


Abstract
The electrification of regional railway lines using battery-electric trains requires accurate simulation tools to support energy management and thermal control design. This paper presents an integrated dynamic simulation model of the traction system of a Hitachi Caravaggio ETR 521 regional train operating in battery-electric mode, developed in MATLAB/Simulink 2024b. The model incorporates all key drivetrain components, including a train reference generator, speed controller, motor controller, three-phase inverter, induction motor, a Kokam Co., Ltd. lithium-ion battery pack, and a detailed battery thermal management system. The proposed framework enables simultaneous evaluation of traction performance, battery state of charge (SOC) evolution, and thermal behavior under realistic conditions. To validate the model, simulations of the Treviso–Vicenza route were conducted under two scenarios: traction-only operation and operation with a 160 kW auxiliary load. Simulation results demonstrate that auxiliary loads significantly affect energy consumption and battery thermal behavior, with energy consumption increased by 50%. The results highlight the importance of integrating thermal effects into energy management and sizing decisions for battery-electric regional trains. The developed model provides a practical tool for optimizing battery sizing, thermal management strategies, and overall energy performance, supporting the planning and design of sustainable electric railway solutions. The modular MATLAB/Simulink architecture is designed to be route-agnostic; extension to other regional lines with different gradients, speed profiles, or extreme climate conditions (e.g., alpine routes or high-temperature regions) requires only updated route data and adjusted ambient boundary conditions, demonstrating the model’s broad applicability beyond the Treviso–Vicenza case study.
1. Introduction
The decarbonization of railway transport has become a critical priority for achieving European climate targets [1], as the transport sector accounts for approximately 25% of total EU greenhouse gas (GHG) emissions [2]. Reducing dependence on fossil fuels is therefore essential. According to the International Energy Agency [3], rail transport represents one of the most promising solutions to reduce the global carbon footprint, owing to its relatively low emissions per passenger–kilometer [4]. However, this advantage primarily applies to electrified railway lines. In regions where diesel-powered trains are still in operation, the environmental benefits of rail transport are significantly reduced.
While mainline railways in Europe benefit from extensive electrification infrastructure, regional and secondary railway lines often remain non-electrified due to the high capital costs associated with catenary installation and long-term maintenance [5]. This issue affects approximately 29% of the railway network in Italy [6], 15% in France [7], and 40% in the United Kingdom [8]. To reduce the carbon footprint while ensuring reliable service on non-electrified lines, recent research has focused on the development of hybrid traction systems, predominantly based on fuel cells or battery technologies. One significant research path is Rail FP4—Rail4Earth, subproject 1, founded by the European Union [9].
Saeed et al. [10] and Fedele et al. [11] provide comprehensive overviews of the currently available technologies. With specific reference to regional railway applications, fuel cells were initially considered the most promising solution due to their high energy density [12]. Hoffrichter et al. already in 2014 made a conceptual study on a Stadler GTW operating on the not electrified Birmingham–Stratford-upon-Avon route, concluding that a fuel cell-powered train would have been suitable for the application [13]. Agati et al. [14] presented a detailed study of a fuel-cell-powered train designed for non-electrified lines, while Fragiacomo et al. [15] focused on a real case study involving a non-electrified line in southern Italy (Catanzaro Lido–Reggio Calabria). On the same route, Piraino et al. [16] affirmed that a hybrid train powered by a fuel cell powertrain could be a concrete alternative to diesel trains in the case of overhead line interruption or malfunctions.
In parallel, several rolling stock manufacturers developed and tested prototype fuel-cell trains, notably Alstom [17] and Siemens [18], which subsequently entered commercial service in Germany [19] and the Netherlands [20]. However, during the early phases of commercial operation, several technical and operational challenges emerged. As a result, some affected operators decided either to revert to diesel traction [21] or to transition toward fully battery-based traction configurations [22]. Current research and projects will allow hydrogen trains to be reliable in the future and, maybe, even able to produce hydrogen on board [23], but battery-electric multiple units (BEMUs) are considered the most promising technologies in the short term.
BEMUs were initially considered suitable mainly for light rail vehicles and short-distance operations, due to the limited operating range of early battery technologies [11,24]. Nevertheless, significant reductions in battery costs, together with improvements in energy density, reliability under different operating conditions [25], and advancements in charging infrastructure management and availability [26], have substantially enhanced the viability of battery-based rail traction. Consequently, BEMUs have emerged as one of the most promising alternatives for partially or non-electrified railway lines, enabling zero-emission operation while maintaining compatibility with existing railway infrastructure and conventional regional electric multiple units (EMUs) [27]. A concrete application has been studied by Pugi et al. [28] on the Firenze–Faenza line, demonstrating that a three- or four-car BEMU would be able to operate on a partially (25–33%) electrified line. Another significant example has been reported by Ruvio et al. on the 25 kVac Turkish network [29].
The development of new BEMUs able to reach higher autonomy and integrate with the current infrastructure would benefit from a comprehensive, reliable predictive model of train performance. Currently, recent studies on battery-electric railway systems span three broad research streams. The first addresses traction energy consumption and vehicle dynamics: González-Gil et al. [27] modeled energy-efficient urban train operation with regenerative braking and demonstrated that optimized driving strategies can reduce net energy consumption significantly on stop-and-go routes. Su et al. [30] developed an optimal train control simulation for metro systems and quantified the effect of coasting phases on traction energy. These works established the importance of accurate speed-profile modeling but treated the battery as an ideal energy source without thermal or electrochemical details. The second stream focuses on battery thermal management in electric vehicles and traction applications: Pesaran [31] provided a foundational analysis of battery thermal issues in hybrid and electric vehicles, identifying temperature uniformity and heat rejection as key design drivers. Jaguemont et al. [32] reviewed lithium-ion cell behavior at low temperatures and highlighted how internal resistance rises at cold conditions can severely limit available power and accelerate degradation. Yang et al. [33] and An et al. [34] investigated forced-air and liquid cooling configurations for cylindrical lithium-ion packs, confirming that liquid cooling achieves superior temperature uniformity under high C-rate cycling. Murashko et al. [35] characterized the through-plane thermal conductivity of Li-ion cylindrical cells, providing cell-level properties directly applicable to pack-level thermal modeling. However, these studies were conducted in EV or stationary contexts and did not couple thermal behavior to traction duty cycles on real routes. A third, more recent stream attempts partial integration: Hussain [36] designed and simulated a battery thermal management system specifically for onboard railway applications, establishing the baseline battery thermal management system (BTMS) architecture adapted in the present work. Nevertheless, none of the above studies couples the full chain—traction dynamics, battery electrochemistry, and active liquid cooling—within a single simulation validated against a real regional route. This gap motivates the development of the present study.
The Hitachi Caravaggio ETR 521 [37], originally designed as an electric multiple unit (EMU), represents a new generation of regional trains that can be adapted for battery-electric operation. However, the transition from catenary-fed to battery-powered traction introduces significant technical challenges, particularly in energy management and thermal control [32,38].
Accurate dynamic modeling of battery-electric traction systems is essential for optimal design, energy management strategy development, and operational planning. While existing literature addresses either traction modeling [30,31] or battery thermal management [34,35] independently, few studies integrate both aspects into a comprehensive simulation framework for regional train applications. The complexity of such integrated models arises from the coupling between electrical, mechanical, and thermal domains, each operating at different time scales and requiring coordinated simulation.
This paper presents a complete MATLAB/Simulink 2024b-based dynamic model of a single traction drive for the Hitachi Caravaggio ETR 521 operating in battery-electric mode. The model integrates all essential drivetrain components. The integrated model enables comprehensive analysis of traction performance, energy consumption, battery state-of-charge (SOC) evolution, and thermal behavior under realistic operating conditions. To validate the model and demonstrate its practical utility, simulations are performed for the Treviso–Vicenza route in the Veneto region of Italy [39], a representative regional railway line spanning 60.06 km with 10 intermediate stops. This route was selected because, even being electrified, it represents a potential typical non-electrified regional service in northern Italy, featuring a mix of inter-station distances, realistic speed profiles, and gentle gradients characteristic of the Veneto plain, making it an appropriate benchmark for evaluating battery-electric train performance. Two operating scenarios are investigated: traction-only operation and operation with auxiliary loads (representing power for lighting, heating, ventilation, and onboard systems) since auxiliary loads can reach up to 30% of the total power consumption on a train [40].
This study proposes an integrated simulation framework combining traction modeling, energy consumption analysis, and battery thermal behavior for a battery-electric regional train. Unlike previous works that focus either on traction performance or battery systems independently, this work couples electrical, mechanical, and thermal domains within a unified environment. The model incorporates realistic route data, auxiliary loads, and liquid cooling dynamics, enabling a comprehensive evaluation of both energy efficiency and thermal management. This integrated approach provides a more accurate representation of real-world train operation and supports the design and optimization of battery-electric railway systems. The novelty of this work lies in the simultaneous coupling of traction dynamics, battery-electrochemical modeling, and liquid-cooled thermal management within a single validated Simulink environment, applied to a real regional route under both traction-only and full-service auxiliary load conditions, a combination not previously reported in the literature for battery-electric regional train applications.
2. Materials and Methods
The following chapter describes ETR521 technical parameters, battery-electric drive design in MATLAB/Simulink 2024b, and the operating scenarios that ETR521 withstands along a real railway route, which is essential to ensure realistic validation of the proposed model. Route characteristics such as station spacing, speed limits, gradients, and dwell times directly influence traction energy consumption, battery discharge behavior, and thermal loading. Therefore, the Treviso–Vicenza line is used as a representative case study for regional railway operation.
2.1. ETR521 BEMU Traction Overview
The following chapter provides a comprehensive overview of the current Hitachi Caravaggio ETR521 and the version developed by the authors to design a BEMU configuration.
2.1.1. Hitachi Caravaggio ETR521 Overview
The Caravaggio ETR 521, developed and manufactured by Hitachi Rail in Italy is a modern regional electric multiple unit (EMU) designed for medium-distance passenger service on the Italian railway network. Originally developed as a catenary-fed electric train, the modular architecture of the ETR 521 enables adaptation for battery-electric operation on non-electrified secondary lines. The train is a high-capacity double-deck EMU for regional traffic [41]. Please see Figure 1 for ETR521 and Table 1 and Figure 2 for its key technical specifications. Although the actual ETR 521 train is equipped with eight traction motors, the developed model represents a single traction unit (one motor + proportional share of the battery pack). The full train traction power in catenary mode is 3400 kW across eight motor-inverter units (4 bogies × 2 motors each = 425 kW as peak power motor). In battery-electric mode, a derated continuous rating of 200 kW per motor is used to reflect steady-state thermal and energy constraints rather than peak transient capability. This value takes into account that the current motor adopted on ETR521 has a continuous power of 200 kW, and other EMUs’ nominal power motor range is similar, according to [42], as shown in Table 2. Each motor is driven by its own voltage-source inverter fed from the common DC battery bus; Figure 3 illustrates this single traction drive architecture. The single-motor model is representative of one of these 8 traction motors across 8 powered axles. All forces, masses, and power quantities are divided by eight to maintain full-system equivalence. The traction model makes a reasonable assumption that there is no wheel slip/slide, thanks to the anti-slip/anti-skid control in modern trains with negligible load transfer effects during acceleration/braking.
Figure 1.
Hitachi Rock ETR521.
Table 1.
Key specifications of ETR521—adapted from [41].
Figure 2.
Block diagram of the ETR521 motorized car. The block diagram shows a simplified version of the current structure of one ETR521 motorized car (2 traction converter units) for a standard 3 kVdc line-fed train. Please note that 2 motorized cars are present on one ETR521 train (in total 8 motors). Figure adapted from [41].
Table 2.
Traction motors per car, related nominal power, and vehicle weight. [a] Empty mass; [b] the total weight of ETR521 has been calculated from [37] considering 18.5 max weight per axle across 10 axes; [c] project also known as Abellio East Anglia (made by former Bombardier Transportation, now Alstom).
Figure 3.
Traction system architecture of the ETR 521 in battery mode configuration. The battery energy storage system (BESS), comprising 456 Kokam Co., Ltd. NMC lithium-ion polymer cells arranged in 228 series × 2 parallel strings (839 V, 206 Ah, 173 kWh), supplies a common DC bus through a battery management system (BMS). Each voltage-source inverter (VSI) drives individual three-phase induction motors via 5:1 gearboxes, one per wheelset. A DC/DC converter steps down the bus voltage for auxiliary loads, while a battery thermal management system (BTMS) provides active liquid cooling. Regenerative braking energy is returned to the DC bus. External charging is provided at the station or depot via a wayside charger.
2.1.2. Battery-Electric Configuration
The battery-electric adaptation of the Hitachi Caravaggio ETR 521 replaces the energy of the overhead line with a lithium-ion battery energy storage system (BESS). The battery pack is designed to provide sufficient energy for operation between charging stations, typically at terminal stations or selected intermediate stops equipped with fast-charging infrastructure.
NMC cells by Kokam Co., Ltd are selected for their high specific power density (suitable for the pulsed 1 C–1.6 C traction profiles), wide operating temperature range, and proven performance in electric vehicle and rail traction applications. The BESS consists of battery modules (103 Ah nominal cell capacity) connected in series-parallel configurations to achieve the required 839 V nominal bus voltage and 206 Ah pack capacity. Each module consists of 19 cells connected in series (19 s1p). These modules form the subpack with 12 such modules connected in series 12 s × (19 s1p) or 228 s1p, followed by a battery string with 2 subpacks connected in parallel. Table 3 represents the battery string sizing. The overall battery and traction architecture is illustrated in Figure 3, which shows the energy flow path from the battery strings through the BMS and DC bus to each inverter-motor drive unit. The battery pack capacity [kWh] is consistent with several BEMUs for regional commercial service reported by Fedele et al. [11]. Please refer to Figure 4.
Table 3.
Kokam Co., Ltd. battery string specifications.
Figure 4.
Benchmark of BEMU ETR521 battery capacity [kWh] versus the vehicles reported in [11] Table 2. Additionally, Coradia Continental BEMU [48] and Stadler TREEN have been added [24].
The battery sizing for the complete traction chain is considered reasonable in light of the vehicle’s characteristics. The ETR521 is a high-capacity, five-car double-deck trainset offering 619 passenger seats [37], and as such, its energy storage requirements are substantially greater than those of lighter, single-deck regional battery-electric multiple units such as the Coradia Continental BEMU (three cars, 150 passenger seats [48]) and the Mireo Plus B (three cars, 160 passenger seats [18]).
The battery pack exhibits a linear voltage–SOC relationship with a slope of 3.42 V per 1% SOC change, indicating stable voltage characteristics during operation. The relatively flat discharge curve ensures consistent power delivery across the operating SOC range, which is critical for maintaining traction performance throughout the journey.
The battery management system (BMS) enforces C-rate limits to protect the cells: 2 C maximum during regenerative braking and 3 C maximum during high-power traction events. The relationship between vehicle speed and C-rate is as follows: at cruise speeds of 60–80 km/h (upto 105 km/h for short period), traction power demands approximately 25 kW per motor, drawing 30 A from the battery string under nominal condition (0.14 C); during maximum acceleration from standstill, power reaches 200 kW corresponding to ~238 A (1.15 C) under nominal battery voltage. The 3 C discharge limit (618 A) is therefore not approached under normal operation, providing a substantial safety margin. During regenerative braking at 0.75 m/s2, peak charging current is limited to 2 C (412 A) to protect cell integrity. The operating SOC window is restricted to 20–80% to maximize cycle life while providing sufficient energy reserve for route completion.
The battery pack is equipped with a liquid cooling-based BTMS to maintain cells within optimal temperature ranges during high-power traction and regenerative braking operations. Maintaining appropriate thermal conditions is critical for battery lifespan, performance, and safety.
The battery specifications used in the developed model can be summarized in Table 3.
2.1.3. Traction Drive Architecture
The traction drive system for a single motor follows a conventional voltage-source inverter (VSI) architecture, as illustrated in Figure 5. It provides an overview of the complete energy flow from the battery pack through power electronics to the wheelset, while Figure 5 details the MATLAB/Simulink 2024b model implementation.
Figure 5.
Single traction drive system architecture for battery-electric ETR 521 (MATLAB/Simulink 2024b implementation). Figure 5 shows the complete system schematic from battery pack cells through BMS, DC/DC converter, VSI, induction motor, and gearbox to the wheelset, including the regenerative braking path and hierarchical control structure.
The system consists of several major subsystems working together to enable efficient traction and thermal performance. The energy storage system is based on a Kokam Co., Ltd. battery pack that supplies DC power to a DC/DC converter, which in turn feeds the inverter. The power conversion subsystem employs a three-phase, voltage-source inverter (VSI) that converts the DC battery voltage into variable-frequency and variable-amplitude AC power for the induction motor. Each traction converter can deliver up to 0.5 MW of peak power and 200 kW of continuous power to one single motor. The inverter uses insulated-gate bipolar transistors (IGBTs) with anti-parallel diodes, allowing bidirectional power flow to support regenerative braking.
Each motor is assumed to represent 1/8th of the total traction system. Therefore, all resistive forces calculated using the Davis equation are divided by eight, ensuring consistency between the modeled subsystem and the full vehicle behavior.
The traction motor is a three-phase squirrel-cage induction motor that converts electrical power into mechanical power. While the ETR 521 traction motors are capable of higher peak outputs during acceleration, this study utilizes a nominal continuous rating of 200 kW per drive unit. This approach focuses on steady-state thermal and energy performance rather than transient peak power events. Each motor was chosen to have a rated continuous power of 200 kW instead of the 3400 kW/8 motors = 425 kW/motor, as shown in Table 1 and Table 2. The rated efficiency will be equivalent to 93%. This value is commonly accepted in railway applications. Kondo et al. [49] tested a prototype able to reach 95.5%, while [50] provided an overview of motor higher than 100 kW able to reach between 93.6 and 95.8%. The motor is cooled using forced air, and its torque and speed characteristics are tailored for traction performance through a mechanical transmission system that incorporates a gear reduction ratio of approximately 5:1. This gearing adapts the motor’s high speed and low torque output to the wheelset’s traction requirements.
The control system follows a hierarchical architecture. A train reference generator produces speed and position targets based on the route profile, station stops, and energy-efficient driving strategies. The speed controller forms the outer control loop, ensuring the train tracks the reference profile by generating appropriate torque demands. The motor controller, based on field-oriented control (FOC), regulates torque and flux independently, while the inverter control generates the switching signals for the IGBT gates according to the voltage references provided by the motor controller.
Finally, the equivalent battery thermal management system (BTMS) maintains the battery temperature within safe limits. The battery pack is equipped with a liquid cooling system in which cooling plates are in direct contact with the battery modules. The battery thermal management system (BTMS) utilizes a refrigeration cycle to cool the circulating fluid via a brazed plate heat exchanger. The primary loop includes an expansion tank and a pump that ensures a steady flow of coolant through the battery cold plates. The secondary loop comprises refrigeration components, including a compressor, air-cooled condenser, thermostatic expansion valve, and evaporator. A more detailed description of the BTMS can be found in [36].
2.1.4. Auxiliary Power Systems Consumption
Beyond traction, the train draws auxiliary power for onboard systems. This power is estimated from the nominal auxiliary consumption of the ETR 521 in standard service operation as reported by [41] (4 Auxiliary Power Supply APS, each one of 100 kVA). The ETR 521 operates on a 3 kV DC catenary with a reported auxiliary system demand of approximately 320 kW under full-service conditions. However, it is demonstrated by Soares et al. [51] that for a 118-ton train, a maximum power consumption for the auxiliary systems is 100 kVA despite a nominal power of 210 kVA, and the power consumption is not related to the train speed. Scaling this value to a 234-ton train (ETR 521 full weight as explained in Section 2.3.5), the new auxiliary power consumption is 198 kVA. Considering a power factor of 0,8, the auxiliary power consumption of ETR521 can be equal to 160 kW. The 20 kW load represents a portion of the total power consumption for HVAC, lighting, doors, compressors, and control units during normal passenger service. The remaining auxiliary power demand is fulfilled through the 7 other battery strings.
Accounting for the DC/DC converter efficiency and the voltage step-down from 839 V to the 24/72/110 V auxiliary buses, the equivalent demand at the battery side is approximately 21 kW, which is the value used in this study. This corresponds to an equivalent continuous current draw of approximately 25 A at nominal battery voltage, which at maximum traction current of 270 A represents an additional 9% current overhead. The combined peak current during acceleration (traction + auxiliary = ~295 A) remains within the 3 C discharge limit of the 206 Ah battery pack (3 C = 618 A), confirming the auxiliary load does not violate battery protection constraints.
2.2. Model Development
The battery-electric traction drive system is implemented as a hierarchical MATLAB/Simulink 2024b model comprising interconnected subsystems operating at a 1 kHz sample rate. Each component is realized as a stateless MATLAB/Simulink 2024b R function block to ensure code generation compatibility and modular testing.
The train reference generator synthesizes speed profiles for the 60.06 km Treviso–Vicenza route using a five-phase state machine (acceleration, cruise, coasting, braking, station stop) with detailed route data including station locations, speed limits, and track gradients. The system operates at 70% of maximum track speeds to represent conservative regional service operation, with adaptive acceleration (up to 1.1 m/s2) accounting for gravitational effects from track gradients.
The control architecture implements a cascaded structure with an outer speed controller and inner field-oriented control (FOC) for the induction motor. The speed controller employs an enhanced PID design with aggressive cruise stabilization features, forcing speed error to zero when multiple stability conditions are met to eliminate oscillations. The FOC algorithm regulates torque and flux independently through d-q axis current control with field weakening above base speed, achieving a bandwidth of 100–200 Hz for current loops.
The three-phase inverter model incorporates realistic IGBT and diode loss calculations, including conduction losses, switching losses (at 5 kHz PWM), and railway-specific auxiliary losses, with total losses ranging from 5 kW idle to 80 kW maximum. The mechanical subsystem models the 5:1 gearbox, Davis equation resistance forces, and single-motor dynamics representing one of four traction motors with adjusted mass distribution.
The Kokam Co., Ltd. battery pack (206 Ah, 615–957 V operating range) uses coulomb counting for SOC estimation with enforced C-rate limits (2 C charge, 3 C discharge) and a 20–80% SOC operating window. Battery thermal management calculates I2R heat generation with SOC-dependent internal resistance, providing thermal load inputs together with battery temperature to the train control and management system (TCMS), which then signals the BTMS controller for cooling.
2.3. Simulation Setup and Route Characteristic
The following chapters describe the Treviso–Vicenzo route parameters and the main vehicle equation for the simulation setup.
2.3.1. Route Description: Treviso–Vicenza Line
The simulation study is conducted on the Treviso–Vicenza railway line, a 60.06 km regional route in the Veneto region of northeastern Italy connecting the provincial capitals through the characteristic flat to gently rolling terrain of the Veneto plain. The route comprises 12 stations with 10 intermediate stops between the terminals, as shown in Table 4.
Table 4.
Station sequence and characteristics for Treviso–Vicenza route [52].
All stations maintain a uniform dwell time of 100 s for passenger boarding and alighting. Speed limits vary from 90 km/h at terminal and urban stations to 150 km/h on open mainline sections.
2.3.2. Track Gradient and Altitude Profile
The altitude profile illustrated in Figure 6 reflects the gentle topography of the Veneto plain, starting at sea level (0 m) at Treviso Centrale, reaching a maximum elevation of approximately 30.75 m near Galliera Veneta-Tombolo (32.927 km), and descending to 18.64 m at Vicenza. Maximum gradients do not exceed ±8‰, which is typical of plain terrain railway construction.
Figure 6.
Altitude profile (m): Treviso Centrale–Vicenza.
Track gradient is calculated dynamically using a 100 m look-ahead distance according to Equation (1):
where gradient is the slope or steepness of the terrain, expressed in per mille (‰), altitudelookahead is the elevation (in meters) at a point ahead along the path, altitudecurrent is the current elevation (in meters). The gravitational effect on acceleration is modeled with a 0.7 scaling factor (accounting for rotating masses), limited to ±0.3 m/s2 maximum influence
2.3.3. Speed Profile Generation Strategy
The train reference generator implements an energy-conscious driving strategy operating at 70% of maximum track speeds to improve energy efficiency, extend battery range, enhance passenger comfort, and reduce thermal stress. This yields operational speeds according to Table 4.
Note: A speed versus time diagram for the complete Treviso–Vicenza journey is provided in Figure 7b (Section 3.1), which shows the achieved speed profile over the full 4200 s simulation. This figure illustrates the multi-phase acceleration–cruise–braking cycles across all 11 inter-station segments and confirms the operational speed values listed in Table 4.
Figure 7.
(a) Vehicle speed (km/h) vs. distance (km); (b) vehicle speed (Km/H) and time (s).
The multi-phase speed profile for each inter-station segment is composed of several distinct phases. The acceleration phase follows a three-stage adaptive strategy: an initial acceleration of 1.1 m/s2 with full gradient compensation up to 85% of the target speed, followed by a reduced acceleration of 0.3 m/s2 between 85% and 95% of the target speed with partial gradient compensation, and finally a gentle acceleration of 0.05 m/s2 beyond 95% of the target speed to ensure a smooth transition into cruising. During the cruise phase, the train maintains a constant speed slightly below the track limit whenever its velocity exceeds 98% of the target speed.
A coasting phase is reserved for future implementation as part of energy optimization strategies, but is not currently active in the model. The braking phase employs a distance-based approach, incorporating a 200 m safety margin with service braking limited to 0.75 m/s2 to ensure passenger comfort. Finally, the station stop phase maintains zero velocity for a 100 s dwell period while the brakes remain engaged.
To prevent abrupt changes in speed, adaptive rate limiting is applied, with a base rate of 2.0 m/s per second, reduced to 1.0 m/s per second during the approach phase and 0.6 m/s per second during cruise. Additionally, a 10 s initial delay at Treviso station represents standard departure procedures.
2.3.4. Battery Thermal Model
The battery thermal model calculates transient temperature evolution using lumped-parameter dynamics according to Equation (2):
where Cthermal is the thermal capacity of the battery pack in kJ/kg·K; dT/dt is the rate of temperature change in K/s; Qgen is the heat generated by the battery in kW; Qcool is the cooling load transferred to coolant in kW, which is the BTMS cooling power.
The heat generation from resistive I2R losses with SOC-dependent internal resistance ranging from 68 mΩ at optimal SOC (40–80%) to 68–81 mΩ at extreme SOC values. The thermal capacitance Cthermal = 722.5 kJ/K represents the battery pack’s thermal mass calculated from mpack = 722.5 kg and Cp = 1 kJ/(kg·K) specific heat capacity typical of lithium-ion systems [12], including cells, housing, and interconnects. Heat removal is the result of BTMS operation with a continuous cooling capacity of 4.5 kW.
Tbattery is the battery temperature, which is initially considered at 35 °C; Tcoolant is the coolant temperature that enters the cold plate of battery packs. Here, the BTMS ensures delivery of coolant at 20 °C for battery cooling. The coolant is a 50/50 water-ethylene glycol mixture with the following thermophysical properties at 20 °C: density ρ = 1069 kg/m3, specific heat capacity Cp = 3.56 kJ/(kg·K), dynamic viscosity μ = 2.4 × 10⁻³ Pa·s, and thermal conductivity k = 0.42 W/(m·K) [9]. In this model, “battery temperature” refers to the lumped average temperature of the entire battery pack, computed using a single-node thermal model that assumes uniform heat generation and temperature distribution across the pack. This is a standard simplification for system-level energy and thermal management studies.
2.3.5. Simulation Parameters
The simulation uses MATLAB/Simulink 2024b R with a fixed-step solver at 1 ms sample time (1 kHz), providing adequate resolution for control dynamics (10–200 Hz bandwidth), inverter global behavior, and battery thermal dynamics while maintaining computational efficiency. The key parameters used in the simulation are as follows. The total train mass is 234 tons, corresponding to a five-car configuration including passengers (calculated as 185 tons empty weight plus 619 persons seated [37] multiplied by a weight of 80 kg according to railway standard EN 15663 [53]). The traction system consists of 8 motors in total; however, the simulation models a single motor with an adjusted equivalent load to represent one-eighth of the total. The wheel diameter is 0.92 m (with a radius of 0.46 m), and the gear ratio is 5:1, ensuring appropriate torque and speed conversion between the motor and the wheelset. The mechanical (gearbox) drivetrain efficiency is assumed to be 98%, accounting for minor mechanical losses in transmission as adopted by [54], while the complete connected electric drive system delivers an efficiency of 88%, as reported by Sun et al. [12]. The train resistance is calculated using the Davis equation with coefficients corresponding to the full vehicle. Since the model represents a single traction motor in a four-motor system, the resulting resistance force is divided by four to assign the appropriate share to the modeled motor represented by Equation (3):
where Atotal [N] is the rolling resistance coefficient (constant term, assumed to be 2500 N); Btotal [N·h/km] is the velocity-dependent mechanical–aerodynamic coefficient (assumed to be 40 N·h/km); Ctotal [N·h2/km2] is the aerodynamic drag coefficient (assumed to be 0.5 N·h2/km2); vkmh [km/h] is the train speed; Fresistance [N] is the total resistance force per motor unit [27,39].
The simulation begins with the following initial conditions. The battery has an initial state of charge (SOC) of 80%, a voltage of 889.2 V, and an initial temperature of 35 °C. The inlet coolant temperature is set to a constant of 20 °C at the start of the simulation, which is the result of the BTMS operation under the stabilized zone. The train is initially positioned at 0 m (corresponding to Treviso station) and is stationary, with an initial velocity of 0 m/s.
2.3.6. Operating Scenarios
The comparison quantifies impacts on total energy consumption, battery SOC depletion, thermal load, and cooling requirements. Two simulation scenarios are defined to quantify the impact of auxiliary loads on overall performance and thermal behavior. In Scenario 1—traction-only (baseline), the auxiliary load is set to 0 kW to isolate the behavior of the pure traction system and determine the theoretical minimum energy consumption under ideal conditions. In contrast, Scenario 2—full-service operation (realistic) includes a constant auxiliary load of 20 kW representing proportional power demand from heating, ventilation, and air conditioning (HVAC) systems, lighting, doors, compressors, and control units [27,38], which are subjected to the single battery string. This load corresponds to an equivalent continuous current of approximately 25 A. The purpose of this scenario is to model normal revenue service conditions where passenger comfort and onboard systems are fully active.
2.3.7. Performance Metrics and Data Collection
Throughout the simulation, several key performance indicators (KPIs) are continuously monitored and recorded at a 1 kHz sampling rate to ensure a detailed and comprehensive analysis consistent with the results presentation.
The speed profile parameters include the reference speed generated by the trajectory generator (in m/s), the actual train speed (in m/s), train position (in meters), and cumulative distance (in kilometers), as well as the current operational phase—coded as 1 for acceleration, 2 for cruise, 3 for coasting, 4 for braking, and 5 for stop. Additionally, the current station index and applicable speed limit (in km/h) are tracked.
The battery temperature data covers the battery string temperature (°C), heat generation rate (kW) due to losses, internal resistance as a function of state of charge (SOC), and both ambient and coolant temperatures (°C). For SOC and voltage, the monitored variables include the battery state of charge (%), terminal voltage (V), current (A) with positive values indicating charging and negative values indicating discharging, as well as battery power (kW) and cumulative energy discharged or regenerated (kWh). The cooling capacity and temperature parameters include the BTMS cooling power (kW). The traction, resistive, and braking forces are also recorded, including the traction force at the wheel–rail interface (kN), total motion resistance (sum of rolling, aerodynamic, and grade components), grade resistance alone, braking forces (regenerative and frictional), and the net accelerating or decelerating force (kN). Finally, for the motor torque–speed behavior, the electromagnetic torque (Nm), mechanical speed (rpm), operating point on the torque–speed curve, motor efficiency (%), and mechanical power output (kW) are all measured. All these parameters are logged every 1 millisecond and exported to the MATLAB/Simulink 2024b workspace for post-processing, visualization, and comparative analysis between Scenario 1 (traction-only) and Scenario 2 (with 20 kW auxiliary load).
3. Results
This section presents comprehensive simulation results for the Treviso–Vicenza route under Scenarios 1 and 2. All results span the complete 4200 s journey, covering 60.06 km with 10 intermediate station stops. Cumulative energy consumption over time for both scenarios is reflected in the battery SOC profiles (Figure 8 and Figure 9), from which energy in kWh is derived as E = ΔSOC ×173 kWh.
Figure 8.
Kokam Co., Ltd. battery state of charge (%) profile (Scenario 1: taction only).
Figure 9.
Kokam Co., Ltd. battery state of charge (%) profile (Scenario 2: traction + 20 kW auxiliary load).
3.1. Speed Profile Analysis
Both operating scenarios result in identical speed profiles as shown in Figure 7, ensuring that differences in energy consumption, battery state-of-charge depletion, or thermal behavior between Scenario 1 (traction-only) and Scenario 2 (traction with 20 kW auxiliary load) are exclusively attributable to auxiliary power demands. The train reference generator operates independently of auxiliary loads, synthesizing the same multi-phase speed profile based solely on route geometry, station locations, and speed limits.
The implemented speed strategy operates at 70% of maximum track speeds, yielding operational velocities of 63 km/h in terminal zones (90 km/h limits), 77 km/h in reduced-speed sections (110 km/h limits), and 98–105 km/h on mainline segments (140–150 km/h limits). This conservative approach provides enhanced energy efficiency through reduced aerodynamic drag, extended battery range, improved passenger comfort, and reduced mechanical stress on drivetrain components. The complete journey spans 60.06 km over approximately 4200 s, including 10 intermediate station stops with uniform 100 s dwell periods.
The speed-distance profile reveals distinct characteristics based on inter-station geometry. The first segment (Treviso to Paese, 6.7 km) reaches approximately 63 km/h, followed by four high-speed segments reaching 98–105 km/h corresponding to the Paese–Istrana (4.7 km), Istrana–Albaredo (6.9 km), and Albaredo–Castelfranco (6.3 km) mainline sections with 140–150 km/h limits. The Castelfranco to S. Martino segment (6.1 km) also reaches approximately 105 km/h. Following this, a series of short-distance segments of 2–4 km demonstrates constrained kinematic behavior where the train cannot reach intended cruise speeds before braking must commence. The S. Martino-to-Galliera Veneta segment (2.3 km) reaches approximately 50 km/h, Galliera-to-Cittadella (3.5 km) peaks at 75 km/h, Cittadella-to-Fontaniva (3.7 km) achieves approximately 63 km/h due to the 90 km/h urban speed limit, Fontaniva-to-Carmignano (3.0 km) reaches 65 km/h, and Carmignano-to-S. Pietro (3.7 km) peaks at approximately 60–70 km/h. The final segment from S. Pietro in Gu to Vicenza (13.2 km) represents the longest inter-station distance, allowing extended acceleration to reach a sustained cruise speed of approximately 77–78 km/h, corresponding to the 110 km/h speed limit in the Vicenza approach zone.
The profile clearly shows four high-speed segments exceeding 90 km/h in the first half of the journey (0–30 km) where longer inter-station distances and higher speed limits permit full acceleration to cruise velocity, followed by five constrained segments with peaks of 50–75 km/h in the middle section (30–50 km) where short distances and lower speed limits restrict achievable speeds, and finally the extended high-speed segment reaching 77–78 km/h for the final 13 km approach to Vicenza. This pattern creates asymmetric energy consumption with higher specific energy use in the first half due to higher speeds and resulting aerodynamic drag, moderate consumption in the middle-constrained section where speeds remain below 80 km/h, and sustained moderate-to-high consumption in the final extended cruise segment.
The three-stage adaptive acceleration strategy progressively reduces acceleration from 1.1 m/s2 (0–85% of target speed) to 0.3 m/s2 (85–95%) and finally 0.05 m/s2 (above 95%), minimizing jerk to enhance passenger comfort and enabling seamless cruise entry. The varying peak speeds achieved on different segments, ranging from 50 km/h on the shortest 2.3 km segment to 105 km/h on longer mainline sections, demonstrate the distance-dependent nature of the acceleration-braking cycle, where shorter segments transition directly from acceleration to braking with minimal or absent cruise phases.
Cruise phase stability is maintained by an enhanced PID controller that eliminates speed oscillations, critical for passenger comfort, energy efficiency, and predictable thermal behavior. The extended cruise phases are most evident in the first five high-speed segments and the final long segment, where horizontal plateaus indicate steady-state operation at target velocities. The middle section’s short segments show predominantly triangular or trapezoidal speed profiles with limited cruise duration.
The braking strategy employs conservative 0.75 m/s2 deceleration with a 200 m safety margin, prioritizing passenger comfort and regenerative efficiency. The gentle Veneto plain topography, with maximum gradients of ±8‰, allows target speed maintenance without visible variations despite elevation changes, confirming favorable terrain for battery-electric operation. The final extended segment sustained 77–78 km/h over 13.2 km, representing approximately 615 s (10.25 min) of continuous high-power operation, creating the most demanding sustained energy and thermal loading condition of the journey.
3.2. Battery State of Charge Evolution
Figure 8 and Figure 9 illustrate the battery state-of-charge trajectories for both operating scenarios. Scenario 1 (traction-only) declines from 80% to 65.96%, representing 14 percentage points or 24.28 kWh depletion. Scenario 2 (with 20 kW auxiliary) exhibits dramatically greater consumption, declining from 80% to 51.55%, corresponding to 28.45 percentage points or 49.21 kWh depletion. This difference of 14.41 percentage points (24.92 kWh) quantifies the auxiliary system impact, demonstrating that auxiliary loads contribute 50% of total energy consumption in full-service operation.
The specific energy consumption reveals operational efficiency: Scenario 1 achieves 0.40 kWh/km while Scenario 2 requires 0.82 kWh/km, representing a 2× increase. The 24.92 kWh auxiliary energy corresponds to 20 kW average power over the 4200 s journey for the battery nominal voltage of 839 V
Both scenarios exhibit similar SOC behavior, including in the case of auxiliary loads. The profiles show a stepped descent pattern, with steeper drops during acceleration, gentler slopes during cruising, and noticeable upward inflections during regenerative braking, particularly after high-speed segments. This trend aligns with the inter-station segments, where high-speed operation drives the most pronounced SOC decline due to sustained battery power demand overcoming aerodynamic resistance.
Even with the addition of auxiliary loads in the second case, the overall behavior remains consistent with the baseline case without auxiliary loads as shown in Table 5. The final SOC values reveal critical operational constraints. Scenario 1’s 65.96% final charge leaves 79.51 kWh usable energy above the 20% minimum threshold, enabling approximately three additional identical journeys. The battery is appropriately sized for four-way traction-only operation. Scenario 2’s 51.55% final charge leaves only 54.58 kWh usable remaining, enabling approximately 1 additional identical journey. The battery pack has an autonomy of approximately 120 kms with the auxiliary loads. This final charge indicates that round-trip operation is still possible without intermediate charging. The battery sizing is adequate for two-way full-service operation.
Table 5.
SOC, energy consumption, and energy depletion comparison between Scenario 1 and Scenario 2.
The comparison in Table 5 reveals that auxiliary loads, together with traction, have significant energy requirements for battery-electric regional trains on flat terrain at moderate speeds. Auxiliary systems consume 24.92 kWh, representing 50% of Scenario 2’s total, while traction accounts for the other 50%. This suggests that auxiliary efficiency improvements, such as optimized HVAC scheduling, LED lighting, and intelligent load management, offer a greater range of extension potential than traction optimization within this modeled scenario.
3.3. Battery Thermal Management System Performance
3.3.1. Battery Cooling Circuit
Figure 10 illustrates the coolant temperature profile with an equivalent battery cold plate circuit. To capture the transient behavior of the BTMS during the initial cooling phase, the coolant temperature is initially assumed to be 45 °C. As the system stabilizes, the BTMS active cooling system maintains the coolant inlet temperature at a constant 20 °C.
Figure 10.
Coolant temperature (°C) profile at the inlet and outlet of the cold plate.
In the primary circuit, a 50/50 water–glycol mixture [55] is circulated through the battery pack’s cold plate at a constant flow rate. The coolant enters the cold plate at 20 °C, absorbs the heat generated by the battery, and exits at a higher temperature.
In the secondary circuit, an evaporator removes the absorbed thermal energy from the coolant, reducing its temperature back to 20 °C before it is recirculated into the system.
Figure 11 and Figure 12 present reference experimental results obtained during BTMS operation under varying real project-specific parameters, including flow rate, thermal load, and coolant volume.
Figure 11.
Experimental results of coolant temperature (°C) profile at the inlet and outlet of the cold plate.
Figure 12.
Experimental setup of BTMS experimental validation done in Microelettrica Scientifica cooling system division.
In the simulation model, it is considered that a steady coolant flow is maintained, with the cold plate inlet temperature stabilized at 20 °C. For the sake of system-level analysis, a detailed thermal model is not presented in this scope of work, and a simple BTMS with a continuous cooling capacity of 4.5 kW is instead used as shown in Figure 13. However, detailed work has been done by Hussain [36] elaborating on the complete thermal exchanges and BTMS performances.
Figure 13.
Cooling load (kW) profile.
3.3.2. Battery Thermal Analysis
The battery heat generation profiles reveal similar thermal loading characteristics between scenarios, with heat arising primarily from resistive I2R losses exhibiting quadratic dependence on current magnitude and SOC-dependent internal resistance.
Scenario 1 (Figure 14, starting from 0 W) exhibits characteristic pulsed heat generation correlating with traction power demand. Peak heat generation reaches 4.25 kW during maximum acceleration events when battery current approaches around 270 A, with the most prominent peaks occurring during the first acceleration from Treviso and the final long segment to Vicenza. Heat generation drops sharply to near-zero during station stops when traction power is minimal.
Figure 14.
Heat generated by the battery (kW) profile for Scenario 1 (traction only).
Scenario 2 (Figure 15) presents fundamentally similar thermal behavior dominated by traction load. The profile shows a pattern with baseline heat generation of a few watts from the 20 kW auxiliary systems, drawing 25 A against nominal battery voltage. Since the battery string has two parallel subpacks, the effective internal resistance is halved, leading to minor heat generation from the auxiliary load. Peak heat generation during acceleration events reaches around 4.5 kW when the traction current of 270 A combines with the auxiliary current of 25 A for a total current withdrawal of 295 A. Critically, the final segment shows a sustained plateau at approximately 3.75 kW starting around 3500 s, representing the most severe and prolonged thermal loading period. This sustained elevation during the 13.2 km S. Pietro to Vicenza segment results from a high-speed cruise at 77 km/h, which requires continuous traction power, combining with the constant 25 A auxiliary load over the extended duration.
Figure 15.
Heat generated by battery (kW) profile for Scenario 2 (Traction + 20 kW auxiliary load).
The battery temperature profiles in Figure 16 demonstrate the importance of active thermal management for safe battery operation during sustained traction operations, comparing uncooled operation.
Figure 16.
(a) represents the battery temperature profile for scenario 1; (b) shows the battery temperature profile for scenario 2; (c) exhibits the battery temperature profile without cooling.
The battery temperature profiles for Scenario 1 (traction-only), shown in Figure 16a, and Scenario 2 (with 20 kW auxiliary load), showcased by Figure 16b, reveal insignificant thermal differences attributable to auxiliary system operation. Both scenarios exhibit a temperature drop from an initial 35 °C to approximately 21 °C, representing an effective cooling over the 4200 s journey. Both scenarios exhibit similar thermal profiles, stepped patterns correlating with power demand cycles. The cooling system maintains adequate thermal control in both scenarios, dissipating 4.5 kW of thermal load from the battery packs. This cooling power is well above the peak thermal load that is generated by the power traction demand. The battery temperature without cooling, shown in Figure 16c, exhibits continuous thermal rise from an initial temperature of 35 °C to approximately >46 °C at journey completion, representing an 11 °C increase that could potentially exceed the 55 °C maximum safe operating limit prone to thermal runaway. The risk of thermal runaway increases when the battery packs are further degraded over a few years of operation, increasing the thermal resistance of the cells. The temperature profile shows a rapid initial rise during the first 500 s, followed by a persistent gradual increase throughout the journey, with stepped patterns correlating to power demand cycles showing steeper slopes during acceleration phases and gentler slopes during cruise. Even during station stops when heat generation approaches zero, temperature stabilizes due to thermal inertia within the battery’s 722.5 KJ/K thermal mass, demonstrating that passive cooling through natural convection would be insufficient, especially during summer. Comparing profiles quantifies cooling system performance: the 25 °C temperature difference between uncooled (46 °C) and cooled (21 °C) operation represents prevented thermal energy accumulation of ΔQ = 722.5 KJ/K × 25 K = 18 MJ removed over 4200 s, with average cooling power of 4.5 kW. The cooling system adequately manages intermittent high-power pulses during acceleration-cruise-braking cycles. The analysis reveals the design consideration: the cooling system provides overly adequate thermal management for the complete journey. It may be reasonable to downsize the BTMS cooling capacity to reduce the auxiliary power demands.
3.4. Tractive, Braking, and Resistive Forces
3.4.1. Traction Force Profile
Figure 17 displays the average force at the wheel-rail interface, showing characteristic patterns corresponding to the operating phases of each inter-station segment. Peak traction forces reach approximately 4.5 kN during maximum acceleration events, primarily during departures from stations.
Figure 17.
All forces profile (kN).
The traction force profile exhibits three distinct operational regimes. During acceleration phases, the force rises rapidly to peak values and remains relatively constant as the train accelerates to the target speed. The high-amplitude traction forces during these phases reflect the motor torque output scaled by the gear ratio (5:1) and wheel radius (0.46 m).
During the cruise phase, the train maintains a nearly constant speed through a balance between the applied traction force and the total opposing forces. From a physical standpoint, the traction force generated by the motor offsets aerodynamic drag, rolling resistance, and any gradient effects along the track (as shown in Figure 18). At higher speeds, aerodynamic drag becomes increasingly dominant, requiring greater traction effort to sustain the same velocity.
Figure 18.
Resistance force (kN) profile.
At station stops, the traction force reduces to zero, with the train held stationary by mechanical braking and no propulsion demand
3.4.2. Braking Force Characteristics
The braking force profile shown in Figure 18 demonstrates the regenerative braking capability of the battery-electric traction system. The plot shows braking force as negative values, with braking events clearly visible as large downward excursions from baseline.
Active braking events occur during station approaches, with forces reaching approximately −4.5 kN depending on the approach speed and required deceleration. The most significant braking forces appear during approaches to stations from higher cruise speeds, while lighter braking suffices for lower-speed approaches. All braking follows the conservative 0.75 m/s2 deceleration rate for passenger comfort.
3.4.3. Resistance Force Analysis
Figure 17 presents the total motion resistance force profile calculated according to the Davis equation for the single motor’s share. The resistance exhibits direct correlation with speed, ranging from 0.9 kN to up to 1.5 kN during peak 98–105 km/h cruise, representing a reasonable variation that validates proper aerodynamic drag modeling.
The stepped profile mirrors the speed characteristics with distinct resistance levels: 0.8 kN at 63 km/h during the first segment, 1.4–1.6 kN during four high-speed mainline segments at 98–105 km/h (visible as tall plateaus at 500–2000 s), 0.7–1.1 kN during constrained middle segments at 50–75 km/h (2000–3500 s), and sustained 1.1–1.25 kN during the final 77–78 km/h extended cruise (3500–4200 s).
The sustained 1.1 kN plateau during the final 13.2 km segment represents the longest continuous high-resistance period maintained for 615 s.
The traction/braking force shows a highly cyclical pattern, alternating between strong positive (traction) and negative (braking) values. This indicates repeated acceleration and deceleration phases, representing the stop-and-go operation of the train between stations. The peaks are fairly consistent in magnitude, suggesting controlled and repeatable force application. During cruising at constant speed, the traction force is balanced by the resistance force, indicating zero net force.
3.5. Motor Output Power and Drive Performance
Figure 19a,b illustrates the induction motor’s operating envelope throughout the journey, revealing complete torque-speed and power-speed characteristics under field-oriented control and demonstrating motor utilization across diverse traction demands.
Figure 19.
(a) Torques vs. motor speed; (b) motor output vs. motor speed.
The plots show a largely constant torque (~±800–900 N·m) over most of the speed range, with only a slight drop near maximum speed. This is normal for a system that operates mostly in the constant-torque region, with field-weakening occurring only close to top speed. The power increases with speed up to ~200 kW, which is expected since torque is nearly constant. The vertical bands indicate repeated steady operating points where torque adjusts to balance resistance. Overall, the behavior is consistent, showing stable control, strong symmetric motoring/braking capability, and operation across the full speed range.
3.6. Traction Power vs. Time and Energy vs. Time
The traction power profile shown in Figure 20 highlights a clear cyclic pattern of positive and negative peaks, corresponding to alternating propulsion and braking phases throughout the journey.
Figure 20.
Traction power [kW] vs. time [s] for Scenario 2.
During acceleration segments, the power rises sharply to positive values around 200 kW, indicating strong traction effort as the train increases its speed. These peaks are relatively consistent, suggesting similar acceleration demands across successive sections. As the train approaches the desired cruise speed, the power quickly reduces, often settling near zero or at a low positive level, reflecting the reduced energy required to maintain motion once resistive forces are balanced.
Negative power regions (down to −180 kW) represent regenerative braking, where the train dissipates excess energy while decelerating or regulating speed. The symmetry and repetition of these negative peaks indicate controlled braking events associated with the approach to station stops.
In the cruise portions, the power appears relatively low and stable compared to the peaks, which aligns with the expectation that only modest energy input is needed to counteract aerodynamic drag, rolling resistance, and gradients. The smoothing of the signal reduces high-frequency fluctuations, so the profile emphasizes the overall energy exchange rather than rapid control actions.
Overall, the repeating sawtooth-like structure reflects the operational cycle of accelerate–cruise–brake, with energy being alternately supplied and recovered, demonstrating efficient use of traction and regenerative braking over the route.
Figure 21 highlights the energy consumption during the complete route for Scenario 2 which reached up to 49.2 kWh. This is in line with the energy consumption illustrated in Table 5.
Figure 21.
Energy consumption [kWh] vs. time [s] for Scenario 2.
4. Conclusions
This paper presented a comprehensive integrated traction and thermal simulation model for the Hitachi Caravaggio ETR 521 battery-electric regional train, validated through simulation of the 60.06 km Treviso–Vicenza route under traction-only and full-service (20 kW auxiliary load) operating scenarios. The MATLAB/Simulink 2024b-based model successfully coupled electrical, mechanical, and thermal domains, enabling detailed analysis of traction performance, energy consumption, battery state-of-charge evolution, and thermal management effectiveness throughout realistic regional service operations.
The comparative analysis revealed critical insights for battery-electric train design. Scenario 1 (traction-only) consumed 24.28 kWh (0.40 kWh/km) with a final SOC of 65.96%, providing margin for 3 identical journeys. Scenario 2 (with 20 kW auxiliary load) consumed 49.21 kWh (0.82 kWh/km) with a low final SOC of 51.55%, leaving margin for 1 identical journey and rendering round-trip operation possible without intermediate charging. The most significant finding is that auxiliary systems dominate energy requirements, contributing 24.92 kWh (50% of total) in full-service operation, while traction accounts for the other 50%. This highlights that auxiliary efficiency improvements, such as optimized HVAC scheduling, LED lighting, and intelligent load management, offer greater range extension potential than further traction optimization within this simulation framework. However, it should be noted that the ETR 521 (introduced in 2017) already employs modern auxiliary systems; the 20 kW modeled load represents a scaled equivalent of the catenary-mode consumption and may overestimate savings achievable through efficiency upgrades alone. These findings should therefore be interpreted as indicative of the relative energy balance rather than a definitive claim about the inefficiency of the train’s onboard systems.
The thermal analysis demonstrated the necessity of active liquid cooling. Without cooling, the battery temperature rose from 35 °C to >46 °C, prone to thermal runaway on further journey. With active cooling, temperatures remained controlled at 21 °C, staying within safety limits. The cooling system adequately managed intermittent high-power pulses given its continuous cooling capability of 4.5 kW. Motor operation confirmed proper field-oriented control with smooth base speed to field-weakening transitions
Operational implications indicate the 173 kWh battery pack is appropriately sized for four-way traction-only operation and is adequate for two full-service operation, requiring no destination charging for round-trip service or larger capacity (>200 kWh) for adequate safety margins. The gentle Veneto plain topography (±8‰ maximum gradients) provides favorable conditions, with grade resistance contributing only 5–10% of total resistance. Note: The model assumes a constant coolant inlet temperature of 20 °C and does not explicitly account for variable ambient weather conditions. In practice, elevated ambient temperatures would reduce cooling system effectiveness and increase battery thermal stress, while cold conditions may affect cell internal resistance. These effects should be incorporated in future extensions of the model for seasonal or multi-regional applicability. The developed model provides a valuable tool for design optimization, enabling rapid evaluation of battery sizing, thermal management configurations, auxiliary system improvements, and operational strategies for sustainable rail transport on non-electrified lines. Note: The current model does not incorporate battery degradation effects (capacity fade, internal resistance increase with cycle aging). This is an acknowledged limitation. Future work should incorporate a degradation model (e.g., cycle-count-based capacity fade) to assess long-term operational viability.
Author Contributions
Conceptualization, A.G., S.H. and J.D.; methodology, D.T.; software, J.D. and S.H.; validation, J.D., S.H. and A.G.; formal analysis, D.T.; investigation, J.D. and S.H.; resources, A.G.; data curation, J.D.; writing—original draft preparation, J.D.; writing—review and editing, A.G. and D.T.; visualization, A.G.; supervision, A.G. and D.T.; project administration, A.G. All authors have read and agreed to the published version of the manuscript.
Funding
This research received no external funding.
Data Availability Statement
The original contributions presented in this study are included in the article. Further inquiries can be directed to the corresponding author.
Acknowledgments
The authors would like to thank Camillo Vacca, Alessandro Fusi, Amith Subash, Simon Karam, Luca Fanchini, Domenico Casalino, Claudio Rabissi, and Andrea Baricci for their valuable contributions throughout the entire duration of this work.
Conflicts of Interest
Sadaf Hussain and Alessandro Giannetti are employees of Microelettrica Scientifica Group. The remaining authors declare that the research was conducted in the absence of any commercial or financial relationships that could be construed as a potential conflict of interest.
Abbreviations
The following abbreviations are used in this manuscript:
| HVAC | Heating, Ventilation, Air Conditioning |
| SOC | State of Charge of the Battery |
| BEMU | Battery-Electric Multiple Units |
| EMU | Electric Multiple Units |
| BESS | Battery Energy Storage System |
| BMS | Battery Management System |
| BTMS | Battery Thermal Management System |
| TCMS | Train Control and Management System |
| FOC | Field-Oriented Control |
| PID | Proportional–Integral–Derivative |
| APS | Auxiliary Power Supply |
References
- Directorate General for Climate Action. Document 52020DC0562—Communication from the Commission to the European Parliament, the Council, the European Economic and Social Committee and the Committee of the Regions Stepping up Europe’s 2030 Climate Ambition: Investing in a Climate-Neutral Future; European Union Commission: Brussels, Belgium, 2020. [Google Scholar]
- ERA (European Railway Agency). Rail Environmental Report; ERA: Valenciennes, France, 2024. [Google Scholar]
- International Union of Railways; International Energy Agency. Energy Consumption and CO2 Emission 2017. Available online: https://uic.org/uic-iea-railway-handbook (accessed on 20 January 2026).
- International Energy Agency. The Future of Rail: Opportunities for Energy and the Environment; IEA: Paris, France, 2019. [Google Scholar]
- O’Brien, C. Battery Electric & Hydrogen Fuel Cell Trains 2023–2043; IDTechEx Research Report; IDTechEx: Boston, MA, USA, 2023. [Google Scholar]
- European Parliament. Report from the Commission to the European Parliament and the Council-Eighth Monitoring Report on the Development of the Rail Market Under Article 15(4) of Directive 2012/34/EU of the European Parliament and of the Council, European Commission, COM(2023); European Commission: Bruxelles, Belgium, 2012. [Google Scholar]
- Lancon, C.D.; Renault, M.; Crispiani, D.; Abdallah, I.; Juston, M.; Foncin, C.; Petitet, G. Hydrogen and battery train, which technologies for future light trains? In Transport Transitions: Advancing Sustainable and Inclusive Mobility; Springer: Cham, Switzerland, 2024. [Google Scholar]
- Royston, S.; Gladwin, D.; Stone, D.; Ollerenshaw, R.; Clark, P.M. Development and validation of a battery model for battery electric multiple unit train. In Proceedings of the 45th Annual Conference of the IEEE Industrial Electronics Society (IECON 2019); IEEE: Piscataway, NJ, USA, 2020. [Google Scholar] [CrossRef] [Scilit]
- Nicod, L.; Clément, P. Europe’s Rail FP4-Rail4EARTH Sustainable Rail Systems Progress Point of the European R&D Program. In Transport Transitions: Advancing Sustainable and Inclusive Mobility; Springer: Cham, Switzerland, 2024. [Google Scholar]
- Saeed, M.; Abouzeid, A.F.; Gu, J.M. Onboard Energy Storage Systems for Railway: Present and Trends. IEEE Open J. Ind. Appl. 2023, 4, 23–38. [Google Scholar] [CrossRef] [Scilit]
- Fedele, E.; Iannuzzi, D.; Del Pizzo, A. Onboard energy storage in rail transport: Review of real applications and techno-economic assessments. IET Electr. Syst. Transp. 2020, 10, 239–250. [Google Scholar] [CrossRef] [Scilit]
- Sun, Y.; Anwar, M.; Hassan, N.M.S.; Spiryagin, M.; Cole, C. A review of hydrogen technologies and engineering solutions for railway vehicle design and operations. Railw. Eng. Sci. 2021, 29, 212–232. [Google Scholar] [CrossRef] [Scilit]
- Hoffrichter, A.; Hillmansen, S.; Roberts, C. Conceptual propulsion system design for a hydrogen-powered regional train. IET Electr. Syst. Transp. 2016, 6, 56–66. [Google Scholar] [CrossRef] [Scilit]
- Agati, G.; Borello, D.; Ruvio, A. Fuel Cell–Battery Hybrid Trains for Non-Electrified Lines: A Dynamic Simulation Approach. Energies 2025, 18, 5457. [Google Scholar] [CrossRef] [Scilit]
- Fragiacomo, P.; Piraino, F.; Genovese, M.; Flaccomio Nardi Dei, L.; Donati, D.; Migliarese Caputi, M.V.; Borello, D. Sizing and Performance Analysis of Hydrogen- and Battery-Based Powertrains, Integrated into a Passenger Train for a Regional Track, Located in Calabria (Italy). Energies 2022, 15, 6004. [Google Scholar] [CrossRef] [Scilit]
- Piraino, F.; Genovese, M.; Pagnotta, L.; Caposciutti, M.; Flaccomio Nardi Dei, L.; Fragiacomo, P. Integrated hydrogen and battery energy systems as emergency backup in electric trains. Energy Convers. Manag. X 2023, 18, 100382. [Google Scholar] [CrossRef] [Scilit]
- Alstom Railway Press. Alstom’s Coradia iLint Hydrogen Train Runs First Time in France; Alstom Railway Press: Levallois-Perret, France, 2021; Available online: https://www.alstom.com/press-releases-news/2021/9/alstoms-coradia-ilint-hydrogen-train-runs-first-time-france (accessed on 3 April 2025).
- Siemens. Siemens Mireo Plus Datasheet: Datenblatt Mireo Plus B/Mireo Plus H—EN. Available online: https://assets.new.siemens.com/siemens/assets/api/uuid:0a451202-2be4-485d-a736-974d74263e63/siemens-mobility-mireo-plus-b-mireo-plus-h-en.pdf (accessed on 20 January 2026).
- Alstom. World Premiere: Alstom’s Hydrogen Trains Enter Passenger Service in Lower Saxony. 2018. Available online: https://www.alstom.com/press-releases-news/2018/9/world-premiere-alstoms-hydrogen-trains-enter-passenger-service-lower (accessed on 3 April 2026).
- Alstom. Trial Runs of Alstom’s Hydrogen Train in the Netherlands Deemed Officially Successful. 2020. Available online: https://www.alstom.com/press-releases-news/2020/9/trial-runs-alstoms-hydrogen-train-netherlands-deemed-officially (accessed on 3 April 2026).
- Jackson, C. Diesel trains to temporarily replace hydrogen on Germany’s Taunus network in 2025. Railway Gazette International, 28 November 2024.
- Collins, L. No more hydrogen trains|Rail company that launched world’s first H2 line last year opts for all-electric future. Hydrogen Insight, 3 August 2023.
- Villaume, S.; Dalbavie, J.-M.; Foncin, C. Technico-Economic Feasibility Study of On-Board H2 Production in a Passenger Hydrogen Train for Railway Operators. In Transport Transitions: Advancing Sustainable and Inclusive Mobility; Springer: Cham, Switzerland, 2024. [Google Scholar]
- Stadler Rail. The First Narrow-Gauge Battery-Powered Train for Europe. 2025. Available online: https://www.stadlerrail.com/en/media/media-releases/italy-the-first-narrow-gauge-battery-powered-train-for-europe (accessed on 3 April 2026).
- Andersson, T. A Study Regarding Charging Infrastructure on Non-Electrified Railway Lines. Master’s Thesis, Uppsala University, Uppsala, Sweden, 2025. [Google Scholar]
- Streuling, D.; Pagenkopf, J.; Schenker, M.; Lakeit, A. Techno-Economic Assessment of Battery Electric Trains and Recharging Infrastructure Alternatives Integrating Adjacent Renewable Energy Sources. Sustainability 2021, 13, 8234. [Google Scholar] [CrossRef] [Scilit]
- Gonzalez-Gil, A.; Palacin, R.; Batty, P.; Powell, J. Energy-efficient urban railway operation with bidirectional regenerative energy transfer: A model and case study. IEEE Trans. Intell. Transp. Syst. 2013, 14, 1462–1474. [Google Scholar]
- Pugi, L. Synergic design and simulation of battery-operated trains on partially electrified lines: A case study regarding the Firenze–Faenza line. Energies 2024, 17, 24. [Google Scholar] [CrossRef] [Scilit]
- Ruvio, A.; Bayrak, O. A preliminary design of a hybrid train’s on-board batteries for a 25 kV–50 Hz high speed railway line. J. Energy Storage 2024, 84, 110966. [Google Scholar] [CrossRef] [Scilit]
- Su, S.; Tang, T.; Wang, Y. Evaluation of strategies to reduce traction energy consumption of metro systems using an optimal train control simulation model. Energies 2016, 9, 105. [Google Scholar] [CrossRef] [Scilit]
- Pesaran, A. Battery thermal management in EVs and HEVs: Issues and solutions. In Proceedings of the Advanced Automotive Battery Conference, Las Vegas, NV, USA, 12–14 February 2001. [Google Scholar]
- Jaquemont, J.; Boulon, L.; Dube, Y. A A comprehensive review of lithium-ion batteries used in hybrid and electric vehicles at cold temperatures. Appl. Energy 2016, 164, 99–114. [Google Scholar] [CrossRef] [Scilit]
- Yang, N.; Zhang, X.; Li, G.; Hua, D. Assessment of the forced air-cooling performance for cylindrical lithium-ion battery packs: A comparative analysis between aligned and staggered cell arrangements. Appl. Therm. Eng. 2015, 80, 55–65. [Google Scholar] [CrossRef] [Scilit]
- An, Z.; Jia, L.; Ding, Y.; Dang, Y.; Li, Y. A review on lithium-ion power battery thermal management technologies and thermal safety. J. Therm. Sci. 2017, 26, 391–412. [Google Scholar] [CrossRef] [Scilit]
- Murashko, K.; Pyrhönen, J.; Jokiniemi, J. Determination of the through-plane thermal conductivity and specific heat capacity of a Li-ion cylindrical cell. Int. J. Heat. Mass. Transf. 2020, 162, 120330. [Google Scholar] [CrossRef] [Scilit]
- Hussein, S. Design and Simulation of Battery Thermal Management System for Onboard Railway Applications; Microelettrica: Milan, Italy, 2024. [Google Scholar]
- Trenitalia. ROCK: La Nuova Generazione dei Treni Regionali—Scheda Tecnica. 2017. Available online: https://www.fsitaliane.it/content/dam/fsitaliane/Documents/old-media-ed-eventi/comunicati-stampa-e-news/anno-2017/ottobre/2017_10_10_scheda_tecnica_rock.pdf (accessed on 5 August 2025).
- Wang, J.; Rakha, H.A. Electric Train Energy Consumption Modeling. Appl. Energy 2017, 193, 346–355. [Google Scholar] [CrossRef] [Scilit]
- Fusi, A. Preliminary Design of a Hybrid Braking Unit for Rolling Stock Applications. Master’s Thesis, Politecnico di Milano, Milan, Italy, 2022. [Google Scholar]
- Wieser, S.; Schenker, M.; Schwurack, H.; Hoffmann, S. Efficient Air Conditioning of Battery-Electric Multiple Units (BEMU): Modeling and Optimization. In Transport Transitions: Advancing Sustainable and Inclusive Mobility; Springer: Cham, Switzerland, 2024. [Google Scholar]
- Sacchi, M.; Ambrogio, S.; Cascone, B.; Lenzi, L.; Sinatti, S. Caravaggio: The New Hitachi High Capacity EMU Platform. Hitachi Rev. 2018, 67, 45–51. [Google Scholar]
- TSA (Traktionssysteme Austria). Reference List—EMU. Available online: https://tsa.at/references/emus/ (accessed on 3 April 2026).
- Iwasaki, M.; Furukawa, K.; Okamoto, K.; Koreishi, K.; Kaneyasu, T.; Kota, Y.; Kawase, K.; Radford, A. Development of Class 385 Semi-customised/Standard Commuter Rolling Stock for Global Markets. Hitachi Rev. 2017, 66, 102–108. [Google Scholar]
- Newag Rail. Elektryczne Zespoly Trakcyjne. Available online: https://www.newag.pl/wp-content/uploads/2025/01/Elektryczne-Zespoly-Trakcyjne-PL.pdf (accessed on 3 April 2026).
- Dobell, M. New Trains in a Pandemic? Rail Engineer, 15 February 2021.
- Alstom; Alstom Press. Coradia Meridian un Treno di Successo. Available online: https://www.ufficiostampa.provincia.tn.it/content/download/34252/596260/file/16%2003%2025%20Presentazione%20Coradia%20Meridian%20Trento%20finale%20-%20rivista.pdf (accessed on 3 April 2026).
- Locoinfo.com. Alstom Coradia Meridian Italian State Railway ALe 501, ALn 501, ETR 245, 324, 425 and 526. Available online: https://loco-info.com/view.aspx?id=13576& (accessed on 3 April 2026).
- Railmarket News. Alstom’s Battery-Electric Coradia Continental Trains Enter Regular Service on Chemnitz–Leipzig Line. 2026. Available online: https://railmarket.com/news/rolling-stock/50176-alstom-s-battery-electric-coradia-continental-trains-enter-regular-service-on-chemnitz-leipzig-line?utm_source=chatgpt.com (accessed on 3 April 2026).
- Kondo, M.; Miyabe, T.; Manabe, Y. Development of a high efficiency induction motor and the estimation of energy conservation effect. Q. Rep. RTRI 2014, 55, 138–143. [Google Scholar] [CrossRef] [Scilit]
- Azab, M. A Review of Recent Trends in High-Efficiency Induction Motor Drives. Vehicles 2025, 7, 15. [Google Scholar] [CrossRef] [Scilit]
- Alves, M.; Alonso, T.; Pina Martins, J. Modeling and Validation of the Dynamics and Energy Consumption for Train Simulation. In Proceedings of the 2018 International Conference on Intelligent Systems (IS), Funchal, Portugal, 25–27 September 2018. [Google Scholar] [CrossRef] [Scilit]
- Open Railway Map. World’s Railway Infrastructure. Available online: https://www.openrailwaymap.org/ (accessed on 20 January 2026).
- EN 15663:2017+A2:2024; Railway Applications—Vehicle Reference Masses. European Committee for Standardization: Brussels, Belgium, 2024.
- Wu, Z.; Gao, C.; Tang, T. An Optimal Train Speed Profile Planning Method for Induction Motor Traction System. Energies 2022, 14, 5153. [Google Scholar] [CrossRef] [Scilit]
- Dynalene. Dynalene LC-PG—Water/Glycol Datasheet; Dynalene: Whitehall, PA, USA, 2020. [Google Scholar]
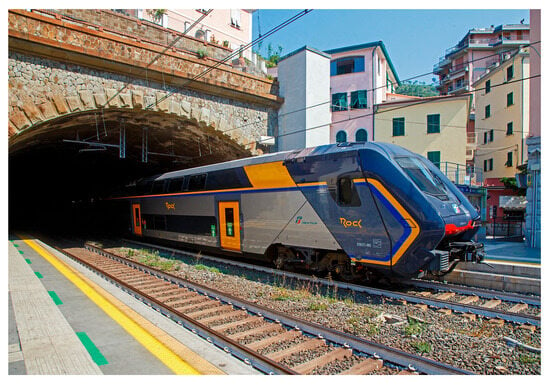
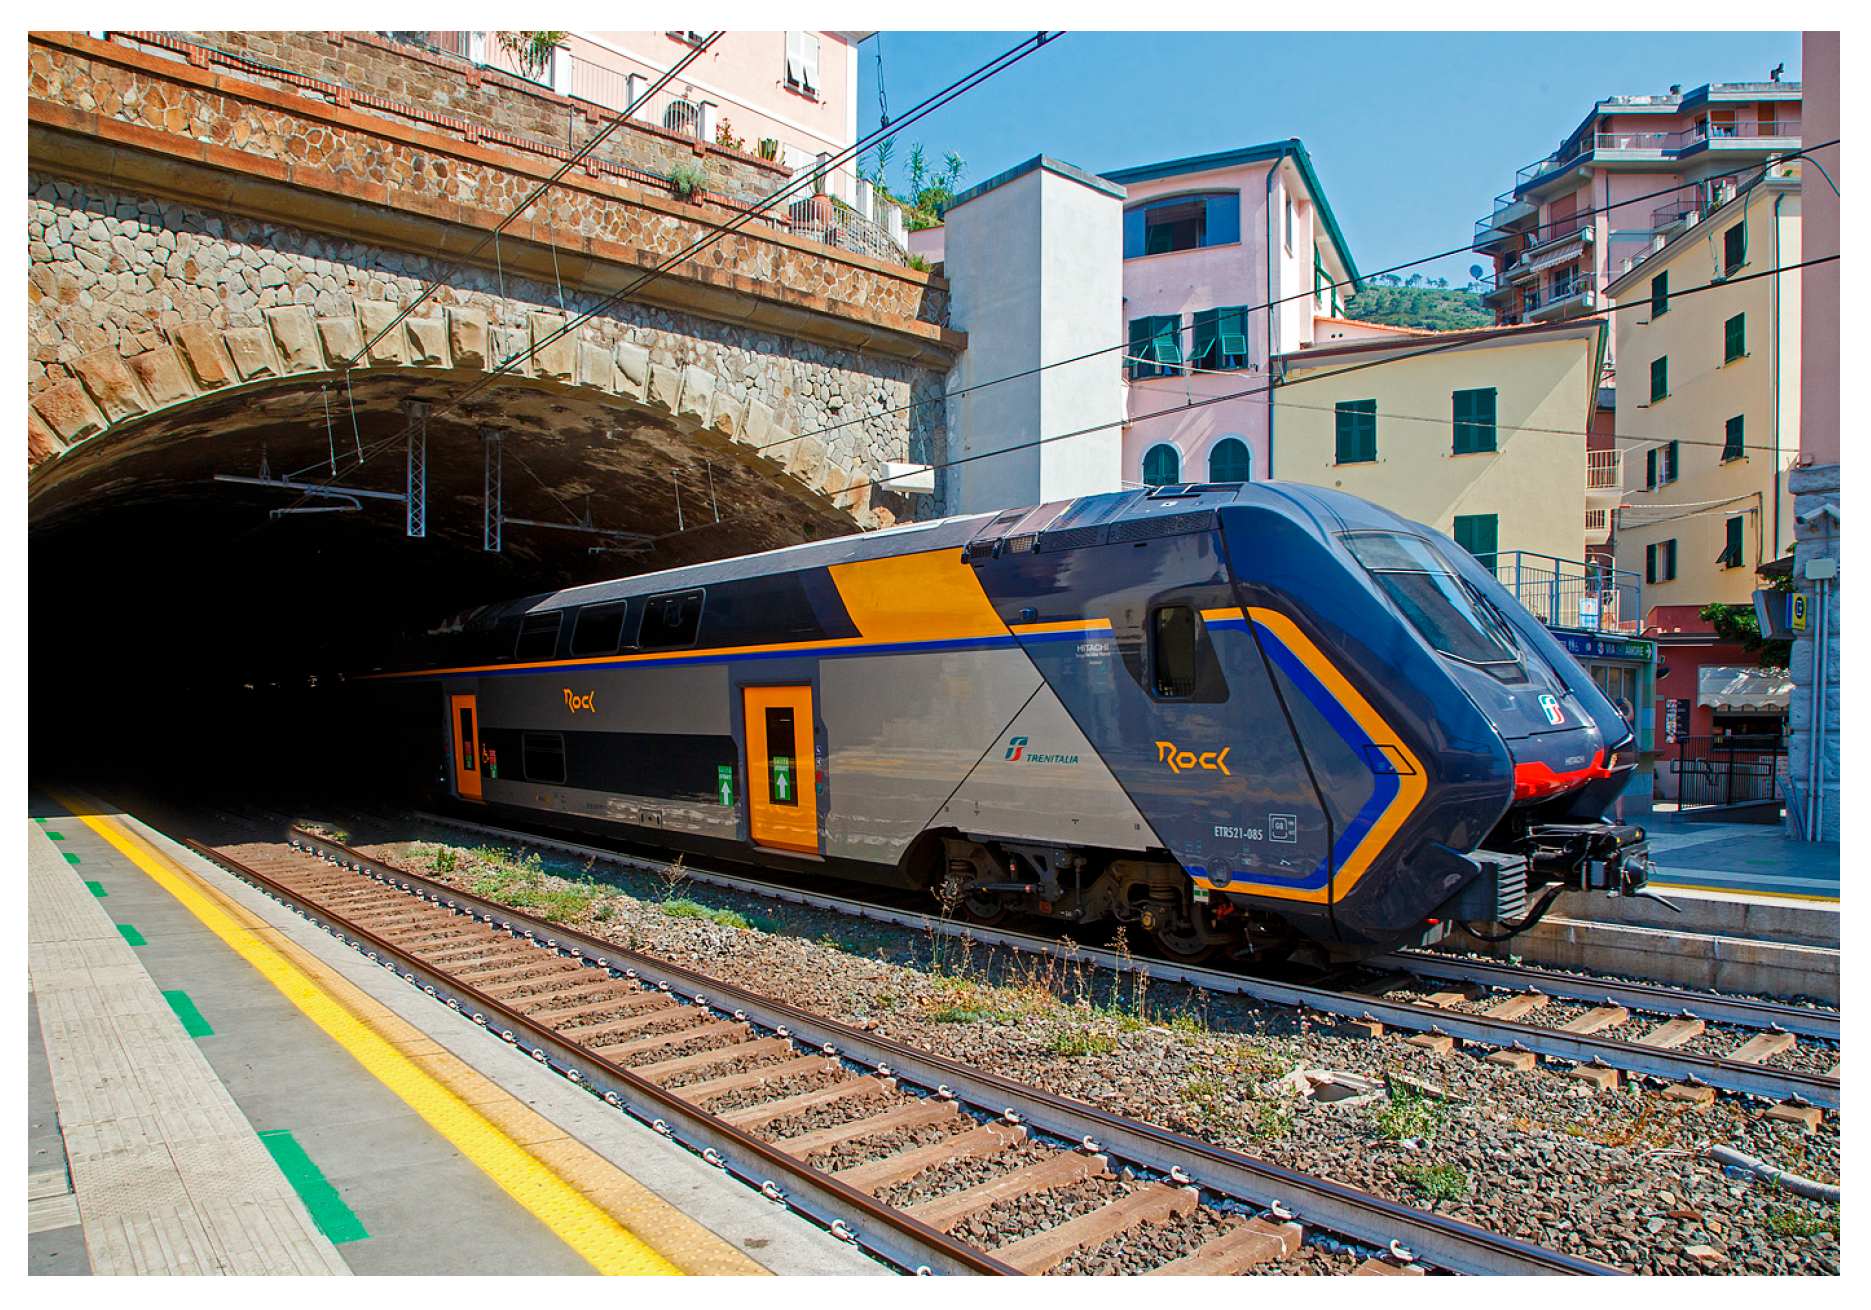
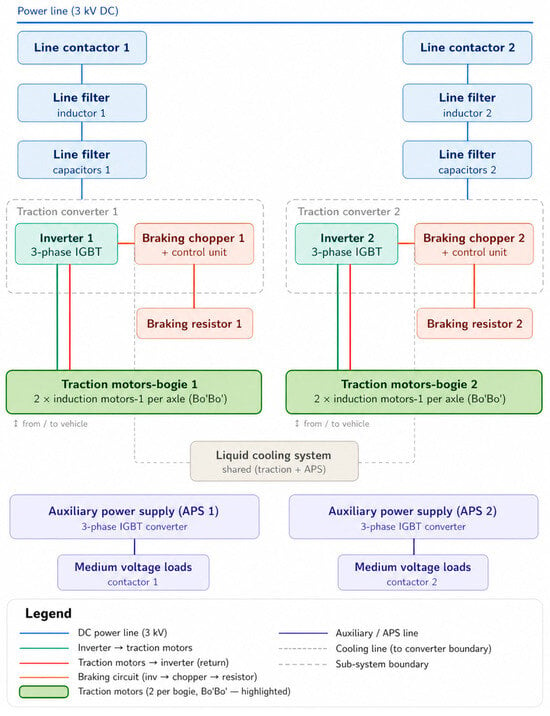
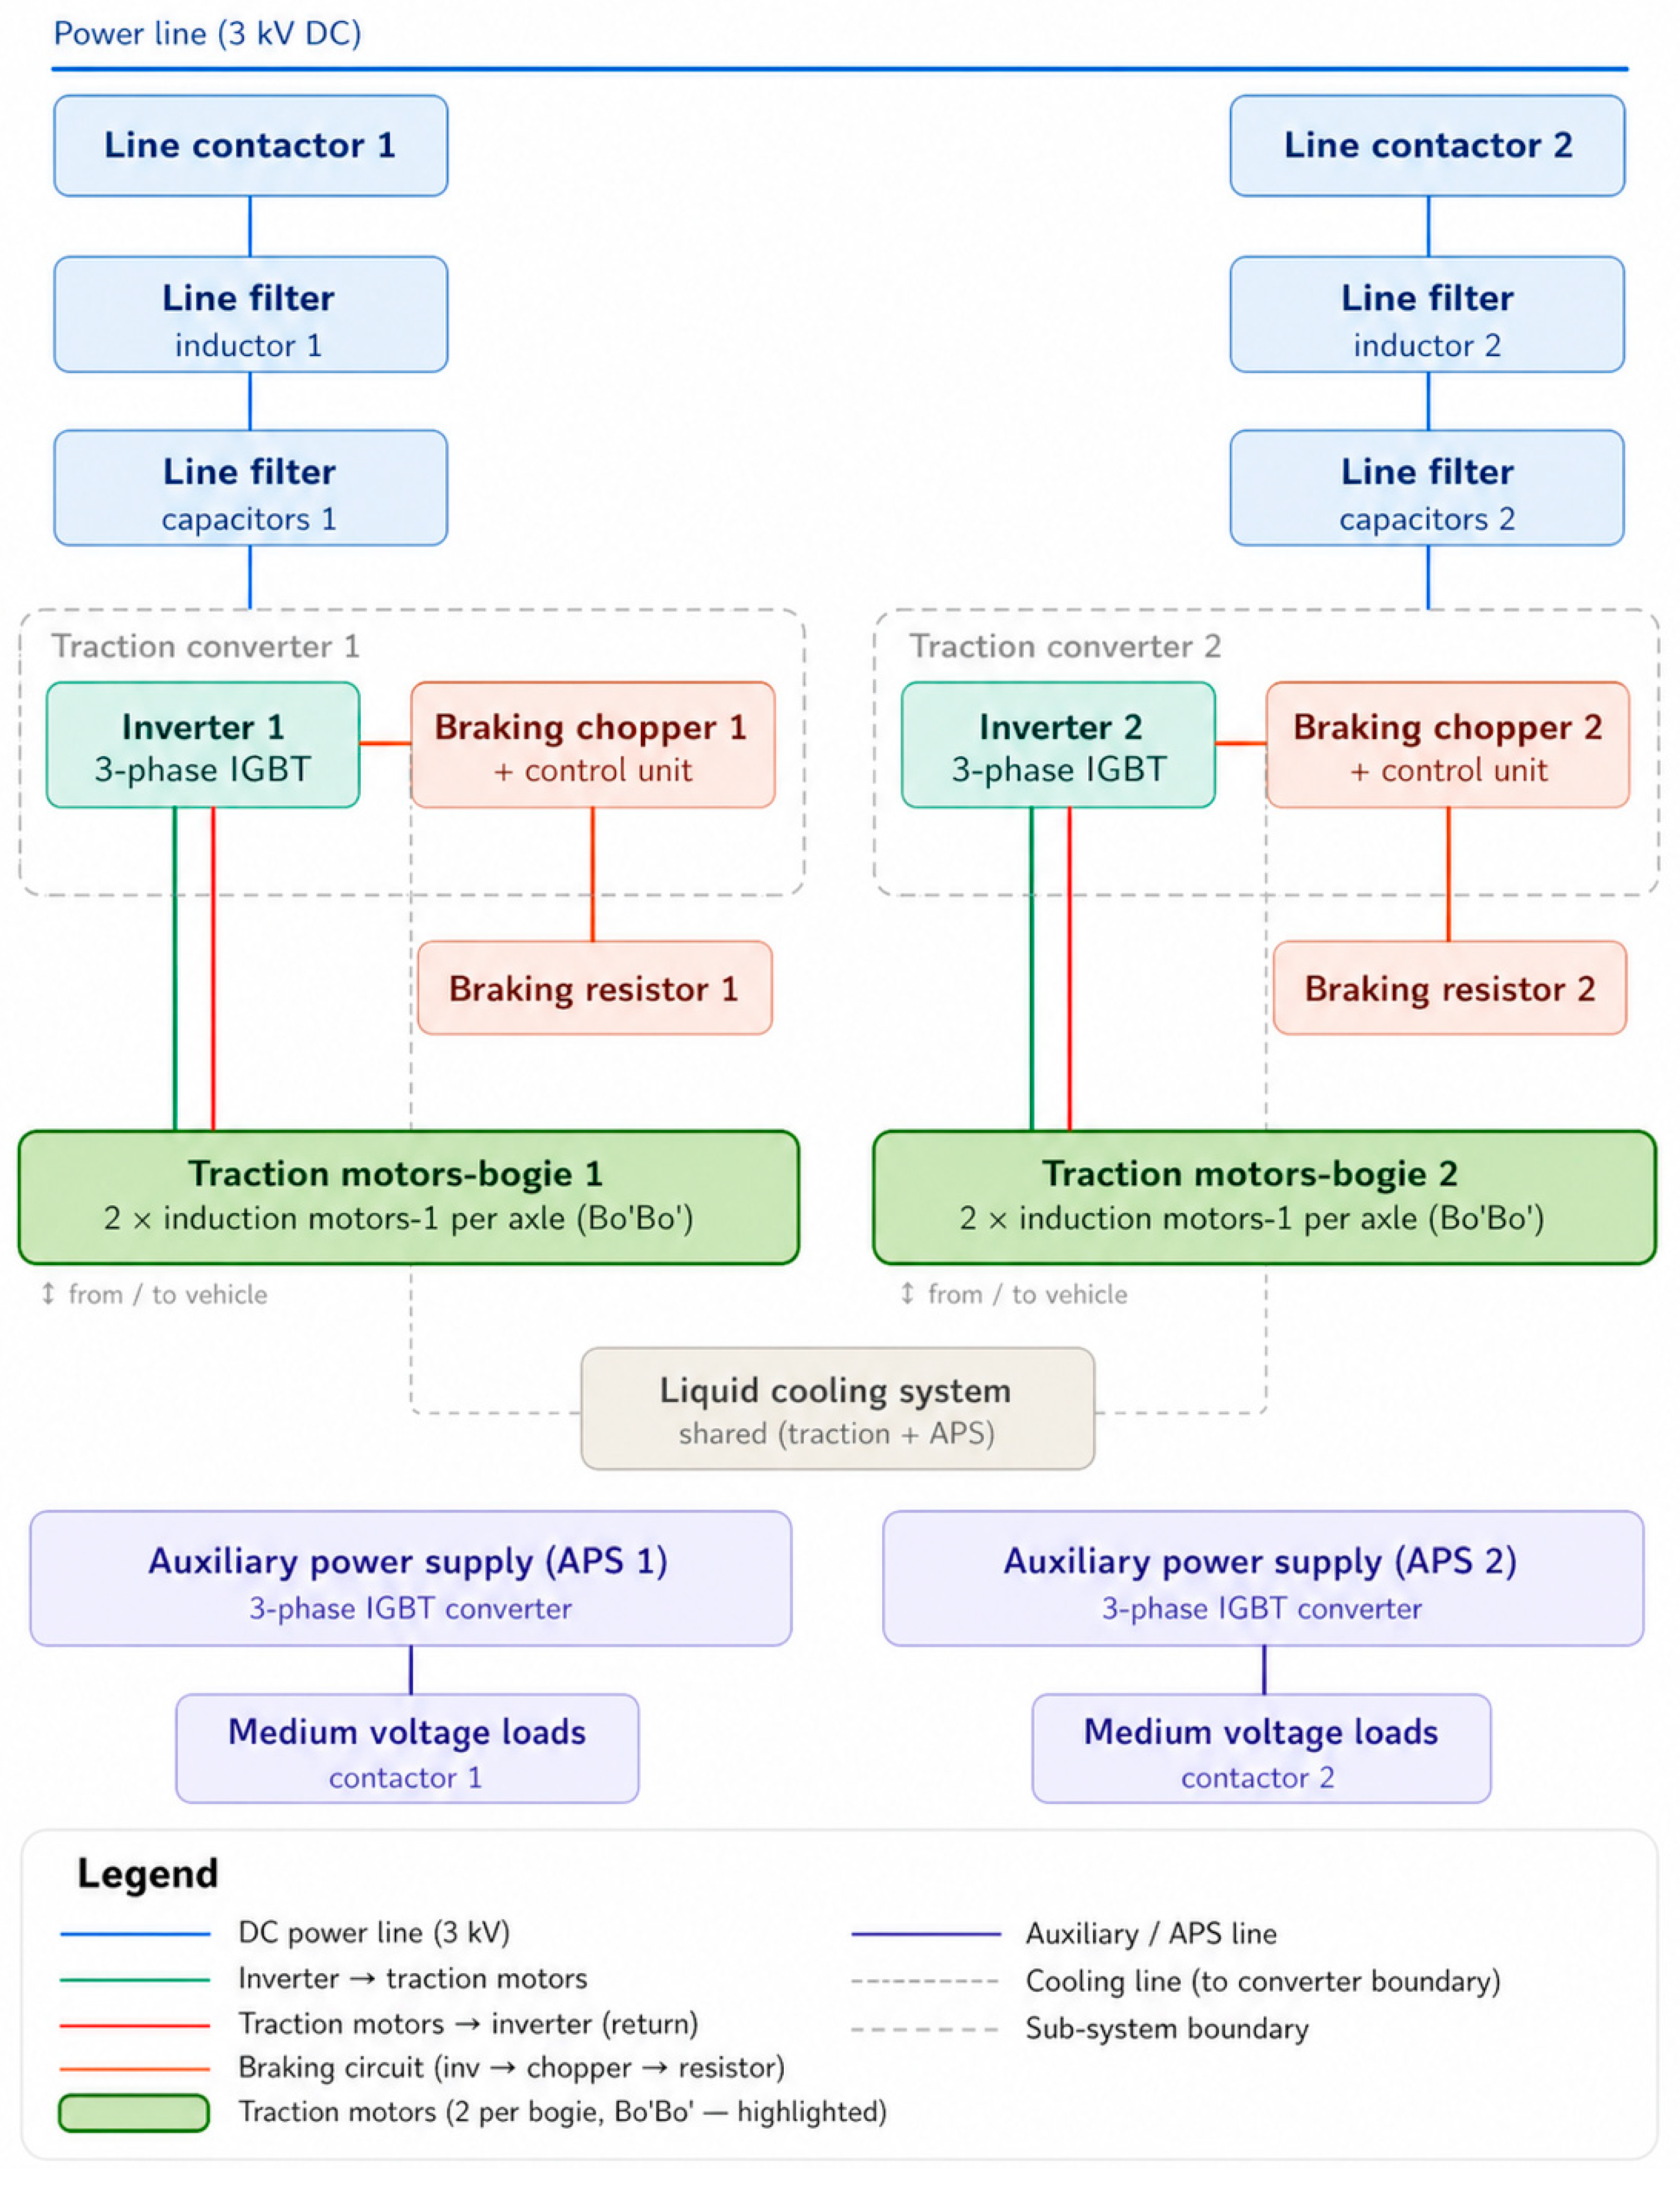
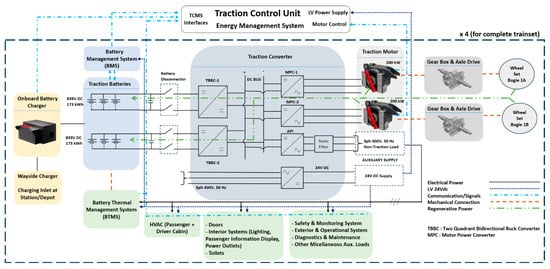
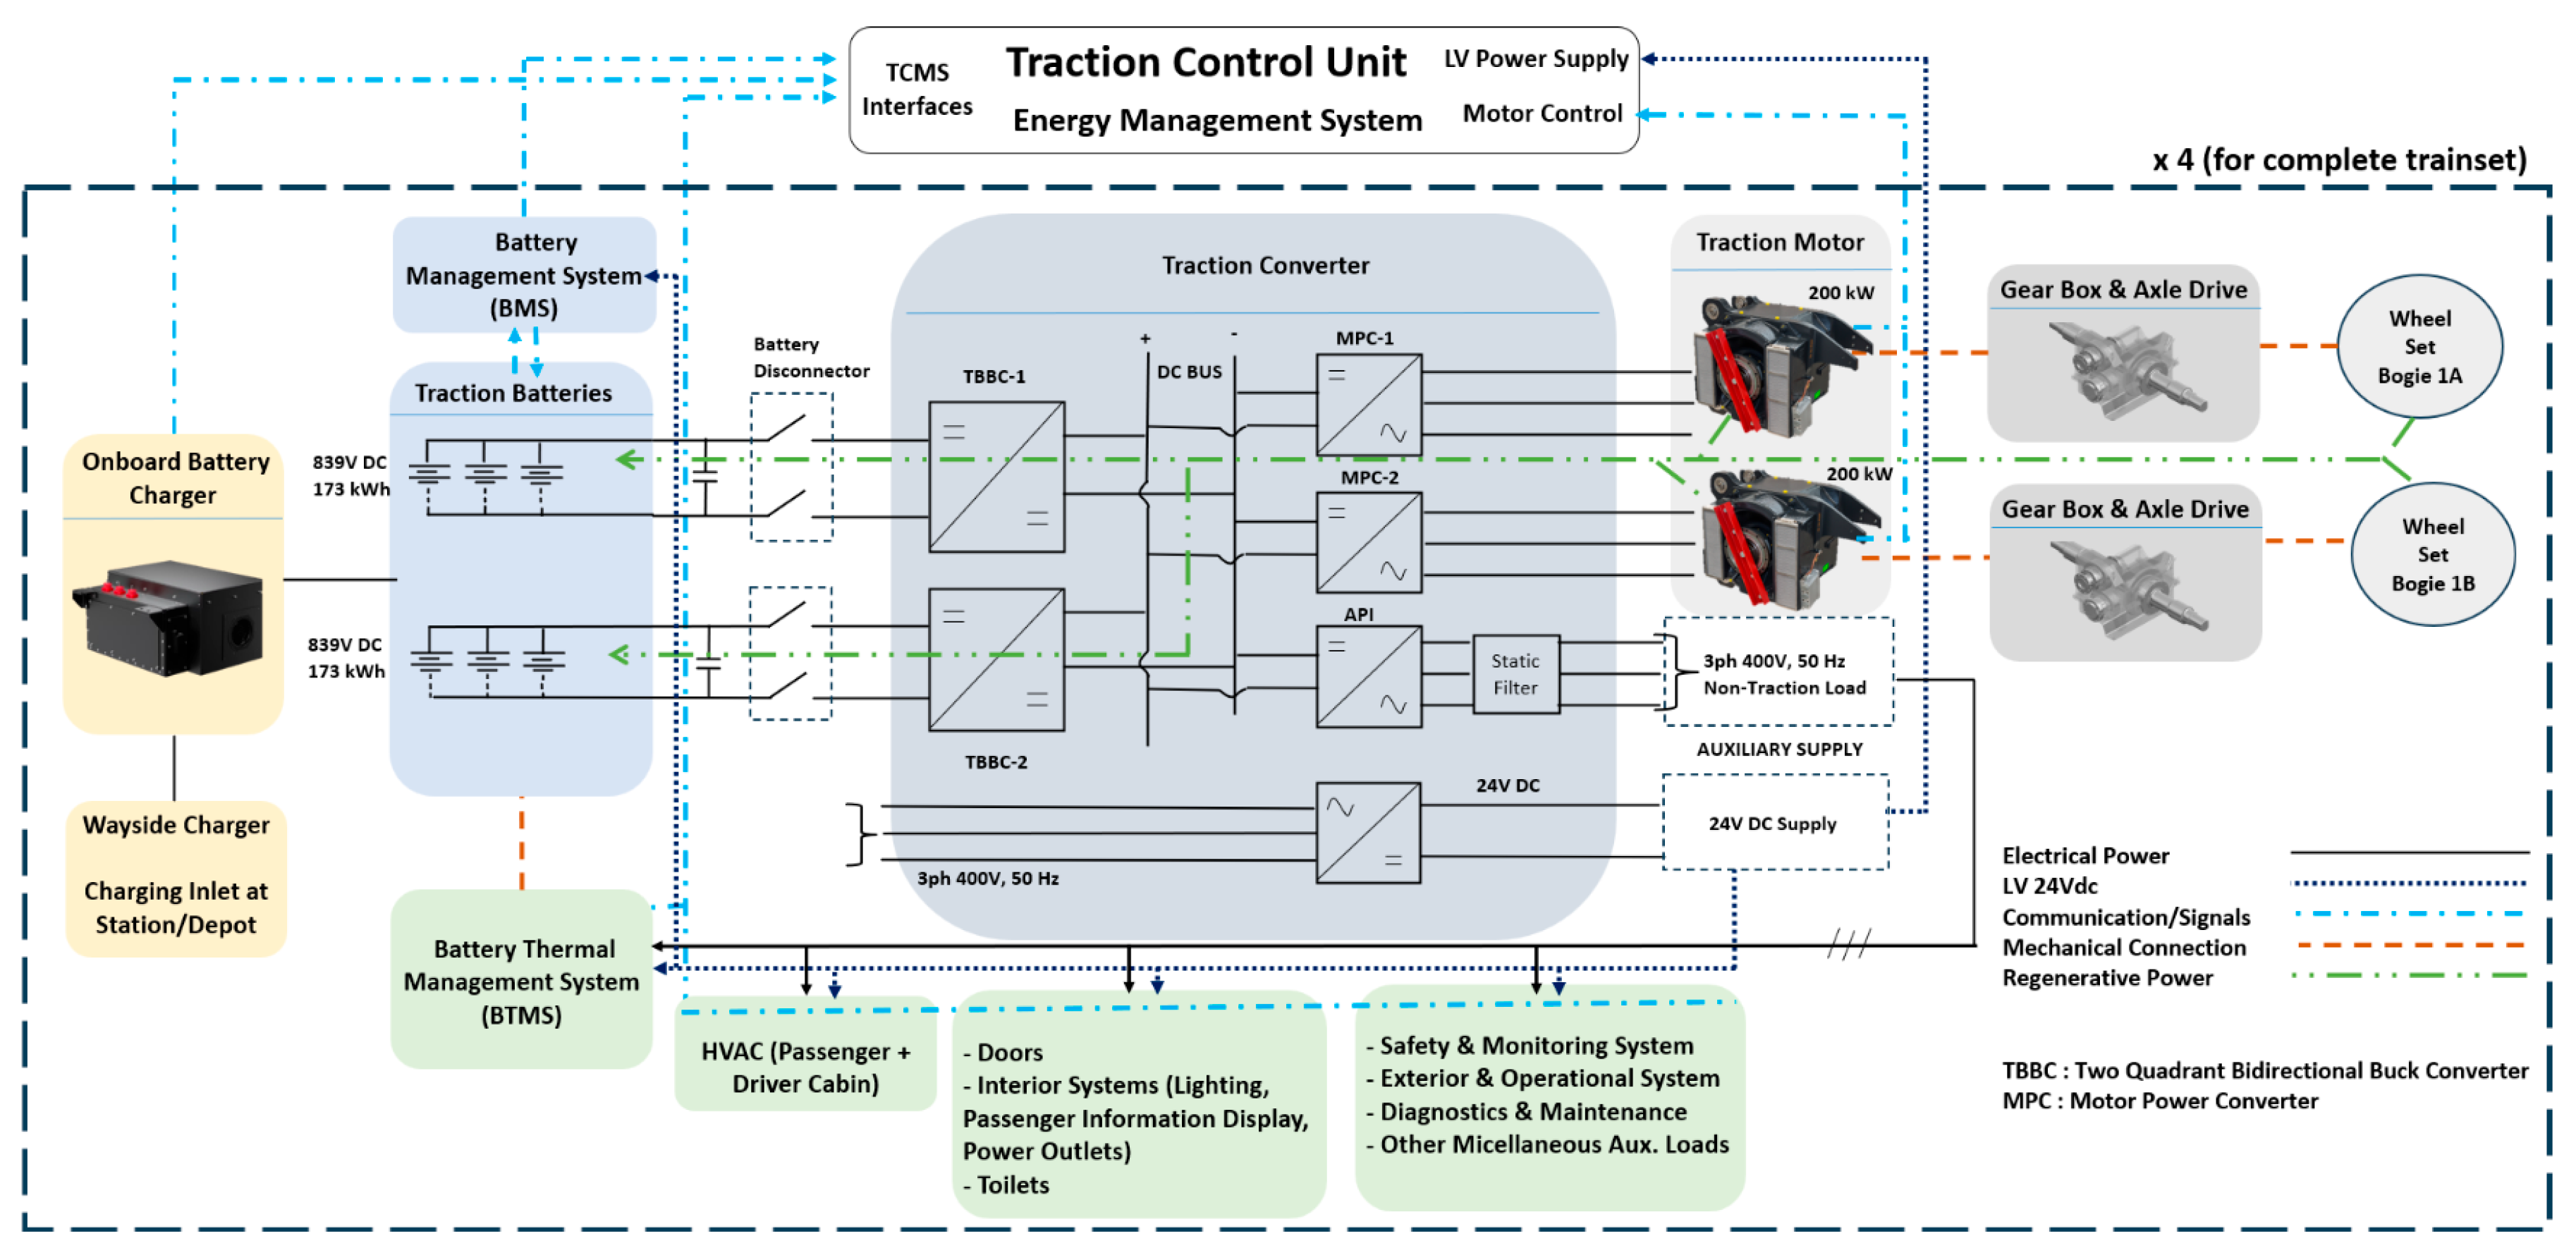
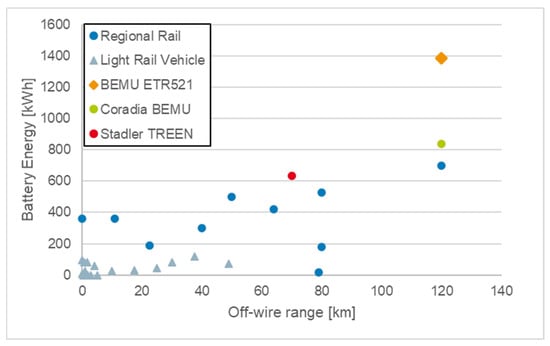
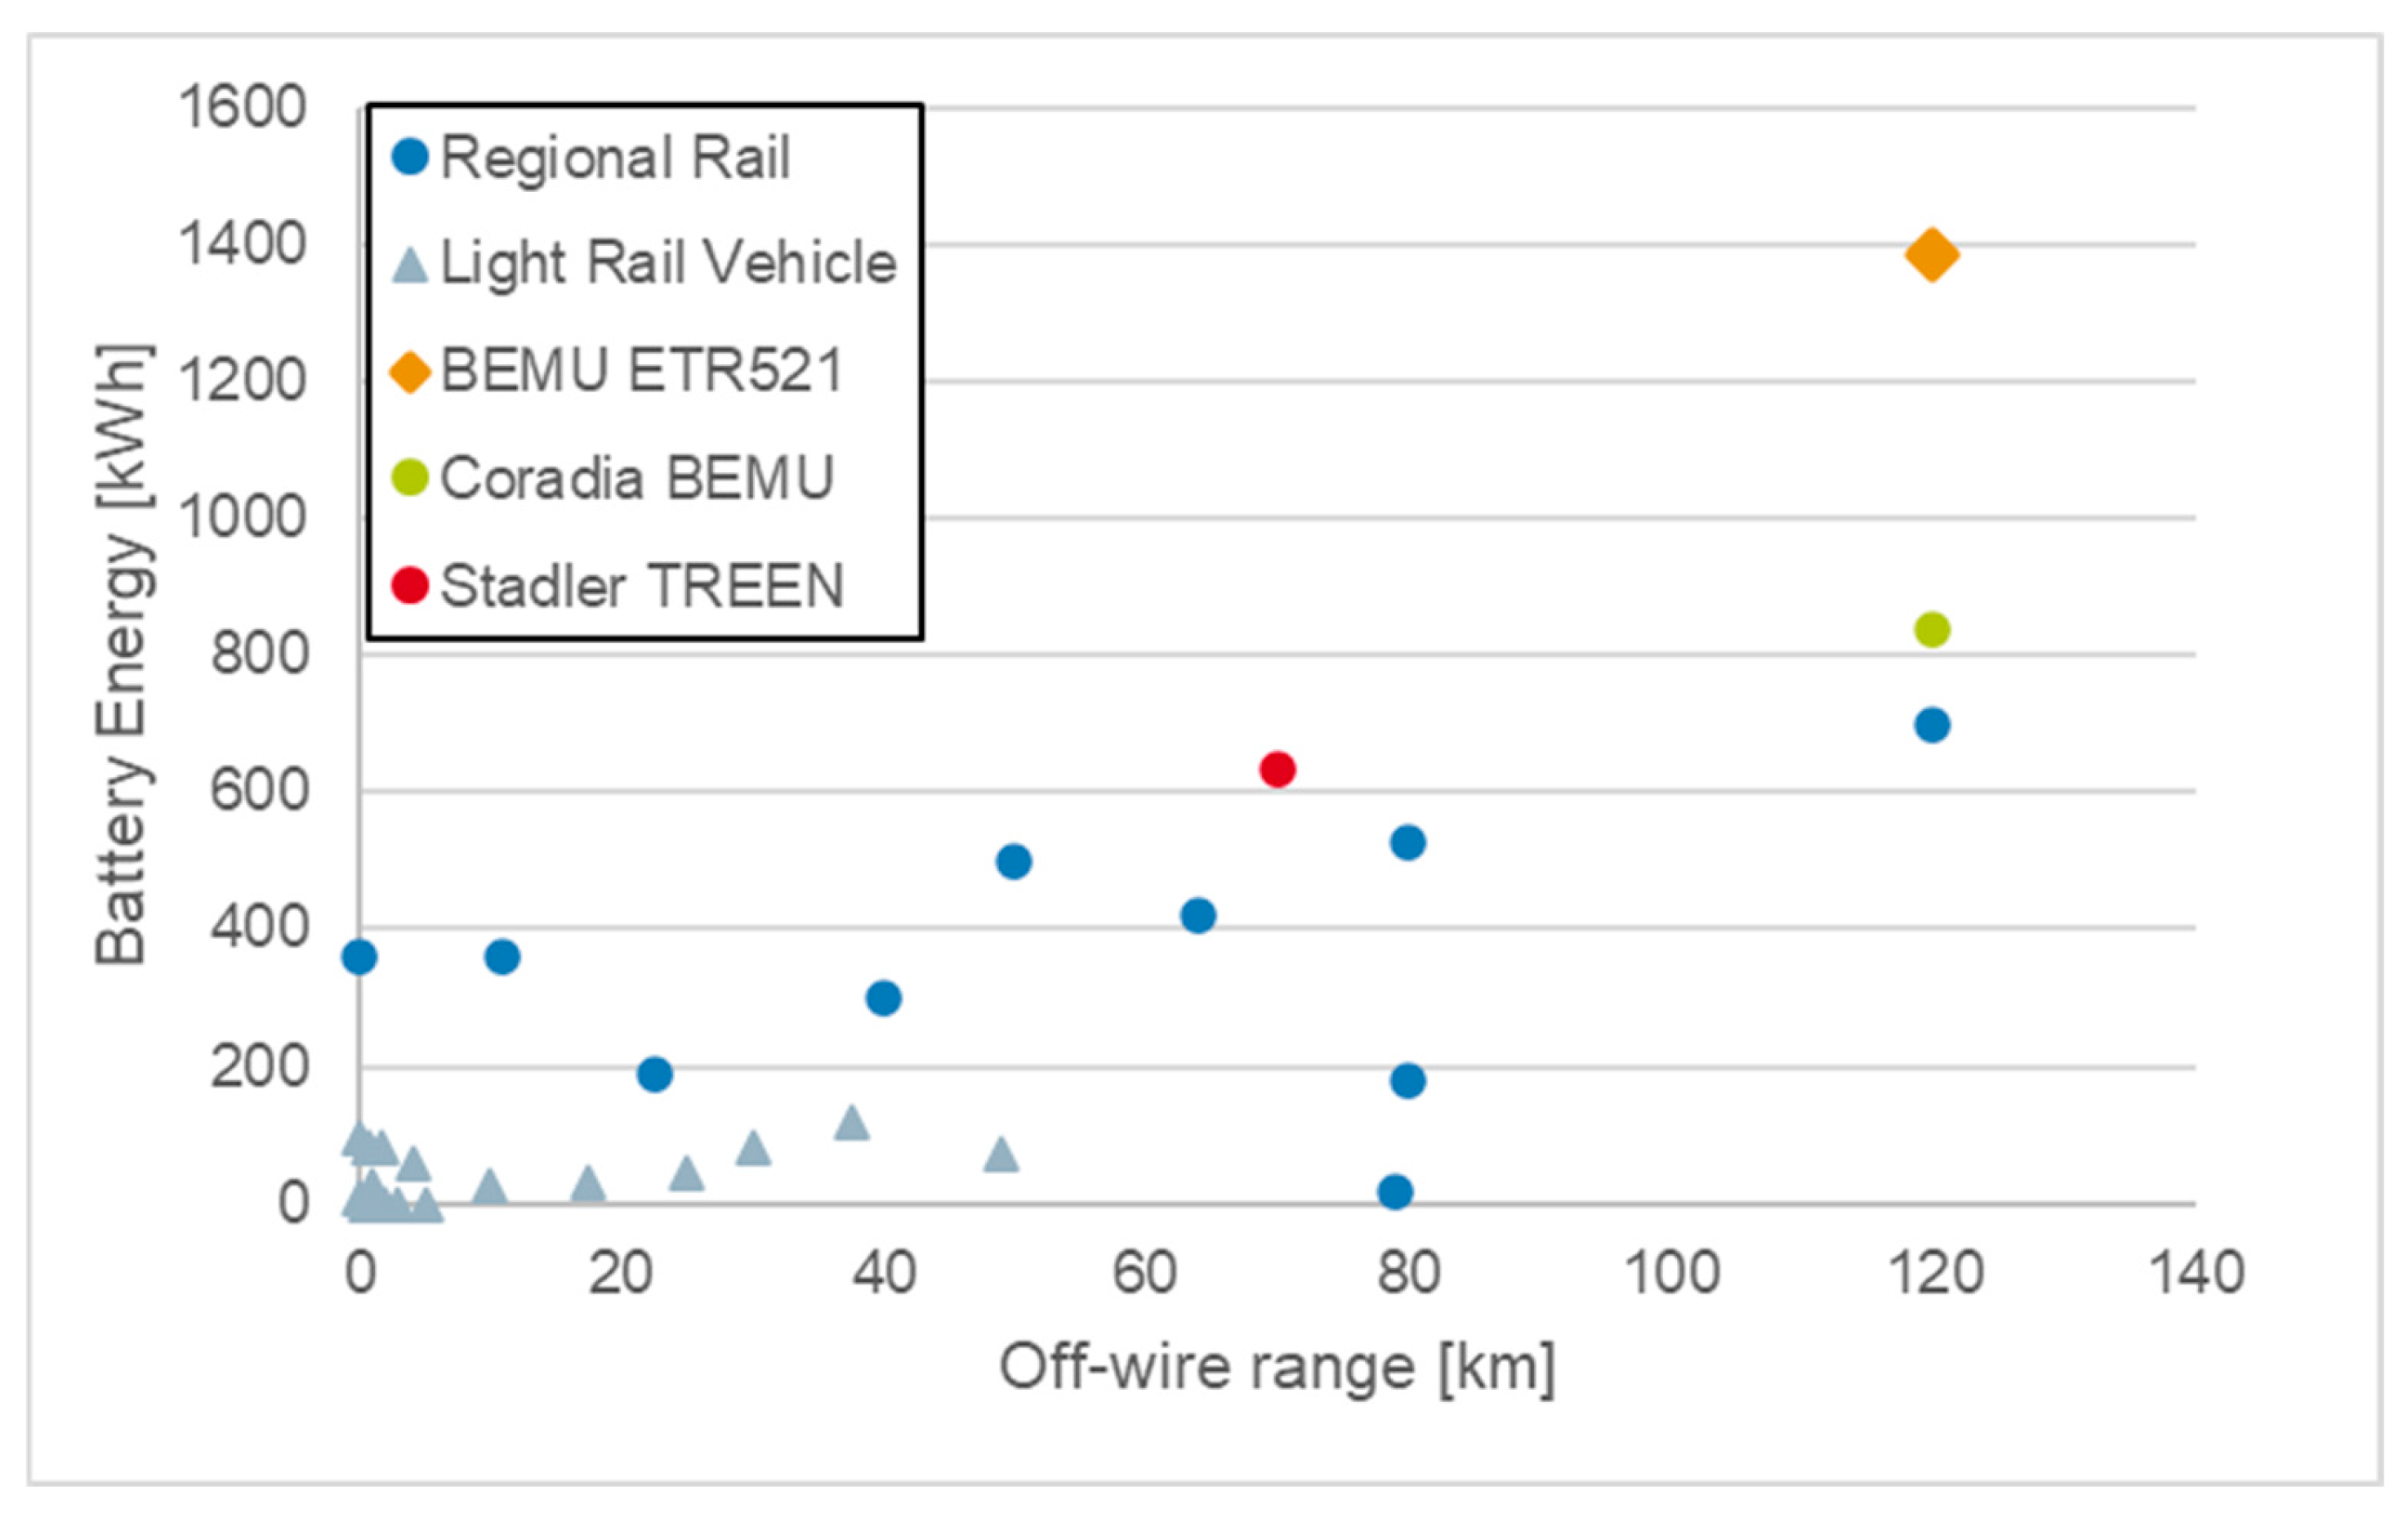
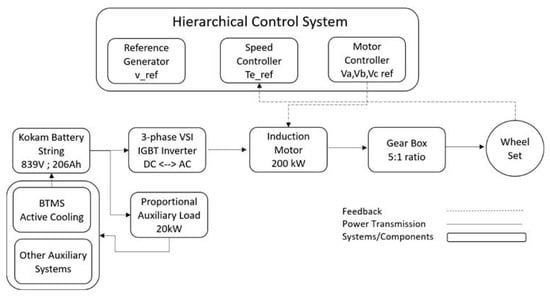
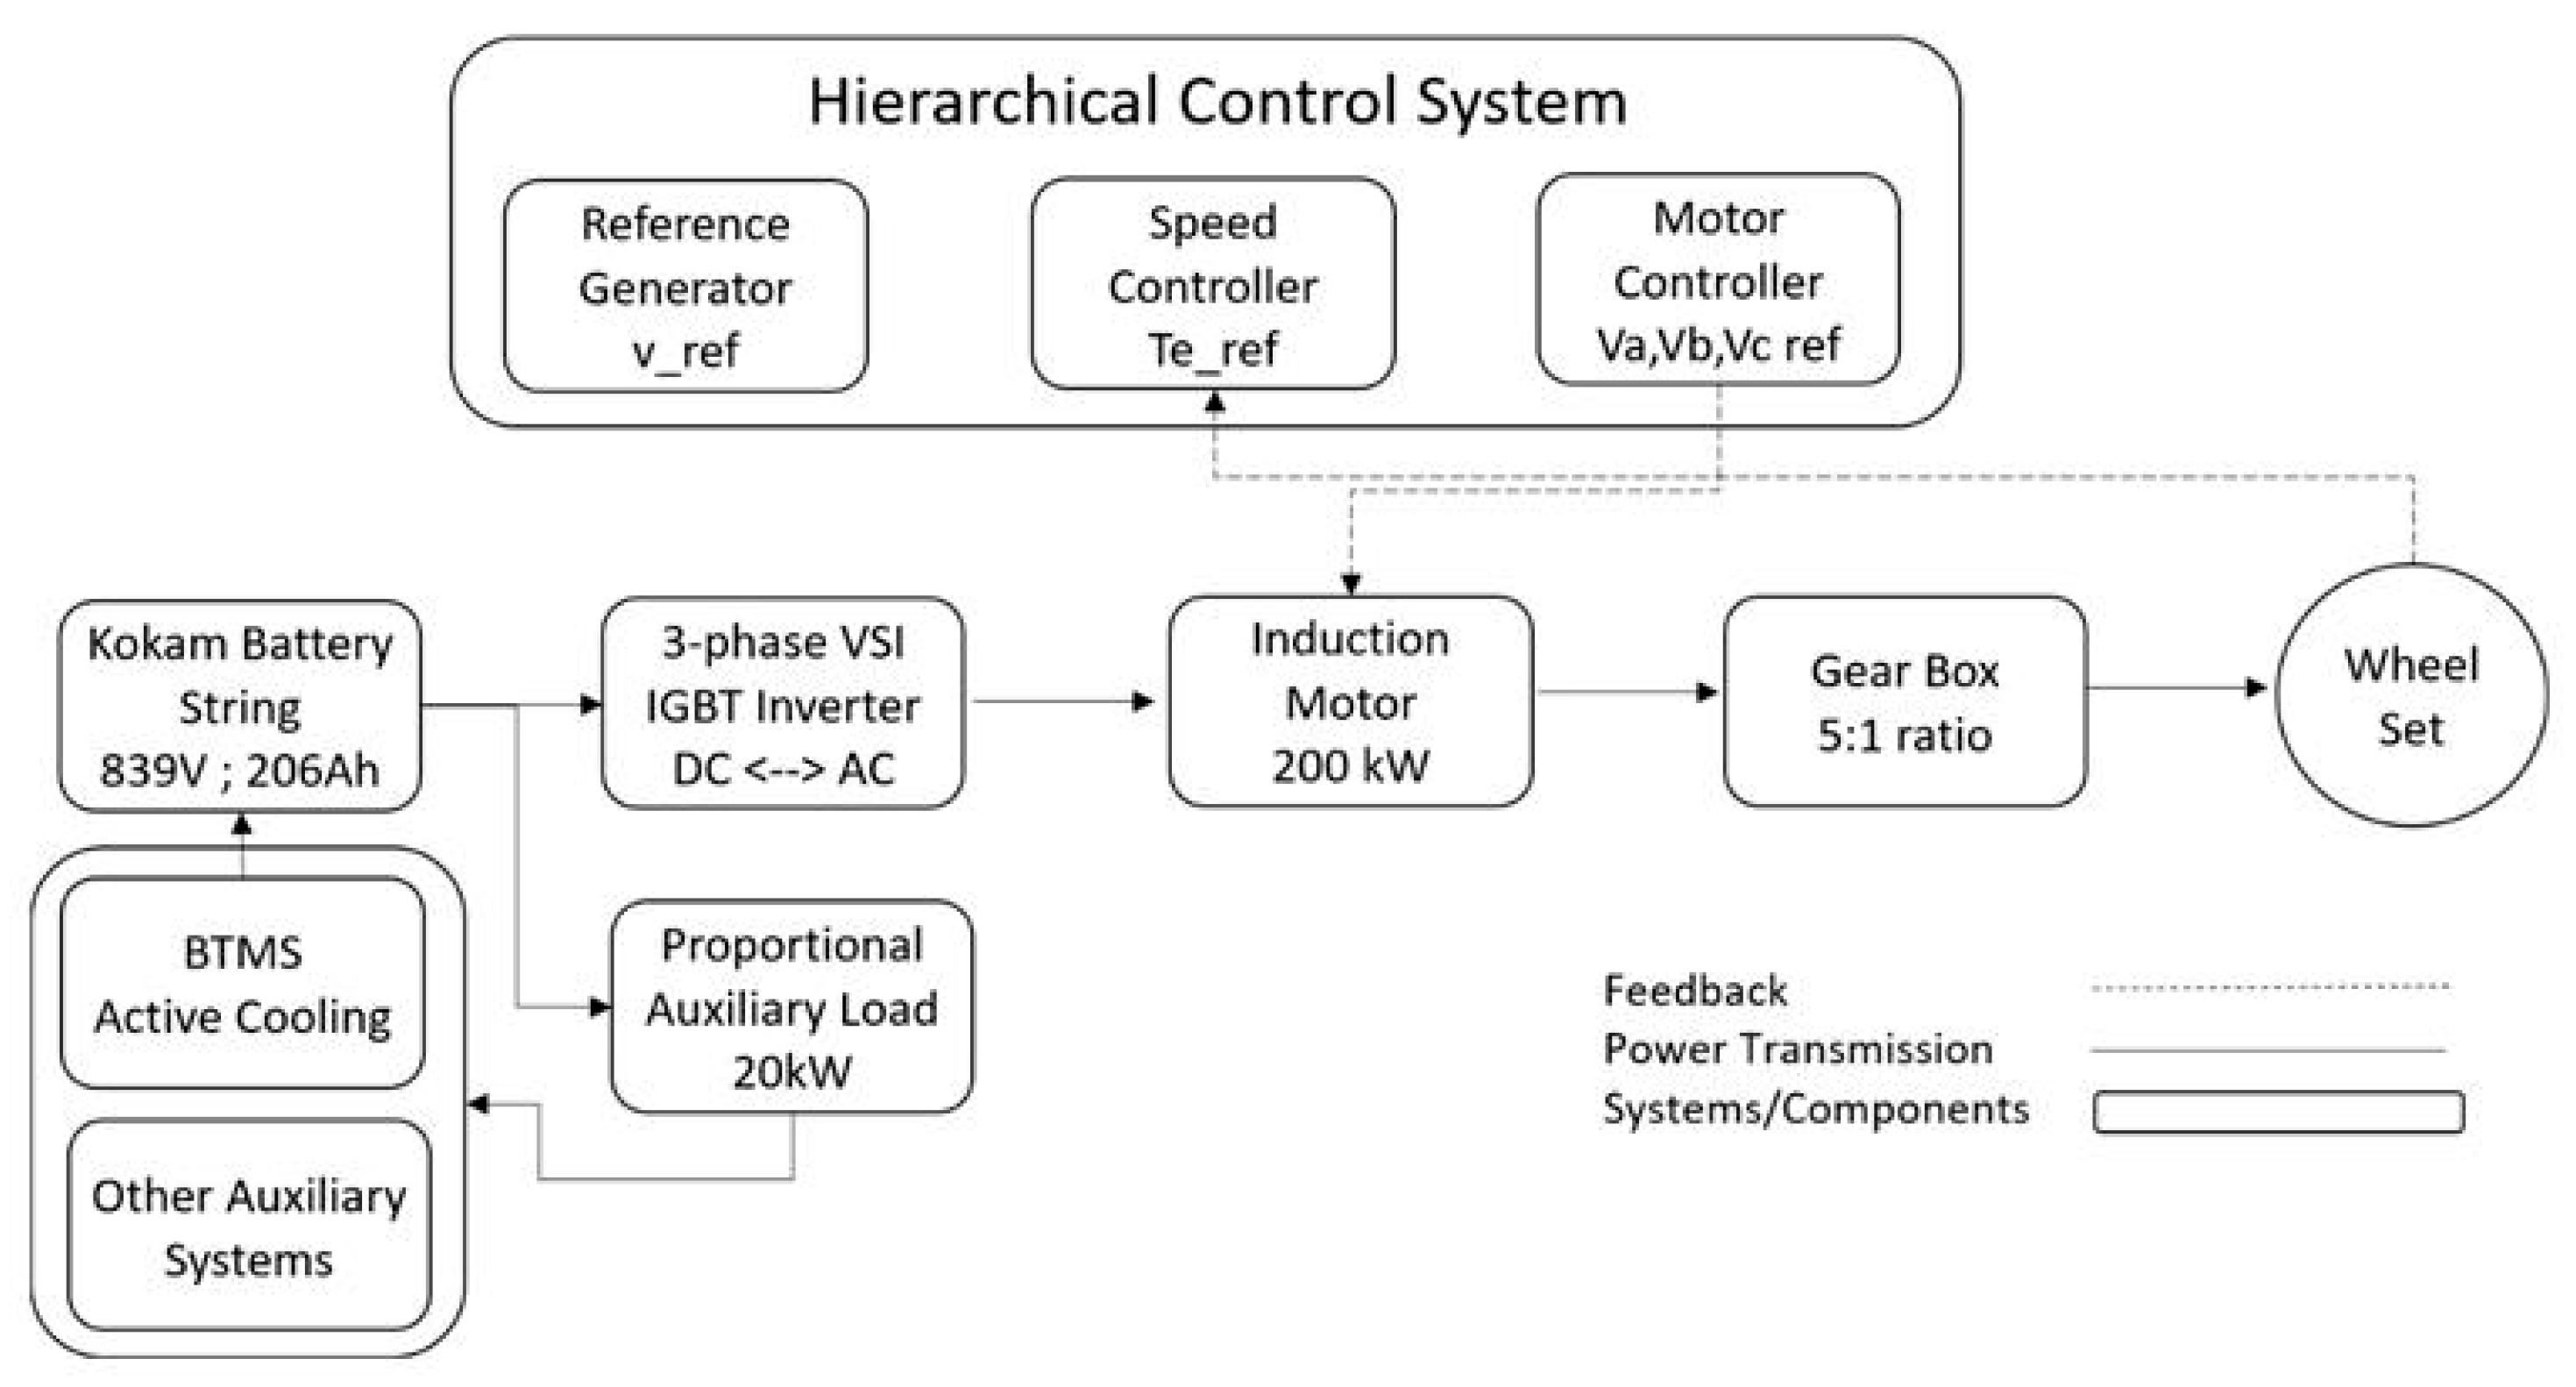
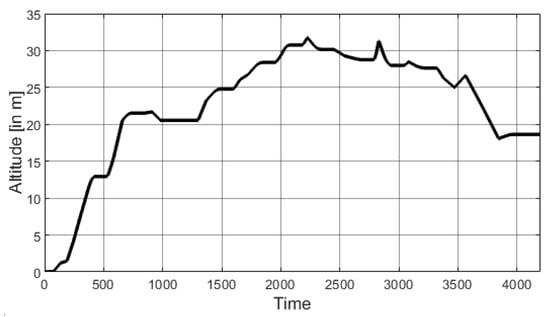
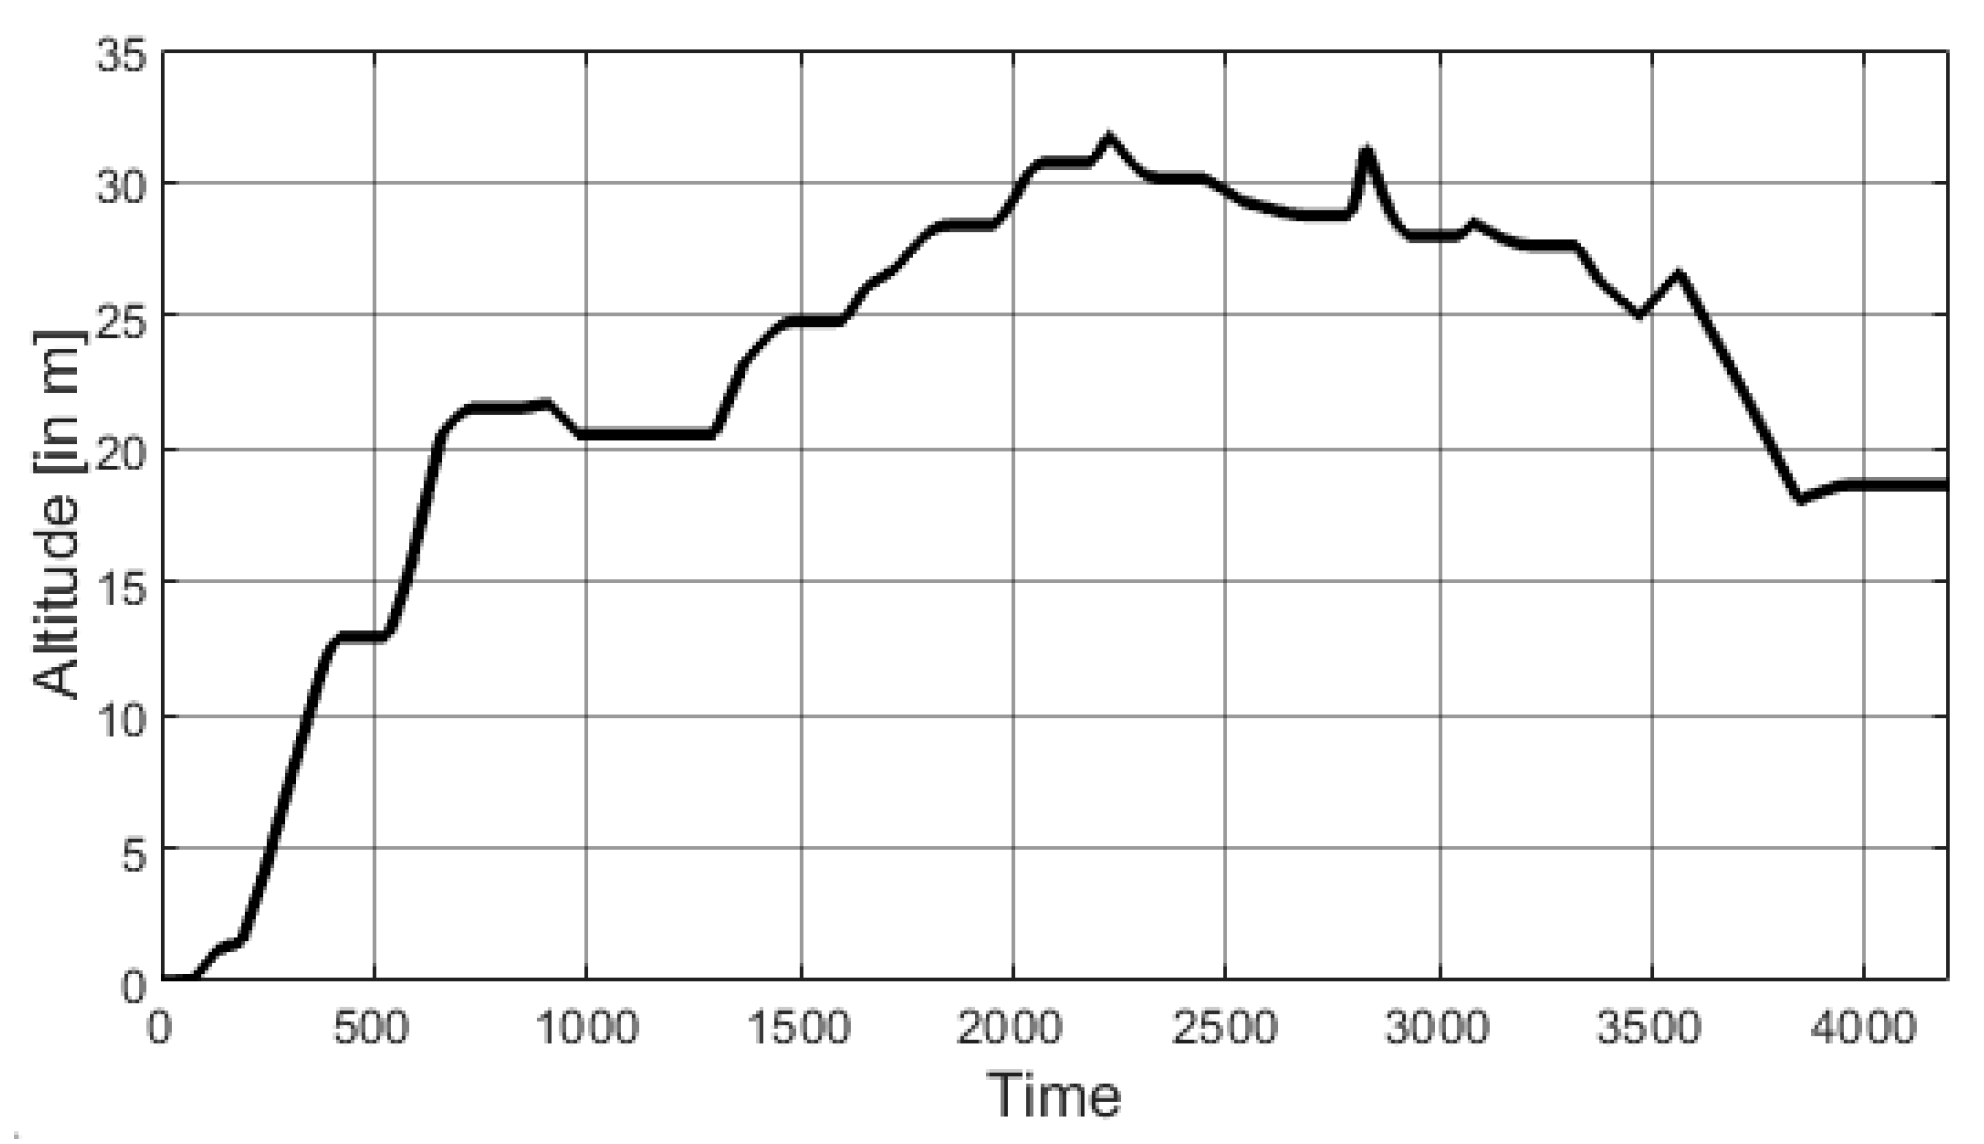
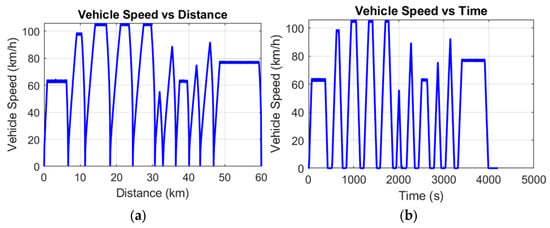
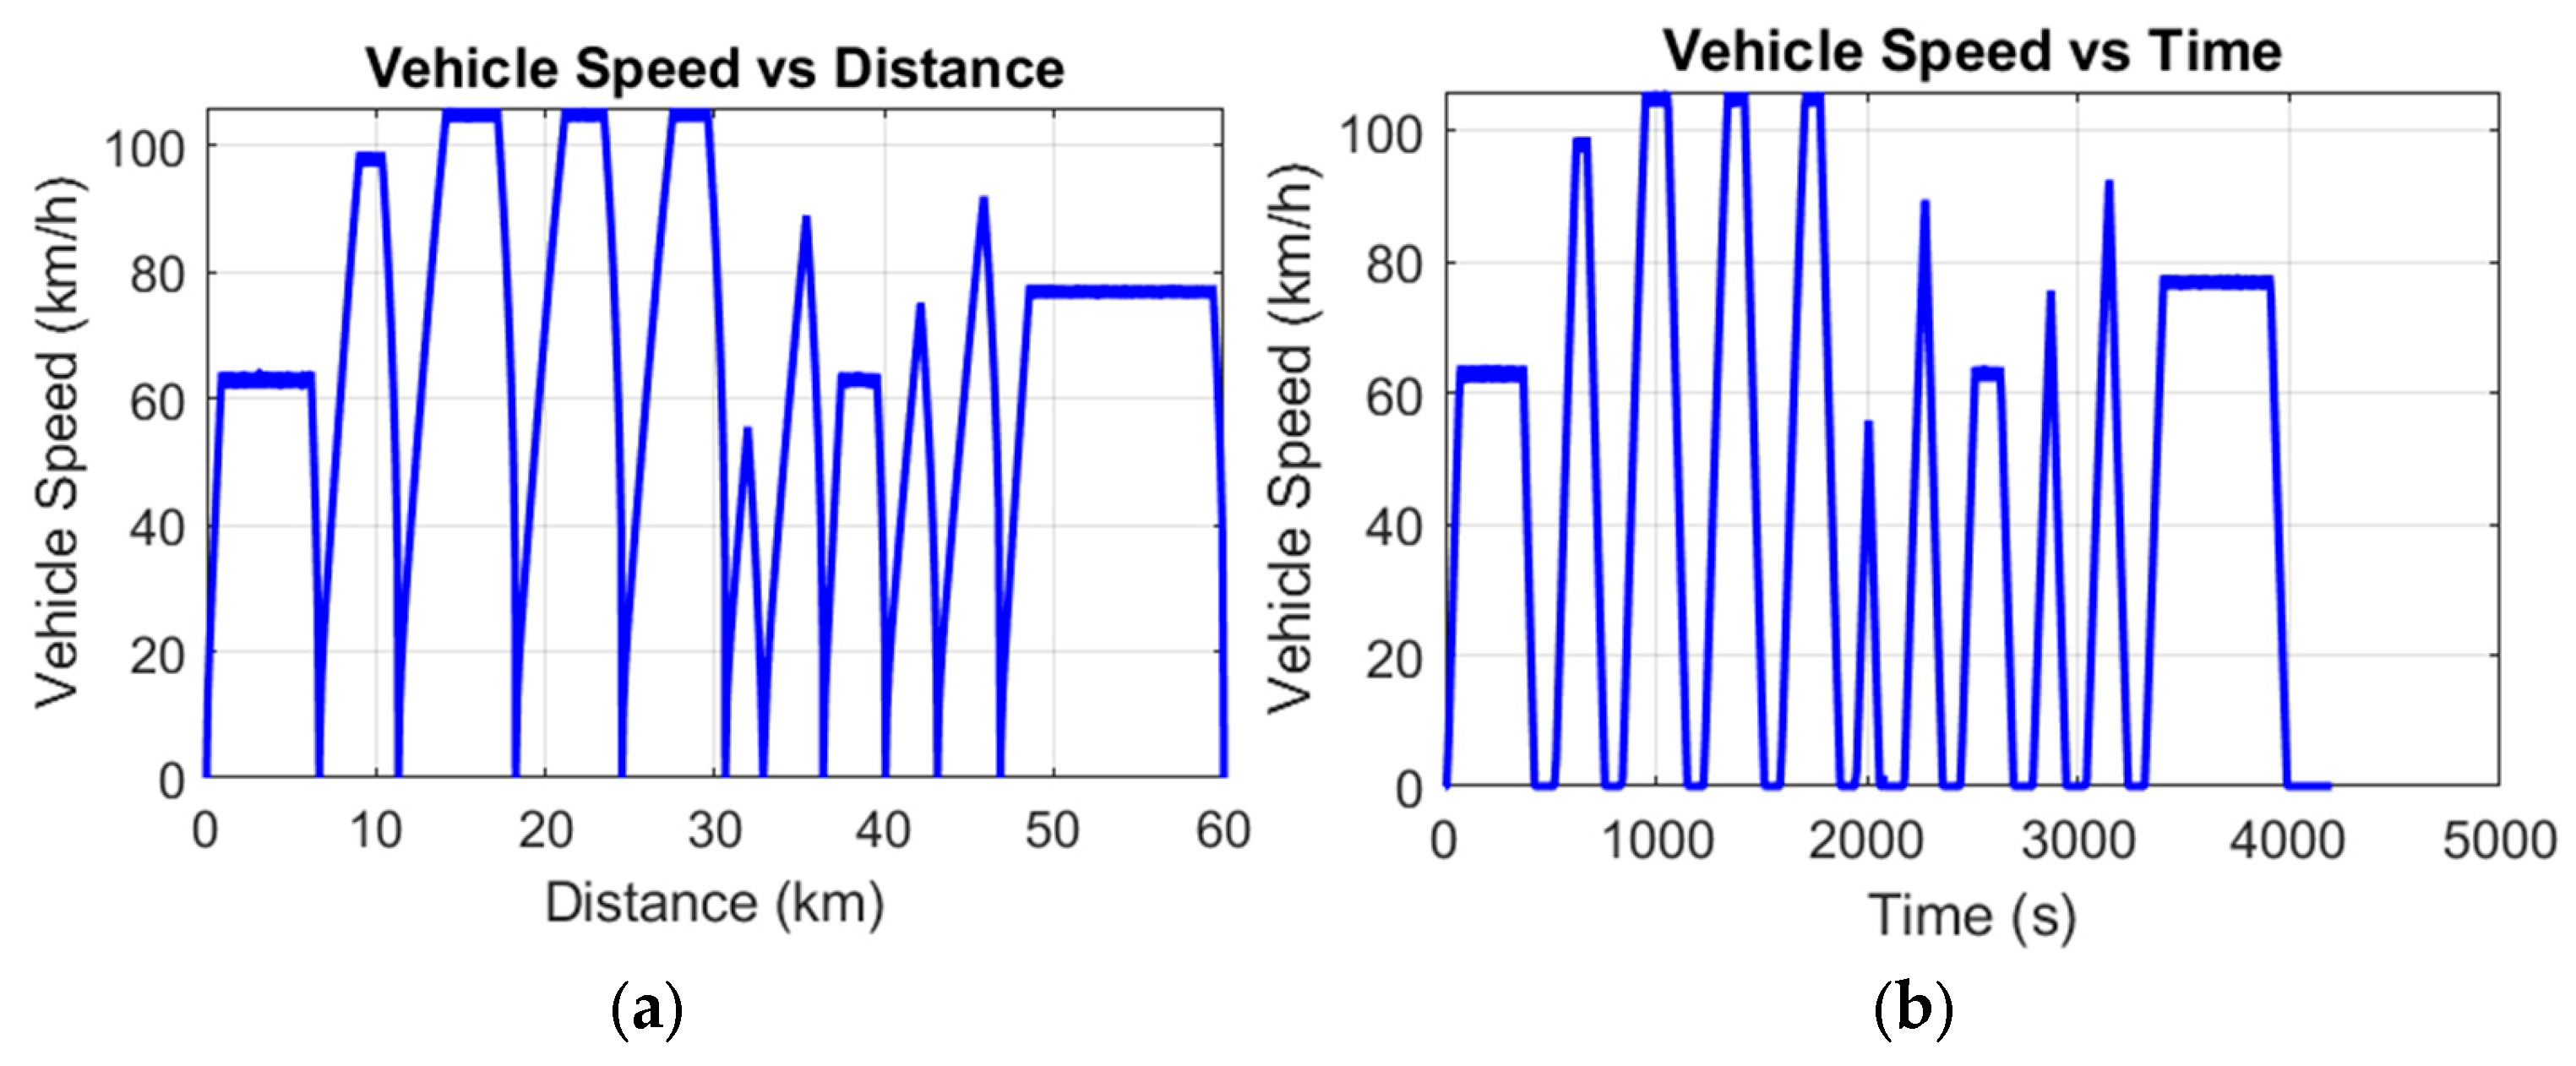
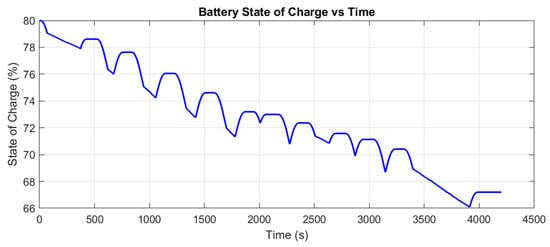
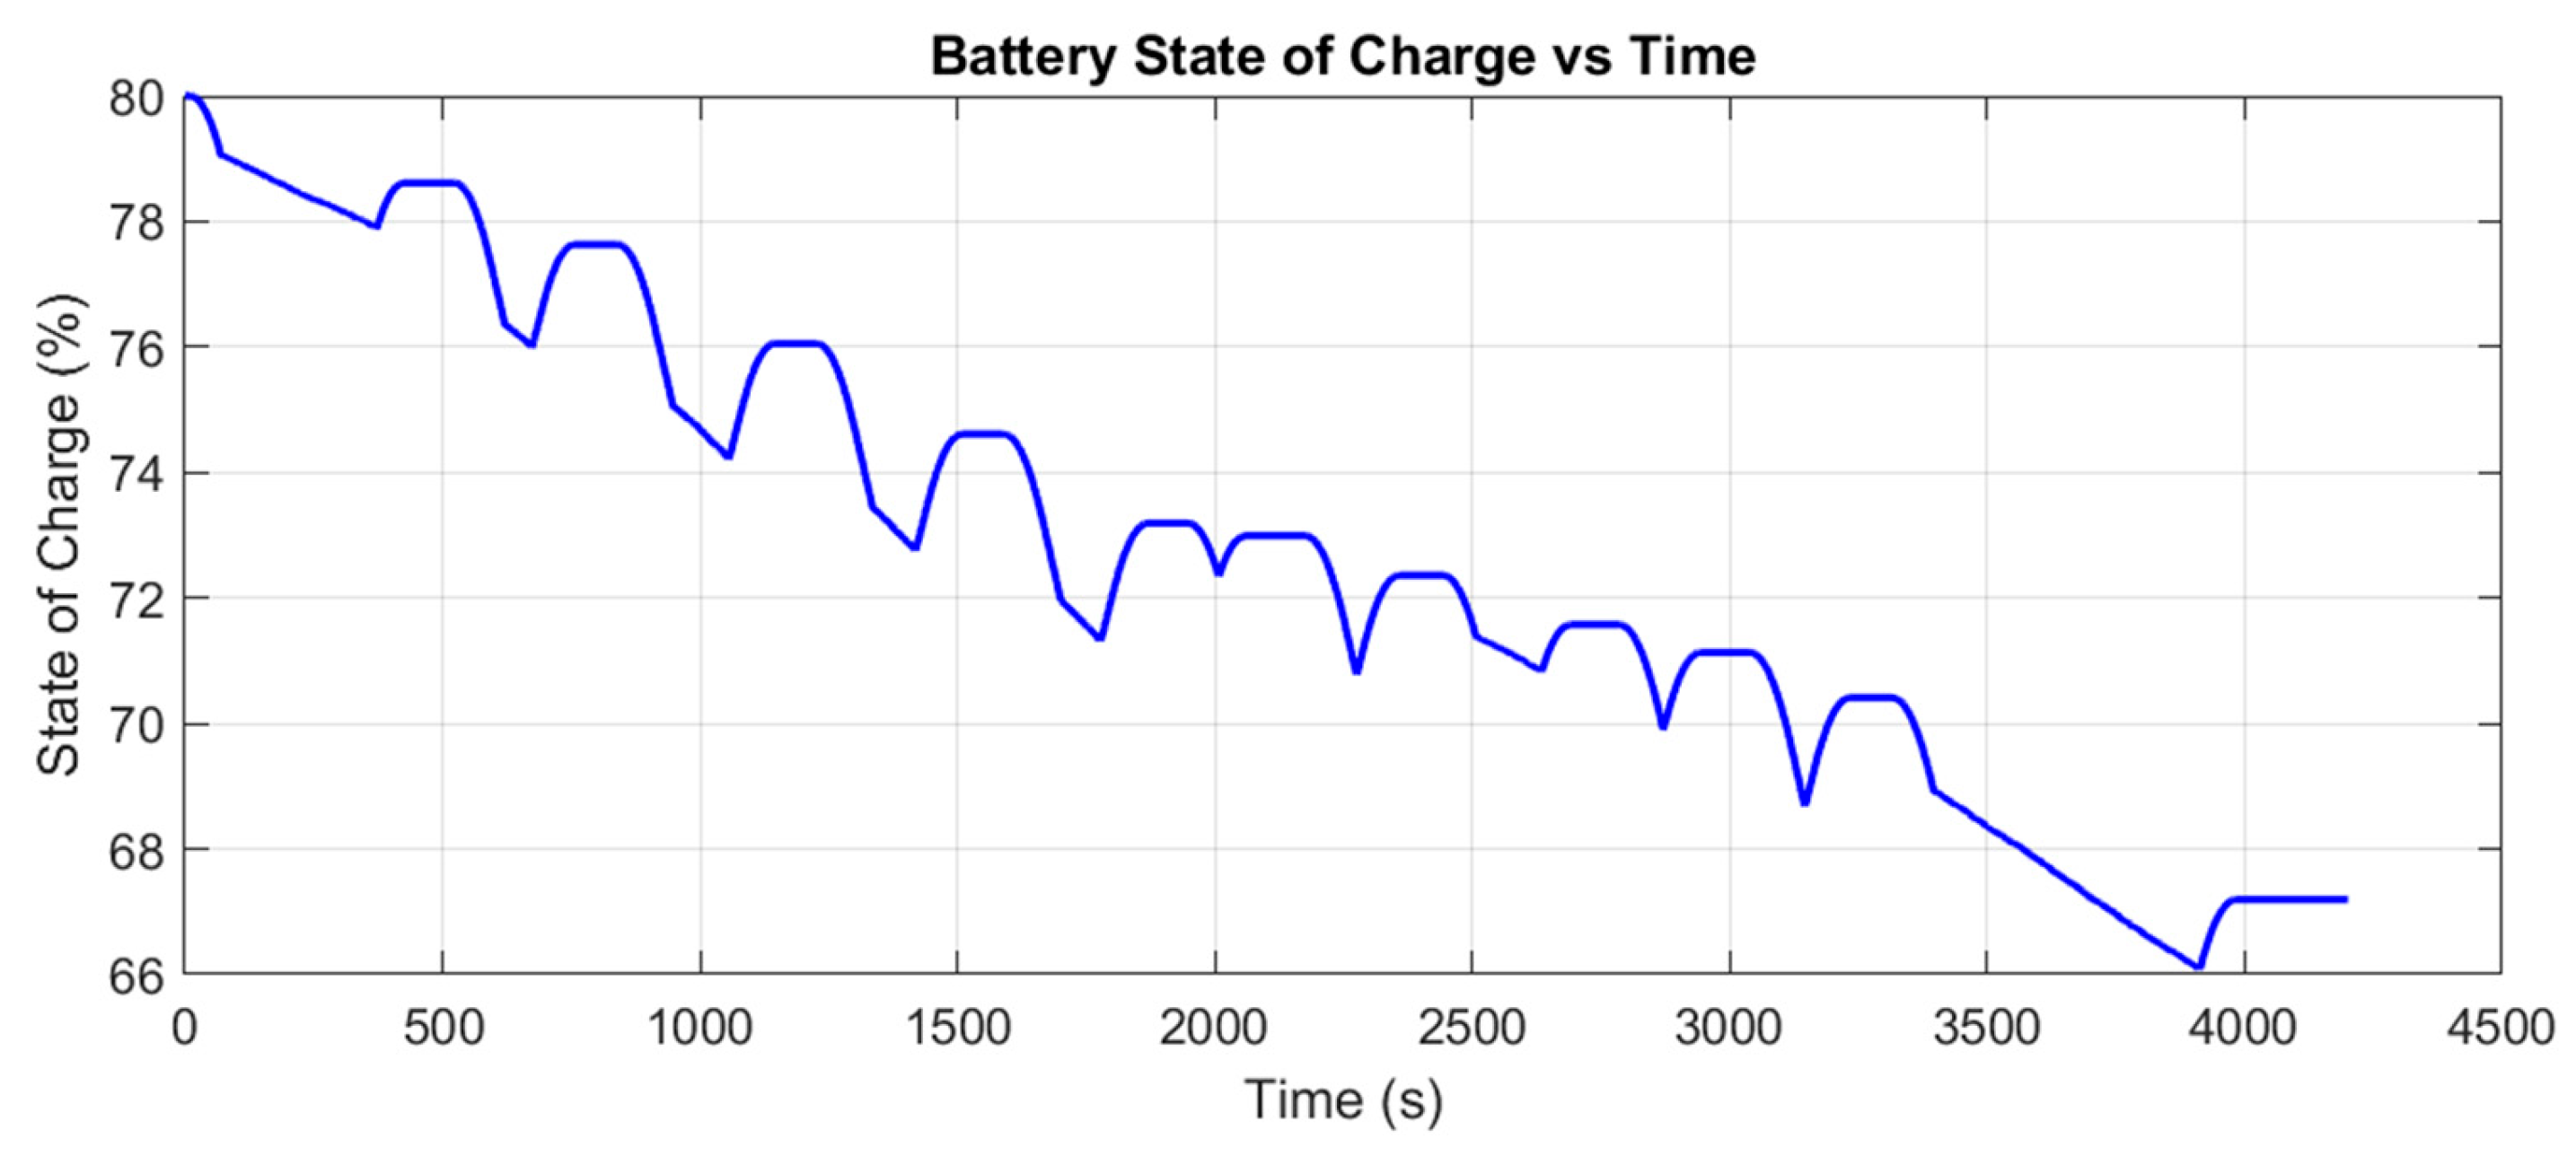
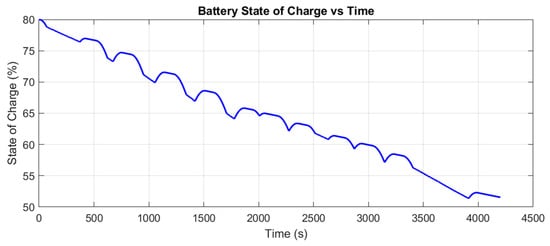
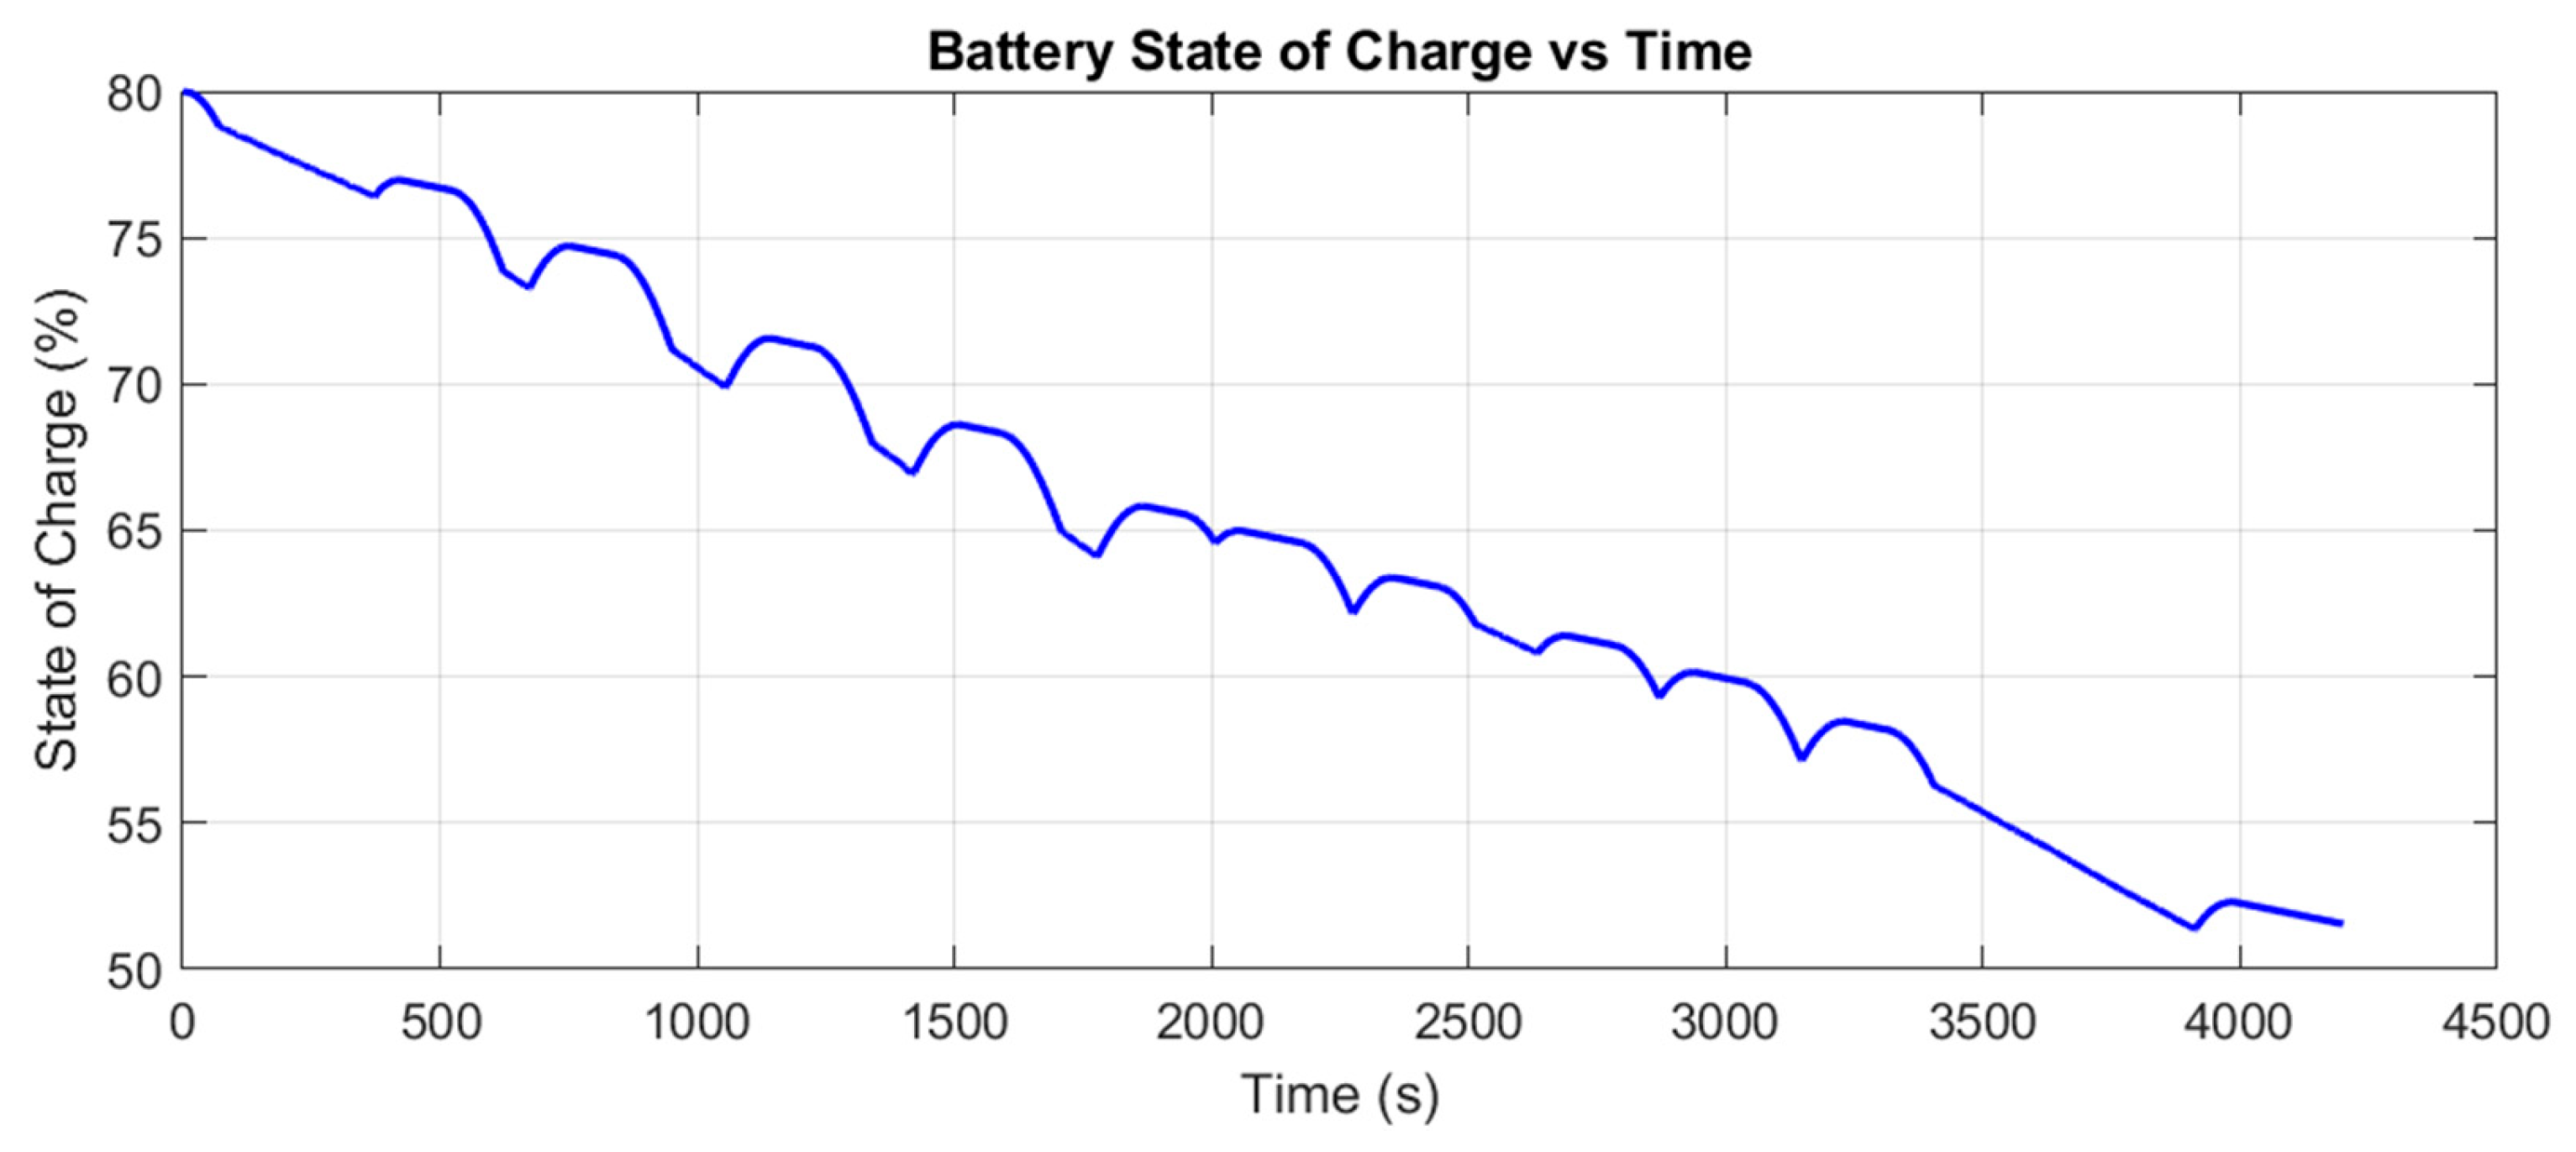
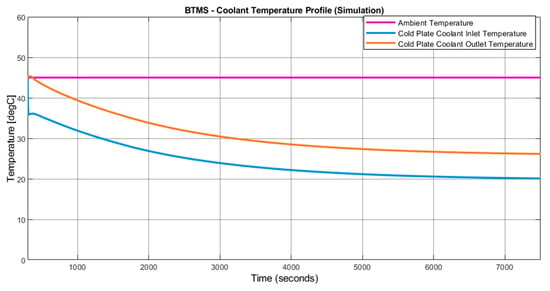
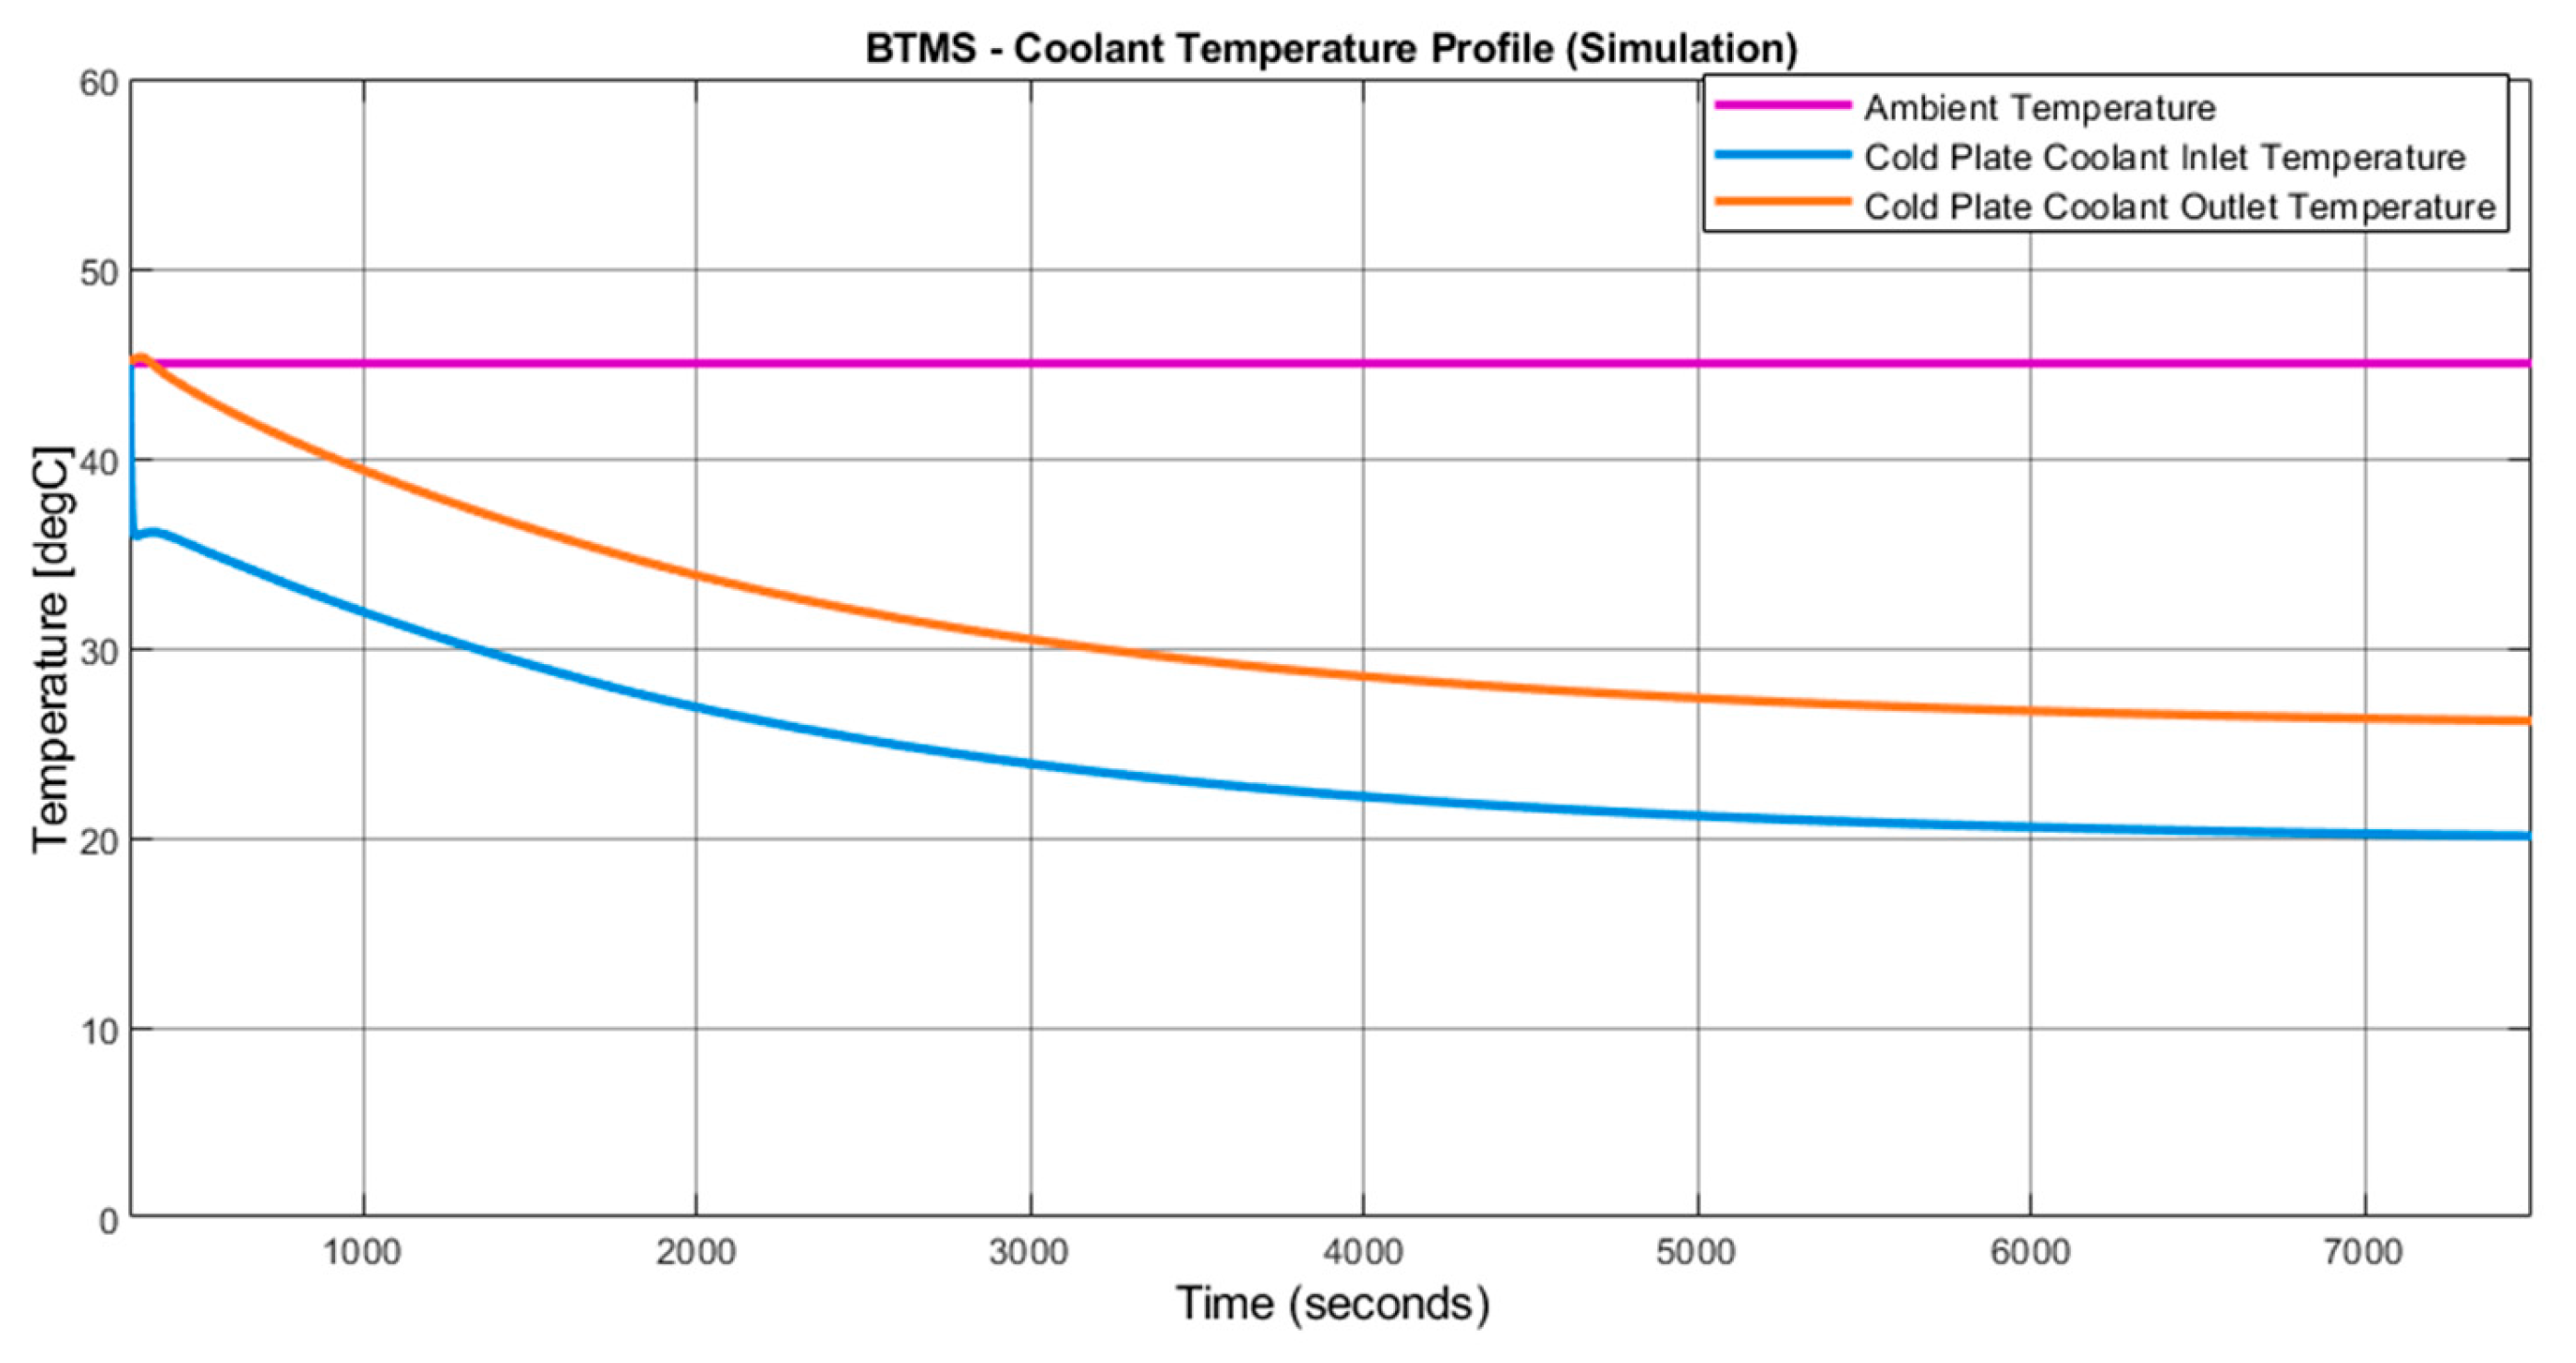
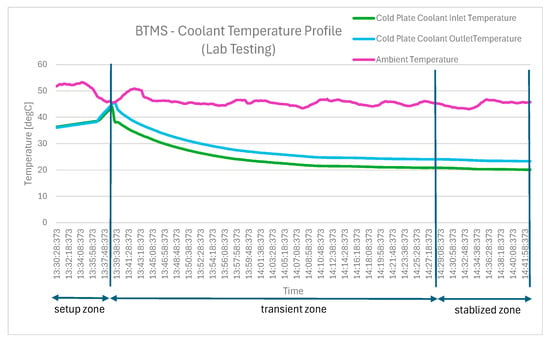
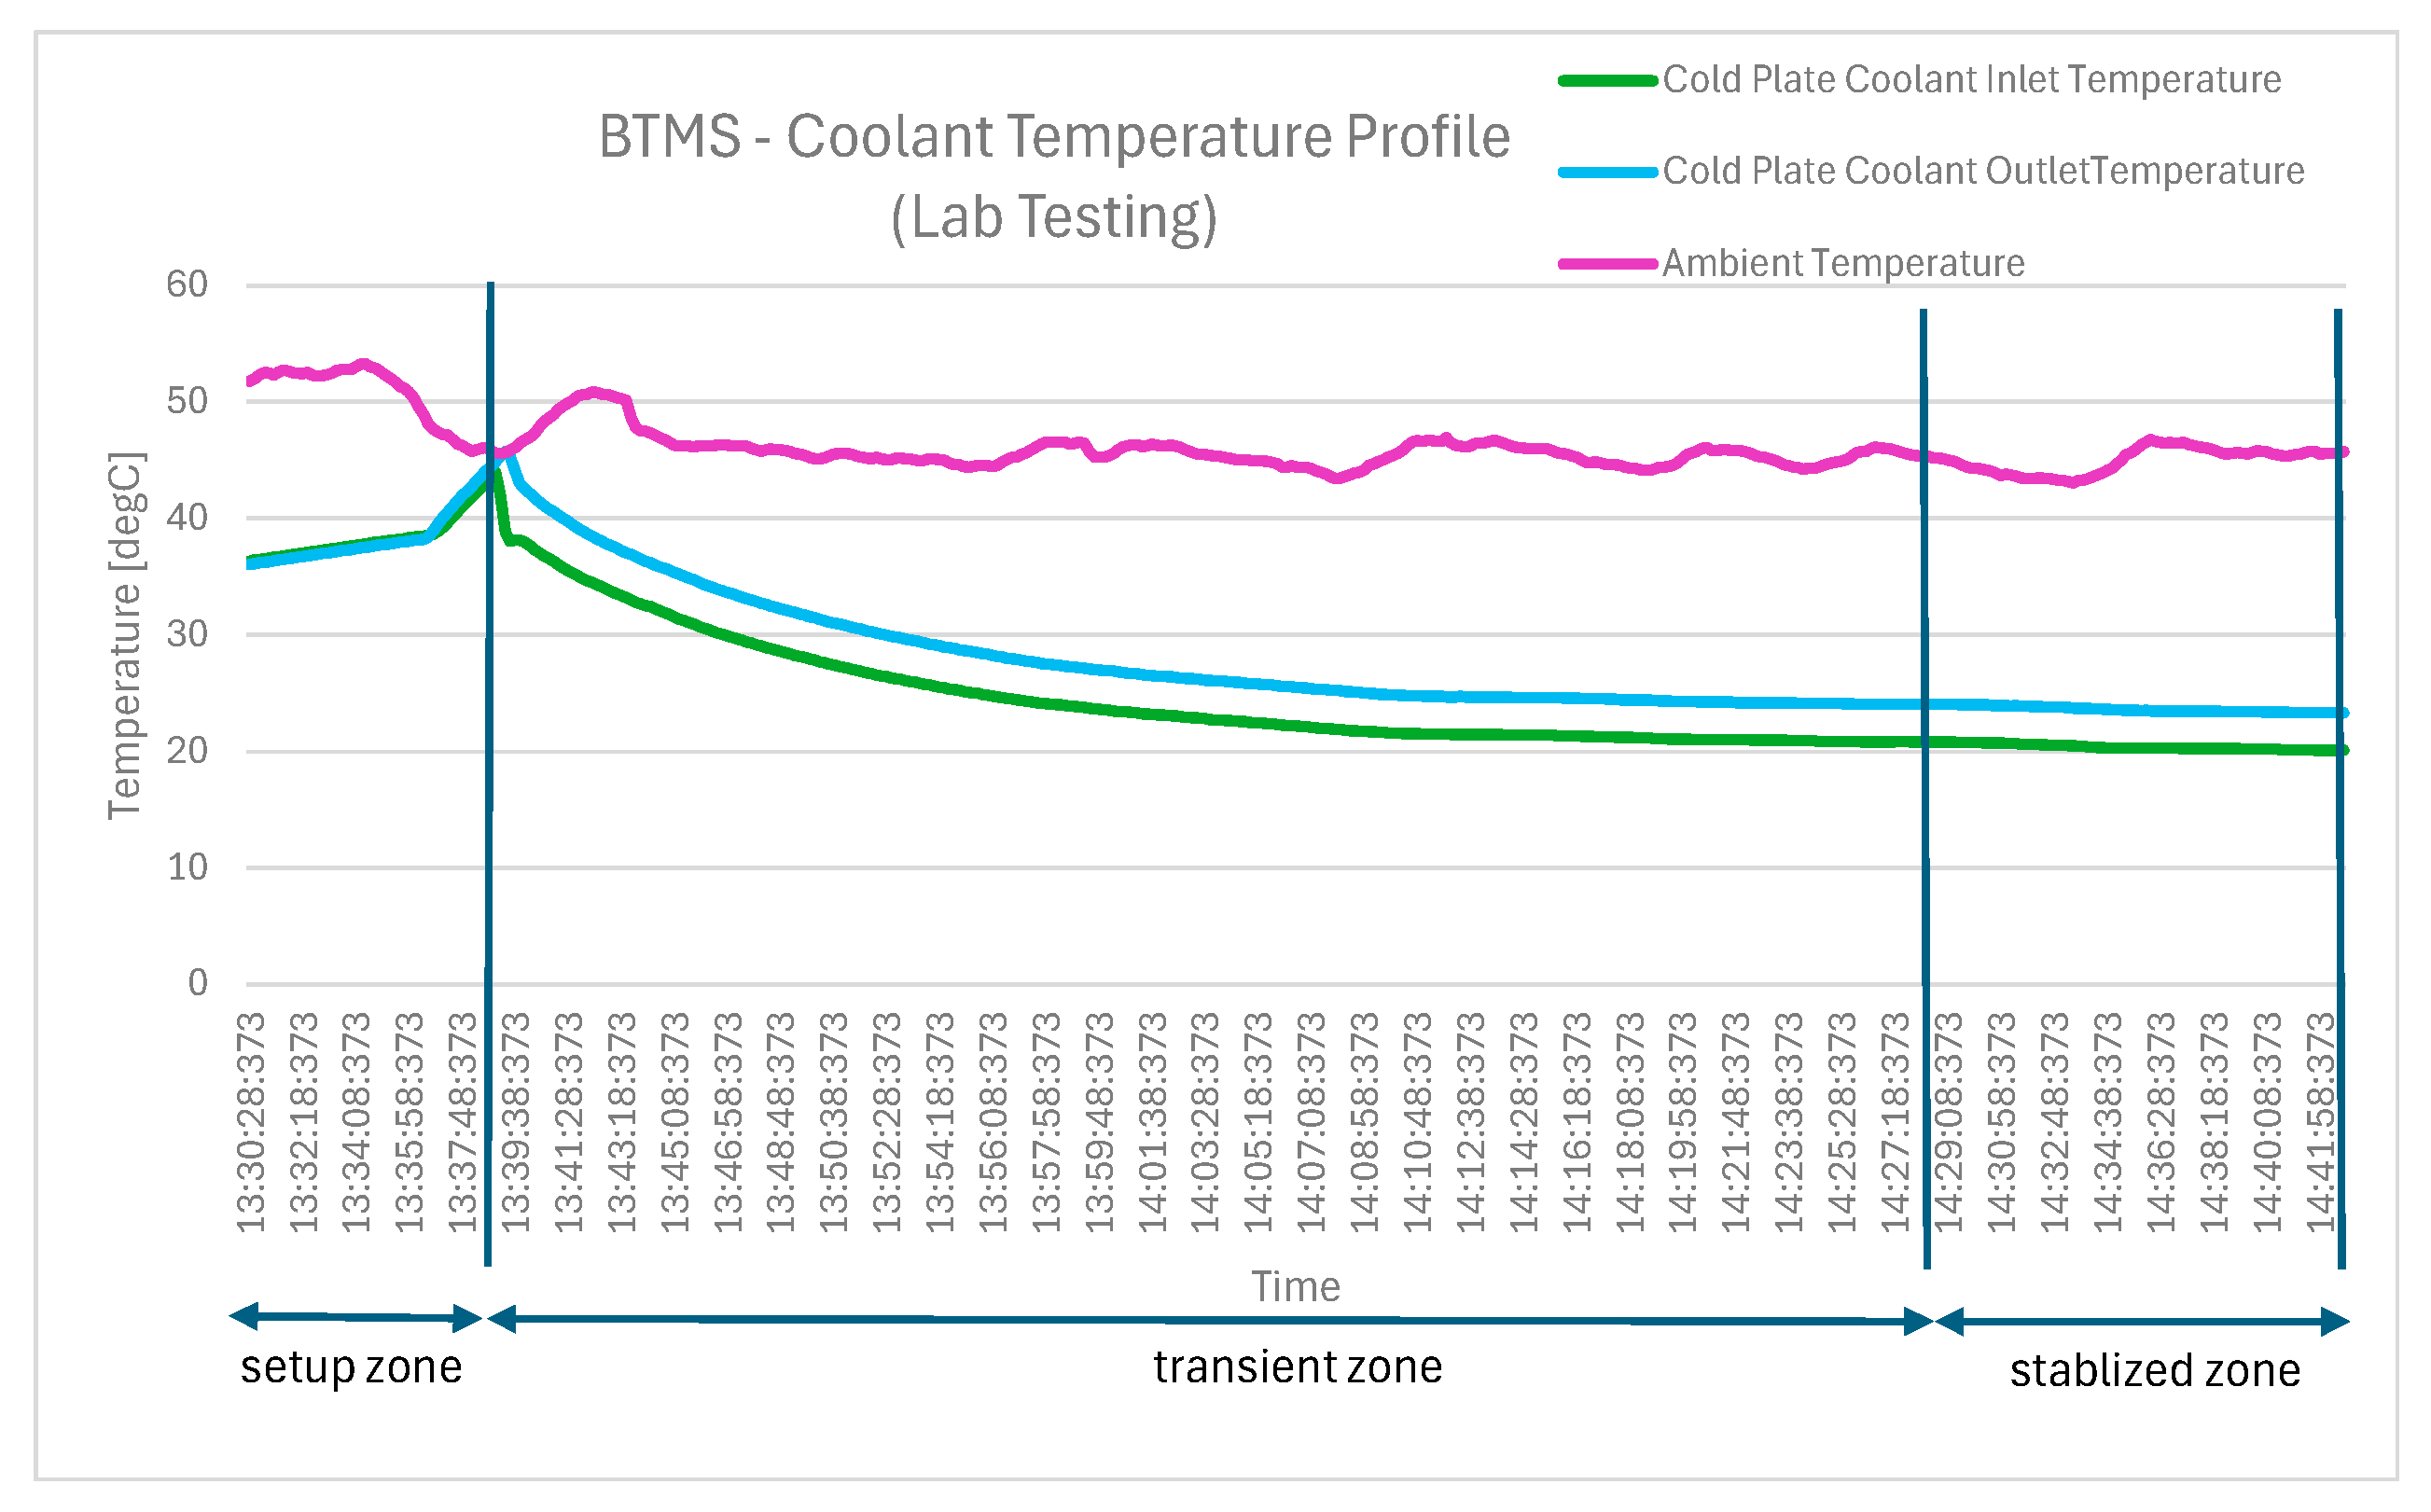
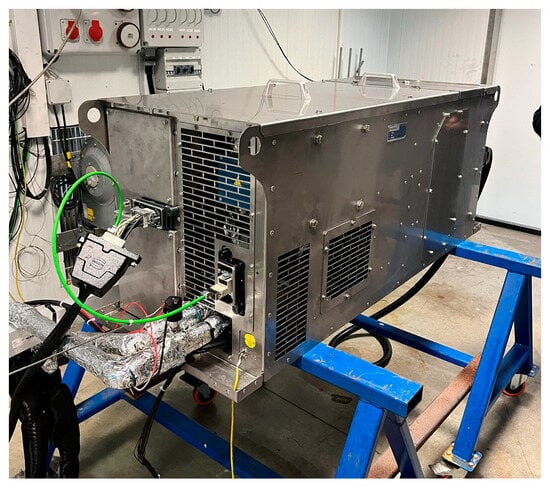
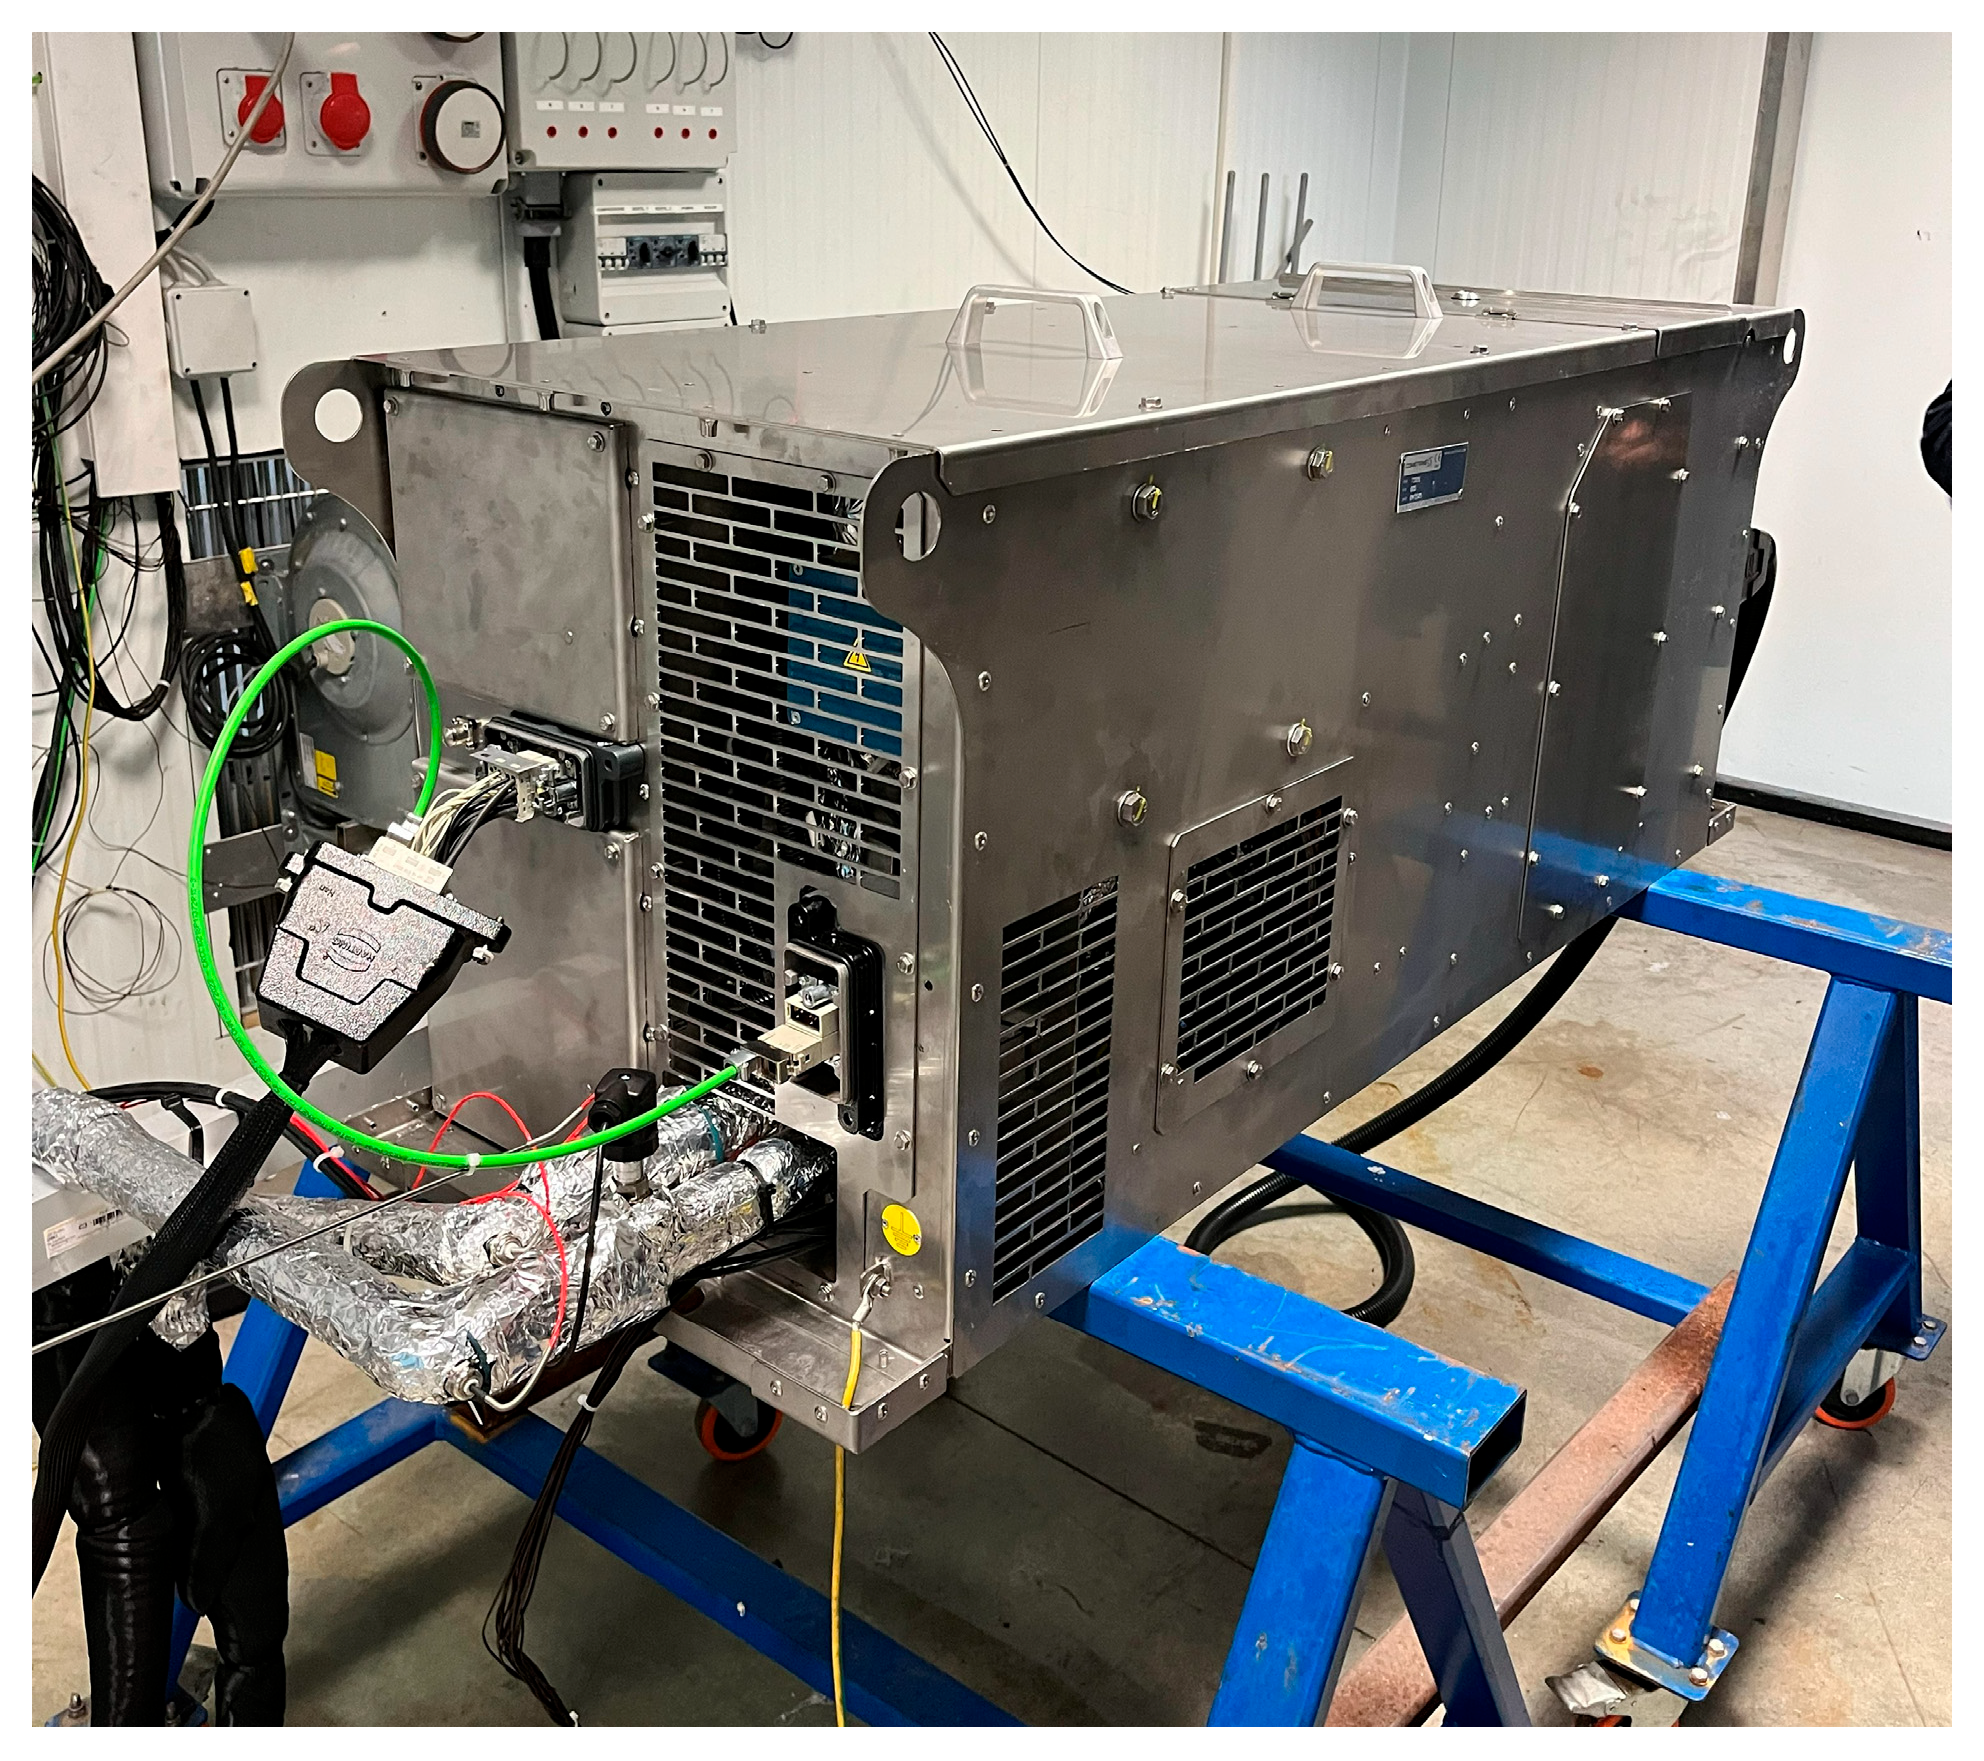
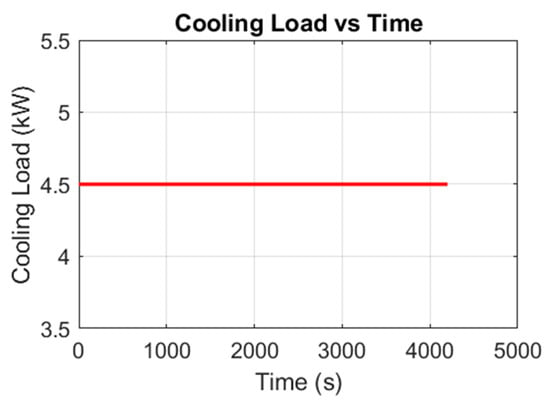
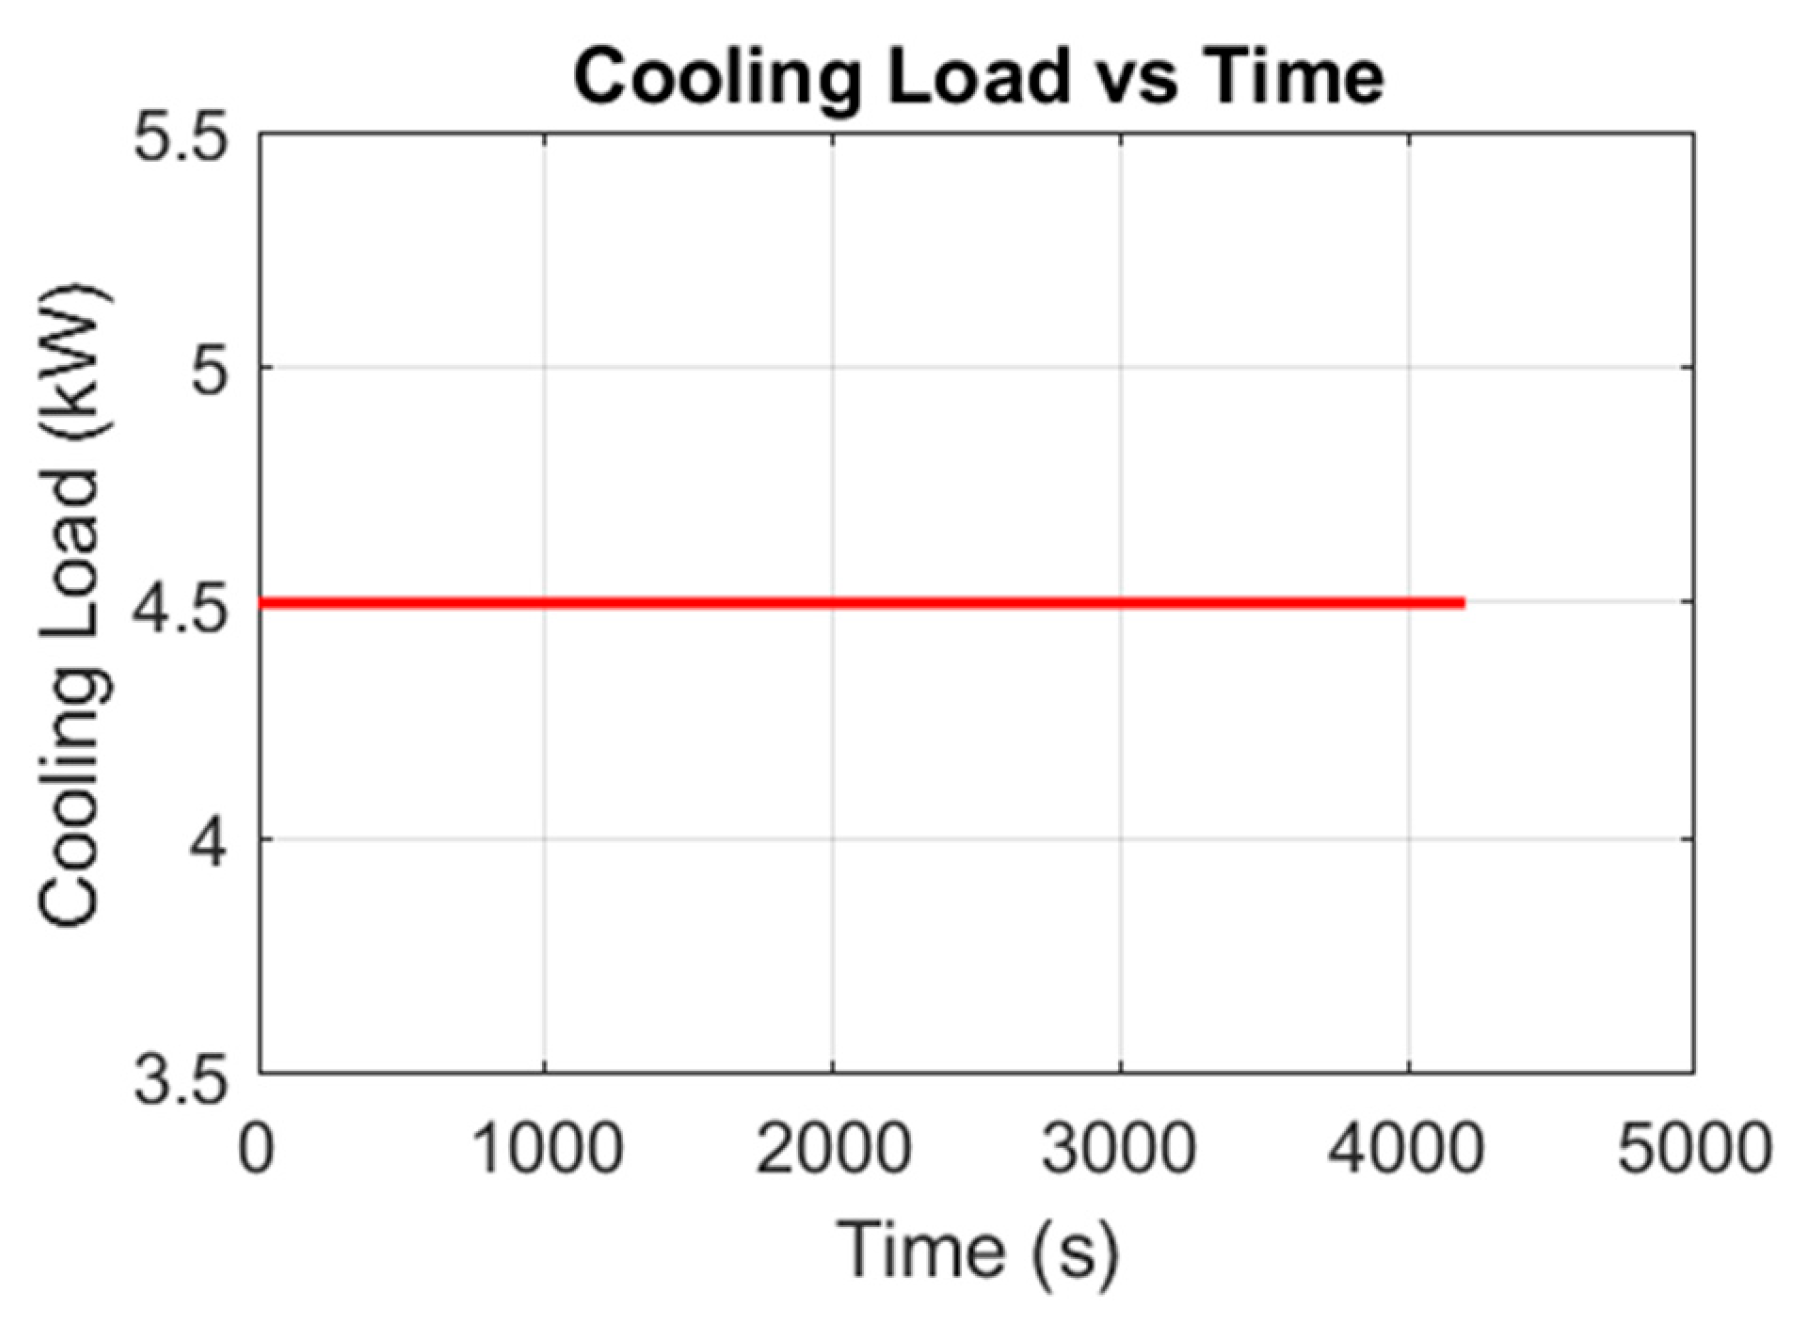
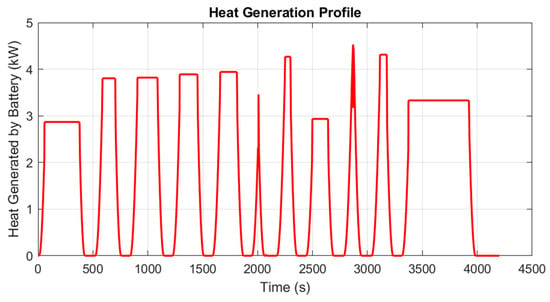
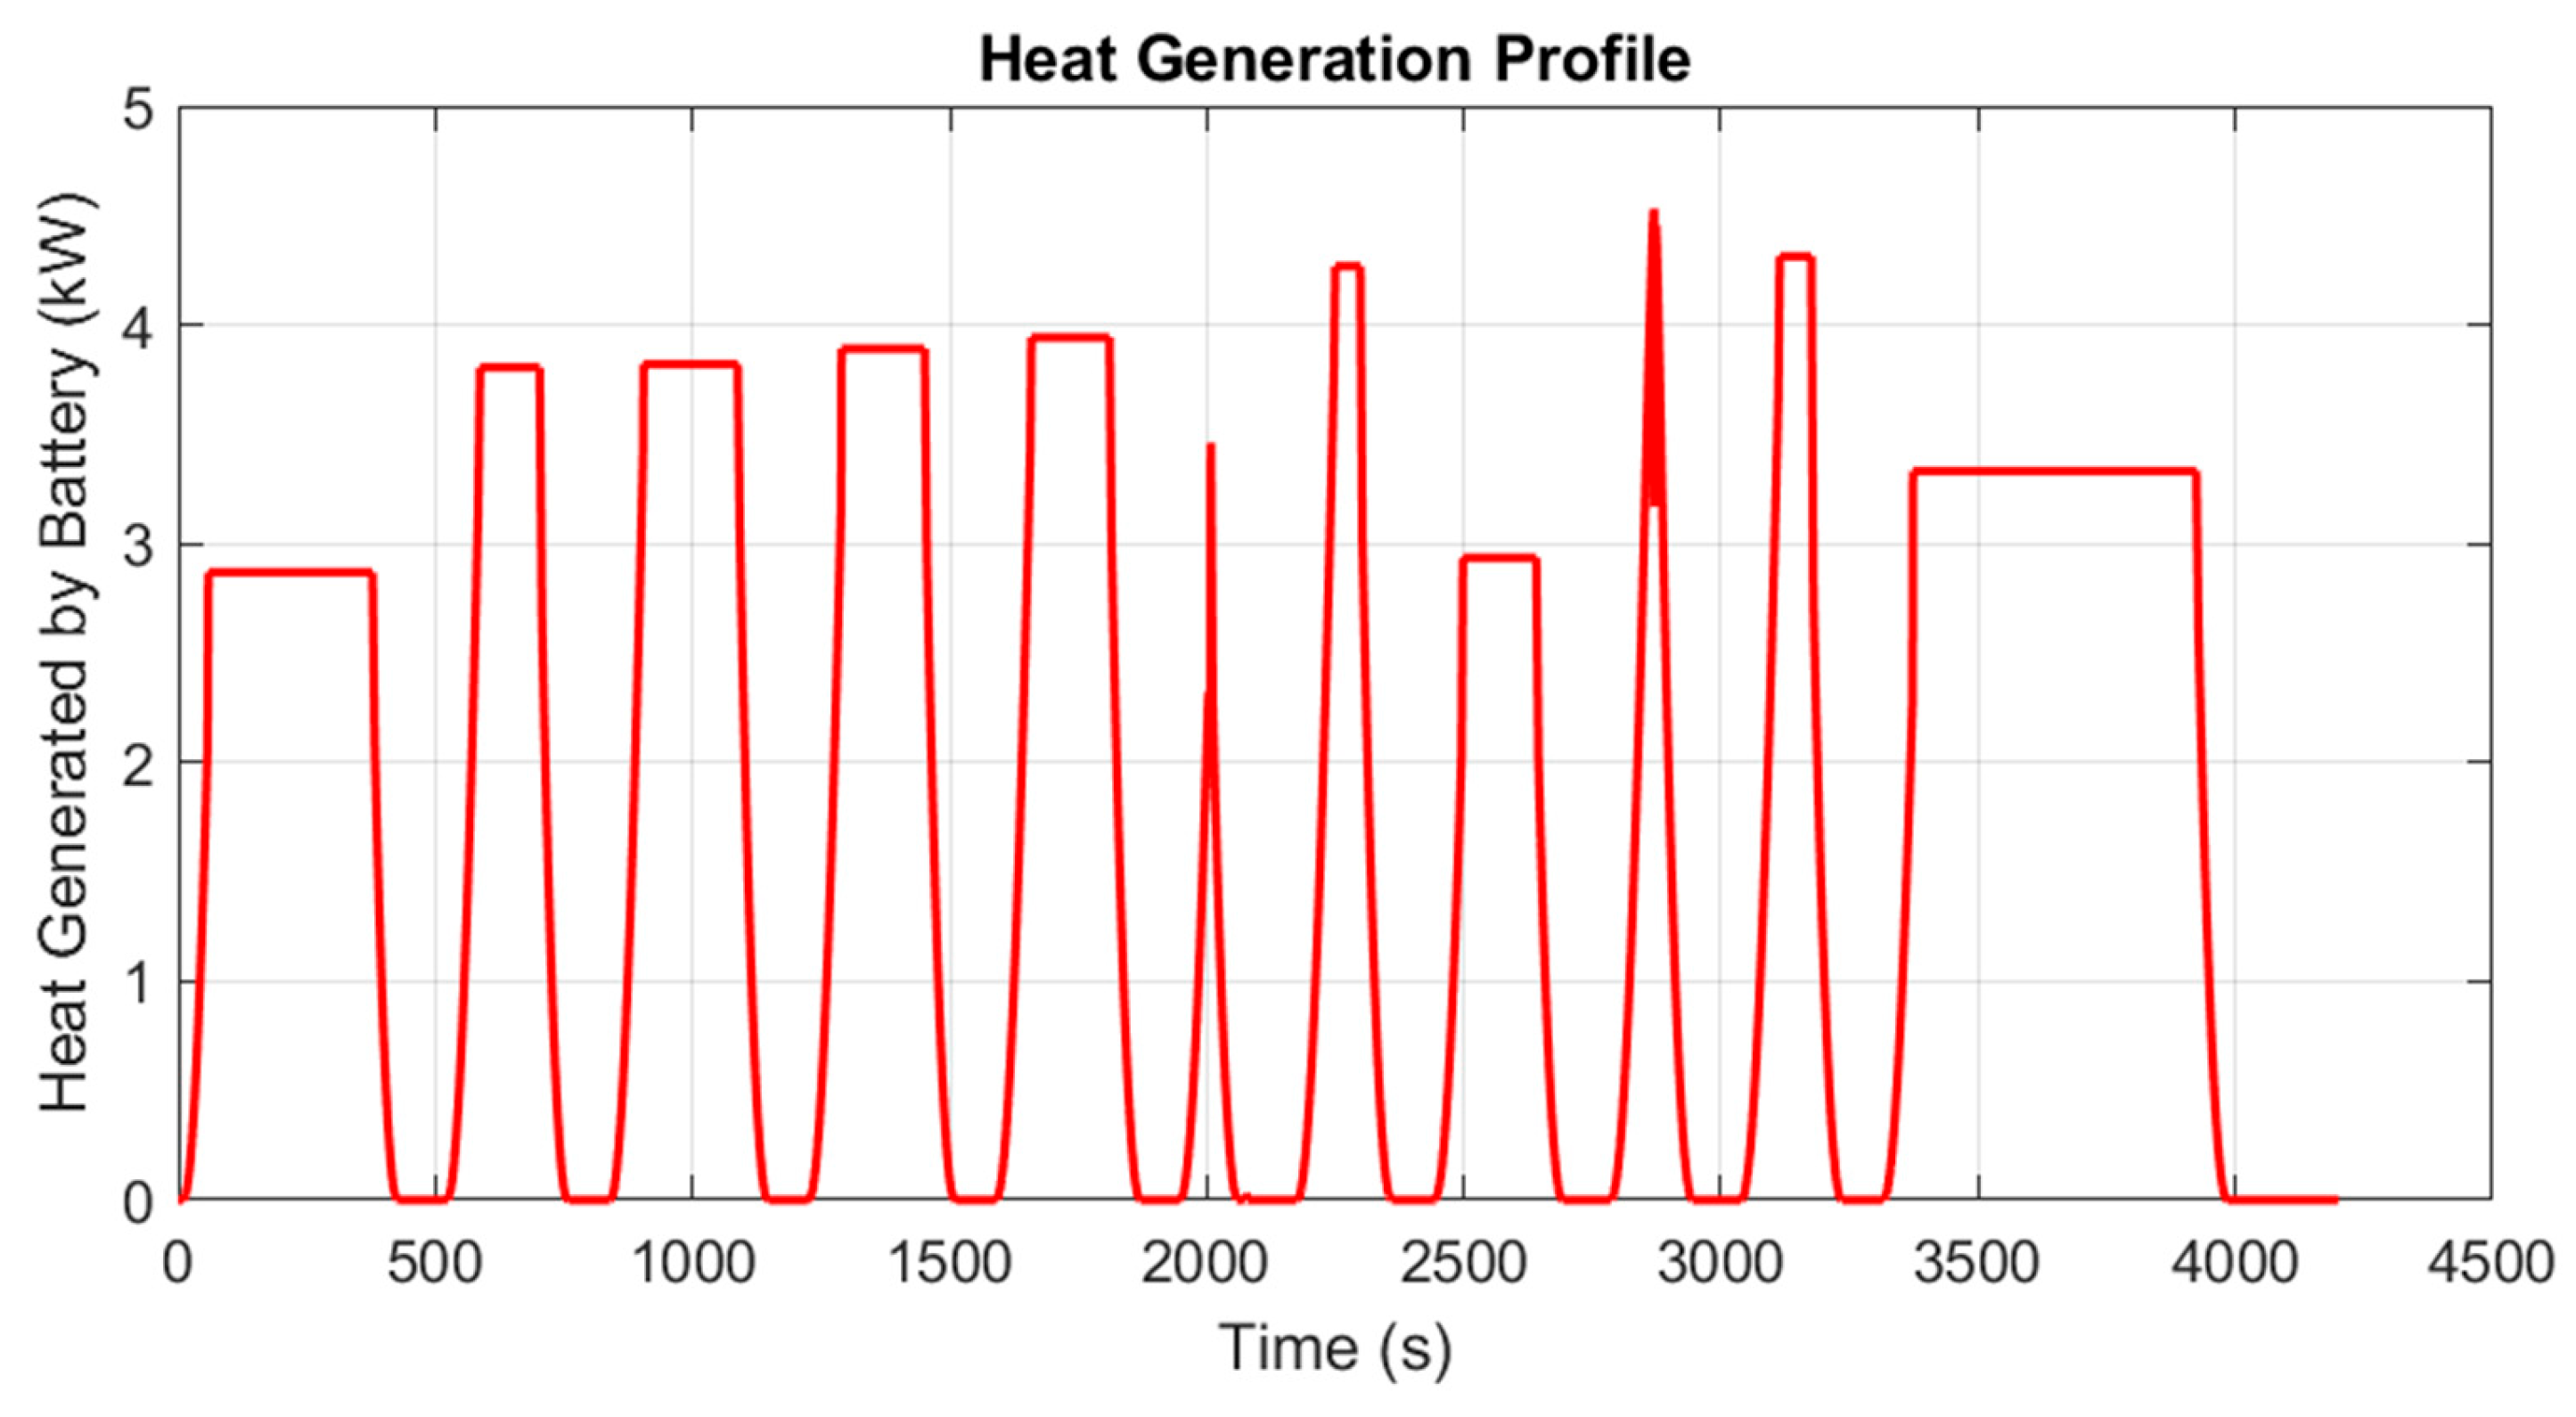
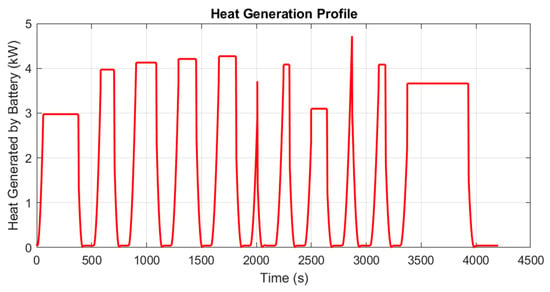
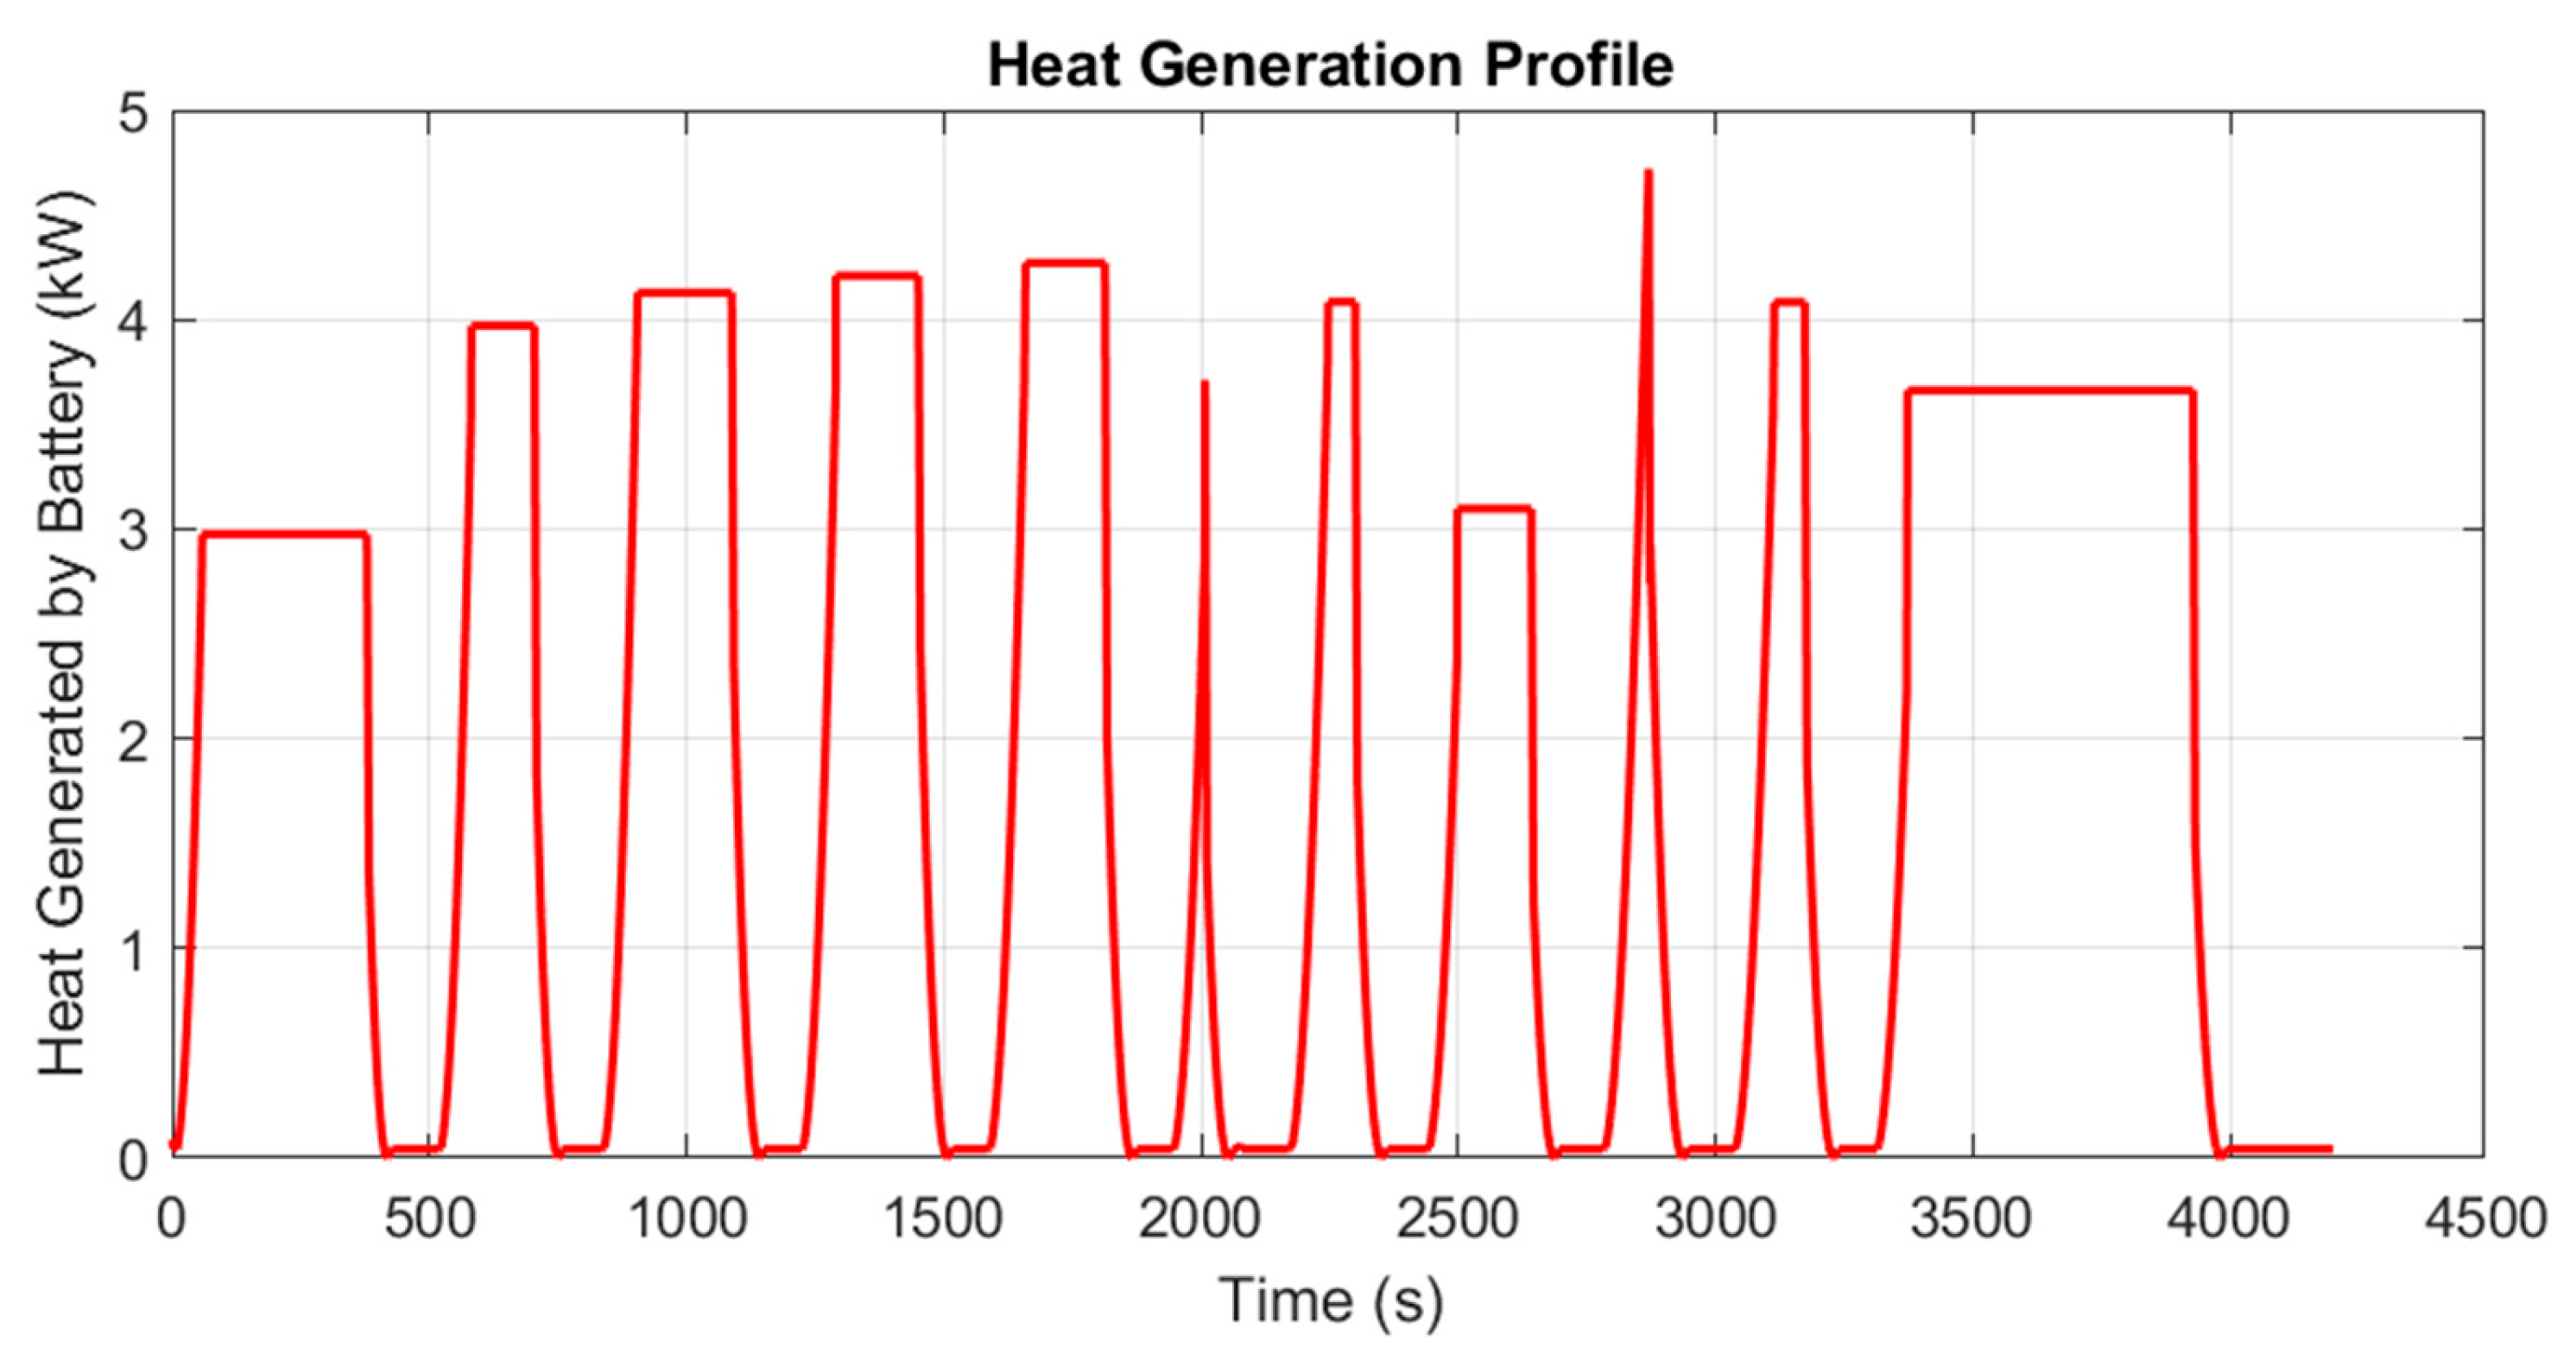
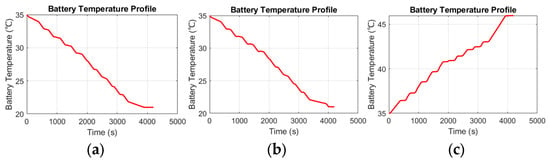
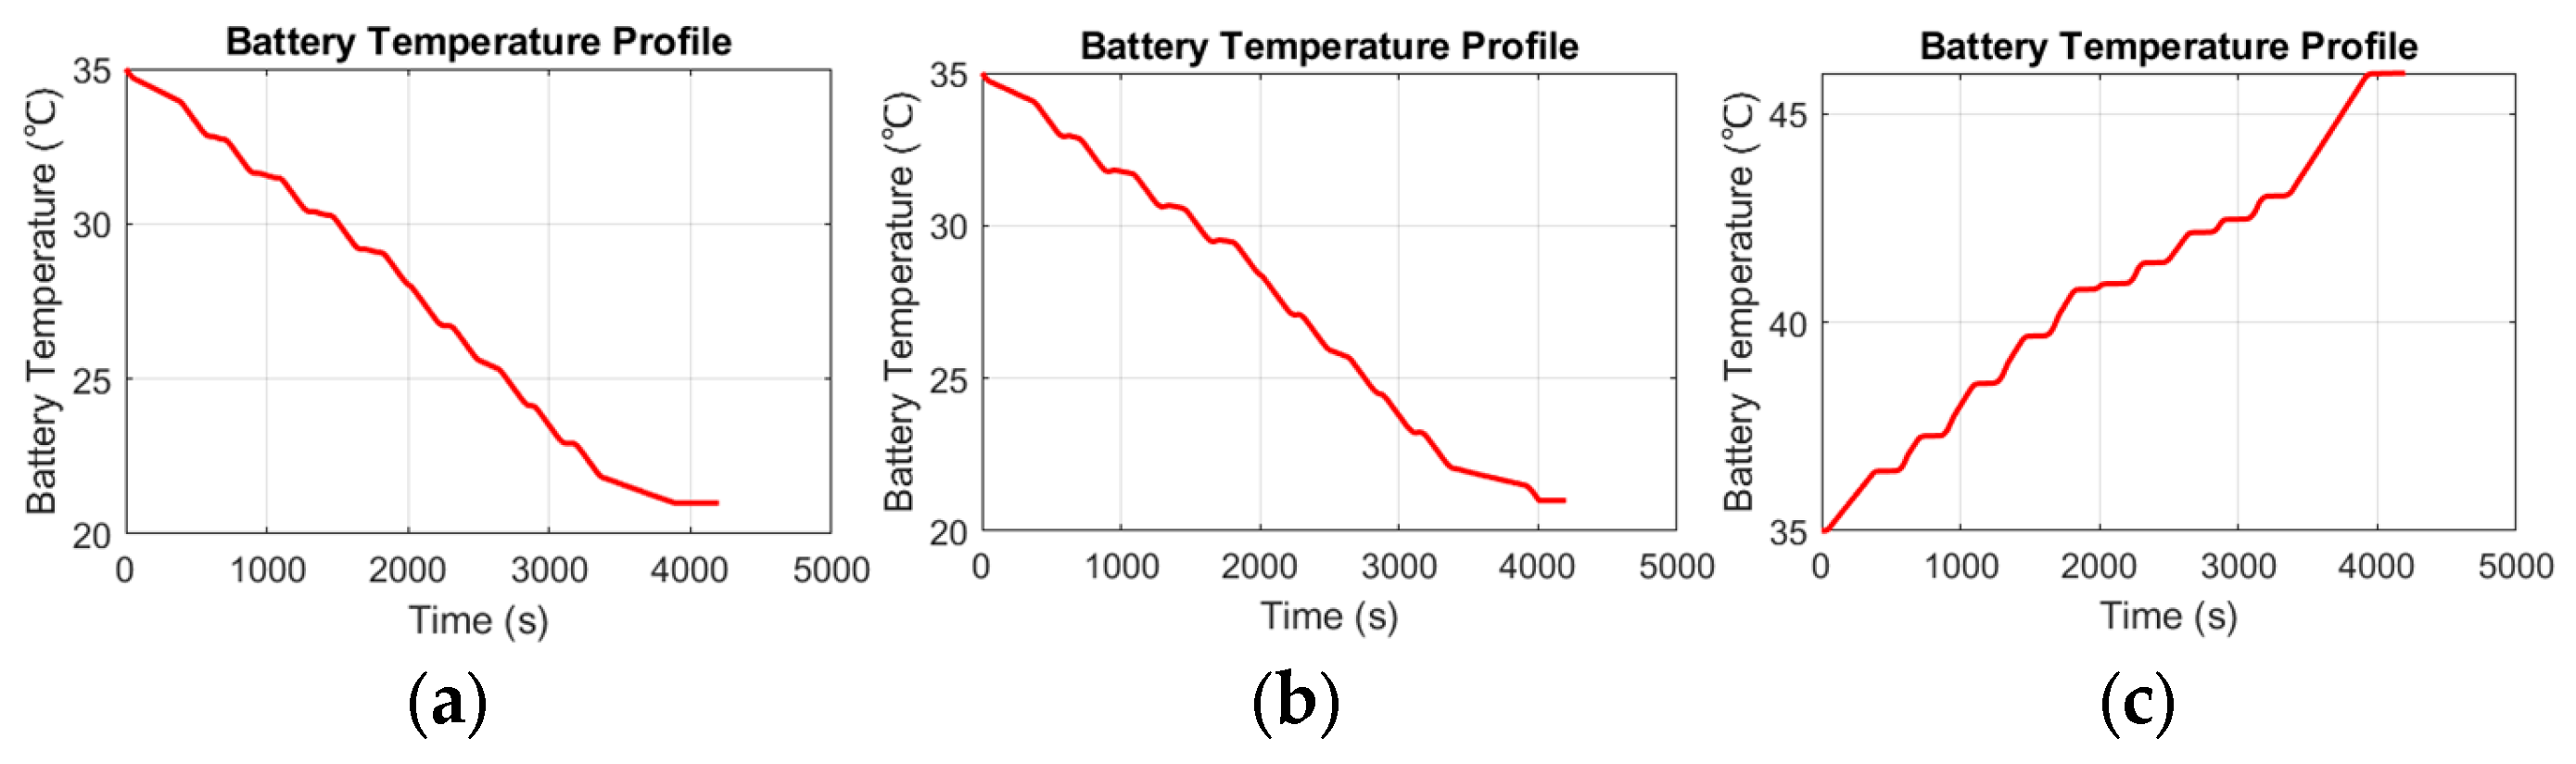
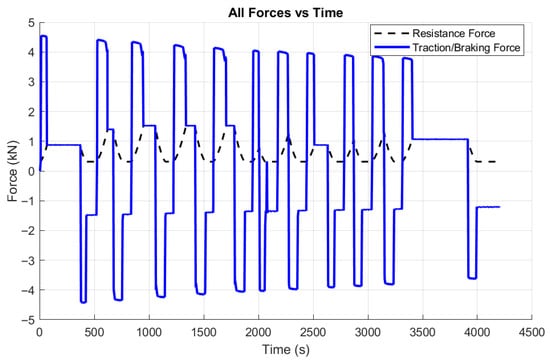
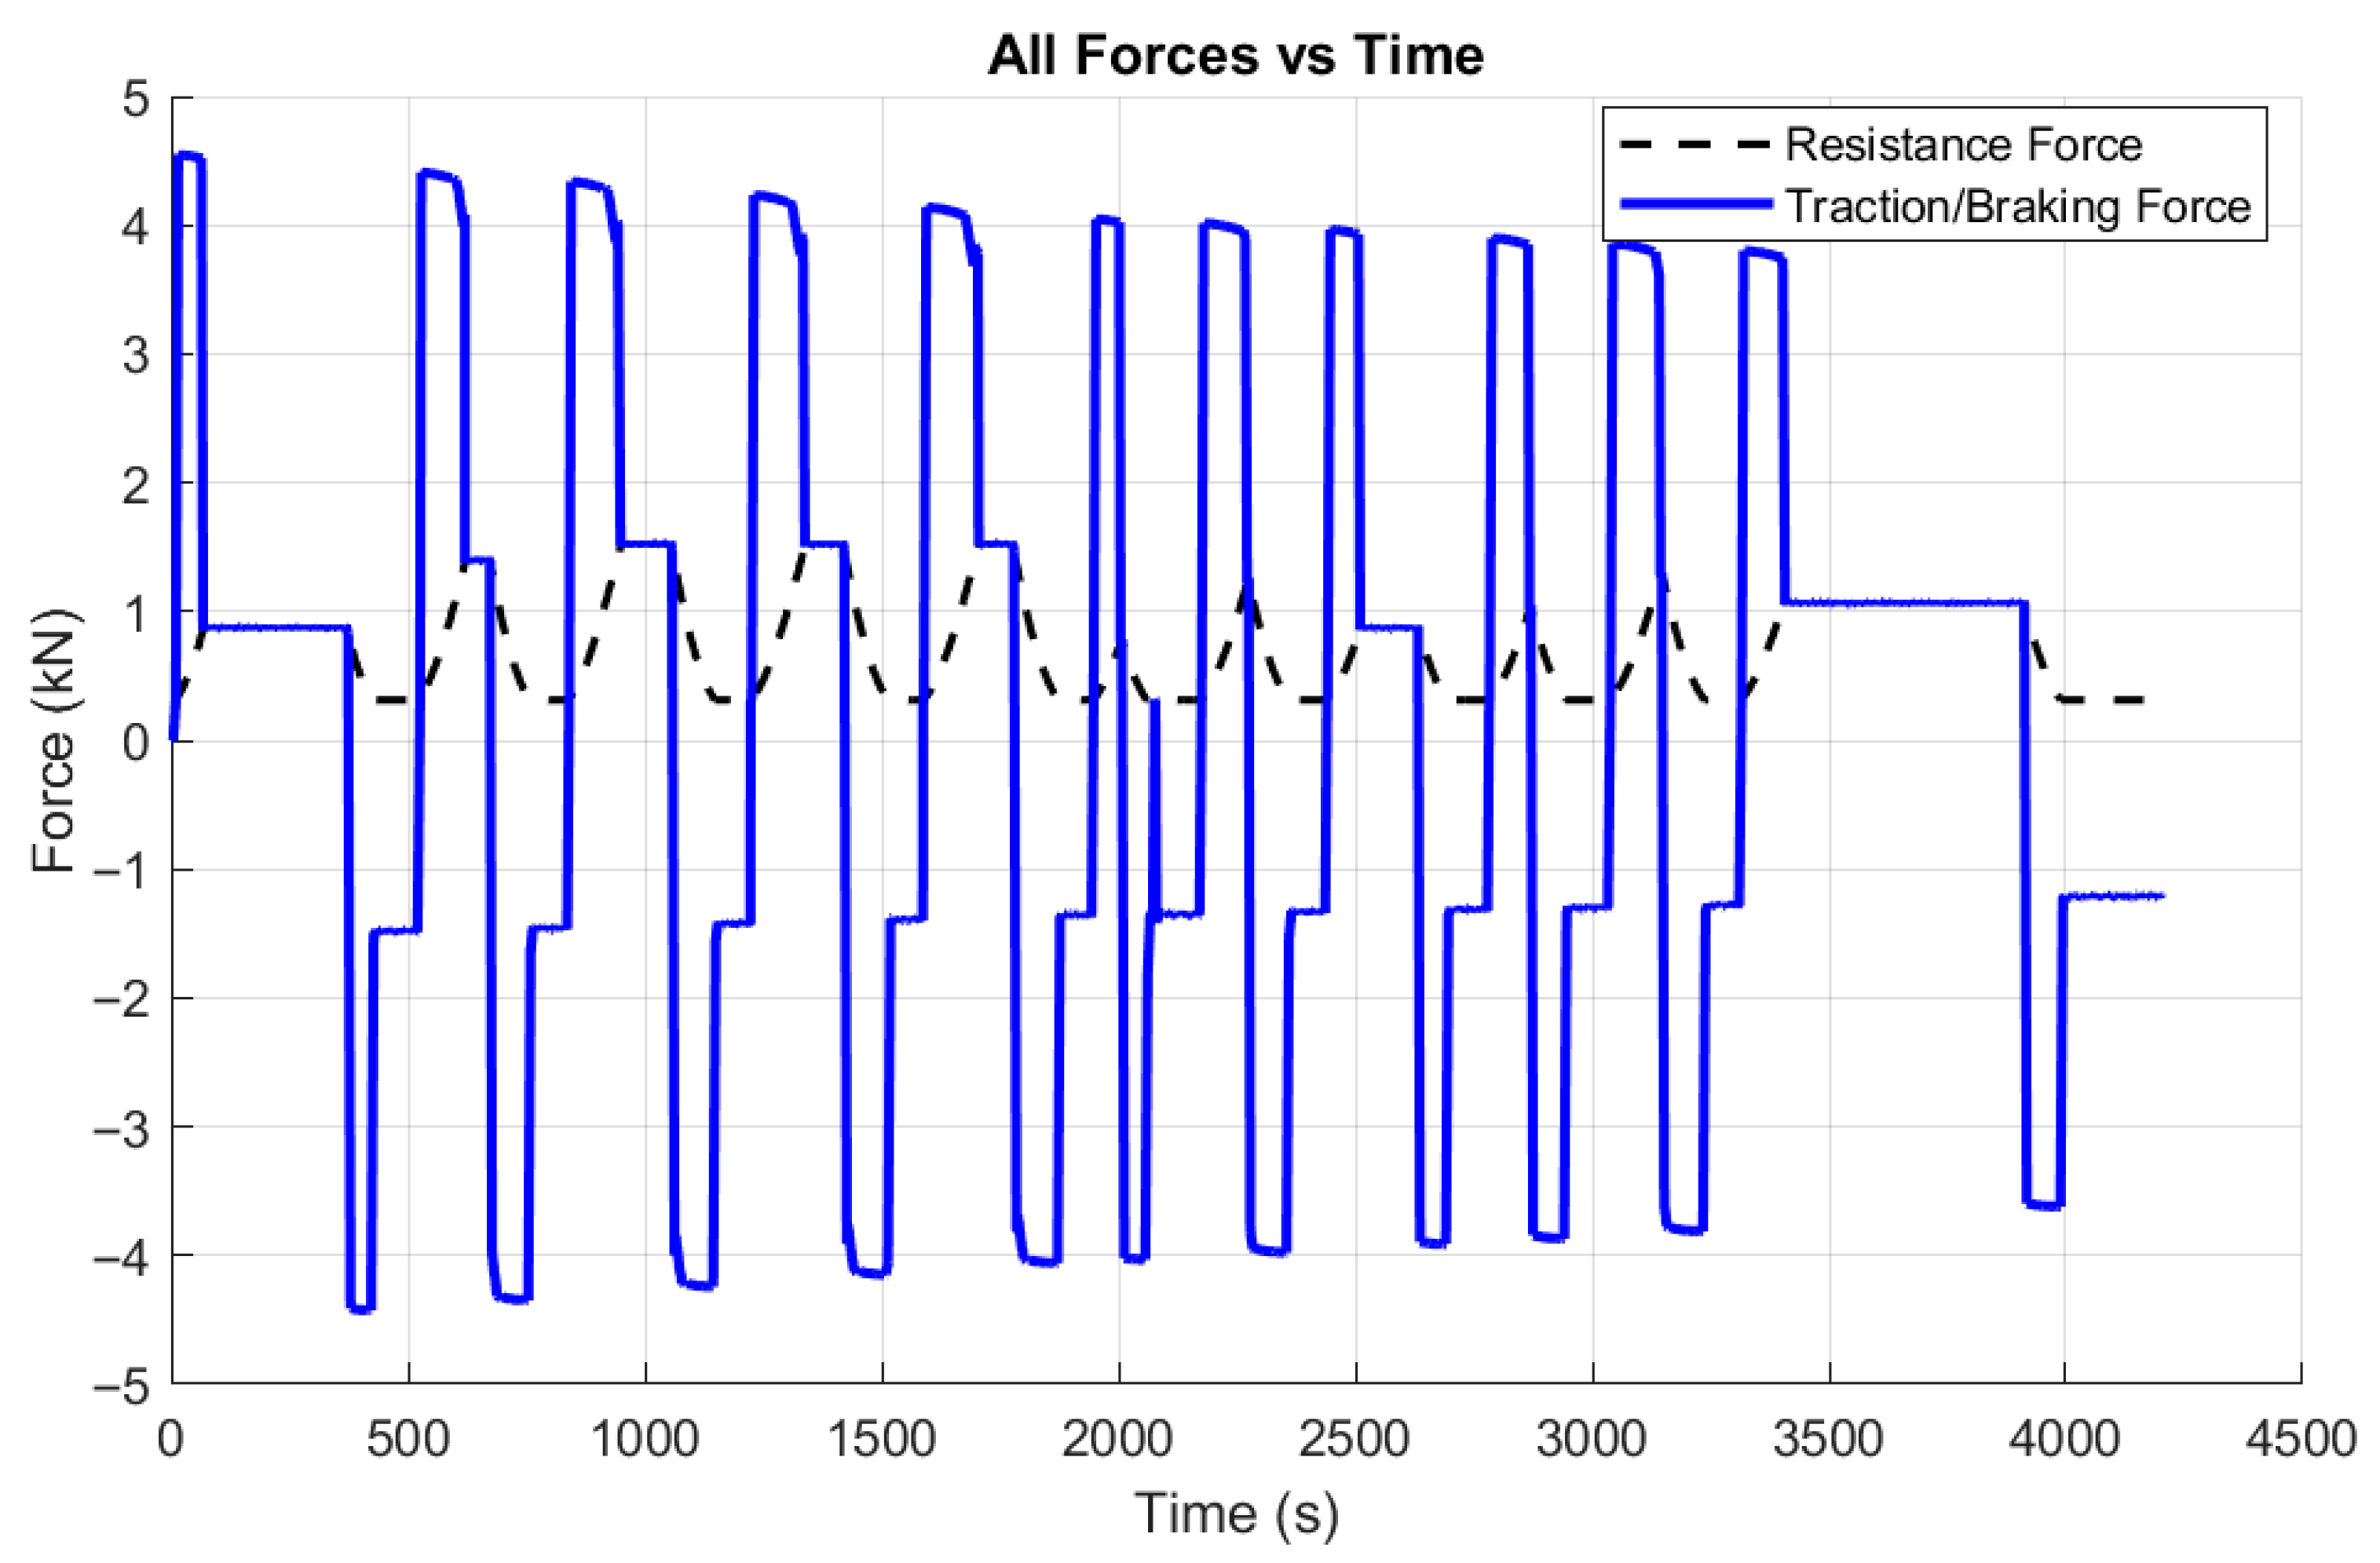
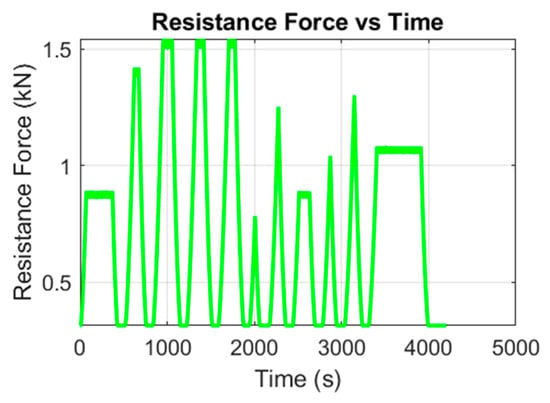
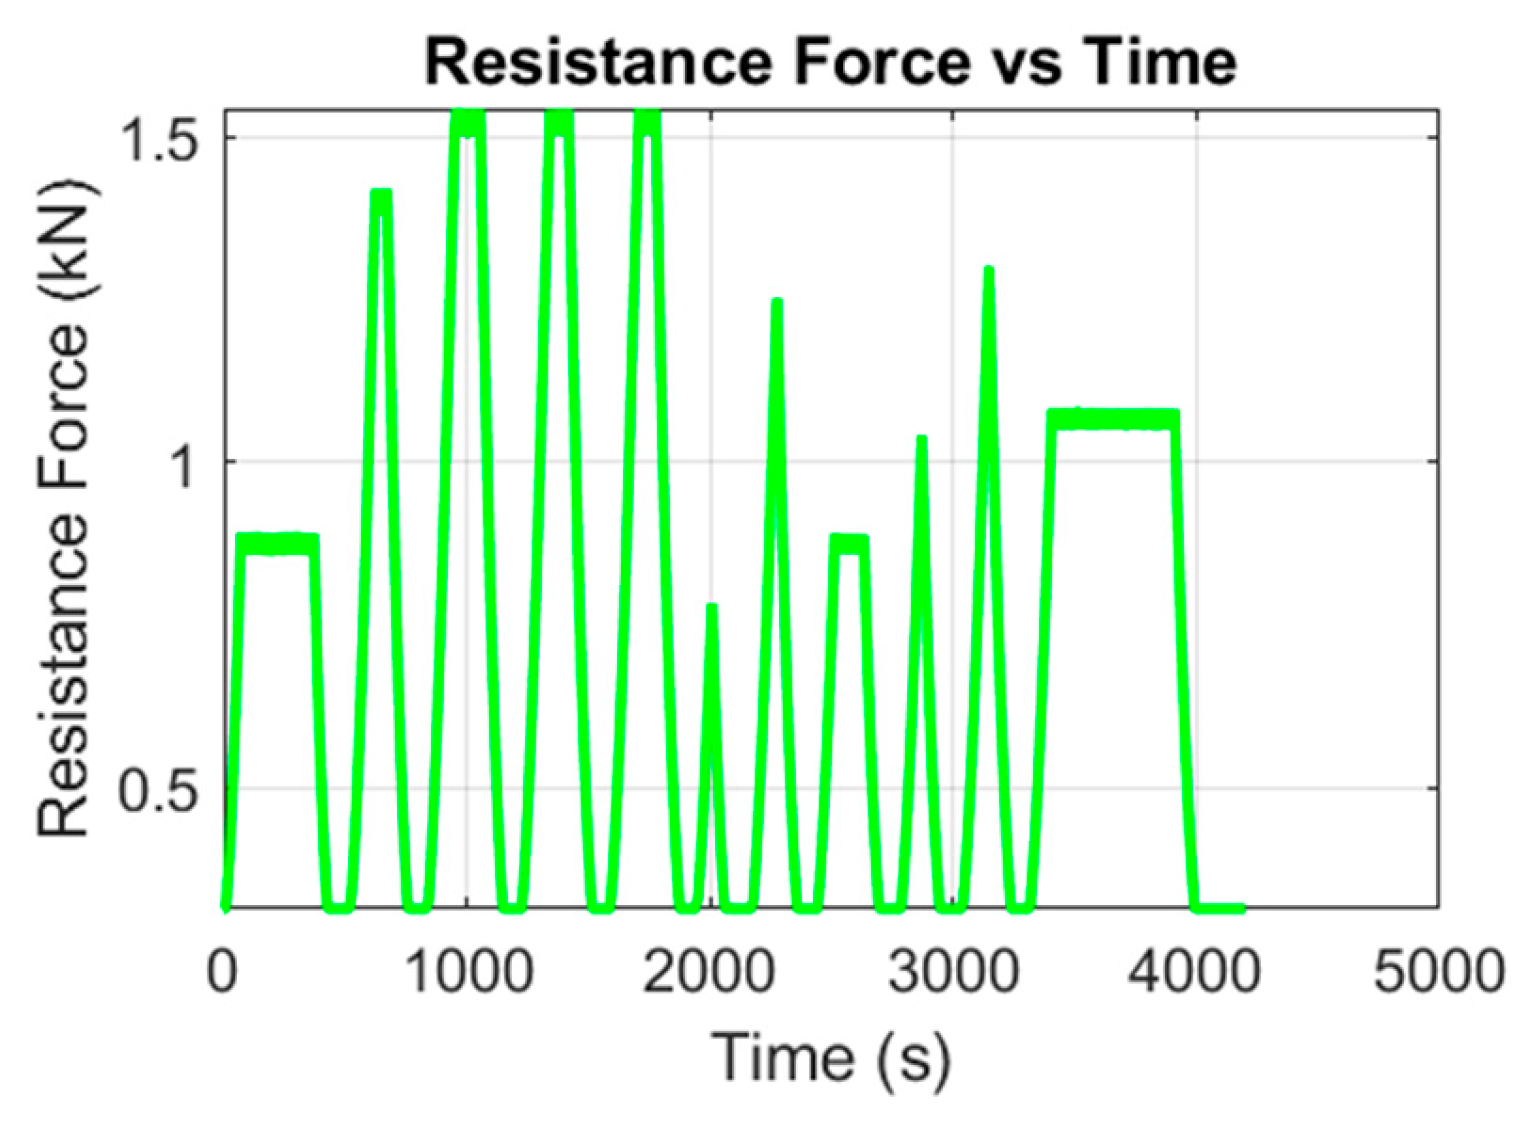
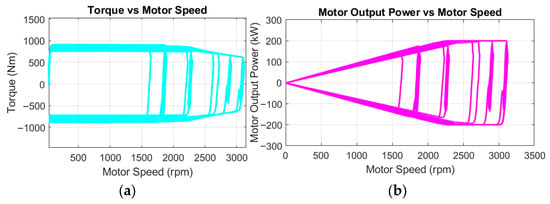
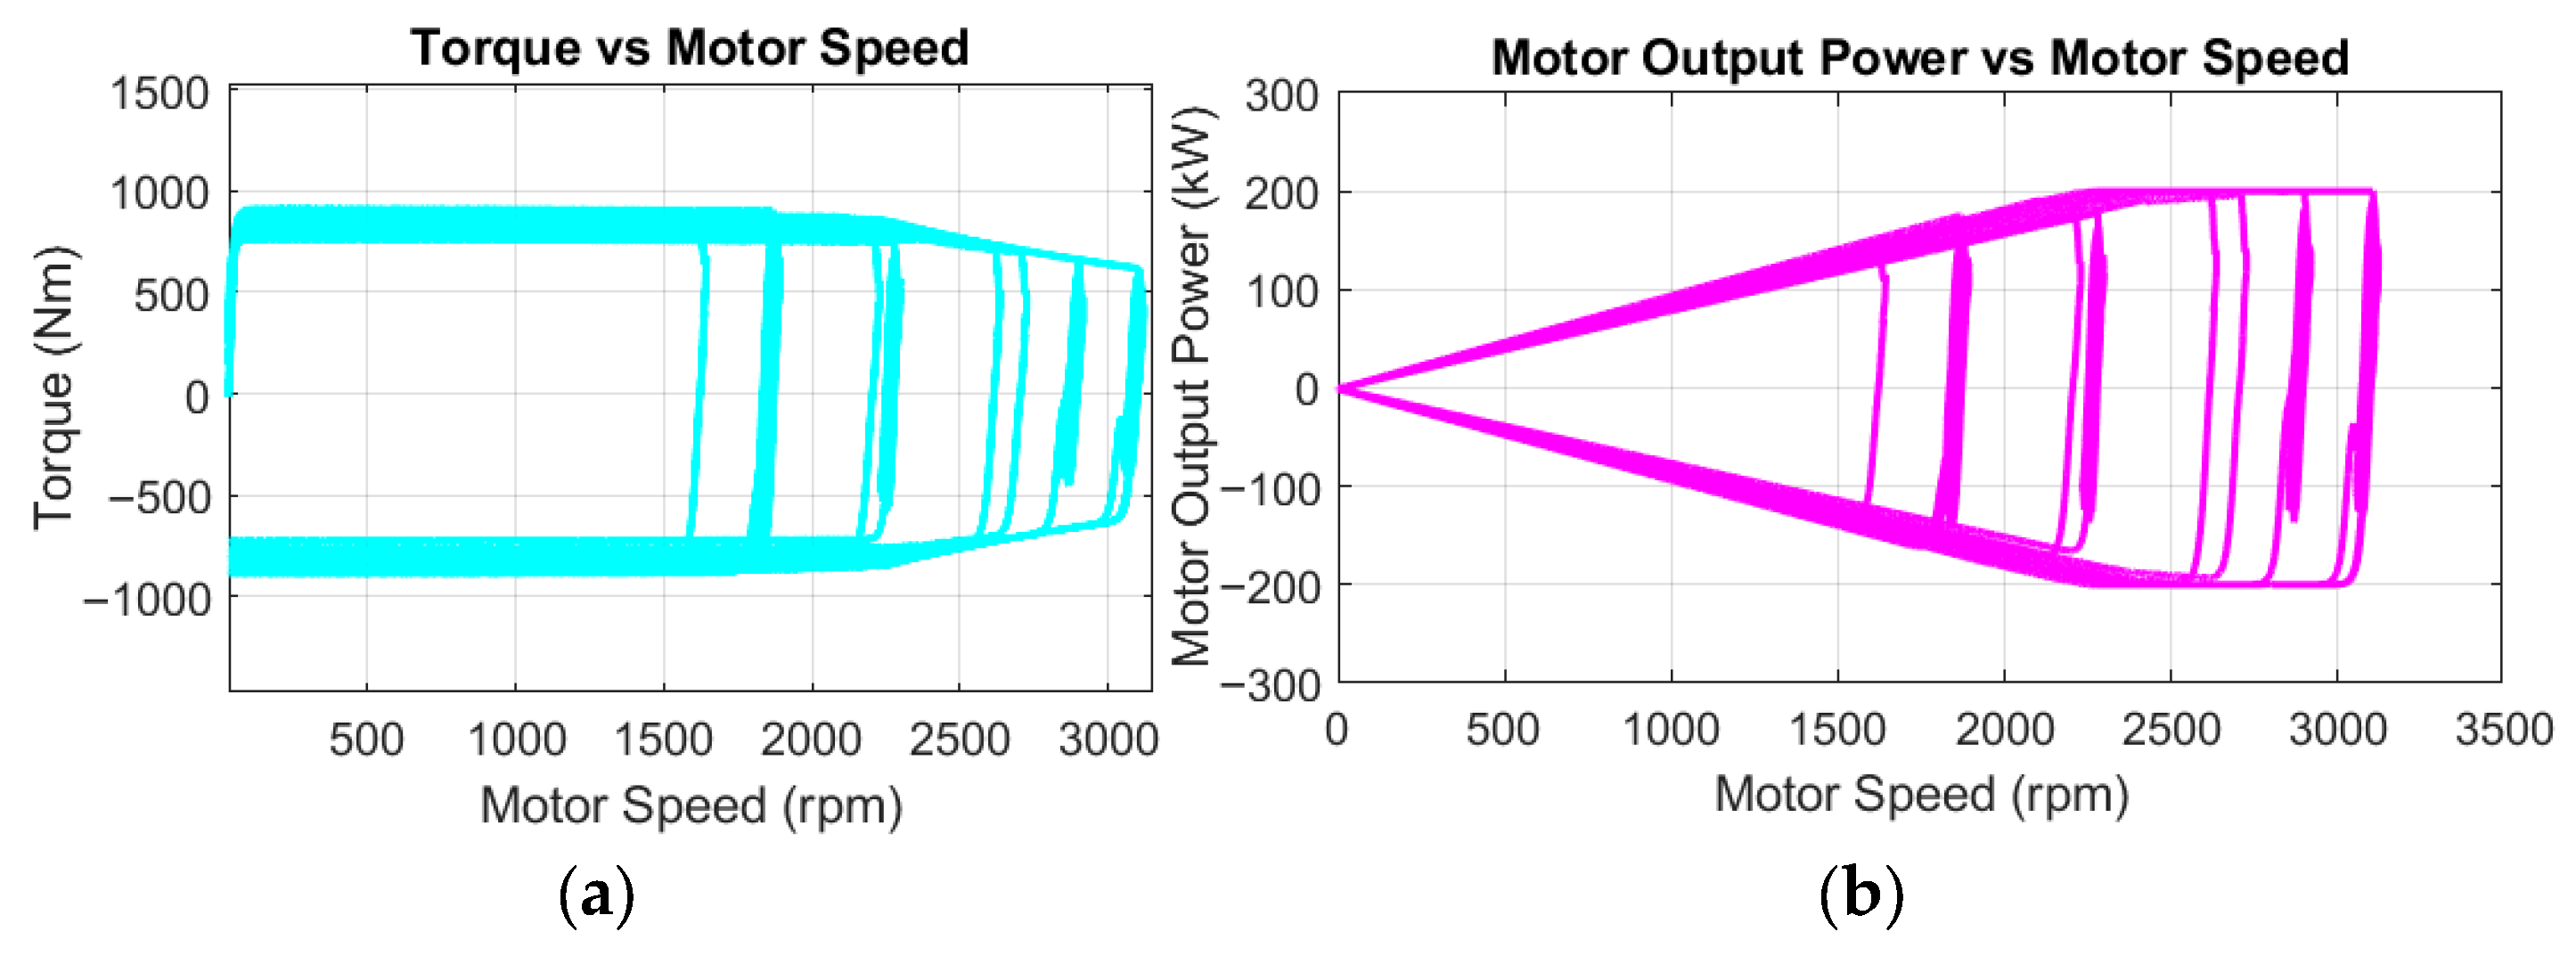
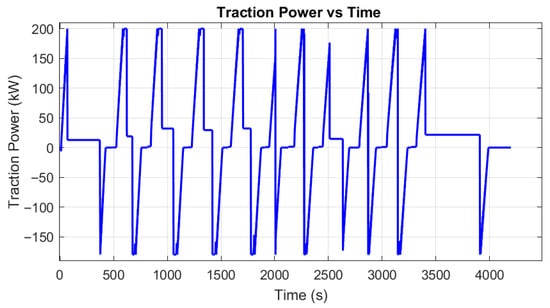
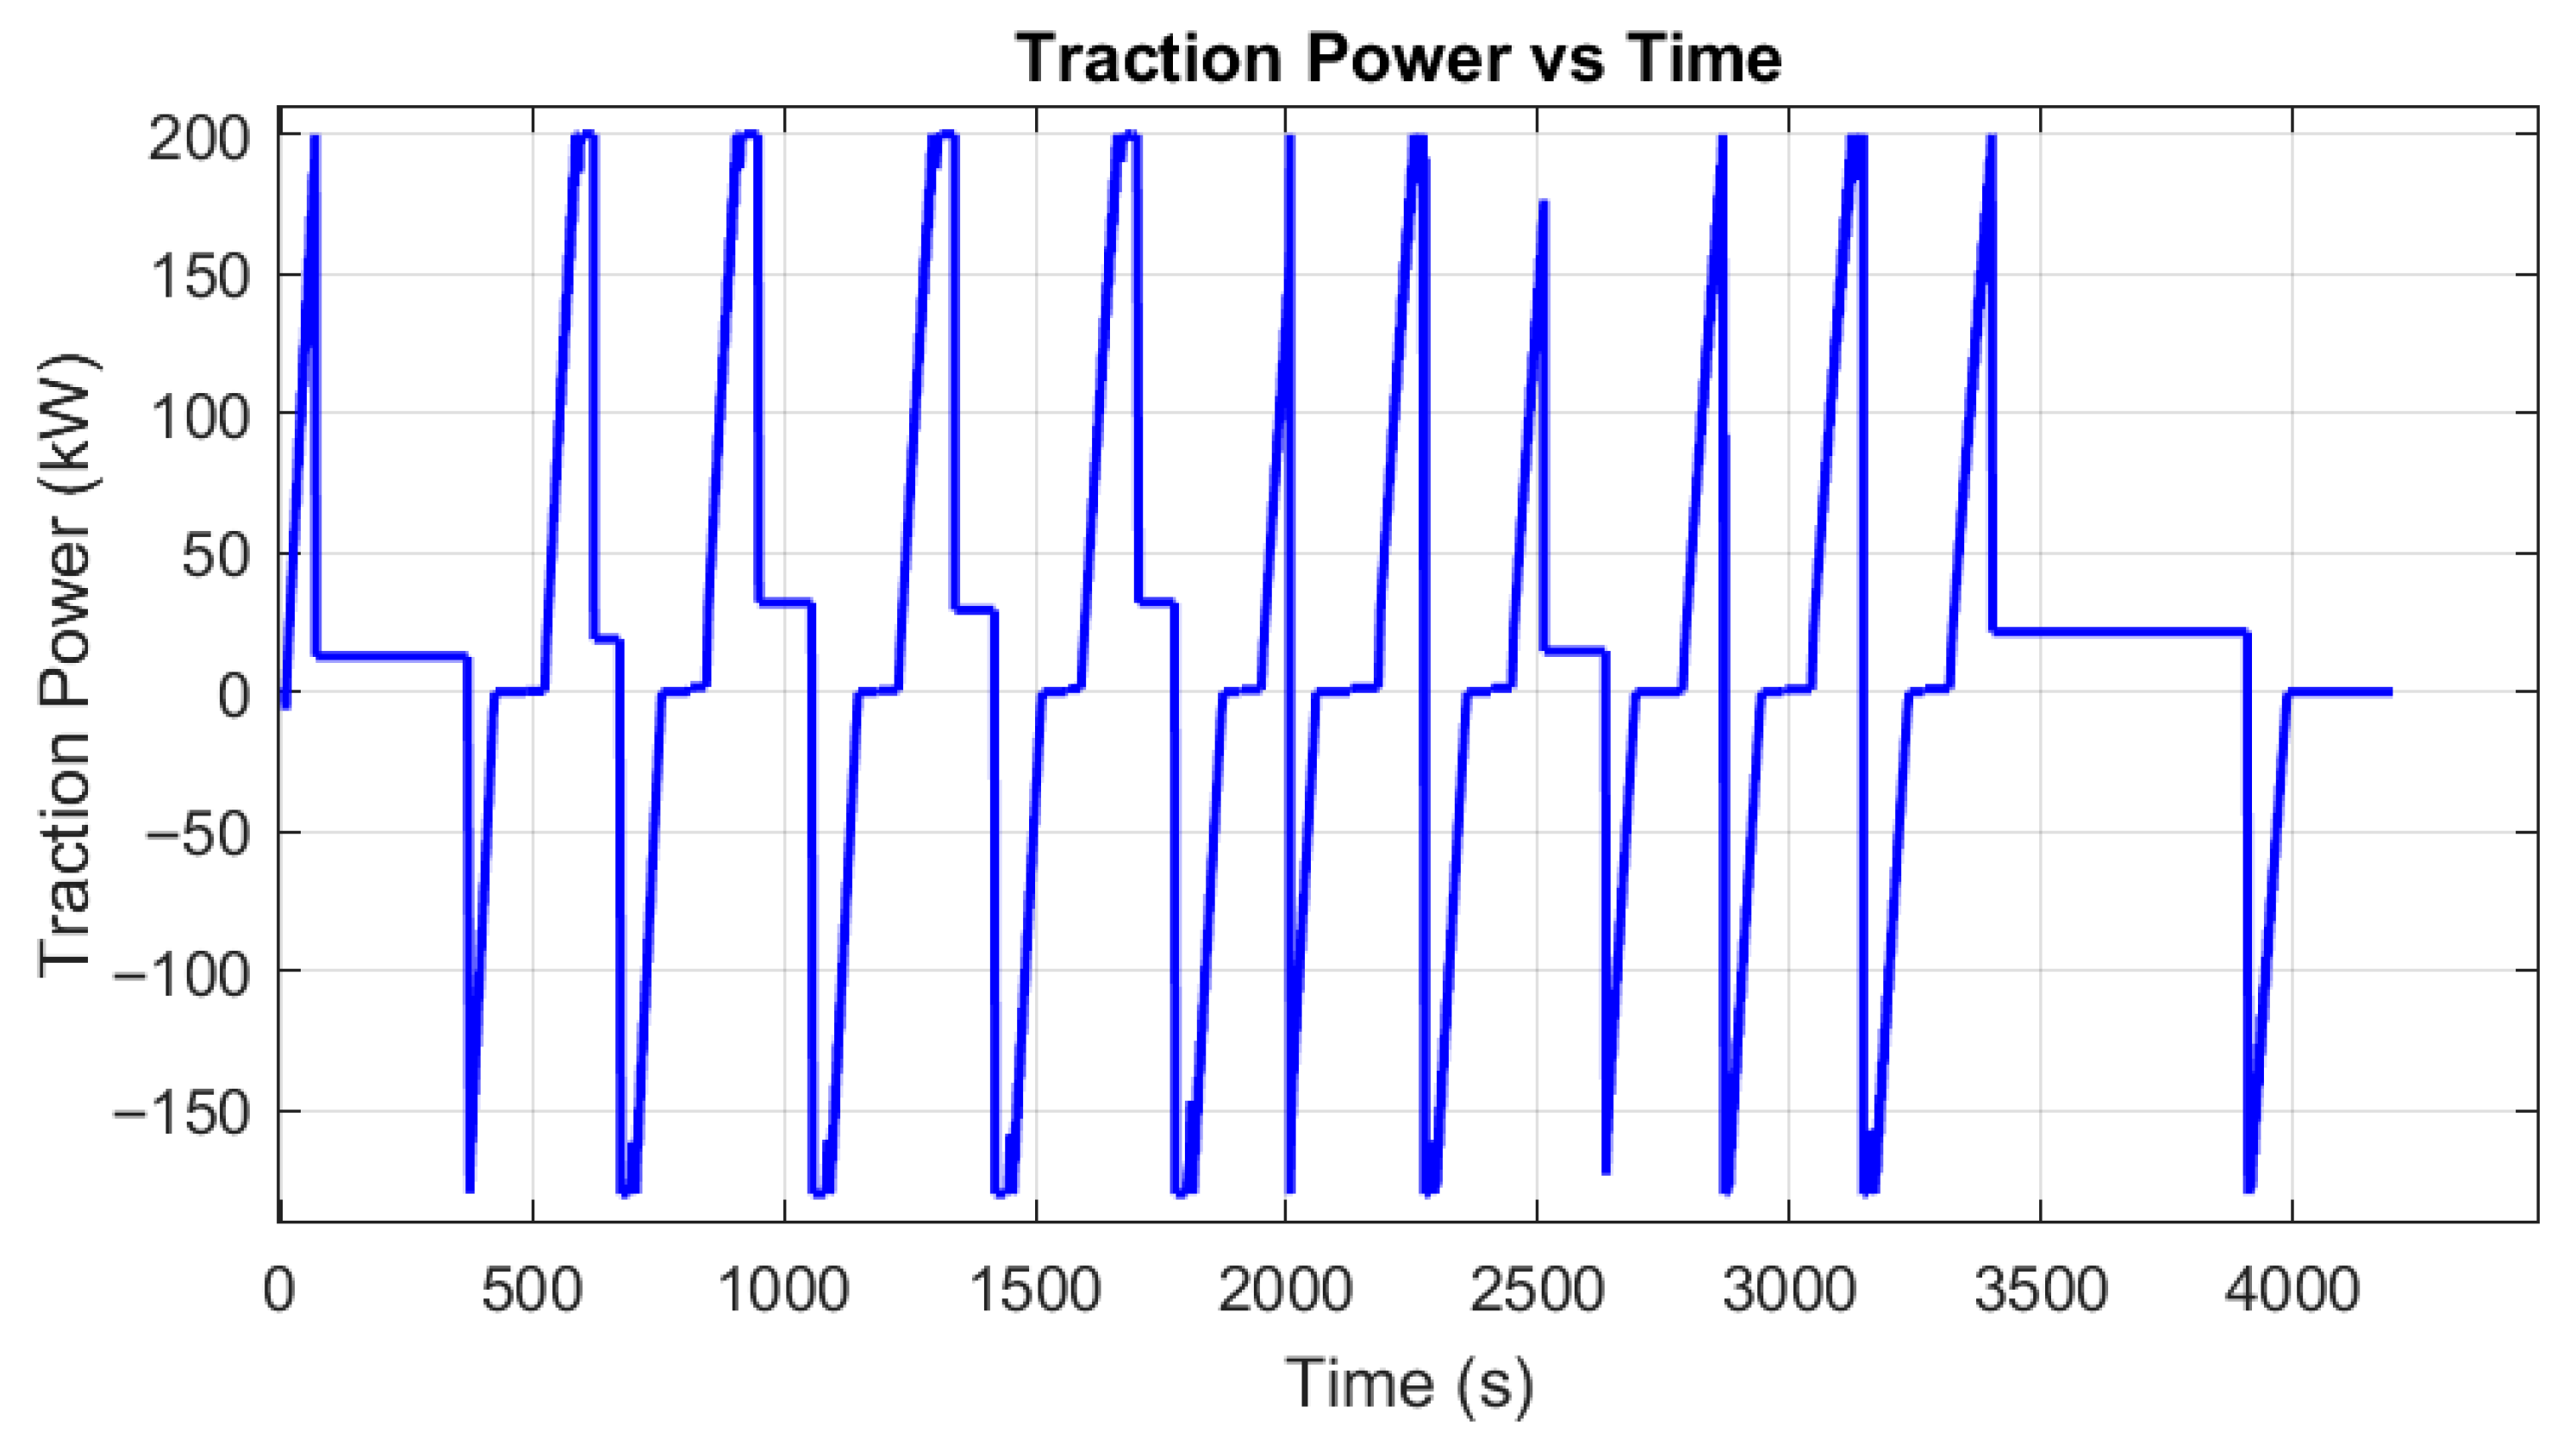
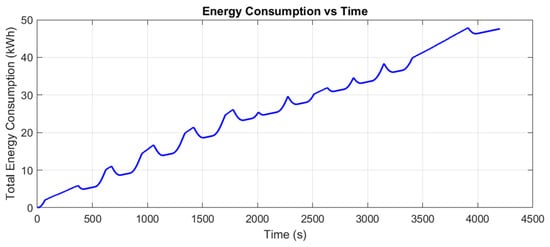
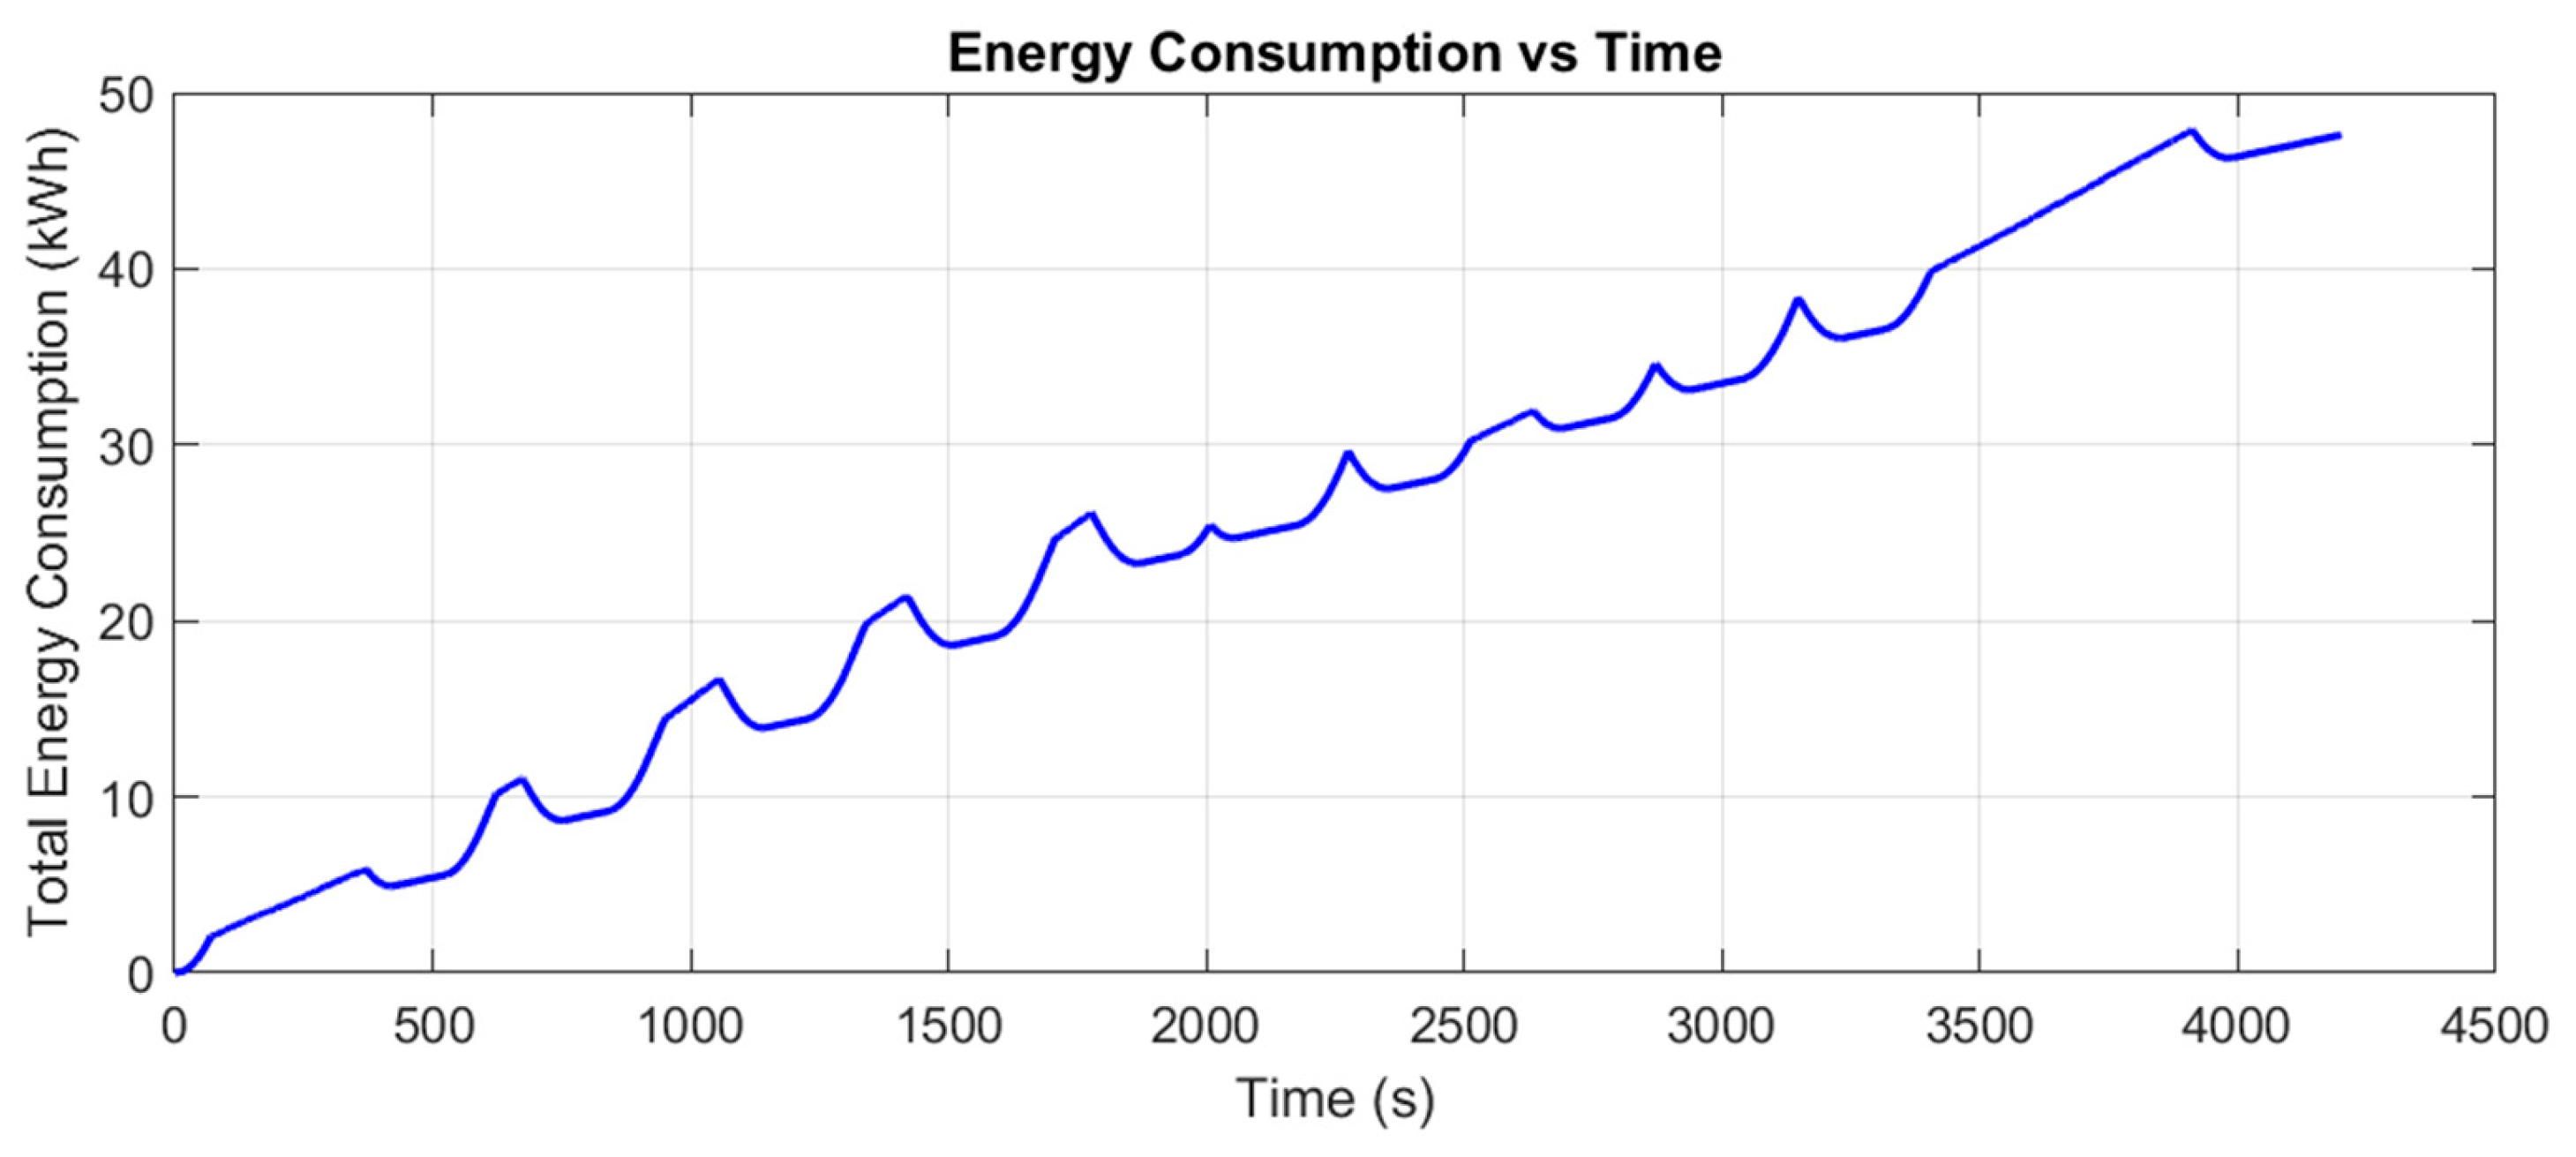

Disclaimer/Publisher’s Note: The statements, opinions and data contained in all publications are solely those of the individual author(s) and contributor(s) and not of MDPI and/or the editor(s). MDPI and/or the editor(s) disclaim responsibility for any injury to people or property resulting from any ideas, methods, instructions or products referred to in the content. |
© 2026 by the authors. Published by MDPI on behalf of the World Electric Vehicle Association. Licensee MDPI, Basel, Switzerland. This article is an open access article distributed under the terms and conditions of the Creative Commons Attribution (CC BY) license.