


Abstract
We present a parametrised charging infrastructure model developed to support the design of a hybrid electric zero-emission vessel with corresponding charging infrastructure for operation along the Norwegian Coastal Express route. The charging model includes functionalities to analyse the required battery storage capacity and power ratings and locations of charging facilities for achieving battery-electric operation. We demonstrate the use of the charging model to analyse different zero-emission scenarios for the Norwegian Coastal Express route. In the presented example scenarios, the model takes as input the estimated energy demand for a new zero-emission vessel design for the Coastal Express in different weather conditions, and includes functionality to consider realistic port stays based on existing timetables and historical data of delays. The analyses show minimal required battery capacities and illustrate a trade-off between charging power and battery capacity, as well as exemplifying the impact of different timetables and historic deviations on charging and energy delivered from the battery. The charging model presented is general and can be used for other routes than the Norwegian Coastal Express, as a tool for decision-makers to optimize for battery-electric operation whilst keeping the need for onboard storage capacity and charging infrastructure installations at a minimum.
1. Introduction
The Norwegian Coastal Express route provides passenger transport and cargo services along the Norwegian coast, connecting 34 ports from Bergen in the south to Kirkenes in the north, as shown in Figure 1. The full eleven-day round-trip covers approximately 2500 nautical miles (4600 km). Eleven ships are sailing at any time so that all ports have one northbound and one southbound arrival and departure every day, year-round. The ships in use today are approximately 125 m long and 19 m wide, with accommodation for up to 500 people.
Figure 1.
The charging infrastructure model presented herein can be used to find optimal charger locations and capacities for the Norwegian Coastal Express. Map modified with permission from [1], and ship concept visualization printed with permission [2].
Following ambitious goals to reduce global maritime emissions from the International Maritime Organization (IMO) [3] and the European Commission (EC) [4], as well as Norwegian national climate goals [5], Hurtigruten (one of two operators of the Norwegian Coastal Express route) has established the R&D project Sea Zero [6] with partners from industry and research. The primary goal of Sea Zero is to enable sustainable coastal transport of people and goods by demonstrating zero-emission solutions for the Coastal Express. To this end, a new vessel design was developed in the Sea Zero project. The new design has significantly reduced energy demands for propulsion and hotel needs, featuring sails for en-route energy harvesting, and a large battery pack as the primary energy source. The ship is designed for hybrid operation, with a low carbon backup energy source, intended for situations outside of expected normal operation, such as extreme weather or unavailable chargers. Other reports and publications within the Sea Zero project cover results and analyses related to the new energy-efficient ship design [7], propulsion technology [8], internal energy system, hotel energy needs, and life-cycle climate footprint. In addition, research on charging infrastructure within the Sea Zero project includes an extensive mapping of the available grid capacity and quay conditions in relevant ports [9], a review of developments in charging infrastructure technology [10], and development and testing of new components for high-power charging.
This work focuses on dimensioning on-board battery and port chargers. Electric maritime transportation may have to meet different zero-emission targets under varying weather conditions and timetable deviations. In the Sea Zero project, a model for the optimization of onboard battery capacity, charger locations, and charger power ratings has been developed in order to analyse minimum requirements for meeting such zero-emission targets. This battery and charging infrastructure sizing method is presented in this work, and the case of the Norwegian Coastal Express project demonstrates the applicability of the method.
A preliminary version of this work was presented in [11], where we introduced the core methodology and exemplified usage for the Norwegian Coastal Route case. However, ref. [11] was limited to illustrating the functionality of the model, as data on ship model and energy demand was not available at the time. This article further develops the presented model and additionally provides an extensive analysis of the case study on the Norwegian Coastal Express Route; including input data on ship model and energy demand.
1.1. Experience from Literature
As battery-electric operation for maritime vessels extends beyond short, fixed crossings suitable for electric ferries to longer and more complex routes, there is a need for large-scale charging infrastructure planning [12,13]. Finding the optimal design and structure of shore-side charging networks emerges as a central optimization problem where the spatial distribution of chargers, their power capacities, and the port stay durations jointly determine the achievable degree of battery-electric operation. The vast majority of published modelling studies within this domain are related to charging infrastructure of electric vehicles (EVs); see, e.g., reviews in [14,15,16,17]. Some of the most popular modelling approaches include mixed-integer optimization combining discrete decisions, such as charger location and size, with continuous power and energy constraints, although mostly at a smaller (power) scale than the present case. Here, we focus on the efficient modelling of the charging infrastructure needed for zero-emission operation of the Norwegian Coastal Express given the new vessel’s energy demand and existing timetable constraints.
Although no similar charging infrastructure model for the case of the Norwegian Coastal Express has been openly published, some relevant experience can be found in the literature for similar problems. In the maritime domain, Havre et al. [18] study a similar zero-emission vessel service network design problem for high-speed passenger vessels, jointly optimizing route structure, service frequencies, sailing speeds, charger locations, and power capacities. Realistic battery size and speed-dependent energy consumption are used as modelling constraints. However, combining all free variables from technical operation of vessels, routes, and timetables with economic variables such as tariff structure, opens a rather large domain for optimal solutions that can lead to model scenarios that are not achievable in practice. Similarly, Oyediran et al. [19] study optimal charging infrastructure for the electrification of marinas in Stockholm through mixed-integer optimization models for the spatial allocation and sizing of slow vs. fast chargers, balancing capital cost, energy cost, and reliability of energy supply to fleets of electric boats operating on fixed or semi-fixed routes. The scale is significantly smaller than for the Coastal Express, but the model has otherwise similar functionalities as the present work including varying energy demands, capacities, and locations of chargers. From other adjacent transport modes (such as electric city buses [20], heady-duty road transport [21,22], and regional electric aviation [23]), learning can be found in optimization models that treat batteries and chargers as black-box assets with given power or energy limits and use mixed-integer formulations to jointly optimize location, sizing, and operation under timetable and energy demand constraints.
In these studies across different transport domains, a general pattern emerges: the relationship between available charging power along the transport route(s) and the required battery capacity is strongly influenced by operational constraints such as dwell times, route schedules, and energy demands. Limited charging time or constrained charging power in some locations may require increased storage capacity and higher charging energy in other locations to maintain battery-electric operation, whereas higher charging power and more frequent charging can reduce the needed battery size through enabling shorter charging events. This trade-off is consistent across domains, but needs to be assessed on a case-by-case basis, e.g., via a parametrised model approach as presented in this paper.
Further relevant work includes power system architecture studies for shore-side charging of electric and hybrid ships [24] and current technological limitations for high-power charging systems exceeding 15 MW [25], which in this context, also should be complemented by local grid constraints that indirectly impact the achievable charging power at each port. In addition, similar models for charging and discharging are also developed for stationary batteries, e.g., grid support [26] and electric power system control [27]. Although the methodology of the model presented here is motivated by the zero-emission efforts for the Norwegian Coastal Express, it can be independently applied to other battery-electric vehicles, vessels, and other maritime or land-based routes that aim to transition to battery-electric operation.
1.2. Case Study and Constraints
We adopt a parametrised optimization modelling strategy and apply the model framework to the case of the Norwegian Coastal Express route, introducing relevant constraints given by the national tender for operation of the route. The continuous eleven-day round-trip along the Norwegian coastline is operated by eleven ships, such that all ports along the route (except the end ports in Bergen and Kirkenes) are visited by one northbound and one southbound vessel per day. The port stay durations vary, as given by the timetable in the national tender. Although future tenders may open for changes in the route and timetable, the existing timetable is used as a benchmark in this study. The competing objectives and limitations represent an extensive optimization problem. To address this challenge, we have built a parametrised model to assess how the choice of onboard battery size as well as the location and power rating of chargers along the route impact the battery-electric operation. We further consider the effects of actual port stay and sailing time variations based on historic AIS (automatic identification system) data from Coastal Express vessels in operation today. Our focus here lies on exploring different configurations of battery size and charging capacities along the route to reach different zero-emission targets.
This paper is organized as follows: Section 2 outlines the structure and functionality of the parametrised model, Section 3 presents a number of different scenarios of interest for the future Coastal Express, and Section 4 discusses the implications of the scenarios and the wider applicability of the model.
2. Methods
The parametrised model introduced in this work, hereafter called the charging model, is illustrated in Figure 2. It explores the degree of achievable battery-electric operation by simulating the energy flows into and out of the onboard battery, with functionality to vary charger power and location in port, onboard battery capacity, round-trip timetables, and energy demand data by adjusting input parameters. The following sections describe the model’s parameters and outputs, as well as the underlying assumptions and simulation logic.
Figure 2.
Illustration of the modelling approach with parameters to the left and outputs to the right. The figure also includes case-specific energy demand simulations, as described in Section 3.
2.1. Parameters
The input parameters (light blue boxes in the charging model in Figure 2) are modelling the factors whose effects are studied in this work: the battery, the energy demand for different speeds and weather, the charging infrastructure, and the vessel’s timetable. This section details the syntax and semantics of the charging model’s parameters.
2.1.1. Energy Demand
The net amount of energy required by the ship’s energy system during operation depends on multiple factors such as the vessel design and propulsion technology, as well as sailing conditions such as wind, currents, and temperature. The energy demand as a function of sailing speed is used as an input parameter to the charging model. This is illustrated in Figure 2. The split between energy demand simulations and the charging model allows researchers to choose different input datasets representing assumptions about the vessel and the sailing environment in order to study different scenarios or goals for zero-emission operation. For example, the energy demand dataset may represent a worst case of an inefficient ship design in harsh winter weather, or a more efficient ship sailing in less demanding conditions. It can also be set to a target threshold for energy that has to be supplied from battery and chargers. Hence, the charging model specifies the format of the energy demand input data only. The method of calculating this input data may vary for different case studies, and the method used in this work’s case study is described together with the case study in Section 3.
The energy demand parameter set is split into the energy demand during port stays and the energy demand while at sea. These are given as a function of the duration of the port stay or the duration of the sailing leg between two ports. For port stays, the average power demand during the stay is given as one shared input value for all ports and multiplied with the duration. For sailing legs, the power at any given moment depends on the sailing speed. It is therefore provided to the charging model in the form of polynomials, each representing the energy demand as a function of sailing time for a specific sailing leg. The fourth-order polynomials take the sailing time as input and return the energy needed. Optionally, the valid range of sailing times for which each polynomial yields a meaningful average power demand can also be specified. Port stays are defined as the time during which the ship is secured at the quay. The energy demand for manoeuvring in the port and mooring is assumed to be included in the sailing leg.
2.1.2. Battery
The battery is described by its net energy capacity, a charging loss approximation function, and a discharging loss approximation function.
The battery net capacity is defined as the difference between a given minimum allowed state of charge (SoC) and a given maximum allowed SoC. Accordingly, the battery is considered empty when the SoC reaches the defined minimum SoC and should not be further discharged, and full when the SoC reaches the defined maximum and should not be further charged. The gross capacity is the battery capacity required to guarantee the defined net capacity throughout the battery’s lifetime. Detailed modelling of the battery as well as calculations of the required gross size are outside the scope of the charging model. In the charging model, we therefore use the net battery capacity.
The charging and discharging loss functions approximate all losses within the battery and onboard charging equipment, including power converter losses. The discharging loss function does not consider any losses in the ship’s internal power distribution system. Instead, these are assumed to be included in the energy demand input. The loss approximation functions can estimate losses from charging or discharging based on duration, power, or the current SoC.
2.1.3. Charging Infrastructure
The charging infrastructure is represented as a system of available chargers at selected ports along the route. Each charger is defined by its location (the port) and power rating. The power value used in the charging model represents the power that is delivered to the ship, i.e., after onshore losses. Furthermore, it is assumed that the ship will always charge at the maximum available port power. If relevant, connection and disconnection time as well as any additional energy needed onboard the ship for connecting or disconnecting the charger can be specified. Limitations on available grid capacity can be enforced by setting an upper limit to charger ratings accepted by the model.
2.1.4. Timetable
A timetable is defined by a sequence of port stays including arrival and departure times. In the charging model, the relevant input parameter is a schedule, where one schedule can include one or more timetables. This allows us to represent timetable changes over the simulated time period, for example, due to different timetables for summer and winter operation.
The arrival and departure times in the timetable are defined as the start and end of the time frame within which the ship is stationary and secured for cargo handling and passenger boarding. The time needed for manoeuvring in port, mooring, and connecting the charging plug are assumed to be included in the sailing time.
2.2. Simulation Method
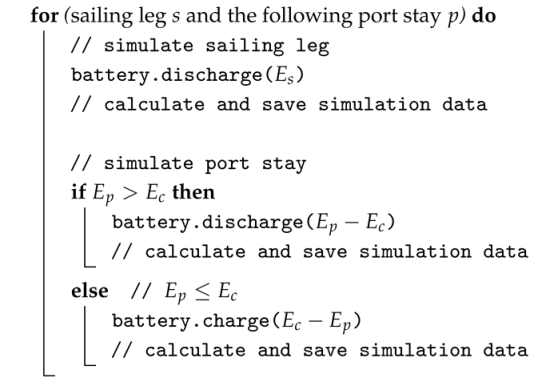
In the charging model, a round-trip is simulated according to a given timetable. Port stays and sailing legs are simulated in order of sequence as shown in Algorithm 1. In each time step, simulation results are collected, including:
- Start time;
- Port (destination port for sailing legs);
- Battery state of charge (SoC);
- Time when battery limits (empty or fully charged) are reached during the time step;
- Average battery power flow;
- Energy delivered to ship system (propulsion and hotel);
- Energy delivered from battery;
- Energy delivered from shore power;
- Energy delivered from backup source;
- Energy delivered from chargers.
This output data can then be used for further analysis, including calculating the percentage of battery-electric operation and other relevant metrics. Energy demand is calculated for each sailing leg () and port stay () from the given timetable. The total energy available from the respective charger () is calculated for each port stay. If no charger is installed in the respective port, then .
| Algorithm 1: Round-trip simulation. |
 |
2.3. Modelling Historic Timetable Deviations
In order to analyse historic delays in comparison to a set schedule, historical port stay durations can be analysed using automatic identification system (AIS) data. The data source is the Norwegian Coastal Administration, and the data is subject to the NLOD license [28]. There are no geographic limitations to the data, but transmissions (via satellite) are sporadic outside of Norwegian waters. Using AIS data for a relevant time period from Coastal Express vessels, the data processing steps to obtain historical timetable data are as follows:
- Clean data: check the AIS data for missing or unreliable values such as AIS drop-outs, and (where appropriate) fill in gaps without introducing bias; discard datasets that are not complete or inconsistent with respect to the assumed route.
- Define operational mode: divide each vessel’s journeys into segments representing individual sailing legs for which we can calculate start- and endpoints (time, longitude, latitude), as well as the time spent stationary (i.e., at port) prior to a sailing leg. We assume stationarity when (i) the median speed over ground (SOG) over a min period centred at the sample timestamp considered is no higher than kn, or (ii) more than 30 s have elapsed since the last recorded AIS message and the SOG is below 1 kn.
- Select complete trips: filter for spurious results stemming from manoeuvring close to quay or AIS drop-outs; full trips are collected for which the expected sequence of port stays can be identified from the AIS data with reasonable confidence; discard trips with missing values or insufficient confidence in the data. The resulting data-based schedules can be fed into the charging model to gauge the sensitivity of results given historic time delays and deviations, and are thus an integral part in finding optimal and robust infrastructure and vessel design choices.
3. Case Study
In this section, the charging model presented in Section 2 is applied to the case of the Norwegian Coastal Express Route, as described in Section 1. We analyse the minimum requirements for battery capacity and charging infrastructure under given prerequisites and goals for zero-emission-operation.
Section 3.1 details the energy demand simulations yielding the energy demand data parameter. Section 3.2 further presents the model parameter settings, ranges, and criteria used to represent the Coastal Express case. Section 3.3 presents relevant charging model scenarios and results. Limitations and implications of the results are further discussed in Section 4.
3.1. Estimating Energy Demand Input
To provide realistic input data for the energy demand of each sailing leg, the energy demand of the new Sea Zero ship design is simulated for different speeds and for realistic weather conditions. The Sea Zero design as well as the wind model quality assessment are described in [7]. The resulting datasets are used as the energy demand parameter in the case study, as described in Section 3.2.
3.1.1. Ship Model
The Sea Zero concept vessel is modelled using software from the ship design suite ShipX version 4.4.0 [29], as well computational fluid dynamics (CFD) simulations and tests of the hull and of the propulsion system. The ship model is calibrated based on model tests such as cyberphysical tests of the hull and sails [30] in the SINTEF Ocean towing tank, and manoeuvring tests in the ocean basin [8,31]. The generated ship model can be used for steady simulations in SINTEF Ocean ship’s simulator VeSim version 4.4.0 [32,33]. Gymir uses a quasi-steady approach when computing the ship performances. Given speed-over-ground, wind, and sea state, we estimate the steady-state power demand for propulsion based on:
- 1.
- Calm water resistance from CFD calculations, including the drag reduction due to air lubrication.
- 2.
- Wave resistance by VERES, a potential flow code in ShipX [34].
- 3.
- Propulsion efficiency coefficients from CFD calculations.
- 4.
- Wind resistance from CFD simulations.
- 5.
- Wind propulsion forces of two rigid wing sails are estimated using a static lifting-line model. A simple control system is implemented to vary the sails’ flap angle and angle of attack based on the apparent wind.
The sea current was not included in this study. Following the route from port to port along the coast, the ship is often in shielded areas. Some legs are however exposed to stronger current, for example, the Stad peninsula, Bodø-Lofoten, and the north coast from Hammerfest to Kirkenes, leading to inaccuracies in these areas. As discussed in Section 4, including sea currents into the energy demand calculations will be the subject of follow-up projects.
The following power demands are added during transit simulation:
- 1.
- Hotel, ventilation, air condition (HVAC).
- 2.
- Raising or lowering the sails when passing a bridge, electrical lines, or close to the port areas.
- 3.
- Compressor for the air lubrication system.
3.1.2. Simulating Legs
The energy demands per leg, as described in Section 2.1, are estimated using the Gymir simulation platform [35]. Gymir can be used to estimate model ship performance using hindcast weather data to simulate the transit phase of ship operations for an extended period of time. The Coastal Express route is impacted by local weather and sea conditions along the coast. In this case, we have studied the Norwegian Coastal Express route for the (weather) year 2019. For this study, a model with a grid size of 800 m (WAM800) from the Norwegian Meteorological Institute (MET Norway) is used. The WAM800 model hindcast data were compared to the operational data collected by the currently operating Coastal Express ship MS Nordlys from March 2023 to March 2024 [7]. The agreement was found to be generally good.
Gymir simulates each (port-to-port) sailing leg independently. Following the relevant timetables, each leg is simulated on a daily basis throughout one whole year. There are some seasonal differences, e.g., that Geiranger and Hjørundfjorden are only visited during limited periods of the summer and/or fall season. All legs are sailed at 11.5, 12.5, 13.5, 14.5, and 15.5 knots, and for each speed, a distribution function for the average power demand per leg is estimated. These distributions are then used to estimate statistical 50th, 70th, and 90th percentiles of the average power demand for a distribution of voyages for each leg. The percentiles are provided to the charging model as fitted polynomials for the power demand as a function of speed for each leg along the Coastal Express route (one polynomial for each statistical percentile).
3.2. Parameter Setting and Ranges
This case study analyses battery capacity and charging infrastructure requirements by the means of five scenarios, referred to as scenarios A through E. In the following, the scenarios are defined by their respective parameter settings. Table 1 gives an overview of the scenarios referred to throughout the case study.
Table 1.
Overview of scenarios presented in this study.
3.2.1. Energy Demand Thresholds
In the following scenarios, the simulated energy demand per leg, as presented in Section 3.1, is used as the energy demand input to the charging model. The scenarios analyse minimum requirements for onboard battery size and charging infrastructure needed to guarantee zero-emission operation for a certain threshold of energy required per leg. We compare two thresholds: one derived from the average energy demand per leg (scenario A) and one derived from the 90th percentile energy demand per leg (scenario B). Scenario A represents a requirement for zero-emission operation under historically typical weather conditions, opening for use of the backup energy source if more energy is required, for example, due to challenging weather. It is referred to as average energy demand in the remainder of the section. Scenario B reflects a more strict threshold for zero-emission operation on most trips, which is referred to as high energy demand in the following. Scenarios D and E discuss adapted and deviating schedules on the basis of the average energy demand. Scenario C evaluates the trade-off between battery capacity and charging power based on the high energy demand compared to scenario B.
3.2.2. Choice of Schedule
For the schedule parameter, the Coastal Express timetable for 2022 is used. There are different seasonal timetables: The winter–spring timetable, valid from November to May, represents the base case and includes a ten-hour stay in Ålesund on the northbound journey. Outside this season, the stay in Ålesund is interrupted by a nine-hour excursion to Geirangerfjord from June to August (summer timetable), and an eight-hour excursion to Hjørundfjorden in September and October (autumn timetable).
For Geirangerfjord, along with the other Norwegian fjords on UNESCO’s World Heritage list, the Norwegian Ministry of Climate and Environment has introduced requirements on zero-emission operation for passenger ships [36]. For vessels with a gross tonnage of 10,000 or below, the law takes effect from 1 January 2026. For larger vessels, including the current Coastal Express vessels, zero-emission operation in the fjord is required from 1 January 2032.
To analyse future Coastal Route operation, we will therefore include the following values for the charging model’s schedule parameter in the analysis:
- Full year. Consisting of three separate timetables for summer, autumn, and winter–spring to reflect the full-year schedule of 2022 including seasonal excursions.
- Winter. Scenarios A, B, and C focus on the winter–spring timetable without excursions only.
- Adaptations from 2022. In scenario D, the winter–spring timetable from 2022 is adapted slightly to exemplify the effect of timetable changes on charging and energy demand.
- AIS data. In scenario E, the schedules derived from historic AIS data are used to represent timetable deviations in the charging model.
3.2.3. Charging Ports and Charging Time
In the following scenarios, we consider charging in the ten ports with the longest stays (105 min or longer). Ports with shorter stays are not considered relevant for installing chargers, due to high investment costs and relatively sparse usage. The time used to connect the charger is assumed to be relatively short (up to 5 min) and included in the process of mooring and securing the ship, and therefore part of the sailing leg.
In scenarios A and B, the charger ratings are then optimized to yield the smallest possible battery capacity. Scenarios D and E analyse the charging infrastructure given by scenario A for modified time schedules.
3.2.4. Battery Limits
The Sea Zero ship was designed for a gross battery capacity of 72.4 MWh with current technology, which corresponds to approximately 60 MWh net capacity. In the following scenarios, we analyse the impact of different battery net capacities between 50 and 80 MWh. In the case study, battery capacities mentioned in the figures and text refer to the net capacity of the battery as opposed to the gross capacity. Analogously, the SoC represents the SoC of the net capacity. Charging and discharging losses are approximated as a fixed 2.5% of the battery power flow both for charging and discharging. This is deemed sufficiently accurate for the purpose of this case since the details of the battery and converters in the new ship remain to be determined.
3.2.5. Charger Capacities and Grid Constraints
The Sea Zero project also involves testing a charging solution from Cavotec. This charging solution is rated with up to 23 MVA. Additionally, possible constraints in available grid capacity may limit charging power in some ports. For the case at hand, these have been examined in interviews with grid companies in the ports [9]. Combining technological constraints with limitations in grid capacity, we set the upper bound for charging power in the analysed scenarios to 20 MW assuming linear charging as described in Section 2.
3.3. Scenarios
Using the parameters described above, we use the charging model to analyse the impact of different choices for battery capacity, charging infrastructure, and timetable, as well as different goals for electric operation.
We begin with an example with non-optimal battery and charging configurations in order to demonstrate periods of both full battery and complete depletion during a full round-trip. Figure 3 shows the change in the net battery SoC with respect to time passed during both sailing legs and port stays. For a scenario with a relatively small battery size of 50 MWh, an arbitrary charging infrastructure is detailed in Figure 4, with the average leg energy demand of the new ship used. All seasonal timetables are visualised in the same plot. Battery discharge due to propulsion is indicated by a sharp decline in the SoC between port stays. If the SoC reaches zero, the energy demand of the ship has to be supplied from the backup source until the next charging possibility. During port stays, charging is indicated by a sharp increase in the SoC. If the SoC reaches 100%, the battery is full and therefore no longer charging.
Figure 3.
The state of charge during the round-trip journey (Bergen–Kirkenes–Bergen) of a Norwegian Coastal Express ship for an example battery net capacity, charging infrastructure, and energy demand.
Figure 4.
Installed charger power per port including the proportion of unused power (not utilised in any season during northbound and southbound journeys).
Note that any combination of timetable and energy demand defines a lower bound for the battery capacity. That is, the battery capacity must be, at minimum, equal to the energy demand for the longest period between two consecutive chargers. In Figure 3, the longest periods without charging are the sailing legs between Honningsvåg and Kirkenes. However, the timetable for the northbound journey allows only for a ten-minute port stay in Brønnøysund, and as a consequence, the charging energy in this port will not be significant for any realistic charging power. Therefore, without any changes to the timetable, the energy demand for the journey from Trondheim to Bodø represents a minimum required value for the battery net size for the ship to reach the set goal of battery-electric operation.
To supply the given energy demand from battery and chargers, they can be adapted to avoid a depleted battery during the full round-trip. The SoC behaviour prior to a period of depletion can guide adaption of the charging infrastructure. Increasing the charging power in previous ports only has an effect if the battery is not fully charged after. As an example, Figure 3 shows one period with a depleted battery before arrival in Bergen at the end of the round-trip. Increasing the charger capacity in Brønnøysund will not change the outcome, because no additional energy can be stored when reaching Trondheim (visible in Figure 3 as a full battery). On the other hand, increasing charging power in Ålesund will be effective due to free battery capacity (for the southbound journey). Alternatively, new chargers may be introduced in other ports. Similarly, increasing the battery capacity has an effect only if there are charging ports where there is more energy available than what can be stored, visualised by periods where the SoC is equal to the battery capacity.
It is relevant to consider to what extent the installed charger capacity can be exploited given the timetable. This is impacted by two factors: the duration of the port stay, considering both the northbound and southbound journey, and the free capacity in the battery when arriving at the port. The duration of each port stay according to today’s winter–spring timetable is visualised in Figure 5. When selecting a port for increasing charging power, the energy gained per unit of added power is greater if the vessel’s stay in that port is longer. In this example, in order to mitigate battery depletion before arrival in Tromsø, it may be more relevant to increase the size of the charger in Bodø rather than in Brønnøysund, where the duration of the northbound stay is significantly shorter.
Figure 5.
Duration of port stays according to the winter–spring timetable.
Even though there is a sufficient amount of energy that can potentially be delivered from the charger during a port stay, it may not be possible to store the energy due to limited available capacity in the battery. In Figure 3, this becomes visible as horizontal parts of the figure at the battery capacity limit, for example, during the northbound stay in Ålesund (for winter schedule). As the majority of ports are visited twice, the SoC graph may not immediately reveal in which ports the installed power can be reduced without effecting the SoC. From the simulation data, we can calculate the power used in each port during the round-trip. Figure 4 shows these numbers set up against the installed capacity. This information can be used to optimize charger size to the minimum power needed to achieve the same result.
We will now present scenarios of the Norwegian Coastal Express under various conditions of ship battery capacity, charging infrastructure, and weather conditions (energy demand). For a detailed definition of the parameter settings for each scenario, refer to Section 3.2. An overview of the scenarios is given in Table 1. All scenarios assume the winter–spring timetable, with the duration of port stays as detailed in Figure 5.
3.3.1. Scenario A: Average Energy Demand
This scenario evaluates the battery capacity needed to realize complete battery-electric operation of the round-trip for a given charging infrastructure, using typical weather conditions for all legs. The winter–spring timetable is used for the scenario, with duration of port stays as detailed in Figure 5.
Figure 6c shows the SoC for scenario A based on two different charger configurations. First, the battery capacity is optimized for 15 MW charging in all selected ports, as shown in Figure 6a. In this case, the ship must be equipped with a net battery capacity of at least 52.2 MWh in order to avoid being fully discharged at any point during its journey. However, since a charger configuration of 15 MW in each port is non-optimal, the overall charging power can be further reduced. The installed charging power in ports Bergen and Kirkenes can be reduced since they are not fully utilized during the round-trip. In Figure 6b, the charging infrastructure has been changed to reflect this. Additionally, in Ålesund, the charging power can be reduced with little effect on the required battery capacity. This is possible due to the extended stay there during the northbound trip where the SoC reaches 100% even with very low charging power, and the short stay there on the southbound trip where a change in charging power only has a minor effect on the SoC profile. Finally, due to a longer stay in Trondheim preceding a short stay in Ålesund during the southbound journey, a minor increase in power in Trondheim is sufficient to compensate for the relatively larger reduction in power in Ålesund. The resulting charging infrastructure in case (b) has a sum total of 135 MW installed charging power compared to 150 MW total charging power installed in case (a), while the minimum required battery capacity of the ship remains similar at 52.4 MWh.
Figure 6.
(a) Charging infrastructure with 15 MW chargers installed in all ports. (b) Charging infrastructure optimized with aim to reduce the sum of installed charging power. (c) The state of charge during the round-trip journey (Bergen–Kirkenes–Bergen) of a Norwegian Express Ship for the average energy demand, serviced by the charging infrastructures specified in (a) or (b). Dotted lines indicate the battery capacity.
With the given schedule, the minimum required battery capacity is bottle-necked by the long passage from Trondheim to Bodø, where the only available charging station on this leg is a very short stay at Brønnøysund. Another notable long passage is on the southbound journey from Trondheim to Bergen, with a short charging stop in Ålesund. Further increasing the charging power in ports Brønnøysund and Ålesund can reduce the required battery capacity, but only marginally due to their short stays. For example, using the charging infrastructure in Figure 6b but with charging capacity in Brønnøysund and Ålesund, as well as Tromsø, increased to 20 MW, the minimum battery capacity is almost unchanged at 51.4 MWh.
3.3.2. Scenario B: High Energy Demand
This scenario analyses the minimum required battery size under high energy demand conditions. The schedule follows the winter–spring timetable, with port stays as detailed in Figure 5.
Figure 7 shows the SoC for two different charging infrastructures. In Figure 7a, all chargers deliver 15 MW, similar to scenario A. Due to the harsher weather conditions for all legs, more energy is depleted from the battery between every charging stop. The minimum battery capacity that enables full battery-electric operation in case (a) is 76.9 MWh. The limiting factors are the two long southbound legs from Trondheim to Bergen with only a short charging stop in Ålesund. In Figure 7b, the charging infrastructure is adapted to achieve the smallest possible battery capacity ensuring full battery-electric operation. The choice of charging infrastructure in case (b) was determined mainly by ensuring a high SoC before the southbound legs from Trondheim to Bergen, which is reflected by increased charging power in Svolvær and Tromsø. Further improvements were limited by the previously mentioned bottleneck in Brønnøysund on the northbound trip from Trondheim to Bodø. These changes resulted in a minimum required battery capacity of 57.4 MWh, given a charging infrastructure with a total charging power of 153 MW. Thus, by distributing the magnitude of charging power to ports based on the energy demanded by the schedule, one can in certain scenarios greatly reduce the ship’s required battery capacity without requiring a higher sum of installed charging capacity.
Figure 7.
(a) Charging infrastructure with 15 MW chargers installed in all ports. (b) Charging infrastructure optimized with the aim to minimize battery capacity. (c) The state of charge during the round-trip journey (Bergen–Kirkenes–Bergen) under high energy demand conditions, given the charging infrastructures specified in (a) or (b). Dotted lines indicate the battery capacity of each case.
The Sea Zero ship was designed for a gross battery capacity of 72.4 MWh, which corresponds to approximately 60 MWh net capacity. With this battery capacity, the evenly distributed charging infrastructure in Figure 7a is not able to support a fully battery-electric operated ship under high energy demand conditions. On the other hand, with a more methodical distribution of the available charging power, as in Figure 7b, the Coastal Express may realize fully battery-electric operation even during the most energy-demanding conditions.
3.3.3. Scenario C: Fixed Battery Size
While scenarios A and B analyse the minimal required battery size, this section focuses on exploring solutions with less total charging power, as a trade-off with a larger battery. Timetable and energy demand parameters are set to the winter timetable with a high energy demand, respectively, in order to compare the results to scenario B. For battery capacities of 60 MWh, 70 MWh, and 80 MWh, we adapt the charging infrastructure to reduce the sum of the charger power ratings installed in all ports.
Table 2 shows the resulting total charging power for 60 MWh, 70 MWh, and 80 MWh battery capacities. Battery size and charging power of scenario B are added as a baseline for comparison. The required total charging power for the baseline battery capacity (57.4 MWh) is highest. An initial increase in the battery size by 2.6 MWh to 60 MWh trades for 7 MW less in total charging power. With higher battery capacities, the required total charging power is reduced down to 127 MW for a battery capacity of 80 MWh. Furthermore, it becomes visible that the additional decrease in charging power per added unit of battery capacity is reducing with higher charger ratings: increasing the battery capacity from 60 MWh to 70 MWh leads to a reduction in charging power of 14 MW, whereas increasing battery capacity from 70 MWh to 80 MWh yields a relatively lower decrease in charging power of 5 MW.
Table 2.
Comparison of battery capacity and total charging infrastructure required to supply the high energy demand from battery and chargers only for scenarios B and C.
Figure 8 presents the SoC throughout the round-trip as well as the charger power ratings for a battery capacity of 70 MWh. The total charging power required to supply the full energy demand is 132 MW. This represents a reduction of 21 MW compared to the baseline scenario Bwith a battery capacity of 57.4 MWh. Beyond the trade-off between battery capacity and charging infrastructure, we note that the difference in charging power between the ports experiences an increase with increased battery capacity. This effect is illustrated by the difference between the charger with the lowest power and the charger with the highest power, amounting to 9 MW for the baseline and 15 MW for Figure 8. The increased difference can be attributed to the larger storage capacity of the battery, allowing for the charging power to be distributed more flexibly to ports where charging is most effective.
Figure 8.
(a) The state of charge and (b) installed chargers for high energy demand, winter timetable, and 70 MWh battery capacity (dotted line in (a)).
3.3.4. Scenario D: Adapted Schedule
In this scenario, we exemplify the effect of adapting the timetable. The northbound port stay in Brønnøysund is one example where changes to the timetable can help lower the requirements for battery size or total installed charging power. This can be seen in both scenarios A and B, where further optimization reached stagnation due the short stay in Brønnøysund. Here, we present a scenario where the winter–spring timetable has been adjusted between Trondheim to Bodø to allow for a longer port stay in Brønnøysund in order to extend the charging period there. This scenario is otherwise identical to scenario A, using the optimized charging infrastructure in Figure 6b.
If there is a criterion on the overall trip length, extended port stays must be balanced by shortening the stay in other ports, or by decreasing the time to sail certain legs and thus increasing the sailing speed. The adapted timetable for this case is shown in Table 3, where the extended port stay in Brønnøysund is balanced out by shortening the sailing time for each of the three sailing legs before and after the port stay in Brønnøysund. Both departure from Trondheim port and arrival in Bodø port remain unchanged. As the steeper decline in battery SoC for the adapted timetable in Figure 9 shows, the faster sailing speed does require more energy, but the extended charging time in Brønnøysund dominates the trade-off. With the original timetable, the difference in SoC from Trondheim to Bodø is 52.4 MWh, while it is 47.2 MWh using the adapted timetable. Thus, adapting the schedule to accommodate the needs of battery-electric operation can effectively reduce the required size of the on-board battery.
Table 3.
Minor changes to the original timetable to optimize battery-electric operation.
Figure 9.
The state of charge for the winter–spring timetable and an adapted version.
3.3.5. Scenario E: Schedule Based on Historical Data
We complete this case study by analysing scenario A under timetable deviations based on AIS data from 20 historic voyages for the Norwegian Coastal Express in 2022 and 2023. The historic round-trip schedules are the result of AIS data analysis as described in Section 2.3. While a significant number of round-trips had to be discarded due to missing values or insufficient confidence in the data, the resulting selection of 20 full round-trips are considered historically representative for a range of normal operations. As illustrated by Figure 10, significant deviations from the timetable can be observed in the time spent at port due to delays or changes to the route, for example, as a consequence of shifting and unfavourable weather conditions.
Figure 10.
Variability of the time spent at port for 124 complete round-trips from Coastal Express vessels in operation today. The colours indicate the total time spent at port for entire round-trips. These cumulative times illustrate a theoretical upper bound for the time available for charging. Data was selected from the winter and spring seasons in the periods of 1 January–31 May 2022 and 1 November 2022–31 May 2023.
Such a scenario can be studied to showcase how real-world delays and time deviations affect battery-electric operation for a given charging infrastructure and battery capacity. We focus on the winter–spring schedule and use the same input parameters as scenario A for battery capacity, energy demand, and charging infrastructure capacity. Figure 11 illustrates the sensitivity of the SoC with respect to real-life delays, e.g., late arrivals in Trondheim (northbound), Bodø (northbound), or Svolvær (southbound) can cause substantial deviations from the official schedule. Such delays may result in significantly reduced time for charging in some ports and corresponding need for supplying energy from the backup energy source to complete the following legs. A full sensitivity analysis of how real-life delays for the Coastal Express will affect the achievable amount of battery-electric operation is beyond the scope of this paper, and will be the subject of upcoming work.
Figure 11.
Range of simulated SoC values for the Coastal Express route using 20 complete historic round-trip schedules from AIS data in the periods of 1 January–31 May 2022 and 1 November 2022–31 May 2023 (light blue bands). This corresponds to the winter–spring timetable. The AIS-based schedules are compared with the winter–spring timetable without any deviation or delays (dark blue line). Input parameters for battery capacity, energy demands, and charging power capacities are otherwise equal to scenario A(b). Dotted line indicate the battery capacity.
3.3.6. Percentage of Battery-Electric Energy
For a broad overview of battery and charging infrastructure options for one timetable and energy demand, the ratio of battery-electric operation can be visualised for different battery capacities and total charger capacities. Figure 12 shows this for two different energy demand datasets. The charging infrastructure options are characterized by the total installed charging power, i.e., the sum of the installed charging power in each port. The percentage plotted for each value of total installed charging capacity is the maximum percentage among all charging infrastructure options that amount to the same total installed charging power. Both plots show the same general pattern, highlighting two trends:
Figure 12.
The ratio of energy supplied from the battery as a function of battery capacities and charging infrastructure options, for (a) average energy demand and (b) high energy demand, using the winter–spring timetable.
- 1.
- Below a certain onboard battery capacity, increasing the charging power does not yield any significant improvements in the percentage of battery-electric operation. For increases in charging power to have an effect, the battery capacity needs to be sufficiently large. The same applies vice versa: an increase in battery capacity only impacts the ratio if enough charging power is available.
- 2.
- The final increments in the percentage are the most costly to achieve: as the percentage increases, the additional battery capacity and charging infrastructure required for further improvements grow significantly (the distance between the traces indicating a 0.05 rise in the ratio is expanding towards the upper right corner), while initial increases can be achieved with relatively small additional investments.
4. Discussion
This section discusses the applicability and limitations of the charging model introduced in Section 2 and the interpretation of the results from the case study in Section 3.
4.1. Model Evaluation
In this section, the charging model structure and its implications are discussed.
4.1.1. Energy Demand as a Parameter
The calculation of the energy demand is decoupled from the charging model and must be conducted independently before running the charging model. One benefit of this is reduced computation time for simulating different scenarios. While energy calculations may be time consuming, the polynomial input structure allows for efficient calculation of the energy demand depending on the timetable. Another advantage of this separation is modularity: both the charging model and energy demand calculations can evolve independently without requiring interdependent updates.
As the charging model accepts the energy demand data as a parameter, we are effectively choosing assumptions about the vessel and the sailing environment by selecting a certain dataset: both vessel characteristics (like size, systems, and design) and weather including oceanographic parameters like waves, tides, and currents impact the energy demand of the vessel. Simulating the same scenario for different datasets therefore allows us to compare different technologies or different environments.
4.1.2. Battery Loss Approximation
The charging model accepts functions for approximating battery losses during charging and discharging. These functions are used during the simulation when the losses are calculated, and can take available information from the current state of the charging model as input for loss approximation. Available information includes the duration of the charging or discharging phase as well as the current state of charge. However, the charging model works with a linear average power for both the charging and discharging phases. Consequently, the loss approximation can be based on average power only, and the power delivered to or by the battery at any given point in time cannot be taken into account when calculating the losses.
4.1.3. Charging and Discharging Power
The charging model does not take into account charging profiles, but assumes linear charging and discharging of the battery, where charging always occurs at maximum power. In practice, charging power is typically reduced when approaching fully charged battery. However, the C-rate of batteries with a large storage capacity compared to the maximum charging power will be low at full charging power. In this study, we therefore assume that the simplification of the charging profile to a linear profile is reasonable to analyse charging infrastructure and battery requirements. However, different charging profiles may need to be taken into account in other analyses.
4.1.4. Battery Gross Capacity
The charging model is treating the given battery capacity as the net capacity of the battery, i.e., the capacity that is available for use during daily operation. Commonly, battery producers provide a recommended minimum and maximum SoC that should not be surpassed in order to ensure efficient operation and prevent premature ageing. Additionally, batteries degrade through ageing and cycling, such that capacity will be less at the end of the defined lifetime. The gross capacity required to provide the respective net capacity throughout the planned lifetime of the battery will therefore be larger than the net capacity used in the charging model, and can be calculated as a post-processing step. However, ageing mechanisms in battery systems are complex and differ for different battery systems. Estimating the corresponding gross capacity therefore requires detailed knowledge of the specific battery system and cells.
In this work, we therefore chose to keep battery modelling and calculation of the required gross battery capacity separate from the charging model. For the case study at hand, battery modelling is out of the scope for this work. However, the charging model simulation can provide the battery cycling profile, among other parameters, as an input to gross capacity calculation. Additionally, peak power values may be relevant. These are typically not direct outputs from hydrodynamic simulations, but depend rather on decisions in the design of the vessel and propulsion system.
4.1.5. Battery Energy Density in Design
In the charging model, the energy demand and the battery capacity are separate input parameters. However, depending on how the energy demand parameter is used, this represents a simplification of dependencies: the battery capacity directly impacts weight and space requirements on board, which in turn may impact the vessel’s energy demand. In some cases, the vessel’s draft is limited by certain passages in the route, such that changes in battery weight have to be counteracted by other changes in the ship design to keep the same draft. Nevertheless, the vessel’s vertical centre of gravity may be impacted, changing the vessel’s behaviour in waves, among other effects. The true energy demand is therefore impacted by the size of the battery. If the charging model is used as described above (see Section 4.2), setting the energy demand per leg to a certain threshold that has to be supplied from battery and chargers, this has no impact on the simulation results, as the zero-emission threshold does not change in dependence of the battery capacity. If the model is used for statistical analysis of trips for which the energy demand is simulated for the specific vessel design, the battery weight and size may introduce a small error to the result.
4.1.6. Cost Estimation
The presented methodology focuses on exploring technical requirements for reaching different zero-emission targets, as opposed to installation and operational expenses. Cost estimation would require a thorough techno-economic analysis that includes detailed assessments of economic and societal factors. This should also include the possibility of sharing grid capacity or charging infrastructure with other users. Case-specific battery and energy costs also need to be taken into account. Due to the focus on battery capacity and charging infrastructure requirements in this work, the charging model therefore does not provide a cost analysis. It can, however, be extended to assign costs to different alternatives in the future.
4.2. Targets for Zero-Emission Operation
The Norwegian Coastal Route is governed by a public tender. Although the future tender criteria are not known at the time of writing this paper, they will likely require low-emission operation. For example, this goal can be defined by requiring a certain percentage of the total energy demand to be supplied from battery and chargers or other zero-emission energy sources. However, the achievability of a criterion set like this depends on weather conditions as well as logistic challenges like unavailable chargers or skipped port calls. As these are not known at the time of battery and charger installation, fulfilling the set criterion can be quantified by a probability of success depending on predictions, but is not guaranteed with a certain infrastructure and energy system design.
Alternatively, the tender can specify a fixed zero-emission energy threshold for normal operation. This threshold represents the highest energy demand per leg or round-trip that must be possible to supply from the battery. Trips that require more energy than this or experience other irregularities are treated as exceptional cases and may use the backup energy source. This approach separates normal operation from extraordinary conditions such as bad weather, route changes, unavailable chargers, or skipped port calls, and battery and charging infrastructure only need to be sized for the defined normal cases.
The charging model is best suited for analysing battery and charging infrastructure requirements for a fixed zero-emission energy threshold per sailing leg. The combinations of battery and charging infrastructure that yield full battery-electric operation in the charging model simulation guarantee meeting the zero-emission criterion in real-world conditions.
In order to evaluate realistic energy thresholds for each leg in the presented case study, we used the energy demand for the Sea Zero ship design, simulated for weather data from 2019. Both the average energy demand and a higher threshold where analysed, with the high energy demand representing the worst case to be supplied from battery and chargers. Any higher energy demands or changes in route and port calls are considered outside of normal operation. It is important to note that the energy demands for the sailing legs are simulated independently. Thus, the combination of all legs that are simulated based on the 90th percentile energy demand for each leg does not statistically correspond to the 90th percentile of the total round-trip energy demand. However, if respective input data for timetable and energy demand is given, the charging model can be used for a statistical analysis of a representative set of round-trips. As an alternative to setting a fixed zero-emission energy threshold per leg, a set emission goal for a complete round-trip journey requires a model structure that also takes into account correlations and dependencies between consecutive legs.
4.3. Case Evaluation
Using the charging model presented in this paper, the case study demonstrates the sensitivity of the required battery and charging infrastructure to the ship’s schedule. The installed charging power per port and the size of the ship’s battery are both strongly affected by the duration of the individual stays and the distance between consecutive charging ports. In this study, we have applied the timetable used in 2022 for the Coastal Express. This timetable is not optimized for battery-electric operation. With a zero-emission Coastal Express, making adjustments to the timetable to accommodate the needs of battery-electric operation can potentially reduce the required size of the battery and the amount of charging power required throughout the network. The charging model can aid this planning process, and can ultimately contribute to reduced costs for the project.
The AIS analysis in scenario E shows that historically, one can expect significant deviations from the timetable also for normal operation. For a future battery-electric ship, such deviations may result in reduced time available for charging, and it will be even more important to thoroughly plan the journey ahead based on weather forecasts, as well as possibly introducing some charging buffer capacity in selected ports to account for late arrivals.
Scenario C includes batteries of up to 80 MWh net capacity. Although the ship designed within the project was originally optimized for the space and weight requirements of a smaller battery (72.4 MWh gross capacity; about 58 MWh net capacity), it may be possible to include larger batteries at the beginning of the next tender period for the Coastal Route. Importantly, the energy density per space and weight of a battery has been continuously increasing with new developments in the past years, and it is reasonable to assume that this trend continues. Therefore, larger capacities may be possible with small adjustments.
However, the weight of the ship, impacted among other factors by the battery weight, affects the energy demand indirectly through the ship’s hydrostatics and hydrodynamics. In the studied case, the ship’s draught is a fixed design constraint necessary to allow for operation in particular ports along the route. Hence, if a larger and heavier battery is chosen, the ship designer will have to modify the general arrangement such that the hydrostatic properties of the ship, in particular, the displacement and draught, remain unchanged. Changing the general arrangement could lead to modifications in the ship’s hydrodynamics, in particular, the metacentric height (GM) affecting the motions of the ship and its added resistance in waves. A preliminary study showed that the effects of a small GM modification on the total power demand are marginal. However, it is to be expected that in other cases, hull redesign, a new hydrodynamic model, and new simulations could be needed if battery weight and volume change significantly compared to the initial assumptions during the optimization process.
In the presented case, we used a fixed 2.5% loss factor to approximate losses occurring within the battery during charging and discharging. This is estimated to be representative for a new battery system. However, due to ageing effects, losses will increase over time, and the assumed factor may underestimate losses for a battery system approaching end of design life. Depending on the goal of the simulation, it may therefore be relevant to choose loss factors representative for beginning of life, end of design life, or after a certain timespan or amount of cycles. Loss factors should also be representative for the expected operation conditions of the battery system, including especially temperature and cooling arrangement.
Although limited to a certain range, the results show a clear trade-off between battery capacity and total installed charging power (see Table 2 and Figure 12). The prioritisation of possible combinations depends on economic and other case-specific evaluations outside of the scope of this work. One criterion that may play a role is the number of ships operating the Coastal Route using the same charging infrastructure. If there is only one ship with a battery installed, it may be advantageous to invest in a large battery in order to keep charging capacity low. If more ships are fitted with batteries, smaller batteries may reduce the costs, although the charging power has to be increased. Furthermore, grid limitations as well as local conditions have to be taken into account. This work therefore focusses on possible solutions as opposed to their implementation.
4.4. Future Research
Based on the results and learnings found in this work, we propose possible future research directions as follows.
For usage of the model as a tool for statistical analysis of battery-electric operation in historic conditions in addition to the proposed method for dimensioning according to minimum zero-emission targets, we suggest focusing on:
- 1.
- Expanding the statistical basis for schedule variability by using larger historic AIS datasets and applying systematic uncertainty quantifications.
- 2.
- Including weather correlations between subsequent legs in the energy demand model by dependently simulating the energy demand of each leg for continuous operation over a longer timespan.
- 3.
- Running a statistically significant number of round-trip simulations in the charging model using, e.g., Monte Carlo simulations to generate distributions of key indicators such as percentage of battery-electric operation and minimum SoC during critical legs.
These improvements would enable the model to report not only scenario-based point estimates but also confidence intervals for key outcomes such as required net battery capacity (e.g., 52–54 MWh for average-demand scenarios, 56–58 MWh for high-demand scenarios), required charging power capacity in each port, probability of full battery-electric operation, and expected statistical SoC trajectories for different schedules.
Furthermore, results from other, parallel work on the Coastal Route case can be included to further specialise the charging model to the case at hand. This includes the following:
- 1.
- Development of charger components or adoption of standardized charging technologies.
- 2.
- Controlled-level experiments of on-board energy subsystems and maritime batteries.
- 3.
- Port–grid studies on available capacity, local conditions, and infrastructure sharing.
This can increase the trust in the scenario results and support its application to future tenders and to other long-distance battery-electric vessel routes.
Finally, depending on the use case or target, the following improvements of the model are relevant:
- 1.
- Energy demand calculation can be refined by including sea currents and improved wind–wave interactions. Updated energy demand polynomials will help reduce systematic biases identified in the present study, particularly for sailing legs commonly experiencing stronger currents and harsher weather situations such as around Stad, between Bodø and Lofoten, and between Hammerfest and Kirkenes in the case study at hand.
- 2.
- Battery and charging sub-models can be adapted to represent specific battery systems or components and their characteristics, replacing the current linear charging profile approximation with experimentally verified charging curves, temperature-dependent losses, and SoC-dependent power limits. This may provide relevant information for the design of electrical components onboard and onshore. However, simulating with varying power profiles requires larger changes to the round-trip simulation in the charging model in order to capture more finely granulated time steps.
- 3.
- An analysis of cost related to charging can be included in the charging model. This could entail investment costs as well as operational costs for charging and electricity. For each use case, this requires careful analysis of specific conditions and pricing systems.
5. Conclusions
This paper has introduced a method for analysing different alternatives for charging infrastructure configurations and battery capacities for battery-electric vessels along with their impacts on battery-electric operation. The presented model is parametrised by the timetable and energy demand of the vessel during the different sailing legs and port stays, as well as the onboard battery capacity, charger locations, and charger power ratings. Furthermore, the methodology was demonstrated for the Norwegian Coastal Express, working towards zero-emission operation for large passenger vessels serving 34 ports along the Norwegian coast on a regular 11-day round trip. For this case study, the energy demand was derived from ship model simulations in weather and sailing conditions measured in 2019.
The presented model has provided insights into the consequences of different choices for battery sizing and charging infrastructure realization for a new generation of vessels serving the Norwegian Coastal Express route. However, the presented methodology is by no means restricted to this case, and we expect it to be useful for similar electrification projects.
Author Contributions
Conceptualization, K.S. and S.S.; Methodology, K.S., O.M., S.S., E.G.T., B.B.S., A.B. and O.M.; Software, K.S., S.S., B.B.S., O.M. and A.B.; Analysis, K.S., S.S., E.G.T., B.B.S., A.B. and O.M.; Data Curation, S.S., E.G.T. and A.B.; Writing—Original Draft Preparation, K.S., S.S., E.G.T., B.B.S., A.B. and O.M.; Writing—Review and Editing, K.S., S.S., E.G.T., B.B.S., A.B. and O.M.; Visualization, K.S., S.S., E.G.T., B.B.S. and O.M.; Supervision, K.S. All authors have read and agreed to the published version of the manuscript.
Funding
This research was funded by the Research Council of Norway through the Green Platform project Sea Zero, project no. 340898.
Data Availability Statement
The dataset on energy demand is available from the authors on request.
Acknowledgments
The presented work was carried out within the Green Platform project Sea Zero, supported by the Research Council of Norway. Sea Zero also received support from DNV, Jotun, Cavotec Microcontrol, Vard Design, Sjøfartsdirektoratet, Teknotherm Marine, Corvus Energy, Samfunnsbedriftene, Bergen Havn, Sustainable Energy, Plug, and Brunvoll Maritime Group, for which we are grateful.
Conflicts of Interest
Klara Schlüter, Brage Bøe Svendsen and Olve Mo are employed by SINTEF Energy Research AS, Erlend Grytli Tveten and Severin Sadjina are employed by SINTEF Nordvest AS, Anne Bruyat is employed by SINTEF Ocean AS. They declare that the research was conducted in the absence of any commercial or financial relationships that could be construed as a potential conflict of interest.
References
- Hurtigruten. The Coastal Express Voyage. 2026. Available online: https://www.hurtigruten.com/en/about-us/voyages/coastal-express (accessed on 16 February 2026).
- Vard Group AS. Sea Zero Vessel Concept Illustration. Available online: https://www.vard.com/ (accessed on 26 February 2026).
- International Maritime Organization. 2023 IMO Strategy to Reduce GHG Emissions from Ships. 2023. Available online: https://www.imo.org/en/OurWork/Environment/Pages/2023-IMO-Strategy-on-Reduction-of-GHG-Emissions-from-Ships.aspx (accessed on 30 March 2026).
- The European Parliament and the Council of the European Union. Regulation (EU) 2023/1805 of the European Parliament and of the Council of 13 September 2023 on the Use of Renewable and Low-Carbon Fuels in Maritime Transport, and Amending Directive 2009/16/EC. 2023. Available online: https://eur-lex.europa.eu/legal-content/EN/TXT/?uri=CELEX%3A32023R1805 (accessed on 30 March 2026).
- Norwegian Ministery of Climate and Environment. Meld. St. 13: Norway’s Climate Action Plan for 2021–2030. 2021. Available online: https://www.regjeringen.no/en/dokumenter/meld.-st.-13-20202021/id2827405/?ch=1 (accessed on 30 March 2026).
- Hurtigruten. The Sea Zero Project. Available online: https://www.hurtigruten.com/en/about-us/sustainability/sea-zero (accessed on 6 November 2020).
- Alterskjær, A.; Bruyat, A.; Östman, A.; Dæhlen, J.; Mak, T.; Skjong, T.; Rødland, A.; Christiansen, G. Wind Propulsion for Hurtigruten’s future zero emission cruise vessels. In Proceedings of the RINA Wind Propulsion Conference, London, UK, 22–23 October 2024. [Google Scholar]
- Rabliås, Ø. Slik Kan to “Motsatte” Propeller Gjøre Skip mer Energieffektive. 2025. Available online: https://www.sintef.no/siste-nytt/2025/slik-kan-to-motsatte-propeller-gjore-skip-mer-energieffektive/ (accessed on 28 March 2025).
- Støa-Aanensen, N.; Schlüter, K.; Gabrielii, C.; Tveten, E.G.; Berg, T.A. Opportunities and Limitations in Norwegian Ports for Charging Infrastructure for an Electric Coastal Express; Project Memo AN 25.14.11; SINTEF Energy Research AS: Trondheim, Norway, 2025. [Google Scholar]
- Baerug, H.; Syvertsen, H.M.T.; Klusmeier, K.K.; Strand, H. Review of High Power Charging Solutions for Electric Vessels; Project Memo AN 24.14.101; SINTEF Energy Research AS: Trondheim, Norway, 2025; Available online: https://hdl.handle.net/11250/5319105 (accessed on 30 March 2026).
- Schlüter, K.; Tveten, E.G.; Sadjina, S.; Mo, O. Battery and Charging Infrastructure Sizing Method Applied to the Norwegian Coastal Express. In Proceedings of the Electric Vehicle Symposium (EVS38), Gothenburg, Sweden, 15–18 June 2025. [Google Scholar]
- Aksöz, A.; Asal, B.; Golestan, S.; Gençtürk, M.; Oyucu, S.; Biçer, E. Electrification in Maritime Vessels: Reviewing Storage Solutions and Long-Term Energy Management. Appl. Sci. 2025, 15, 5259. [Google Scholar] [CrossRef] [Scilit]
- Mærsk Mc-Kinney Møller Center for Zero Carbon Shipping. Understanding the Potential of Battery-Electric Propulsion for Cargo Vessels. 2024. Available online: https://www.zerocarbonshipping.com/publications/understanding-the-potential-of-battery-electric-propulsion-for-cargo-vessels (accessed on 30 March 2026).
- Ma, T.Y.; Fang, Y. Survey of charging management and infrastructure planning for electrified demand-responsive transport systems: Methodologies and recent developments. Eur. Transp. Res. Rev. 2022, 14, 36. [Google Scholar] [CrossRef] [Scilit]
- Guerrero-Silva, J.A.; Romero-Gelvez, J.I.; Aristizábal, A.J.; Zapata, S. Optimization and Trends in EV Charging Infrastructure: A PCA-Based Systematic Review. World Electr. Veh. J. 2025, 16, 345. [Google Scholar] [CrossRef] [Scilit]
- Li, J.; Chew, A.; Wang, H. Investigating state-of-the-art planning strategies for electric vehicle charging infrastructures in coupled transport and power networks: A comprehensive review. Prog. Energy 2024, 6, 042004. [Google Scholar] [CrossRef] [Scilit]
- Metais, M.O.; Jouini, O.; Perez, Y.; Berrada, J.; Suomalainen, E. Too much or not enough? Planning electric vehicle charging infrastructure: A review of modeling options. Renew. Sustain. Energy Rev. 2022, 153, 111719. [Google Scholar] [CrossRef] [Scilit]
- Havre, H.F.; Lien, U.; Ness, M.M.; Fagerholt, K.; Rødseth, K.L. Network design with route planning for battery electric high-speed passenger vessel services. Eur. J. Oper. Res. 2024, 315, 102–119. [Google Scholar] [CrossRef] [Scilit]
- Oyediran, D.; Thakur, J.; Khalid, M.; Baskar, A.G. Electrification of marinas in Stockholm: Optimizing charging infrastructure for electric boats. Energy 2024, 305, 132311. [Google Scholar] [CrossRef] [Scilit]
- Kunith, A.; Mendelevitch, R.; Goehlich, D. Electrification of a city bus network—An optimization model for cost-effective placing of charging infrastructure and battery sizing of fast-charging electric bus systems. Int. J. Sustain. Transp. 2017, 11, 707–720. [Google Scholar] [CrossRef] [Scilit]
- Bertucci, J.P.; Hofman, T.; Salazar, M. Joint optimization of charging infrastructure placement and operational schedules for a fleet of battery electric trucks. In Proceedings of the IEEE 2024 American Control Conference (ACC), Toronto, ON, Canada, 10–12 July 2024; pp. 2995–3000. [Google Scholar] [CrossRef] [Scilit]
- Balke, G.; Zähringer, M.; Schneider, J.; Lienkamp, M. Connecting the dots: A comprehensive modeling and evaluation approach to assess the performance and robustness of charging networks for battery electric trucks and its application to Germany. World Electr. Veh. J. 2024, 15, 32. [Google Scholar] [CrossRef] [Scilit]
- Vehlhaber, F.; Salazar, M. Electric aircraft assignment, routing, and charge scheduling considering the availability of renewable energy. IEEE Control Syst. Lett. 2023, 7, 3669–3674. [Google Scholar] [CrossRef] [Scilit]
- Karimi, S.; Zadeh, M.; Suul, J.A. Shore Charging for Plug-In Battery-Powered Ships: Power System Architecture, infrastructure, and Control. IEEE Electrif. Mag. 2020, 8, 47–61. [Google Scholar] [CrossRef] [Scilit]
- Wärtsilä Corporation. Marine Vessel Charging Systems. 2024. Available online: https://www.wartsila.com/marine/products/ship-electrification-solutions/shore-power/charging (accessed on 30 March 2026).
- Bucciarelli, M.; Paoletti, S.; Vicino, A. Optimal sizing of energy storage systems under uncertain demand and generation. Appl. Energy 2018, 225, 611–621. [Google Scholar] [CrossRef] [Scilit]
- Rosewater, D.M.; Copp, D.A.; Nguyen, T.A.; Byrne, R.H.; Santoso, S. Battery energy storage models for optimal control. IEEE Access 2019, 7, 178357–178391. [Google Scholar] [CrossRef] [Scilit]
- Norwegian Digitalisation Agency. Norwegian Licence for Open Government Data (NLOD) 2.0. Available online: https://data.norge.no/nlod/en/2.0 (accessed on 18 March 2026).
- Fathi, D.E.; Grimstad, A.; Johnsen, T.A.; Nowak, M.P.; Stàlhane, M. Integrated decision support approach for ship design. In Proceedings of the IEEE 2013 MTS/IEEE OCEANS-Bergen, Bergen, Norway, 10–13 June 2013; pp. 1–8. [Google Scholar] [CrossRef] [Scilit]
- Rabliås, Ø.; Kramer, J.; Bruyat, A.; Sauder, T.; Alterskjær, A. Vessel response in transient wind conditions for a zero emission cruise ship with wing sails. In Proceedings of the RINA Wind Propulsion Conference, London, UK, 17–18 February 2026. [Google Scholar]
- Britz, C. Le Navire Zéro-éMission à Voiles d’Hurtigruten à l’Analyse Fine de la modéLisation Hybride. 2025. Available online: https://www.meretmarine.com/fr/construction-navale/le-navire-zero-emission-a-voiles-d-hurtigruten-a-l-analyse-fine-de-la-modelisation-hybride (accessed on 28 March 2025).
- Rabliås, Ø.; Kramer, J. The importance of transverse second-order wave loads, a case study of a bulk carrier with wing sails in regular waves. In Proceedings of the 16th International Symposium on Practical Design of Ships and Other Floating Structures (PRADS), Ann Arbor, MI, USA, 19–23 October 2025. [Google Scholar]
- Ross, A.; Bruyat, A.; Aspelund, L.; Hassani, V.; Simanesew, A. Ship Manoeuvring Study of a Vessel Transiting a Ship Tunnel. In Proceedings of the ASME 2024 43rd International Conference on Ocean, Offshore and Arctic Engineering (OMAE), Singapore, 9–14 June 2024. [Google Scholar] [CrossRef] [Scilit]
- Fathi, D. Shipx Vessel Responses (Veres), Ship Motions and Global Loads, Users’ Manual; ShipX Vessel Responses (VERES); Marintek AS: Trondheim, Norway, 2004. [Google Scholar]
- Dæhlen, J.S.; Sandvik, E.; Rialland, A.; Lagemann, B. A Method for Evaluating Ship Concepts in Realistic Operational Scenarios using Agent-based Discrete-Event Simulation. In Proceedings of the 20th International Conference on Computer and IT Applications in the Maritime Industries (COMPI21), Mülheim, Germany, 8–9 August 2021; pp. 141–150. [Google Scholar]
- Norwegian Ministry of Climate and Environment. Press Release: Zero-Emission Requirements for Passenger Ships in World Heritage Fjords. 2025. Available online: https://www.regjeringen.no/en/whats-new/zero-emission-requirements-for-passenger-ships-in-world-heritage-fjords/id3097475/ (accessed on 18 February 2025).
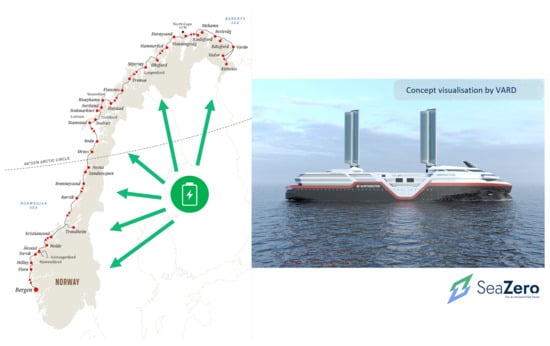
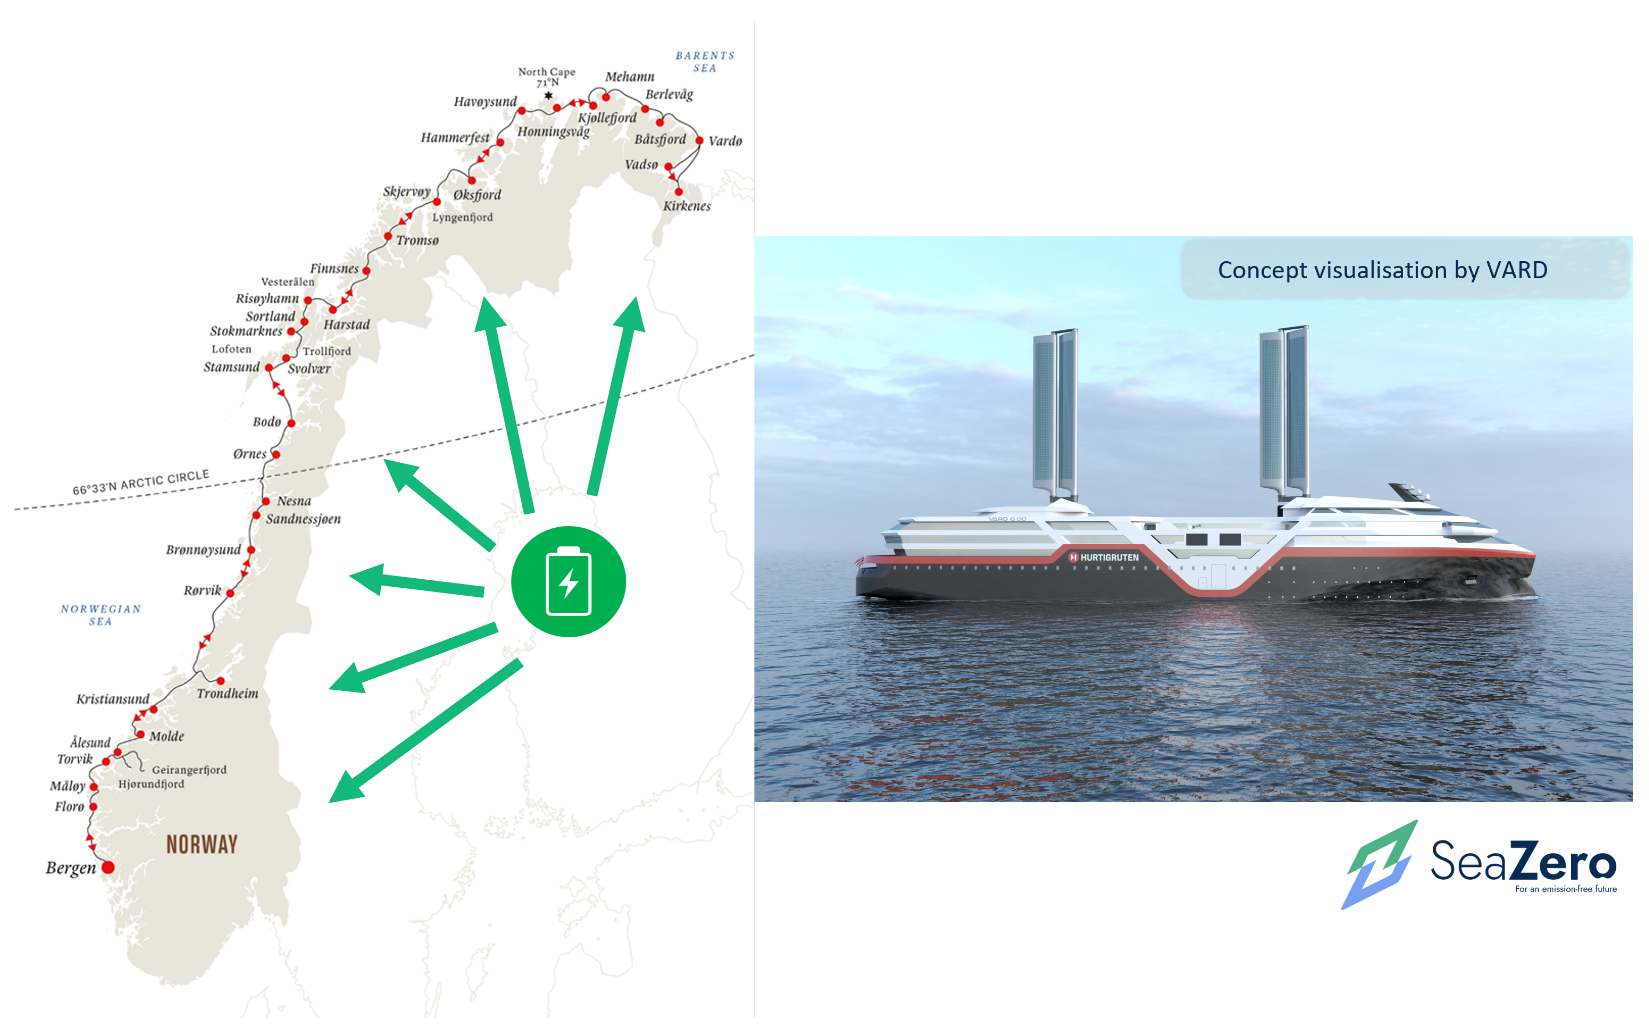
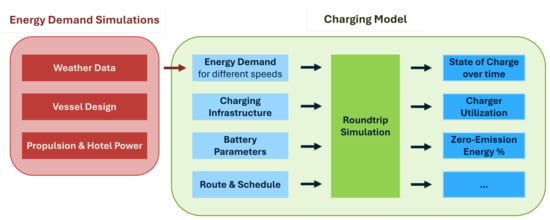
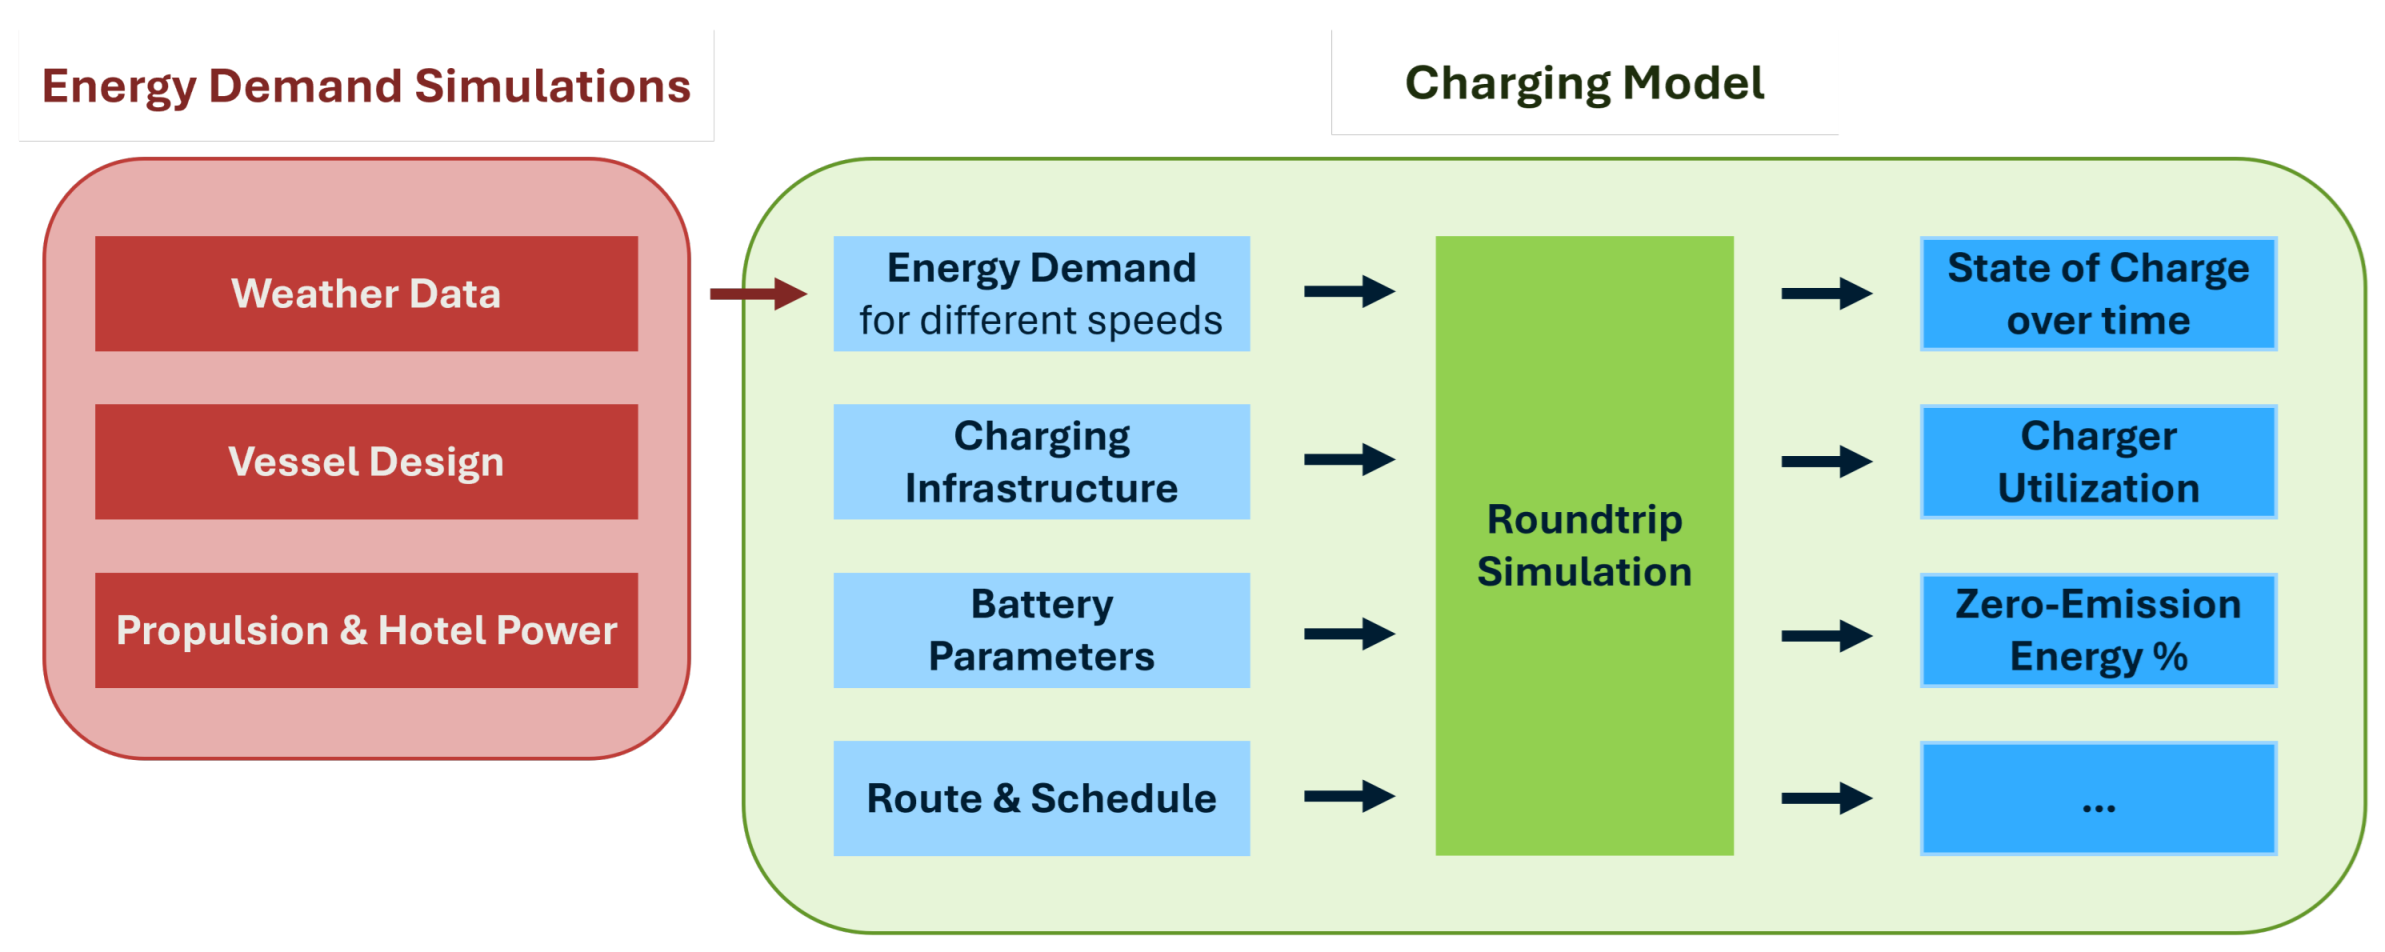
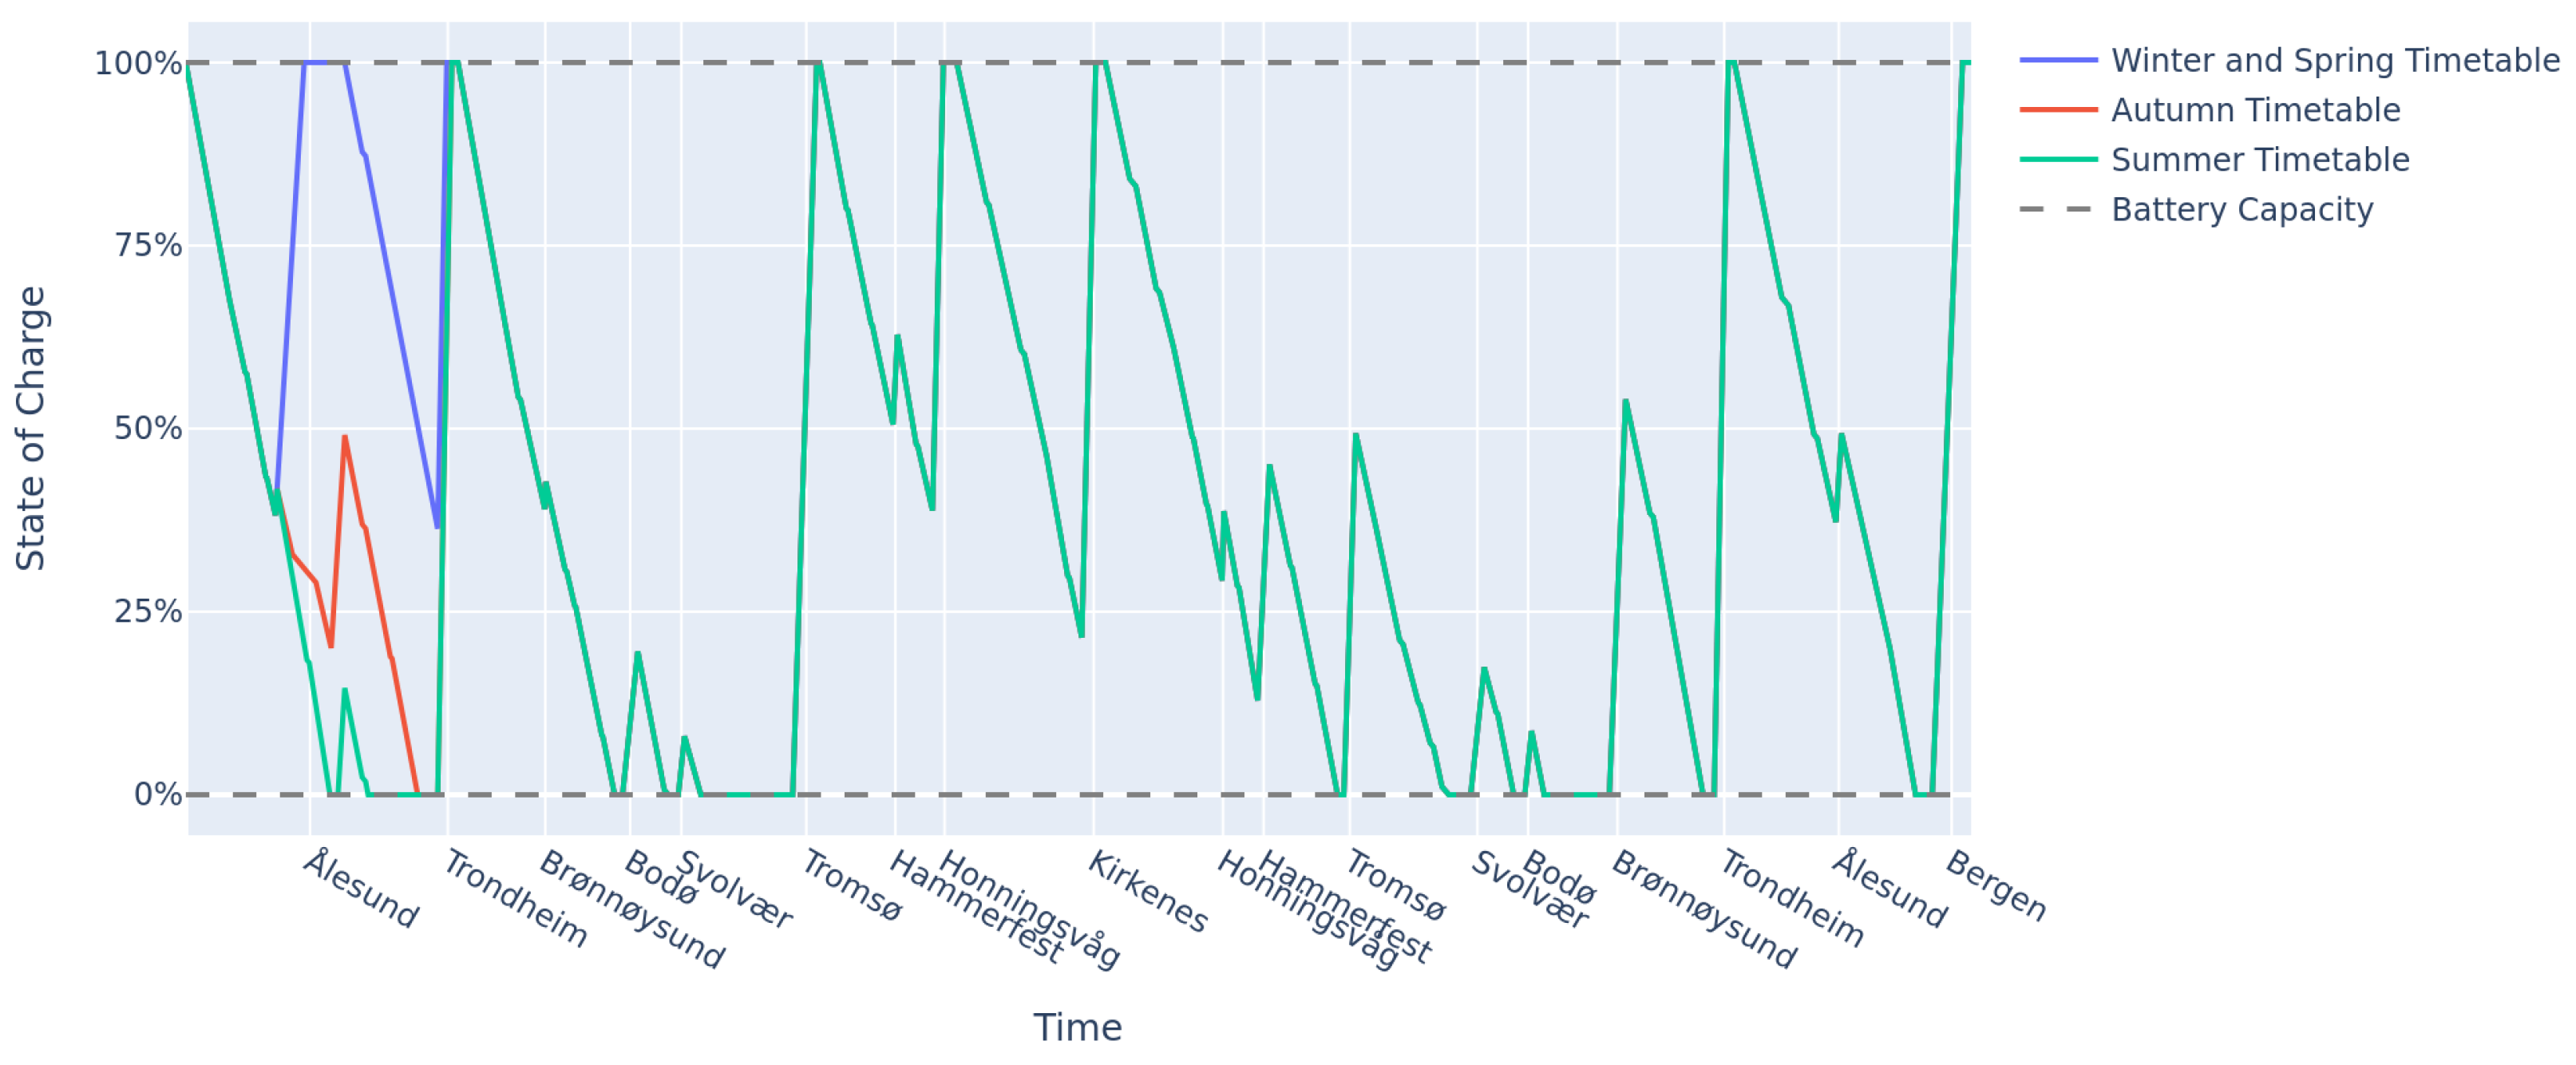
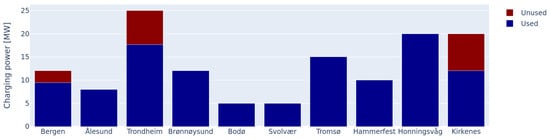
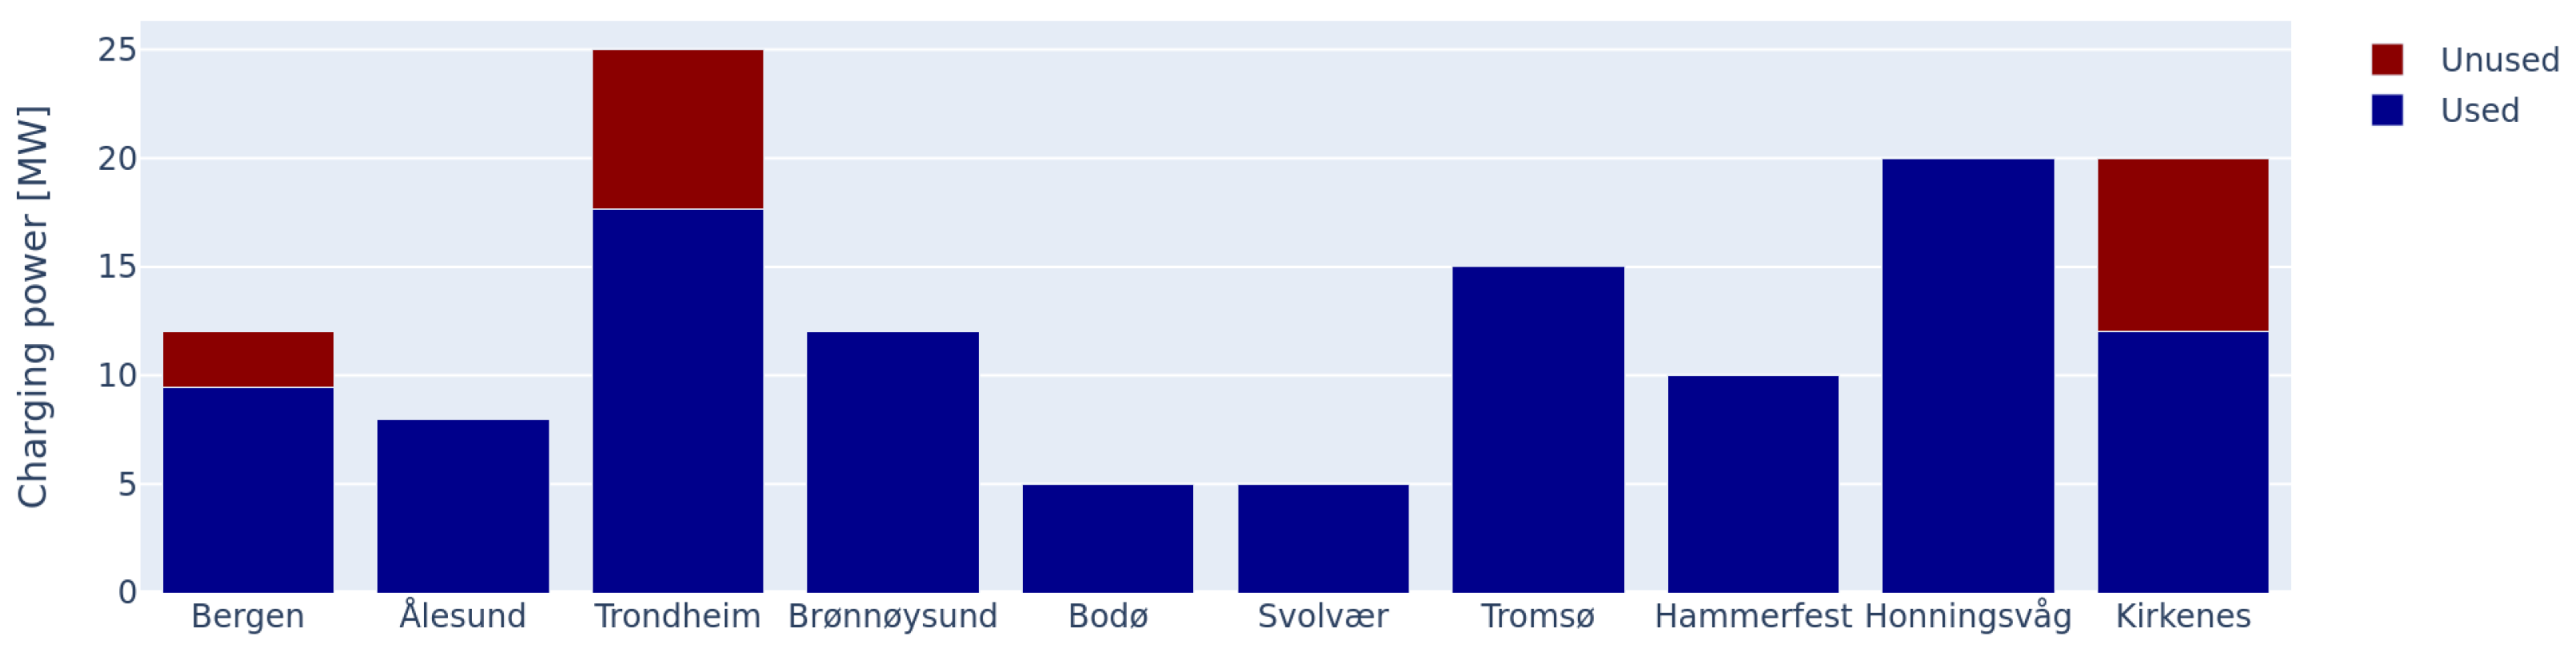
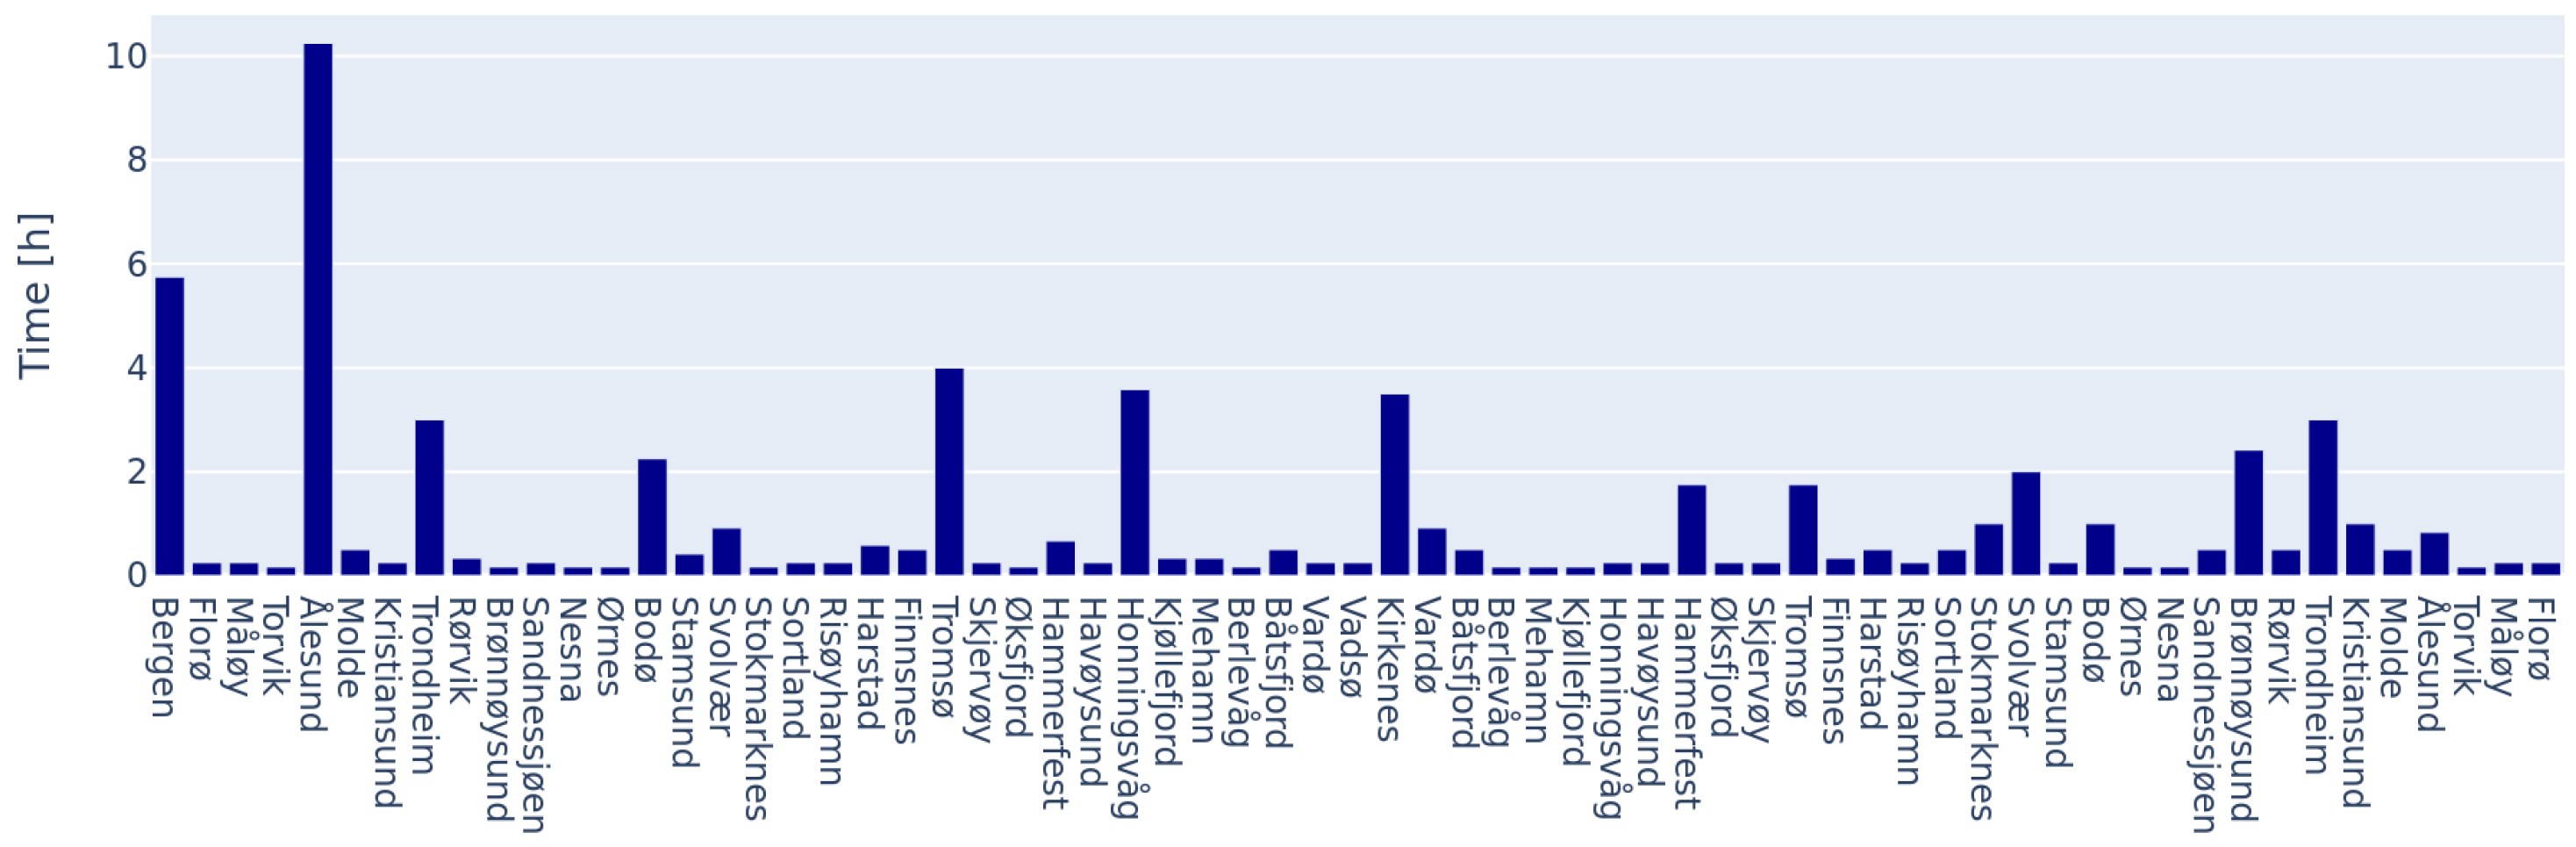
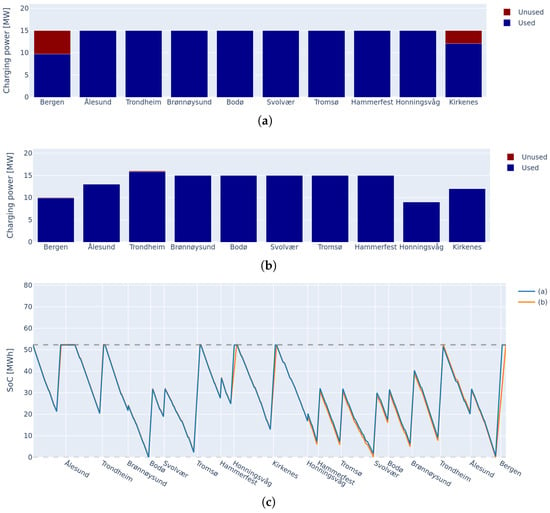
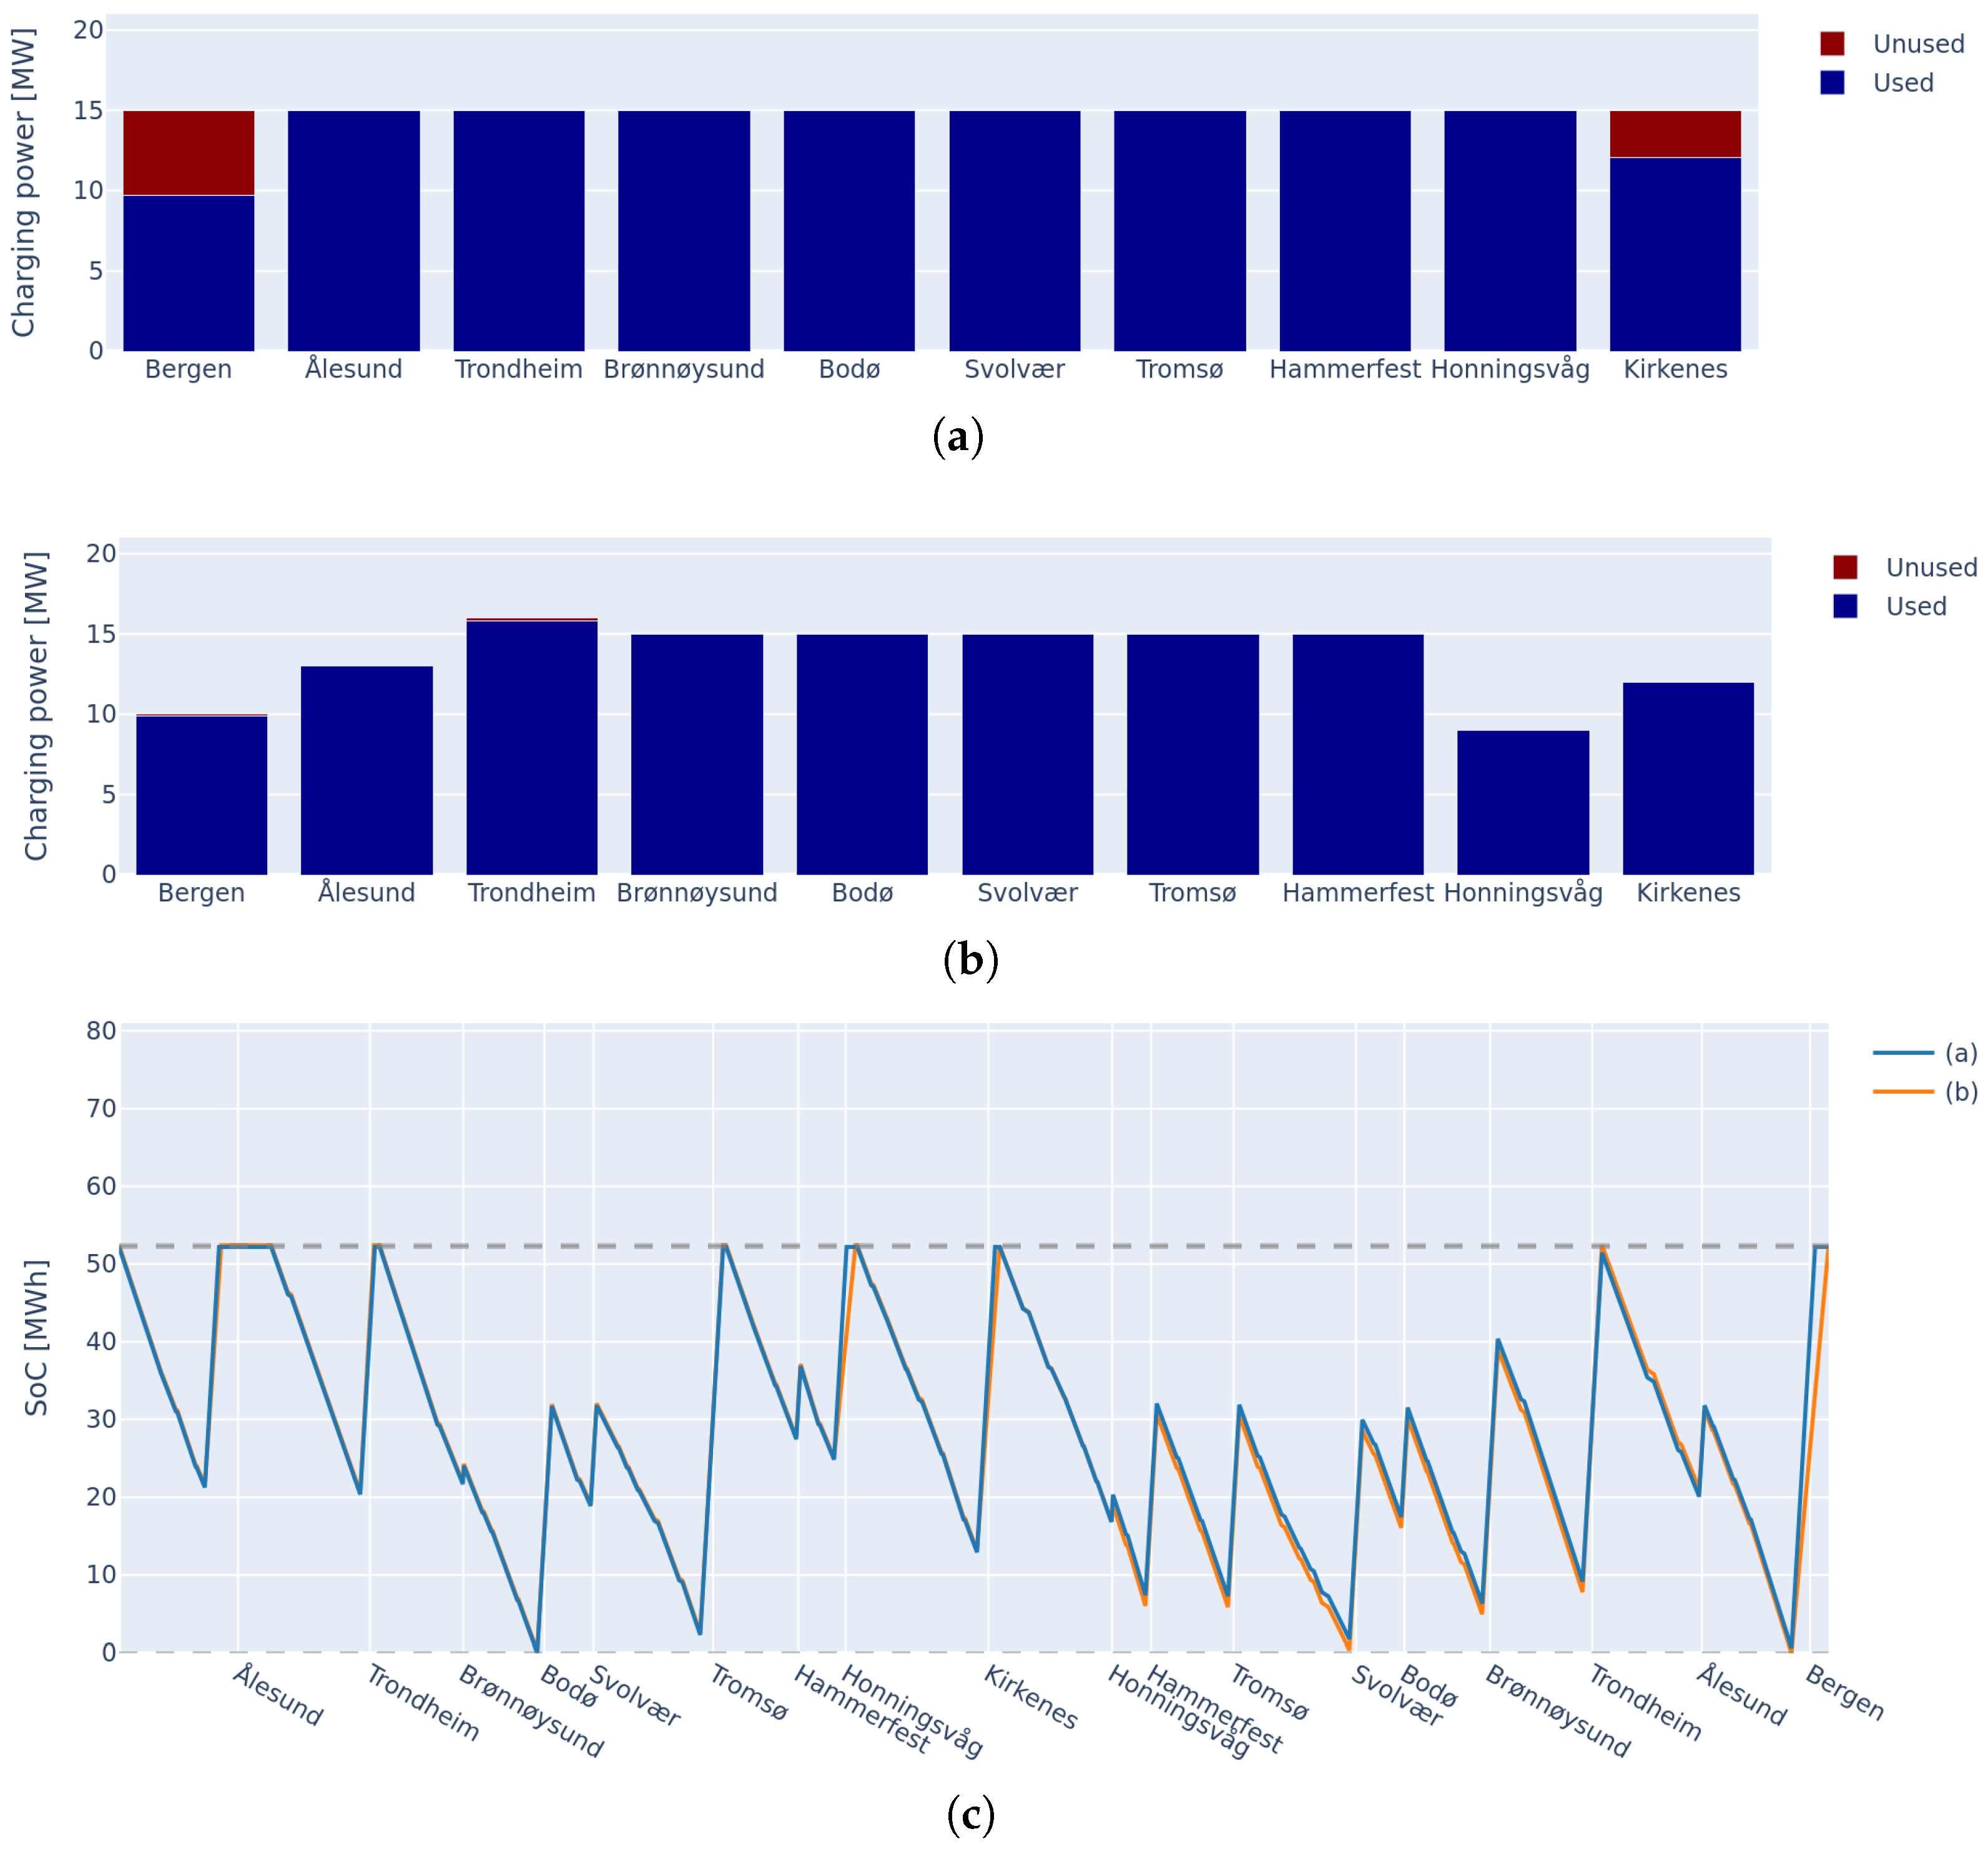
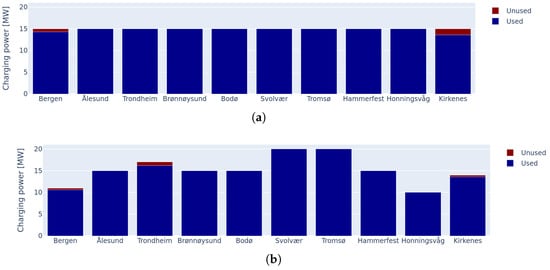
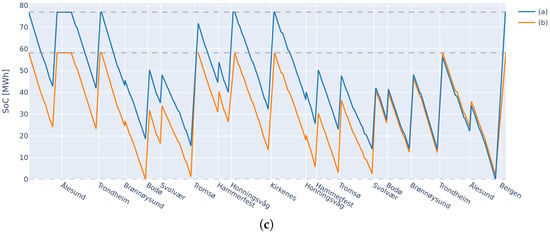
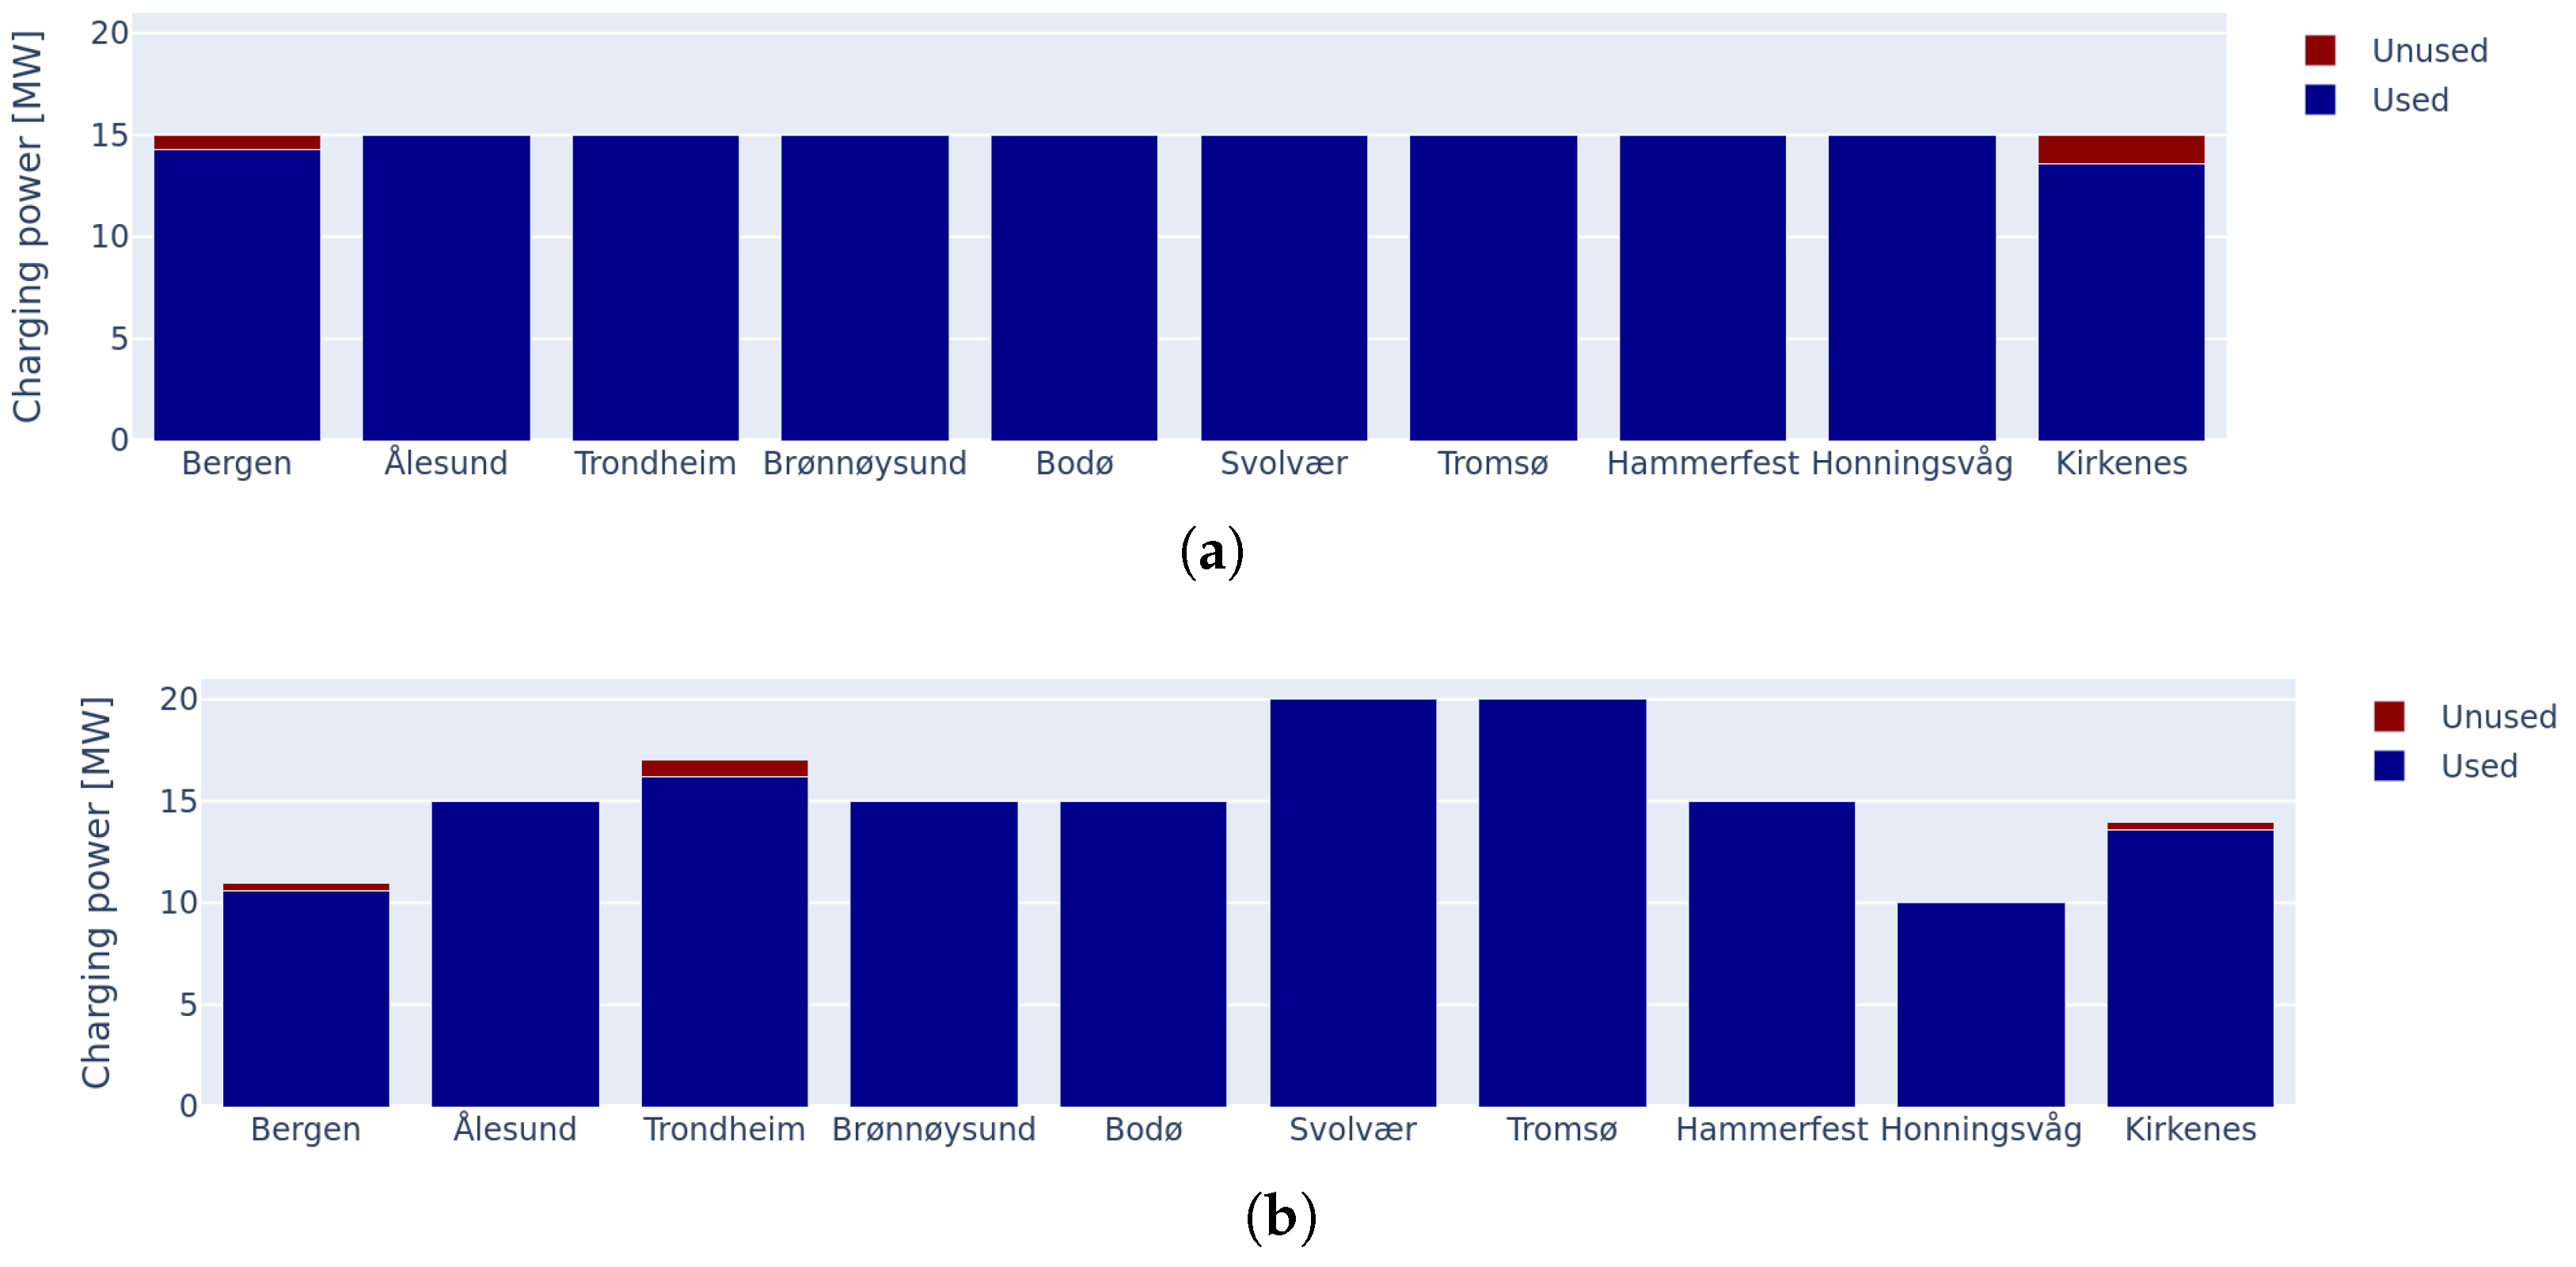
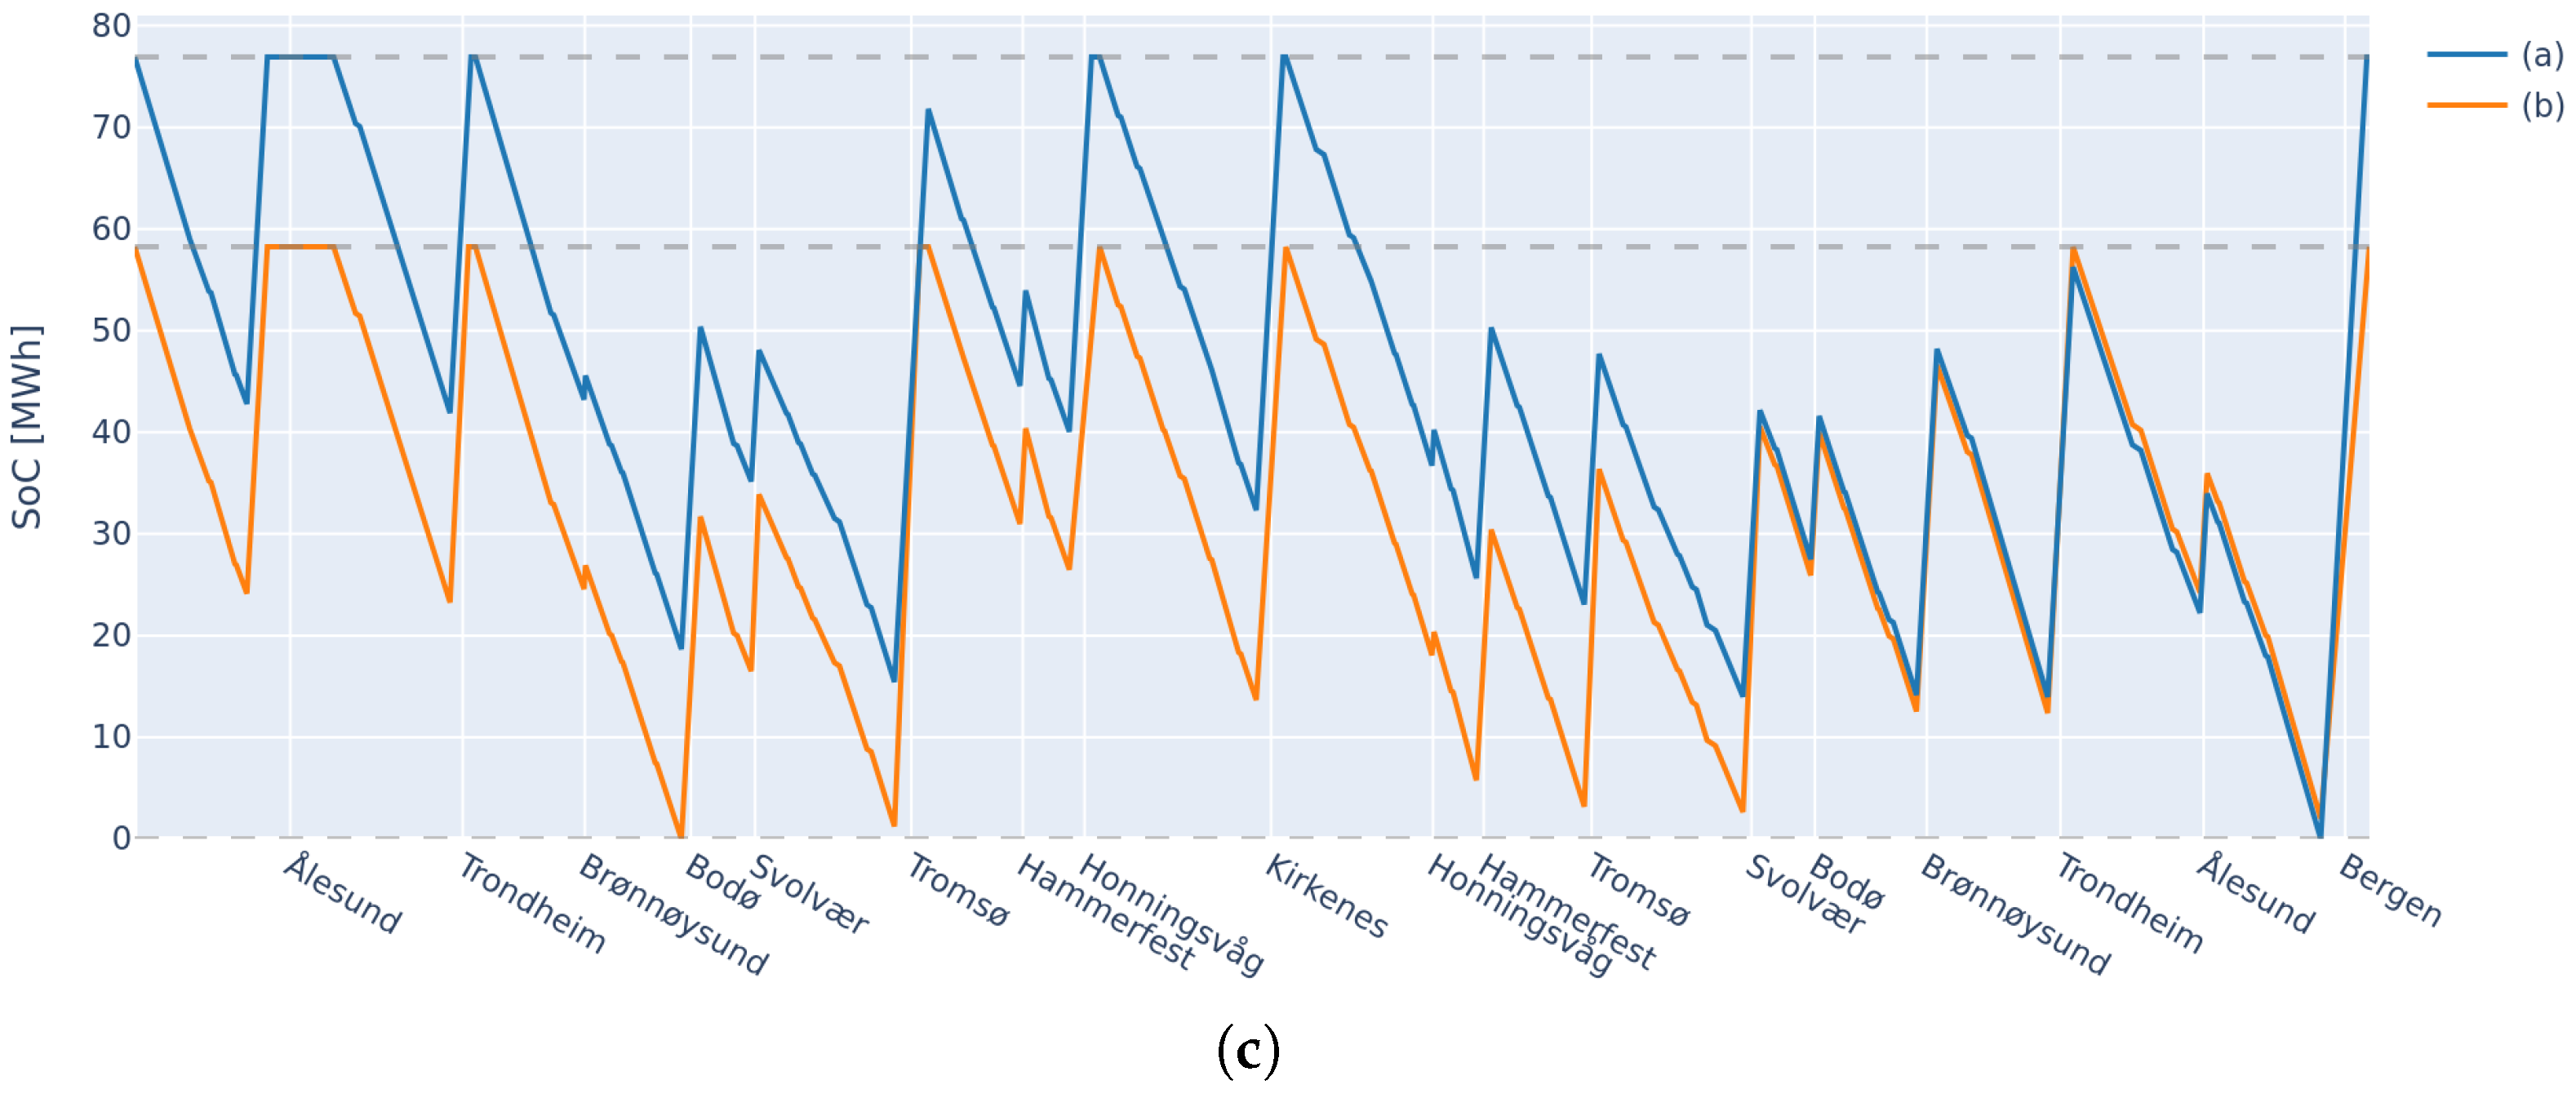
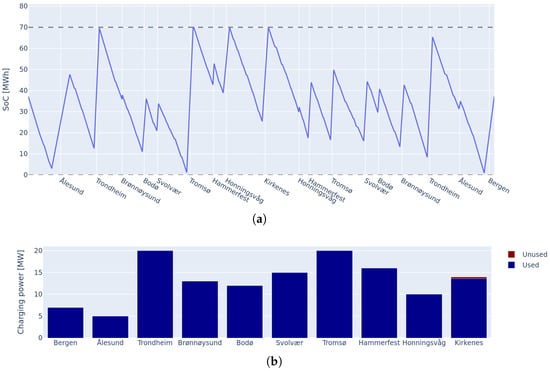
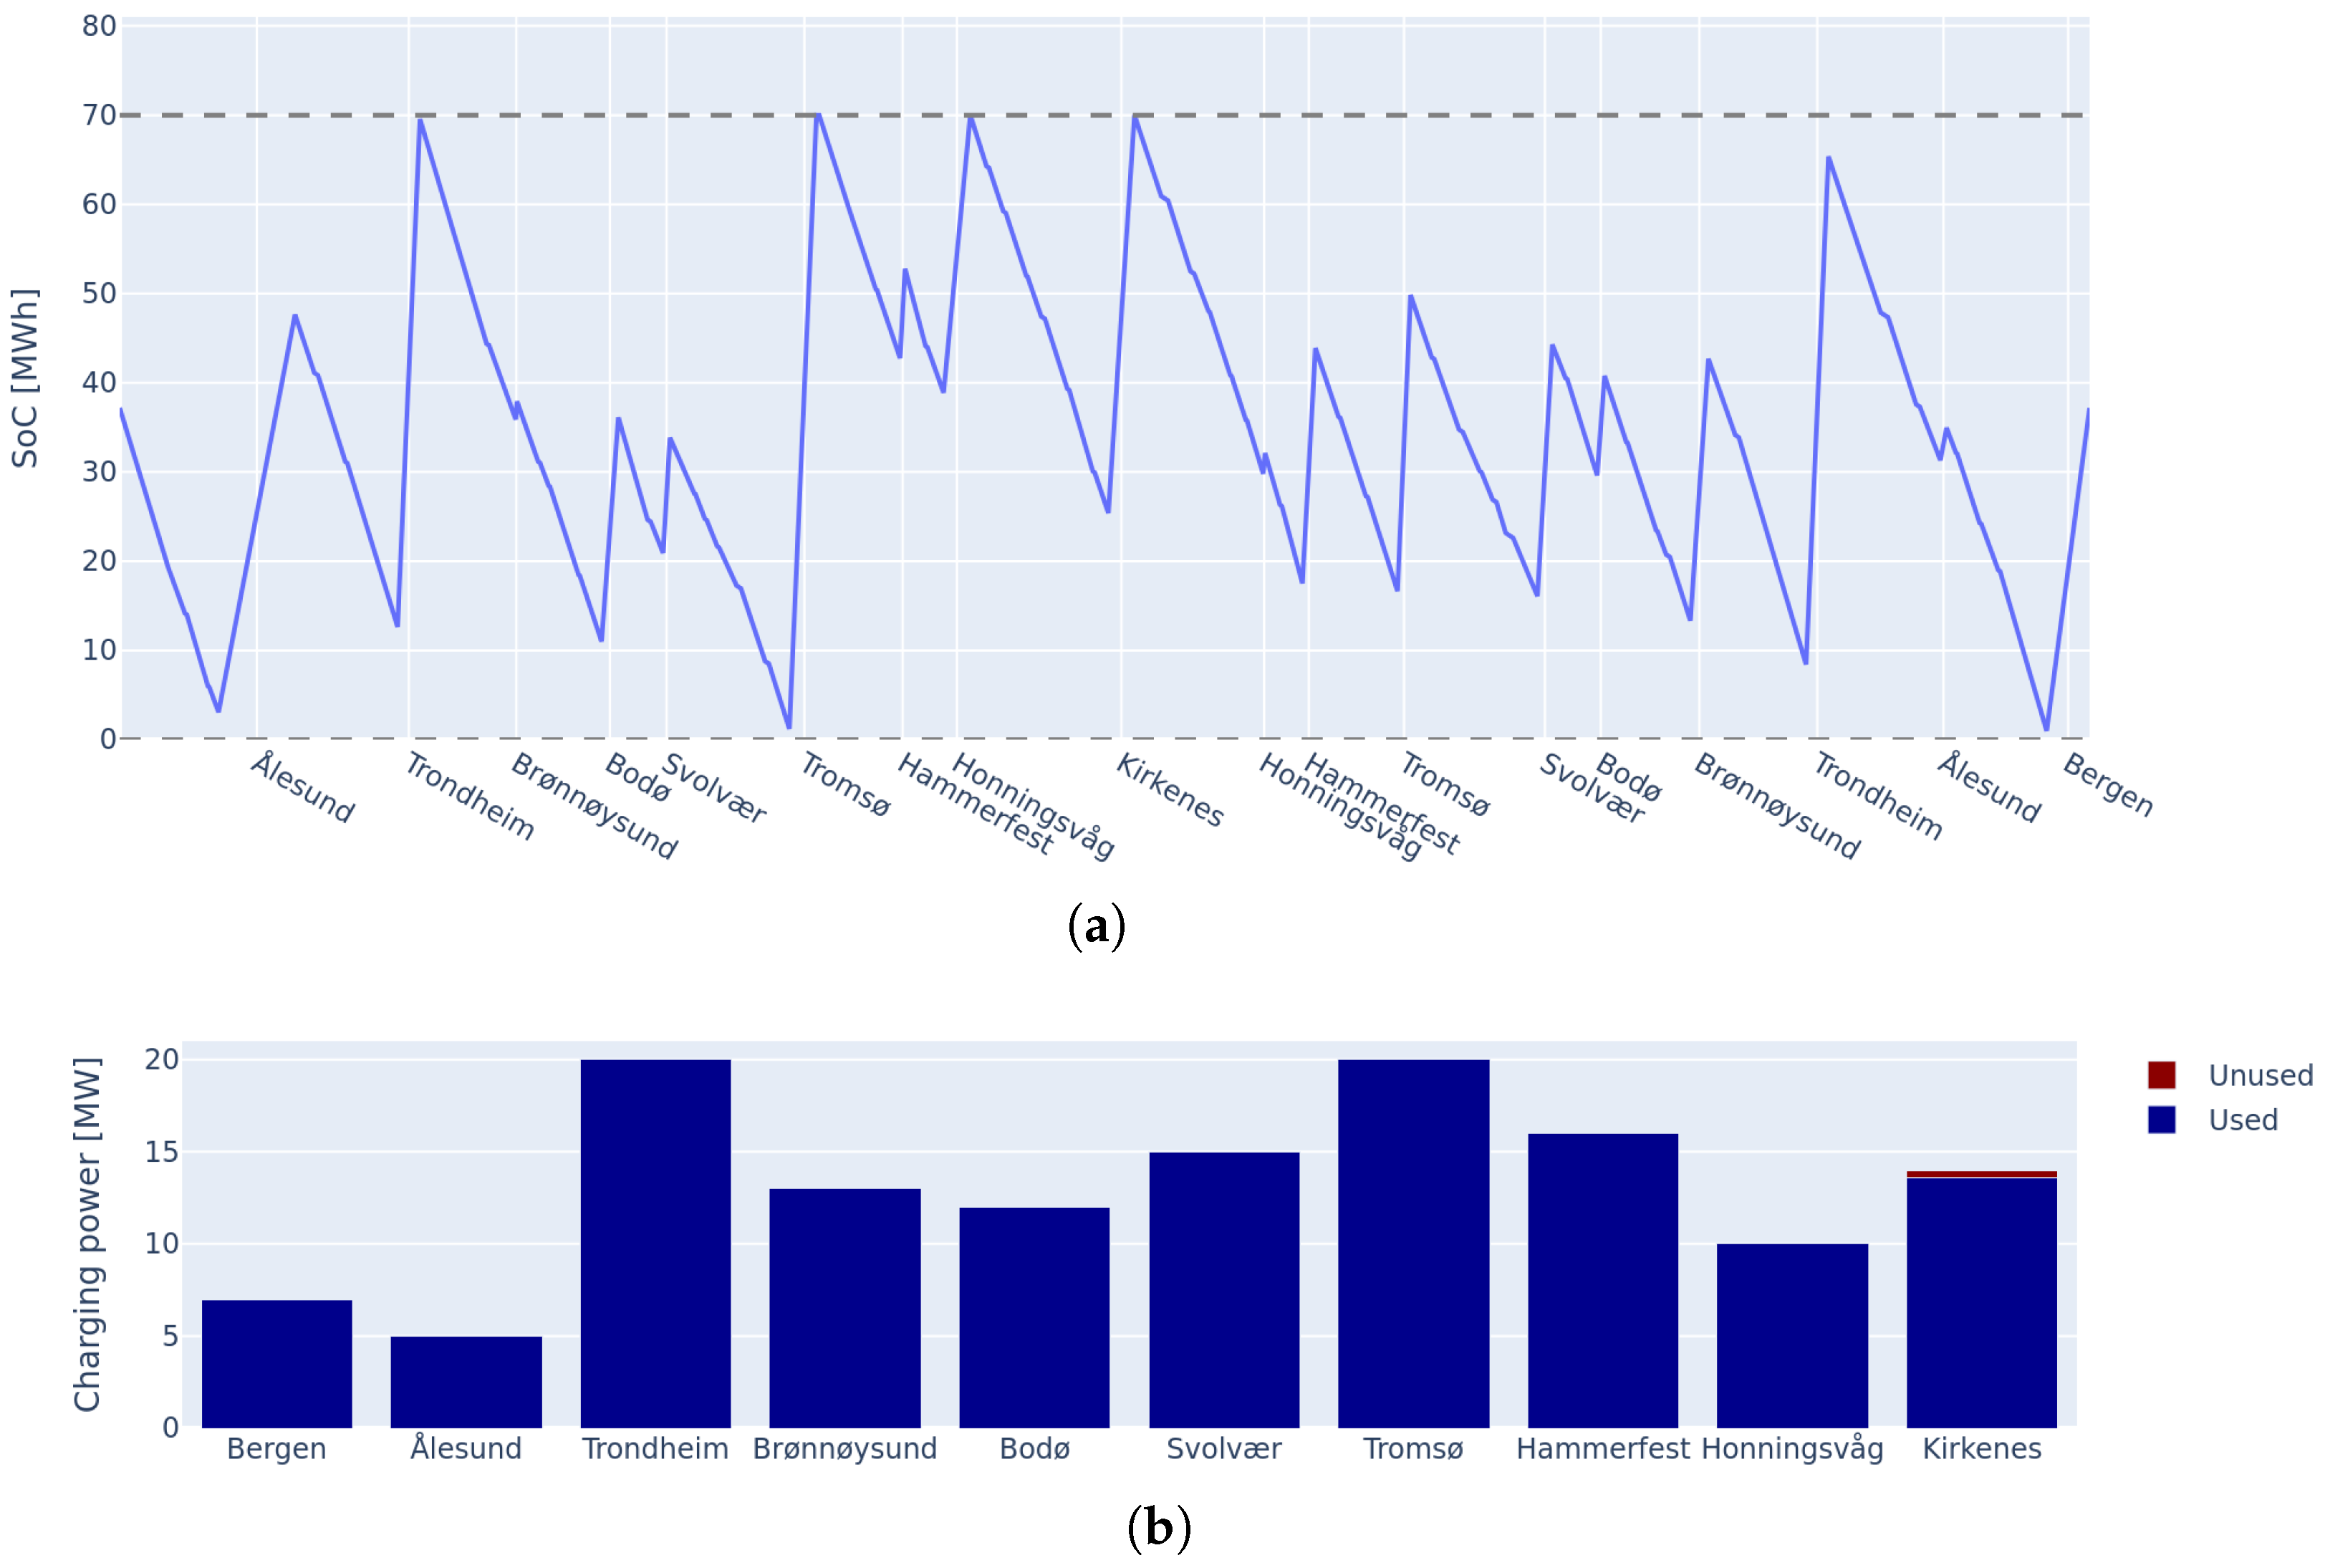
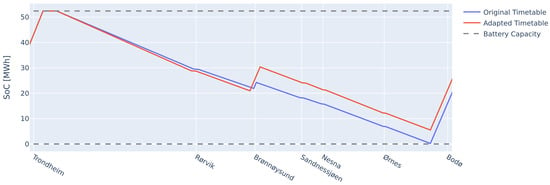
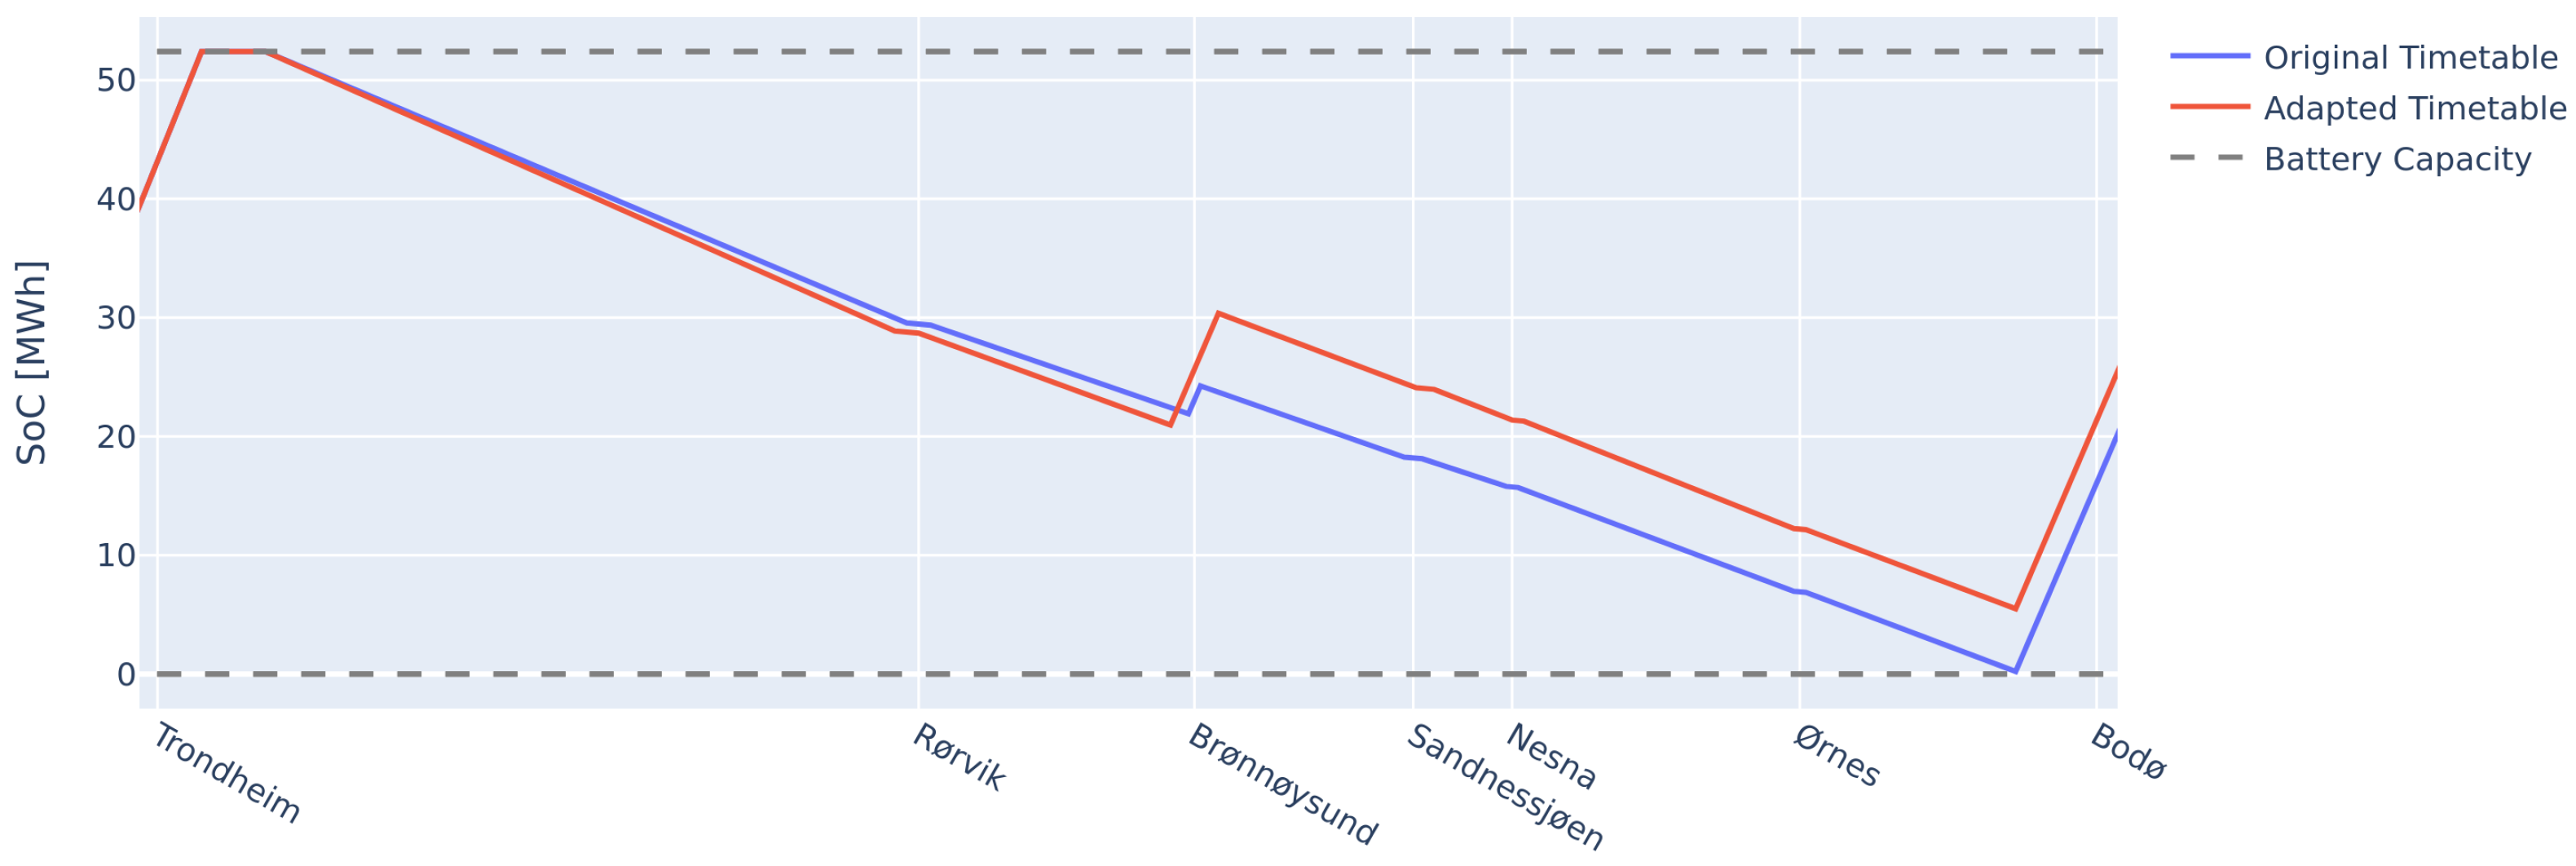
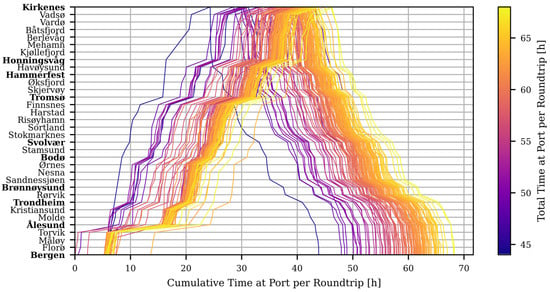
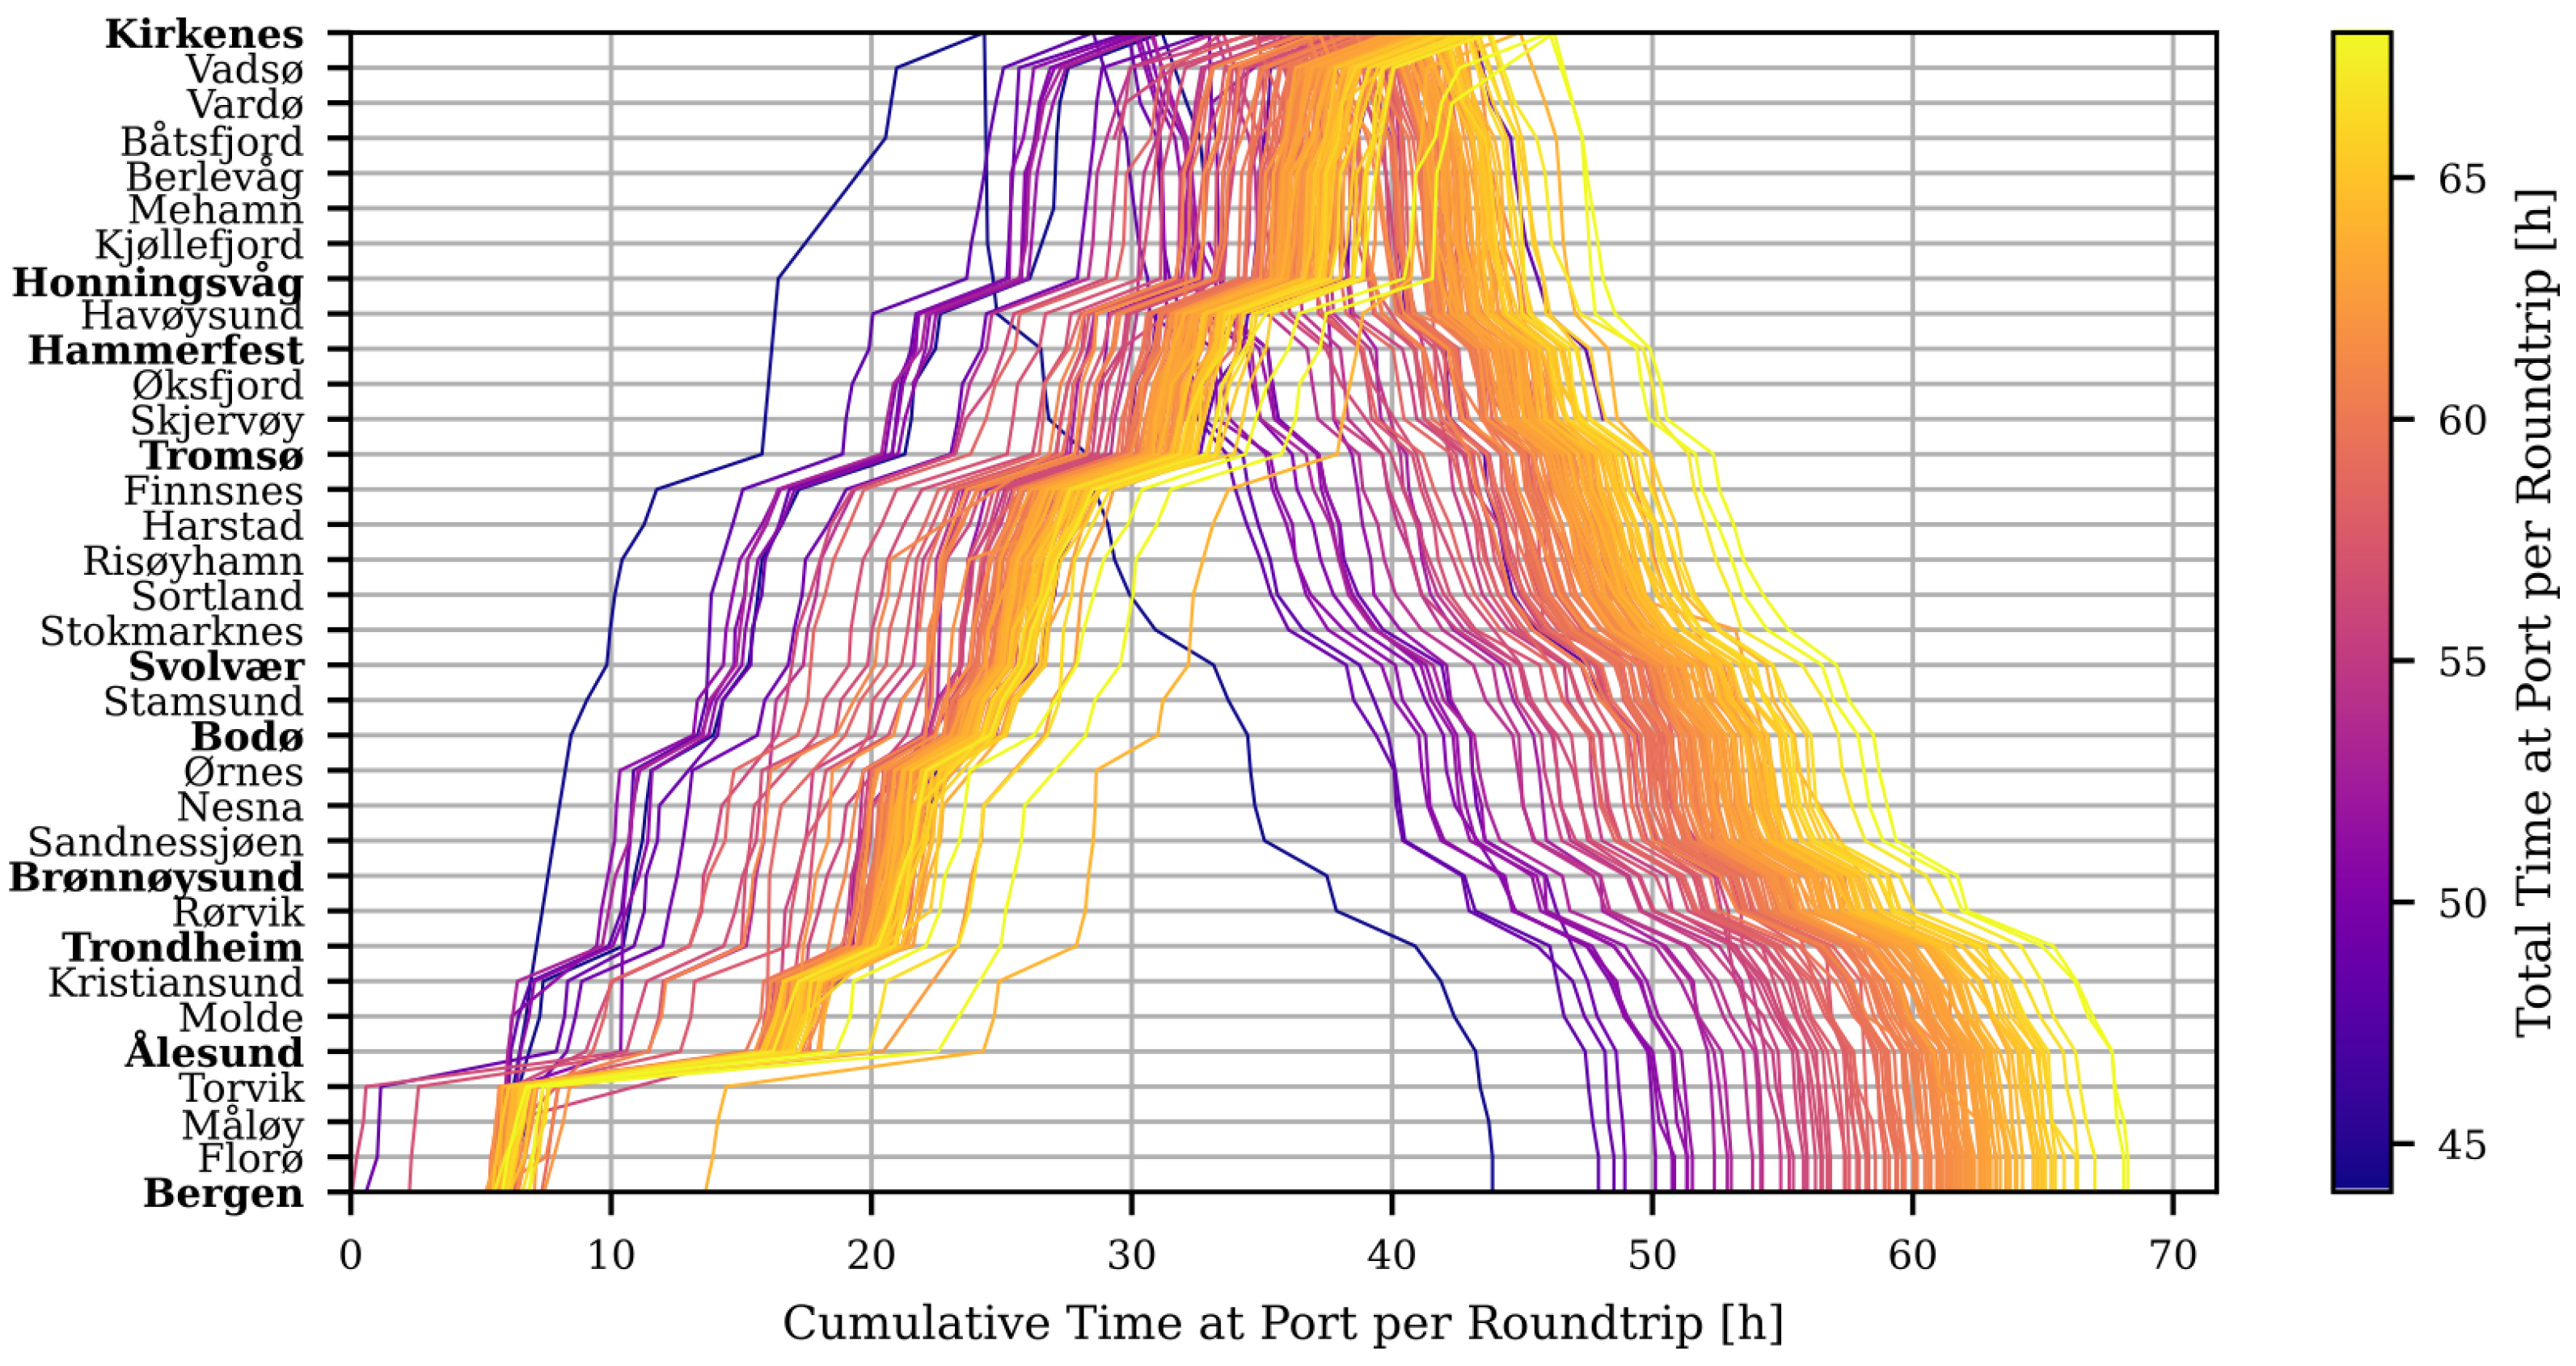
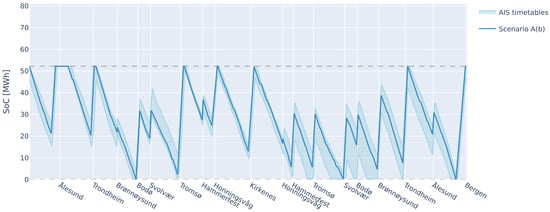
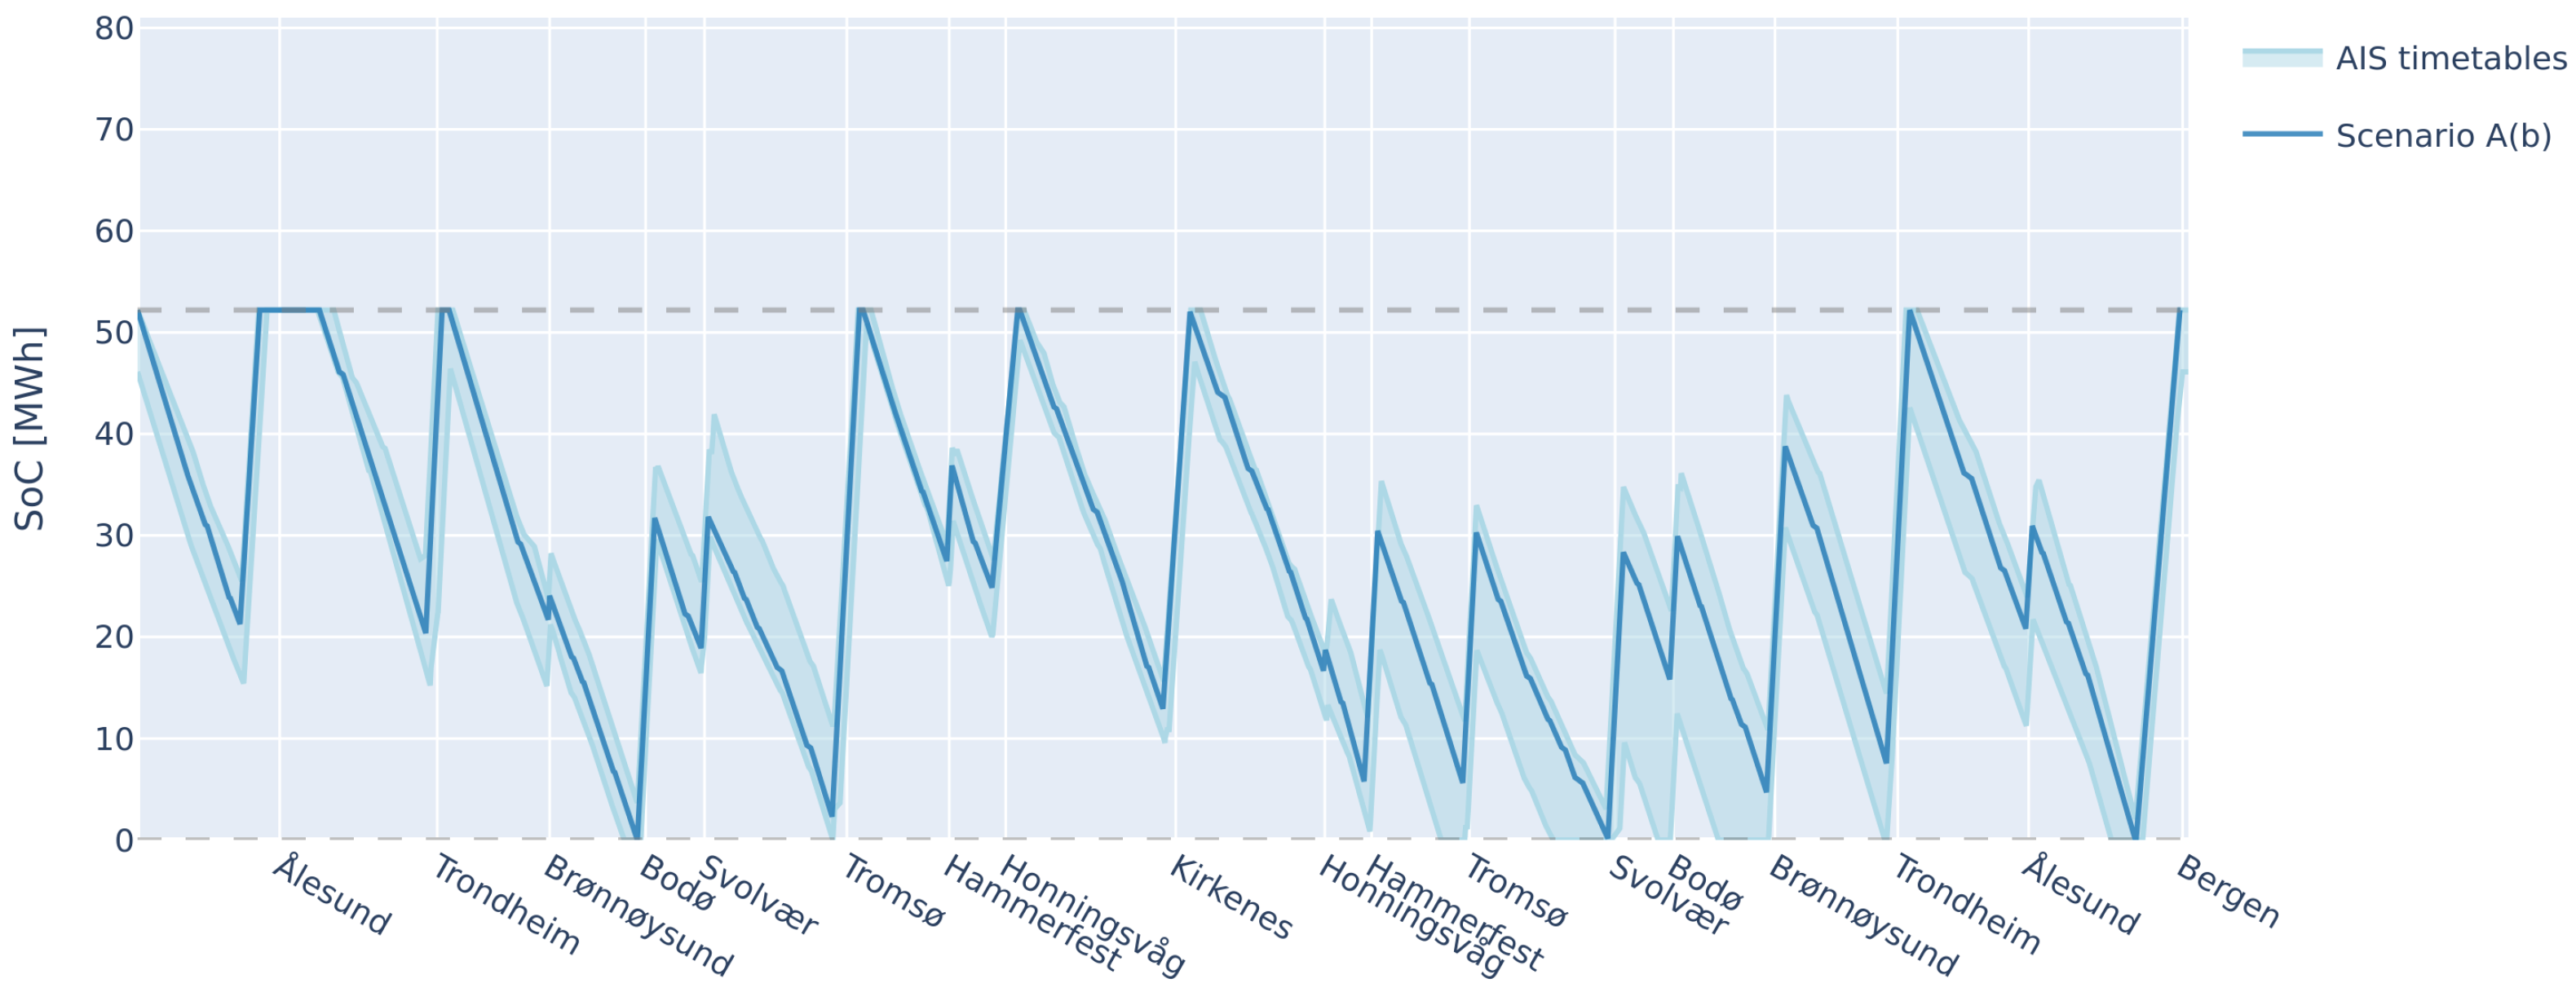
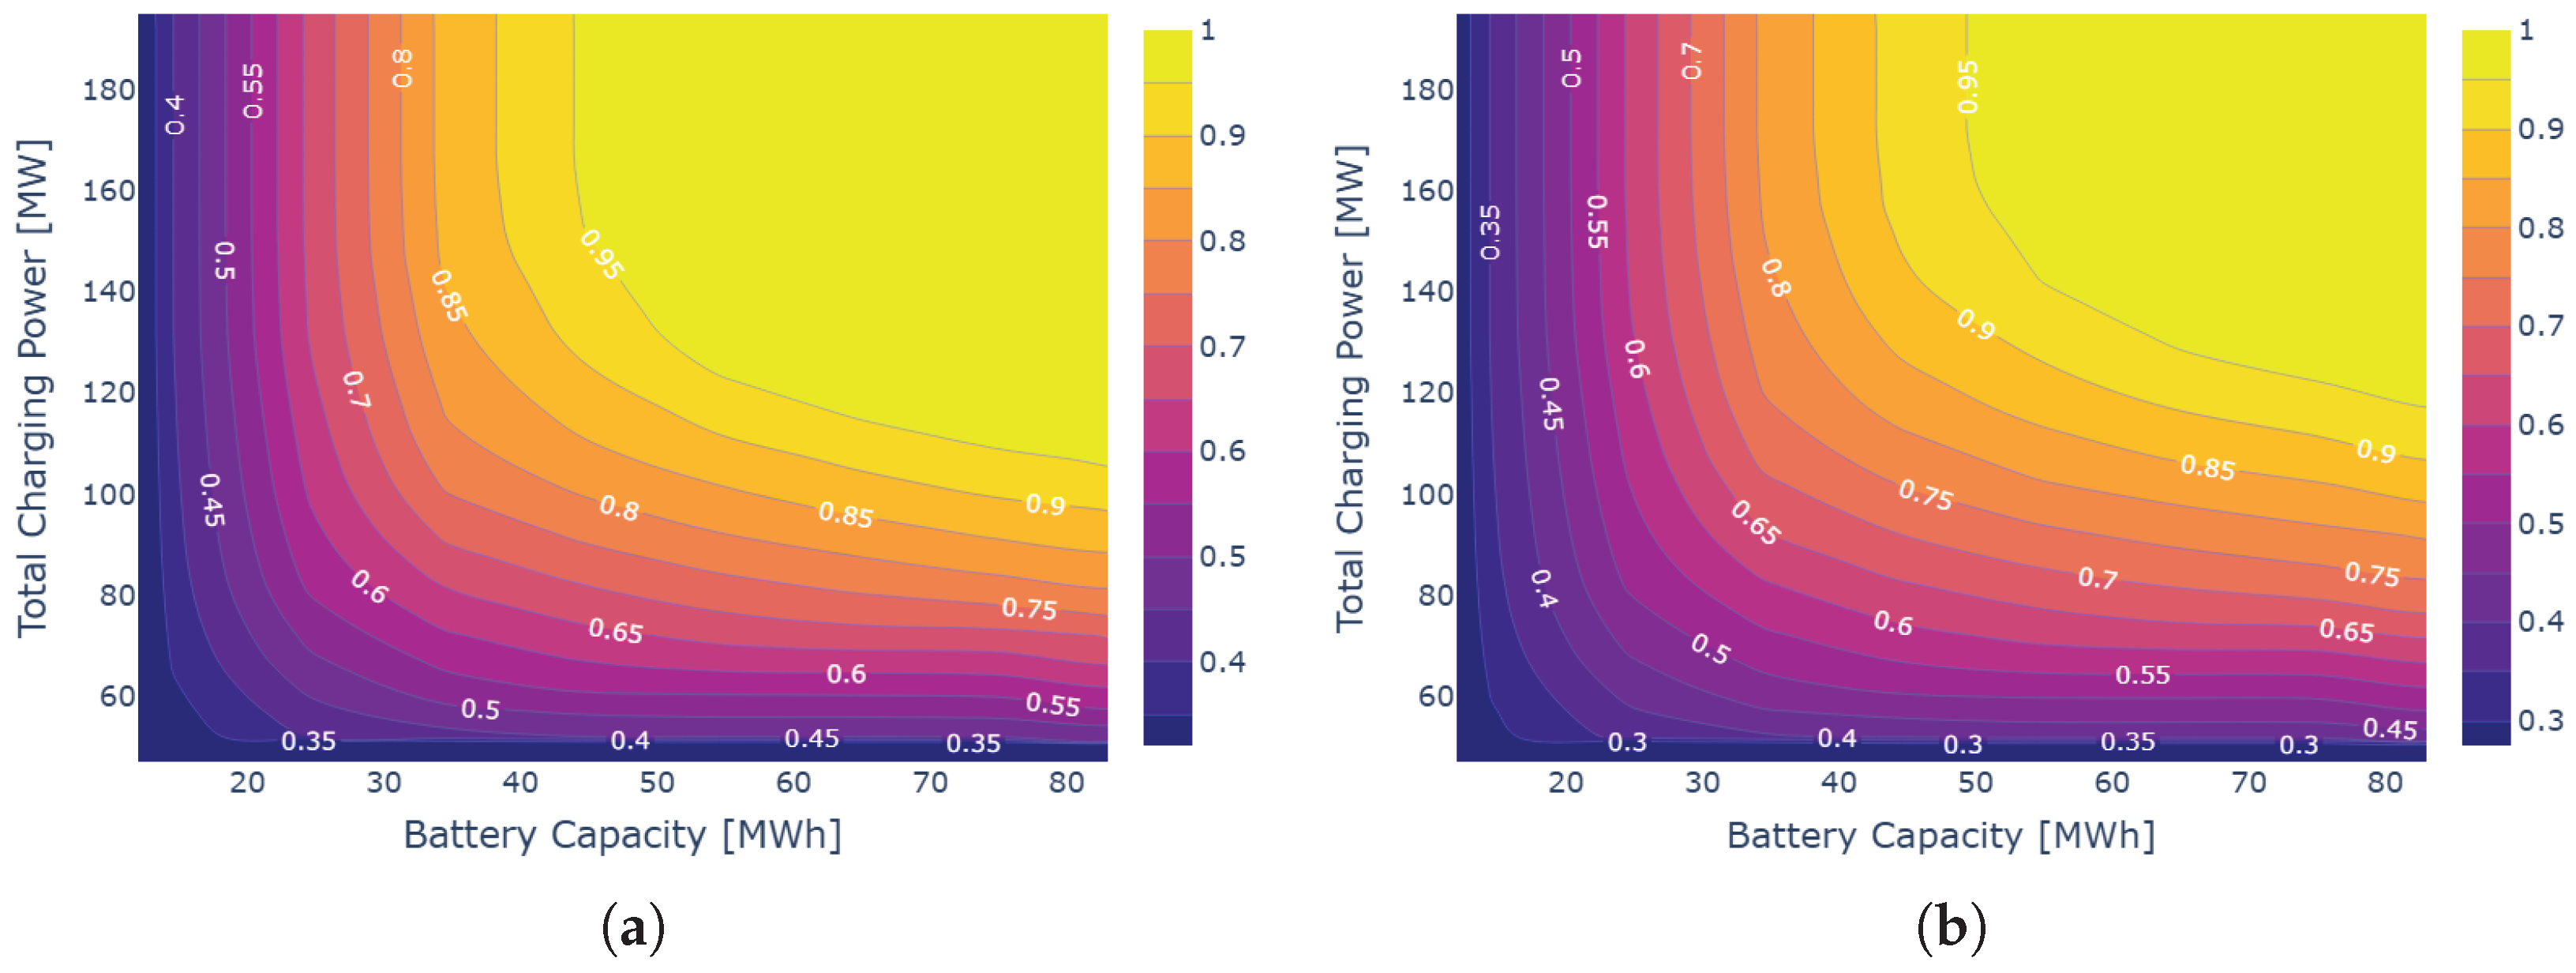

Disclaimer/Publisher’s Note: The statements, opinions and data contained in all publications are solely those of the individual author(s) and contributor(s) and not of MDPI and/or the editor(s). MDPI and/or the editor(s) disclaim responsibility for any injury to people or property resulting from any ideas, methods, instructions or products referred to in the content. |
© 2026 by the authors. Published by MDPI on behalf of the World Electric Vehicle Association. Licensee MDPI, Basel, Switzerland. This article is an open access article distributed under the terms and conditions of the Creative Commons Attribution (CC BY) license.