


Abstract
This study presents an integrated simulation framework that combines agent-based transport modeling with probabilistic load-flow analysis to quantify power system loading of long-haul heavy-duty electrification. The approach is applied to a case study considering fully electrified road freight in the Skåne region in Sweden, using high-resolution transport demand data and the actual power grid model used by the grid owner in the study area. The synthetic freight population covers the full long-haul truck segment intersecting Skåne. Both public en-route fast charging and end-of-trip depot charging are considered. The analysis reveals two fundamentally different charging demand profiles: a heavily fluctuating profile for public en-route charging, accounting on average for 82% of the total daily charging energy, and a stable profile for end-of-trip depot charging, covering on average the remaining 18%. The latter is achieved through a Linear Programming (LP) optimization model that flattens the load by scheduling charging across depot stay windows. These profiles serve as inputs to a probabilistic load-flow simulation that computes loading distributions for substation transformers. The simulation results show that in 4 of the 43 primary substations studied, the maximum transformer loading exceeds 100% following the introduction of truck charging, with peak loading at the most affected substation rising from 99% to 159%. This stress is primarily caused by the public charging demand, which peaks from late morning to noon, aligning with the early stages of logistics operations. However, there is no clear correlation between the magnitude of the truck charging load and the impact on transformer loading, since this is also highly dependent on local grid conditions. These findings highlight the value of integrated transport-energy simulations for planning resilient infrastructure and guiding targeted grid reinforcements.
1. Introduction
Achieving a zero-emission transportation fleet requires decisive and coordinated actions, with electrification as one of the most impactful strategies currently available. Electrification can be realized through a range of energy-carrier technologies (e.g., battery-electric or fuel cell vehicles) and corresponding methods of energy replenishment (e.g., plug-in fast charging, charging while driving, battery swapping, or hydrogen refueling). Each technology and method is associated with specific implications for vehicle operation, infrastructure, and the electric power system. According to the European Union’s Alternative Fuels Infrastructure Regulation (AFIR) [1], member states must deploy plug-in fast-charging and hydrogen-refueling stations along the core and comprehensive networks of the Trans-European Transport Network (TEN-T) [2] with deadlines starting at the end of 2025. These targets aim to ensure accessibility for zero-emission freight across the Union.
While several combinations of energy carriers and replenishment methods are possible, this study focuses on battery-electric heavy-duty trucks utilizing high-power en-route charging supplemented by lower-power depot charging. This pairing enables high-resolution assessment of operational patterns, infrastructure utilization, and resulting power-system loading within a well-defined context. Projecting future charging demand for a fully electric road-freight fleet is a complex task that requires (i) comprehensive datasets describing freight movement, (ii) valid assumptions for vehicle energy consumption, and (iii) consideration of route changes imposed by shorter ranges and longer energy replenishment times compared to conventional diesel or gas refueling. Charging infrastructure availability and placement are therefore central topics, as limited opportunities to recharge influence both individual route choices and the aggregate spatio-temporal charging demand.
To address these challenges, this paper presents an integration of two complementary simulation approaches. First, an agent-based transport simulation models road freight vehicle movements at high spatial and temporal resolution, generating station-level probabilistic charging demand profiles. Second, these time series feed a probabilistic load-flow simulation to quantify resulting impacts on the power system, including loading distributions for substation transformers and power lines and the probability of overload events. Together, the models provide a high-resolution representation of the link between transportation electrification and power system performance.
The analysis focuses on long-distance heavy-duty trucks in the Skåne region of Sweden, where detailed road freight patterns and power grid infrastructure models are available. While the application is specific, the methodology is designed to be general. With access to equivalent transport and grid data, the approach can be replicated for other regions or vehicle segments to support data-driven planning and development of charging and grid infrastructure.
1.1. Literature Review
The electrification of transportation introduces new demands on the electric grid, particularly due to the potential for concentrated and unpredictable charging loads [3]. To address this, some studies have coupled detailed electric vehicle modeling with power system simulations to assess grid impacts under different charging scenarios, such as Hu et al. [4]. Another study by Zhou et al. [5] integrates travel demand estimation and grid constraints into optimizing charging infrastructure. These studies demonstrate the effectiveness of using detailed transport models to understand the impact of electrification on the power grid; however, they rely on simplified or aggregated representations of vehicles. This limits their ability to capture the spatial and temporal variation of a large-scale real-world scenario. Safdarian et al. coordinate transmission and distribution analyses using survey-derived charging demand for light-and heavy-duty fleets but rely on simplified energy-per-mile assumptions rather than vehicle and route-specific consumption [6].
Recent studies in the field have been exploring the benefit of detailing advanced simulations to do in-depth analyses on the infrastructure requirements originating from electrification. Advanced transport simulations have been used to capture freight movement patterns and charging needs. For example, Tietz et al. employ MATSim, the same activity-based multi-agent simulation framework used in this study, to represent Germany’s long-haul trucking with realistic driving hours and rest regulations to geographically identify needs for high-power charging and potential bottlenecks [7]. Their analysis showed that even with depot charging available, substantial en-route charging infrastructure is needed, in the megawatt scale. Similarly, Menter et al. employs MATSim to assess 1–20% fleet electrification adoption scenarios in Germany, finding that charging utilization increases with battery electric vehicle (BEV) share even as absolute charger counts grow [8].
As an alternative to agent-based simulation, trip-chain focused modeling using empirical freight data has been proposed as a valid method per Shoman et al. [9]. In their study, a trip-chain model for European long-haul transport is created, converting origin-destination matrices and real-world trucking schedules into charging stops in compliance with driving time regulations. This data-driven approach estimated Europe’s charging needs in 2030 projecting a 15% electrified fleet share, requiring in total around 40,000 depot charging points (50–100 kW) and 9000 megawatt-scale charging points. A great benefit of using detailed transport simulation paired with real-world timestamps is the generation of synthetic but realistic charging profiles, such as in Borlaug et al. [10]. Their study shows that, in the U.S., many distribution substations could accommodate heavy-duty truck charging at ≈100 kW per vehicle without major upgrades. Their results also show that depot charging effects will impact the local distribution grid, with concentrated loads when trucks return to depots. Probabilistic construction of truck-charging load profiles has also been explored to capture variability for planning [11].
All studies above do agree that electrification of long-haul heavy-duty trucks will stress the power grid, which will eventually need to be upgraded to accommodate wide-scale charging, especially at megawatt scale. One potential mitigation strategy is to coordinate smart charging, utilizing timing and power modulation to flatten the load profile [12]. While highly effective for flexible depot charging, this approach is constrained during en-route charging by the need to minimize vehicle downtime. In such cases, grid impact might instead be mitigated by stationary battery storage at the charging stations. Another mitigation is to co-locate charging hubs with on-site energy resources (e.g., photovoltaics plus battery storage) to buffer peaks e.g., a highway case study for Egypt optimizes locations and sizes of stations with co-located photovoltaics and energy storage systems under multiple design scenarios [13]. Hierarchical control systems have also shown promise, studied in [14]. Their study demonstrated that a large truck charging site equipped with battery storage and controlled via predictive algorithms can reduce peak grid power demand significantly. In their case study, an energy-management system at a >1 MW charging park (with energy storage and photovoltaics) alleviated the net energy taken from the grid by 28%.
1.2. Paper Contribution
Existing literature examines multiple electrification pathways for heavy-duty transport, but few studies model a single technology–method pairing with the temporal and spatial resolution needed to evaluate real-world grid impacts. As highlighted in Section 1.1, prior works assessing grid impacts often rely on simplified or aggregated vehicle representations and generalized energy-consumption assumptions. Conversely, studies employing high-resolution transport simulations typically focus on identifying infrastructure needs rather than evaluating the subsequent stress on an actual power grid. The present work closes this gap by explicitly connecting these two domains, capturing the interaction between charging demand, station utilization, and substation-level loading. To achieve this, a detailed simulation framework is proposed in this article, directly linking vehicle- and route-specific movements to probabilistic load-flow outcomes on a real regional grid. A related conference article by the authors applies the same integrated framework to quantify grid-capacity impacts in Skåne using a transport model and probabilistic load flow [15] simulation. The present article expands on this work by focusing on the methodology description and interaction, incorporating explicit depot charging to model an all-round charging need, and releasing an open parametrization of station-level charging-demand profiles for public and depot charging.
This study focuses on battery-electric heavy-duty trucks with high-power plug-in charging, a scope chosen because it aligns with near-term EU targets, representing a mature zero-emission option for short and long-haul freight, and provides a template that can be transferred to other technology–method combinations within the same framework.
The main contributions of this study are:
- Integration of an agent-based transport simulation (with a one-to-one road freight representation) and a probabilistic load-flow model of the actual grid, translating station-level probabilistic charging profiles into loading distributions for transformers and lines, including overload probabilities.
- Construction of a high-resolution synthetic road freight truck population and station-level probabilistic charging-demand profiles. The parametrization used to generate these profiles is made openly available to support replication and sensitivity analyses.
- Explicit modeling of depot charging, complementing en-route public charging demand.
- A regional case study of Skåne, Sweden, demonstrating how spatially distributed charging demand from electrified freight transport affects average and peak transformer loading in a real power grid model.
- A reproducible workflow that can be adapted to other regions or vehicle segments given suitable transport and grid data.
2. Methods
This study connects a high-resolution agent-based transport simulation with a probabilistic load-flow (PLF) model of the electric grid. First, a description of the study area and datasets is provided, then a walkthrough of the transport model that generates station-level charging demand (including depot charging), followed by the power-system model and the transport–grid coupling. Finally, a statistical characterization of station loads is shown and parametrized.
2.1. Agent-Based Transport Model
To generate a comprehensive spatio-temporal power demand for the probabilistic power grid simulation, a model providing a detailed insight into goods transport in Sweden is needed. Creating a synthetic representation of the transport flow enables a realistic simulation of daily transportation patterns. This model is comprised of a population of agents, a road network, and a charging infrastructure.
2.1.1. Agent Population and Trip Generation
The modeled population, representing a fully electrified daily transport of long-haul truck agents, is produced from the Swedish Transport Administration’s Swedish National Goods model, Samgods [16]. Samgods generates optimized goods transport flows based on data on aggregated monetary flows between companies in Sweden. The resulting output specifies the annual number of origin-destination (OD) freight flows.
To convert these aggregated annual transport flows into representative daily trips for synthetic agents, OD pairs are assigned probabilistically to individual agents based on their likelihood of occurrence, generating a statistically likely average day. OD pairs with an expected frequency of one or more occurrences per day are included deterministically according to their integer value. Any remaining fractional probability, as well as pairs with sub-daily frequencies, are sampled probabilistically with a probability of inclusion equal to their expected daily occurrence rate, following the method described in detail in [17]. Using yearly data presents two limitations. First, since no data on day-to-day variations is available, it is impossible to accurately simulate a statistically correct sequence of days. Second, the temporal variation of departure times is unavailable. This second limitation has been successfully mitigated by obtaining data containing probability distributions of vehicle type and trip length-specific departure times, provided by truck manufacturers Scania CV AB and Volvo Trucks AB. The implications of this averaged daily representation on peak charging demand estimation are further discussed in the limitations Section 4.2.
The truck agents themselves are defined as distinct classes, categorized by parameters such as battery capacity and speed limit, with the specific class for each trip being provided by the Samgods output. Their energy consumption is governed by vehicle-specific maps dependent on speed and road slope, which were derived from a dynamic vehicle simulation model in MATLAB and Simulink (version R2022a).
2.1.2. Study Area
The primary study area is the Skåne region in southern Sweden. Skåne was selected due to the availability of detailed freight data and an operational grid planning model. The region is of particular interest as it is home to 13.5% of Sweden’s population, is an electricity-deficit region, and serves as a critical corridor for road transport from continental Europe. A regional filter is applied to the OD dataset to include only those trips that intersect the area at any point along their route. The model’s geospatial data includes:
- The road network, including geometry, speed limits, and topology, is obtained from OpenStreetMap [18]. Trips originating from foreign positions are relocated to the most suitable border entry point into Sweden, considering both road and ferry options.
- The public charging infrastructure within the model is based on public fast-charging station locations built or planned by the end of 2025 under the national “Regionala Elektrifieringspiloter” program [19].
- The OD set from Samgods contains realistic positions of terminals, harbors, and municipal centers, which form the set of trip start and end nodes used for routing and for calculating end-of-trip depot charging needs.
2.2. Agent-Based Transport Simulation
The agent-based model is implemented using the mesoscopic transport simulation framework MATSim [20] to generate detailed charging demand data.
2.2.1. Simulation Process and Daily Variations
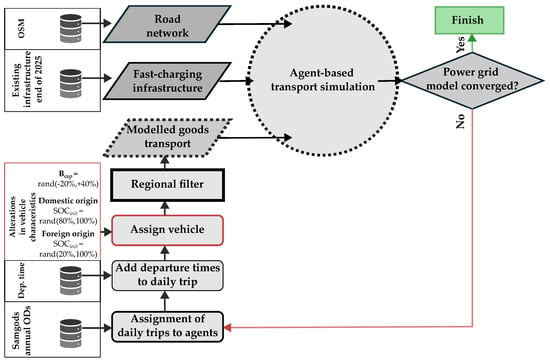
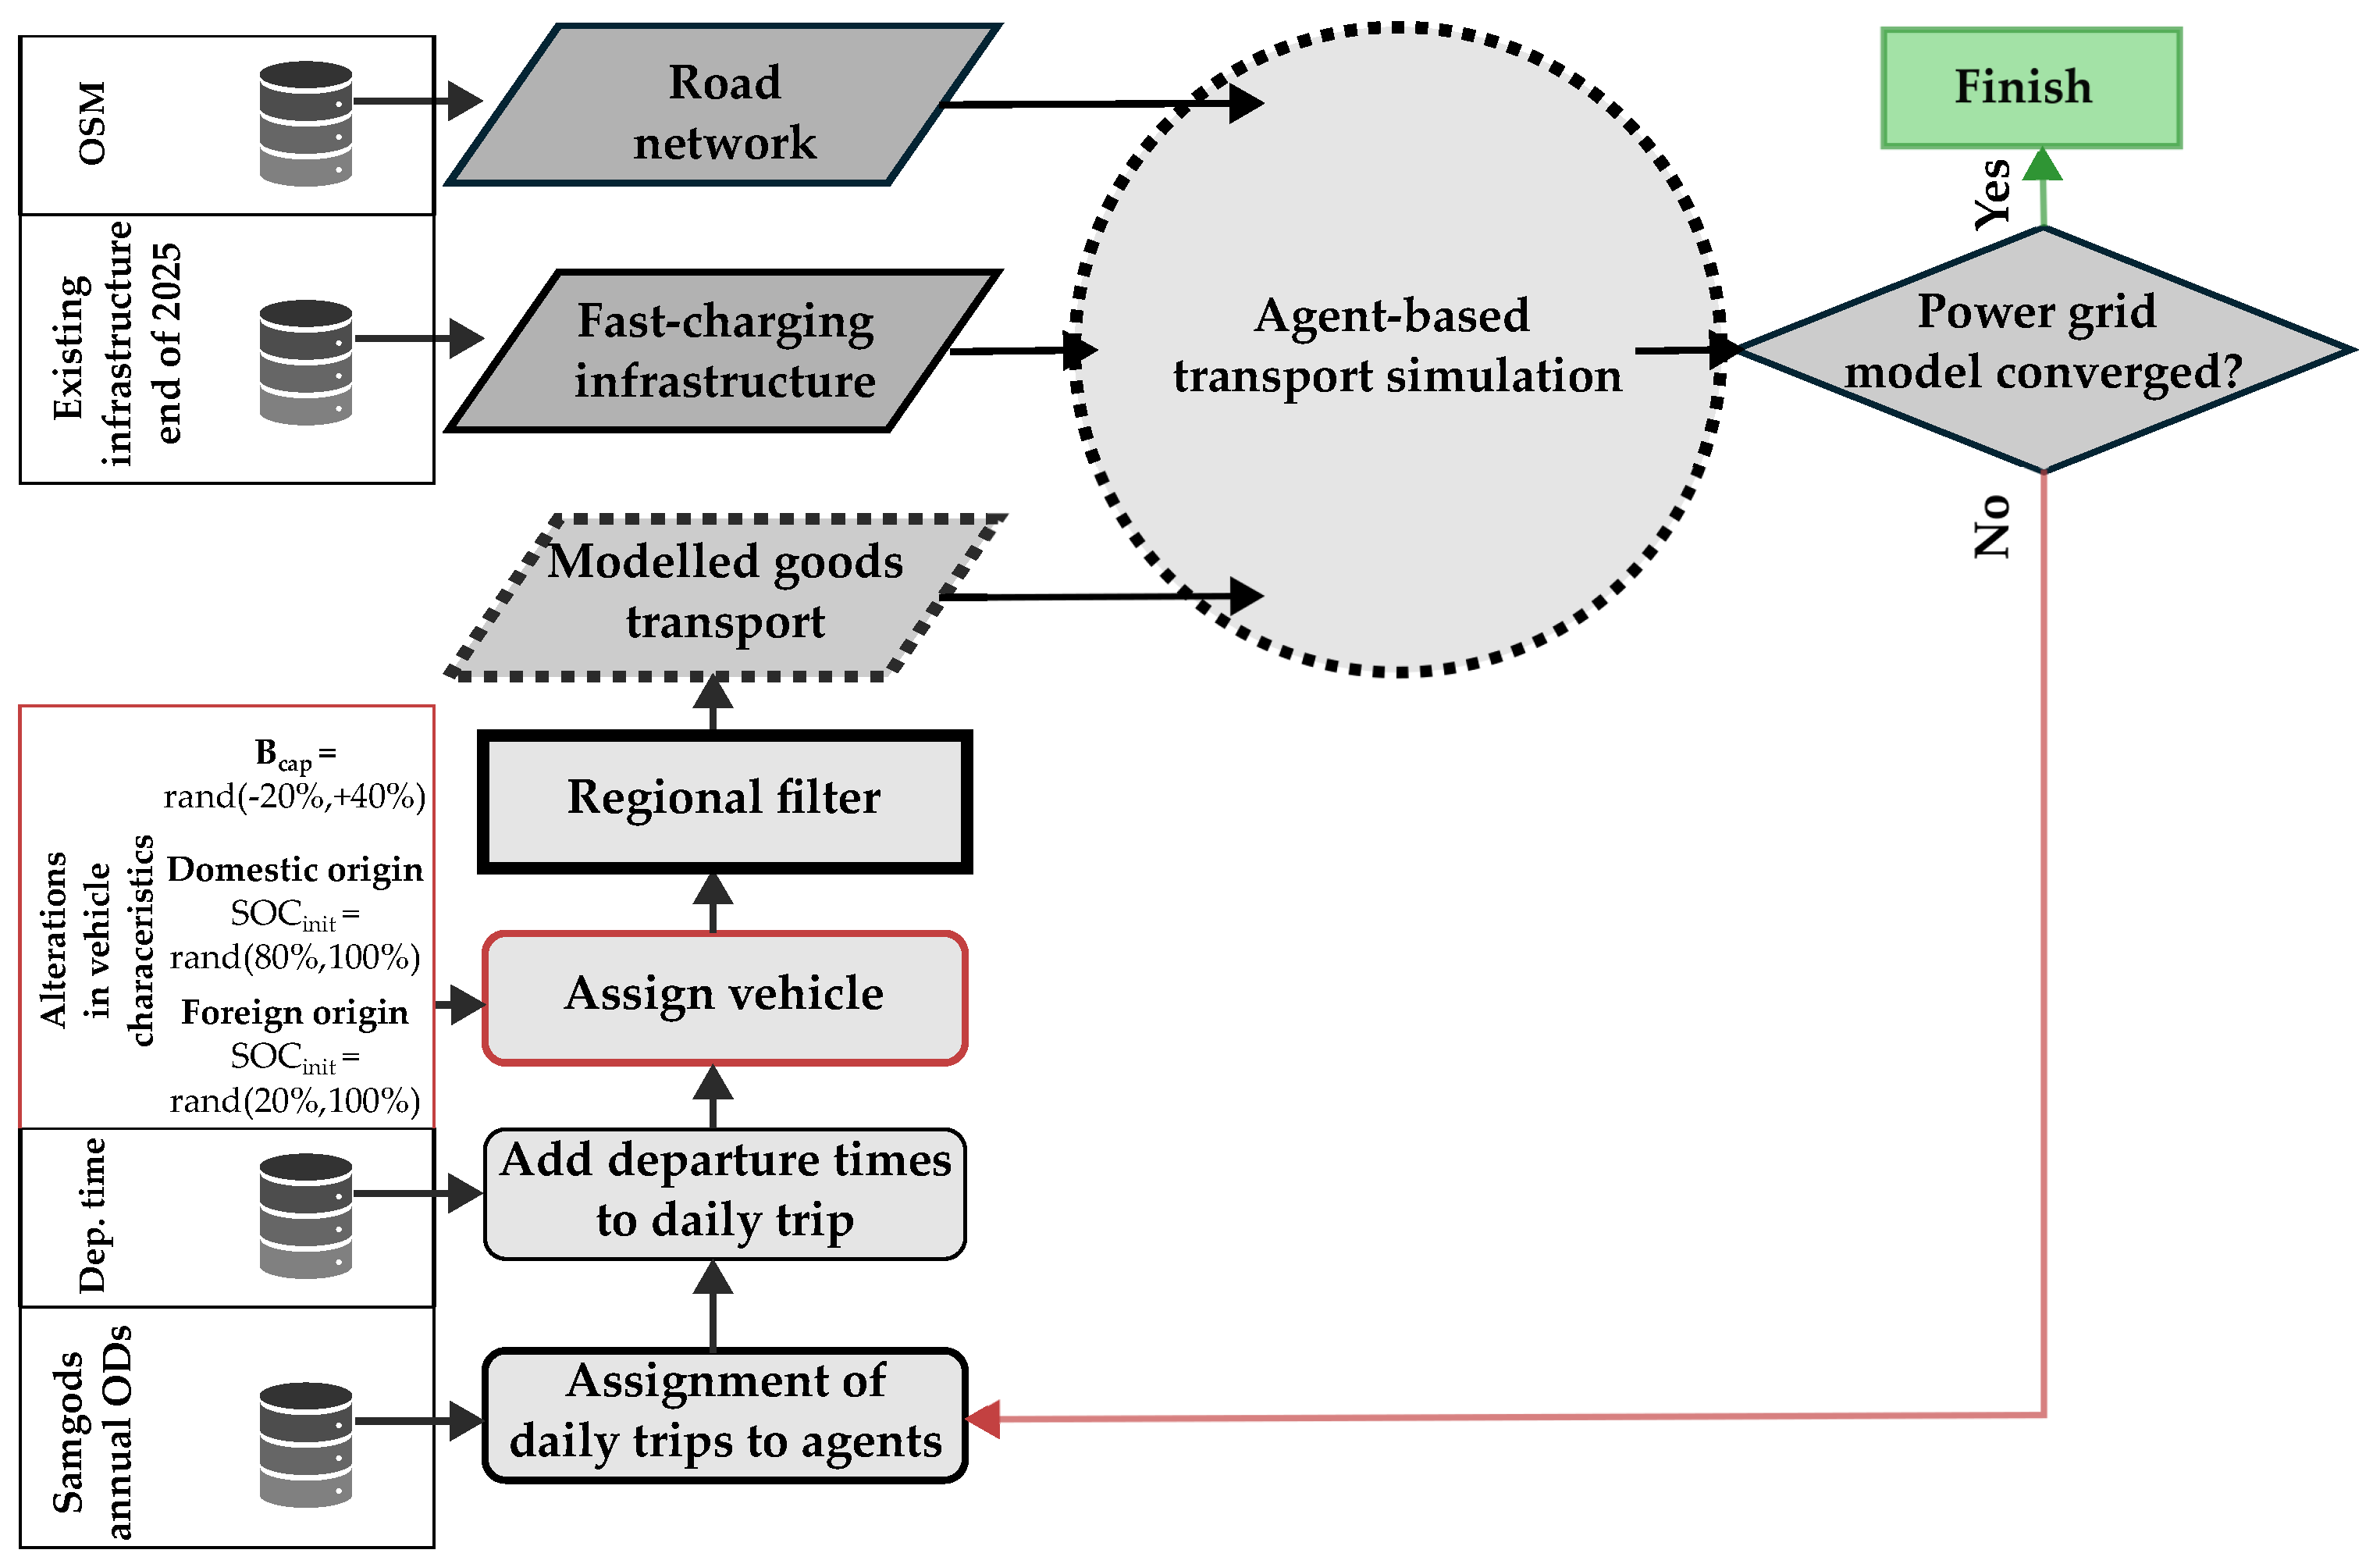
A core challenge is that the input data provides no statistical link from one day to the next. Each simulated version represents the same total transport work (ton-km), but three parameters are varied stochastically across runs to capture realistic operational variability:
- For trips originating domestically, the initial state of charge (SOC) is drawn from a range of 80% to 100% to reflect the assumption that these vehicles depart from their home base, where depot charging is available before the trip begins.
- For trips originating from foreign locations, the SOC is drawn from a broader range of 20% to 100% to account for greater uncertainty.
- The battery capacity of each truck is drawn from a range of 20% to 40% above the minimum energy required for its trip, representing variability in vehicle specifications across the fleet.
Because the initial SOC and battery capacity jointly determine whether a vehicle requires en-route public fast charging or can complete its trip relying solely on depot charging, the split between public and depot charging energy is not fixed but varies across runs. For each run, the agent population is reconstructed by re-sampling the probabilistic allocation of sub-daily-frequency trips described in Section 2.1.1, such that the trip composition may vary across runs while the total transport work (ton-km) is preserved exactly. This iterative process, which ensures that agent conditions alter from one simulated day to the next, is illustrated in Figure 1.
Figure 1.
Simulation procedure showing the process of varying the modeled population to create daily variations. Red outlines indicate the parameters that are re-sampled between simulation iterations.
2.2.2. Agent Behavior
Within MATSim, agents’ daily plans are simulated simultaneously for a 24-h period. The plans are iteratively refined until a stable state is reached, with agents behaving in a self-interested manner to optimize their individual plans. This process does not aim for a global optimum but rather focuses on individual optimization, making it particularly suitable for simulating the self-interested decision-making of truck drivers. The simulation is run until convergence is observed, with an additional buffer applied, resulting in a total of 20 iterations. The agent behavior is governed by a scoring function S, which rewards the completion of freight activities while penalizing travel time, battery depletion, and delays. The function is defined as:
where:
- is the utility gained from truck activity i (e.g., loading/unloading) at the start or end of the day ().
- represents the penalty for traveling along route segment j, summed for all m segments to incentivize minimizing travel time.
- is a discrete penalty scaled to one hour of travel time, ensuring that detours longer than one hour are not chosen merely to avoid depletion.
- is a high penalty for failing to reach the second activity on time, a standard MATSim feature that prevents agents from getting stuck at their origin.
Charging activities are determined in a pre-simulation phase, where each agent’s SOC is estimated spatially along its potential route. To encourage exploration of different charging options, if the estimated SOC drops below a random threshold between 15% and 40%, a charging stop is planned. This logic applies for the first 80% of the MATSim iterations. For the final 20% of iterations, charging decisions are fixed based on the five highest-scoring plans.
2.2.3. Charging Demand Estimation
To isolate the total charging demand from infrastructure constraints, a key assumption is made regarding the public charging infrastructure. Since the scenario investigates the impact of a fully electrified long-haul transport sector, the infrastructure planned for 2025 is assumed to be insufficient regarding the number of available charging points. Therefore, while the planned station locations are used, each station is assumed to have as many charging points as needed in order to avoid queues during the simulation, dedicated to public en-route charging. Each charging point can deliver up to 1 MW, although the actual power drawn by a vehicle in the model is limited by a pre-defined charging curve dependent on the vehicle’s specific battery capacity and the instantaneous state of charge (SOC) of the battery during the charging process.
This assumption intentionally removes all waiting times to reveal the total unconstrained fast-charging demand. In practice, finite charging capacity would first encourage vehicles to seek an alternative charging station along the route to avoid queuing, redistributing the charging load in both time and space. If the charging capacity over a certain geographical area becomes so constrained that no alternative empty charging point can be found nearby, queues will start forming. Those queues will naturally result in a flatter but wider power profile at the constrained stations. Queues will also delay vehicles’ travel plans, propagating to later arrival times at subsequent destinations. The effect of such delays on the power profile at each destination cannot be generally predicted, since it depends on the specific power profile at those locations, i.e., on the behaviour of all other vehicles arriving there. The broader implications of this unconstrained approach on peak load estimations are further discussed in Section 4.
In addition to this en-route fast charging, the model also calculates the end-of-trip charging need for trips concluding at nodes within Skåne. This represents charging at depots or home bases. To translate the required charging energy into an efficient power profile, a high-resolution optimization problem is formulated and solved. While the charging window is determined using precise arrival and departure times, the optimization itself operates on discrete 5-min time slots. The problem is formulated as a Linear Programming (LP) problem, as all decision variables are continuous.
Sets and Indices. The model considers a set of vehicles , where N is the total number of vehicles at the station, and a set of 5-min time slots , creating a 24-h time span.
Parameters. For each vehicle , the model uses its arrival time slot (), departure time slot (), and energy requirement (). The duration of each time slot is h. A key physical constraint is the maximum charging power per charging point, kW.
Decision Variables. The primary decision variables are the energy charged to each vehicle in each 5-min time slot () and the resulting station-wide peak power demand ().
Objective Function. The multi-objective function minimizes a weighted sum of the peak power and the total deviation from the mean power to find a flat load profile per charging station.
where (=1000) (=1) to prioritize peak reduction, and are auxiliary variables used to linearize the absolute deviation term.
Constraints. The optimization is subject to the following primary constraints:
- Per-Vehicle Power Limit: The instantaneous power delivered to any single vehicle cannot exceed the maximum charging point rate, , of 350 kW.
- Vehicle Availability: A vehicle’s end-of-day charging window is defined by its arrival and departure slots (), which are derived from the precise simulation times. The arrival time is taken from the recorded final-destination arrival time in the transport simulation output. Vehicles completing their final trip past midnight have their arrival times wrapped to the corresponding early morning hours of the same operational day (e.g., an arrival at 25:00 is treated as 01:00). The departure time is determined by sampling each vehicle’s depot stop duration individually from the probability distributions of the longest daily stop per truck reported by the Swedish Transport Administration [21], which aggregates large-scale operational data from truck manufacturers Scania CV AB and Volvo Trucks AB. The sampled stop duration is enforced as a minimum: if it is shorter than the time to physically charge the battery at 350 kW (the practical maximum for current non-megawatt depot charging equipment), it is extended accordingly. The optimization analyzes this schedule over a single, representative 24-h cycle, meaning any charging scheduled past midnight from the transport simulation is wrapped to the corresponding early morning hours of the same operational day, as described above for the arrival time. The set of available 5-min slots, , handles depot charging schedules. Vehicles may only be charged within these slots ( for ).
- Energy Balance: Each vehicle must be charged to its target SOC, which is a randomized value between 80–100%, before its departure. The sum of energy charged across all its available slots must equal its total requirement: .
- Peak Power Definition: The station’s peak power, , must be greater than or equal to the total power dispatched in any given 5-min time slot.
Output Aggregation. After solving the optimization, the high-resolution 5-min energy results () are aggregated into a final hourly power profile for reporting and analysis. For each hour h, the total energy from its twelve 5-min slots is summed and divided by one hour to calculate the average hourly power, .
2.3. Interface Between Transport and Power Grid Models
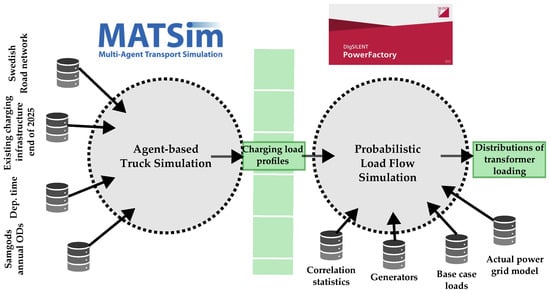
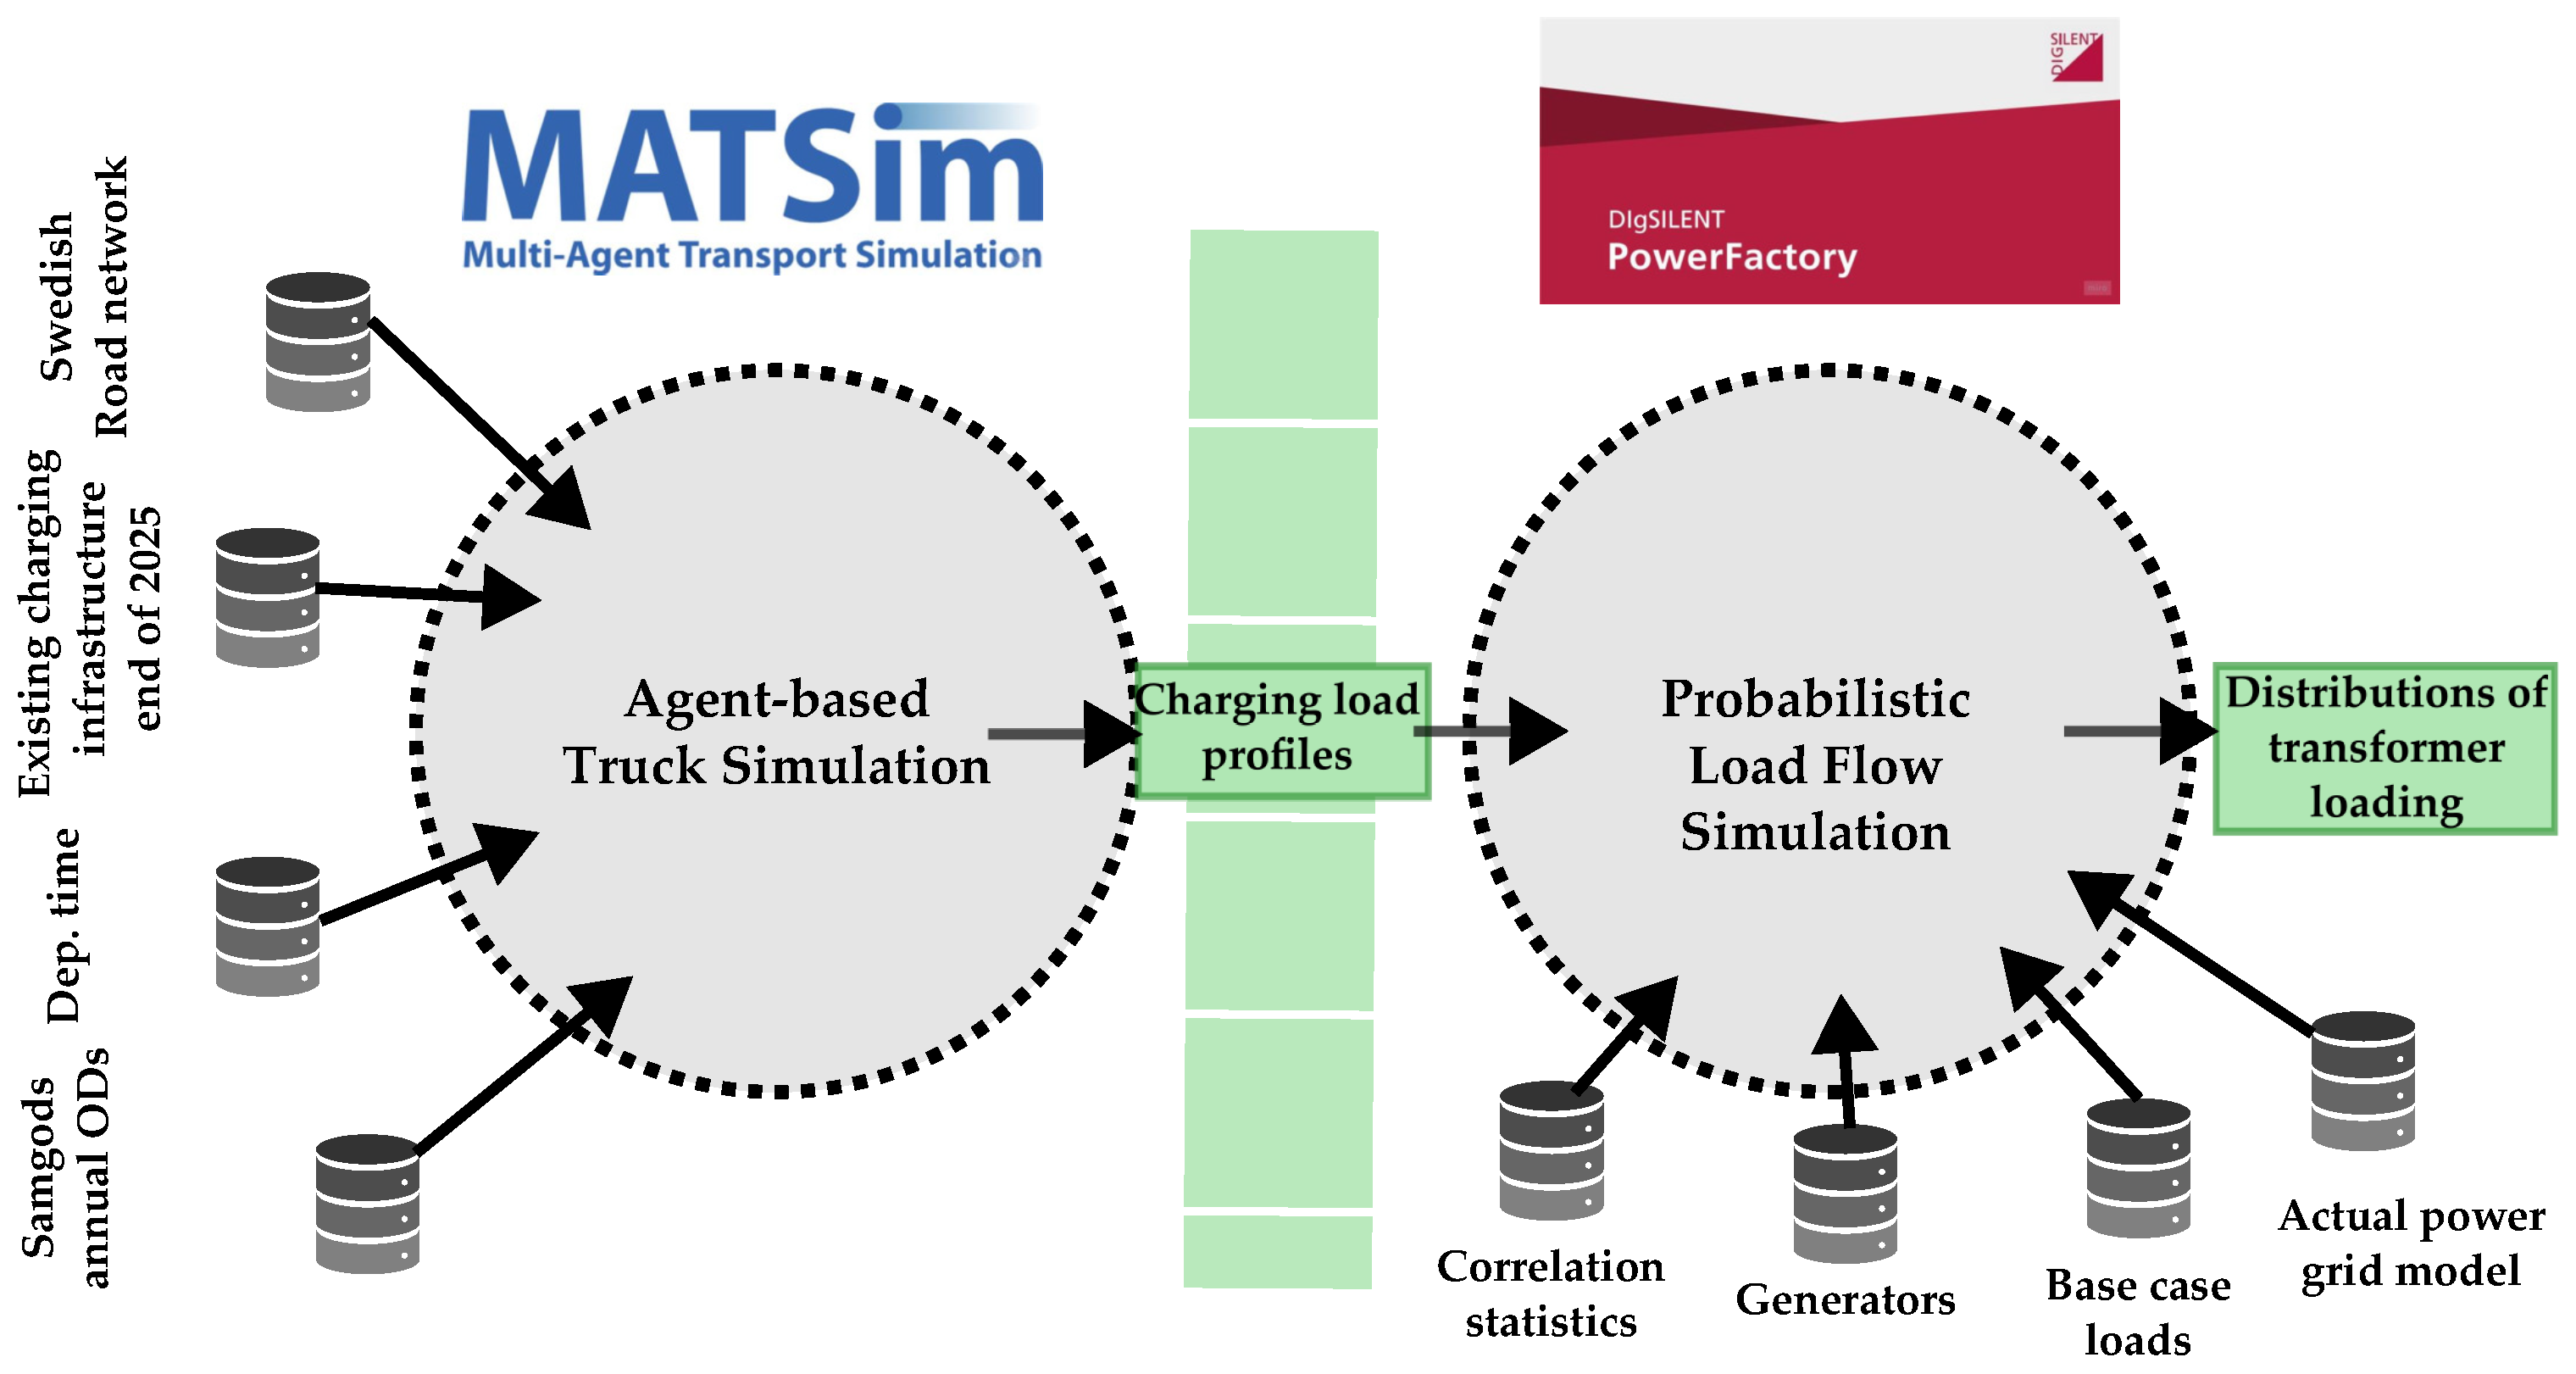
The connection between the agent-based transport simulation and the probabilistic load flow (PLF) model is crucial for this study. Figure 2 provides a schematic overview of this interface, detailing the data inputs, the intermediate processing steps, and the final outputs that link the two systems.
Figure 2.
Total overview of the data inflow and outflow when combining the simulation procedures.
The transport model is constructed by integrating four primary data sources: the Swedish road network from OpenStreetMap, charging infrastructure locations from the ‘Regionala Elektrifieringspiloter’ program, foundational annual trip data from the Samgods database, and daily departure time distributions from truck manufacturers.
The agent-based simulation processes this information to produce two distinct types of charging demand: en-route fast charging at public stations and end-of-trip charging at depots. These demands are aggregated into hourly power profiles for each charging station and depot location.
This aggregated charging load data is the primary output of the transport simulation. It is then fed into the PLF simulation as a new, highly resolved load component. For each PLF iteration, this new load is combined with other stochastically generated inputs: non-BEV base case loads are generated by bootstrapping 10-year historical data, while wind and Combined Heat and Power (CHP) generation are drawn from synthetic probability distributions. Correlation between the new BEV loads and existing base case loads is modeled using copulas, while generators are assigned fixed average correlations based on previous work. The PLF simulation then produces a probability distribution of the resulting loading for each grid element. Since no contingencies are considered in this study, power lines do not experience overloads, and the analysis is therefore focused on the loading of transformers.
2.4. Power System Model & Probabilistic Load Flow
A probabilistic load flow (PLF) simulation is run using the simulation tool DIgSILENT PowerFactory [22] to analyse how truck charging impacts the grid capacity. The grid model used is the actual transmission (400 kV) and sub-transmission (135 kV) grid model used by the grid owners in the study area. Due to security constraints, the model can not be shared openly, but some key statistics are listed in Table 1. The grid has a meshed topology.
Table 1.
Grid elements in grid model used.
The inputs to the PLF simulation are distributions of truck charging loads, base case loads, and generators in the system. The bootstrapping method [23] is applied to draw random values from the truck charging load time series generated by the MATSim simulation. For the base case loads, 10 years of historical hourly data are available, on which the bootstrapping method is applied to draw random values.
The generators in the study area mainly consist of distributed wind power and combined heat and power (CHP) plants. Parameterized probability distributions to model wind power plants have been developed in [24] and are used as input in this study. Wind power generators are modeled using Weibull distributions, as in:
where ( being the rated power of the wind power plant) and k = 0.85. These parameters were calculated in [24] based on historical wind power data in the study area. The CHP plants are modeled using uniform distributions as described by:
where is the maximum and the minimum power of the plant.
The different input parameters to the PLF simulation can not be assumed to be independent. Studies have previously shown that electric vehicle (EV) charging loads from cars are highly correlated to other loads in the system [25], which implies that the same may be true for truck charging loads. This is considered by calculating a correlation matrix from the generated truck charging profiles and the 10-year datasets of basecase loads. The correlation is then captured in the PLF simulation by using Gaussian copulas [26]. Based on Sklar’s theorem, a copula C links the random variables X and Y, which have continuous cumulative distribution functions (CDFs) and , if their joint distribution can be expressed as
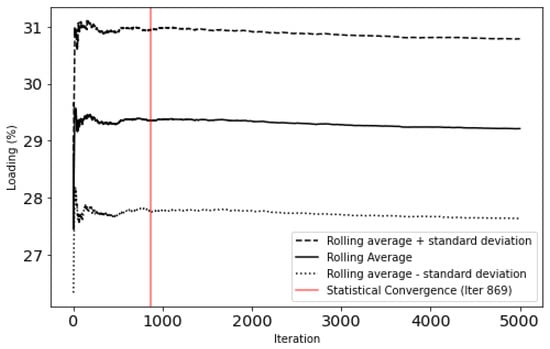
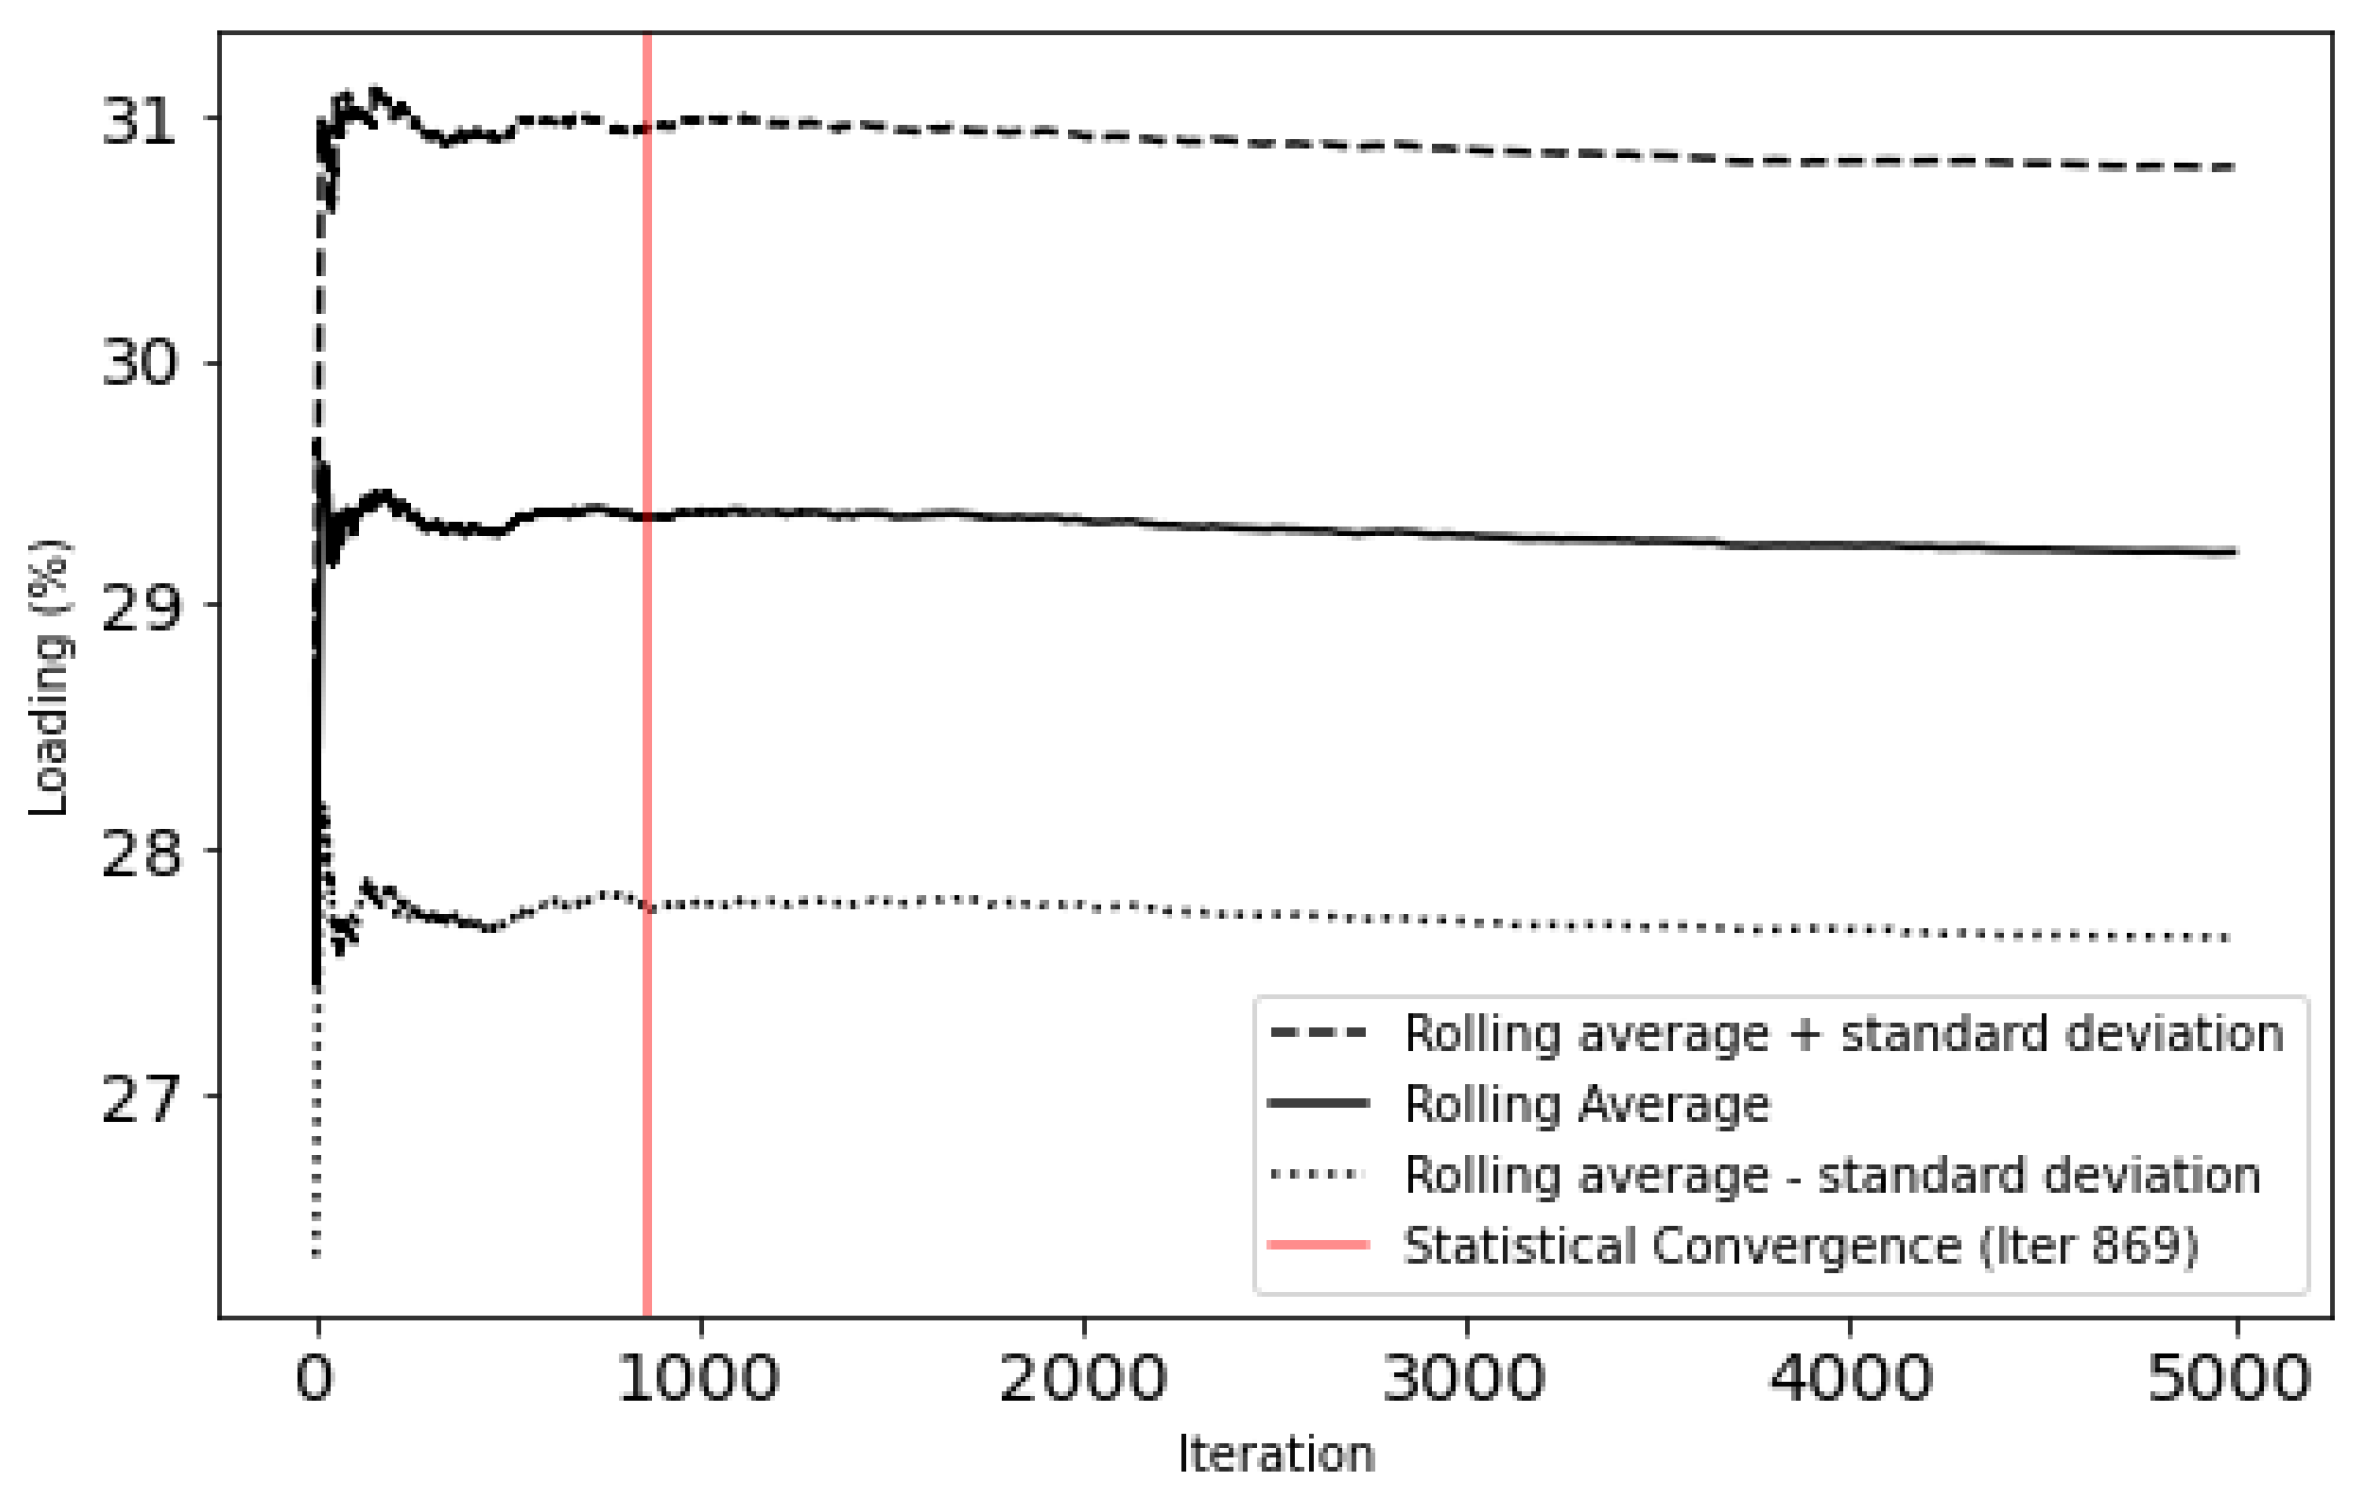
The PLF simulation was run for 5000 iterations. To verify the convergence of the PLF simulation and ensure that key risk indicators had stabilized, the following statistical convergence criterion was implemented. The relative change in the rolling average of the transformer loading was evaluated over a moving window. Let represent the rolling average at iteration N, and k represent the window size. The relative error was calculated as:
A window size of iterations and a strict maximum tolerance threshold of were applied. The simulation is considered mathematically converged when this relative error permanently falls below the threshold.
3. Results
The combined simulations provide detailed information regarding the charging demand for each agent and station, as well as the impact of charging stations on the nearest primary substation transformer.
3.1. Charging Load Profiles
The simulations generate two distinct categories of electricity demand: en-route fast charging at public stations and end-of-trip depot charging for vehicles domiciled within Skåne. The following sections analyze the characteristics of these two load profiles, both individually and in comparison.
3.1.1. Public Fast-Charging Demand
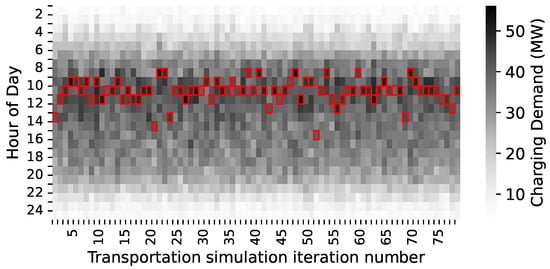
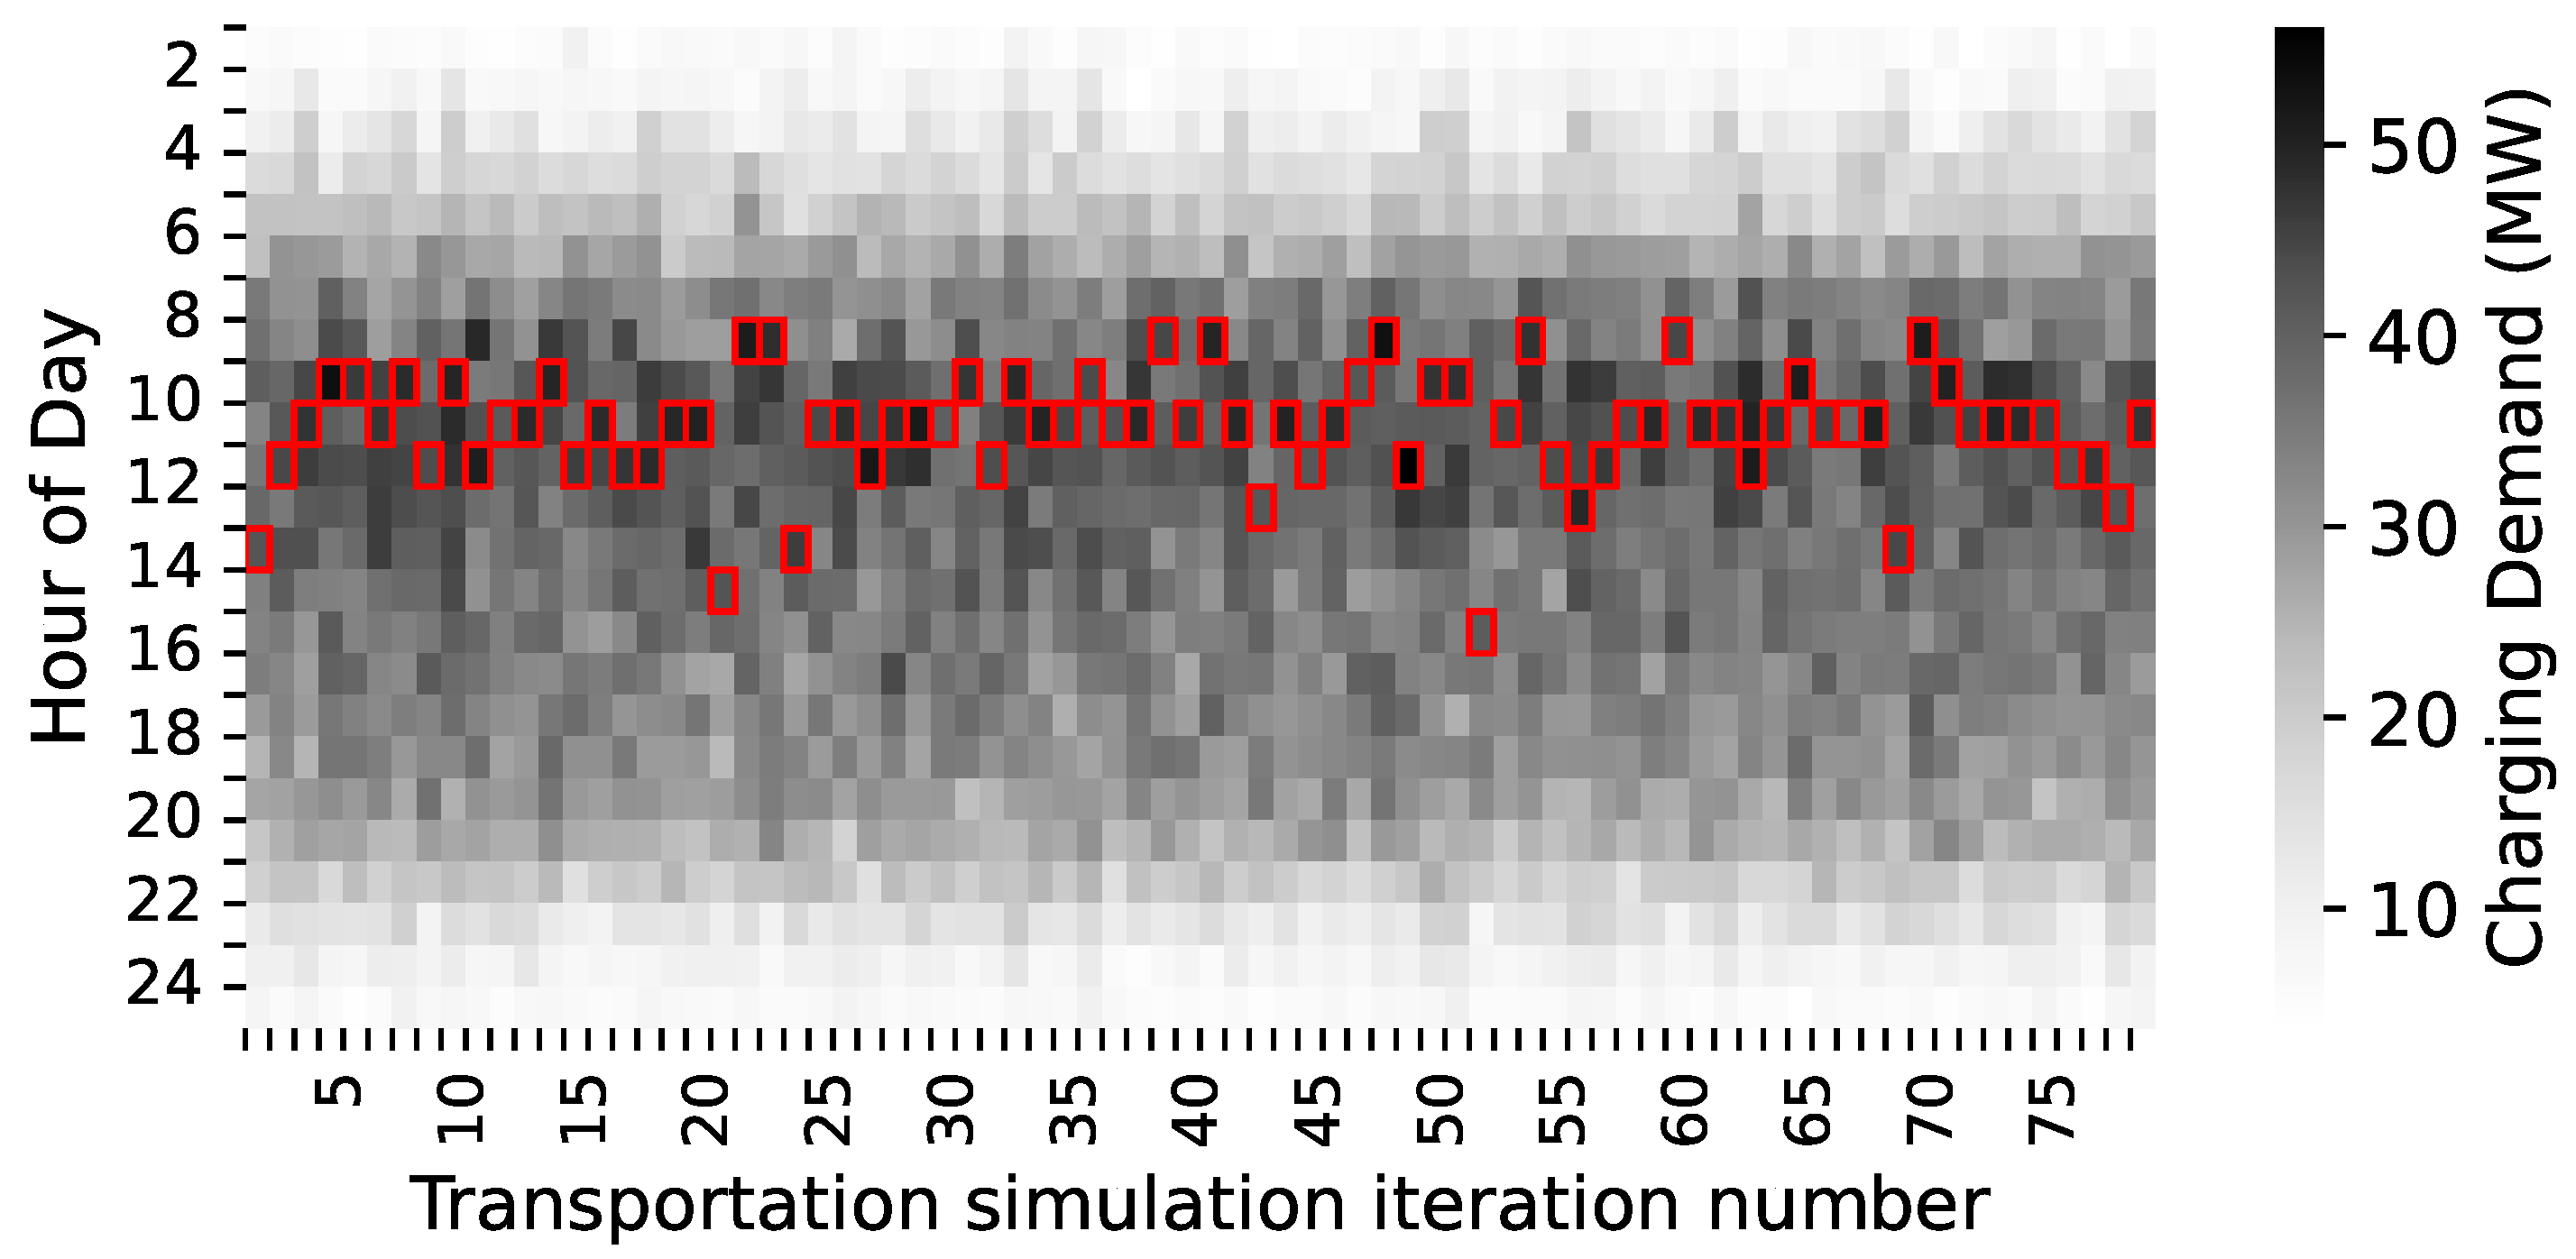
As the conditions of the simulated population vary, so does the demand for public fast charging. The resulting aggregated demand across all stations and simulation runs is shown in the heatmap in Figure 3. The profile is characterized by a distinct daytime peak, with the highest demand consistently occurring between 9:00 and 12:00. This morning peak is primarily driven by agents starting with a lower initial SOC and requiring an early charge to complete their daily trips.
Figure 3.
Charging demand for trucks for all public charging stations across the independent simulation runs with varying variables. The hour of peak power demand is highlighted in red.
3.1.2. End-of-Trip Depot Charging Demand
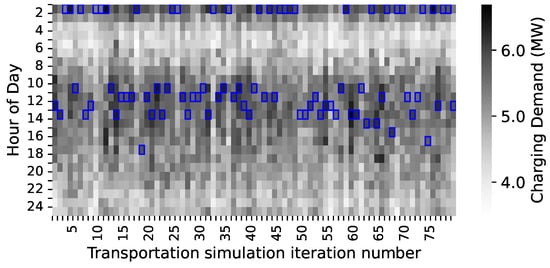
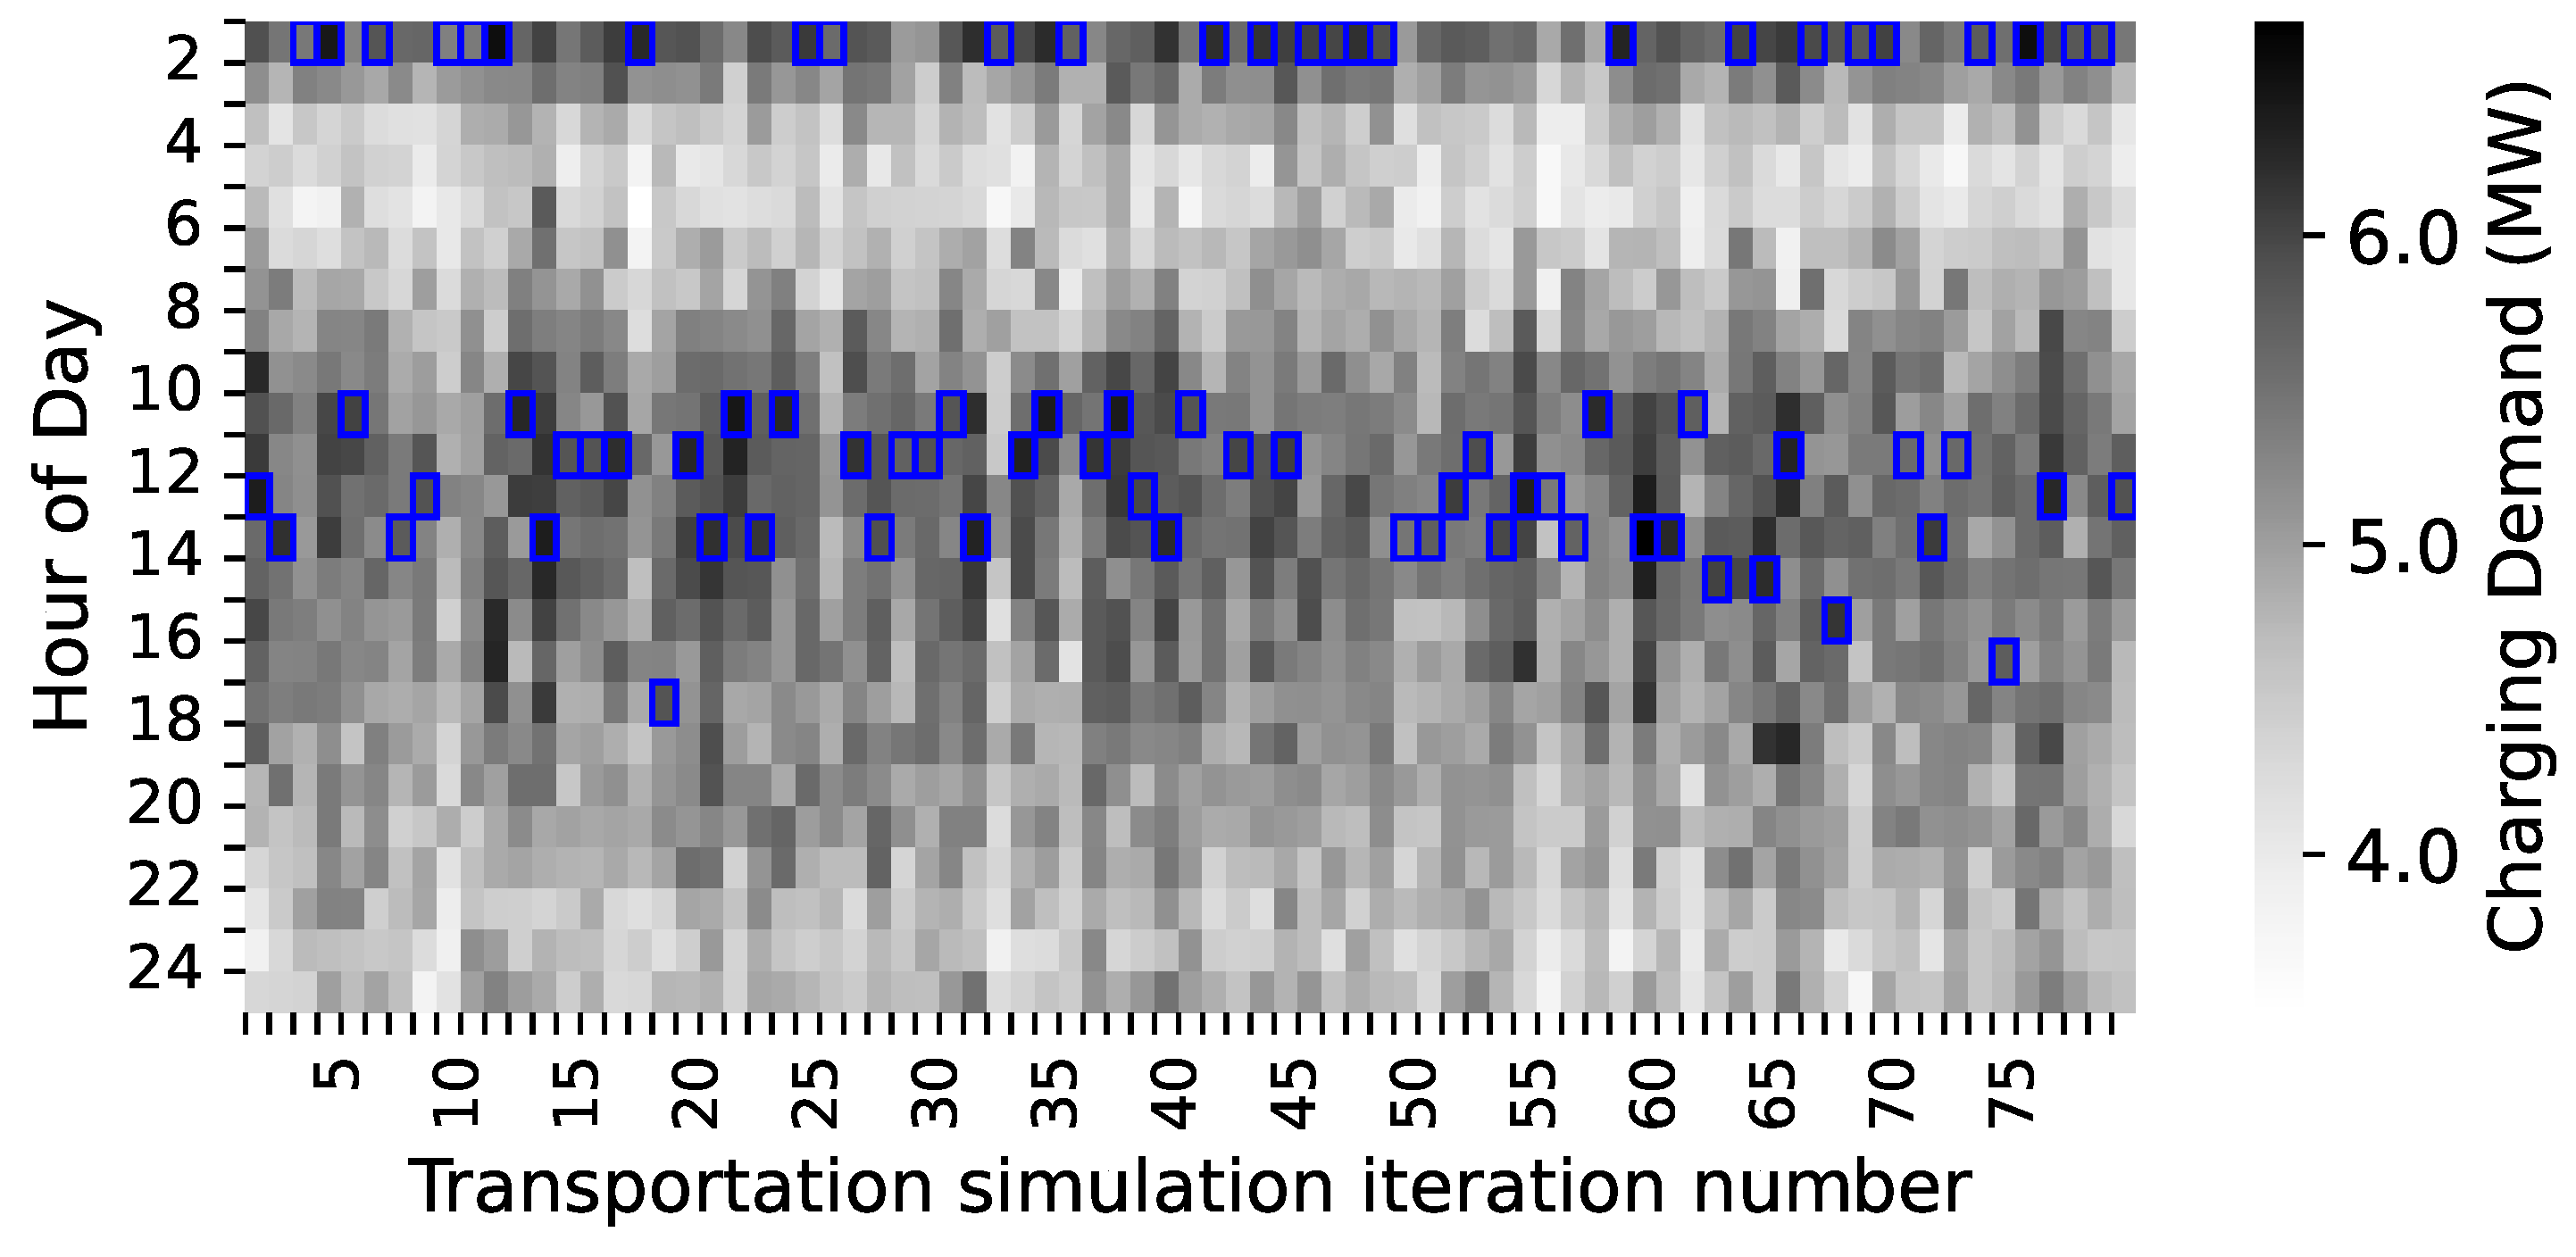
Figure 4 shows the optimized depot charging demand across all independent transport simulation runs. The shape of this load profile is driven by the depot charging windows, and hence by the resulting vehicle arrival times and the duration of the depot stop (sampled from empirical data). Specifically, more trips conclude in the evening (≈22%) than in the early morning (≈8%). Paired with the distribution of depot stop durations, these evening arrivals drive a peak in charging demand during the night hours prior to morning departures. Conversely, the broad daytime charging demand is primarily driven by vehicles that arrive early at the depot and are assigned a break short enough to allow a new departure in the same evening. The figure also reveals that the timing of depot demand varies across simulation runs: iterations with lower initial SOC or smaller battery capacities force extra en-route charging stops, delaying final arrivals and pushing the peak charging demand to a later time.
Figure 4.
Optimized end-of-trip depot charging demand across the independent simulation runs. The primary variables altered are initial state of charge (SOC) and battery capacity. The peak power demand is highlighted in blue.
A key characteristic shown in the figure is this temporal shift, which is a direct consequence of the main variables being altered between simulation runs: initial SOC and battery capacities. Simulation runs with lower initial SOC or smaller battery capacities induce extra en-route charging sessions for the agents. These additional stops add significant time to the daily schedule, thus affecting the final arrival time at the depot. As a result, the optimal window for the end-of-trip charge is pushed progressively later.
3.1.3. Statistical Comparison of Charging Demands
A statistical analysis of the demand across all the independent transport simulation runs reveals that the total required energy is predominantly for public charging, which accounts on average for 82% of the total, while end-of-trip depot charging constitutes the remaining 18% on average. This distribution is a direct reflection of the model’s focus on long-haul freight transport. An analysis of the underlying trip data shows that the vast majority of simulated trips (approximately 81%) are transit journeys that pass through Skåne without starting or ending there. These long-haul trips rely almost exclusively on public en-route fast charging. In contrast, only about 10% of trips conclude within Skåne, making them candidates for the end-of-trip depot charging. Notably, the model does not include local distribution trucks, evidenced by the fact that 0% of trips both start and end within the region. Including a more detailed representation of local distribution fleets would likely shift the energy balance significantly, increasing the proportion of predictable, low-power depot charging.
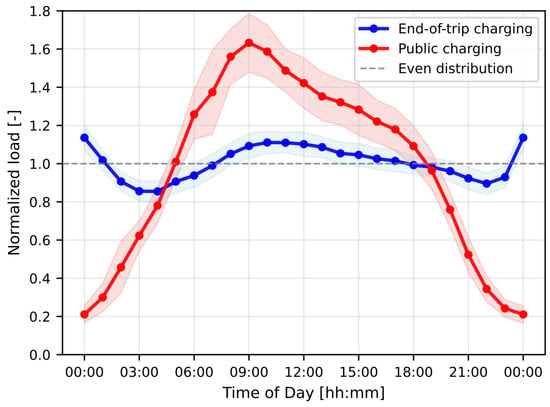
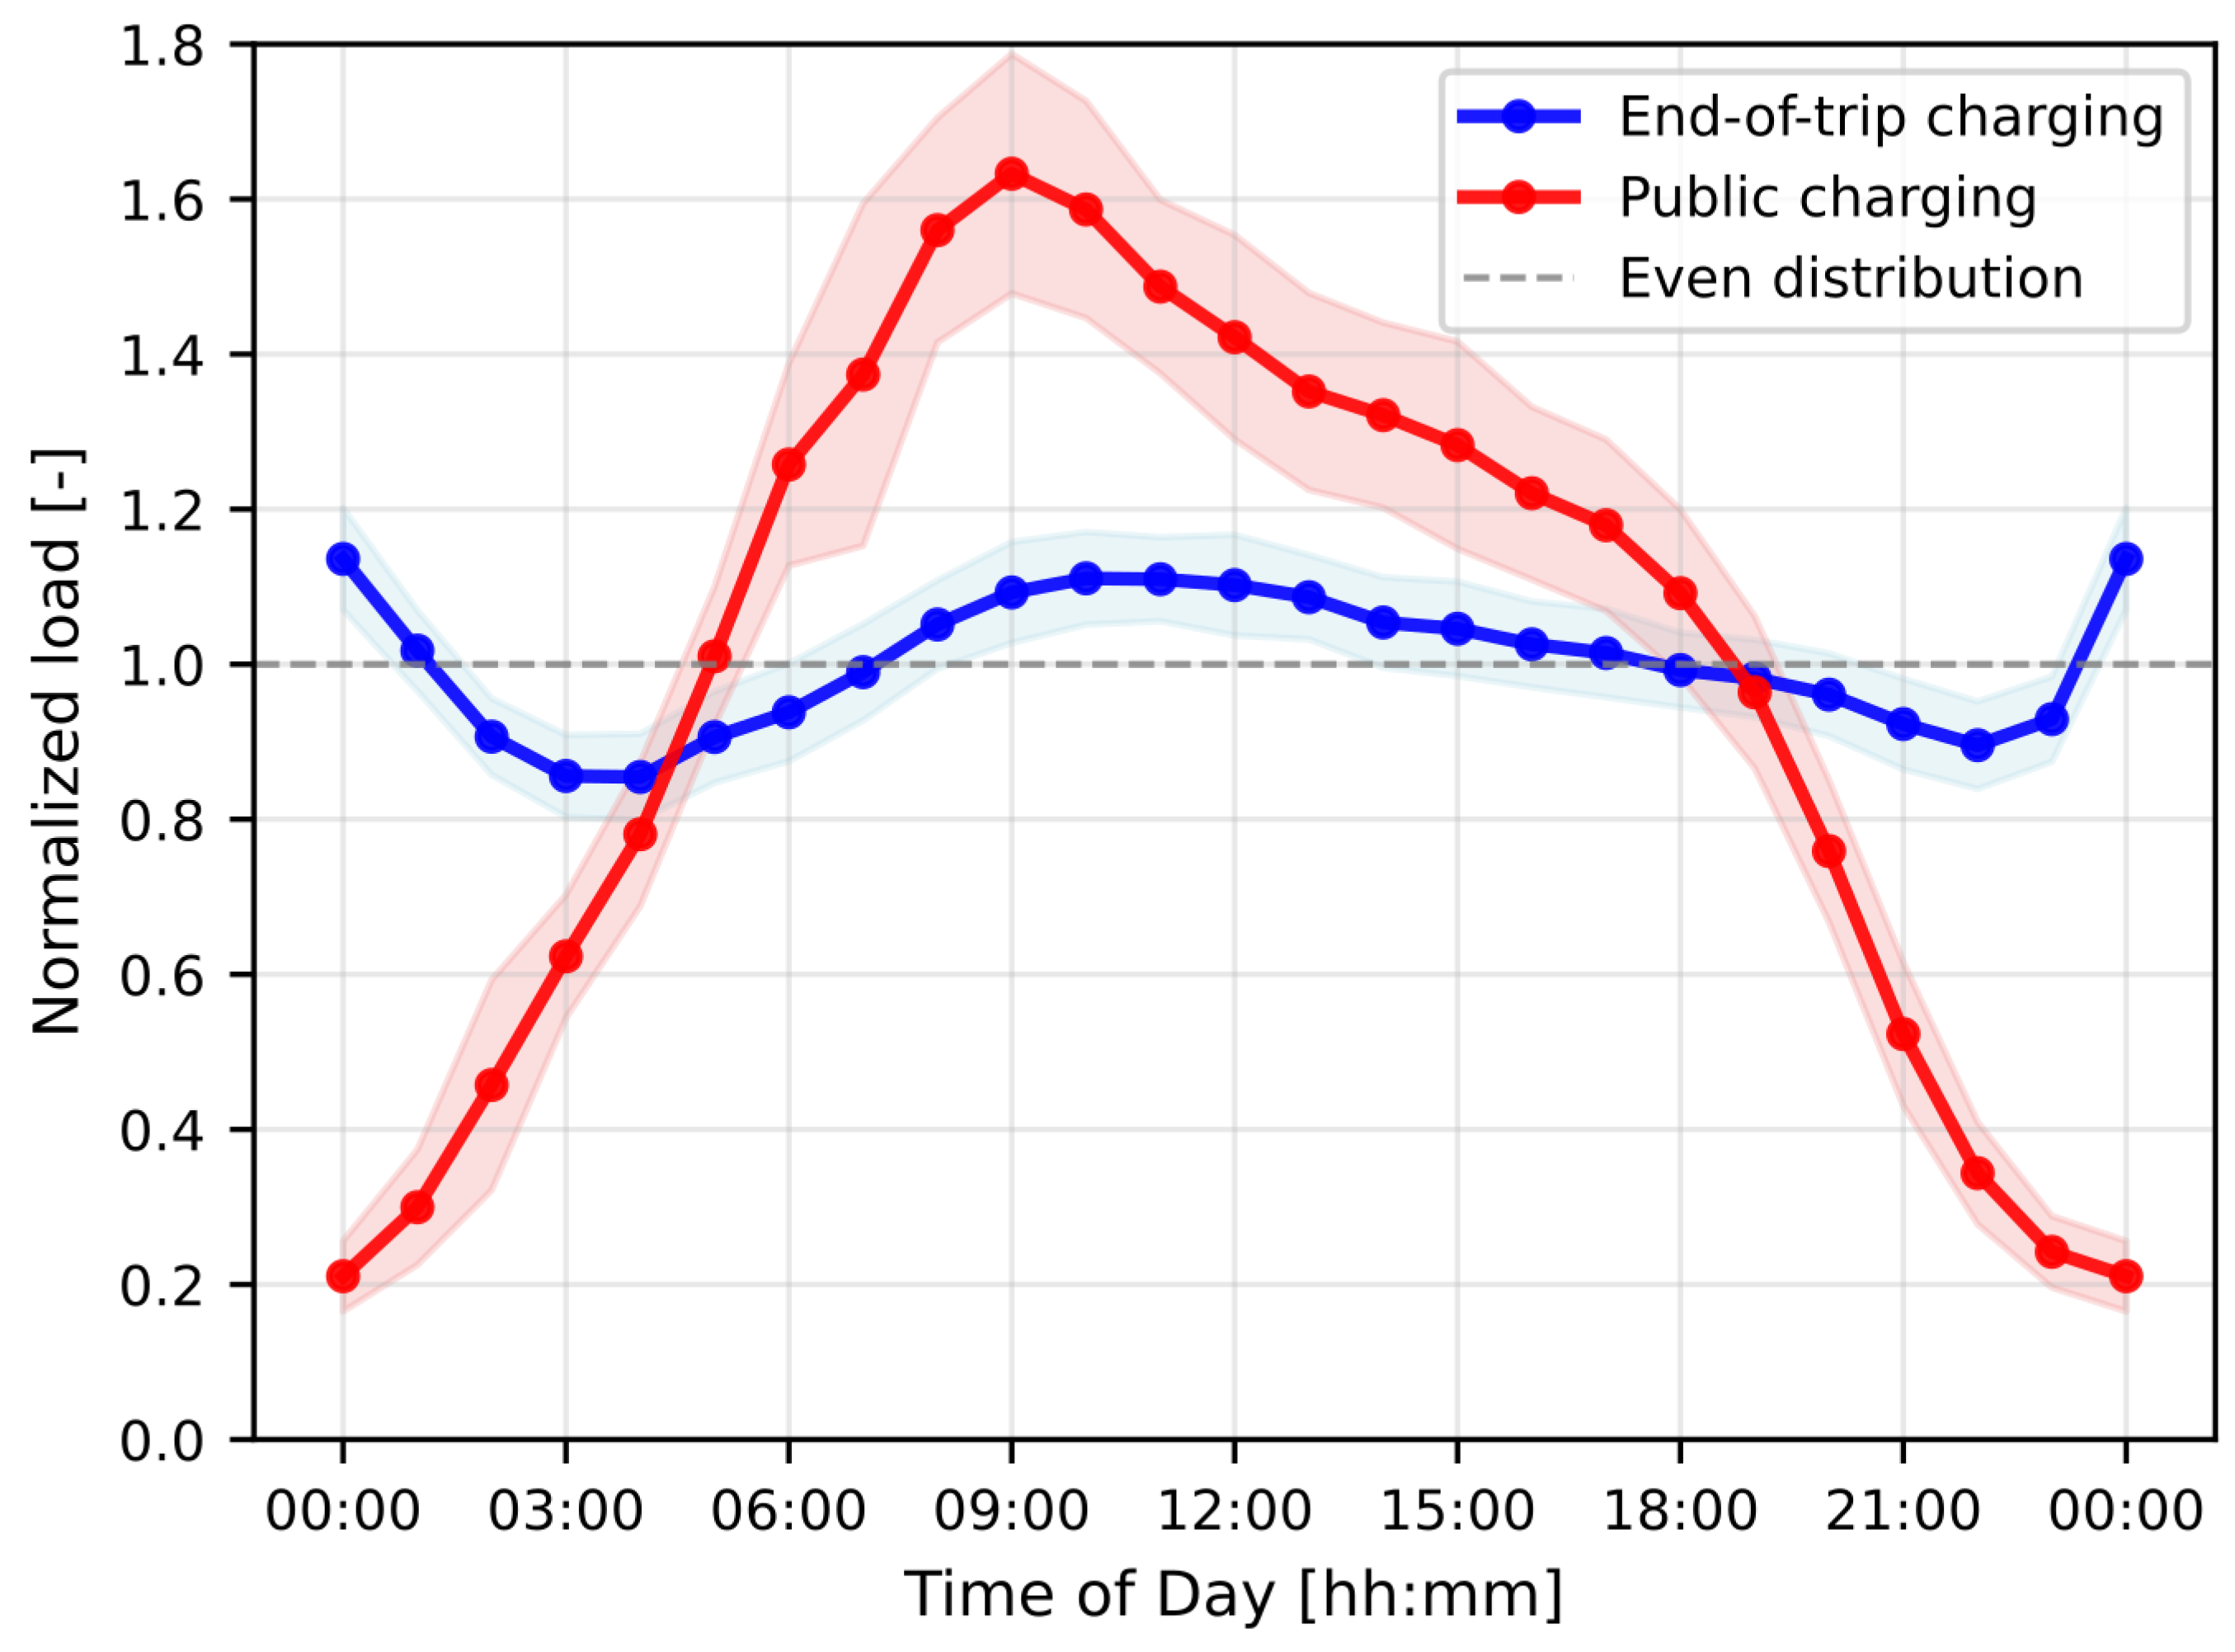
The analysis reveals two fundamentally different charging demand profiles for end-of-trip depot charging and public en-route charging, each with distinct implications for the power grid. The primary difference lies not in the day-to-day variation of total energy, but in the temporal shape of the demand within a 24-h cycle, as illustrated in Figure 5.
Figure 5.
Temporal distribution of charging demand, comparing end-of-trip depot and public charging infrastructure. The y-axis is normalized in relation to a perfectly even distribution. Solid lines represent the mean charging load at each time step across all simulations, and shaded areas show ±1 standard deviation reflecting the variance between these individual simulation runs (assuming normal distribution).
End-of-trip depot charging demonstrates a relatively flat temporal profile, a direct result of the LP optimization. With a within-day coefficient of variation (CV) of 8%, the demand remains relatively uniform across all hours, and the peak hourly demand accounts for just 5% of the total daily energy. This indicates that the optimization model successfully utilizes the flexible depot charging windows of the depot-parked fleet to create a grid-friendly near-baseload demand. It is important to note that this optimized load is achieved using realistic charging windows derived from empirical stop-duration data [21]. The midnight peak reflects genuine operational behaviour, specifically the influx of evening arrivals, demonstrating that the LP optimization framework is readily equipped to handle real-world driving schedules and effectively smooth loads.
In stark contrast, public en-route charging exhibits a vastly more fluctuating pattern, driven by the uncoordinated, opportunistic nature of fast charging during operational hours. With a high within-day CV of approximately 48%, this demand is strongly correlated with daytime activity. The load peaks between 09:00 and 15:00, reaching, on average, 1.6 times the even distribution rate, before falling to less than half that rate during the stay at the depot. It should be noted that the magnitude of this peak is influenced by the assumption of unconstrained public charging capacity. However, as long as the total number of charging points in a geographical area remains sufficient, vehicles faced with an occupied station would simply use the nearest available alternative. While this shifts the charging event slightly in time and space, it does not significantly disrupt their schedules, leaving the aggregated demand profile largely unchanged. Only severe regional constraints would noticeably alter the peak, suggesting these aggregated profiles are robust to localized bottlenecks. This pronounced peak-driven profile presents a significant challenge for grid stability, requiring careful infrastructure planning and potentially demand-response strategies to manage the large fluctuations.
While their temporal shapes are significantly different, the magnitude of the total daily energy demand for both charging types varies similarly across the simulation runs. This variation is directly linked to the changing battery parameters. The initial SOC and total battery capacity determine a vehicle’s final SOC after completing its daily trips, which in turn dictates the energy required to reach the target for the next day’s departure. This variability can be quantified by analyzing the deviation from the mean daily energy demand across all runs. Public charging demand varies from a maximum increase of +10% to a minimum reduction of −7.5%. End-of-trip demand shows a slightly wider range, from +8.9% down to −12%. Despite these different ranges, their relative stability is similar, with a day-to-day CV of 4.1% for public charging and 4.5% for end-of-trip charging. This indicates that the changing battery parameters have a proportionally consistent impact on the magnitude of demand for both en-route and depot charging sessions. To facilitate transparency and further analysis, the detailed demand profiles and statistical summaries presented here have been deposited in a Zenodo repository [27].
3.2. Grid Impacts
The PLF simulation generates results in the form of probability distributions of transformer and power line loading. To check the convergence of the PLF simulation, the statistical criterion defined in Section 2.4 was applied to the rolling average of all transformers in the study area. Applying this criterion to the 5000 total iterations revealed that the rolling average and standard deviation of the loading mathematically stabilized already at iteration 869. This convergence test is visualized in Figure 6. Therefore, running the PLF for 5000 iterations provides a robust margin to guarantee that the probability distributions and tail risks are fully captured without premature truncation.
Figure 6.
Convergence plot of the rolling average loading of analyzed transformers. The iteration where the simulation reached statistical convergence is marked with a red vertical line.
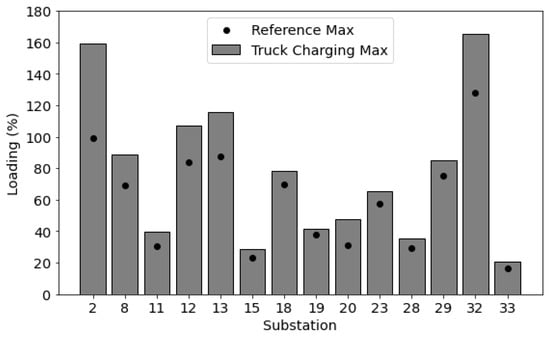
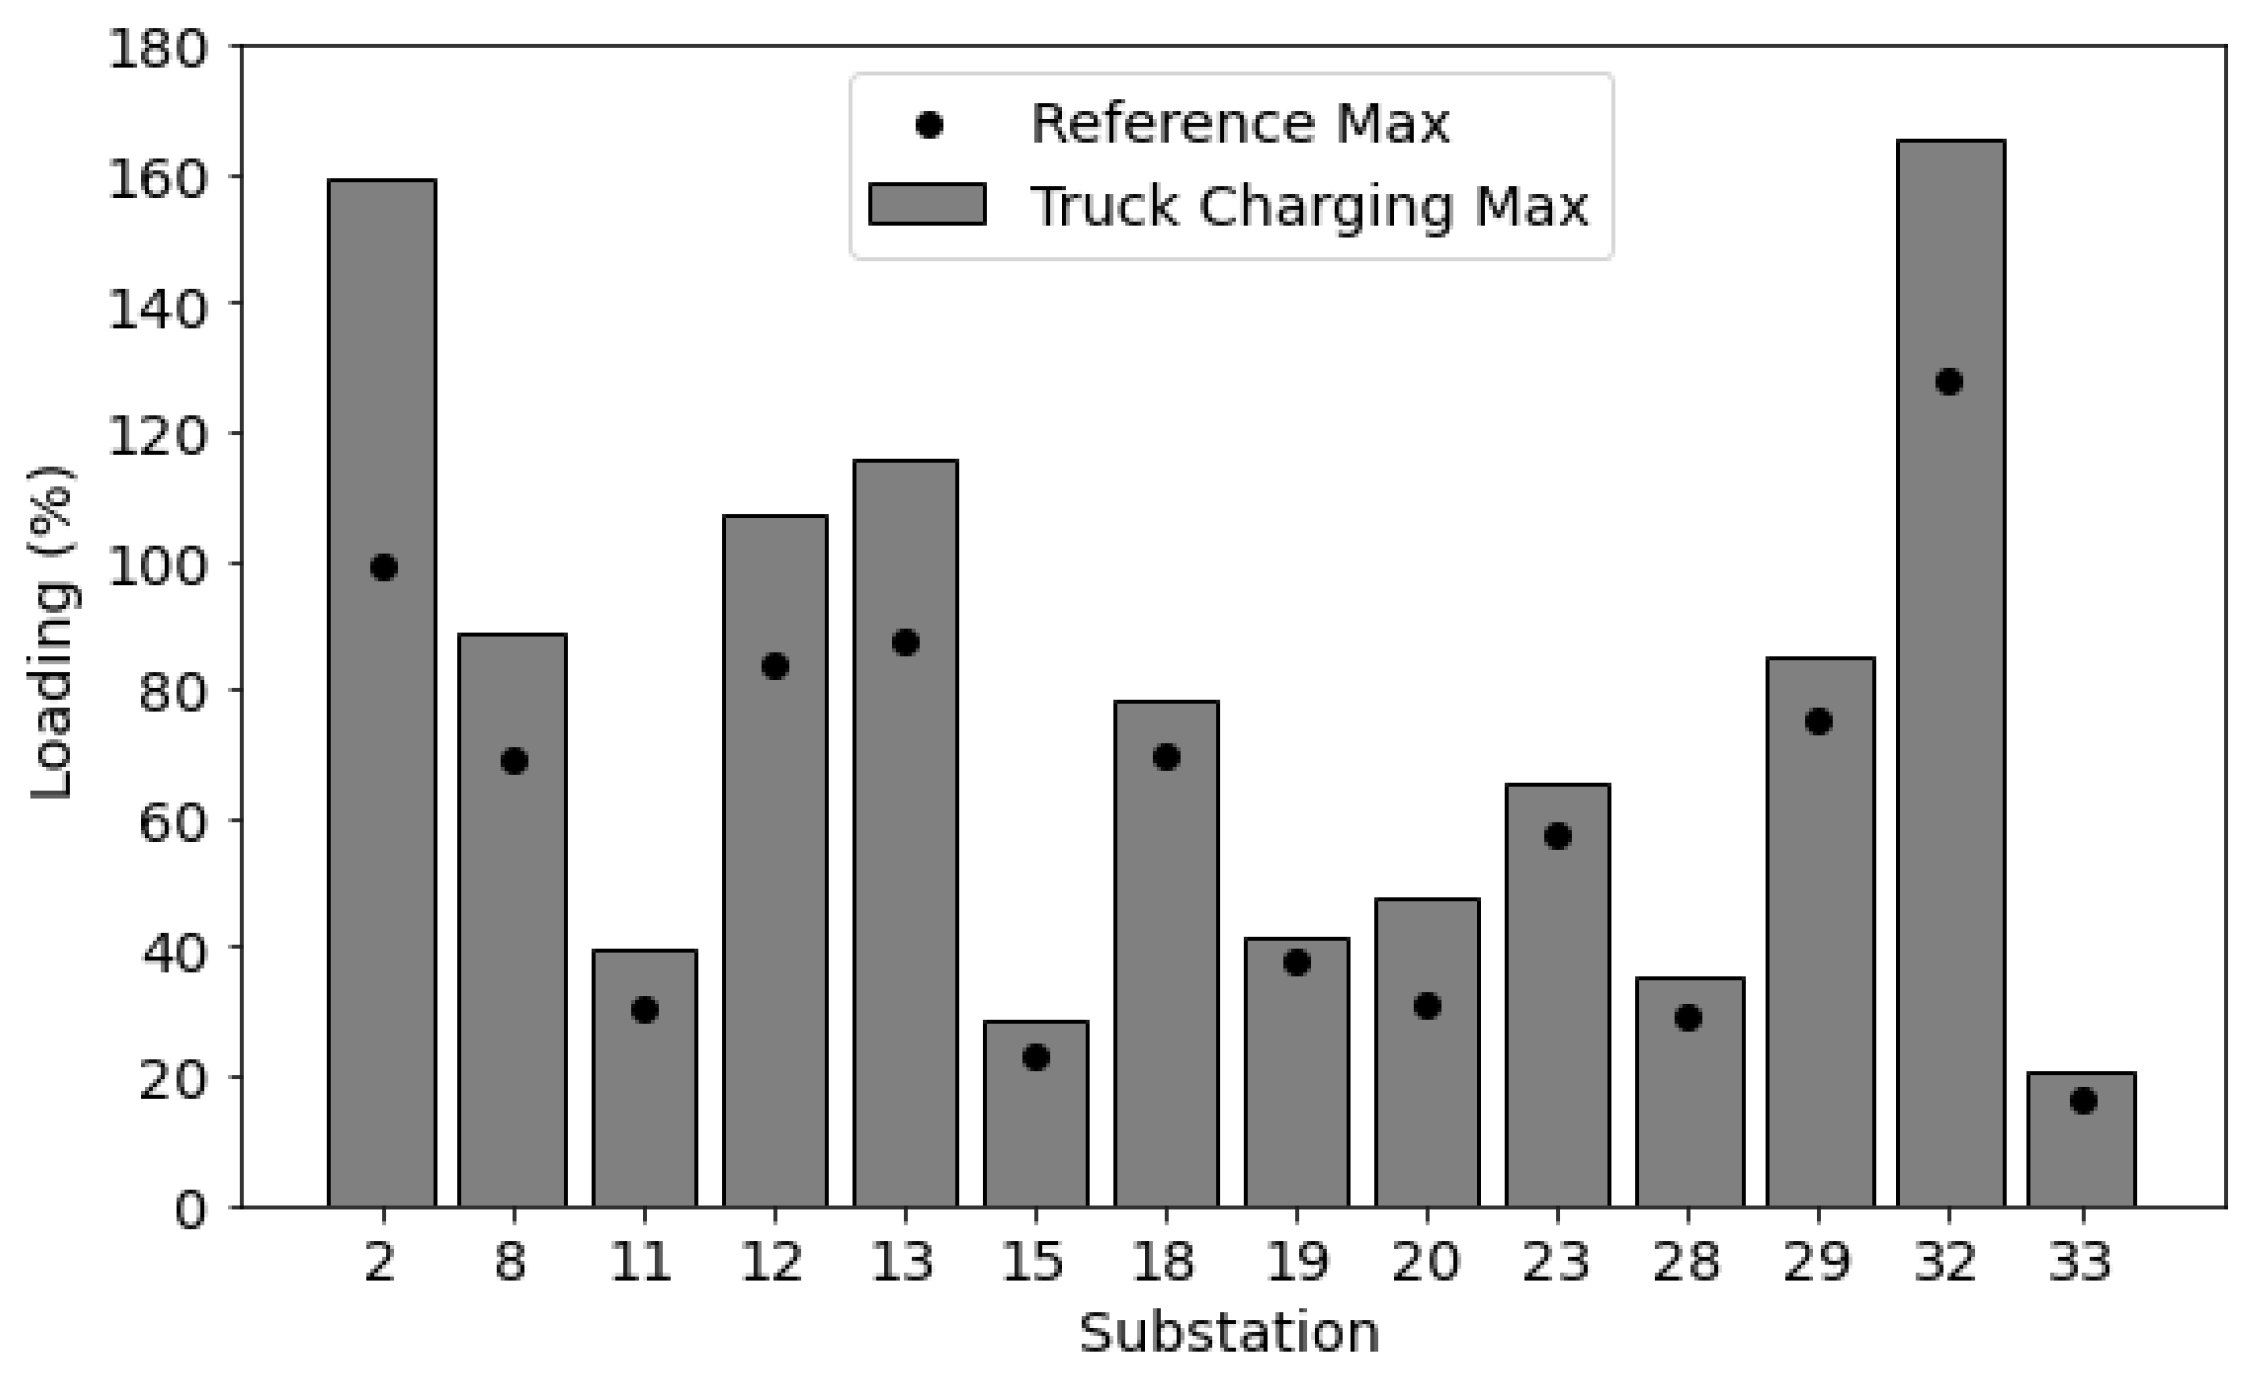
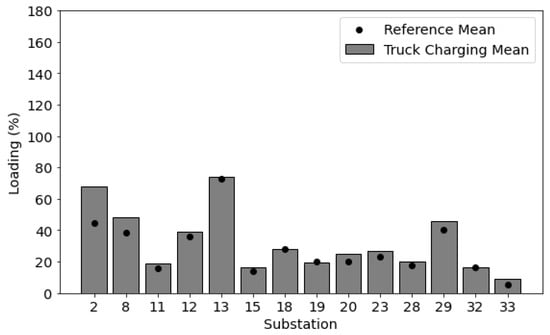
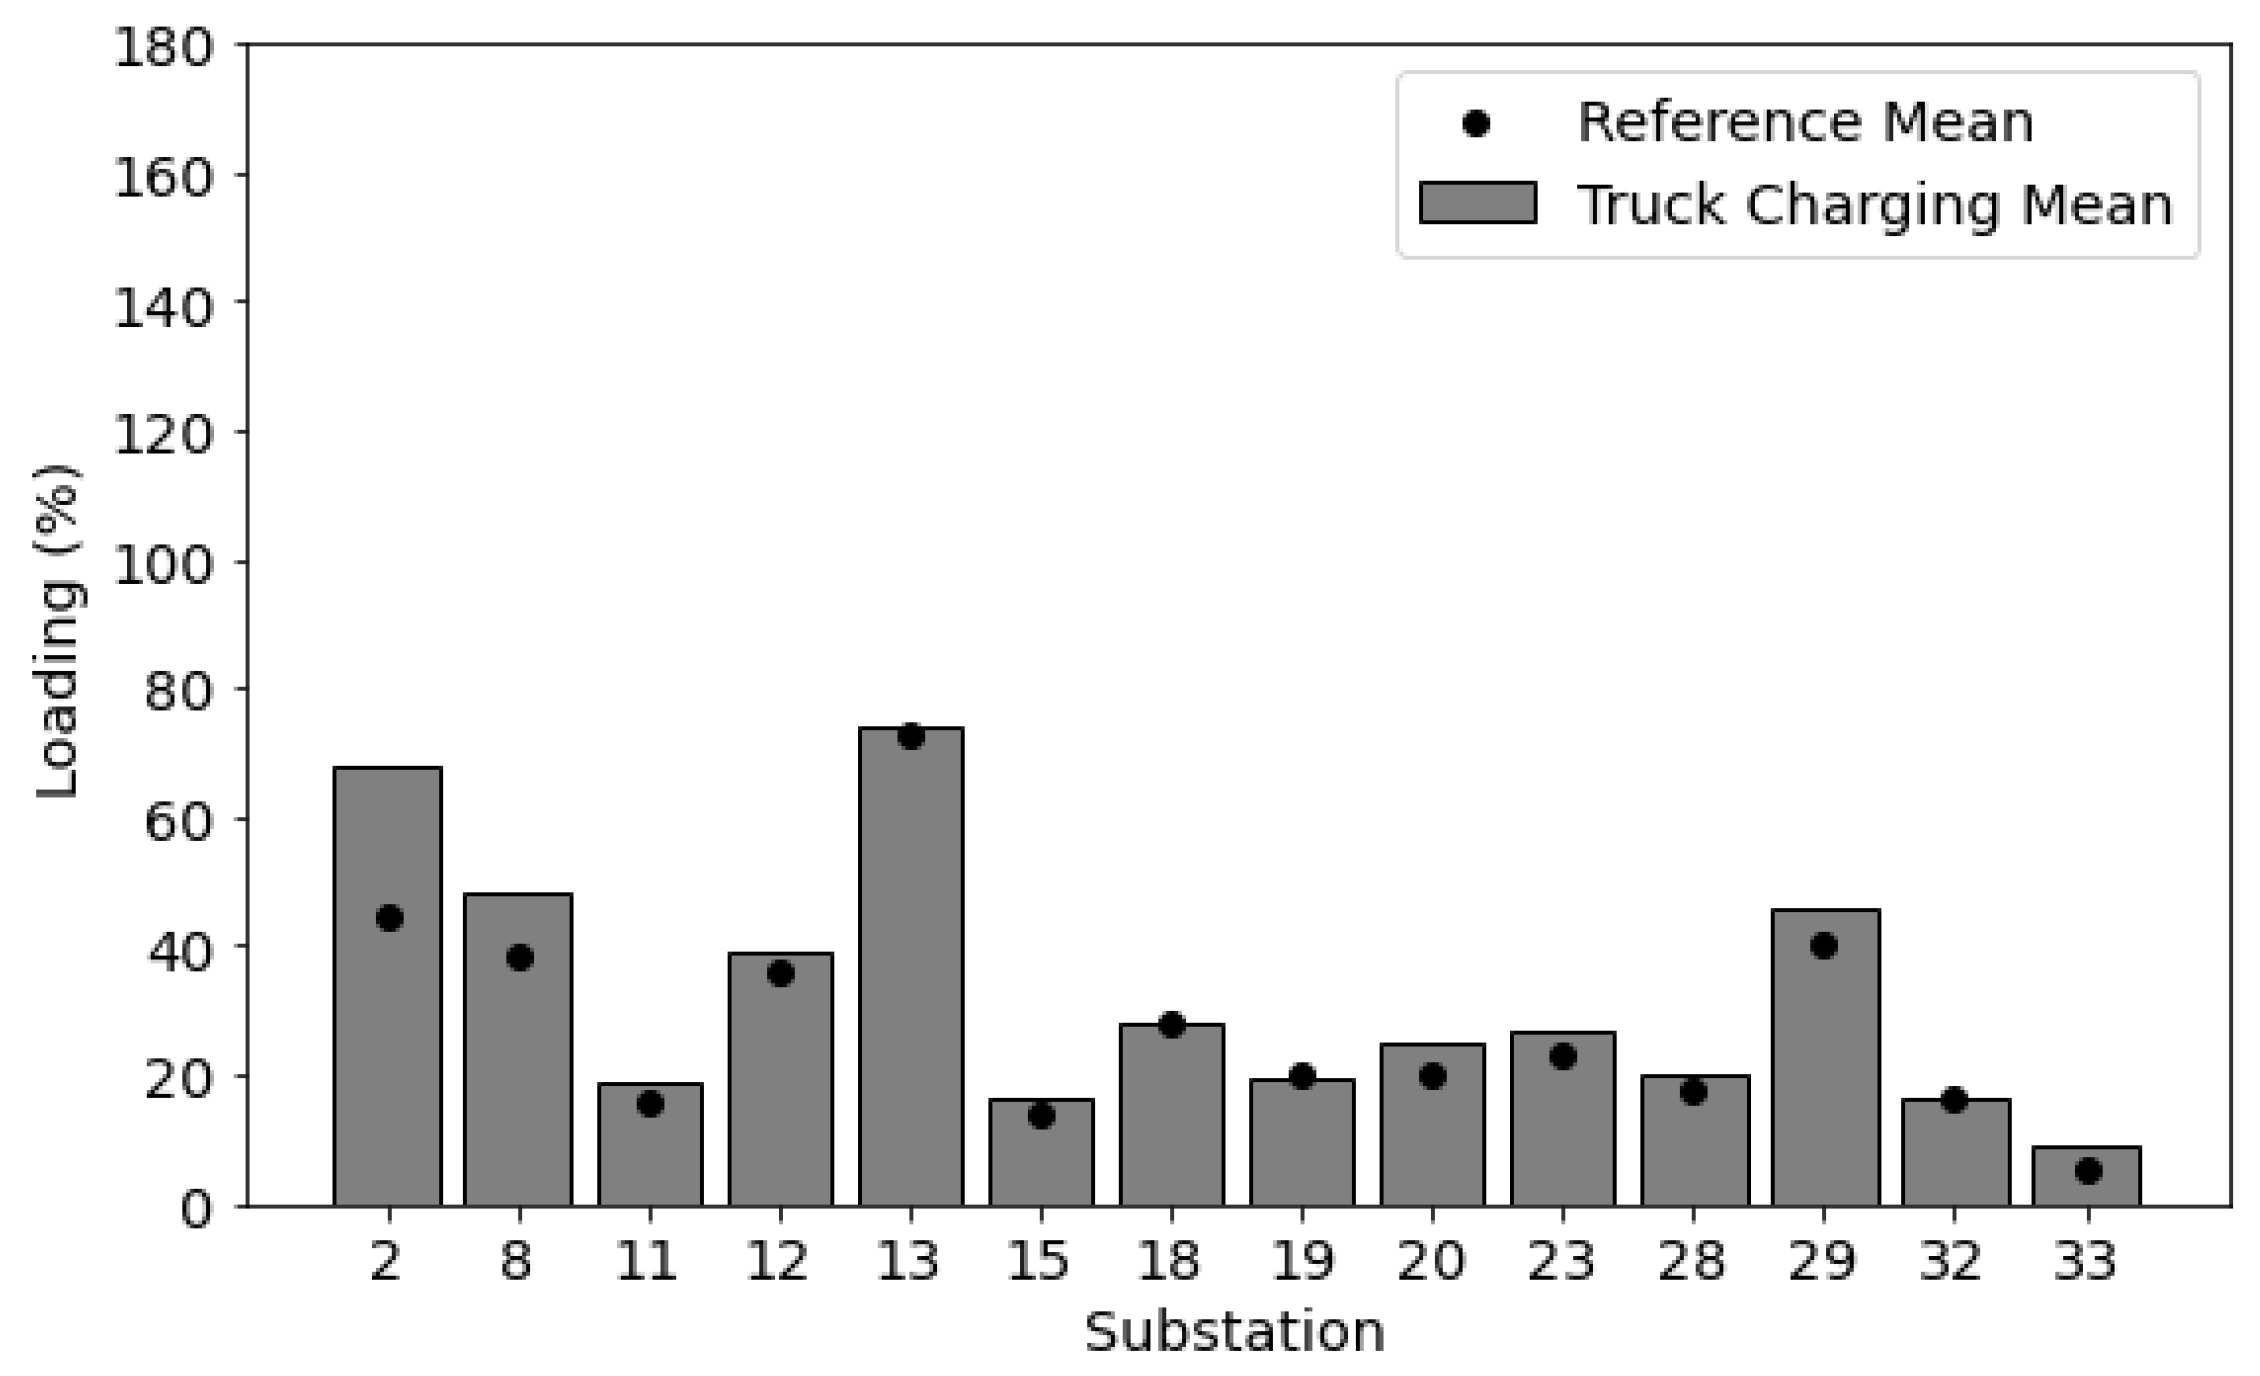
The PLF simulation indicates that introducing public truck charging may increase the average and maximum loading of the primary substation transformers in certain cases. In 14 out of the 43 primary substations where truck loads are introduced, the relative change in average or peak transformer loading exceeds 10%. Figure 7 presents the maximum loading of these substation transformers, while Figure 8 shows their average loading, both before and after the introduction of truck charging. The greatest increase in peak loading occurs at Station 2, where it rises from 99% to 159%. This station also sees a high increase in average loading, from 45% to 69%. Among the 14 substations exhibiting a significant increase in transformer loading, four (Stations 2, 12, 13, and 32) reach peak loading levels of above 100%. Additionally, substations 8, 18, and 29 reach levels of above 80%, indicating that they are approaching the limit. This indicates that a more detailed analysis needs to be conducted in these substations to examine how to meet the truck charging demand without overloading the substation transformers.
Figure 7.
Maximum loading of transformer stations with introduced truck charging compared to the reference case.
Figure 8.
Mean loading of transformer stations with introduced truck charging compared to the reference case.
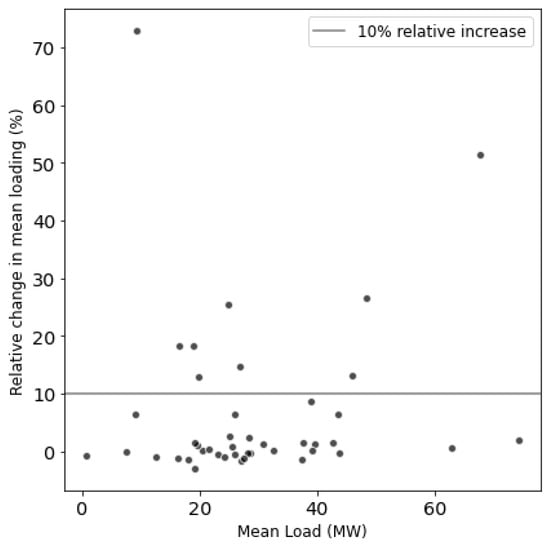
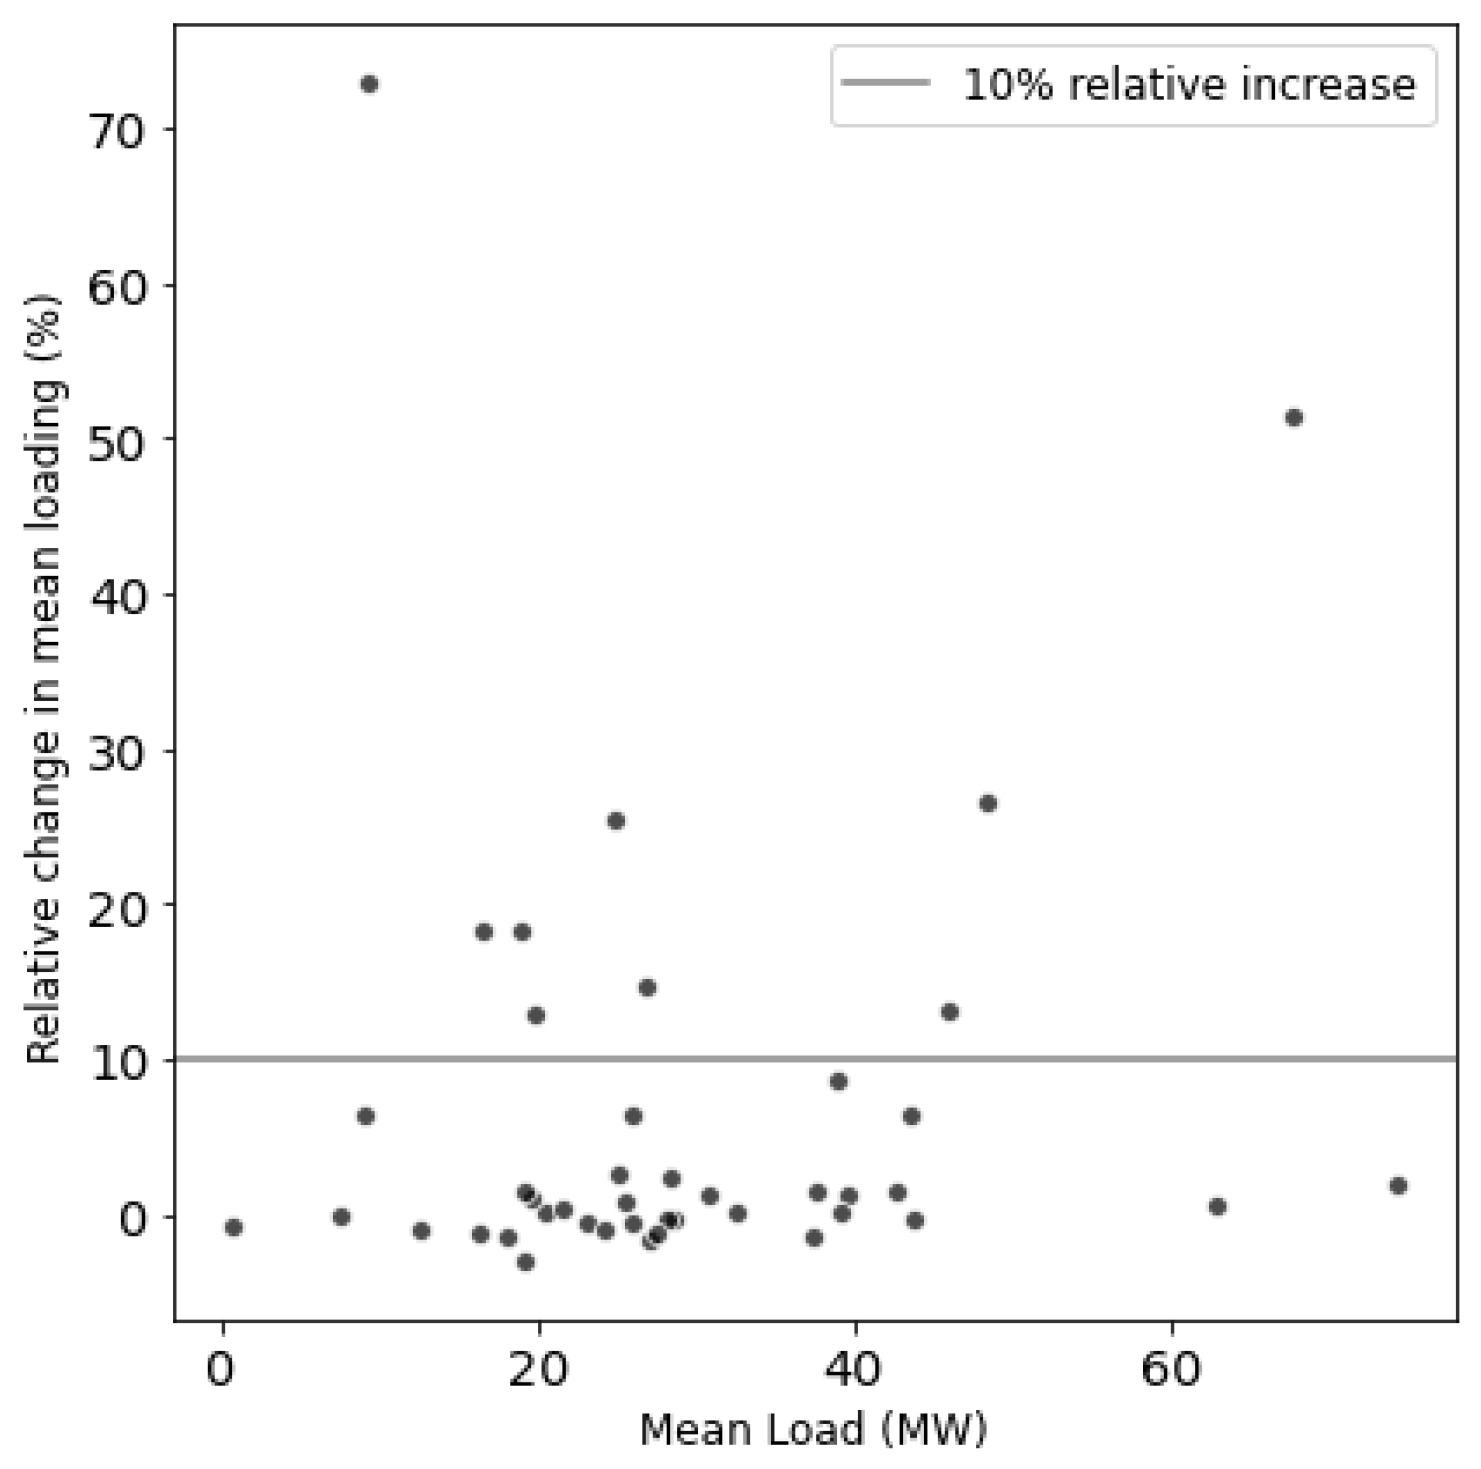
The grid capacity impact of the introduced truck charging load is highly dependent on the size of the primary substation transformer and its base case loads and generation. This can be seen in Figure 9, where the average truck load for all 43 substations is plotted against the relative change in transformer loading. The cut-off level of 10% relative increase on average loading as applied to the filtering above is marked by a horizontal line. 9 substations show a relative increase in average loading of more than 10%. Many stations present little impact on the average loading of the transformer, despite adding high truck charging loads. In fact, the substation with the highest average truck charging load does not show up among the 9 stations with more than 10% relative change in average transformer loading. Conversely, the station with the highest relative increase in average loading is a station with a relatively low truck charging load introduced (located at the top right in the scatter plot). This lack of clear correlation between the size of the introduced truck charging load and the resulting impact on the transformer loading highlights the need for power systems simulations and good local knowledge of the power grid studied when assessing the grid impact from new loads on the system.
Figure 9.
Comparison of average truck charging load and the relative change in average loading of the closest transformer station. The limit of 10% relative change in average loading is marked by a horizontal line.
4. Discussion
4.1. Implications for Infrastructure Planning and Power System Operation
The main findings of this study underscore a critical contrast in the load profiles generated by the two most common charging approaches for electric heavy-duty vehicles. Specifically, uncoordinated public en-route charging generates severe daytime load fluctuations, with peak demand reaching up to 1.6 times the even distribution rate, driven heavily by opportunistic midday charging sessions. In contrast, optimized depot-based charging, supported by empirical operational data regarding both arrival times and stop duration, yields a considerably more stable load profile. This demonstrates the inherent flexibilities of these approaches.
From a transport planning perspective, these results highlight the strategic importance of prioritizing depot infrastructure to support large-scale electrification. The extreme daytime peaks observed at public fast chargers suggest that relying predominantly on en-route megawatt charging is likely to create grid stress along major freight corridors. However, as demonstrated in Section 3.2, the actual impact on any given substation depends strongly on local grid conditions and cannot be inferred from the charging load magnitude alone; a detailed, location-specific analysis is therefore required before drawing conclusions about where grid upgrades are needed. These findings align with the broader literature on electric heavy-duty transport, such as Borlaug et al. [10], which emphasizes that optimizing logistics schedules around depot charging represents a far more manageable pathway to fleet electrification than overbuilding uncoordinated en-route networks. Alternative technologies like battery swapping or electric road systems could further decouple charging demand from stationary dwell times, possibly offering even greater flexibility. However, as these systems remain largely in the pilot phase in Europe and lack standardized large-scale implementation in the region, conventional plug-in charging remains the most relevant near-term baseline as a charging technology.
From a power system operation perspective, the probabilistic load flow results reveal that the unconstrained addition of megawatt-scale charging will cause severe bottlenecks. The observation that 4 out of 43 primary substations may experience transformer loading exceeding 100% (with one reaching 159%) due to the installation of new charging loads highlights a need for proactive grid reinforcements or flexibility measures. Considering the long lead times in grid expansion, grid operators and charging station operators will likely need to rely on flexibility measures. For example, Mohamed et al. [14] and Hammam et al. [13] suggest that co-locating stationary battery energy storage systems (BESS) and photovoltaic generation at public charging hubs could be vital to shave the severe daytime peaks identified in the transport simulation. Future work could therefore include such flexibility measures in the simulation framework developed in this study.
An important finding of this work is that the impact on transformer loading does not scale proportionally with peak charging demand, as shown in Figure 9. This contradicts the common assumption that a mitigation of the peak loads (such as smoothing the charging profile by using technologies such as battery swapping, stationary batteries, or electric road systems) will automatically decrease the risk of congestion in the power grid. This finding underscores the importance of including realistic and geographically explicit grid simulations in order to draw any conclusions on the grid capacity impact of new charging loads. Future work should therefore include an analysis of how such measures affect the charging demand as well as the resulting grid impact.
4.2. Limitations of the Current Study
While this study provides a detailed, high-resolution link between electrified freight and the power grid, it is important to acknowledge the assumptions and boundaries of the analysis. The primary limitations relate to the model’s scope, the input data, and the idealized simulation environment.
First, the scope of the analysis is confined to the long-haul truck sector. Charging demand from other vehicle segments, primarily passenger cars, is omitted. Although origin-destination data for these vehicles is available, there is a lack of detailed statistics on trip departure times. Making assumptions about these patterns without a strong statistical basis would risk diluting the accuracy of the results. Furthermore, the model relies on a “statistically likely average day” to represent traffic flow. As the underlying aggregated annual freight data lacks the temporal resolution to isolate weekday or seasonal variations, this approach does not capture pre-holiday peaks or differences between weekday and weekend traffic, which could significantly alter charging patterns. Importantly, the absence of peak-period scenarios means that the presented transformer loading distributions characterize average conditions. Under high-demand periods, actual grid impacts could be higher. Moreover, such increases are unlikely to represent a uniform scaling of all routes; different freight corridors may grow at different rates, shifting the spatial distribution of charging demand and potentially stressing different substations than those identified here. To address these data constraints, future work should include targeted stress-scenario or sensitivity analyses that account for this route-level heterogeneity. The freight demand itself is also based on current economic data and does not yet account for future growth or changes in supply chains.
Second, the simulation environment includes several key assumptions. The most significant is that of an unconstrained charging infrastructure, where every station has as many charging points as needed to avoid queues. This was a methodological choice to quantify unconstrained demand, but it means the model does not account for real-world bottlenecks like queuing at busy stations or power limitations from the local grid connection. Consequently, the reported peak grid impacts should be interpreted as upper-bound estimates. In practice, finite charging capacity would introduce some dynamic rerouting and waiting times; however, as argued in Section 3.1.3, these effects are unlikely to be drastic as long as sufficient charging points remain available within a geographical area. Vehicles would simply redistribute to nearby alternatives without significantly altering the aggregated demand profile. Only a severe, area-wide shortage of charging capacity would produce meaningful queuing and noticeably flatten the peak. Accounting for such scenarios would require introducing numerous additional operational parameters, such as wait-time tolerance and rerouting logic, which would substantially expand model complexity. Finite charging point scenarios therefore represent a natural and important extension that would yield more conservative, operationally realistic demand profiles under conditions of severely constrained infrastructure.
A methodological limitation of this study is the reliance on a Gaussian copula to model the dependencies between input variables. While the Gaussian copula is widely adopted in PLF literature due to its scalability and computational efficiency for high-dimensional problems, it is mathematically characterized by zero tail dependence. In the context of grid impacts, this means the model may systematically underestimate the probability of ’simultaneously extremely high load’ scenarios, such as peak EV charging during periods of absolute maximum base load. However, it is important to contextualize this mathematical limitation within practical grid operations. Unlike inflexible base loads, EV charging is inherently flexible. In modern grid operations, extreme system load would result in reduced EV charging (e.g., via demand response, flexible tariffs, or other smart charging measures). Therefore, while future research could employ tail-dependent models (such as t-copulas) to explore unconstrained worst-case statistical boundaries, the conservative tail estimates produced by the Gaussian copula in this study may closely align with the load-curtailment realities of a managed smart grid.
The model also features a one-way data flow, where transport demand impacts the grid, but there is no feedback loop where grid conditions (e.g., high electricity prices) influence charging behavior. This prevents the analysis of smart charging or demand-response strategies. The absence of this feedback also means that grid congestion events are not reflected in the transport model outcomes, and charging demand profiles therefore do not self-moderate in response to grid conditions. In practice, however, the degree to which grid conditions would actually influence truck charging behavior may be limited by prevailing business models. Wholesale electricity price variations (e.g., on Nordpool) may not be passed through directly to the charging point, as Charging Point Operators (CPOs) may absorb or hedge these fluctuations. Logistics companies may furthermore operate under fixed-price contracts with CPOs, further decoupling their charging decisions from real-time grid signals. To the extent that such arrangements are in place, direct curtailment or explicit demand-response measures would likely be needed to achieve meaningful self-moderation. These effects are absent from the current model and represent a relevant direction for future work.
Finally, a key factor influencing the results is the modeling of the end-of-trip charging window. While the methodology ensures operational realism by sampling each vehicle’s depot stop duration from empirical distributions reported by the Swedish Transport Administration [21], a limitation remains regarding the aggregation level of this data. These stop-duration distributions represent fleet-wide patterns and do not capture company-specific or route-specific schedules. In reality, synchronized fleet departures from a specific private depot could create sharper, localized load peaks than the smoothed profile suggests. Future work could refine this load profile by integrating private operator schedule data, though acquiring such data currently presents a significant challenge due to its proprietary and highly confidential nature.
4.3. Future Research Directions
Building on this work, several research directions could be explored. A natural extension would be to broaden the model’s scope and realism. This could be achieved by incorporating the Swedish Transport Administration’s official prognoses for goods transport through 2045. Furthermore, by linking these projections to an electrification adoption timeline and thereby estimate which year corresponds to a certain percentage of electric trucks, a time-scaled power demand matrix could be developed. However, recognizing that long-term prognoses are inherently uncertain and highly sensitive to political, economic, and social variables, such an extension should not aim for deterministic forecasting. Instead, it should employ scenario-based modeling to explore a range of plausible socio-technical pathways. This approach would allow for a robust assessment of grid vulnerabilities across different future realities, rather than relying on a single predictive timeline. The model’s scope could also be expanded by incorporating passenger car demand, which would require establishing a statistical basis for their departure times through comprehensive travel surveys or the analysis of mobile phone data.
The simulation framework itself can also be enhanced. Introducing finite charging point capacities and queuing models would provide deeper insights into effects from potential delays. Implementing a feedback loop from the power grid model would enable the study of smart charging strategies, where agents’ charging choices would reflect the existing grid capacity limitations.
Finally, this combined modeling approach presents several branching research directions. The framework is well-suited to analyze the impact of different technologies on the power grid, such as electric road systems or battery swapping. Moreover, it could be used for optimization studies, for example, by altering logistic flows to minimize charging peak power demand and thereby reduce the stress on the electrical grid.
5. Conclusions
This study demonstrates a combined simulation approach that integrates detailed agent-based transport modeling with a probabilistic power system load flow analysis to assess the impact of large-scale truck electrification on the power grid. The approach enables a detailed estimation of spatial and temporal charging demand from electric long-haul trucks, which is an essential input for power grid impact assessments.
The key finding is that public en-route and depot charging impose fundamentally different burdens on the grid: the former produces a volatile, daytime-peaked profile with a within-day coefficient of variation of 48% that challenges grid stability, while the latter, when optimized with empirically sampled depot charging windows, yields a substantially smoother profile with a CV of approximately 8%. These contrasting profiles have direct implications for both grid reinforcement planning and charging policy: they suggest that public megawatt-scale charging hubs require more urgent grid attention than depot locations, and that incentivizing depot charging can substantially reduce grid stress.
The PLF simulation results show that introducing truck charging loads may lead to a significant increase in average and peak transformer loading. In a few cases, transformers become overloaded due to the introduced truck charging loads, indicating that the grid does not have enough capacity at these locations. Importantly, this study has shown that the peak charging demand does not scale proportionally with the impact on the transformer loading. This contradicts the common assumption that charging-peak mitigation is most important for avoiding grid congestion. Instead, this study highlights the importance of geographically explicit knowledge of local grid conditions to understand the potential impact of new charging loads on the system.
The analysis highlights the importance of accurate and detailed input data. While the current study focuses on long-haul freight due to available statistical support, including passenger vehicle demand would be a valuable next step, requiring more robust data on departure times. Additionally, incorporating future goods transport forecasts, as the Swedish Transport Administration provided, would strengthen the relevance of such simulations for long-term infrastructure planning.
Finally, the modeling framework presented here is extensible and opens several branches for future research, including the evaluation of alternative charging strategies (e.g., battery swapping or electric road systems), logistic adaptations to reduce power peaks, and coordinated planning between transport and energy sectors. These directions will be crucial in supporting a resilient and scalable electrification of heavy-duty transport.
Author Contributions
Conceptualization, M.I., A.C. and F.J.M.-F.; methodology, M.I. and A.C.; software, M.I. and A.C.; validation, M.I., A.C. and F.J.M.-F.; formal analysis, M.I. and A.C.; investigation, M.I. and A.C.; resources, M.I., A.C. and F.J.M.-F.; data curation, M.I. and A.C.; writing—original draft preparation, M.I. and A.C.; writing—review and editing, M.I., A.C. and F.J.M.-F.; visualization, M.I. and A.C.; supervision, F.J.M.-F.; project administration, F.J.M.-F.; funding acquisition, F.J.M.-F. All authors have read and agreed to the published version of the manuscript.
Funding
This research was funded by Vinnova grant number 2024-03622 and the project ACTUAL Grid and Road Simulation for E-Mobility from the Swedish Electromobility Centre.
Data Availability Statement
The charging demand profiles and associated sampling code generated during this study are openly available in Zenodo at https://doi.org/10.5281/zenodo.18631297 [27]. However, detailed power grid data used in the analysis cannot be shared due to confidentiality and legal restrictions imposed by the data provider.
Conflicts of Interest
The authors declare no conflicts of interest.
Abbreviations
The following abbreviations are used in this manuscript:
| AFIR | Alternative Fuels Infrastructure Regulation |
| BESS | Battery Energy Storage System |
| BEV | Battery Electric Vehicle |
| CDF | Cumulative Distribution Functions |
| CHP | Combined Heat and Power |
| CPO | Charging Point Operator |
| CV | Coefficient of Variation |
| EV | Electric Vehicle |
| LP | Linear Programming |
| OD | Origin-Destination |
| PLF | Probabilistic Load-Flow |
| SOC | State of Charge |
| TEN-T | Trans-European Transport Network |
References
- Council of European Union. Regulation (EU) 2023/1804 of the European Parliament and of the Council of 13 September 2023 on the deployment of alternative fuels infrastructure, and repealing Directive 2014/94/EU. Off. J. Eur. Union 2023, L 234, 1–47. Available online: http://data.europa.eu/eli/reg/2023/1804/oj (accessed on 11 August 2025).
- European Parliament and Council. Regulation (EU) 2024/1679 of 13 June 2024 on Union Guidelines for the Development of the Trans-European Transport Network, Amending Regulations (EU) 2021/1153 and (EU) No 913/2010, and Repealing Regulation (EU) No 1315/2013. Off. J. Eur. Union 2024, L 1679, 1–128. Available online: http://data.europa.eu/eli/reg/2024/1679/oj (accessed on 11 August 2025).
- Rivera, S.; Goetz, S.M.; Kouro, S.; Lehn, P.W.; Pathmanathan, M.; Bauer, P.; Mastromauro, R.A. Charging infrastructure and grid integration for electromobility. Proc. IEEE 2023, 111, 371–396. [Google Scholar] [CrossRef] [Scilit]
- Hu, J.; Morais, H.; Lind, M.; Bindner, H.W. Multi-agent based modeling for electric vehicle integration in a distribution network operation. Electr. Power Syst. Res. 2016, 136, 341–351. [Google Scholar] [CrossRef] [Scilit]
- Zhou, G.; Dong, Q.; Zhao, Y.; Wang, H.; Jian, L.; Jia, Y. Bilevel Optimisation Approach to Fast Charging Station Planning in Electrified Transportation Networks. Appl. Energy 2023, 350, 121718. [Google Scholar] [CrossRef] [Scilit]
- Safdarian, F.; Wallison, D.; Wert, J.L.; Oshinkoya, O.; Jung, J.K.; Overbye, T.J.; Xu, Y. Technical Impacts of Light-Duty and Heavy-Duty Transportation Electrification on a Coordinated Transmission and Distribution System. IEEE Trans. Transp. Electrif. 2024, 11, 3404–3417. [Google Scholar] [CrossRef] [Scilit]
- Tietz, T.; Fay, T.-U.; Schlenther, T.; Göhlich, D. Electric Long-Haul Trucks and High-Power Charging: Modelling and Analysis of the Required Infrastructure in Germany. World Electr. Veh. J. 2025, 16, 96. [Google Scholar] [CrossRef] [Scilit]
- Menter, J.; Fay, T.-U.; Grahle, A.; Göhlich, D. Long-Distance Electric Truck Traffic: Analysis, Modeling and Designing a Demand-Oriented Charging Network for Germany. World Electr. Veh. J. 2023, 14, 205. [Google Scholar] [CrossRef] [Scilit]
- Shoman, W.; Yeh, S.; Sprei, F.; Plötz, P.; Speth, D. Battery electric long-haul trucks in Europe: Public charging, energy, and power requirements. Transp. Res. Part D Transp. Environ. 2023, 121, 103825. [Google Scholar] [CrossRef] [Scilit]
- Borlaug, B.; Muratori, M.; Gilleran, M.; Woody, D.; Muston, W.; Canada, T.; Ingram, A.; Gresham, H.; McQueen, C. Heavy-duty truck electrification and the impacts of depot charging on electricity distribution systems. Nat. Energy 2021, 6, 673–682. [Google Scholar] [CrossRef] [Scilit]
- Walz, K.; Contreras, D.; Rudion, K. Synthetic charging profiles development of battery–electric trucks for probabilistic grid planning. CIRED Open Access Proc. J. 2020, 2020, 124–127. [Google Scholar] [CrossRef] [Scilit]
- Mahyari, E.; Freeman, N. Electric vehicle fleet charging management: An approximate dynamic programming policy. Eur. J. Oper. Res. 2025, 327, 263–279. [Google Scholar] [CrossRef] [Scilit]
- Hammam, A.H.; Nayel, M.A.; Mohamed, M.A. Optimal design of sizing and allocations for highway electric vehicle charging stations based on a PV system. Appl. Energy 2024, 376, 124284. [Google Scholar] [CrossRef] [Scilit]
- Mohamed, A.A.S.; Jun, M.; Mahmud, R.; Mishra, P.; Patel, S.N.; Tolbert, I.; Santhanagopalan, S.; Meintz, A. Hierarchical Control of Megawatt-Scale Charging Stations for Electric Trucks with Distributed Energy Resources. IEEE Trans. Transp. Electrif. 2023, 9, 4951–4963. [Google Scholar] [CrossRef] [Scilit]
- Jansson, A.; Ingelström, M.; Samuelsson, O.; Márquez-Fernández, F.J. Grid Capacity Impact from the Charging of Electrified Long-Haul Trucks. In Proceedings of the 2025 IEEE Texas Power and Energy Conference (TPEC), College Station, TX, USA, 10–11 February 2025; pp. 1–6. [Google Scholar] [CrossRef] [Scilit]
- Trafikverket. Representation of the Swedish Transport and Logistics System in Samgods v. 1.2.2. Technical Report. 2020. Available online: https://bransch.trafikverket.se/contentassets/ab220f9016154ef7a8478555560bb280/2024/representation-of-the-swedish-transport-and-logistics-system-in-samgods-1.2.2.pdf (accessed on 20 February 2025).
- Ingelström, M.; Arabani, H.P.; Alaküla, M.; Márquez-Fernández, F.J. Placement of Fast-Charging Infrastructure for Long-Haul Road Freight Based on Spatio-Temporal Evaluation of En-Route Energy Needs. IEEE Trans. Transp. Electrif. 2026, 12, 53–65. [Google Scholar] [CrossRef] [Scilit]
- OpenStreetMap Contributors. Planet Dump. 2017. Available online: https://www.openstreetmap.org (accessed on 12 November 2024).
- Energimyndigheten. Beviljade Projekt Inom Regionala Elektrifieringspiloter. 2025. Available online: https://www.energimyndigheten.se/klimat/transporter/laddinfrastruktur/stod-att-soka-inom-laddinfrastruktur/regionala-elektrifieringspiloter/beviljade-projekt-inom-regionala-elektrifieringspiloter/ (accessed on 7 April 2025).
- Horni, A.; Nagel, K.; Axhausen, K. Multi-Agent Transport Simulation MATSim; Ubiquity Press: London, UK, 2016. [Google Scholar]
- Trafikverket. Lastbilars Körmönster—Analys av Data från Färdskrivare (Truck Driving Patterns—Analysis of Tachograph Data); Report 2021:106; Swedish Transport Administration: Borlänge, Sweden, 2021. Available online: https://www.diva-portal.org/smash/get/diva2:1524340/FULLTEXT01.pdf (accessed on 11 March 2026).
- DigSilent GmbH. DigSilent PowerFactory 2021 SP3; DigSilent GmbH: Gomaringen, Germany, 2021. [Google Scholar]
- DigSilent GmbH. PowerFactory 2021 User Manual; DigSilent GmbH: Gomaringen, Germany, 2021. [Google Scholar]
- Jansson, A.; Samuelsson, O.; Márquez-Fernández, F.J. Electromobility Impact on the Power Grid—Base Case for Probabilistic Modelling. In Proceedings of the 2023 IEEE Transportation Electrification Conference & Expo (ITEC), Detroit, MI, USA, 21–23 June 2023; pp. 1–6. [Google Scholar] [CrossRef] [Scilit]
- Melhorn, A.C.; Dimitrovski, A. Correlation between EVs and Other Loads in Probabilistic Load Flow for Distribution Systems. In Proceedings of the 2018 IEEE International Conference on Probabilistic Methods Applied to Power Systems (PMAPS), Boise, ID, USA, 24–28 June 2018; pp. 1–6. [Google Scholar] [CrossRef] [Scilit]
- Papaefthymiou, G.; Kurowicka, D. Using Copulas for Modeling Stochastic Dependence in Power System Uncertainty Analysis. IEEE Trans. Power Syst. 2009, 24, 40–49. [Google Scholar] [CrossRef] [Scilit]
- Ingelström, M. mattiasingelstrom/hd-ev-charging-profiles: Charging Demand Profiles for Heavy-Duty Electric Trucks—Skåne, Sweden, version v1.0.0; Zenodo: Geneva, Switzerland, 2026. [Google Scholar] [CrossRef]

Disclaimer/Publisher’s Note: The statements, opinions and data contained in all publications are solely those of the individual author(s) and contributor(s) and not of MDPI and/or the editor(s). MDPI and/or the editor(s) disclaim responsibility for any injury to people or property resulting from any ideas, methods, instructions or products referred to in the content. |
© 2026 by the authors. Published by MDPI on behalf of the World Electric Vehicle Association. Licensee MDPI, Basel, Switzerland. This article is an open access article distributed under the terms and conditions of the Creative Commons Attribution (CC BY) license.