


Abstract
Hydrogen fuel cell tractors (HFCTs) represent a critical frontier in the development of modern green agricultural equipment. Due to the heavy-duty and highly variable nature of tractor operations, current fuel cell-powered platforms face significant challenges, including insufficient energy sustainability and low-efficiency consumption. This study addresses the issues of sluggish dynamic response and durability degradation during complex plowing tasks through systematic power system modeling and energy management strategy (EMS) research. First, a control-oriented fuel cell model coupling mechanical inertia, manifold filling-and-emptying dynamics, and electrochemical reactions is established, which quantitatively reveals the physical boundaries of load-change ramp rates. On this basis, a multi-dimensional performance evaluation framework for HFCTs is constructed. This framework innovatively proposes fuel cell dynamic response indicators and a non-linear calculation model for continuous operational duration, achieving a non-linear mapping between onboard energy storage capacity and operating time for quantitative endurance assessment. Subsequently, guided by this evaluation system, a dynamic program considering the coordination of energy system durability and the energy consumption economy (DP-CoDE) is developed. By establishing an online update mechanism for power-change rates, synergistic optimization of system durability and economy is achieved based on the DP-CoDE strategy. Model-in-the-loop simulation results under plowing conditions demonstrate that, compared to the DP-CoDE strategy, the proposed strategy enhances response stability by 44.44% and reduces response tracking error by 41.17% at a marginal cost of only a 0.15% increase in total hydrogen consumption. These findings significantly improve the system’s tracking capability under transient complex loads and provide a robust theoretical foundation for the control system design of HFCTs.
1. Introduction
Agricultural equipment serves as the material foundation for ensuring food security and promoting the development of modern, sustainable agriculture. As agricultural production modes upgrade, the demand for clean and efficient powertrain systems has become increasingly urgent. Consequently, developing green, intelligent agricultural machinery has emerged as a core trend in global agricultural engineering.
Compared to conventional electrochemical batteries, hydrogen fuel cells offer distinct advantages, including high energy density, clean power generation, and high efficiency, without being constrained by energy storage capacity [1,2]. With advancements in electrode materials and hydrogen storage technologies, applying fuel cell systems to new energy tractors has become a critical pathway for the green transformation of agricultural power. However, they are characterized by relatively sluggish dynamic responses. Frequent and intense power fluctuations under the complex operating conditions of tractors can severely compromise their durability and operational efficiency [3]. Specifically, this performance degradation is driven by a variety of complex factors, including the electrochemical degradation of electrode materials, the loss of active catalyst surface area, and mechanical damage to the membrane electrode assembly under transient stress. Such degradation processes not only lead to a gradual decline in output power and efficiency but also significantly increase the long-term maintenance and replacement costs of the powertrain. Therefore, the accurate characterization and mitigation of performance degradation are of paramount importance for the commercial viability of HFCTs [4]. To mitigate this, optimizing the system structure by introducing an auxiliary power source is a common approach [5,6]. Lithium-ion batteries, characterized by high power density and rapid charge/discharge capabilities, form excellent power–energy complementarity with hydrogen fuel cells. Therefore, this study adopts a lithium-ion battery as the auxiliary power source to construct a fuel cell–battery hybrid energy system, aiming to address issues such as the slow startup and insufficient dynamic response of the fuel cell.
The EMS is central to coordinating the output of hybrid power sources and enhancing overall machine performance. EMSs are generally categorized into rule-based, optimization-based, and intelligent-based strategies [7,8,9,10,11]. In the passenger vehicle sector, the research focus has shifted from single-objective energy conservation to multi-objective balancing. Li et al. [12] utilized a low-pass filter combined with the equivalent consumption minimization strategy to achieve efficient power decoupling of power sources. Liu et al. [13] and Song et al. [14] further introduced lifetime degradation models, combining transient degradation quantification with the pontryagin’s minimum principle to extend fuel cell life while maintaining hydrogen consumption advantages. However, rules extracted from such optimization algorithms often lack robustness when facing complex and variable driving environments. For agricultural machinery operating in harsher environments, researchers have conducted targeted adaptation work. Liu et al. [15] verified the superiority of genetic algorithms in optimizing tractor hydrogen consumption, while Li et al. [16] focused on distributed drive configurations, utilizing multi-resolution analysis theory to optimize power allocation. Building on this, Zhang et al. [17] constructed a dual-source collaborative control framework balancing drive efficiency and equivalent hydrogen consumption, confirming the strategy’s significant role in improving average fuel cell efficiency via Hardware-in-the-Loop testing. Despite these fruitful achievements in energy management for hydrogen fuel cell vehicles, the research focus remains largely tilted towards the automotive sector, leaving a relative scarcity of studies dedicated to tractors. Regarding evaluation systems, most existing results prioritize either reducing hydrogen consumption or maintaining powertrain life individually. There is a lack of holistic multi-objective synergistic optimization that simultaneously considers the fuel economy and the joint durability of coupling components within the energy system.
Research on EMSs specifically tailored for the HFCTs remains relatively scarce. Although some existing studies have begun to address the durability and economy of HFCTs [3,15], they largely rely on static load-change ramp-rate constraints. This approach overlooks the real-time evolution of the power source’s dynamic response capability under complex and varying agricultural tasks. First, rather than adopting a preset fixed ramp rate, this study develops a control-oriented fuel cell dynamic model and proposes an online update mechanism for load-change rate limits, enabling the dynamic correction of the fuel cell’s instantaneous physical feasibility domain. Second, by coupling the fuel cell dynamic response as both a constraint mechanism and an objective function term with durability and economy, this study resolves the output instability issues prevalent in traditional strategies that neglect physical execution boundaries during extreme load transients.
Addressing fuel cell dynamic response latency is a critical technical bottleneck in the control of hydrogen fuel cell vehicles. Regarding the dynamic protection of fuel cells, the existing literature primarily adopts logical rule-based constraints or signal decoupling strategies. Thounthong et al. [18] implement fixed power ramp-rate limits across various hybrid configurations to mitigate the adverse physical impacts of transient load fluctuations on the fuel cell stack. Similarly, Aouzellag et al. [19] integrate low-pass filters at the EMS output stage to eliminate power oscillations induced by motor faults or rapid acceleration while also imposing current slope limits; however, the scientific justification for the selection of these constraint parameters is not explicitly provided. For multi-energy systems, frequency-domain decoupling approaches are also widely utilized. Zhang et al. [20] employ wavelet transform techniques to isolate high-frequency transient components for allocation to supercapacitors while the fuel cell sustains stable low-frequency power. This suppresses power fluctuations at the signal level and provides indirect protection for the power source’s durability. Nevertheless, a research gap remains concerning the deep integration of fuel cell transient response capabilities with energy management strategies, particularly for tractors operating under complex and highly variable agricultural tasks.
Taking the HFCT as the research object, this paper proposes an EMS that incorporates the online dynamic response capability of the fuel cell. The main contributions and organization of this paper are as follows: (1) A control-oriented dynamic model of the fuel cell is constructed, and battery pulse discharge verification is performed to quantitatively reveal the physical boundaries of load variation rates (Section 2). (2) A multi-dimensional evaluation system covering dynamic performance, the economy, and durability is established, laying the theoretical foundation for subsequent EMS optimization in Section 3. (3) A dynamic programming (DP) strategy incorporating the fuel cell’s online dynamic response capability is proposed. This strategy first establishes a DP framework targeting the synergistic optimization of the system fuel economy and component durability, upon which an online update mechanism for the fuel cell dynamic response is introduced in Section 4. (4) The effectiveness and superiority of the proposed strategy are verified through model-in-the-Loop (MIL) simulation experiments, which are shown in Section 5. (5) Finally, conclusions are drawn in Section 6.
2. System Description and Dynamic Modeling
2.1. Program Design
The powertrain configuration of the HFCT proposed in this study is illustrated in Figure 1. The inherent complexity of the HFCT’s operating environment leads to frequent fluctuations in the motor’s power demand. Considering the distinct output characteristics of each energy source, this configuration adopts the fuel cell system as the primary power source, which is cascaded to the DC bus via a unidirectional DC/DC converter. It forms a parallel coupling structure, with a lithium-ion battery serving as the auxiliary power source. This topology is designed to accommodate high-frequency power fluctuations arising from unstructured terrains during heavy-duty operations such as plowing while simultaneously stabilizing the output voltage of the fuel cell system and extending the lifespan of both energy sources. Furthermore, an energy management controller is employed to rationally coordinate and distribute power output among the energy sources, aiming to achieve an optimal performance equilibrium. Additionally, a DC/AC inverter is utilized to convert direct current into alternating current to power the traction motor, realizing the conversion of electrical energy into mechanical energy to propel the vehicle. This configuration offers advantages such as structural simplicity, low control complexity, and high energy conversion efficiency.
Figure 1.
Design scheme of the powertrain system for the HFCT.
2.2. Control-Oriented Fuel Cell Dynamic Modeling
The fuel cell dynamic response is a critical factor defining the control boundaries of energy management strategies during transient load transitions, such as plow–soil engagement or abrupt resistance spikes in tractors. An automotive fuel cell system generally integrates air supply, hydrogen supply, the stack, and cooling subsystems. Due to the high modeling complexity of hydrogen ejectors and this study’s focus on macroscopic power dynamics rather than fine-scale reaction kinetics, the hydrogen supply system is simplified. Following the approach in [21], an empirical anode-side model is employed to indirectly match the hydrogen consumption process. These simplifications are consistent with control-oriented modeling practices for energy management research [22,23,24]. By decoupling the millisecond-level fluid transients and the slow hydrothermal variations from the second-level energy distribution logic, the model maintains the high computational efficiency necessary for global optimization while preserving macroscopic accuracy in terms of power output and fuel consumption.
Under transient tractor loads, it is recognized that the hydration state of the membrane electrode assembly and temperature fluctuations can significantly alter voltage dynamic responses by affecting proton conductivity and activation losses [25]. However, to accommodate the computational overhead required for DP-based global optimization at a second-level resolution, a quasi-isothermal modeling approach is adopted. While neglecting microscopic hydrothermal dynamics might lead to minor discrepancies in predicting the absolute depth of voltage undershoot during abrupt transients, air-supply latency remains the dominant factor governing the dynamic power response at the second-level time scale required for EMS. Furthermore, to compensate for potential prediction uncertainties caused by these simplifications, relatively conservative and physically grounded ramp-rate limits are established in the control logic. This ensures the physical safety and durability of the fuel cell stack during prolonged high-load plowing operations.
Consequently, this section emphasizes the air-supply and stack modules to develop a control-oriented dynamic model. The following assumptions are made to maintain a balance between model fidelity and computational efficiency:
- The stack is assumed to operate in a quasi-isothermal state. Considering that high-power tractor prototypes are equipped with high-efficiency thermal management and active humidification systems, the stack temperature and humidity are maintained within a relatively stable operating window. Consequently, the slow-time-scale thermal dynamics are decoupled from the rapid-time-scale power transients. While the microscopic dynamic effects of hydrothermal management on ohmic losses are neglected during transient events, their steady-state impacts are explicitly incorporated into the parameter calibration of the conductivity formulation in Equation (14).
- Fluid dynamics in manifolds and flow channels are significantly faster than the air compressor’s mechanical response, precluding the need for independent sub-models.
- Microscopic diffusion within the gas diffusion layer is assumed to be much faster than the macroscopic gas supply lag and is therefore simplified.
While this simplification helps improve the efficiency of the algorithm, it is worth noting that changes in the temperature gradient of the fuel cell stack affect proton conductivity and activation losses, thereby altering the dynamic response characteristics. Specifically, under non-steady-state conditions, the dynamic performance of the thermal management system and the electrochemical response are strongly coupled [26]. Consequently, future work could further integrate a thermo-electric co-control framework to improve the physical completeness of the boundary condition updates.
2.2.1. Dynamic Modeling of the Cathode Air-Supply System
Commonly utilized air compressors in fuel cell systems include centrifugal and screw-type compressors [27,28]. Screw compressors offer several advantages, such as low rotational speeds, high operational safety, and quasi-linear flow characteristics under constant speed. Additionally, they exhibit low sensitivity to pressure fluctuations and simplified control requirements, effectively avoiding the surge issues associated with centrifugal compressors. Consequently, from the perspective of system control, a screw compressor is selected for this study.
Building upon the mechanistic analysis and experimental data from reference [29], this study develops a sequentially coupled architecture comprising “compressor mechanical inertia—manifold filling-and-emptying dynamics—oxygen transport delay.” This structure characterizes the dynamic lag from the compressor control input to the cathode oxygen partial pressure across three dimensions: mechanical rotation, fluid pressure elevation, and species transport. This approach enables the simulation of transient “oxygen starvation” characteristics under step-load conditions. The specific mathematical models are as follows:
1. Compressor mechanical dynamic model
As the primary power source for cathode oxygen supply, the actual rotational speed of the air compressor must be adjusted to track the reference speed. This process entails a mechanical response delay that is formulated as
where is the actual rotational speed of the compressor, rad/s; is the reference (demand) rotational speed, rad/s; is the mechanical response time constant, and s.
2. Cathode manifold filling-and-emptying dynamic model
Air supplied by the compressor is delivered to the reaction interface through the cathode manifolds. Based on the ideal gas law and the principle of mass conservation, the total pressure dynamics within the cathode manifold can be characterized. Specifically, the continuity equation is employed to describe the dynamic evolution of the manifold total pressure relative to the compressor flow rate:
where is the total pressure inside the cathode manifold, measured in kPa; R is the universal gas constant, with R = 8.314 × 10⁻³ kJ/(mol·k); is the fuel cell operating temperature, measured in K; is the total volume of the cathode manifold, measured in m3; is the average molar mass of air, with kg/mol; is the air mass flow rate at the compressor outlet, measured in kg/s; is the cathode exhaust air mass flow rate, measured in kg/s; and is the air mass flow rate consumed by the cathode chemical reaction, measured in kg/s.
The cathode air excess ratio is implicitly defined as
where is the cathode air excess ratio.
3. Oxygen partial pressure mass transfer dynamic model
Variations in compressor speed propagate through the manifolds to the stack cathode, resulting in a temporal lag in the oxygen partial pressure. Furthermore, considering that tractors frequently operate under heavy-duty conditions, the substantial amount of liquid water produced at high current densities tends to accumulate within the gas diffusion layer. This “flooding” effect blocks the transport pathways, thereby exacerbating the oxygen transport delay [30]. To characterize this phenomenon, a dynamic correction term for the mass transfer time constant is introduced based on the effective diffusion coefficient:
where is the effective diffusion coefficient; is the oxygen lag time constant; is the thickness of the gas diffusion layer; is the bulk diffusion coefficient; represents porosity; and s represents liquid water saturation.
By incorporating this correction, the actual dynamic oxygen partial pressure is formulated as
where is the actual oxygen partial pressure at the cathode catalyst layer, measured in kPa, and is the steady-state demand oxygen partial pressure, measured in kPa.
2.2.2. Dynamic Modeling of the Anode Hydrogen Supply System
To enhance the fidelity of the fuel cell dynamic response model, this section establishes an anode hydrogen dynamic consumption correction model based on reference [31]. This model specifically characterizes the transient variation characteristics of hydrogen consumption under step load-change conditions, providing the necessary anode-side boundary conditions for subsequent power dynamic response analysis.
When the stack load undergoes a step change, the hydrogen consumption rate must adjust from its initial steady-state value to the new demand level. Due to the inherent dynamic lag, the instantaneous expression is formulated as follows:
where is the actual instantaneous hydrogen consumption rate, measured in mol/s; is the steady-state instantaneous hydrogen consumption rate, measured in mol/s; denotes the settling time required for the anode reaction to reach a steady state, set as 0.1 s; and k represents the hydrogen stoichiometry (excess ratio), set as 1/0.95.
2.2.3. Dynamic Modeling of the Stack Output Voltage
High-fidelity fuel cell stack models typically involve complex multi-physics coupling processes—often referred to as “electro-chemical-thermal” coupling. These processes involve mass conservation along the flow channels, microscopic mass transfer within the gas diffusion layers, and the hydration state of the proton exchange membrane. Such models are inherently complex and entail high computational overhead.
The primary objective of this research is to characterize the overall output lag and voltage undershoot characteristics under dynamic power demands, rather than accurately simulating the instantaneous spatiotemporal distribution of internal physical fields. Therefore, a simplified control-oriented model is developed to achieve an effective trade-off between model complexity and computational efficiency while ensuring the faithful representation of key dynamic behaviors. The proposed model primarily integrates a steady-state voltage base model founded on the “three major losses” theory.
During the electrochemical reaction of a fuel cell, the voltage loss of a single cell under steady-state conditions primarily comprises three components: activation overpotential, ohmic loss, and concentration overpotential. The output cell voltage can be expressed as
where is the fuel cell unit voltage, measured in V; is the Nernst reversible potential, measured in V; is the activation loss, measured in V; is the ohmic loss, measured in V; and is the concentration loss, measured in V.
To investigate the dynamic characteristics, an equivalent circuit model is established, as illustrated in Figure 2. Therein, , , and represent the equivalent resistances corresponding to the aforementioned three polarization losses, respectively, measured in ; C denotes the double-layer capacitance, measured in F, which characterizes the charge storage effect at the electrode interface. Under steady-state operation, the capacitive branch acts as an open circuit, and the terminal voltage conforms to Equation (7).
Figure 2.
Equivalent circuit diagram of a single fuel cell.
1. Thermodynamic electromotive force
Specifically, according to the Nernst equation and incorporating the dynamic oxygen partial pressure, the open-circuit voltage of the fuel cell can be expressed as
where is the anode hydrogen partial pressure, measured in kPa.
2. Activation polarization dynamics and steady-state target values
In a fuel cell, activation polarization losses occur at both the anode and the cathode. Since the activation loss on the anode side is significantly smaller than that on the cathode side, it is typically neglected. Thus, the cathode activation loss is considered the primary source of this voltage drop. Due to the presence of double-layer capacitance (C) at the electrode interface, the activation loss exhibits specific dynamic response characteristics:
where is the total operating current of the fuel cell stack, measured in A; is the active area of a single cell, measured in cm3.
The steady-state target value of the activation loss can be determined by the following empirical correlation:
where is the voltage drop at zero current density (V); is a constant; is the dynamic correction coefficient for activation loss; and is the current density (A/m2).
Both and are functions of oxygen partial pressure and temperature, as defined below:
where is the saturation vapor pressure of water at the current temperature, measured in kPa.
3. Ohmic and concentration polarization losses
Ohmic polarization loss stems from the internal resistance encountered during charge transport within the stack. This resistance is composed of both ionic conduction resistance and electronic conduction resistance. Since the ionic migration resistance within the electrolyte is significantly higher than the electronic transport resistance in the conductors, it serves as the dominant factor contributing to ohmic loss. This portion of the voltage drop is governed by Ohm’s Law, and its expression is as follows:
where is the thickness of the proton exchange membrane, measured in m; is the proton conductivity of the membrane, measured in S/m; is the area-specific resistance of the PEM, measured in ; , , and are constants related to the specific type of PEM; and is the membrane hydration level (water content).
Concentration polarization arises when the consumption of reactants by electrochemical reactions causes the concentration at the electrode surface to fall below the bulk concentration. This phenomenon reflects the voltage drop associated with the decline in oxygen partial pressure during transient load transitions. Its expression is
where is the maximum current density, measured in , and is a constant.
The coefficient is influenced by the real-time oxygen partial pressure and is determined via piecewise calculation based on whether the operating pressure exceeds two standard atmospheres (2 atm):
where 2 atm is defined as the critical pressure, corresponding to a value of 202.65 kPa.
2.2.4. Fuel Cell Stack Power and Efficiency Model
By substituting Equations (8)–(18) into Equation (7), the single-fuel-cell voltage is determined. Assuming consistent performance across all individual cells, the stack output voltage is expressed as
where is the fuel cell stack’s output voltage, measured in V.
The output power of the fuel cell is calculated as
where is the actual output power of the fuel cell, measured in kW.
The overall fuel cell system’s efficiency is the product of the voltage efficiency and the Faradic efficiency. Specifically, the voltage efficiency reflects the discrepancy between the actual stack output voltage and the theoretical maximum voltage, while the Faradic efficiency quantifies the extent to which the supplied hydrogen undergoes electrochemical conversion. The corresponding formulations are:
where is the fuel cell voltage efficiency, measured in %; is the fuel cell Faradic efficiency, measured in %; and F is the Faraday constant, measured in C/mol.
2.3. Simulation Analysis of the Fuel Cell Dynamic Model
The primary parameters of the fuel cell system employed in this study are presented in Table 1. To ensure the engineering practical value of the simulation research, the powertrain parameters selected in this study are referenced from a high-power hydrogen fuel cell tractor prototype developed by the YTO Group.
Table 1.
The primary parameters of the fuel cell system.
2.3.1. Analysis of Steady-State Output Characteristics
To verify the steady-state accuracy of the established fuel cell model, key parameters are identified and calibrated using a nonlinear least-squares algorithm based on the measured polarization data provided by the YTO research institute. Figure 3 illustrates the V-I characteristic curve of the fuel cell stack. As observed, the output voltage exhibits a nonlinear declining trend with the increase in load current, which aligns with typical electrochemical polarization characteristics. At a current of 0 A, the open-circuit voltage of the stack is approximately 441 V, indicating the absence of polarization losses and the attainment of the maximum output potential. As the current increases, the internal polarization losses within the stack gradually accumulate. When the current reaches 665 A, the stack output voltage drops to 270 V, corresponding to an individual cell voltage of 0.6 V. At this point, the stack reaches its designed rated power point of 180 kW. Error analysis indicates that the mean absolute percentage error between the predicted and experimental values is only 1.63%, which is significantly lower than the 5% engineering error threshold. The simulation results demonstrate that the model can accurately reproduce the parameters at the rated operating point. Furthermore, the curve trajectory is smooth without abnormal fluctuations, validating the steady-state accuracy of the model across the entire power range.
Figure 3.
Polarization characteristics of the fuel cell stack.
The system efficiency curve of the fuel cell is shown in Figure 4. Considering as the high-efficiency region of the fuel cell system, the corresponding power range is kW.
Figure 4.
Efficiency curve of the fuel cell system.
2.3.2. Baseline Dynamic Response Characteristics and Rate Limit Analysis
Generally, while response characteristics vary across different stacks, they remain comparable for units with the same power rating. The dynamic response of a PEMFC is primarily constrained by the latency of the air-supply system. Specifically, the allowable ramp rate during the loading process is significantly lower than that during unloading, as the former must strictly avoid “oxygen starvation.” Since satisfying the loading rate requirements inherently encompasses the transient safety boundaries of the unloading process [32], this study adopts a symmetric load-change rate assumption to further enhance system robustness and ensure a sufficient safety margin. This conservative design simplifies constraint handling within the energy management algorithm and improves optimization efficiency while ensuring that the power source remains within an absolutely safe physical operating envelope under any transient conditions.
To define the dynamic output limits of the fuel cell across its full power range, the maximum allowable power variation rate is identified through a series of step-load simulation analyses based on the dynamic model established in Section 2.2, which couples compressor inertia and mass transfer delays. Specifically, a sequence of initial power points is selected across the 0–180 kW range with an increment of 10 kW. At each point, the power ramp rate is iteratively increased in the simulation until the predefined safety boundaries are triggered, i.e., a transient cathode air excess ratio of to prevent compressor surge.
The critical slopes extracted from each condition are fitted to construct the maximum power variation rate limit curve shown in Figure 5. This curve indicates that in the low-power region (0–40 kW), the system possesses high dynamic response potential, with the maximum variation rate reaching 38 kW/s. Conversely, in the full-power region near and above 160 kW, the variation in rate limit is strictly tightened to below 10 kW/s to maintain the stack’s hygrothermal balance and gas stoichiometric ratio.
Figure 5.
Maximum power variation rate of the fuel cell at different power levels.
Based on the aforementioned maximum power variation rate limits, a full-scale loading simulation from 0 kW to the rated power of 180 kW was conducted to obtain the baseline dynamic response curve of the fuel cell, as shown in Figure 6. This curve characterizes the optimal time-domain response of the stack when operating consistently at the limit loading rate permitted by current conditions. Specifically, it represents a scenario where the power variation rate at any given moment is maintained at the upper limit allowed for the corresponding output power point.
Figure 6.
Dynamic response curves of the fuel cell stack from 0 to 180 kW.
To prolong fuel cell life and maintain high-efficiency performance while ensuring response capability, reasonable power ramp rate limits must be established within the typical high-efficiency operating region. In this study, the typical high-efficiency region of the fuel cell is centered around 120 kW. According to Figure 5, the corresponding power variation rate at this power level is approximately 19 kW/s. Consequently, 19 kW/s is selected as the upper limit for the fuel cell power ramp rate to strike a balance between dynamic performance and durability while serving as a reference for the offline constraints in the subsequent EMS. Moreover, the maximum power variation rate of the fuel cell in the high-power range is within [0, 19] kW/s, which is insufficient to cover the drastic power transient demands encountered during plowing operations. Therefore, an auxiliary power source must be integrated, and a rational EMS must be designed to compensate for the fuel cell’s dynamic response limitations.
2.4. Research on Lithium-Ion Battery Operating Performance
Lithium-ion batteries exhibit millisecond-level transient response capabilities, which can effectively compensate for the dynamic response limitations of fuel cells. In this study, a first-order RC equivalent circuit model is employed to simulate the external dynamic characteristics of the storage battery. This model achieves an optimal trade-off between computational complexity and modeling accuracy, accurately capturing both the millisecond-level Ohmic response and the second-level polarization relaxation processes. Consequently, it is well-suited to characterize the rapid dynamic behavior of the battery relative to the fuel cell. The equivalent circuit diagram is shown in Figure 7, where the battery current is defined as positive for discharging and negative for charging.
Figure 7.
First-order RC equivalent circuit diagram of the lithium-ion battery.
The battery terminal voltage is jointly determined by the open-circuit voltage, the Ohmic voltage drop, and the polarization voltage. Its output equation is expressed as
where is the terminal voltage, measured in V; is the open-circuit voltage, measured in V; denotes the battery current, measured in A; represents the internal Ohmic resistance, measured in ; and is the polarization voltage of the RC network, measured in V.
The polarization current consists of the resistive current flowing through the polarization resistor and the capacitive current flowing through the polarization capacitor:
where is the polarization resistance, measured in , and denotes the polarization capacitance, measured in F.
The dynamic time constant of the battery is defined as , which is used to quantitatively characterize the response speed of the polarization process. A smaller time constant indicates a faster response of the polarization voltage to variations in current, reflecting superior dynamic performance of the battery. The dynamic differential equation for the polarization voltage is expressed as
The state of charge (SOC) of the battery is updated via the Ampere-hour integration method:
where is the initial SOC, while represents the rated capacity of the battery, measured in Ah.
Table 2 summarizes the key parameters of the lithium-ion battery, which are aligned with the technical specifications of the high-power tractor prototype. Based on the established first-order RC equivalent circuit model, a simulation model is developed in Simulink to verify the charging and discharging characteristics at a standard 1C rate, with results shown in Figure 8. The simulation results indicate that under constant current conditions, the battery SOC curve varies linearly over time, and the duration for a 90% depth of discharge is 3240 s. This aligns with the theoretical value, thereby verifying the accuracy of the capacity integration component of the model. The terminal voltage variation can be characterized by three distinct stages: an initial transient response stage, a middle quasi-steady-state plateau stage, and a final steep voltage change stage, exhibiting the typical electrochemical characteristics of lithium iron phosphate batteries. The stable plateau stage (A–B) possesses the longest duration and corresponds to the high-efficiency and safe operating region of the battery. To ensure operational lifespan, safety, and efficiency, the SOC operating range for the lithium-ion battery in this study is constrained between [0.2, 0.8]. Furthermore, at the onset of charging and discharging, an instantaneous voltage jump of approximately 21 V is observed, which is consistent with the defined 0.42 Ω Ohmic internal resistance and 50 A current. This demonstrates that the model accurately reflects the dynamic impedance characteristics of the battery. Consequently, the model effectively characterizes both the static and dynamic performances of the lithium-ion battery under typical operating conditions.
Table 2.
Key parameters of the lithium-ion battery.
Figure 8.
The 1C-rate charge/discharge characteristic curves of the Li-ion battery.
3. Establishment of the Evaluation System for Hydrogen Fuel Cell Tractor Powertrain Systems
As an emerging power solution oriented toward clean agriculture, the performance of the HFCT powertrain significantly determines operating efficiency and reliability while directly impacting economic and environmental benefits. Unlike the smooth road conditions experienced by passenger vehicles, tractors encounter extreme heavy-load transients and periodic impulsive loads (e.g., resistance steps during soil engagement and drastic unloading during headland turning). Traditional metrics based on steady-state efficiency or hydrogen consumption alone are insufficient to fully characterize the physical properties of the power source under such extreme non-steady-state conditions. Based on the structural characteristics of the powertrain system and the practical operational requirements of the tractor and considering the discrete-time nature of modern controllers and data acquisition systems, this section proposes the following four core evaluation metrics within the discrete domain:
3.1. Fuel Cell Dynamic Response Indicators
Due to the complex and highly variable nature of agricultural operations, higher requirements are placed on the dynamic response capabilities of fuel cells. Consequently, this section establishes a dynamic performance evaluation framework based on two dimensions: response stability (RS) and response tracking error (RTE).
1. Response stability
RS is utilized to evaluate the variation rate of fuel cell output power, with its core objective being the quantification of the severity of power output fluctuations. During heavy-duty tractor operations, sharp jumps in power demand induce severe fluctuations in internal polarization voltage and hydrothermal balance, thereby accelerating the physical degradation of the membrane electrode assembly. By quantifying the load-change rate, the RS metric objectively reveals the physical stress levels of the power source under transient conditions. This provides unique value for assessing fuel cell durability within complex agricultural machinery environments.
Based on the sampling time step, the average power variation rate is adopted as the RS indicator, which is defined as follows:
where k is the discrete sampling point index, with ; N is the total number of sampling points within the operating cycle; is the average power variation rate, measured in kW/s; and represents the actual output power of the fuel cell at the k-th sampling instant, measured in kW.
2. Response tracking error
RTE is employed to assess the tracking precision of the fuel cell output power relative to the demanded power. Tractor operations involve frequent “light-load turning to heavy-load soil engagement” cycles, which require the EMS to possess a high degree of awareness regarding physical boundaries. The RTE metric not only reflects the precision of the control system but also reveals the extent to which the optimization algorithm recognizes the fuel cell’s physical response boundaries (e.g., load-change slope limits). A smaller RTE value indicates that the strategy more effectively leverages the dynamic potential of the fuel cell without triggering physical protection constraints. Its definition is as follows:
where denotes the fuel cell RTE, measured in kW, and represents the demanded power of the fuel cell at the k-th sampling instant, measured in kW.
3.2. Durability
Durability significantly affects the overall operating costs and reliability of energy systems and is a key indicator for measuring long-term utility value. The HFCT powertrain developed in this study comprises two critical components: the fuel cell and the lithium-ion battery. These two components differ significantly in terms of material characteristics and operating mechanisms, resulting in distinct degradation modes and dominant influencing factors. Consequently, this section develops separate degradation models for the fuel cell and the lithium-ion battery to establish a quantitative evaluation framework for power source durability. By characterizing the performance degradation of both the fuel cell and the lithium-ion battery, this study provides a theoretical foundation for system-level lifespan optimization.
1. Fuel cell degradation
According to the definition by Ford Motor Company, the end-of-life criterion for a fuel cell is reached when voltage degradation at the rated current point reaches 70 mV, i.e., mV [33]. Research indicates that the primary factors influencing fuel cell degradation include start–stop cycles, frequent load variations, high-load operations, and low-load operations [34,35]. Since agricultural machinery is rarely subjected to frequent start–stop cycles during field operations, the impact of start–stop cycles on fuel cell durability is neglected in this study. The specific identification conditions for these degradation factors and the corresponding voltage degradation rates for a single fuel cell are summarized in Table 3.
Table 3.
Voltage degradation rates for a single fuel cell under various influencing factors.
The accumulated lifetime degradation of the fuel cell during a single operating cycle is calculated as follows:
where , , and represent the fuel cell lifetime degradation, measured in mV, caused by high-load operation, low-load operation, and load variations during a single operating cycle, respectively. Furthermore, and denote the duration of high-load and low-load operations at the sampling instant (s), respectively.
In addition, the reversible voltage recovery phenomenon under dynamic loads also constrains system lifetime. Future research can combine a voltage recovery quantification model to further refine the fuel cell health status assessment [37].
2. Lithium-ion battery lifetime degradation
According to the requirements for standard cycle life specified in the national standard, the maximum allowable capacity degradation for a battery is 20% [38]. The battery’s capacity loss is reflected by the difference in the state-of-health (SOH) indicators [39], which is specifically given by
where is the total cyclic degradation, measured in %; denotes the battery SOH, measured in %; M is the degradation coefficient, with M = 31,630; is the activation energy, measured in J/mol; is the universal gas constant, with J/(mol·K); is the absolute temperature, with K; z is the power-law factor, with z = 0.55; and c denotes the C-rate.
Specifically, the gas activation energy is given by
3.3. Fuel Economy
In this study, with the lithium battery serving as the auxiliary power source, the design of the EMS requires maintaining consistency between the initial and final SOC values [40]. Since the energy consumed by the lithium battery essentially originates from the hydrogen supplied by the tank, the total hydrogen consumption from the tank can be decomposed into the direct consumption by the fuel cell and the consumption attributed to the lithium battery. The total hydrogen consumption of the tank within a single operating cycle is specifically expressed as
where denotes the total hydrogen consumption of the tank, measured in g; represents the equivalent hydrogen consumption of the lithium battery, measured in g; is the hydrogen consumption of the fuel cell, measured in g; and are the SOC values at the initial and final instants, respectively; and is a fixed penalty value, with .
Here, the hydrogen consumption of the fuel cell is given by
where represents the lower heating value, with MJ/kg.
The equivalent hydrogen consumption of the lithium battery is calculated as
where is the output power of the lithium battery, measured in kW; is the average hydrogen consumption of the fuel cell, measured in g; and represent the average charging and discharging efficiencies of the lithium battery, respectively; is the average efficiency of the fuel cell; and denote the charging and discharging efficiencies of the lithium battery, respectively; and is the average output power of the fuel cell, measured in kW.
3.4. Continuous Operating Time
Continuous operating time serves as a critical indicator for evaluating the operational suitability and economic efficiency of the tractor, directly determining its overall endurance. Based on the principle that “the total energy released at the source side ≥ the total energy demanded at the load side”, the following energy balance constraint is formulated:
where represents the total energy of the fuel cell, measured in kJ; denotes the total energy demand at the DC bus under plowing conditions, measured in kJ; and is the efficiency of the DC/DC converter.
Based on the average power demand of the YTO-HB2204 tractor(YTO Group Corporation, Luoyang, China) under plowing conditions, previously obtained at the China YTO Mengjin All-Terrain Proving Ground, the total energy demand at the DC bus is calculated as
where represents the average power demand of the vehicle under plowing conditions, measured in kW, and denotes the efficiency of the electric motor.
The total energy released by the fuel cell corresponds to the energy converted from hydrogen to the fuel cell output terminals:
By synthesizing Equations (36)–(38), a calculation method for the continuous operating time can be derived. However, the static estimation method presented in Equation (37) relies solely on average power, failing to adequately account for the time-varying fluctuations of field loads and the efficiency variations in the powertrain at different operating points. Consequently, the resulting evaluation struggles to accurately characterize the actual operational performance. Unlike preliminary parameter matching, the establishment phase of evaluation metrics requires a more objective assessment of the tractor’s endurance over a typical duty cycle. Therefore, this study establishes a calculation model for continuous operating time based on the mapping between instantaneous load power and system dynamic efficiency. By performing discrete integration of energy consumption within a single duty cycle, a nonlinear mapping relationship is constructed between the onboard energy storage capacity and the operating duration, as expressed below:
where denotes the total duration of a single operating cycle, measured in h, and represents the power demand at the motor input, defined as the instantaneous electric power absorbed by the electric drive system from the high-voltage DC bus, measured in kW.
Venting and non-driving auxiliary losses are neglected in the operating time model for the following reasons: (1) Hydrogen purging losses are marginal, typically accounting for less than 1% of total consumption. (2) The fuel cell efficiency utilized represents the net system efficiency, which already incorporates the parasitic power of BOP components such as the air compressor. (3) Non-driving auxiliary power (e.g., steering and lighting) is negligible (1–2 kW) relative to the primary plowing load (approx. 120 kW). Consequently, these minor losses are integrated into the comprehensive efficiency to maintain computational efficiency while accurately reflecting the relative endurance gains of different EMS strategies.
4. Dynamic Programming-Based Optimization Considering Multi-Faceted Performance Indicators
The EMS for the HFCT constitutes a pivotal component of the vehicle control system, playing a critical role in enhancing the overall vehicle economy, energy system durability, and operational efficiency. This section develops a DP strategy aimed at the synergistic optimization of the system fuel economy and the durability of energy components. To enhance the adaptability of the strategy to the actual operating characteristics of the fuel cell and to mitigate tracking deviations resulting from constraints on fuel cell output power fluctuations, an online dynamic response mechanism for the fuel cell is incorporated into the aforementioned DP framework. Consequently, a DP framework integrating fuel cell online dynamic response capability is proposed. This approach facilitates the synergistic optimization of the fuel cell’s real-time response characteristics alongside energy system durability and the fuel economy.
4.1. Dynamic Programming Considering the Coordination of Energy System Durability and the Energy Consumption Economy
4.1.1. Specification of the State and Transition Model
With the SOC selected as the state variable and the fuel cell output power designated as the control variable, the general form of the system state equation at the discrete control step k is expressed as
where x represents the state variable and u denotes the control variable.
Specifically, the state transition equation of the system is given by
where represents the simulation step size, measured in s.
To prevent the lithium battery from overcharging or overdischarging, reasonable constraints must be imposed on the upper and lower limits of the SOC. Furthermore, given the relatively low power demand of the tractor under low-speed and light-load conditions, the fuel cell is permitted to temporarily cease power output. This strategy serves to fully leverage the buffering and regulating function of the lithium battery within the energy system architecture. Accordingly, the settings for the state variables and control variables are defined as follows:
where M and N represent the number of discrete grid points for the SOC and the fuel cell power demand, respectively.
4.1.2. Objective Function Formulation
This study aims to minimize the combined costs associated with energy system durability and the fuel economy. To this end, an objective function that considers the comprehensive hydrogen consumption, the performance degradation of the fuel cell, and the lifetime decay of the battery is constructed.
Departing from the common approach in most studies, which involves converting hydrogen consumption and lifetime degradation into economic costs to formulate the objective function, this research directly employs their physical rates as the optimization targets. This method offers two significant advantages: First, it enhances model generality. Consumption and degradation rates are intrinsic properties of the energy system, directly reflecting its instantaneous consumption characteristics and durability mechanisms. This approach avoids reliance on external economic parameters for cost conversion, thus aligning the optimization objective more closely with the physical nature of the actual operating state. Second, it improves model robustness. By eliminating the need for complex cost conversion coefficients, it reduces the interference of economic parameter errors on the optimization results. This makes the strategy particularly suitable for agricultural equipment scenarios characterized by complex operating conditions and long service cycles, ensuring the stability of the optimization strategy across varying economic environments.
Therefore, the objective function is formulated as
where and represent the comprehensive consumption rate of the energy system and the hydrogen consumption rate from the tank, respectively; and denote the lifetime degradation rates of the fuel cell and the lithium battery, respectively; N is the total number of time steps for the selected operating cycle; and the terms , and are the weighting factors corresponding to the fuel cell lifetime, the lithium battery lifetime, and the hydrogen consumption loss, respectively.
The hydrogen consumption ratio is determined by the ratio of the consumed hydrogen mass to the total hydrogen capacity and is given by
The lifetime degradation rate of the fuel cell is expressed as
where , , and represent the lifetime degradation rates of the fuel cell resulting from high-load operation, low-load operation, and load variations, respectively.
The lifetime degradation rate of the lithium battery is expressed as
Plowing is one of the signature and most fundamental operating conditions for a tractor. Therefore, based on the plowing duty cycle, the values for and are obtained using the aforementioned entropy weight method as follows:
4.1.3. Constraint Settings
To ensure the safe operation of the energy system and extend the service life of key components, multi-dimensional constraints are implemented on the critical parameters of the lithium-ion battery and the fuel cell. A higher resting SOC accelerates battery capacity fade; therefore, the initial SOC is set to 60%. Additionally, the deviation between the terminal and initial SOCs is restricted to maintain state consistency. On the other hand, due to the abrupt load variation characteristics of agricultural field operations, the loading and unloading ramp rates of the fuel cell are established as fixed values based on the maximum power variation rate analysis. This aims to prevent durability degradation induced by excessive instantaneous power fluctuations. The specific constraints are formulated as follows:
where and represent the SOC at the initial and terminal time steps, respectively; denotes the initial SOH; and and are the upper and lower bounds of the SOH, respectively.
4.2. Dynamic Programming Strategy Incorporating Durability, Economy, and Dynamic Response
4.2.1. Mechanism of the Fuel Cell Online Dynamic Response
To overcome the limitations of strategies based on fixed power or fixed power fluctuation limits and to address the issue of output deviation caused by real-time phenomena such as fuel cell aging—which are challenging to capture with offline curve-based mechanisms—this paper proposes an online update mechanism for the fuel cell’s dynamic response capability. The improved solution process for the dynamic programming strategy incorporating durability, economy, and dynamic response (DP-DEDR) is illustrated in Figure 9.
Figure 9.
Flowchart of the DP-DEDR solution process.
By monitoring the FC’s power tracking error and voltage undershoot in real time and integrating these with the baseline dynamic response characteristics derived from a fixed, offline curve, the maximum power ramp rate of the FC is optimized. This enables an online update of its output power limits. To prevent a power deficit resulting from inadequate dynamic response capability, the minimum load variation capability of the FC is constrained to be greater than 19 kW/s, as expressed by
where is the absolute limit of the actual allowable maximum power ramp rate, measured in kW/s; is used to simultaneously constrain the instantaneous rates of both the loading and unloading processes; is the fuel cell dynamic response baseline value, measured in kW/s; is the power deviation correction coefficient, measured in ; is the voltage undershoot correction coefficient, measured in kw/(s⋅v); is the fuel cell output power deviation, measured in kW; and represents the voltage undershoot deviation, measured in V.
The fuel cell output power deviation is the difference between the fuel cell power demanded by the energy management system and the actual output power of the fuel cell, and it is expressed as
The fuel cell voltage undershoot deviation is defined as the difference between the steady-state voltage prior to a load transient and the current actual stack voltage, and it is expressed as
where is the current actual stack voltage, measured in V, and represents the steady-state voltage before the load transient, measured in V.
To enhance the general applicability of the research, this study does not rely on experimental data but instead derives the power deviation correction coefficient through analytical calculation based on the fuel cell dynamic response model. To simplify the analysis and enable the analytical tuning of the control parameters, a decoupled calculation method based on the superposition principle is further employed. This approach treats the constraining effects of power deviation and voltage undershoot on the dynamic capability as independent factors, allowing for the separate derivation of their corresponding correction coefficients. This is expressed as
1. Power deviation correction coefficient
The actual output power of the fuel cell incurs a deviation due to the inherent lag in its dynamic response. A first-order inertial element is employed to characterize the complex multi-stage delay. Therefore, its Laplace transfer function is given by
where represents the dynamic response time constant, measured in s, and s is the Laplace operator.
Assuming the demanded power is a step signal, it is expressed as
where is the reference step magnitude used for parameter tuning. In this study, it is set to the rated power of the fuel cell, i.e., , which is used to characterize the system’s feature response across the full load range, and is the unit step function.
By combining Equations (54) and (55) and performing the inverse Laplace transform on both sides, the time-domain response relationship can be obtained, yielding the actual power response as
Based on Equation (50), the power deviation under the step input is calculated as
The power ramp rate is the derivative of the actual power with respect to time; therefore, taking the derivative of Equation (56) yields
At the initial instant of the step input, i.e., t = 0+, the power ramp rate reaches its maximum value. From Equation (58), the initial actual ramp rate can be derived as
At this instant, the maximum allowable ramp rate should be equal to the initial actual ramp rate; otherwise, the constraint cannot be enforced. That is, the upper limit of the constraint should converge to the physical response limit of the fuel cell. If the command ramp rate issued by the EMS exceeds the maximum physical ramp rate achievable by the fuel cell, an unavoidable deviation will occur. Therefore,
At t = 0+ and by combining Equations (53), (57) and (60), the following can be derived:
Solving for yields
It is noteworthy that, to ensure the stability of the feedback control mechanism, the coefficient must be a positive value. This implies that during the system design phase, the set baseline maximum power ramp rate must satisfy the maximum design step power. The physical meaning of this constraint is as follows: the set baseline limit should be encompassed by the physical limit of the system’s response capability. If the baseline value is set too small, i.e., less than the physical response speed, then no correction coefficient is needed.
2. Voltage undershoot correction coefficient
When the voltage undershoot reaches its maximum value, based on Equation (51), the voltage drop is
where is the maximum voltage undershoot amplitude, measured in V, and represents the minimum stack voltage during the load transient, measured in V.
When the voltage undershoot reaches its maximum, the power ramp rate should decrease to zero to avoid further undershoot. Substituting into Equation (53) yields
by rearranging
3. Online update mechanism for fuel cell dynamic response capability
Based on Equations (49), (62) and (65), the online update mechanism for the fuel cell dynamic response is formulated as shown below. It is important to note that the term in the equations denotes the previously defined reference step constant, rather than the instantaneous step magnitude under real-time operating conditions. This distinction is maintained to ensure the deterministic nature of the control gain:
During the practical online update process, to prevent system oscillations induced by control logic inversion, a lower saturation limit of protection is incorporated into the algorithm’s implementation. This ensures that the system maintains a fundamental level of regulation capability at all times. The formulation is expressed as
Therefore, the maximum and minimum output power values of the fuel cell at a time step (k + 1) are given by
That is,
It can be observed that the improved DP algorithm directly constrains the search space for fuel cell power optimization based on the power output at the previous time step, thereby eliminating the need to determine penalty factors.
The numerical stability of this mechanism is ensured by its analytical formulation and the lower saturation limit in Equation (67), which prevents non-physical divergence and control oscillations. Since the EMS operates at a 1 s time scale and measurement noise typically resides in the high-frequency sub-second domain, the system is inherently robust against signal interference. Consequently, the proposed strategy exhibits strong robustness against these assumed constants, and the selected typical values are sufficient to characterize the dynamic boundaries of the powertrain during the system-level optimization process.
4.2.2. Constraint Settings
The power variation range for the fuel cell at the subsequent time step is constrained based on the aforementioned dynamic response capability constraint mechanism. The specific constraint settings are as follows:
where and represent the SOC at the initial and terminal time steps, respectively; denotes the initial SOH; and and are the upper and lower bounds of the SOH, respectively.
5. Model-in-the-Loop Simulation Verification
To validate the effectiveness of the aforementioned EMS, a MIL simulation platform integrating the online update mechanism for fuel cell dynamic response capability is constructed in this study. Established based on the backward-facing modeling approach, this platform is capable of simulating the complete energy flow of the HFCT—from the driving cycle to the power source—under various operating conditions. The system architecture of the simulation model is implemented on the MATLAB/Simulink 2022 platform. Utilizing this MIL simulation platform allows for a systematic evaluation of the performance of energy management strategies under diverse operating conditions, providing robust theoretical support and a simulation foundation for practical engineering applications. The parameters of the remaining key components of the powertrain are listed in Table 4.
Table 4.
Key parameters of the drive motor.
To enhance the comparative analysis, this study conducts three sets of comparative experiments: the power following strategy, abbreviated as PF; dynamic programming considering the coordination of energy system durability and the energy consumption economy, abbreviated as DP-CoDE; and the dynamic programming strategy incorporating durability, economy, and dynamic response, abbreviated as DP-DEDR.
5.1. Baseline Control Strategies
The rule-based EMS for the HFCT primarily depends on a predefined set of rules to achieve coordinated power distribution among various energy sources. Within this framework, the core concept of the power follower (PF) strategy is to dynamically adjust the fuel cell output power according to the actual load demand, ensuring that the power source tracks the total required power as closely as possible. This strategy is employed as a baseline for longitudinal comparison to verify the effectiveness of the proposed strategy.
To mitigate fuel cell degradation and extend its service life, the fuel cell output power in the PF strategy is subject to constraints regarding the maximum power ramp rate and the allowable output range. Upper and lower operational boundaries are established based on both steady-state and transient analyses. For the designed HFCT, the specific configurations for the inputs, outputs, and key operational boundaries are defined as follows:
where X is the input vector; U is the output variable; v is the vehicle operating speed, measured in km/h; and are the upper and lower limits of the SOC, respectively; and represents the instantaneous load-change rate of the fuel cell’s actual output power, measured in kW/s.
5.2. Plowing Operation Settings
To represent typical agricultural field operation scenarios, a plowing cycle is constructed as shown in Table 5. In this model, the generation of the load profile comprehensively incorporates the parameters of the coupled agricultural implements listed in Table 4 and the empirical formula for rated traction force. Considering the continuous heavy-duty characteristics associated with high-speed operations, the soil type in the model is defined as light loam with low specific resistance. Additionally, stochastic functions are employed to simulate random field resistance fluctuations, thereby ensuring the authenticity of the simulation environment. The specific load variations under plowing conditions are illustrated in Figure 10.
Table 5.
Plowing operation condition settings.
Figure 10.
Load profile of the plowing operation.
5.3. Results Analysis
5.3.1. Analysis of Power Source Power-Split Characteristics
Figure 11 illustrates the dynamic response of power and the SOC for the three different strategies under plowing conditions, while Table 6 presents the terminal values for the SOC and SOH.
Figure 11.
Dynamic response results of power output and the SOC.
Table 6.
Results of the SOC and SOH.
Given that the external operating conditions during the simulation are identical, the power demand at the motor input remains consistent across all three strategies. In contrast to the PF strategy, the DP-CoDE and DP-DEDR strategies—influenced by the component degradation model and the global optimization principles of DP—exhibit a high degree of consistency in their overall trends. Specifically, the load fluctuations of the fuel cell are significantly mitigated, allowing it to continuously and stably supply the primary power required by the tractor. Meanwhile, the lithium battery acts as an auxiliary power source; with the exception of headland turning operations, its power fluctuation remains within a low-power range, performing energy supplementation or recharging as needed.
Conversely, for the PF strategy, since the SOC lies within the specific range of , the fuel cell’s output power gradually increases towards its high-efficiency region, while the lithium battery’s output power correspondingly decreases. This behavior aligns with the design requirements of the PF strategy. Consequently, the power fluctuation interval of the lithium battery spans from −21 kW to 100 kW, representing a wide fluctuation range.
Based on the dynamic response fluctuations of the SOC shown in Figure 11d, it can be observed that the SOC curves derived from both DP strategies exhibit identical trends. Both strategies successfully maintain the terminal SOC value in the vicinity of 0.6, satisfying the design requirement for charge-sustaining operation.
Compared to DP-CoDE, the SOC fluctuation amplitude under DP-DEDR increases slightly by 2.5%. This increase reflects a fundamental trade-off: DP-DEDR prioritizes fuel cell health by imposing rigorous online dynamic constraints to suppress transient power oscillations. Consequently, the battery must perform more intensive compensatory charge/discharge cycles to bridge the power gaps, leading to a passive rise in SOC fluctuations. This minor stability penalty is justified by the substantial gains in fuel cell durability, which is the primary control objective for heavy-duty tractors.
In contrast to the DP-CoDE and DP-DEDR strategies, the PF strategy exhibits substantial increases of 85.80% and 85.06% in fluctuation amplitude, respectively. A comparative analysis of the terminal SOH values for the lithium battery reveals a degradation magnitude of less than 0.0005%, indicating that the battery health status remains well-preserved. In the DP-CoDE and DP-DEDR strategies, the final SOC values are marginally higher—though within the allowable range—due to cumulative errors in lithium battery energy consumption estimation, variable precision errors, and prediction errors.
5.3.2. Analysis of the Fuel Economy
The fuel consumption characteristics of the three strategies under plowing conditions are illustrated in Figure 12 and Table 7. The hydrogen consumption of the fuel cell follows the sequence of PF < DP-DEDR < DP-CoDE, whereas both the equivalent hydrogen consumption of the battery and the total hydrogen consumption follow the order of DP-CoDE < DP-DEDR < PF.
Figure 12.
Hydrogen consumption of various components.
Table 7.
Hydrogen fuel consumption results.
As indicated in Table 7, compared with the PF strategy, the FC hydrogen consumption under the DP-CoDE and DP-DEDR strategies increases by more than 25%, while the equivalent hydrogen consumption of the battery decreases by over 97%. These results demonstrate that the DP-CoDE and DP-DEDR strategies rely on the FC to sustain the primary power demand, with the battery serving as an auxiliary power source.
Notably, the battery equivalent consumption under the DP-DEDR strategy is approximately five times that of the DP-CoDE strategy. This is attributed to the smoother power variation rate of the FC under the DP-DEDR strategy, which necessitates more frequent charging and discharging cycles of the battery. Consequently, the equivalent hydrogen consumption of the battery increases, which is consistent with the observed power fluctuation profiles.
5.3.3. Durability Analysis
The efficiency distribution of the fuel cell system’s operating points is illustrated in Figure 13. Under the PF strategy, the system exhibits the most extensive operating range, characterized by broad coverage across the full power spectrum without significant clustering. This phenomenon occurs because the system operates continuously within the designated interval, where the FC output power increases incrementally at a predetermined rate according to the rule-based settings. Furthermore, under this strategy, the system maintains a constant output of 12 kW whenever the demand falls below , resulting in an overall operating range of [12, 140.6] kW. In contrast, the operating points for the DP-CoDE and DP-DEDR strategies are primarily concentrated within high-efficiency power regions, leading to relatively narrower operating ranges.
Figure 13.
Distribution of the FC operating points.
The fuel cell’s life degradation rates are summarized in Table 8. As indicated by the data, only the PF strategy experiences high-load operation (at t = 1149 s) among the three strategies. Furthermore, the PF strategy requires the FC’s output power to increase incrementally according to rule-based settings, which leads to a significantly longer duration of low-load operation. The degradation losses caused by load fluctuations for the three strategies follow the sequence of DP-DEDR < DP-CoDE < PF, which is consistent with the predefined control objectives.
Table 8.
Life degradation rates of the fuel cell.
The total system losses for the three strategies are illustrated in Figure 14 and Table 9. A horizontal comparison reveals that hydrogen consumption in the tank accounts for the largest proportion of the total cost, while the life degradation of both the FC system and the battery is nearly negligible. These results indicate that hydrogen consumption dominates the total operating losses, followed by battery degradation, with FC degradation being the most gradual. Given that hydrogen serves as a replenishable energy carrier, its dominant share in the total cost does not adversely affect the overall service life of the vehicle.
Figure 14.
Total system losses.
Table 9.
Total system loss rates.
A vertical comparison reveals that the FC degradation rates follow the sequence of DP-DEDR < DP-CoDE < PF, while the battery degradation rates follow the order of DP-CoDE < DP-DEDR < PF. Additionally, both the hydrogen consumption rate and the total system loss rate follow the sequence of DP-CoDE < DP-DEDR < PF. Specifically, the battery degradation rate under the DP-DEDR strategy is 10.23% higher than that of the DP-CoDE strategy, whereas its FC degradation rate is 67.66% lower. This result aligns with the intended design objectives of the strategies. Furthermore, from an economic perspective, prolonging the service life of the fuel cell at the expense of battery life is considered reasonable and justified.
Compared with the PF strategy, the DP-CoDE and DP-DEDR strategies achieve significant reductions in the hydrogen consumption rate, FC degradation rate, battery degradation rate, and total loss rate. These findings demonstrate that the proposed strategies can effectively minimize both consumption and operational losses across all evaluated dimensions.
5.3.4. Analysis of Fuel Cell Dynamic Response Characteristics
Figure 15 illustrates the dynamic response characteristics of the FC under the three evaluated strategies. Specifically, Figure 15a–c depict the power tracking performance, which characterizes the RTE of the FC. It is observed that under the PF strategy, the actual output power fails to follow the demand power effectively, exhibiting significant deviations. In contrast, the DP-DEDR strategy produces the smoothest demand power trajectory during intense fluctuations, enabling the actual output power to maintain remarkably high tracking precision.
Figure 15.
Dynamic response characteristics of the fuel cell.
The superior performance of the DP-DEDR strategy is primarily attributed to the online fuel cell dynamic response update mechanism embedded within its energy management optimization process. This mechanism enables the real-time correction of the physical boundaries for the fuel cell’s load-change rate based on the instantaneous operating state of the system. Unlike the DP-CoDE strategy, which prioritizes the trade-off between steady-state energy efficiency and durability, the DP-DEDR strategy imposes precise constraints on the instantaneous physical feasibility domain of the load-change capability at each decision step. Consequently, this approach ensures that the generated power demand trajectories are not only mathematically optimal but also highly feasible at the physical execution level.
Relatively larger power deviations are observed during the plow penetration and headland turning phases. However, during steady-state operation, the tracking error between the demand and actual power remains below 1 kW. These discrepancies are primarily attributed to the FC load-change capability curve used to constrain the DP algorithm. Since this curve is derived from a fitted analysis of dynamic response characteristics ranging from zero to full power, it serves as a macroscopic characterization of the system’s global dynamic capability. However, as a static mapping function, it is challenging for this curve to precisely represent the instantaneous local dynamic characteristics at every possible power switching point. This limitation leads to subtle tracking mismatches between the planned demand power and the true tracking capability of the model under specific operating conditions.
Figure 15d shows the rate of change in the FC’s output power, which characterizes the RS. The results indicate that the power variation per unit time remains within the range of [−17.37, 18.09] kW/s, which is consistent with the predefined constraint settings.
Table 10 summarizes the FC dynamic response performance under plowing conditions. A vertical comparison indicates that both the DP-CoDE and DP-DEDR strategies achieve substantial improvements in RS and RTE compared to the PF strategy. Among the evaluated methods, the DP-DEDR strategy exhibits superior dynamic response performance, as its power output characteristics align more closely with both the system’s inherent dynamic constraints and the actual operational demands. Specifically, by incorporating FC dynamic response constraints into the DP-CoDE framework, the DP-DEDR strategy enhances RS by 44.44% and reduces the RTE by 41.17% at the cost of a marginal 0.15% increase in total hydrogen consumption. These results demonstrate that the designed DP-DEDR strategy effectively transforms theoretically optimal DP outputs into practically trackable control commands with a negligible economic penalty, thereby validating the effectiveness and superiority of the proposed approach.
Table 10.
Fuel cell dynamic response results under plowing conditions.
To further elucidate the technical innovation of the proposed DP-DEDR strategy in managing transient tractor loads, a comparative summary analysis is performed. As presented in Table 11, the comparison encompasses core control mechanisms, dynamic boundary handling capabilities, and performance gains across key indicators.
Table 11.
Comparison of technical features and performance among different EMS methodologies.
The results demonstrate that by integrating a real-time correction mechanism for the instantaneous physical feasibility domain, the DP-DEDR strategy significantly enhances system stability under extreme operational loads while maintaining a high fuel economy. This approach effectively achieves deep compatibility between theoretically optimal results and low-level physical constraints.
Furthermore, the online dynamic response constraint logic proposed in this study exhibits high algorithmic universality and scenario transferability. Although this study focuses on tractor plowing cycles, other heavy-duty agricultural machinery, such as combine harvesters, encounter similar frequent load transients and impulsive disturbances (e.g., power fluctuations induced by variations in crop feed rate). Consequently, the real-time dynamic boundary correction framework can be directly migrated to these non-tractor scenarios. This provides a generalized control solution for enhancing the power source durability of various heavy-duty hydrogen-powered equipment, thereby offering significant academic and engineering reference value.
In summary, during plowing operations characterized by severe and intermittent load variations, both the DP-CoDE and DP-DEDR strategies significantly outperform the PF baseline in terms of maintaining SOC stability, reducing hydrogen consumption, and enhancing system durability. The entropy weight method quantifies the degree of information dispersion for each indicator across candidate strategies, thereby objectively reflecting its discriminatory contribution to the selection of optimal solutions. Quantitative results reveal that, compared to the economy-oriented DP-CoDE strategy, the proposed DP-DEDR strategy yields a fundamental enhancement in response stability (44.44%) and tracking accuracy (41.17%) at the expense of a marginal 0.15% difference in total hydrogen consumption. Furthermore, the robustness of these conclusions is maintained across different initial energy states. While varying the initial battery SOC may influence absolute fuel consumption, the relative performance gains in dynamic response are independent of the initial SOC, as they are predicated upon the inherent physical boundaries of the fuel cell stack. Since the magnitude of these performance gains far exceeds the subtle fluctuations in fuel consumption, the superiority of the DP-DEDR strategy in balancing durability and economy remains firm even under moderate variations in weighting factors or initial conditions. This underscores the robustness of the conclusions and confirms the high suitability of the proposed strategy for the high-power hydrogen fuel cell tractor designed in this study.
6. Conclusions
1. A dynamic performance simulation model for HFCTs and a multi-dimensional evaluation framework are established. By coupling mechanical inertia, manifold filling-and-emptying dynamics, and electrochemical reactions, the fuel cell dynamic model quantitatively identifies the boundary limits for the load-change ramp rate. This provides a quantitative foundation and objective guidance for the development of subsequent energy management strategies through a comprehensive evaluation system that encompasses dynamic responses, the fuel economy, durability, and continuous operational duration.
2. Fuel cell dynamic response indicators are innovatively proposed, resolving the difficulty in quantitatively assessing transient response latency and output stability under complex operational conditions. Meanwhile, a definition and a non-linear calculation model for continuous operational duration specific to HFCTs are established. By characterizing the non-linear mapping relationship between onboard energy storage capacity and operating duration, this work effectively fills the research gap in the field of quantitative endurance assessment for HFCTs.
3. A DP strategy integrated with online fuel cell dynamic response capabilities is developed. This strategy aims to achieve a synergistic improvement in system durability and the fuel economy. By incorporating physical ramp rates as optimization objectives, the universality and robustness of the model are enhanced. Furthermore, an online update mechanism for the fuel cell dynamic response capability is derived and established, which improves the tracking performance of the actual output power relative to the demand power.
4. MIL simulation results under plowing conditions demonstrate that the proposed DP algorithm yields significant improvements in durability, tracking accuracy, and RS, aligning more closely with real-world operational requirements. Specifically, the DP-DEDR strategy enhances RS and tracking accuracy by 44.44% and 41.17%, respectively, at the cost of a marginal 0.15% increase in total hydrogen consumption.
7. Future Research
Although the current MIL simulations effectively demonstrate the optimization potential of the proposed strategy, the lack of hardware-level validation remains a limitation as real-world controller constraints and communication delays are not fully accounted for. Therefore, future research will prioritize the following directions:
- (1)
- Development of lightweight online intelligent energy management strategies: To address the challenges of high computational complexity and heavy reliance on accurate system models, emerging intelligent algorithms such as deep reinforcement learning will be introduced. Compared with traditional optimization methods, these algorithms demonstrate the potential to handle high-dimensional nonlinear systems [41]. Through interaction with the environment, these methods autonomously learn the optimal power allocation strategy without relying on an accurate model, providing a new approach for future online adaptive control of HFCTs.
- (2)
- Strengthening hardware-level validation and field-scale trials under complex environments. Given the complexity of the agricultural environment (e.g., humidity and temperature disturbances) and the potential impact of sensor noise, future research will prioritize verification through hardware-in-the-loop testing and field operation experiments. This will further validate the strategy’s robustness and engineering applicability under unstructured terrains and extreme load transients.
- (3)
- Subsequent research will explore the coupling mechanism between voltage recovery characteristics and dynamic response capability to further enhance the accuracy of system lifetime prediction under complex, non-steady-state operating conditions.
Author Contributions
Conceptualization, Y.L., L.X. and M.L.; methodology, Y.L.; software, Y.L.; validation, Y.L., Y.W. and S.L.; formal analysis, Y.L.; investigation, Y.L.; resources, M.L. and L.X.; data curation, Y.W.; writing—original draft preparation, Y.L.; writing—review and editing, Y.W.; visualization, S.L.; supervision, L.X.; project administration, M.L.; funding acquisition, M.L. and L.X. All authors have read and agreed to the published version of the manuscript.
Funding
This work was supported by the Key Project of the Youth Fund of China National Machinery Industry Corporation (grant number QNJJ-ZD-2022-03). (Project Title: Energy Management Strategy and Control System Development for Hybrid Powertrain Systems of Large-scale CVT Tractors Based on Auxiliary Power Linear Compensation).
Data Availability Statement
The original contributions presented in this study are included in the article. Further inquiries can be directed to the corresponding author.
Conflicts of Interest
The authors declare no conflicts of interest.
References
- Ahmadi, P.; Torabi, S.H.; Afsaneh, H.; Sadegheih, Y.; Ganjehsarabi, H.; Ashjaee, M. The effects of driving patterns and PEM fuel cell degradation on the lifecycle assessment of hydrogen fuel cell vehicles. Int. J. Hydrog. Energy 2020, 45, 3595–3608. [Google Scholar] [CrossRef] [Scilit]
- Jia, C.; He, H.; Zhou, J.; Li, J.; Wei, Z.; Li, K.; Li, M. A novel deep reinforcement learning-based predictive energy management for fuel cell buses integrating speed and passenger prediction. Int. J. Hydrogen Energy 2025, 100, 456–465. [Google Scholar] [CrossRef] [Scilit]
- Li, Y.; Liu, M.; Wang, Y.; Xu, L.; Lei, S. Energy management optimization and validation of a hydrogen fuel cell-powered agricultural tractor based on hierarchical dynamic programming. IEEE Access 2024, 12, 21382–21401. [Google Scholar] [CrossRef] [Scilit]
- Meng, X.; Mei, J.; Tang, X.; Jiang, J.; Sun, C.; Song, K. The degradation prediction of proton exchange membrane fuel cell performance based on a transformer model. Energies 2024, 17, 3050. [Google Scholar] [CrossRef] [Scilit]
- Lu, D.; Yi, F.; Hu, D.; Li, J.; Yang, Q.; Wang, J. Online optimization of energy management strategy for FCV control parameters considering dual power source lifespan decay synergy. Appl. Energy 2023, 348, 121516. [Google Scholar] [CrossRef] [Scilit]
- Jia, C.; Liu, W.; Chau, K.; He, H.; Zhou, J.; Niu, S. Passenger-aware reinforcement learning for efficient and robust energy management of fuel cell buses. eTransportation 2026, 27, 100537. [Google Scholar] [CrossRef] [Scilit]
- Eriksson, E.; Gray, E.M. Optimization and integration of hybrid renewable energy hydrogen fuel cell energy systems–A critical review. Appl. Energy 2017, 202, 348–364. [Google Scholar] [CrossRef] [Scilit]
- Sundstrom, O.; Guzzella, L. A generic dynamic programming Matlab function. In Proceedings of the 2009 IEEE Control Ap-Plications (CCA) & Intelligent Control (ISIC), St. Petersburg, Russia, 8–10 July 2009; pp. 1625–1630. [Google Scholar]
- Bao, S.; Sun, P.; Zhu, J.; Ji, Q.; Liu, J. Improved multi-dimensional dynamic programming energy management strategy for a vehicle power-split hybrid powertrain. Energy 2022, 256, 124682. [Google Scholar] [CrossRef] [Scilit]
- Jia, C.; Liu, W.; He, H.; Chau, K.T. Health-conscious energy management for fuel cell vehicles: An integrated thermal management strategy for cabin and energy source systems. Energy 2025, 333, 137330. [Google Scholar] [CrossRef] [Scilit]
- Li, K.; Zhou, J.; Jia, C.; Yi, F.; Zhang, C. Energy sources durability energy management for fuel cell hybrid electric bus based on deep reinforcement learning considering future terrain information. Int. J. Hydrogen Energy 2024, 52, 821–833. [Google Scholar] [CrossRef] [Scilit]
- Fu, Z.; Li, Z.; Si, P.; Tao, F. A hierarchical energy management strategy for fuel cell/battery/supercapacitor hybrid electric vehicles. Int. J. Hydrogen Energy 2019, 44, 22146–22159. [Google Scholar] [CrossRef] [Scilit]
- Liu, Y.; Liu, J.; Zhang, Y.; Wu, Y.; Chen, Z.; Ye, M. Rule learning based energy management strategy of fuel cell hybrid vehicles considering multi-objective optimization. Energy 2020, 207, 118212. [Google Scholar] [CrossRef] [Scilit]
- Song, K.; Wang, X.; Li, F.; Sorrentino, M.; Zheng, B. Pontryagin’s minimum principle-based real-time energy management strategy for fuel cell hybrid electric vehicle considering both fuel economy and power source durability. Energy 2020, 205, 118064. [Google Scholar] [CrossRef] [Scilit]
- Liu, M.; Li, Y.; Xu, L.; Wang, Y.; Zhao, J. General modeling and energy management optimization for the fuel cell electric tractor with mechanical shunt type. Comput. Electron. Agric. 2023, 213, 108178. [Google Scholar] [CrossRef] [Scilit]
- Li, X.-Z.; Zhang, M.-Z.; Yan, X.-H.; Liu, M.-N.; Xu, L.-Y. Power allocation strategy for fuel cell distributed drive electric tractor based on adaptive multi-resolution analysis theory. Energy 2023, 284, 129350. [Google Scholar] [CrossRef] [Scilit]
- Zhang, J.; Shi, M.; Liu, M.; Li, H.; Zhao, B.; Yan, X. Dual-Source Cooperative Optimized Energy Management Strategy for Fuel Cell Tractor Considering Drive Efficiency and Power Allocation. Agriculture 2024, 14, 1455. [Google Scholar] [CrossRef] [Scilit]
- Thounthong, P.; Chunkag, V.; Sethakul, P.; Davat, B.; Hinaje, M. Comparative study of fuel-cell vehicle hybridization with battery or supercapacitor storage device. IEEE Trans. Veh. Technol. 2009, 58, 3892–3904. [Google Scholar] [CrossRef] [Scilit]
- Aouzellag, H.; Ghedamsi, K.; Aouzellag, D. Energy management and fault tolerant control strategies for fuel cell/ultra-capacitor hybrid electric vehicles to enhance autonomy, efficiency and life time of the fuel cell system. Int. J. Hydrogen Energy 2015, 40, 7204–7213. [Google Scholar] [CrossRef] [Scilit]
- Zhang, X.; Mi, C.C.; Masrur, A.; Daniszewski, D. Wavelet-transform-based power management of hybrid vehicles with multiple on-board energy sources including fuel cell, battery and ultracapacitor. J. Power Sources 2008, 185, 1533–1543. [Google Scholar] [CrossRef] [Scilit]
- Yang, X.; Wang, Y. Genetic Algorithm-Based Energy Management Strategy for Fuel Cell Hybrid Electric Vehicles. World Electr. Veh. J. 2025, 16, 467. [Google Scholar] [CrossRef] [Scilit]
- Rajabzadeh, M.; Bathaee, S.M.T.; Golkar, M.A. Dynamic modeling and nonlinear control of fuel cell vehicles with different hybrid power sources. Int. J. Hydrogen Energy 2016, 41, 3185–3198. [Google Scholar] [CrossRef] [Scilit]
- Cheng, S.; Hu, D.; Hao, D.; Yang, Q.; Wang, J.; Feng, L.; Li, J. Investigation and analysis of proton exchange membrane fuel cell dynamic response characteristics on hydrogen consumption of fuel cell vehicle. Int. J. Hydrogen Energy 2022, 47, 15845–15864. [Google Scholar] [CrossRef] [Scilit]
- Ahmadi, P.; Khoshnevisan, A. Dynamic simulation and lifecycle assessment of hydrogen fuel cell electric vehicles considering various hydrogen production methods. Int. J. Hydrog. Energy 2022, 47, 26758–26769. [Google Scholar] [CrossRef] [Scilit]
- Wang, X.; Li, W.; Zhang, J.; Jiang, S.; Zhang, G.; Bai, C.; Wang, S.; Zhao, Q.; Lv, L. The critical roles of surface-bound radicals in the nickel phosphide/biochar-persulfate catalytic oxidation system for tetracycline removal: The synergistic catalysis between nickel phosphides and biochar. Chem. Eng. J. 2024, 491, 151915. [Google Scholar] [CrossRef] [Scilit]
- Song, K.; Hou, T.; Jiang, J.; Grigoriev, S.A.; Fan, F.; Qin, J.; Wang, Z.; Sun, C. Thermal management of liquid-cooled proton exchange membrane fuel cell: A review. J. Power Sources 2025, 648, 237227. [Google Scholar] [CrossRef] [Scilit]
- Su, Q.; Zhou, J.; Yi, F.; Hu, D.; Lu, D.; Wu, G.; Zhang, C.; Deng, B.; Cao, D. An intelligent control method for PEMFC air supply subsystem to optimize dynamic response performance. Fuel 2024, 361, 130697. [Google Scholar] [CrossRef] [Scilit]
- Zhang, Q.; Li, Z.; Zhang, J.; Liu, X.; Zheng, J.; Zhou, J. Oxygen excess ratio control strategy for fuel cell dynamic response optimization. Sustain. Energy Technol. Assessments 2025, 83, 104583. [Google Scholar] [CrossRef] [Scilit]
- Zhao, L.; Brouwer, J.; James, S.; Siegler, J.; Peterson, E.; Kansal, A.; Liu, J. Dynamic performance of an in-rack proton exchange membrane fuel cell battery system to power servers. Int. J. Hydrogen Energy 2017, 42, 10158–10174. [Google Scholar] [CrossRef] [Scilit]
- Yan, S.; Yang, M.; Sun, C.; Xu, S. Liquid water characteristics in the compressed gradient porosity gas diffusion layer of proton exchange membrane fuel cells using the Lattice Boltzmann Method. Energies 2023, 16, 6010. [Google Scholar] [CrossRef] [Scilit]
- Essoufi, M.; Benzaouia, M.; Hajji, B.; Rabhi, A.; Calì, M. Advancing Energy Management Strategies for Hybrid Fuel Cell Vehicles: A Comparative Study of Deterministic and Fuzzy Logic Approaches. World Electr. Veh. J. 2025, 16, 444. [Google Scholar] [CrossRef] [Scilit]
- Guo, J.; Wang, Y.; Shi, D.; Chu, F.; Wang, J.; Lv, Z. Comparative Study and Optimization of Energy Management Strategies for Hydrogen Fuel Cell Vehicles. World Electr. Veh. J. 2024, 15, 414. [Google Scholar] [CrossRef] [Scilit]
- Zhou, Y.; Huang, L.; Sun, X.; Shao, F. Impact of low frequency narrow pulse current on the degradation of proton exchange membrane fuel cells. Fuel Cells 2019, 19, 561–569. [Google Scholar] [CrossRef] [Scilit]
- Hu, Z.; Li, J.; Xu, L.; Song, Z.; Fang, C.; Ouyang, M.; Dou, G.; Kou, G. Multi-objective energy management optimization and parameter sizing for proton exchange membrane hybrid fuel cell vehicles. Energy Convers. Manag. 2016, 129, 108–121. [Google Scholar] [CrossRef] [Scilit]
- Chen, H.; Pei, P.; Song, M. Lifetime prediction and the economic lifetime of proton exchange membrane fuel cells. Appl. Energy 2015, 142, 154–163. [Google Scholar] [CrossRef] [Scilit]
- Fletcher, T.; Thring, R.; Watkinson, M. An Energy Management Strategy to concurrently optimise fuel consumption & PEM fuel cell lifetime in a hybrid vehicle. Int. J. Hydrogen Energy 2016, 41, 21503–21515. [Google Scholar] [CrossRef] [Scilit]
- Meng, X.; Sun, C.; Mei, J.; Tang, X.; Hasanien, H.M.; Jiang, J.; Fan, F.; Song, K. Fuel cell life prediction considering the recovery phenomenon of reversible voltage loss. J. Power Sources 2025, 625, 235634. [Google Scholar] [CrossRef] [Scilit]
- Zhou, Y.; Ravey, A.; Péra, M.-C. Real-time cost-minimization power-allocating strategy via model predictive control for fuel cell hybrid electric vehicles. Energy Convers. Manag. 2021, 229, 113721. [Google Scholar] [CrossRef] [Scilit]
- Hu, X.; Zou, C.; Tang, X.; Liu, T.; Hu, L. Cost-optimal energy management of hybrid electric vehicles using fuel cell/battery health-aware predictive control. IEEE Trans. Power Electron. 2019, 35, 382–392. [Google Scholar] [CrossRef] [Scilit]
- Ma, M.; Xu, E.; Zheng, W.; Qin, J.; Huang, Q. The optimized real-time energy management strategy for fuel-cell hybrid trucks through dynamic programming. Int. J. Hydrogen Energy 2024, 59, 10–21. [Google Scholar] [CrossRef] [Scilit]
- Wang, J.; Zhou, J.; Zhao, W. Deep reinforcement learning based energy management strategy for fuel cell/battery/supercapacitor powered electric vehicle. Green Energy Intell. Transp. 2022, 1, 100028. [Google Scholar] [CrossRef] [Scilit]
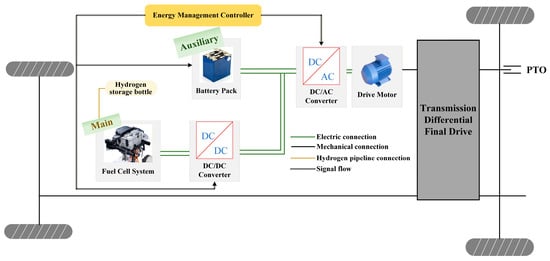
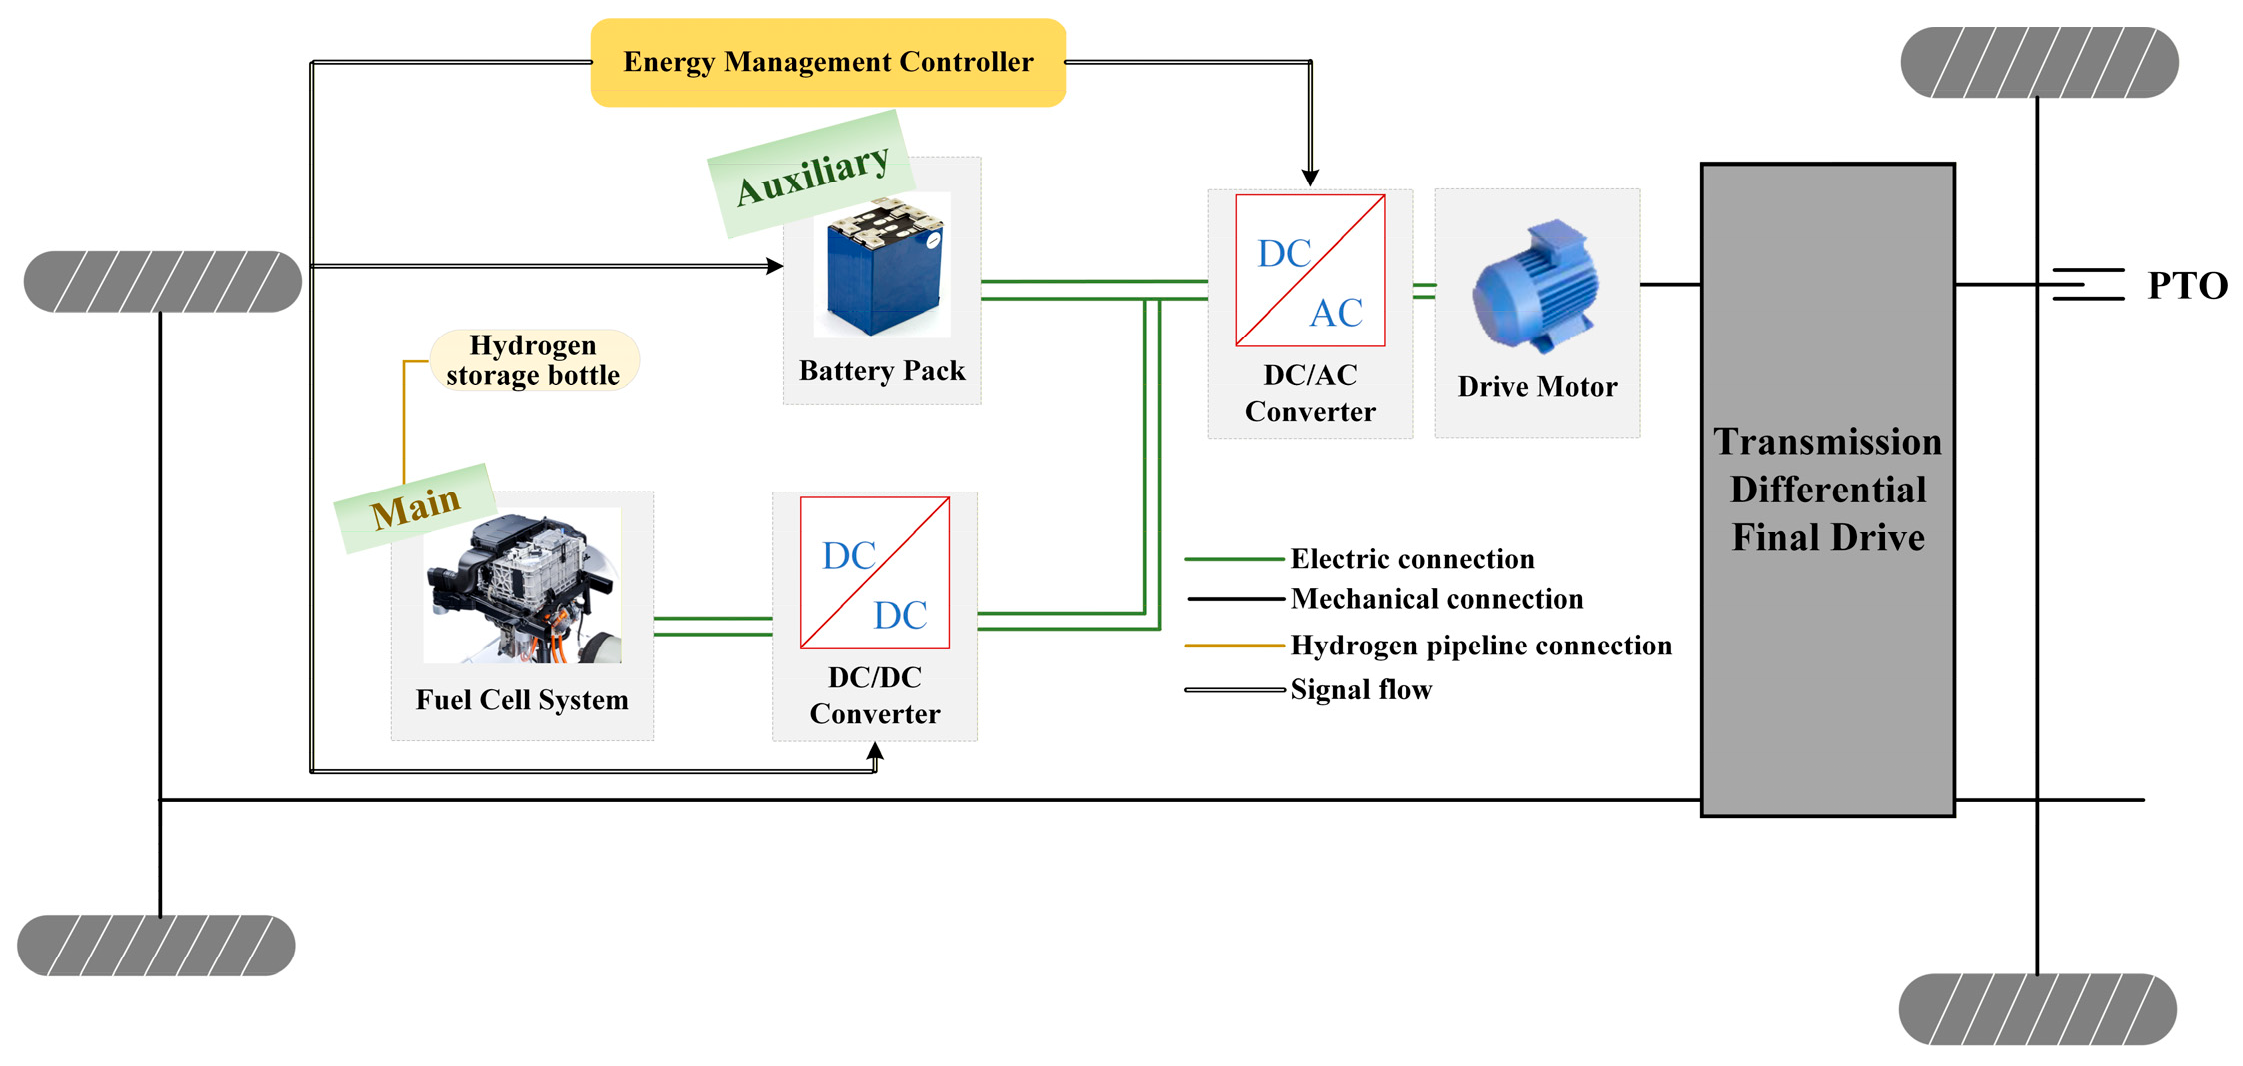
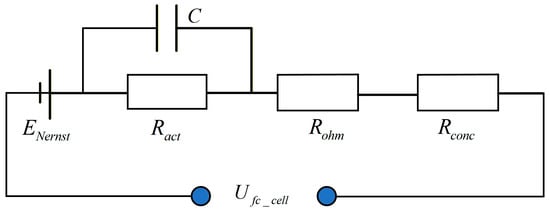
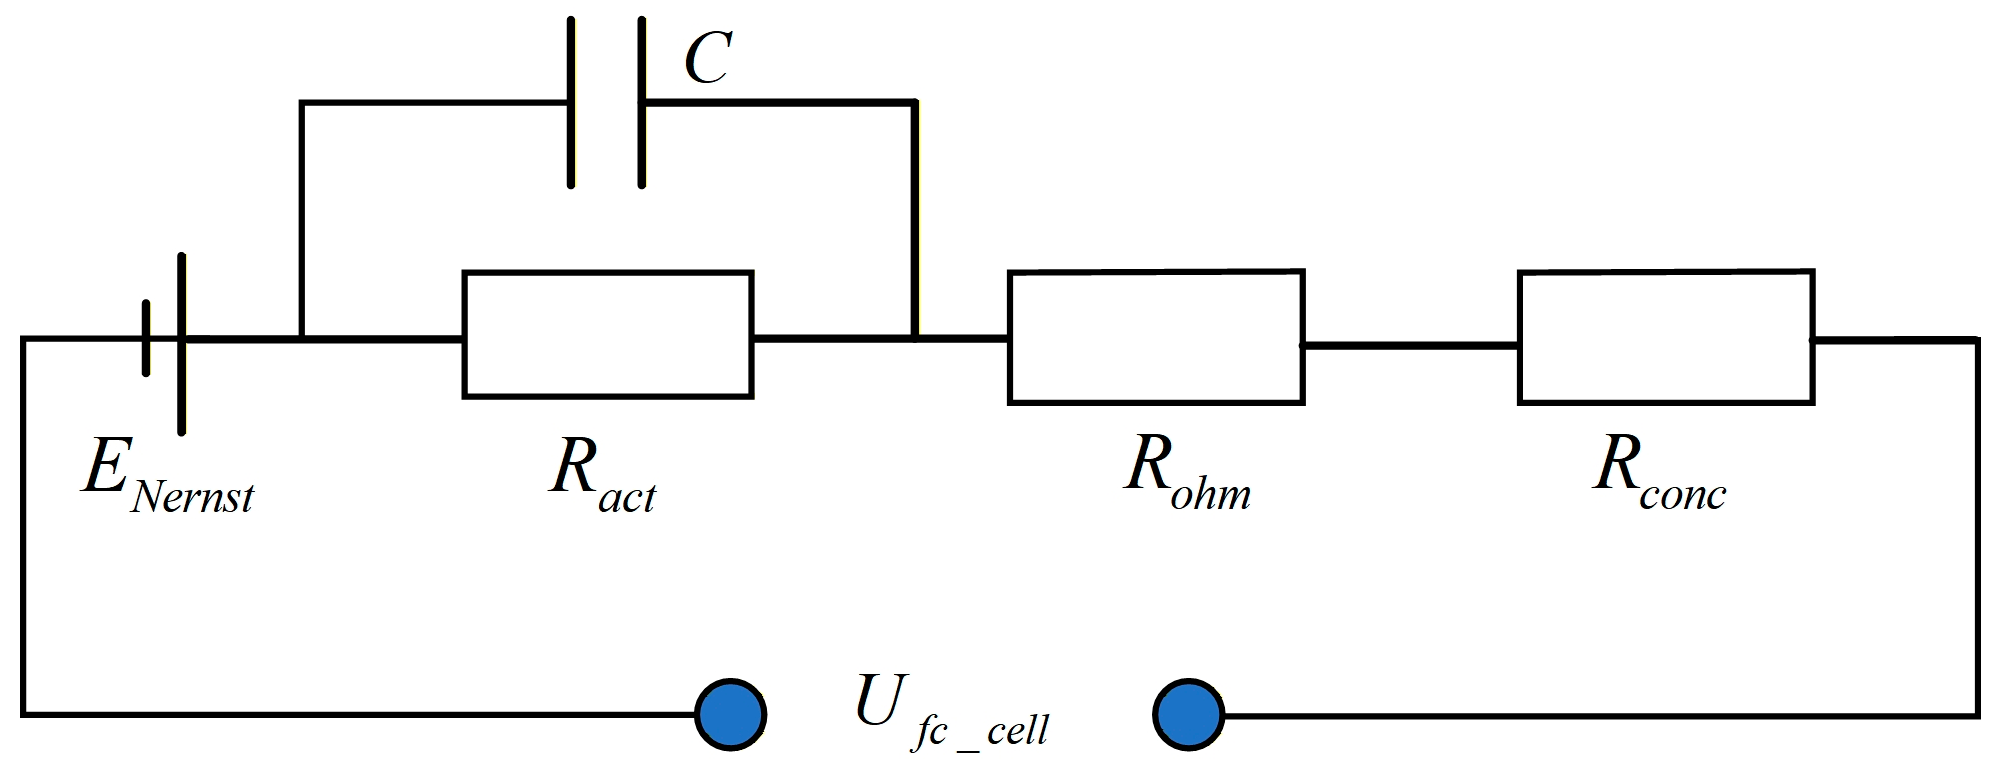
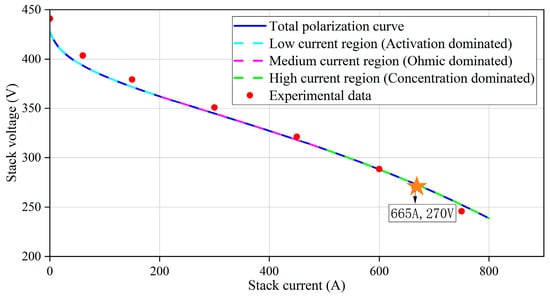
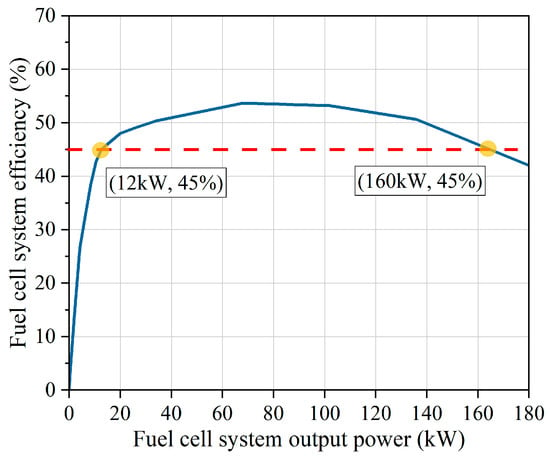
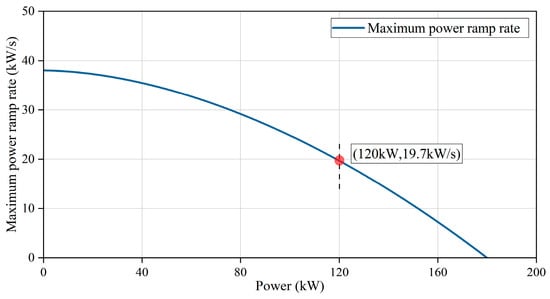
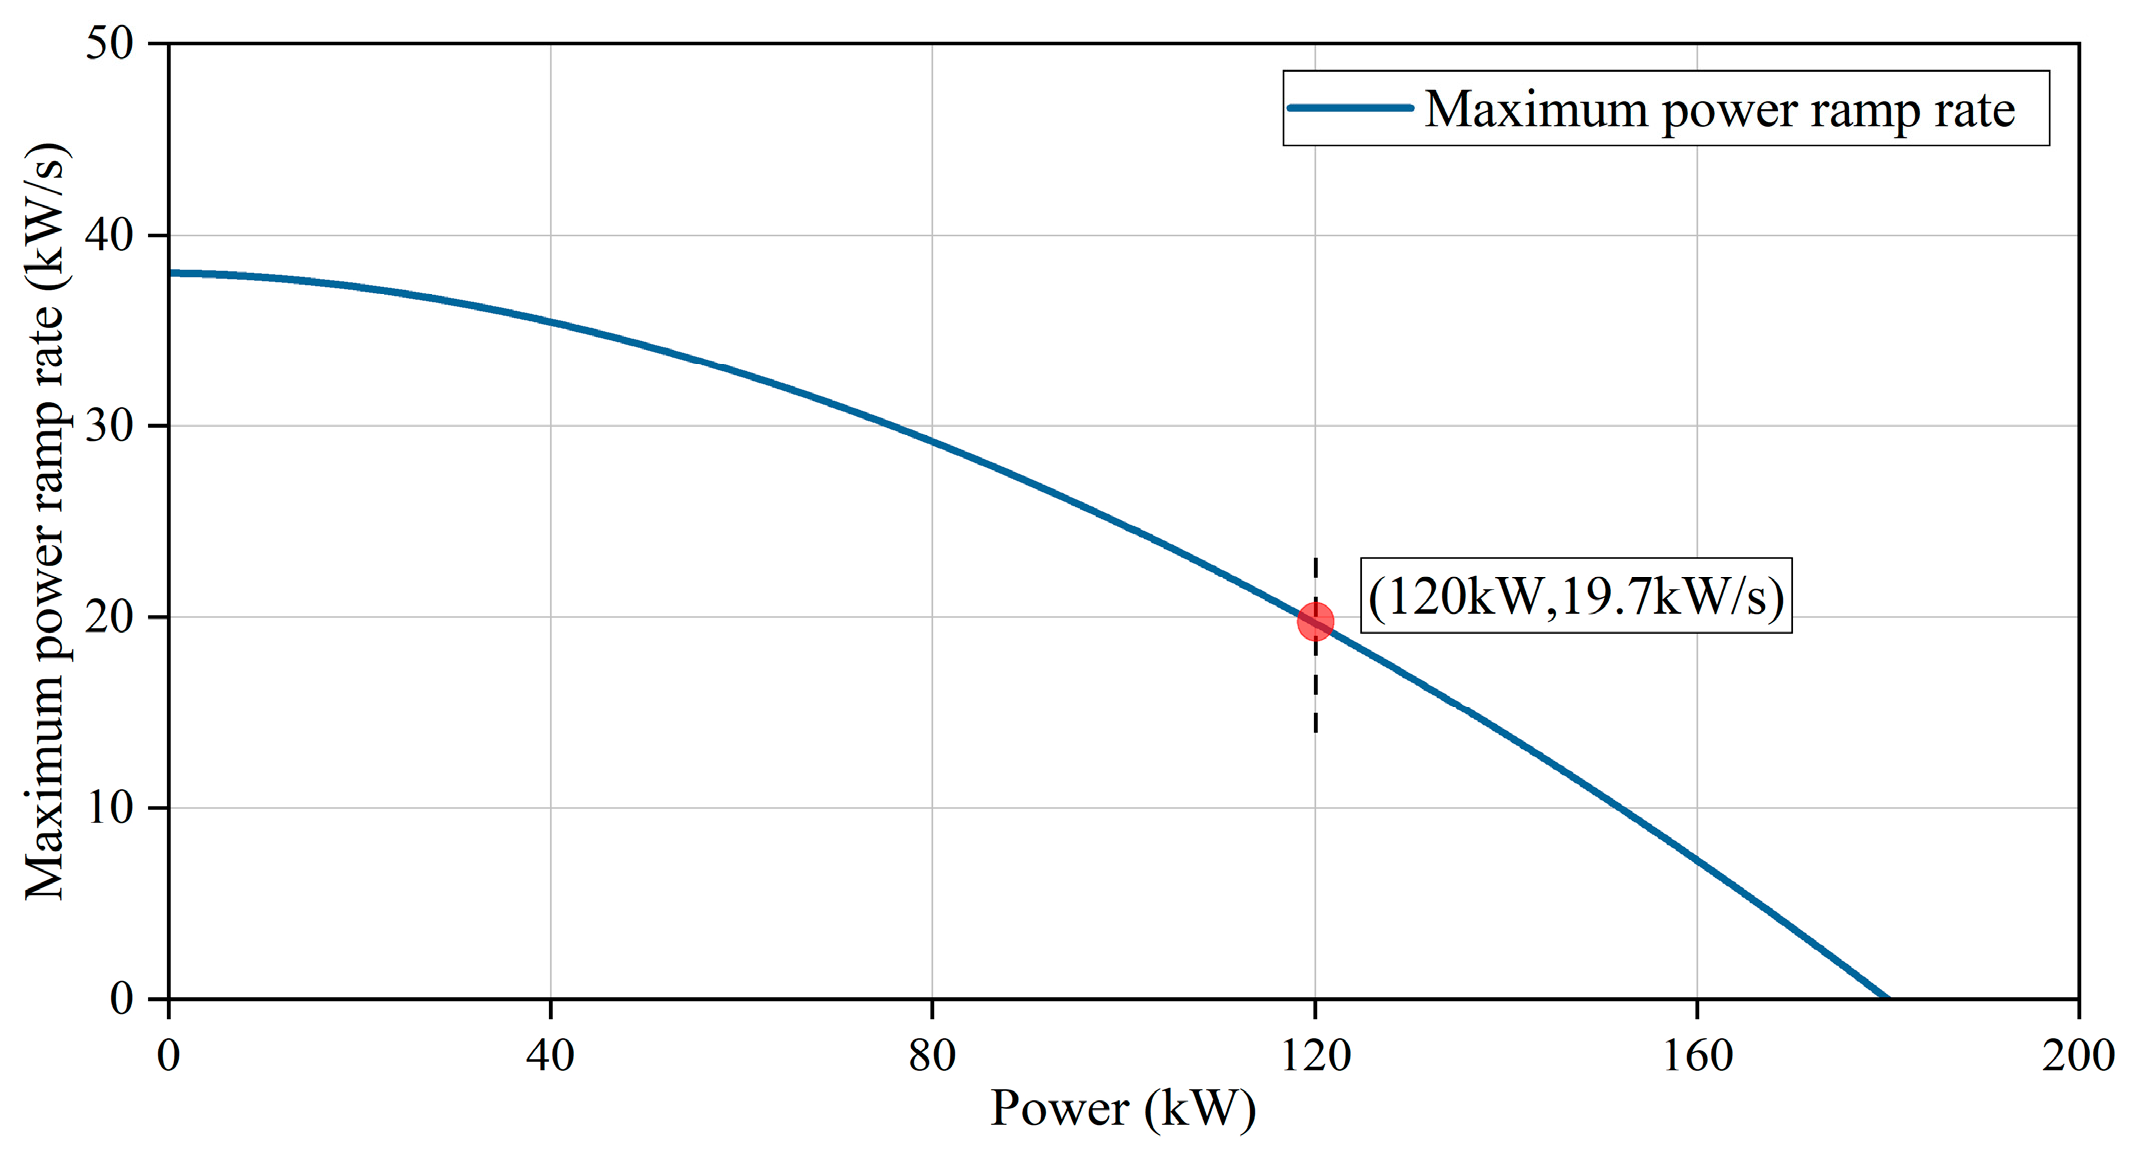
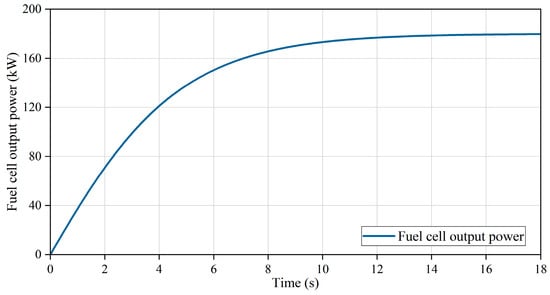
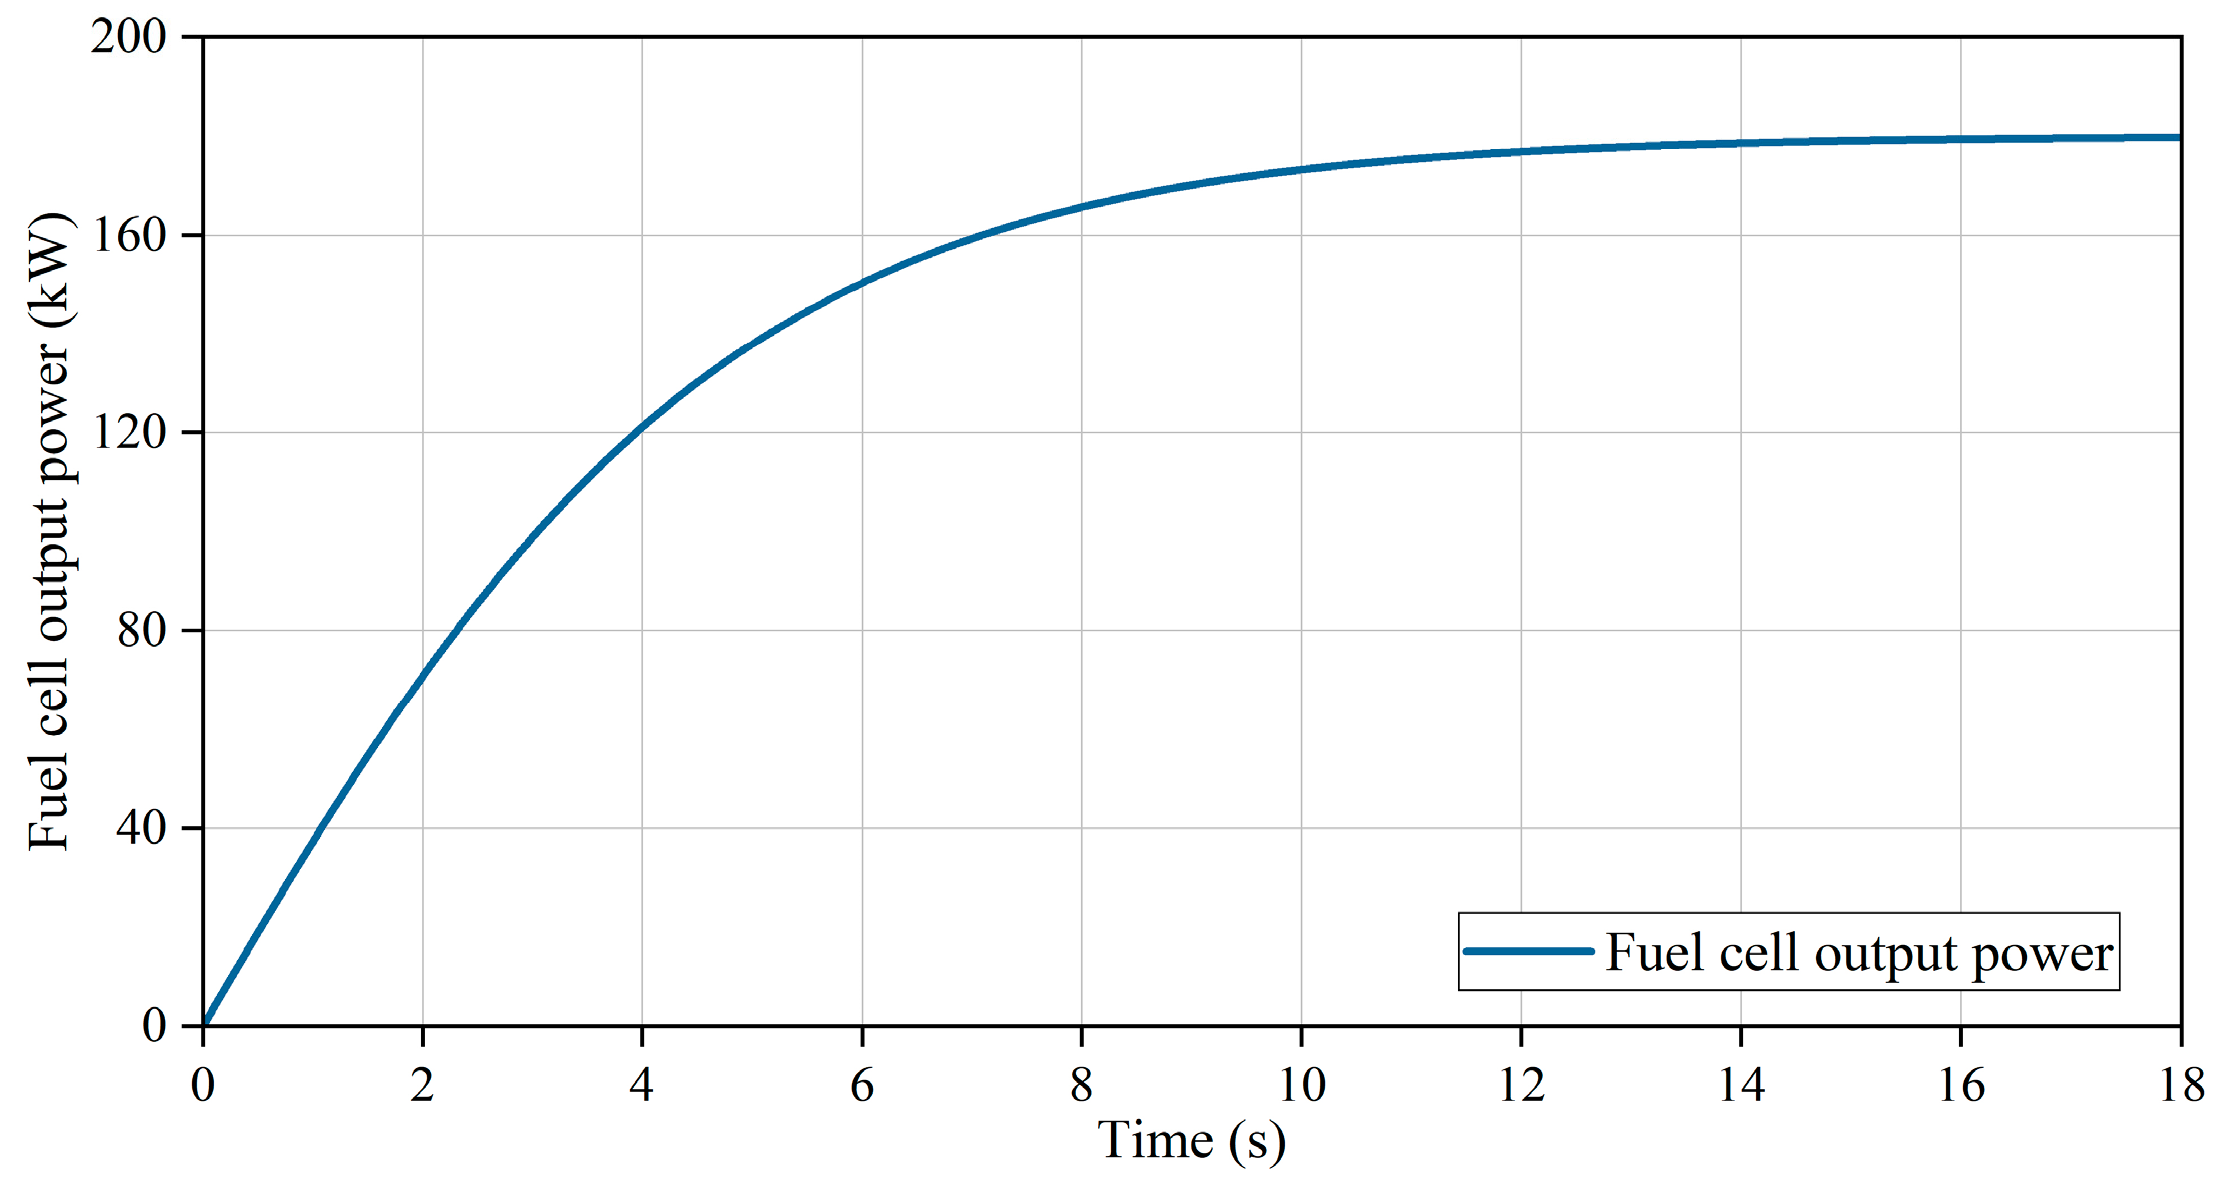
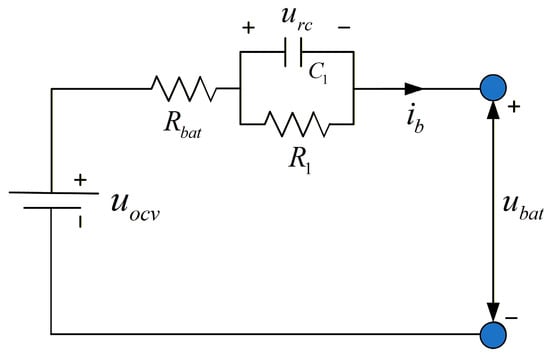
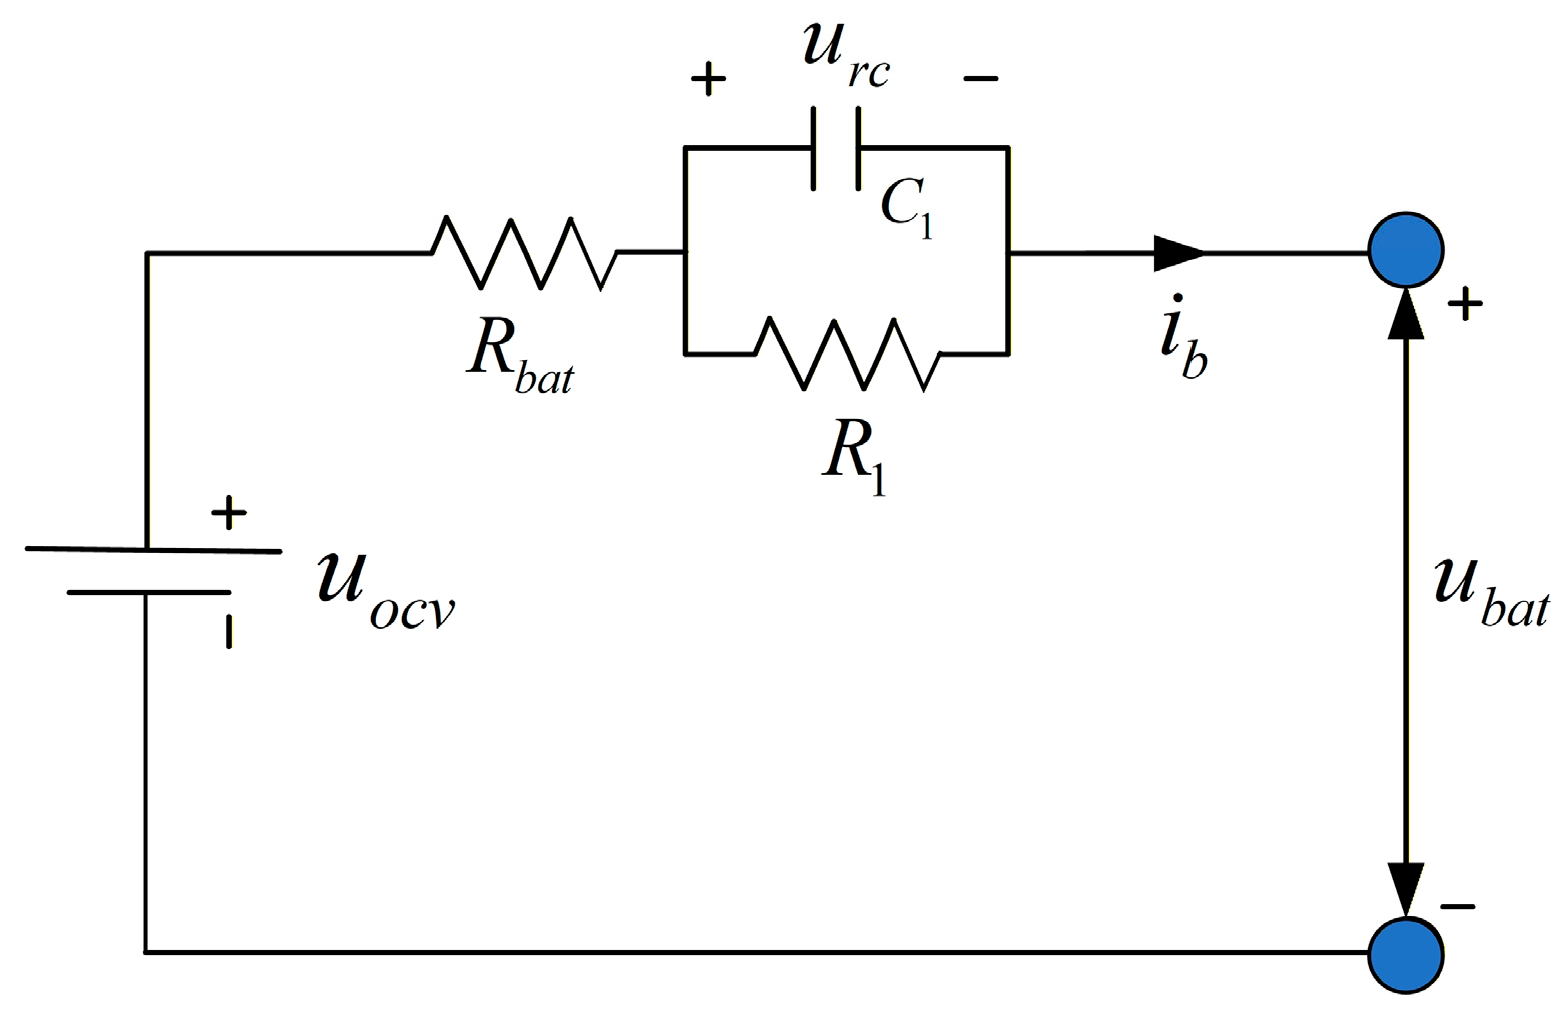
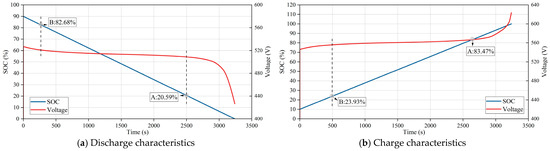
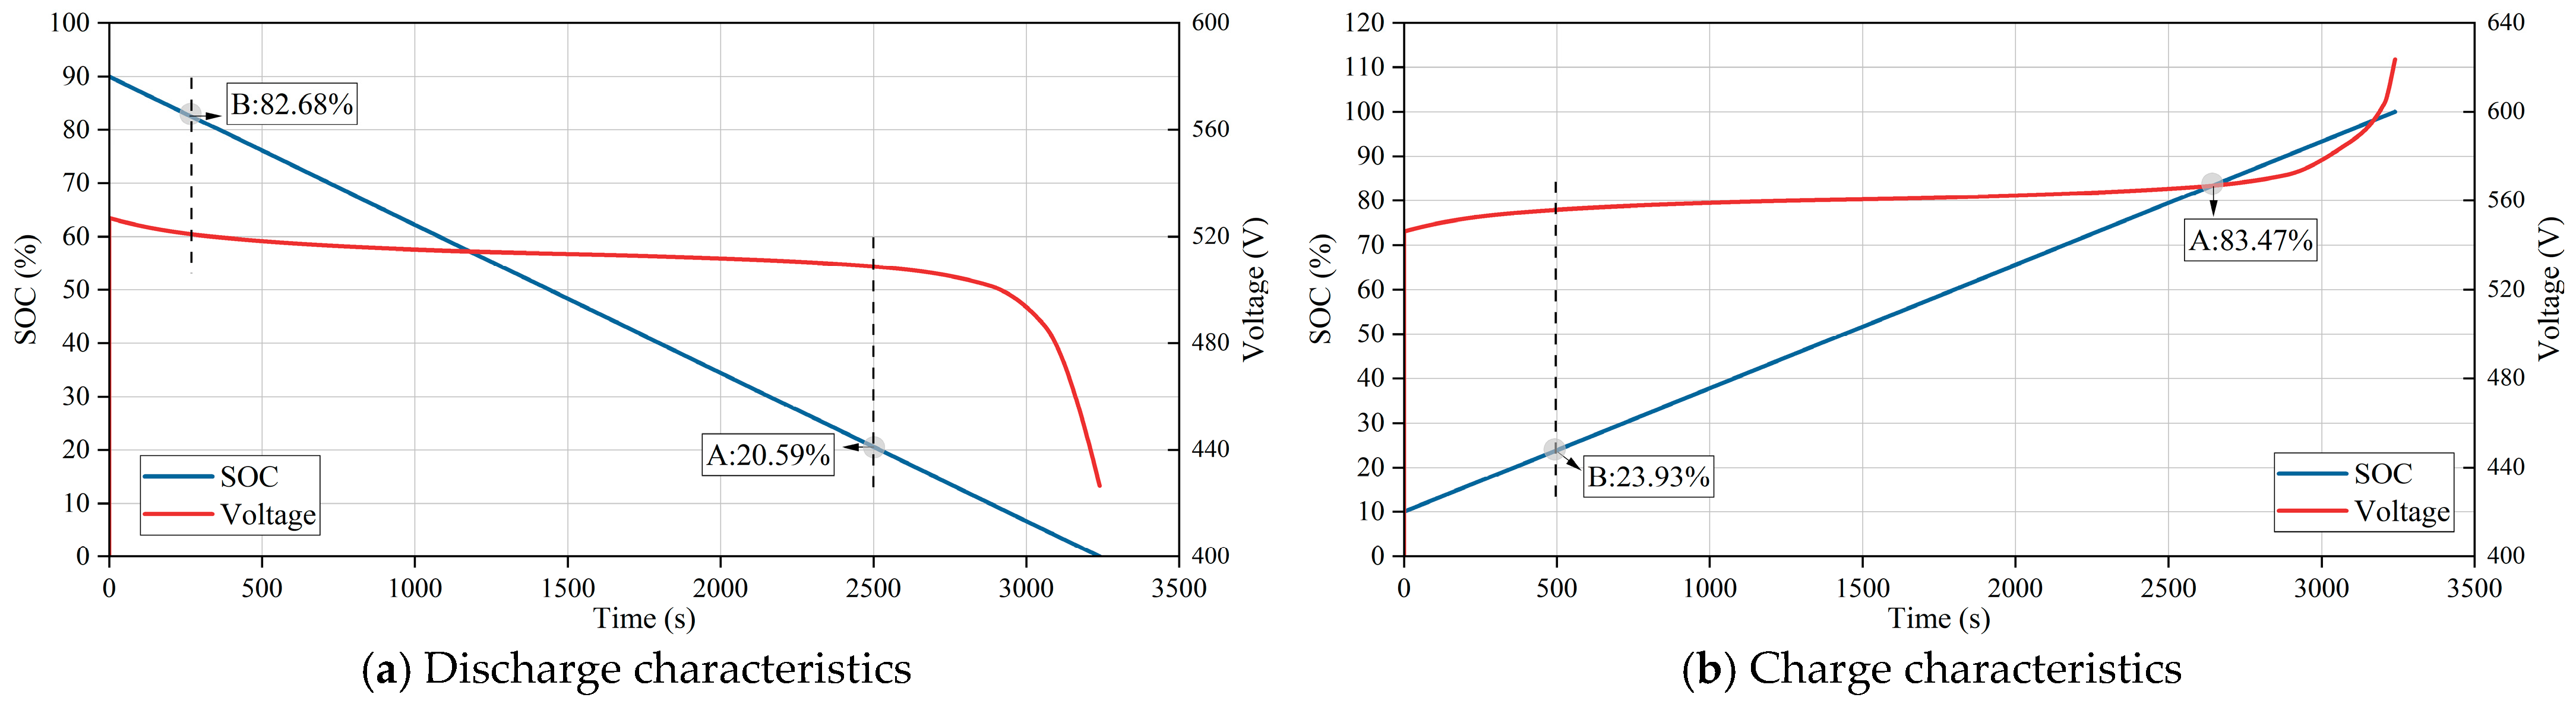
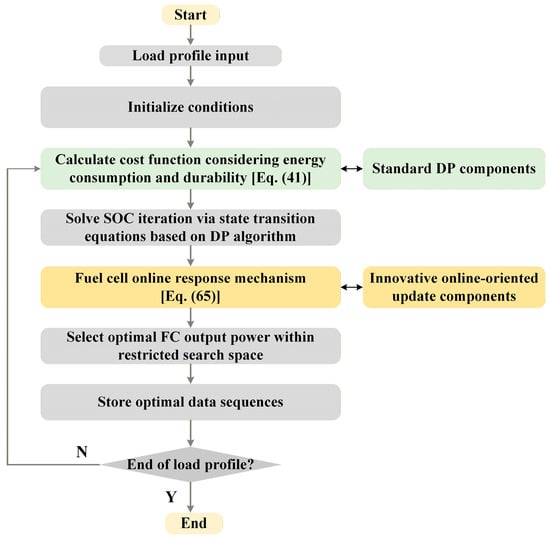
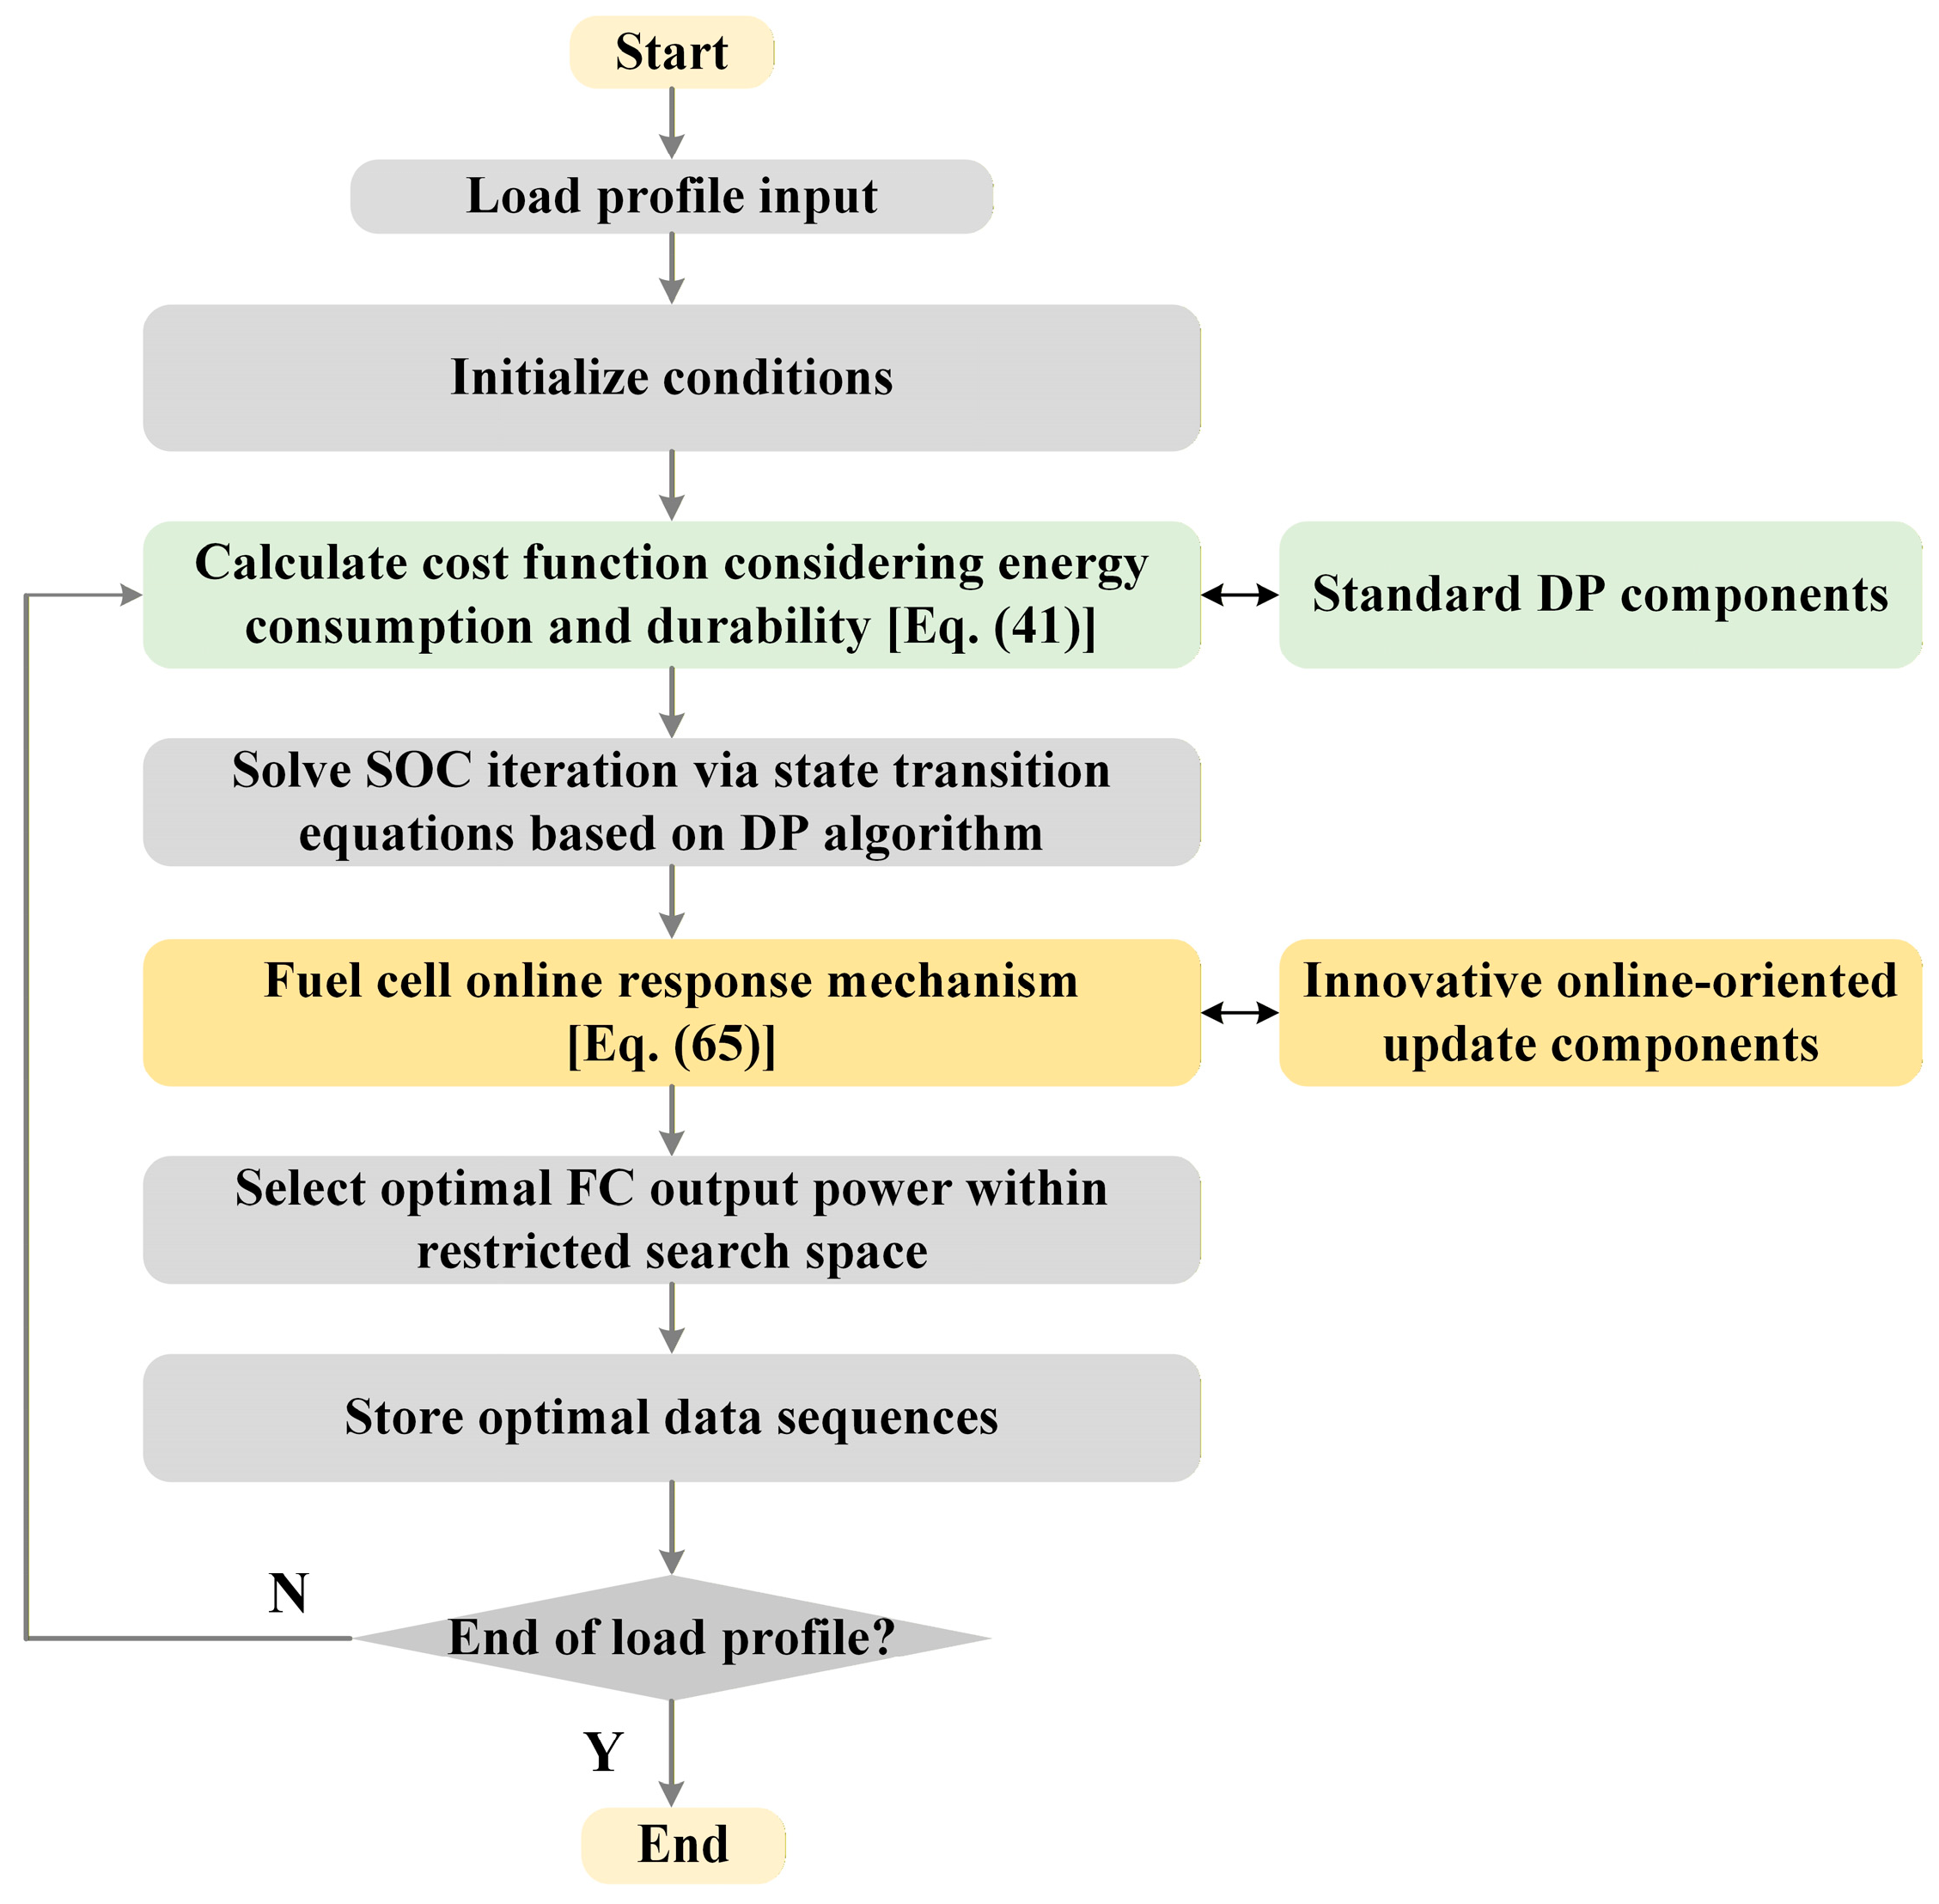
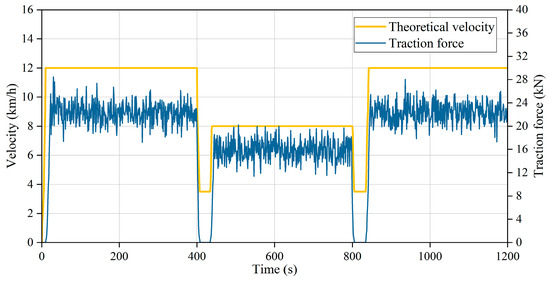
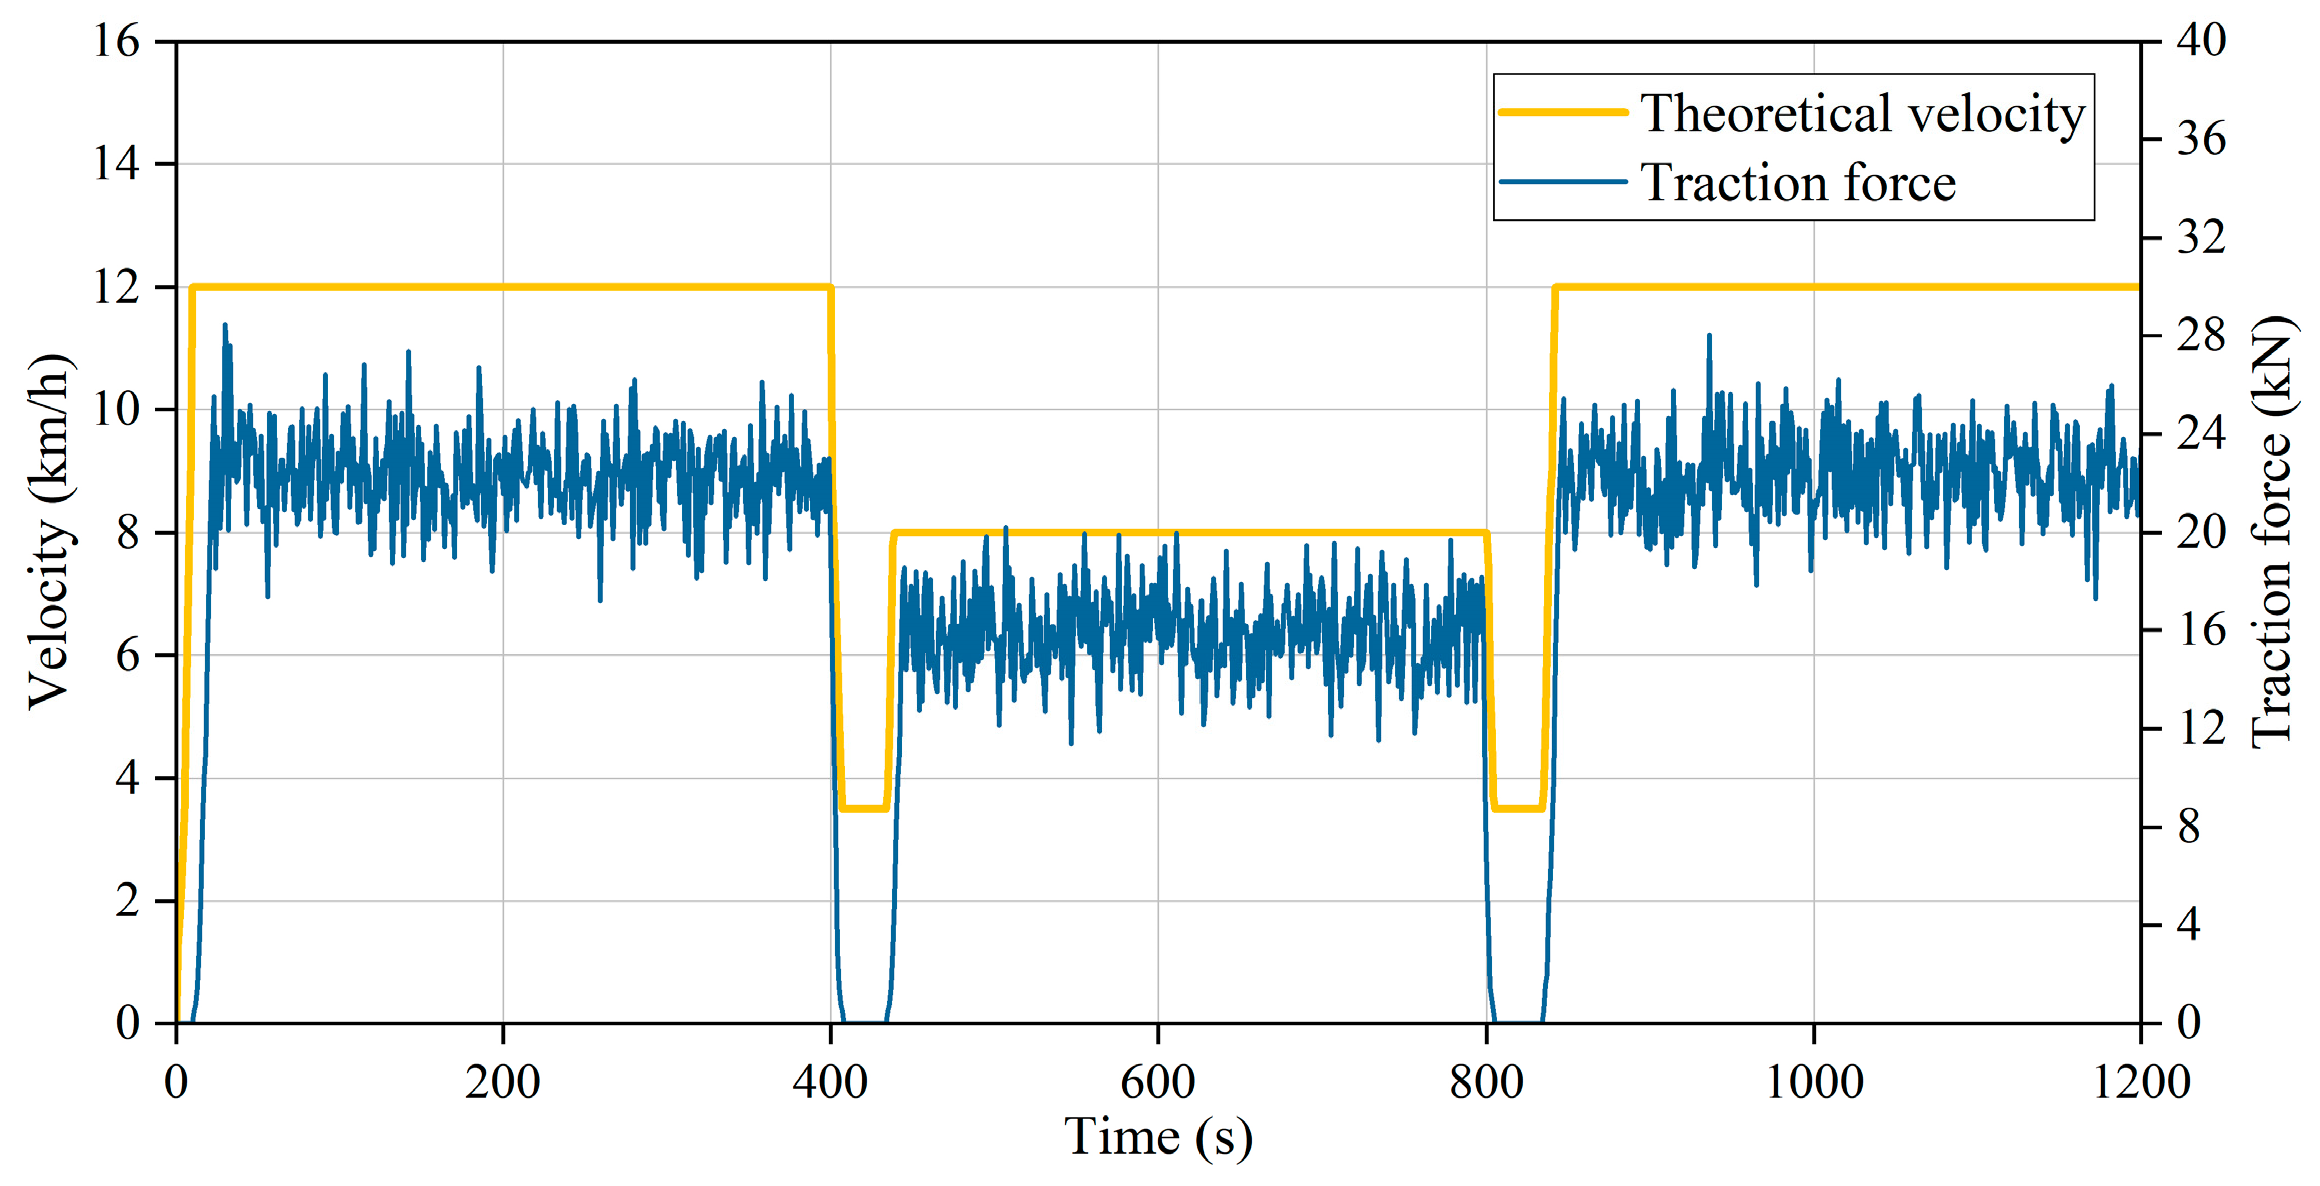
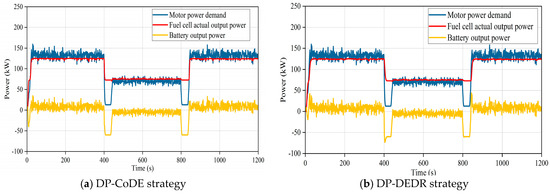
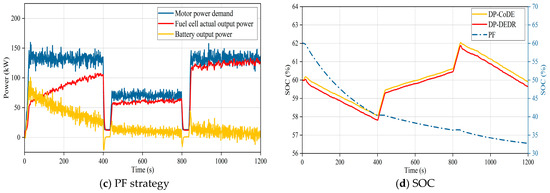
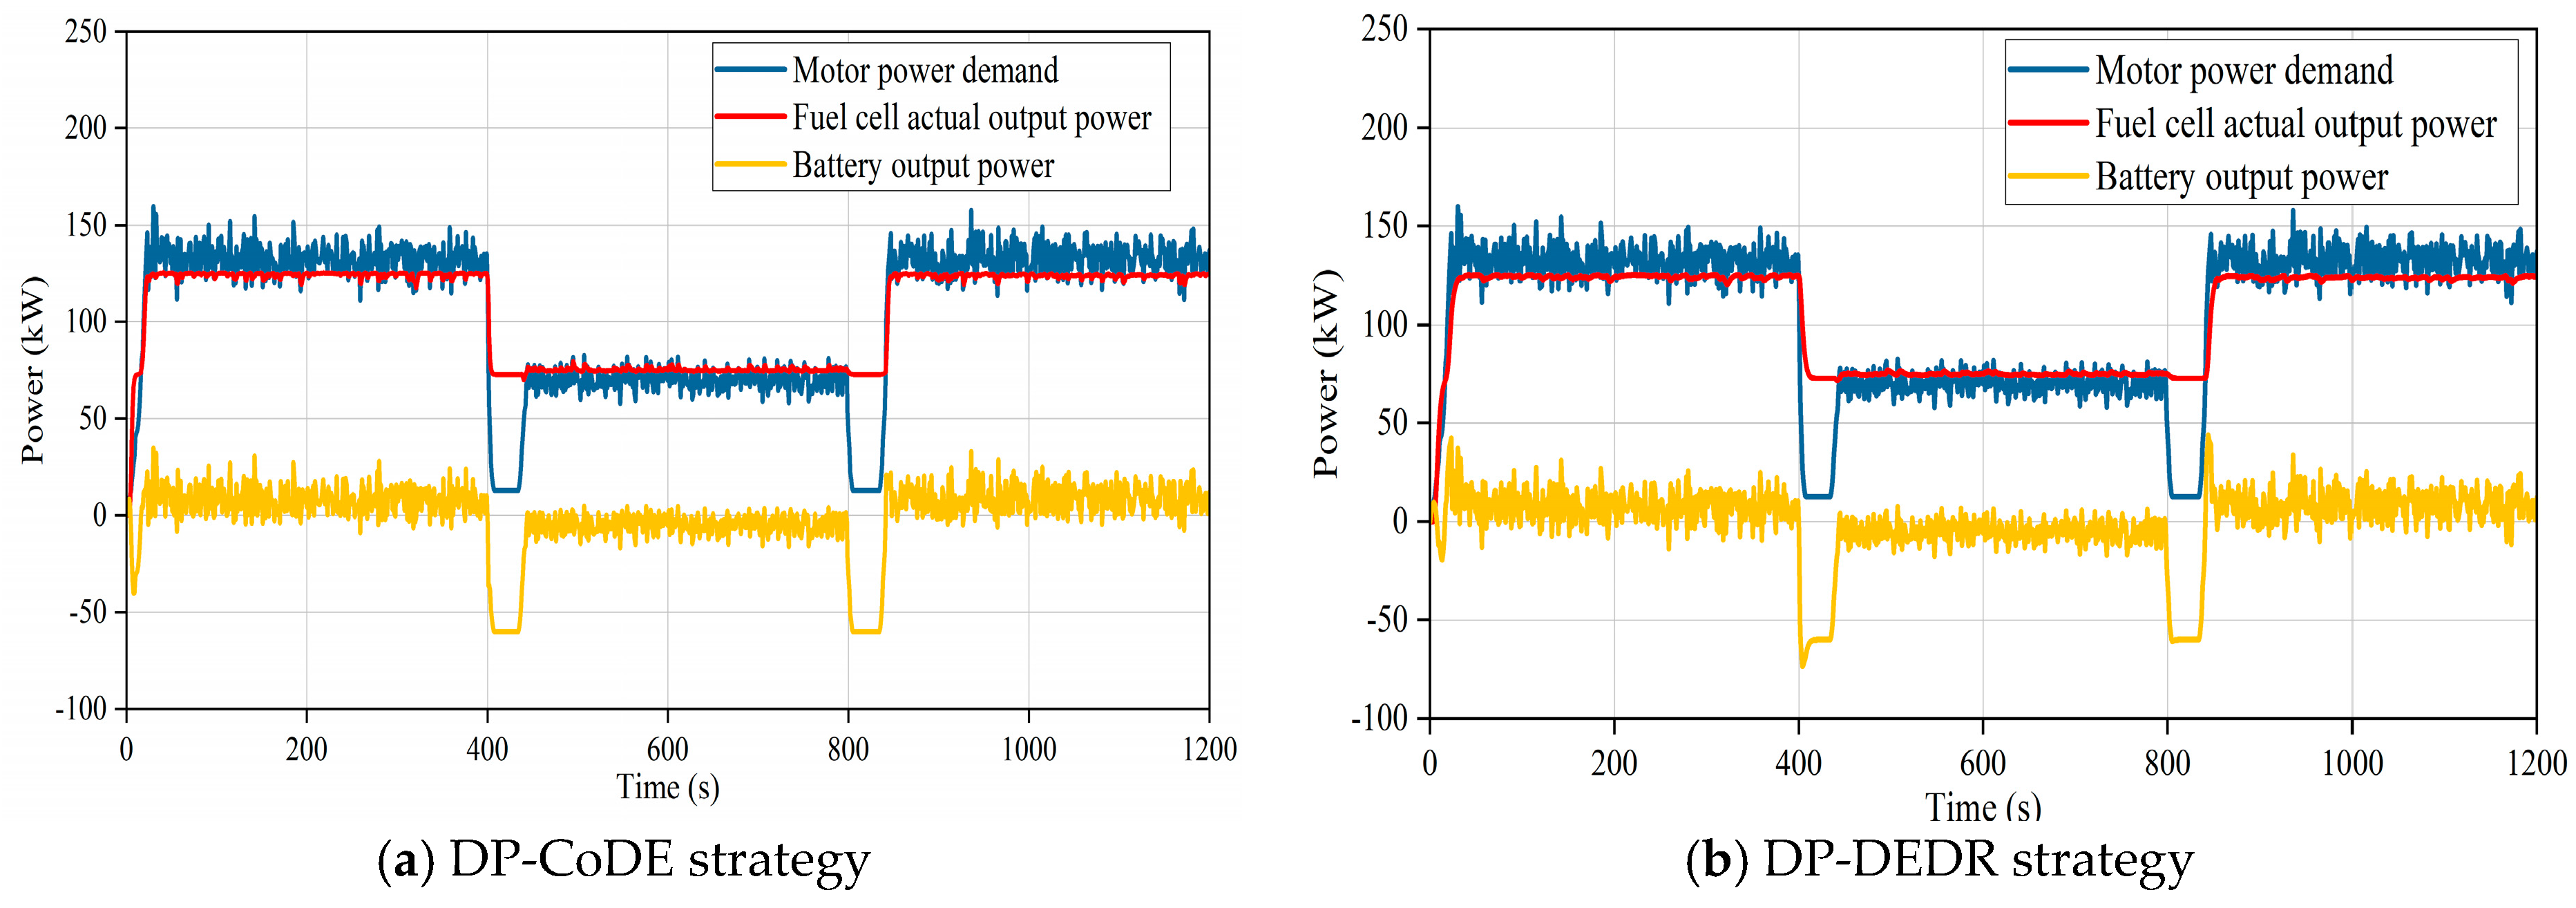
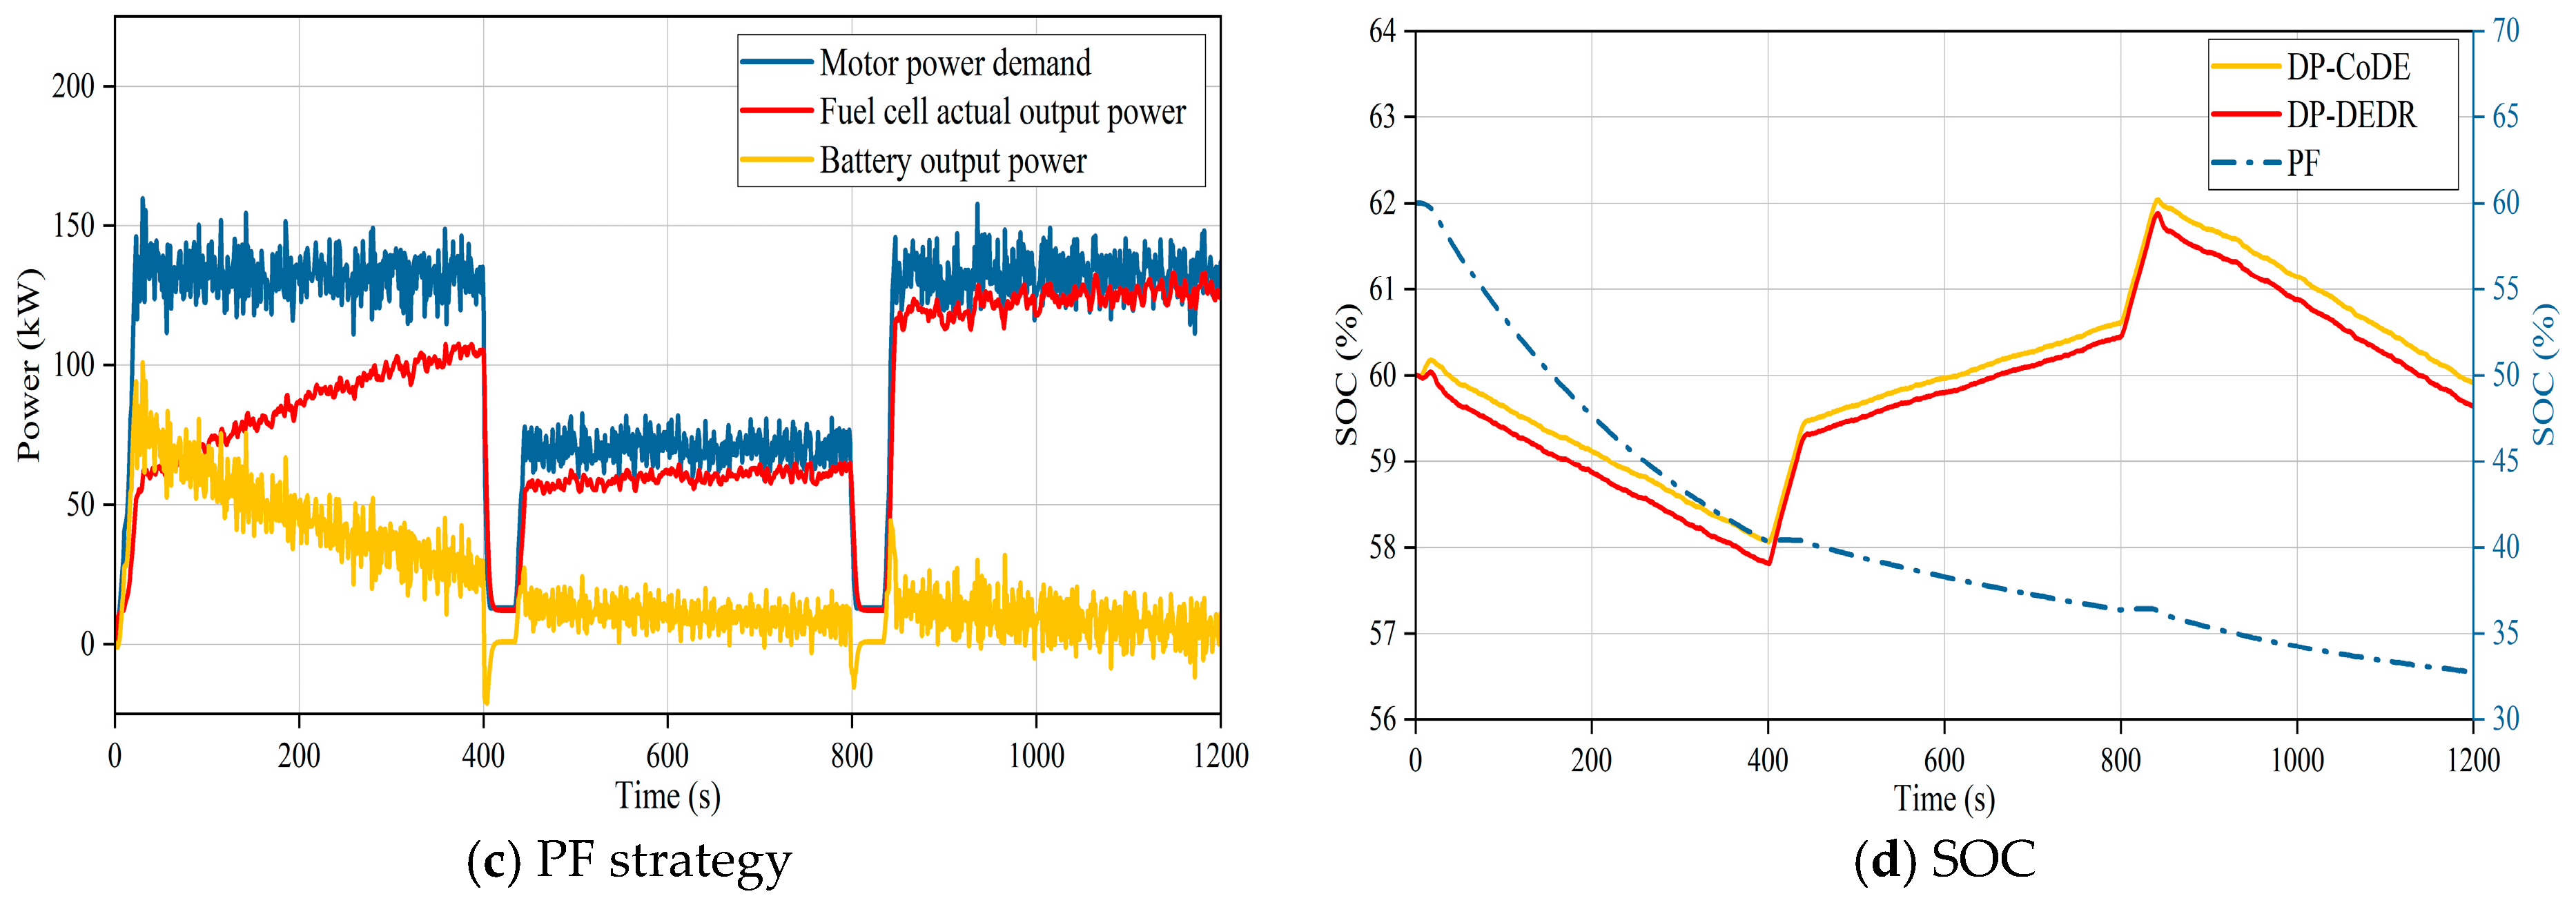
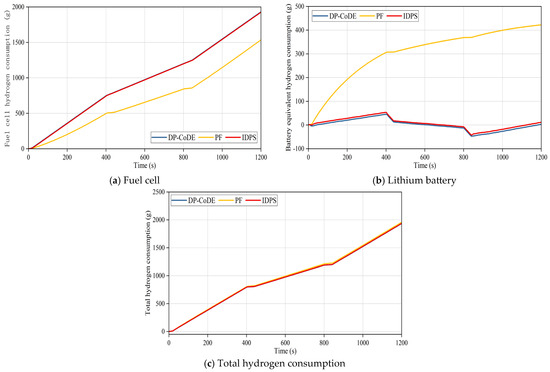
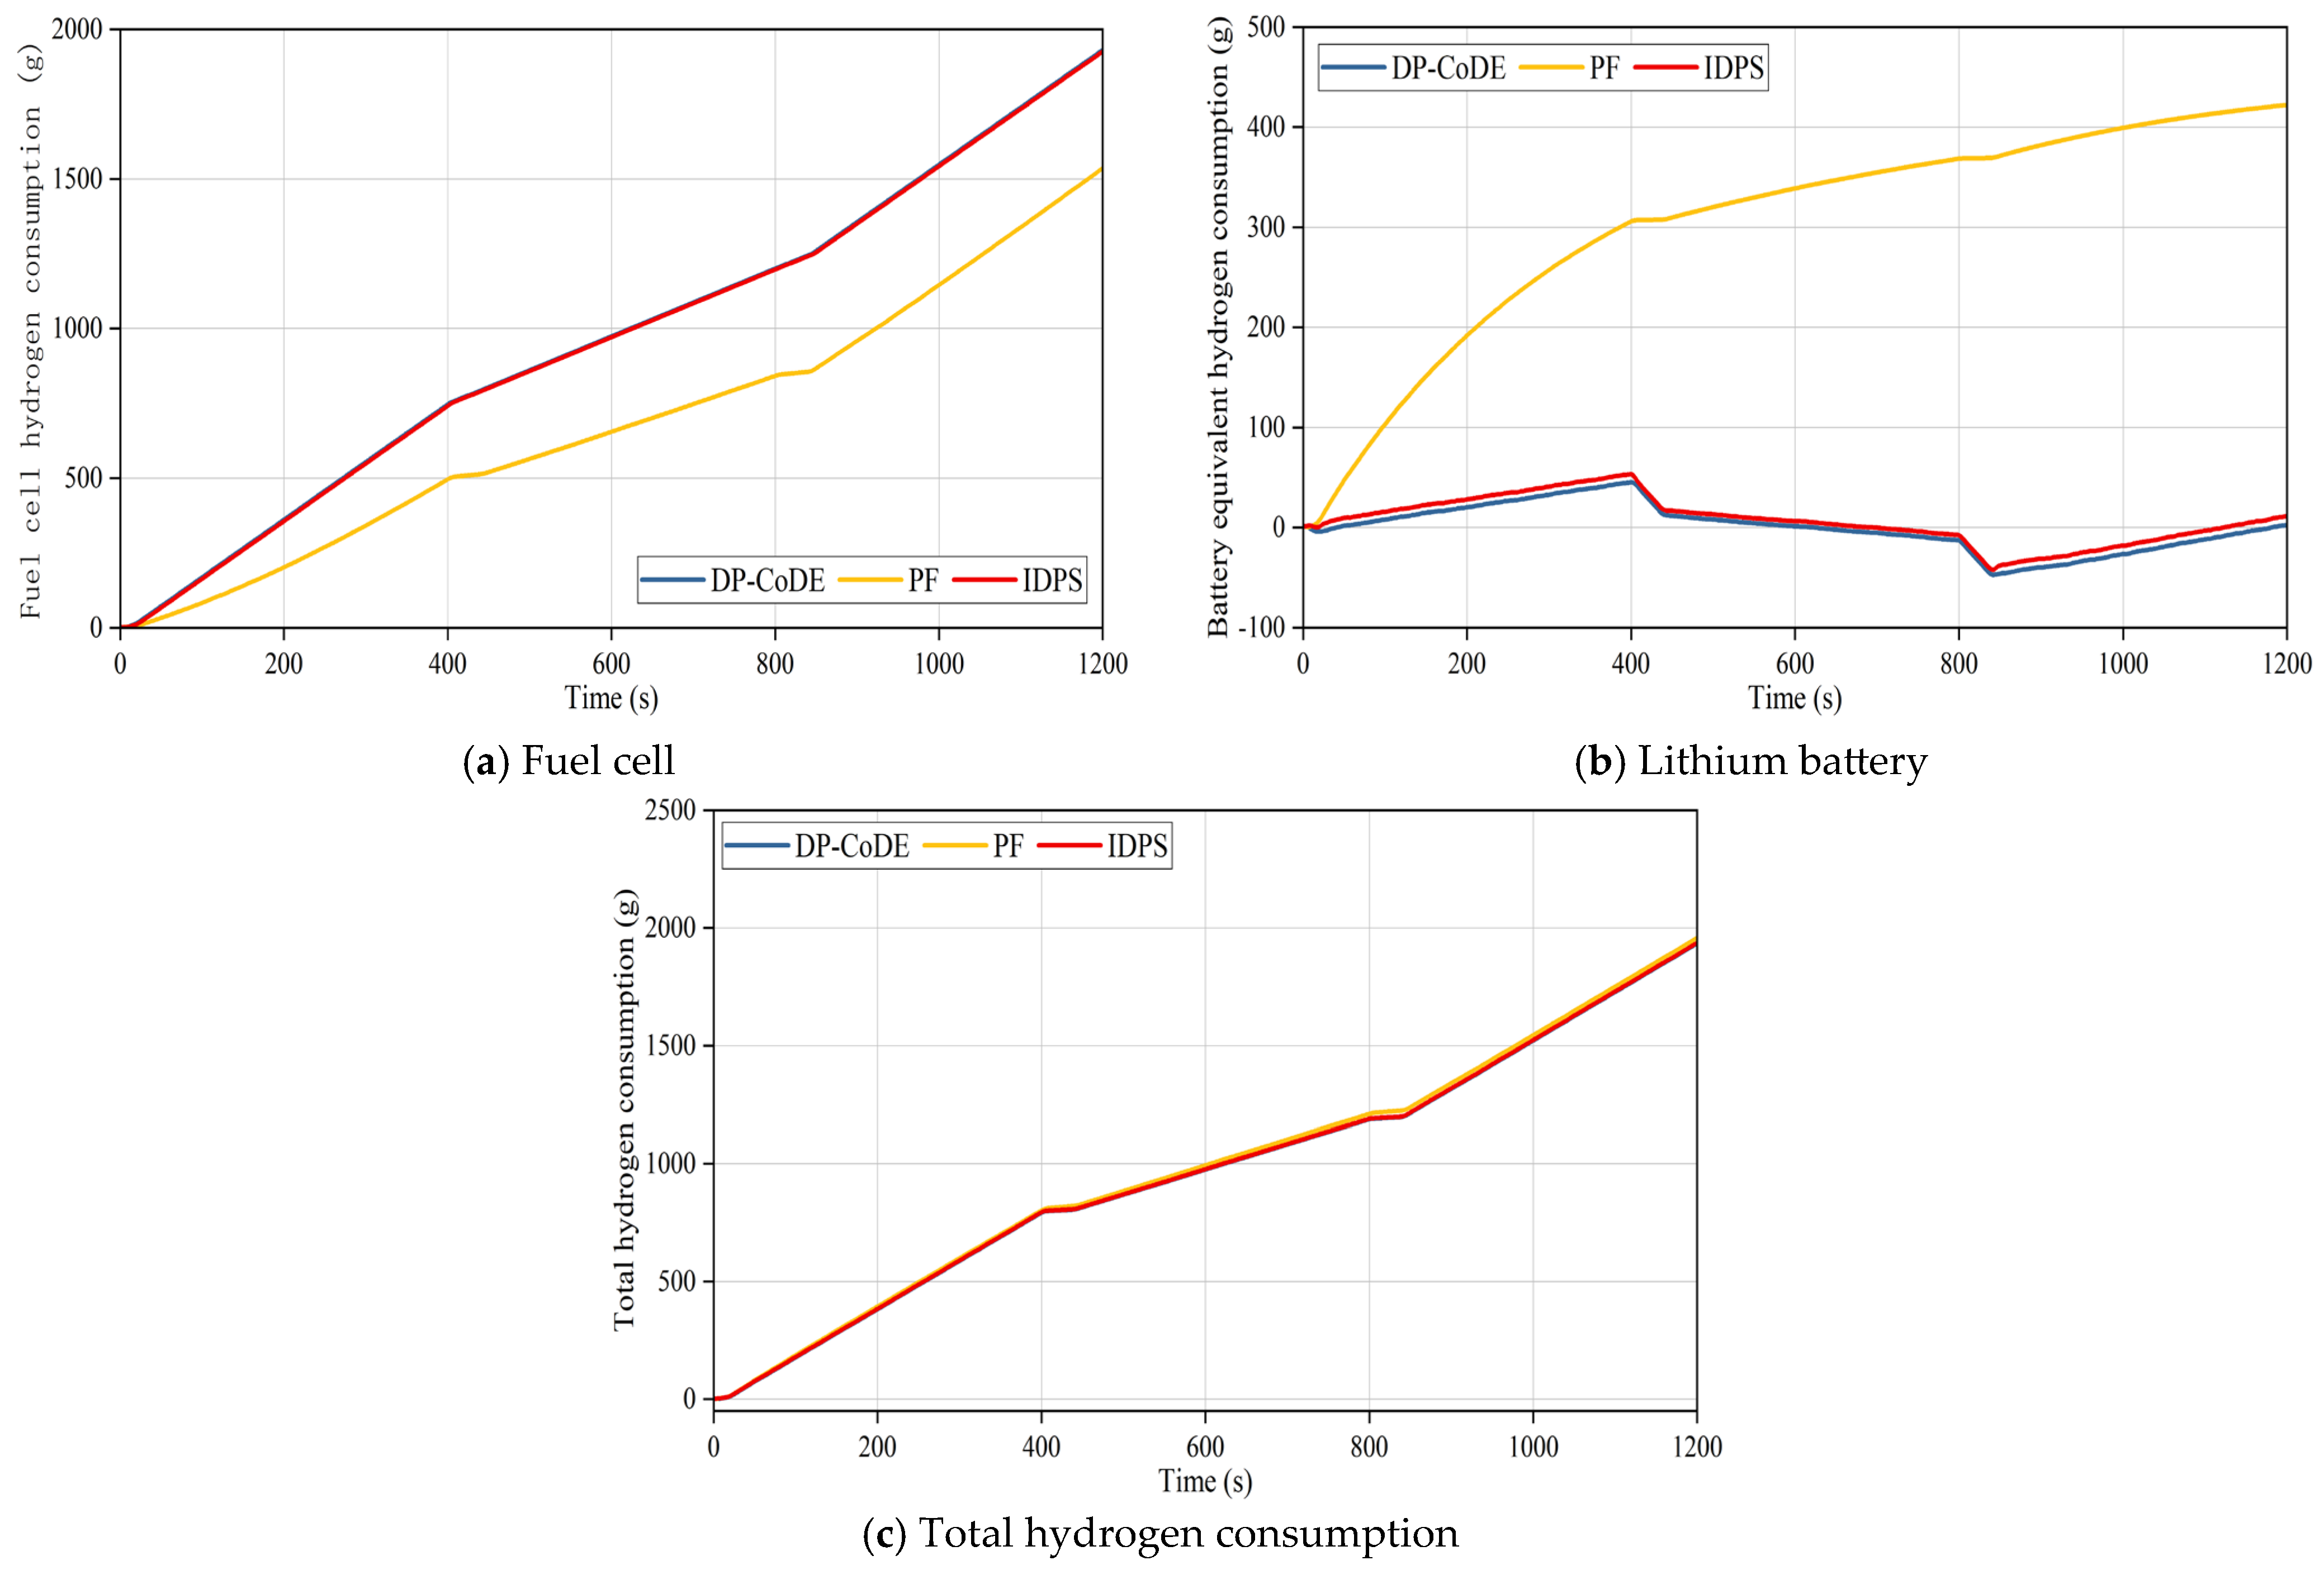
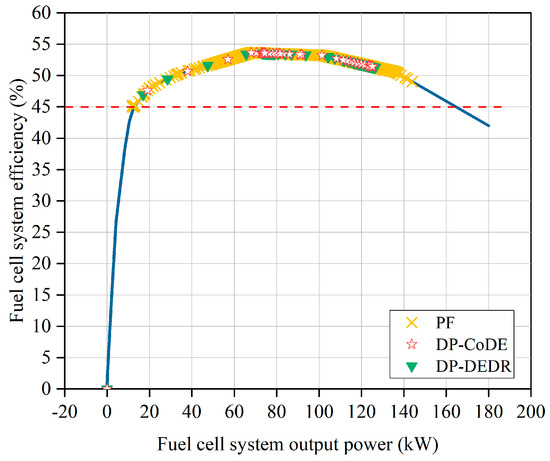
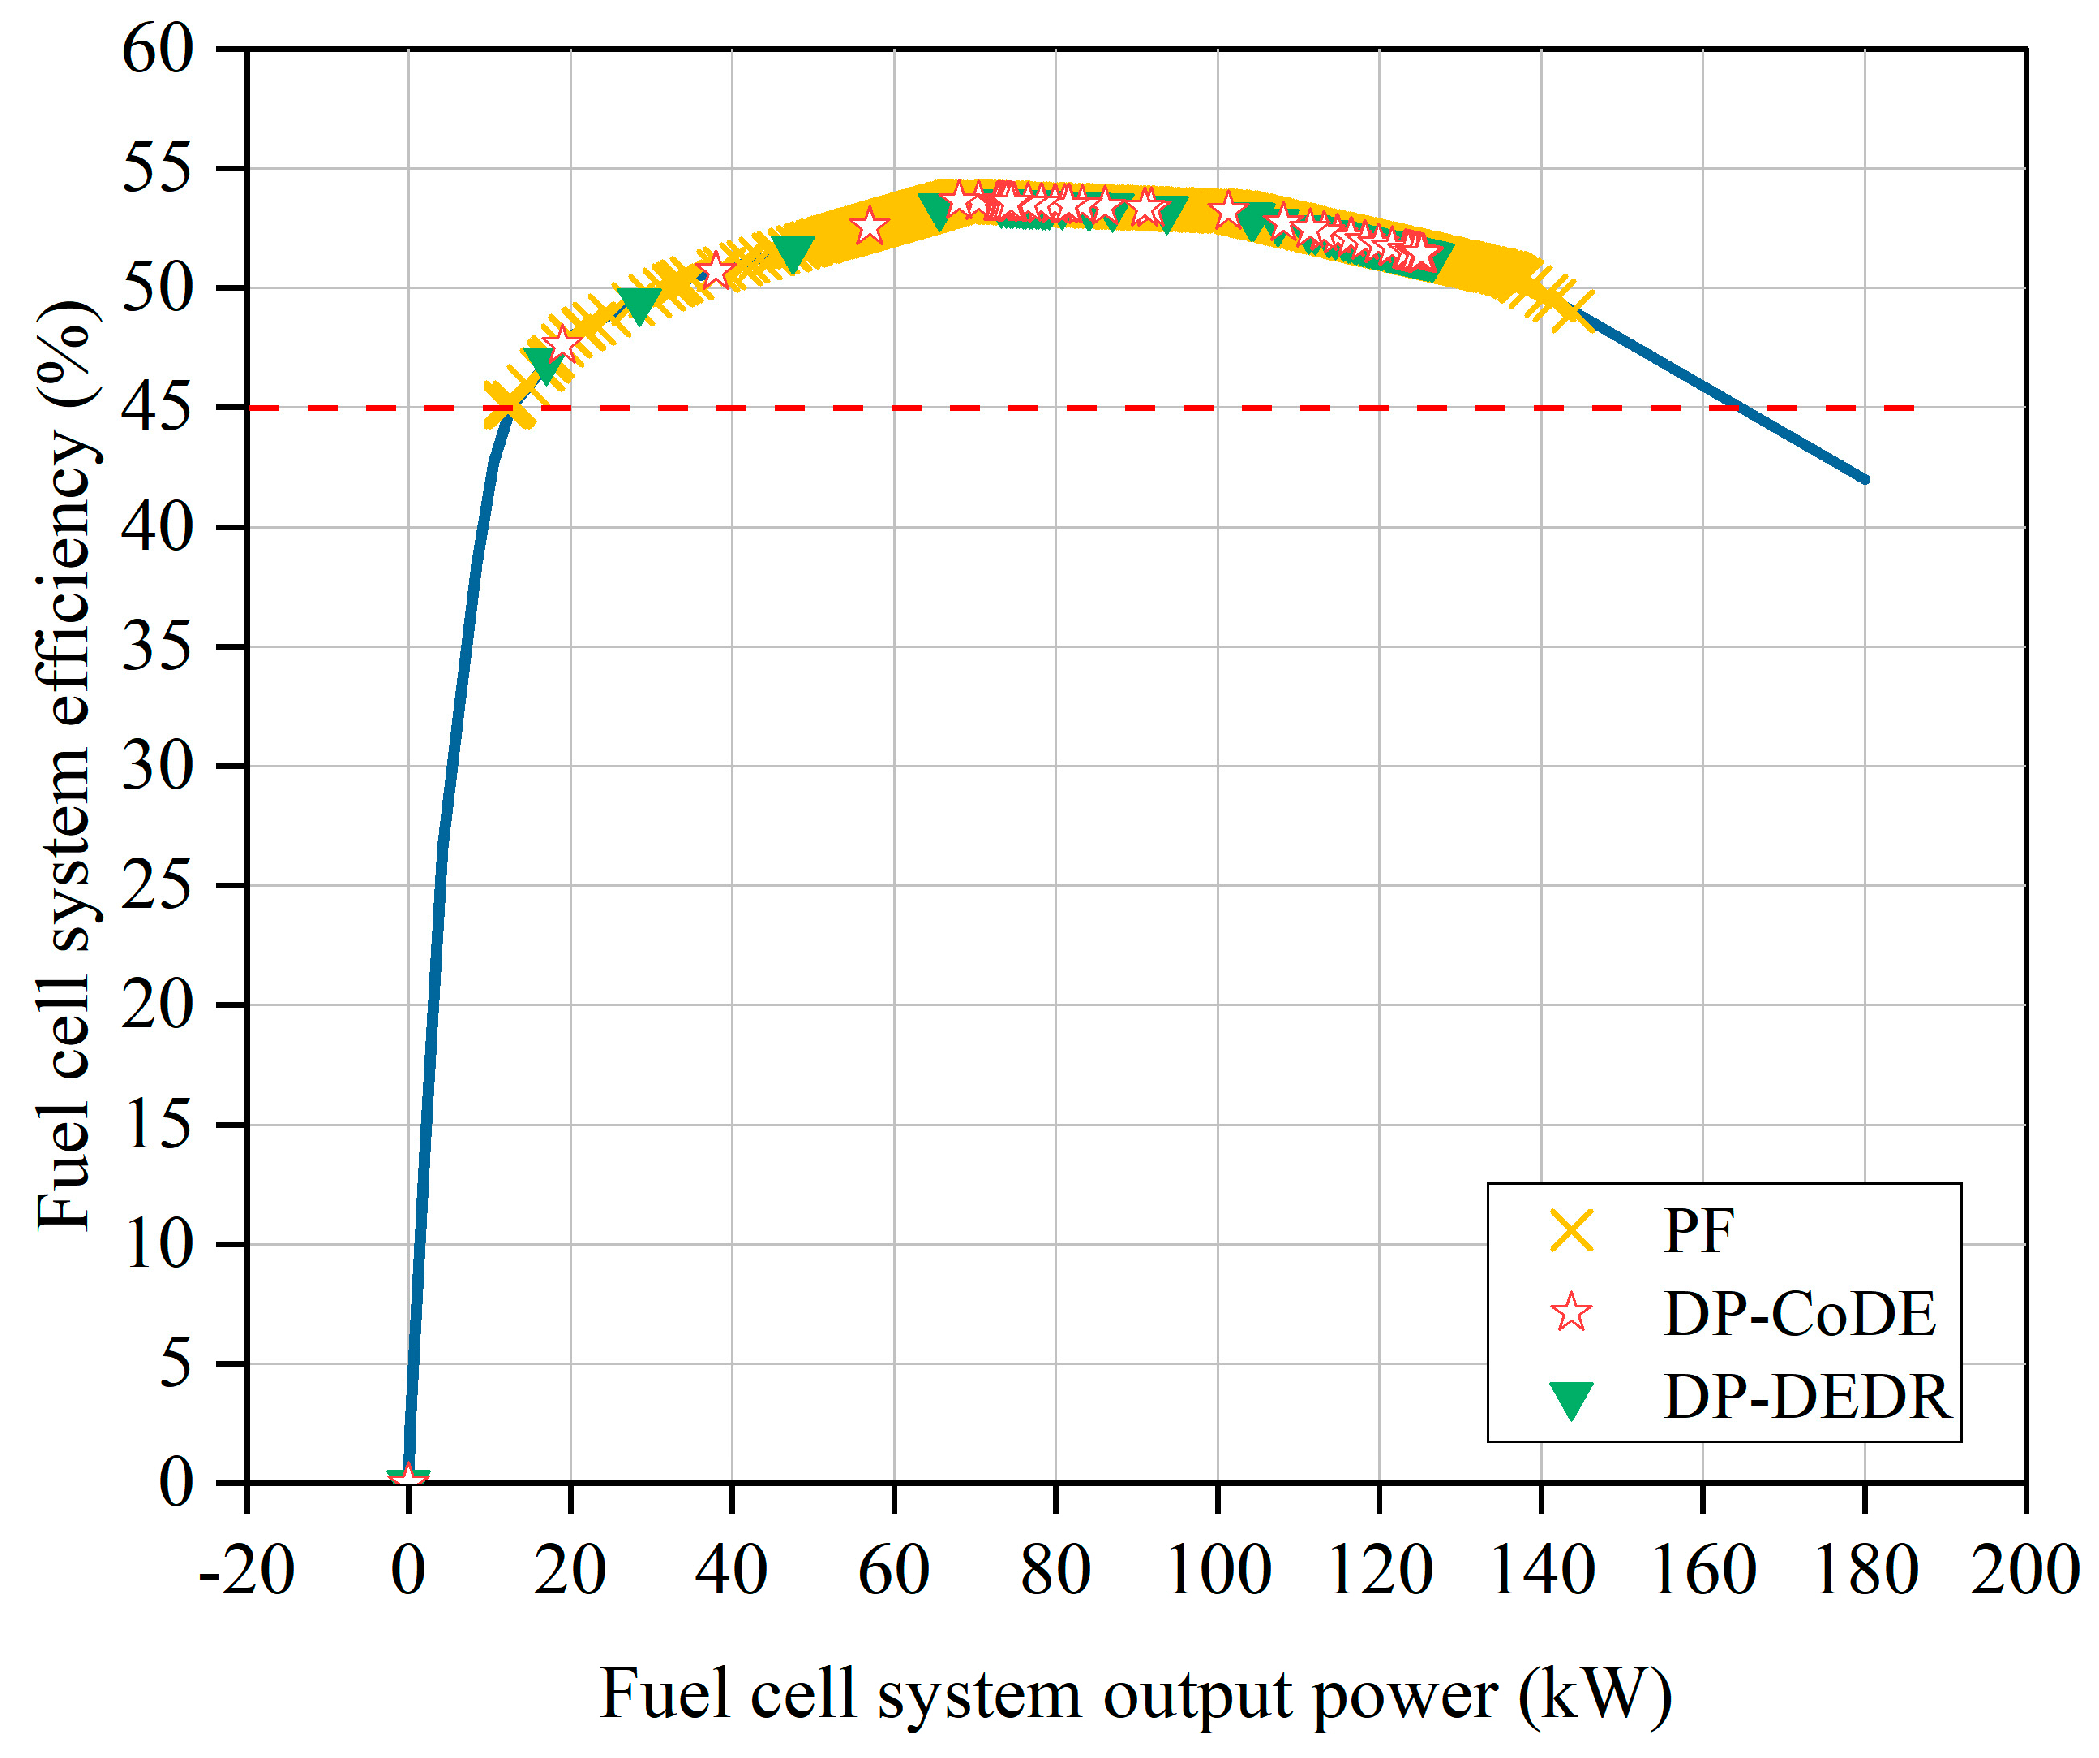
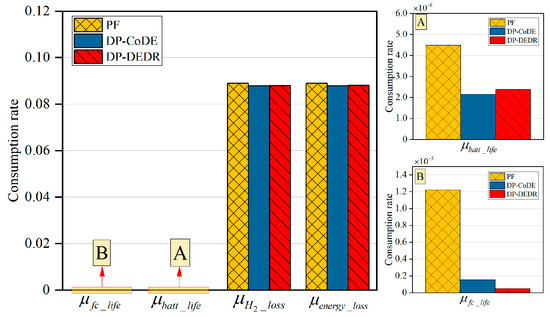
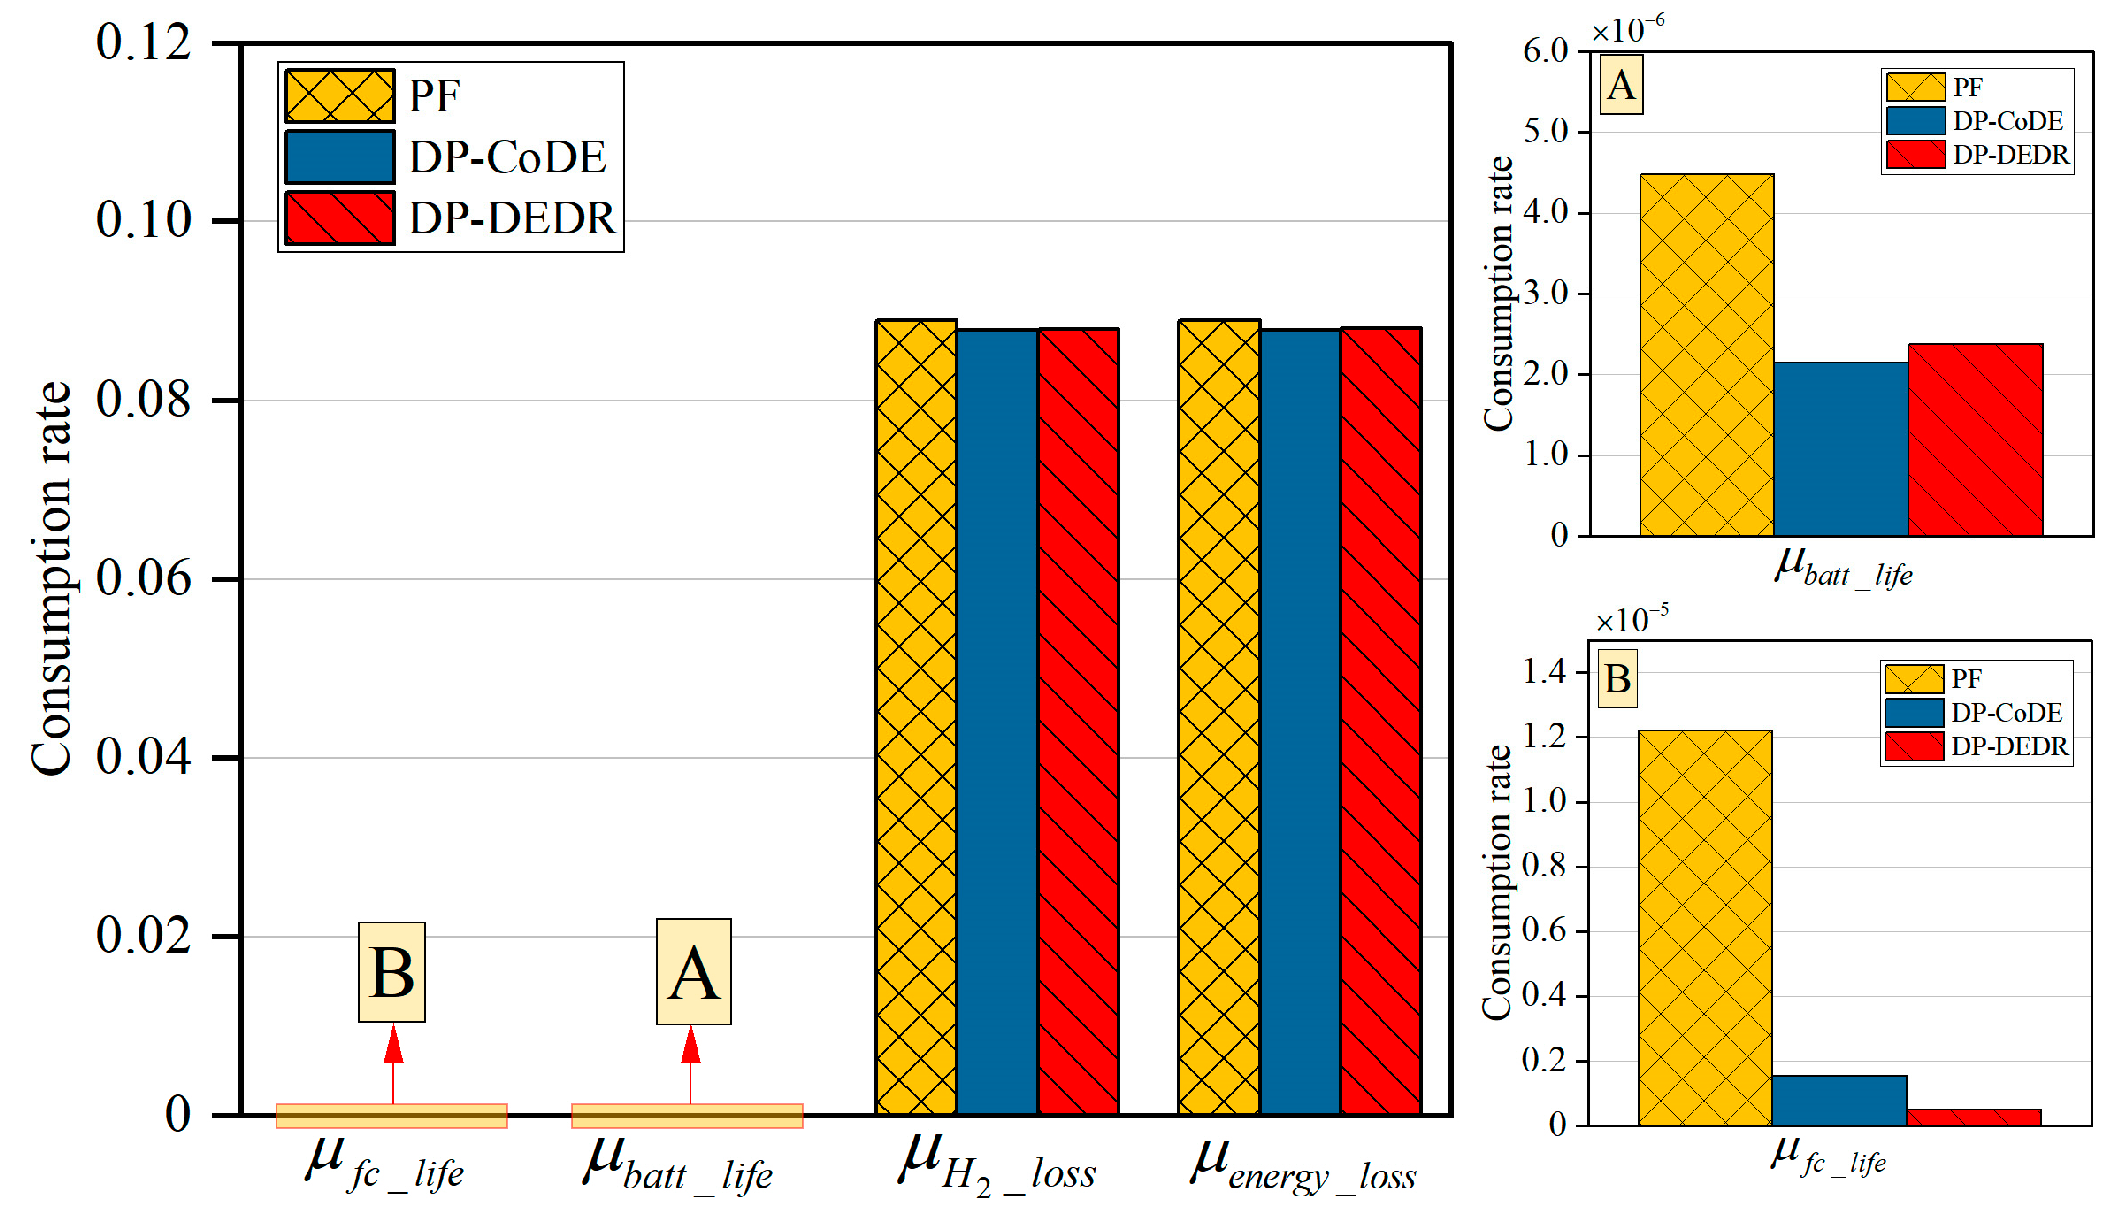
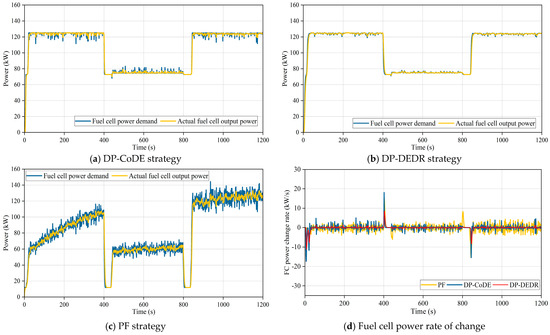
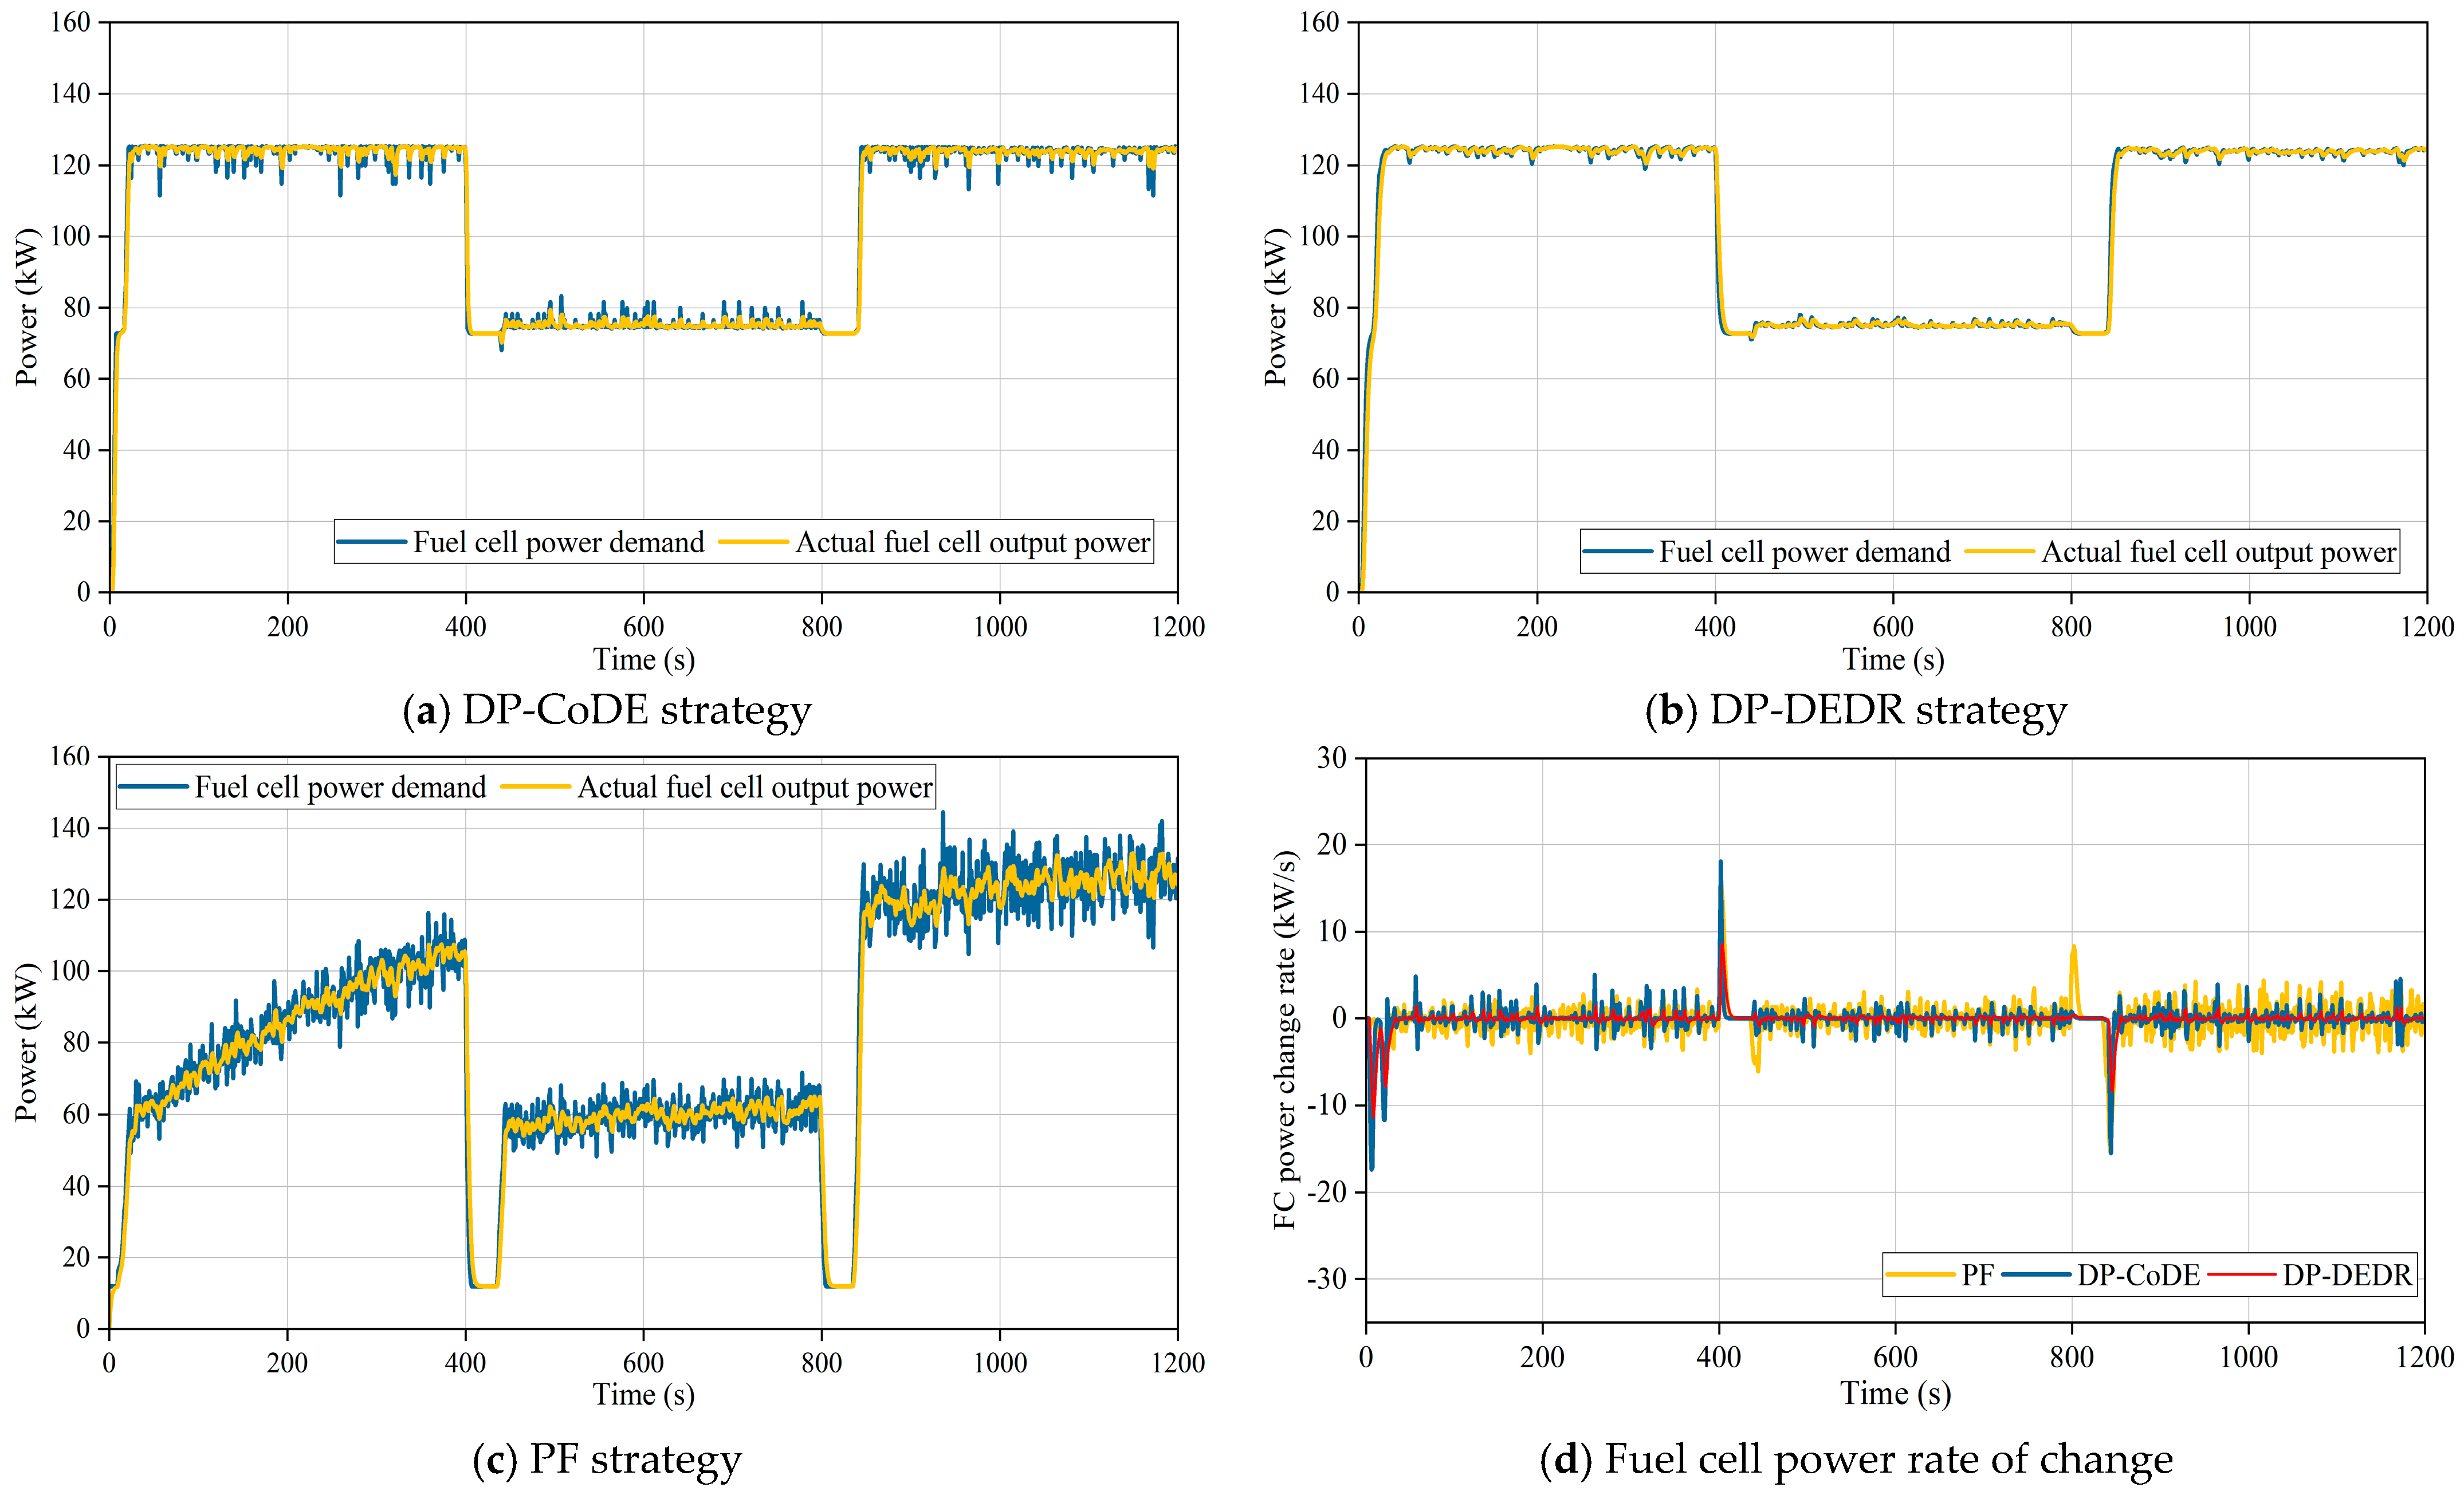

Disclaimer/Publisher’s Note: The statements, opinions and data contained in all publications are solely those of the individual author(s) and contributor(s) and not of MDPI and/or the editor(s). MDPI and/or the editor(s) disclaim responsibility for any injury to people or property resulting from any ideas, methods, instructions or products referred to in the content. |
© 2026 by the authors. Published by MDPI on behalf of the World Electric Vehicle Association. Licensee MDPI, Basel, Switzerland. This article is an open access article distributed under the terms and conditions of the Creative Commons Attribution (CC BY) license.