


Abstract
Terahertz metamaterial sensors offer potential for non-contact monitoring of electric vehicle battery-related films. This study proposes a dual-frequency self-referenced terahertz metamaterial sensor based on a metal–dielectric–metal structure comprising a split-ring resonator, an I-shaped resonator, a TOPAS dielectric layer, and a continuous metal reflector. Without a loaded film, the sensor exhibits near-perfect absorption peaks at 0.8354 and 1.3250 THz, with absorptivities of 99.95% and 99.99%, respectively. Field and current analyses identify the low-frequency I-shaped-resonator mode as the reference channel and the high-frequency split-ring-resonator mode as the sensing channel. A film thickness of 4 μm was selected from the thickness-response analysis for refractive-index sensing. For equivalent refractive indices of 1.30–1.60, the low- and high-frequency peak sensitivities are 96.43 and 272.57 GHz/RIU, respectively. The dual-peak frequency interval results in a fitted sensitivity of 176.14 GHz/RIU and provides enhanced stability against common-mode perturbations rather than higher raw refractive-index sensitivity. Under ±3% and ±5% TOPAS-permittivity perturbations, the interval drift (1.8–25.2 GHz) is lower than the high-frequency peak drift (12.6–39.6 GHz), producing suppression ratios of 36.36–85.71%. The proposed numerical design provides a potential self-referenced sensing approach for equivalent dielectric perturbations in electric vehicle battery-related films.
1. Introduction
The rapid growth of the electric vehicle (EV) industry highlights the need for safe, reliable, and durable lithium-ion power batteries. During service, batteries face temperature changes, vibration, overcharge/discharge, moisture, and aging, which may cause electrolyte leakage, insulation degradation, side-product accumulation, and thermal runaway. Battery advancement, thus, depends on both chemistry/design and safety monitoring/state estimation [1]. Non-contact, robust material state detection is, therefore, desirable for early warning. Conventional battery management systems (BMS) monitor voltage, current, and temperature for overall status and fault [2] but have limited ability to detect local non-electrical changes, such as film contamination, electrolyte residues, moisture, and coating degradation. Sensor faults may also compromise reliability [3]. Hence, new sensing methods for local material variations are needed. Thin-film sensors have shown promise, e.g., embedded pressure sensors for in-situ battery monitoring [4]. Thermal runaway studies confirm the progressive, multi-factor nature of battery failures, emphasizing early detection [5]. However, contact sensors face integration and stability challenges, whereas non-contact spectroscopic methods can probe dielectric states without intrusion.
Terahertz (THz) radiation is non-ionizing and dielectric-sensitive, suitable for polymer and film inspection. THz spectroscopy has been used to analyze electrode materials [6] Yet battery films are typically micrometer-thick, interacting weakly with free-space THz waves, so field-enhancing structures are needed to improve sensitivity. THz metamaterials generate strong localized fields at resonant structures, converting subtle dielectric changes into measurable frequency shifts. However, sensing response is limited by near-field penetration depth [7], and field distributions affect sensitivity and FOM [8] Thus, film–near-field coupling must be analyzed before refractive index sensing. The metal–insulator–metal (MIM) absorbing structure suppresses transmission and achieves near-perfect absorption via impedance matching [9,10]. Metamaterials have also been explored for EV wireless power transfer [11], but this work instead targets THz sensing of battery film dielectric perturbations. Despite extensive studies, several issues remain for EV battery film monitoring: (i) working thickness is often chosen arbitrarily without considering near-field penetration; (ii) single-peak readout is sensitive to environmental and fabrication disturbances; (iii) few designs offer a “reference vs. sensing” relative readout for this specific scenario. Microwave-band metamaterial sensors have been extensively investigated for permittivity and refractive-index sensing applications. Typical examples include a quad-band polarization-insensitive square split-ring resonator metamaterial absorber working at Ku- and K-bands for solid-state and liquid-hydrocarbon dielectric sensing [11], as well as other microwave metamaterial sensing architectures for material dielectric property characterization [12]. Nevertheless, microwave metamaterial sensors suffer intrinsic drawbacks when targeting micrometer-thin-film analytes. Their relatively long wavelength generates deeply penetrating evanescent near-fields, resulting in weak electromagnetic field overlap with micrometer-scale target films. Hence, only small resonance frequency shifts can be obtained under subtle dielectric perturbations of thin films. Moreover, the unit-cell size of microwave metamaterials is usually on the millimeter scale, which prevents compact on-chip integration. Terahertz-band metamaterials offer a feasible solution to overcome the above restrictions. Benefiting from shorter wavelengths, terahertz resonators can produce strongly confined localized near-fields, improve field overlap with micrometer-thick dielectric films, and yield larger measurable spectral shifts under identical dielectric perturbations. Such capability is highly desired for monitoring battery-related thin polymer films. Despite numerous reported terahertz metamaterial sensors, few designs implement built-in differential self-referenced readout to suppress common-mode environmental drift for battery-relevant thin-film detection scenarios. Self-referenced schemes have been proposed to mitigate common-mode perturbations [13,14].
To address these, this paper proposes a dual-frequency self-referenced THz metamaterial sensor for EV battery film monitoring. Unlike single-peak sensors, it uses two spatially distinct localized modes as reference and sensing channels and reads out via the dual-peak frequency interval for improved stability. The design combines an I-shaped resonator and a split-ring resonator in an MIM structure. Through impedance matching, substructure comparison, and field/current analysis, the low-frequency reference mode and high-frequency sensing mode are identified. Film-thickness response analysis determines the working thickness for effective near-field coupling, followed by refractive index sensing at that thickness. Finally, a relative self-referenced parameter is defined using the dual-peak interval, and TOPAS dielectric perturbation simulations verify its suppression of common-mode drift. This study offers a conceptual design for THz metamaterial sensing of equivalent dielectric state changes in EV battery-related films.
2. Sensor Structure and Simulation Method
2.1. Unit Cell Design
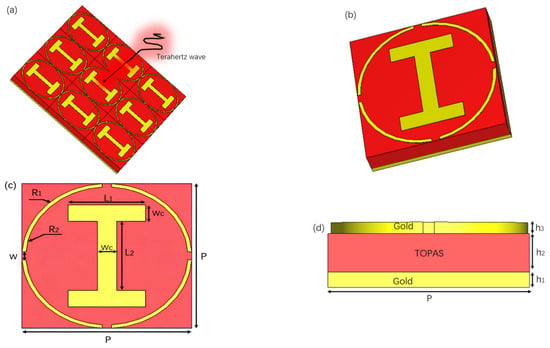
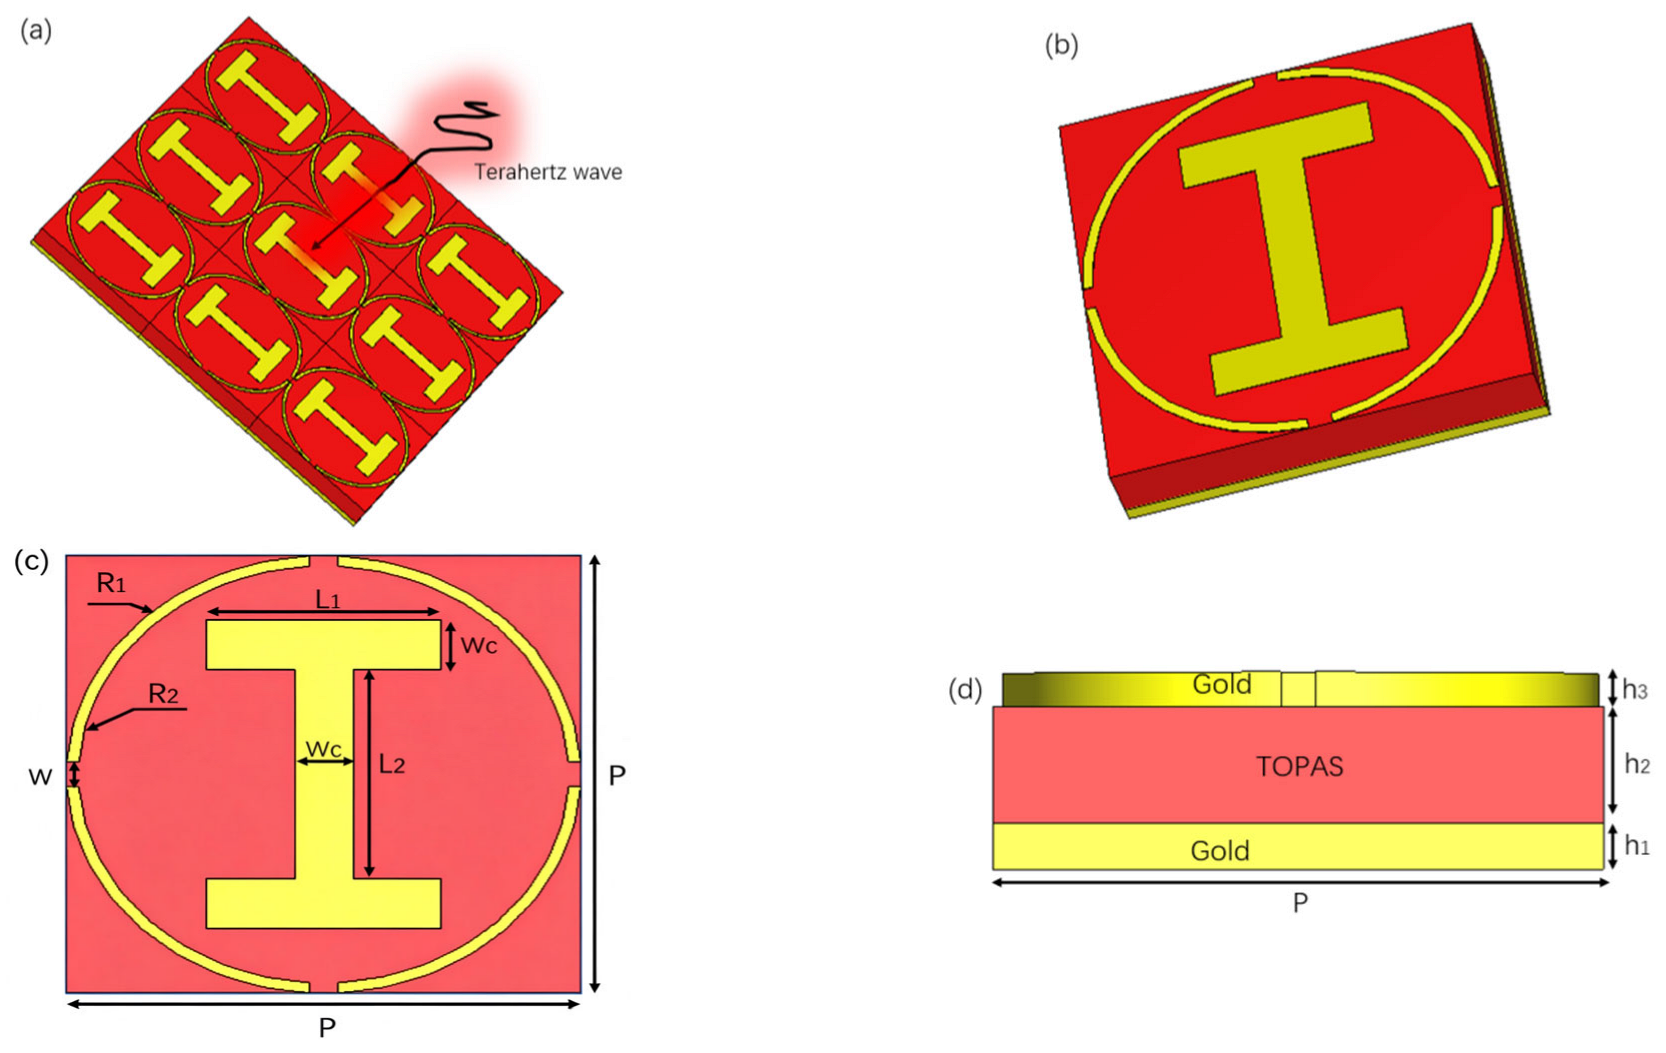
The proposed dual-frequency terahertz metamaterial sensor adopts a metal–insulator–metal (MIM) configuration. The periodic unit cell consists of a top-patterned metallic resonator, a cyclic olefin copolymer (TOPAS) dielectric layer, and a bottom continuous metallic reflector. The top metal pattern is composed of an outer split-ring resonator and a central I-shaped resonator. These two types of resonant elements are designed to excite localized modes in different frequency bands. Figure 1a presents a schematic of the sensor periodic array with terahertz wave incidence, Figure 1b shows a three-dimensional view of a single unit cell, and Figure 1c,d provide the top-view dimensions and layered cross-sectional structure, respectively. The periodicity is denoted by P, the ring dimensions are characterized by R1 and R2, and the split gap width is W. For the I-shaped resonator, the transverse length, longitudinal length, and metal linewidth are L1, L2, and Wc, respectively. In the vertical direction, the thicknesses of the bottom metal layer, TOPAS dielectric layer, and top metal layer are h1, h2, and h3, respectively. The bottom continuous metal layer suppresses transmission, ensuring that S21 is strongly attenuated within the operating band and thereby forming a reflective sensing configuration.
Figure 1.
Schematic diagrams of the sensor structure: (a) periodic array with terahertz wave incidence; (b) three-dimensional view of a single unit cell; (c) top view of the unit cell; (d) cross-sectional side view of the unit cell.
The main geometric parameters of the sensor unit cell after optimization are listed in Table 1, including the period length, ring dimensions, I-shaped resonator dimensions, and layer thicknesses. All parameters are consistent with the structural definitions provided in Figure 1.
Table 1.
Geometric parameters of the sensor structure.
2.2. Material Parameters and Equivalent Model of Battery-Related Films
The top-patterned resonator and bottom continuous reflector are both modeled as gold with a frequency-independent conductivity σ = 4.56 × 10⁷ S/m over the simulated 0.2–2.0 THz range. This value is the effective gold conductivity listed in the CST material library and used in terahertz metamaterial absorber simulations by Duan et al. [15,16]. It is, therefore, a numerical material parameter rather than a measurement of the fabricated metal film. The dielectric spacer layer is TOPAS, a cyclic olefin copolymer characterized by low absorption, low dispersion, and a stable terahertz (THz) refractive index, making it a widely adopted material for low-loss THz devices [17,18]. Its relative permittivity is εr = 2.35 and loss tangent tan δ = 0.0007. In this proof-of-concept model, both parameters are treated as frequency independent over 0.2–2.0 THz; material dispersion and fabrication-dependent variation are not included. The use of TOPAS effectively minimizes substrate-induced broadening of resonance peak width and Q-factor degradation, ensuring that observed frequency shifts predominantly originate from local dielectric changes induced by the film under test.
To systematically evaluate the sensor’s response to dielectric environmental variations, the film under test is modeled as a uniform equivalent dielectric layer covering the top surface of the patterned resonator. This conceptual representation corresponds to micrometer-scale dielectric perturbations that may occur in electric vehicle battery systems, such as surface state changes in porous separators, polymer coating residues, moisture contamination layers, electrolyte residual films, or insulated surface contaminants. Rather than being restricted to a specific battery material, this equivalent film model is adopted to assess the sensor’s sensitivity to generic dielectric changes in the vicinity of the resonant structure.
Lithium-ion battery separators are typically made of porous polyethylene (PE) or polypropylene (PP), whose pores may be filled with air, electrolyte, or contamination residues [19]. Previous THz spectroscopic studies have demonstrated that low-loss polymers generally exhibit stable refractive indices and low absorption losses in the THz band. For instance, Cunningham et al. reported the refractive indices and absorption characteristics of various polymers and organic materials [20]; Nielsen et al. showed that TOPAS features low loss and stable refractive index, making it suitable for THz devices [21]; and D’Angelo et al. further measured the dielectric responses of low-density polyethylene (LDPE), TOPAS, polyamide 6 (PA6), and polytetrafluoroethylene (PTFE) over a broadband THz range [18]. In addition, poly(vinylidene fluoride) (PVDF)-type polymers are commonly used in battery electrode binders or coating systems, with Kalel and Wang reporting average refractive indices of poly(vinylidene fluoride-co-trifluoroethylene) (PVDF-TrFE) and poly(vinylidene fluoride-co-trifluoroethylene-co-chlorotrifluoroethylene) (PVDF-TrFE-CTFE) films in the THz regime approximately in the range of 1.45–1.50 [21].
Accordingly, the refractive index of the equivalent film under test is parametrically varied as n = 1.30, 1.35, 1.40, 1.45, 1.50, 1.55 and 1.60. This range covers equivalent dielectric variation intervals that may arise from porous separators, low-loss polymer coatings, weakly contaminated films, and higher-permittivity residual layers. It is important to emphasize that this range does not represent the fixed measured refractive index of any specific electrolyte, separator, or coating material. Rather, it is constructed as an equivalent dielectric perturbation model for battery-related films, grounded in typical THz-range parameters of polyolefin separators, porous polymer films, and PVDF-type polymers, with the aim of parametrically evaluating the sensor’s responsiveness to dielectric environmental changes.
For the thickness-response analysis, the film refractive index is fixed at n = 1.32 as a representative low-index equivalent dielectric condition near the lower end of the later index range; this value is used only to isolate the thickness dependence. The thickness is set to t = 0, 2, 4, 6, 8, 10 and 12 μm. The subsequent refractive-index sweep independently uses n = 1.30–1.60 at the selected thickness, so n = 1.32 in the thickness sweep is not intended to replace or redefine the lower endpoint n = 1.30.
2.3. Simulation Setup and Performance Evaluation Metrics
Numerical simulations were performed using CST Studio Suite 2022. To model an infinite periodic array, unit cell boundary conditions were applied in the x and y directions. The terahertz wave is normally incident along the z direction, with the electric field polarized along the x direction and the magnetic field along the y direction. The bottom continuous metal reflector suppresses transmission, and open (add space) boundary conditions are applied in the z direction. Reflection parameters are extracted via waveguide ports over a frequency sweep range of 0.2–2.0 THz. The simulation results include S11, S21, absorptivity, normalized impedance, electric-field distributions, and surface current distributions.
Absorptivity is used to evaluate the proportion of incident terahertz energy dissipated by the structure. It is calculated from the reflection and transmission coefficients using Equation (1), where A(ω) is the absorptivity at frequency ω, and S11 and S21 denote the reflection and transmission coefficients, respectively.
A(ω) = 1 − |S11|2 − |S21|2
Because the bottom continuous metal layer strongly suppresses transmission, S21 ≈ 0 in the operating band and Equation (1) reduces to Equation (2).
A(ω) ≈ 1 − |S11|2
The normalized impedance is retrieved from the S-parameters to evaluate impedance matching between the sensor and free space at resonance. When the real part approaches unity and the imaginary part approaches zero, interface reflection is significantly reduced, facilitating near-perfect absorption.
The refractive-index sensitivity, S, characterizes the responsiveness of the resonance frequency to changes in the refractive index of the film under test. Under linear fitting conditions, its unit is GHz/RIU.
S = |Δfr|/Δn
The quality factor, Q, describes the sharpness of the resonance peak, where f0 is the resonance frequency, and FWHM is the full width at half maximum of the absorption peak. A smaller FWHM and larger Q value indicate a narrower resonance peak, which generally enables higher precision in peak-frequency extraction. In this work, both Q and FWHM are extracted from the absorption spectrum of the unloaded sensor.
Q = f0/FWHM
The figure of merit (FOM) comprehensively reflects the influence of sensitivity and linewidth, with unit RIU−1.
FOM = S/FWHM
To evaluate the dual-frequency relative readout capability, the dual-peak frequency interval is defined by Equation (6), where f1 and f2 are the low-frequency reference and high-frequency sensing peaks, respectively. The corresponding frequency-interval sensitivity between two refractive-index states, na and nβ, is defined by Equation (7). This explicit endpoint form avoids the ambiguity associated with a double-delta notation and quantifies the change in the interval readout.
Δf(n) = f2(n) − f1(n)
To quantitatively evaluate the self-referenced stability of the dual-peak frequency-interval readout, the drift-suppression ratio, η, is defined. Taking the unperturbed state of TOPAS with a relative permittivity of εr = 2.35 as the baseline, the drift of the high-frequency sensing peak and the drift of the dual-peak frequency interval are defined by Equations (8) and (9), respectively. The drift-suppression ratio is defined by Equation (10). When η > 0, the interval readout reduces the frequency drift caused by the modeled common-mode perturbation compared with the single high-frequency peak readout.
δf2 = f2(εr) − f2(2.35)
δ(Δf) = Δf(εr) − Δf(2.35)
η = [1 − |δ(Δf)|/|δf2|] × 100%
A systematic mesh-convergence test and frequency-resolution study were carried out to ensure numerical simulation reliability. The unit-cell mesh size was gradually refined until further mesh refinement caused a resonance frequency variation of less than 0.01 GHz. Meanwhile, the frequency sampling interval was adjusted to guarantee a peak-position uncertainty of below 0.01 GHz. Resonance frequencies reported to four decimal places are raw simulation outputs; considering discretization numerical error, the practically reliable precision of extracted resonance frequencies is limited to two decimal places.
3. Results and Discussion
3.1. Dual-Frequency Near-Perfect Absorption Characteristics
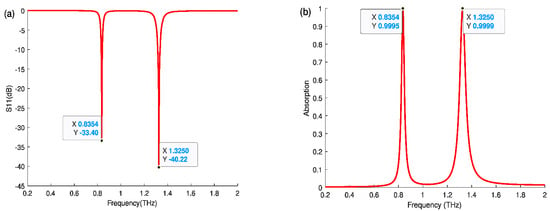
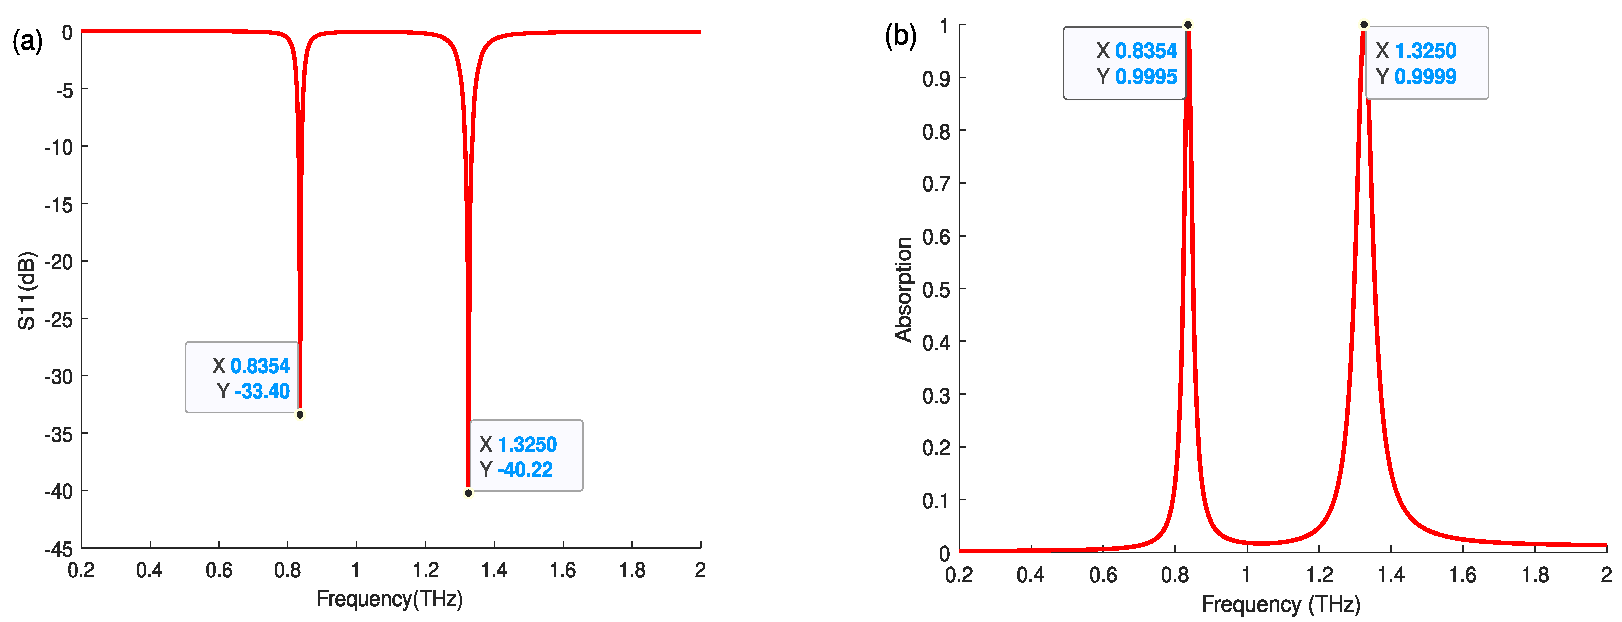
To verify the dual-frequency absorption capability of the proposed structure, the intrinsic electromagnetic response without loaded film is first analyzed. Figure 2a presents the reflection coefficient, S11, spectrum, and Figure 2b shows the corresponding absorptivity curve. The structure exhibits two distinct reflection dips and absorption peaks at 0.8354 THz and 1.3250 THz. At the low-frequency peak, S11 ≈ −33.40 dB with an absorptivity of 99.95%; at the high-frequency peak, S11 ≈ −40.22 dB with an absorptivity of 99.99%. Frequencies are reported to four decimal places and decibel values to two decimal places in the text and in Figure 2. Both absorption peaks approach unity, reflecting a stable dual-frequency near-perfect absorption response.
Figure 2.
Terahertz spectra of the sensor without sample: (a) reflection coefficient, S11; (b) absorptivity, A.
3.2. Impedance Matching Analysis
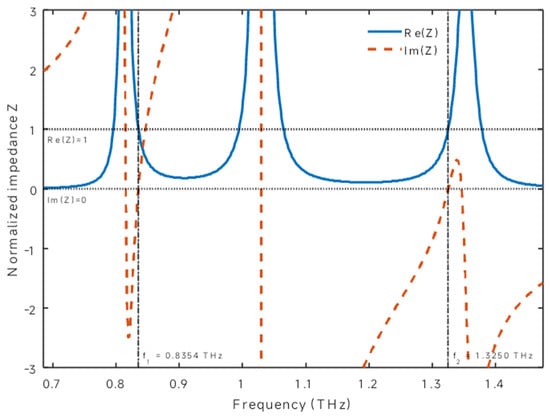
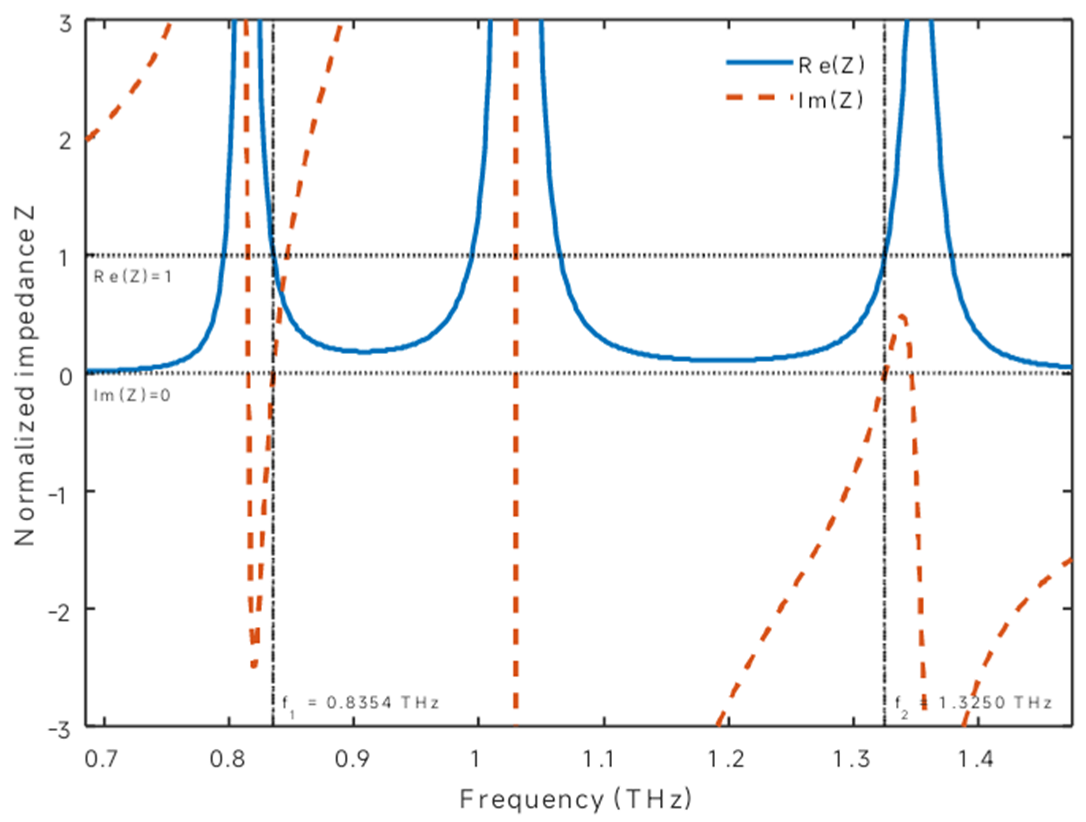
To further elucidate the dual-band near-perfect absorption characteristics described in Section 3.1, the equivalent normalized input impedance, Z, is retrieved from the complex S-parameters using Equation (11) [22,23].
The 0.6 μm continuous gold reflector is approximately 7.4 and 9.3 classical skin depths thick at 0.8354 and 1.3250 THz, respectively, for σ = 4.56 × 10⁷ S/m. It, therefore, strongly attenuates transmission near both resonances, providing the physical basis for S21 ≈ 0. The simplified impedance expression is given in Equation (12).
Z ≈ (1 + S11)/(1 − S11)
According to the impedance matching condition, when the real part of the normalized impedance approaches unity and the imaginary part approaches zero, the impedance mismatch between the sensor and free space is reduced, and reflection at the interface is suppressed. As shown in Figure 3, near f1 = 0.8354 THz and f2 = 1.3250 THz, Re(Z) is close to one while Im(Z) is close to zero. The impedance retrieval results, therefore, verify the formation mechanism of the dual-band absorption peaks, consistent with the subsequent field and surface-current analyses.
Figure 3.
Normalized impedance matching curves: real part, Re(Z), and imaginary part, Im(Z), as functions of the frequency. The horizontal dashed lines represent Re(Z) = 1 and Im(Z) = 0, and the vertical dashed lines mark the two resonance frequencies.
3.3. Analysis of Dual-Band Mode Origins and Physical Mechanisms
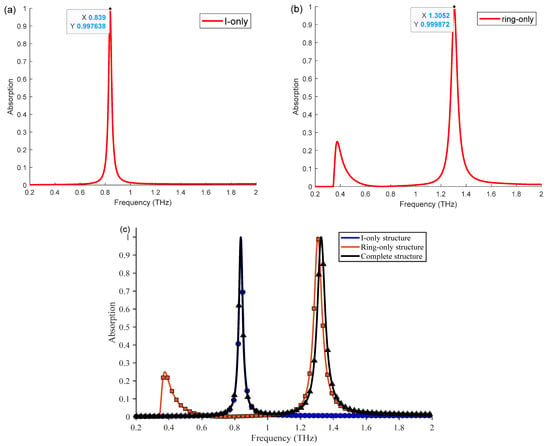
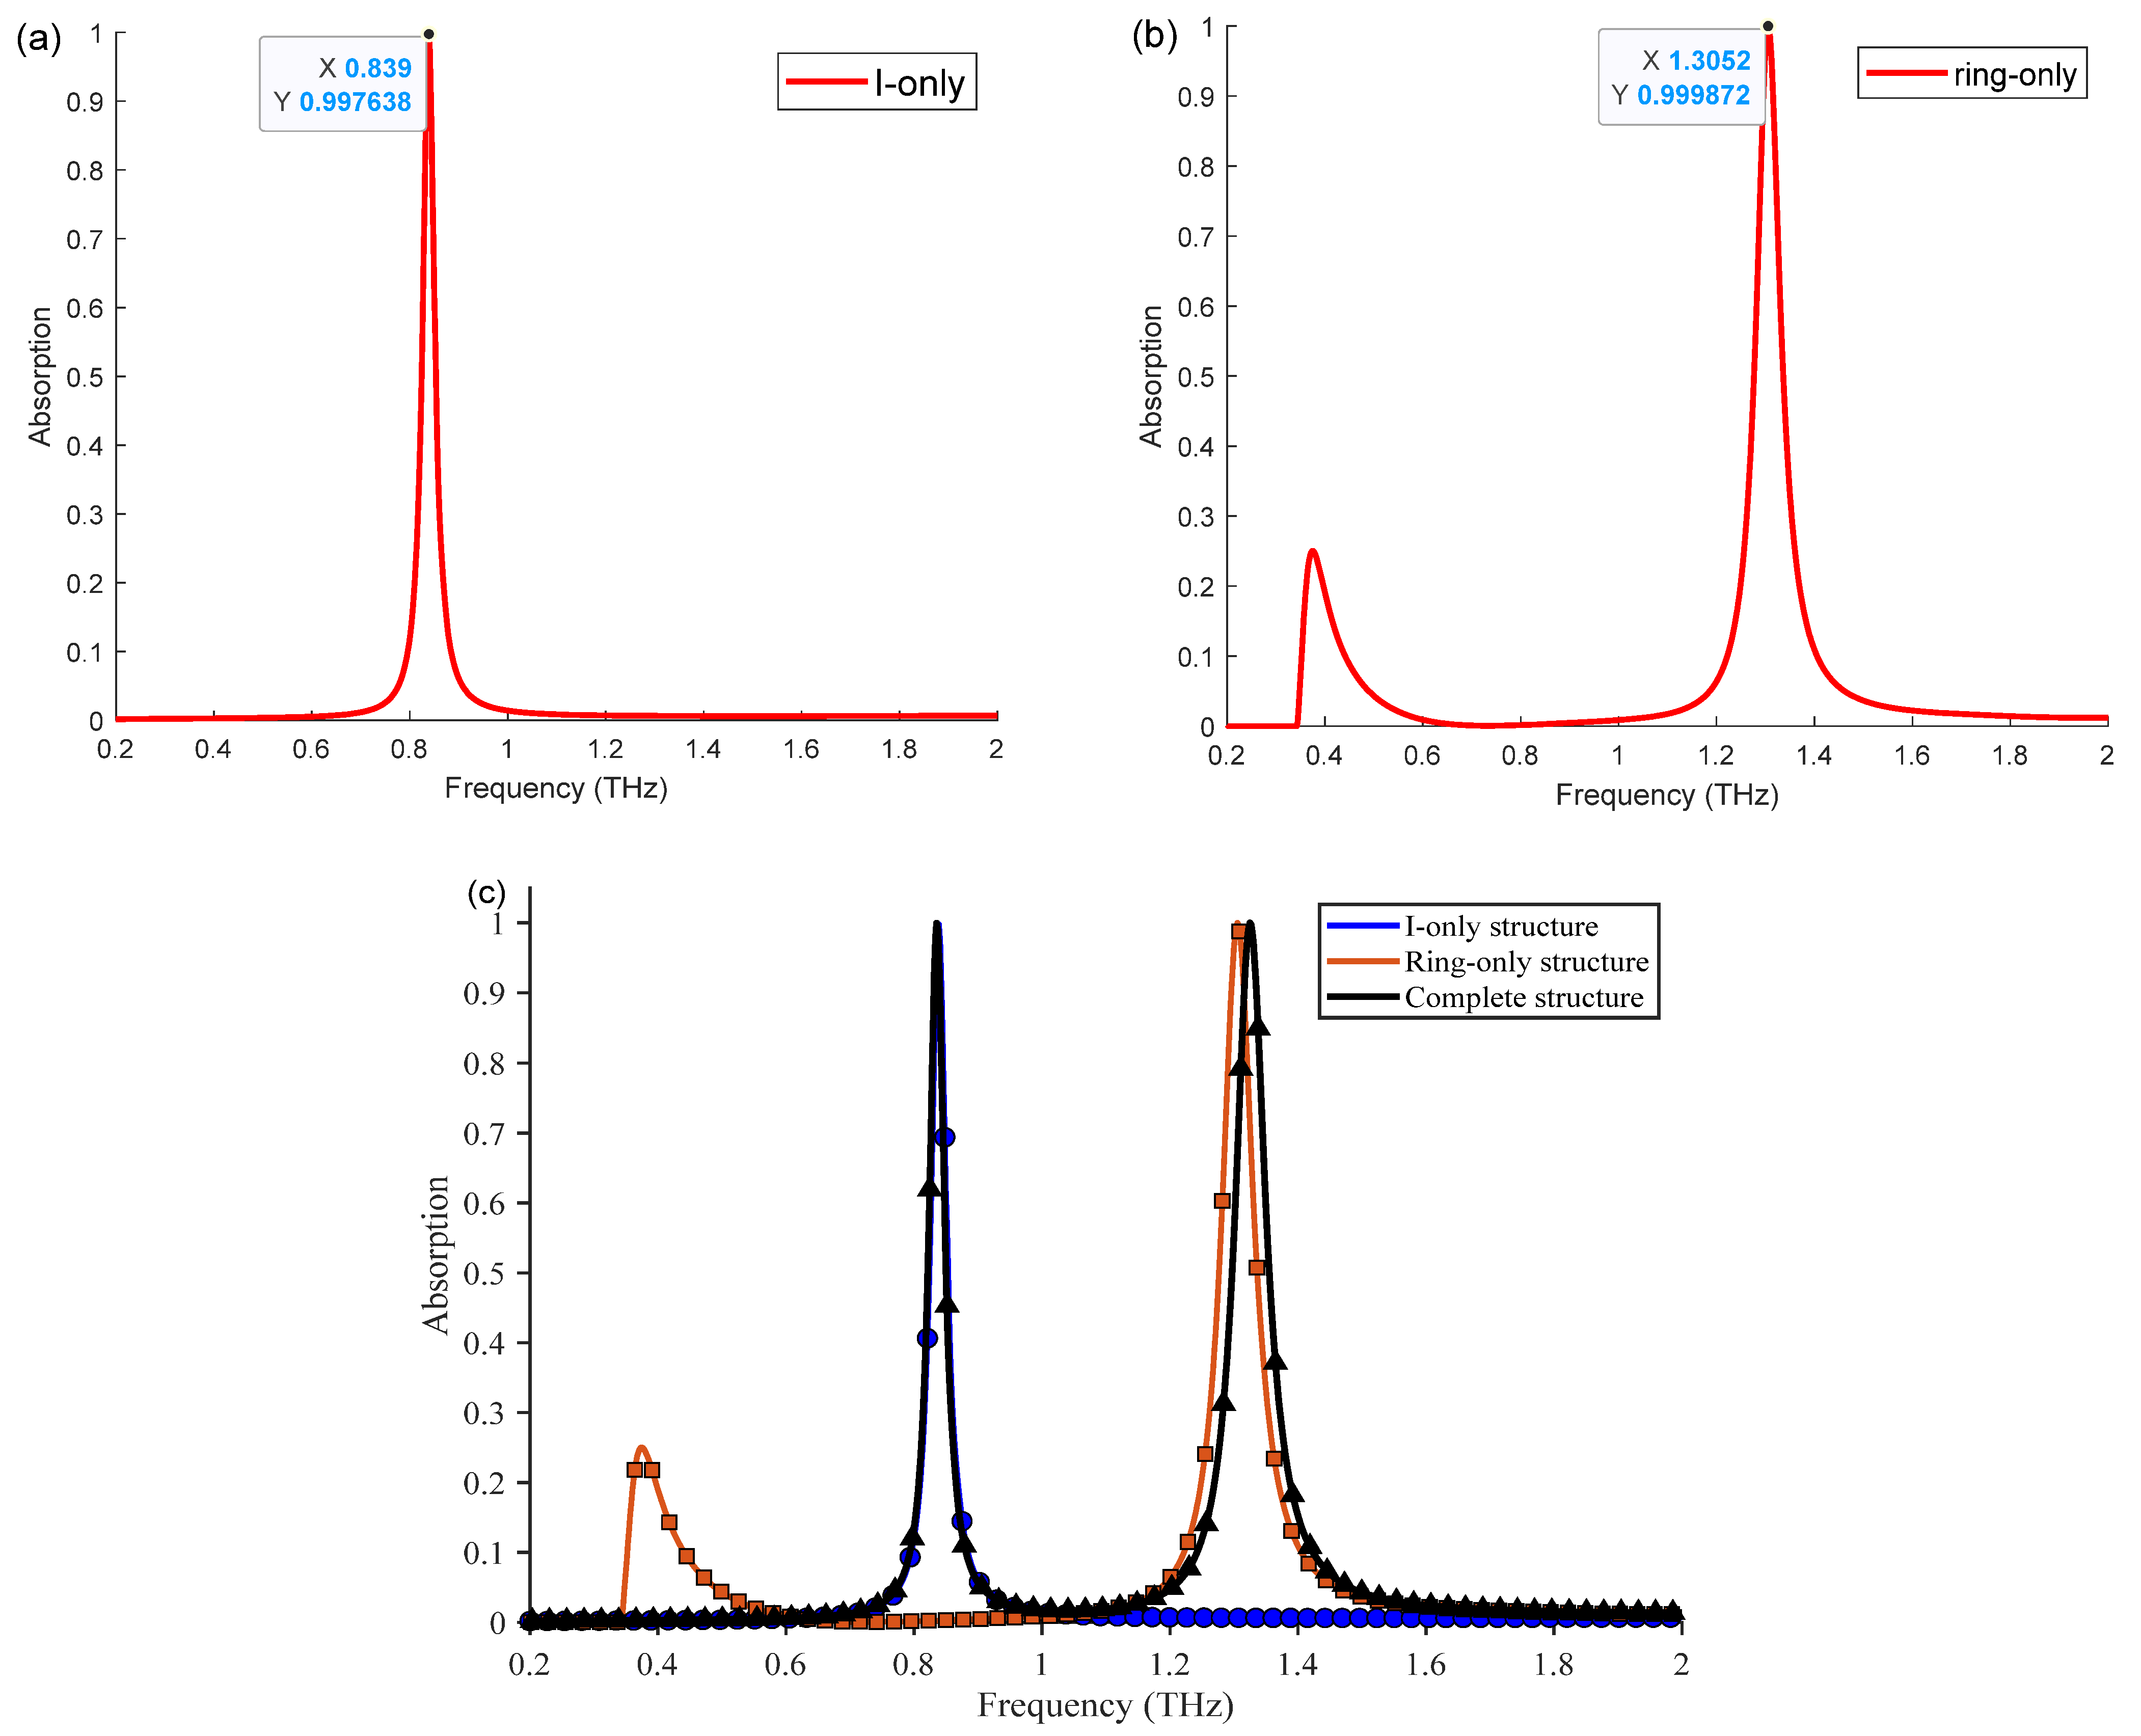
To identify the dominant structural origins of the two absorption peaks, Figure 4 compares the absorption spectra of the I-only, ring-only, and complete structures. The I-only structure exhibits a major absorption peak at 0.839 THz with an absorbance of 99.76%, while the ring-only structure exhibits a major absorption peak at 1.3052 THz with an absorbance of 99.98%. The ring-only spectrum also contains a weak parasitic feature near 0.4 THz; this response is much weaker than the dominant peak and is strongly reduced in the complete structure. It is, therefore, not counted as one of the two near-unity operating modes. In the complete structure, the two dominant peaks show slight shifts relative to those of the individual substructures, indicating relatively independent resonant capabilities with weak near-field coupling or induced responses. The low-frequency peak is primarily attributed to the I-shaped resonator, whereas the high-frequency peak is mainly contributed by the split-ring resonator.
Figure 4.
Absorption spectra of the substructure evolution: (a) structure with only the I-shaped resonator retained; (b) structure with only the split-ring resonator retained; (c) comparison of the absorption spectra among the I-only, ring-only, and complete structures.
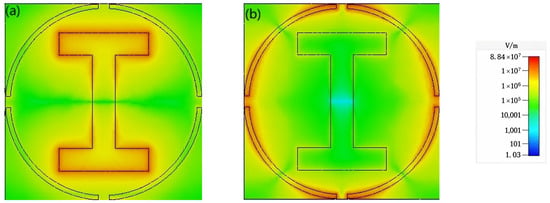
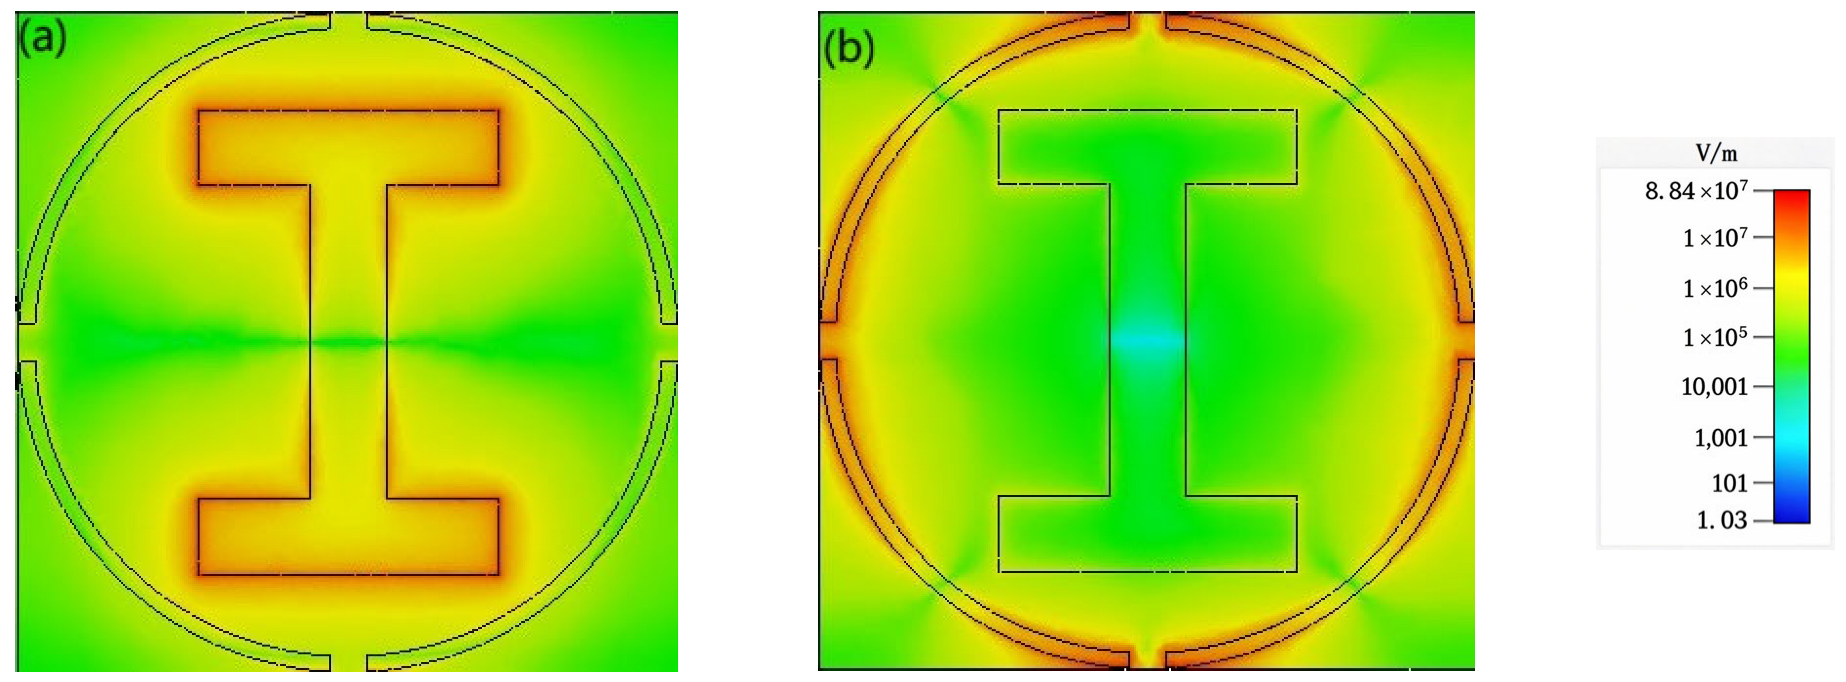
Figure 5a,b show the electric-field distributions at the low-frequency resonance point, f1 = 0.8354 THz, and the high-frequency resonance point, f2 = 1.3250 THz, respectively. As shown in Figure 5a, at the low-frequency resonance, the enhanced electric field is mainly concentrated in the vicinity of the central I-shaped resonator, particularly along the upper and lower transverse arms and their edge regions, while the field enhancement in the outer split-ring region is relatively weak. This indicates that the low-frequency peak is primarily dominated by the I-shaped resonator. In contrast, as shown in Figure 5b, at the high-frequency resonance, the enhanced electric-field region shifts mainly to the vicinity of the outer split-ring, forming a more pronounced localized field at the ring edges and gap region, while the electric-field response in the I-shaped resonator region is relatively weakened. These results indicate that the two absorption peaks correspond to distinct localized electric-field distributions.
Figure 5.
Electric-field distributions at the two resonance frequencies: (a) electric-field distribution at f1 = 0.8354 THz; (b) electric-field distribution at f2 = 1.3250 THz.
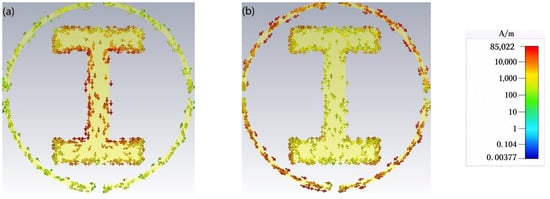
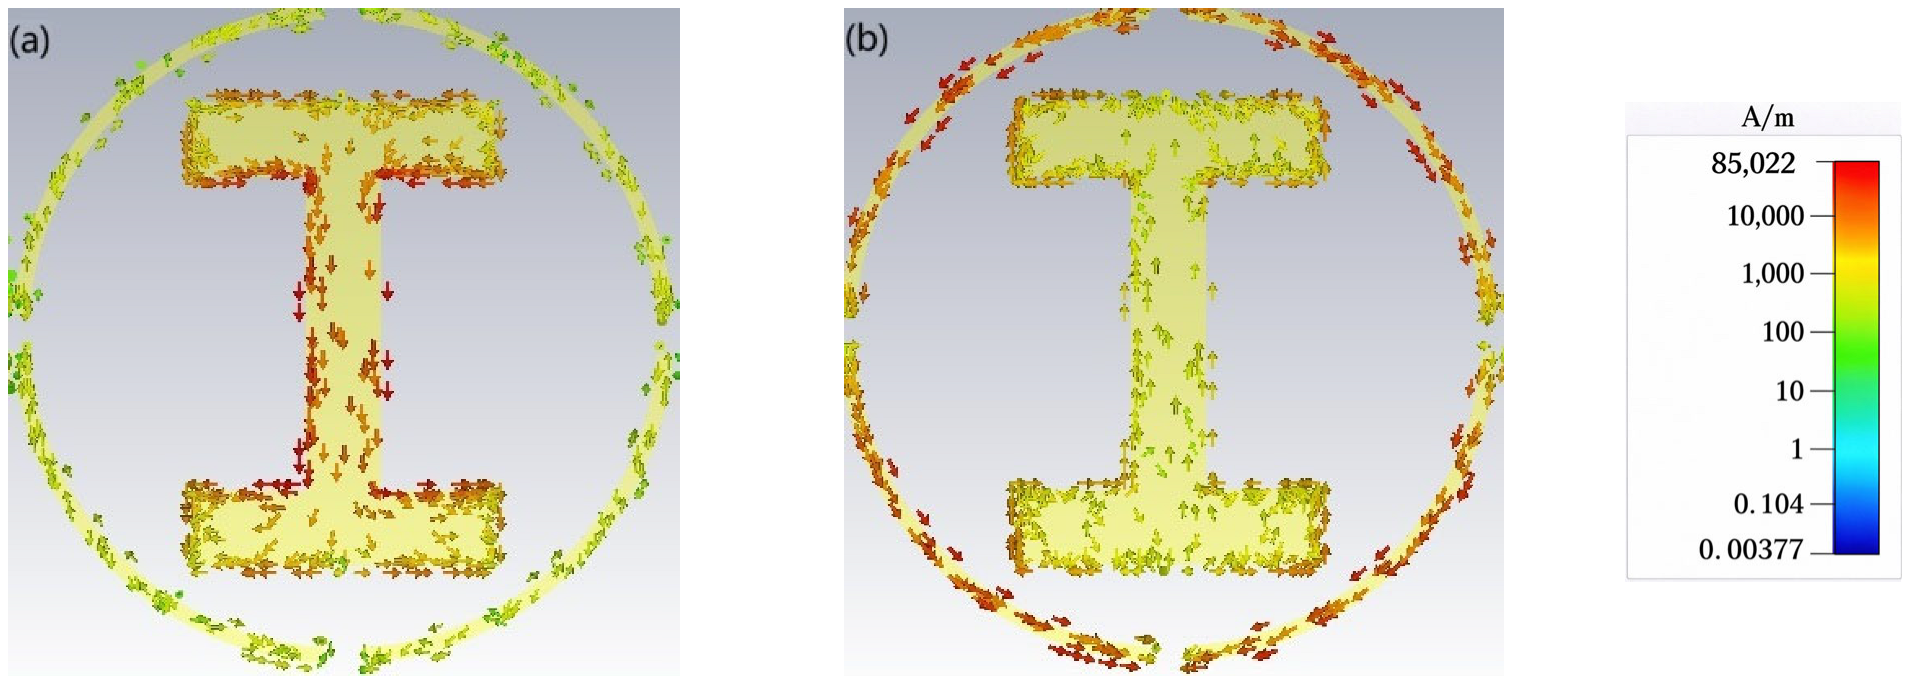
Figure 6a,b present the surface-current distributions at f1 = 0.8354 THz and f2 = 1.3250 THz, respectively. At the low-frequency resonance, the surface current is primarily distributed along the vertical arm and the upper and lower transverse arms of the I-shaped resonator, with only weak induced currents on the ring structure, further verifying that the low-frequency peak mainly originates from the I-shaped resonator. At the high-frequency resonance, the surface current is mainly distributed along the path of the outer split-ring resonator, forming a pronounced circumferential current response at the ring edges, indicating that the high-frequency peak is primarily excited by the split-ring resonator.
Figure 6.
Surface-current distributions at the two resonance frequencies: (a) surface-current distribution at f1 = 0.8354 THz; (b) surface-current distribution at f2 = 1.3250 THz.
Combining the electric field and surface current results, it can be seen that the two absorption peaks in the complete structure have different dominant resonant origins. Meanwhile, weak electric fields and induced currents still exist on the non-dominant structures, indicating a certain degree of weak near-field coupling or induced response between the I-shaped resonator and the split-ring resonator. This modal distinction provides a physical basis for the subsequent construction of dual-band sensing readout.
It should be clarified that the low-frequency mode supported by the I-shaped resonator acts as a differential self-reference instead of an ideal zero-sensitivity static reference. This reference mode still has non-zero sensitivity to analyte permittivity variations. Even so, its sensitivity magnitude is significantly lower than that of the high-frequency sensing mode. Common-mode environmental disturbances produce partially correlated frequency shifts for both resonance peaks. Therefore, calculating the frequency interval between the two resonances can suppress these shared drift components, even though the reference mode itself responds to target dielectric changes.
3.4. Film Thickness Response of Battery-Related Materials and Operating Thickness Calibration
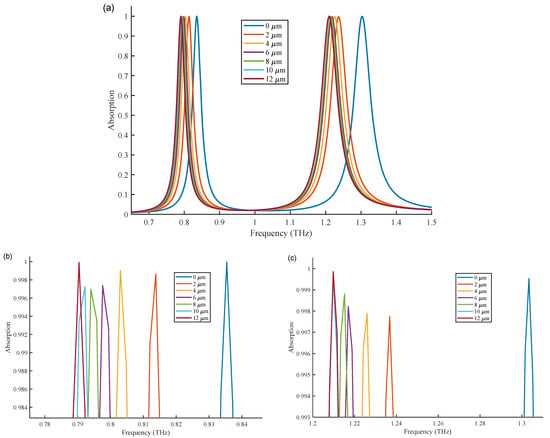
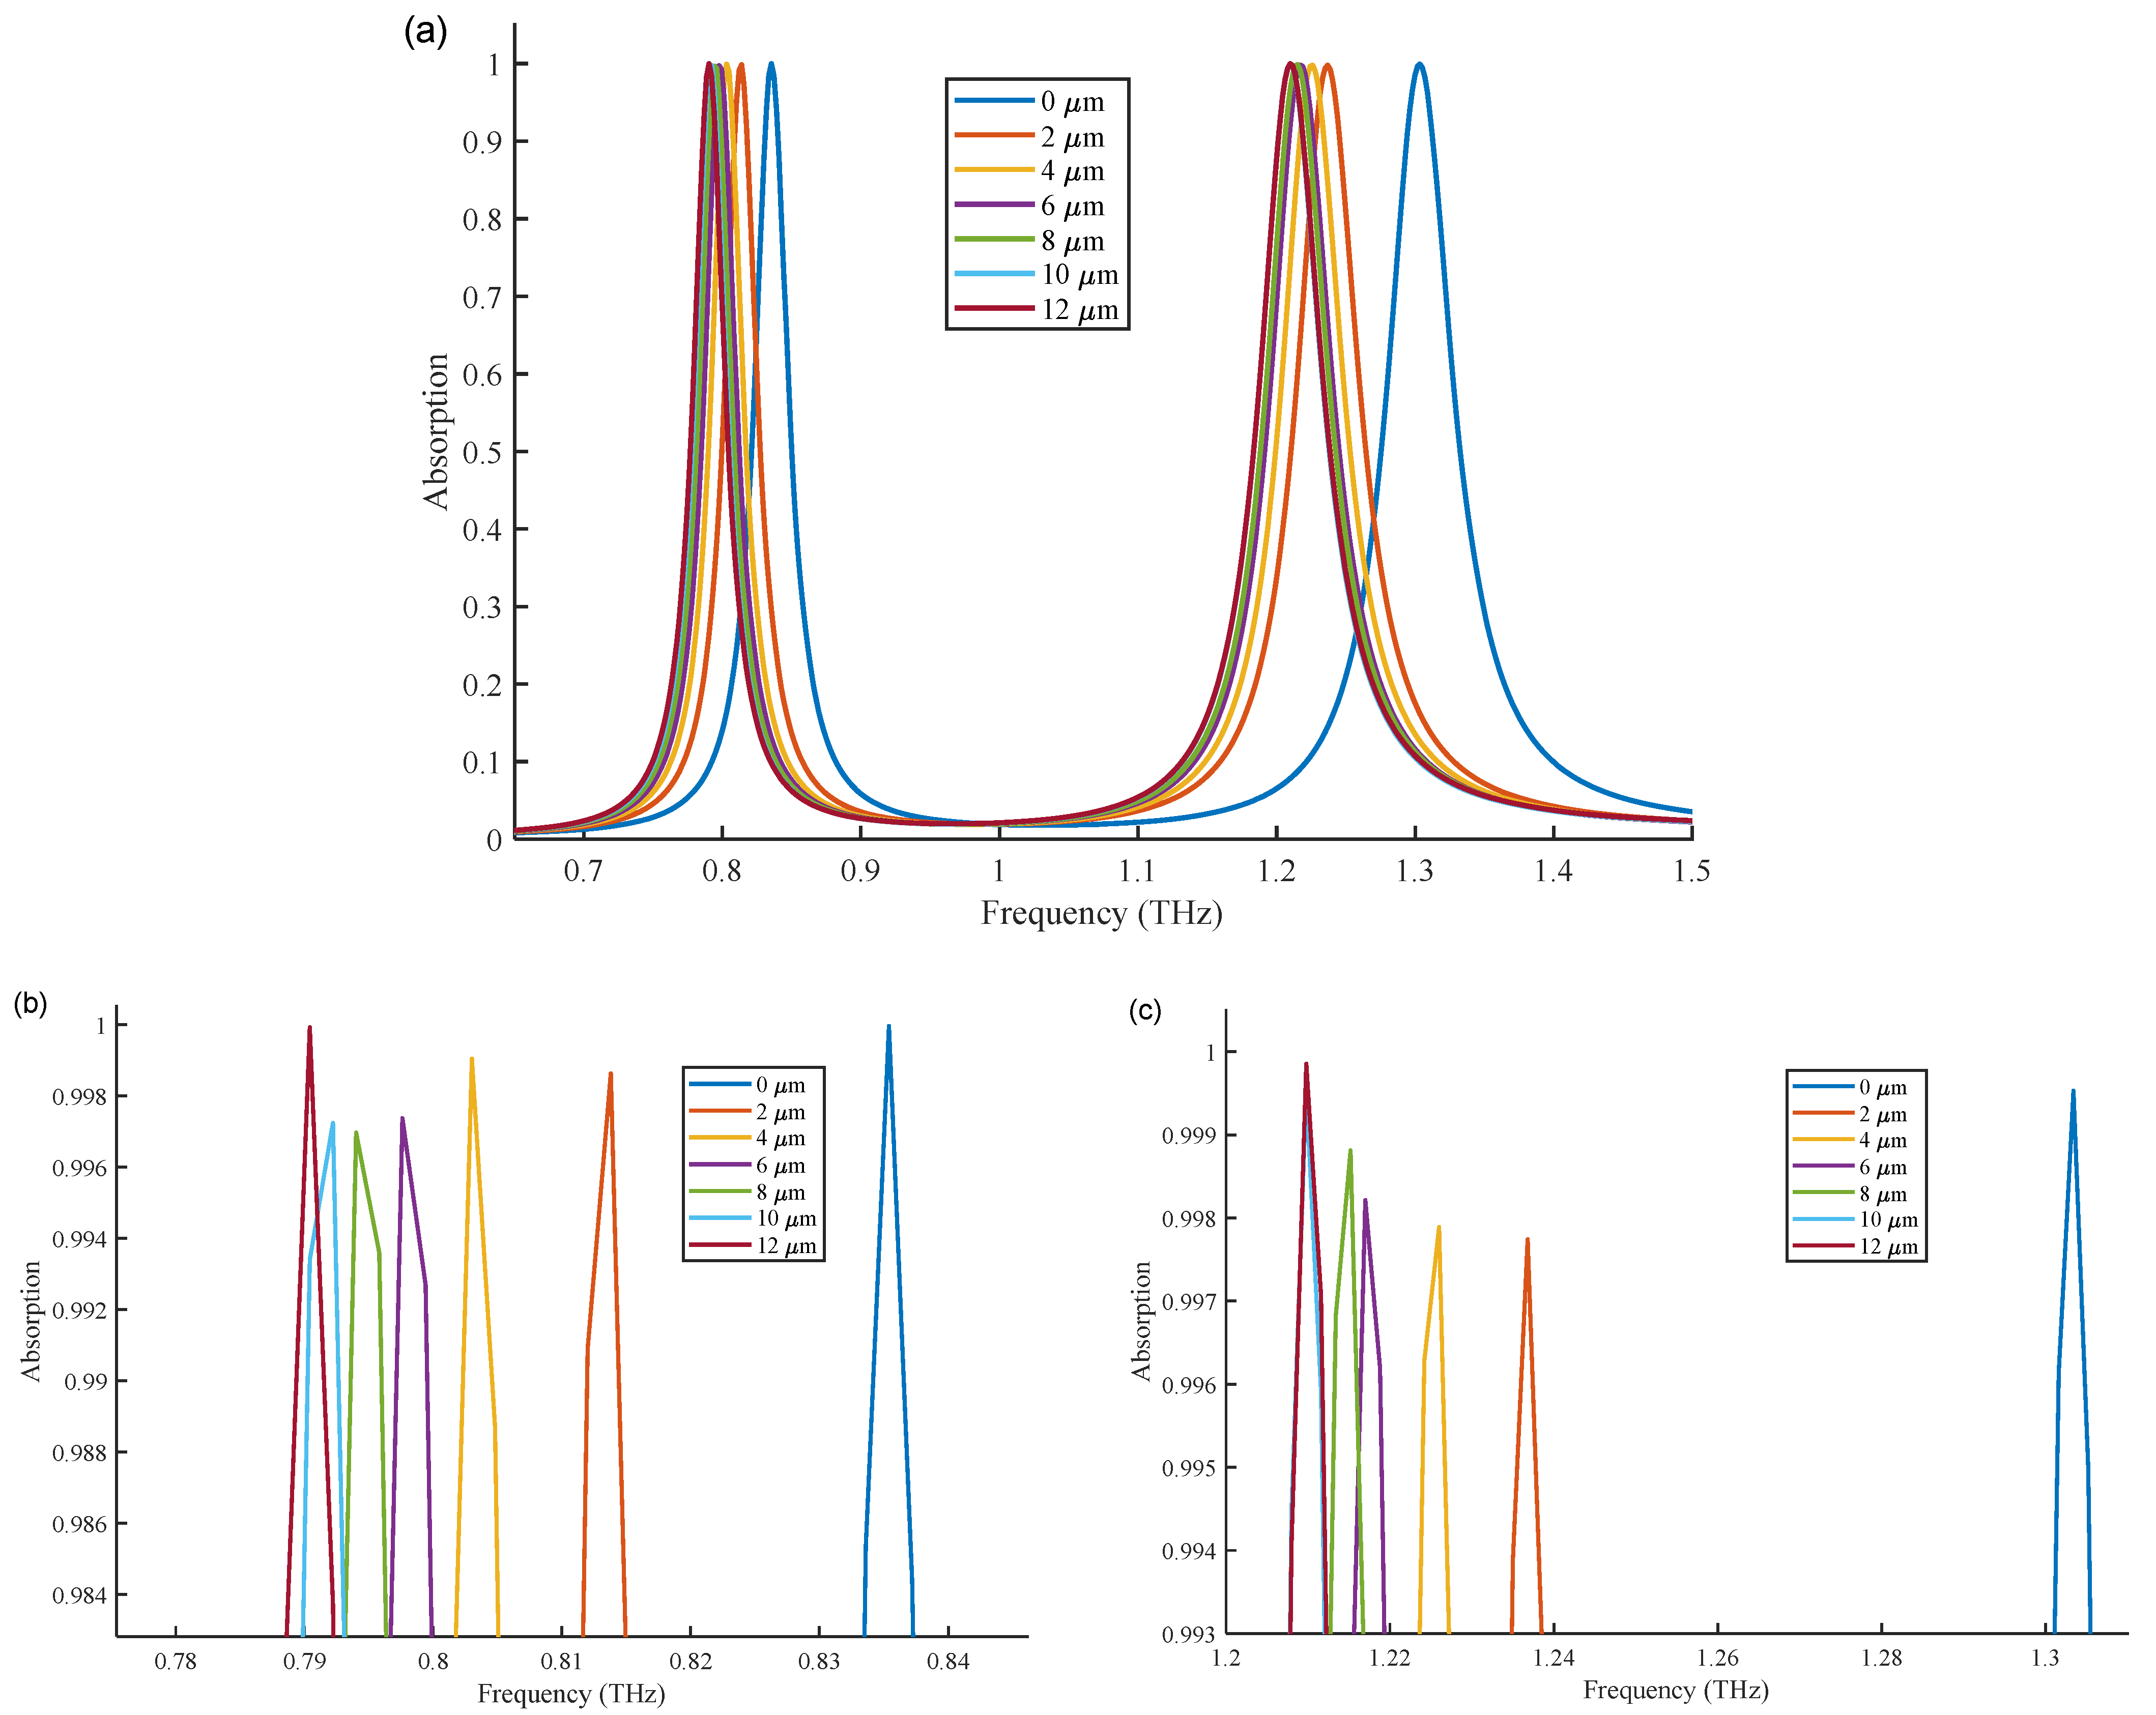
After clarifying the origins of the dual-band modes, the coupling relationship between the detected film thickness and the localized near-field is further evaluated. The localized fields of the metamaterial sensor are mainly concentrated near the surfaces of the metallic resonators. Figure 7a presents the overall absorption spectra under different thicknesses. As the film thickness increases, more of the target material enters the effective near-field region, leading to an increase in the effective permittivity in the resonant region and, consequently, causing a red shift of the resonance. When the film thickness exceeds the dominant near-field interaction depth, further increases in thickness have a gradually diminishing effect on the peak position, manifesting as frequency-shift saturation [7]. The thickness sweep is set to t = 0, 2, 4, 6, 8, 10 and 12 μm, with a fixed refractive index of n = 1.32 as a representative low-index equivalent dielectric condition. Figure 7b,c show the locally enlarged results near the low-frequency peak and the high-frequency peak, respectively. As the film thickness increases, both peaks shift toward lower frequencies, while the high-frequency mode shows the larger shift. At 10–12 μm, the incremental shift weakens, indicating that the film thickness approaches the effective localized near-field depth.
Figure 7.
Film thickness response under a fixed refractive index, n = 1.32: (a) dual-band absorption spectra at different thicknesses; (b) locally enlarged view of the low-frequency region; (c) locally enlarged view of the high-frequency region.
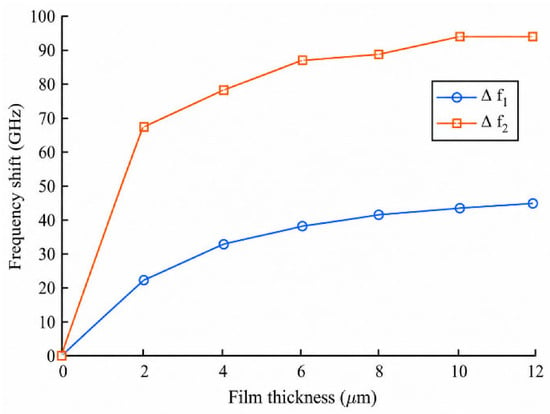
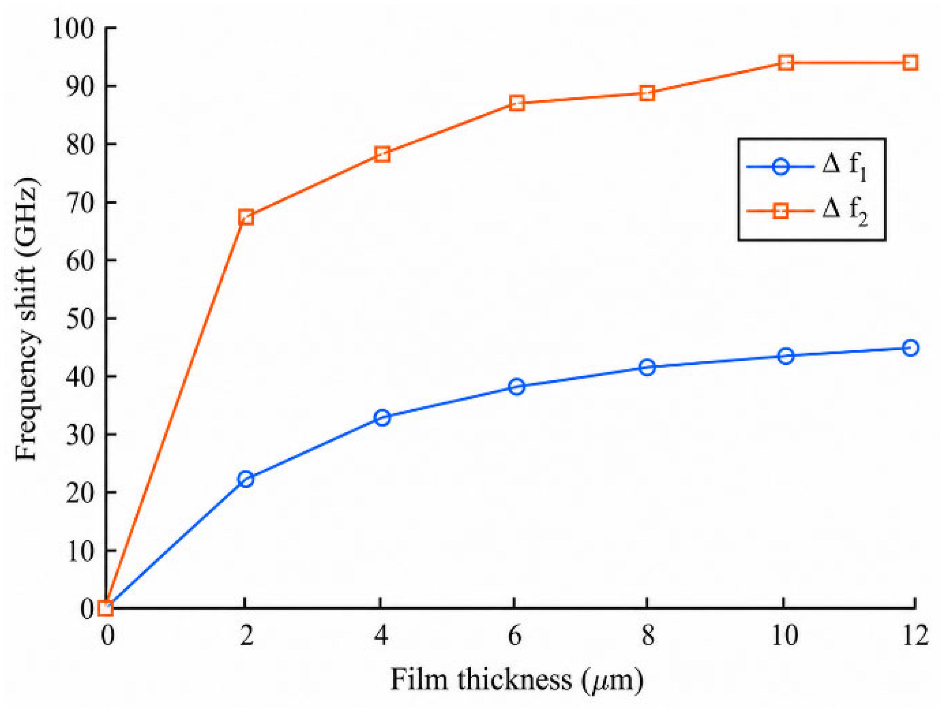
Figure 8 shows the relationship between the frequency shifts in the low-frequency and high-frequency peaks and the thickness of the detected film. Both curves show a rapid initial increase followed by a gradual leveling off, reflecting a finite effective sensing depth. The high-frequency shift at 4 μm is approximately 77 GHz, already exceeding 80% of the approximately 94 GHz shift at 12 μm; increasing the thickness from 4 to 6 μm adds only about 9 GHz while increasing the film thickness by 50%. Two quantitative criteria are defined to determine the working film thickness: (1) the thickness should stay within the monotonic-response regime, where the frequency shift increases with film thickness and full response saturation has not occurred; (2) sufficient electromagnetic field-analyte overlap should be achieved without entering the saturation plateau governed by the near-field decay length of the metamaterial resonators. At t = 4 μm, the high-frequency peak achieves more than 80% of the maximum frequency shift obtained at 12 μm. Further increasing the thickness from 4 μm to 6 μm only brings the marginal additional frequency shift. Balancing the adequate spectral response and avoidance of saturation, 4 μm is selected as the operating thickness for the subsequent refractive-index sensing simulations. Although a 6 μm thick film can also be detected, it is not chosen as the unified working thickness for comparative sensing analysis. A 6 μm film would also be detectable, but it was not adopted as the common working thickness for the subsequent refractive-index comparison.
Figure 8.
Frequency shifts in the low-frequency and high-frequency peaks as a function of the detected film thickness under a fixed refractive index.
3.5. Equivalent Refractive Index Sensing Performance at the Operating Thickness
After determining the operating thickness of 4 μm, this paper further conducts equivalent refractive index parameter scanning to evaluate the response capability of the proposed sensor to changes in the dielectric environment of battery-related films. In the simulation, the thickness of the film under test is fixed at 4 μm, and the refractive index is set to n = 1.30, 1.35, 1.40, 1.45, 1.50, 1.55 and 1.60. It should be noted that this refractive index range does not correspond to fixed measured values of any specific battery material but rather represents the possible equivalent refractive index variations that may arise from battery-related porous films, polymer coatings, weakly contaminating films, or low-dielectric perturbation layers.
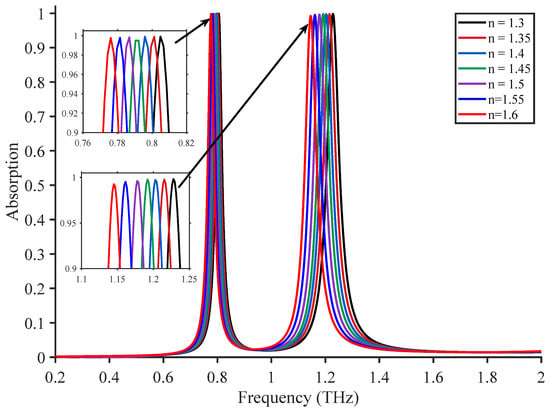
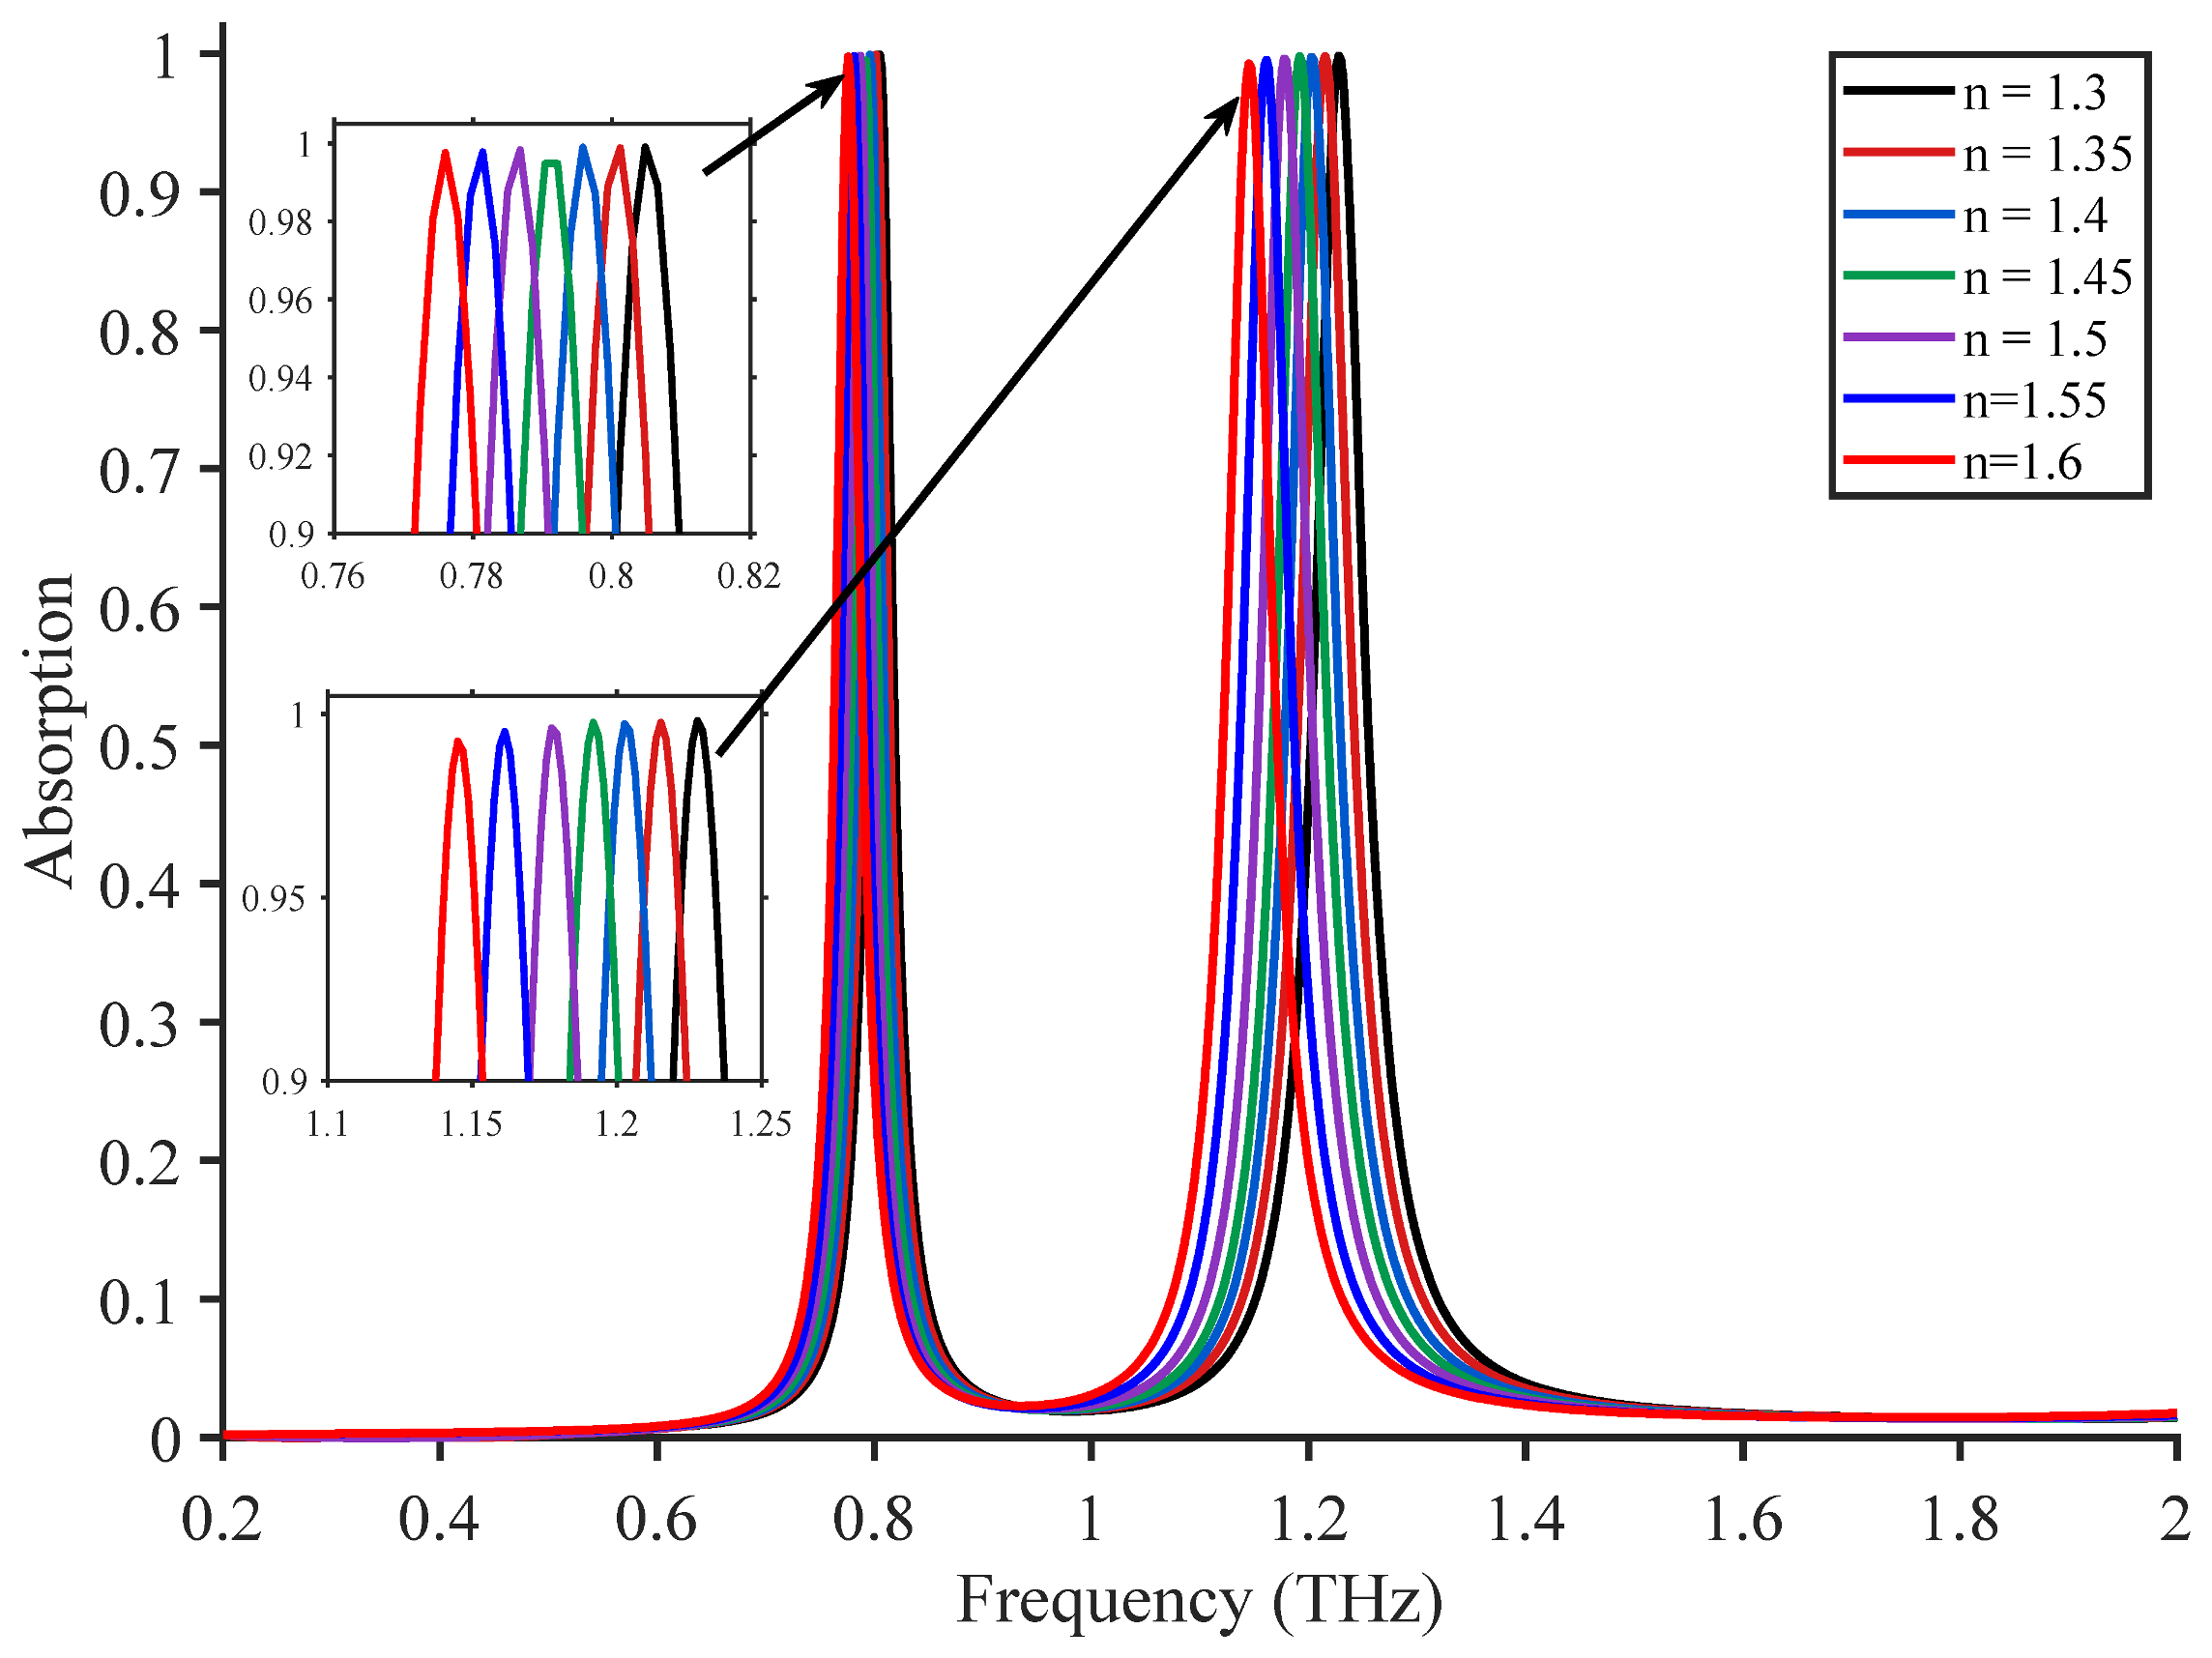
Figure 9 shows that as the equivalent refractive index increases, both absorption peaks shift toward lower frequencies, which can be attributed to the increase in the effective permittivity and effective capacitance in the resonant region. The locally enlarged views show that the shift magnitude of the high-frequency peak is significantly greater than that of the low-frequency peak, indicating that the high-frequency detection mode exhibits a stronger response to changes in the dielectric environment of the film.
Figure 9.
Absorption spectra and locally enlarged views of films with different equivalent refractive indices at the operating thickness.
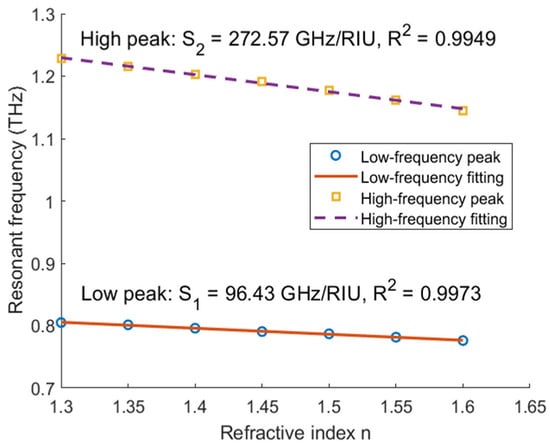
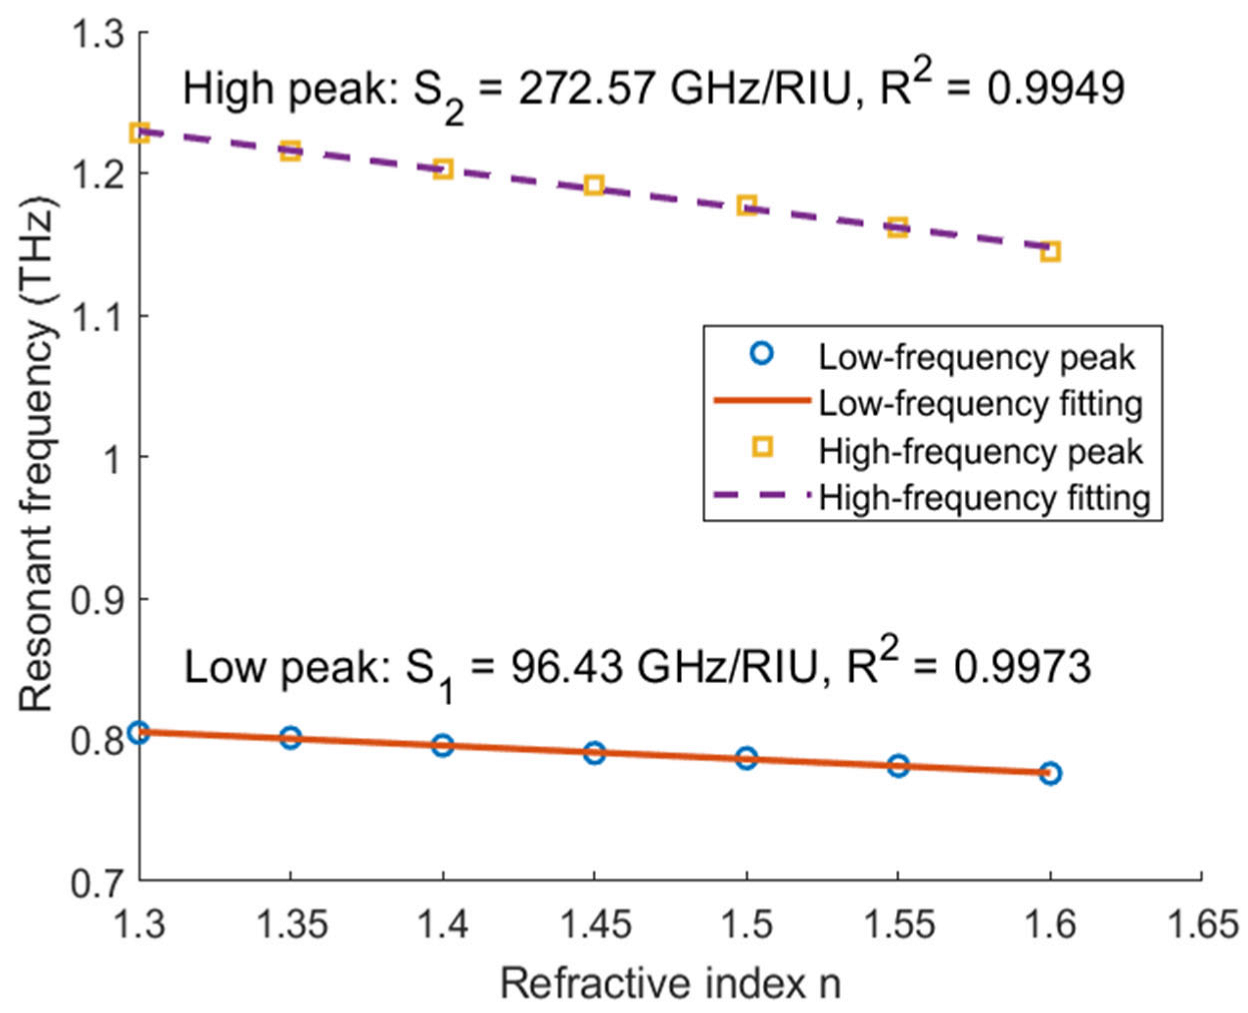
The resonance frequencies of the low-frequency and high-frequency peaks under different equivalent refractive indices were extracted and subjected to linear fitting, with the results shown in Figure 10. The sensitivity of the low-frequency peak is 96.43 GHz/RIU with a goodness of fit value of R2 = 0.9973; the sensitivity of the high-frequency peak is 272.57 GHz/RIU with a goodness of fit value of R2 = 0.9949. The sensitivity of the high-frequency peak is approximately 2.83 times that of the low-frequency peak, indicating that the high-frequency mode exhibits stronger coupling with the localized dielectric environment of the film under test and is, therefore, suitable as the primary detection channel. The low-frequency peak exhibits a smaller frequency shift and a stable peak shape, making it suitable as a relative reference mode for dual-peak frequency interval readout.
Figure 10.
Linear fitting of the low-frequency peak, f1, and high-frequency peak, f2, as functions of the equivalent refractive index of the film.
According to the definitions in Section 2.3, Q and FWHM are extracted from the absorption spectra under the unloaded (without film) state. The quality factors of the low-frequency and high-frequency peaks are Q1 = 29.0 and Q2 = 22.7, respectively. Based on the peak widths of the bare structure, the figures of merit (FOM) for the low-frequency and high-frequency peaks are approximately 3.35 and 4.67 RIU−1, respectively. Although the single-peak sensitivity of this structure is not the highest, its advantage lies in its ability to simultaneously provide a detection peak and a reference peak, enabling a relative self-referenced readout through the dual-peak frequency interval.
3.6. Relative Self-Referenced Readout Based on Dual-Peak Frequency Interval
Although the high-frequency peak exhibits higher refractive index sensitivity, relying solely on the absolute frequency shift of a single resonance peak may still be affected by environmental temperature, structural fabrication errors, uneven sample loading, and test system drift. Since the structure simultaneously provides a low-frequency reference mode and a high-frequency detection mode, the relative frequency relationship between the two peaks can be exploited to construct a self-referenced readout parameter. In this paper, the dual-peak frequency interval is defined as Δf = f2 − f1.
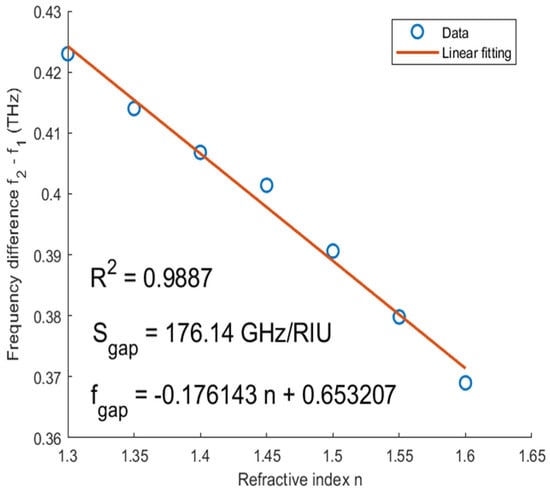
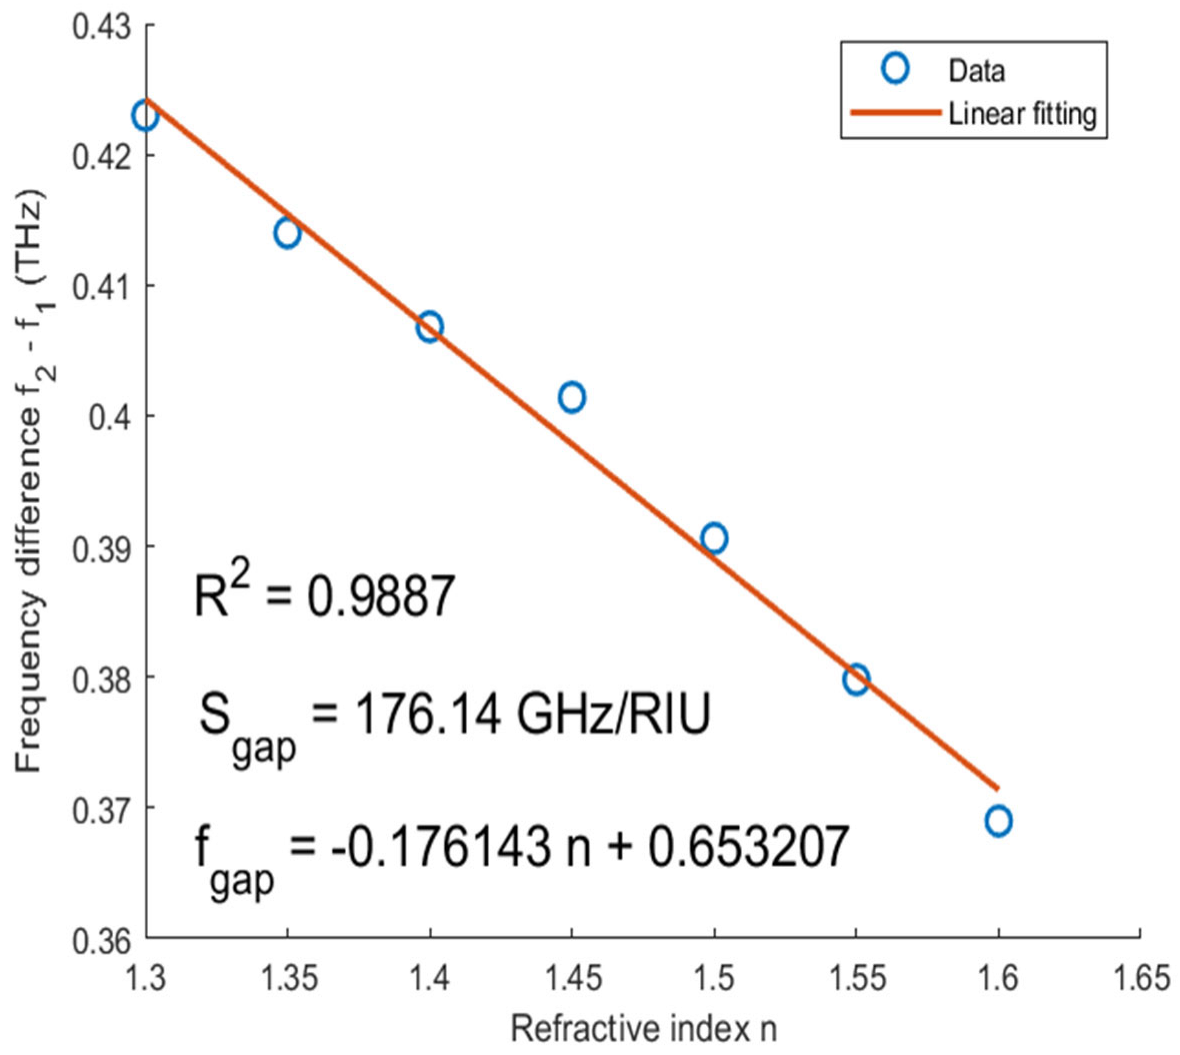
Figure 11 presents the linear fitting results of Δf as a function of the equivalent refractive index of the film under test. As the refractive index increases from 1.30 to 1.60, both resonance peaks undergo red shifts, but the red shift of the high-frequency peak is larger, resulting in a gradual decrease in the dual-peak frequency interval. The fitting results indicate that the frequency interval sensitivity is , with a goodness of fit value of R2 = 0.9887. It is worth pointing out that the interval-based sensitivity, is numerically lower than the raw sensitivity of the high-frequency single peak of 272.57 GHz/RIU. The core advantage of the dual-peak-interval readout is not improved raw refractive-index sensitivity but enhanced stability against common-mode environmental drift. This value is lower than the sensitivity of the high-frequency peak alone, because both peaks shift toward lower frequencies as the refractive index increases, and the change in frequency interval approximately reflects the difference between the sensitivities of the two peaks.
Figure 11.
Linear fitting of the dual-peak frequency interval as a function of the equivalent refractive index.
Therefore, the advantage of Δf lies primarily in the relative frequency readout rather than simply improving sensitivity. When external disturbances cause common-mode drifts of the two resonance peaks in similar directions, subtracting the two frequencies is expected to mitigate the influence of such common drifts. In the context of electric vehicle battery-related film monitoring scenarios, factors such as temperature, assembly errors, test-angle deviations, and background medium perturbations may all affect the absolute frequency readout of a single peak. The dual-peak frequency interval readout, thus, provides a feasible approach to enhancing the stability of spectral readout.
3.7. Parametric Analysis of Equivalent States of Battery-Related Films
To further illustrate the capability of the proposed sensor in distinguishing equivalent dielectric state variations of battery-related films, three representative equivalent refractive index states are selected for parametric verification. Here, the film under test is not limited to any specific battery material but is treated as a uniform equivalent dielectric layer, used to describe local dielectric environment differences that may arise from surface state changes in porous separators, polymer coating residues, moisture contamination layers, or electrolyte residue films. Based on the refractive index scanning results in Section 3.5, n = 1.30, n = 1.45, and n = 1.60 are selected to represent low, medium, and high equivalent dielectric perturbation states, denoted as State I, State II, and State III, respectively.
For the i-th equivalent state, the dual-peak frequency interval, the interval variation between states i and j, and the absolute frequency shift in the high-frequency detection peak are defined by Equations (13)–(15), respectively. Here, f1 and f2 denote the low-frequency reference peak and the high-frequency detection peak, respectively. By comparing the variations in f2 and Δf, both the response capability of the high-frequency detection channel and the discriminative ability of the dual-peak relative readout parameter for state changes can be evaluated.
Δfi = f2(ni) − f1(ni)
|Δfij| = |Δfj − Δfi|
|Δf2,ij| = |f2(nj) − f2(ni)|
As shown in Table 2, from State I to State III, the low-frequency peak shifts from 0.8048 THz to 0.7760 THz, with a frequency shift of 28.8 GHz; the high-frequency peak shifts from 1.2278 THz to 1.1450 THz, with a frequency shift of 82.8 GHz; and the dual-peak frequency interval decreases from 0.4230 THz to 0.3690 THz, with a variation of 54.0 GHz. These results indicate that the high-frequency peak is more sensitive to changes in the equivalent refractive index and is, therefore, suitable as the primary detection channel. The dual-peak frequency interval can reflect the relative variation between the detection mode and the reference mode and can serve as an auxiliary readout parameter for battery-related film state identification.
Table 2.
Parametric verification results of equivalent states of battery-related films.
For the identification of battery-related film states, the reported 28.8 and 82.8 GHz state-to-state shifts are deterministic simulation outputs. Measurement noise, spectrometer resolution, fabrication variability, and peak-fitting uncertainty are not included, so these shifts should not be interpreted as experimentally validated detection limits. In practice, two film states would be distinguishable only if their interval change exceeded the combined peak-extraction uncertainty. Future fabricated-device measurements should report repeated spectra, confidence intervals, and a limit of detection based on measured frequency noise. The present results establish only the ideal parametric separability of the three equivalent states.
3.8. Stability Analysis of Self-Referenced Readout
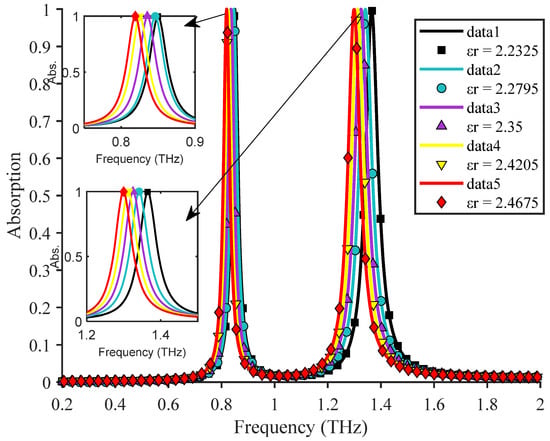
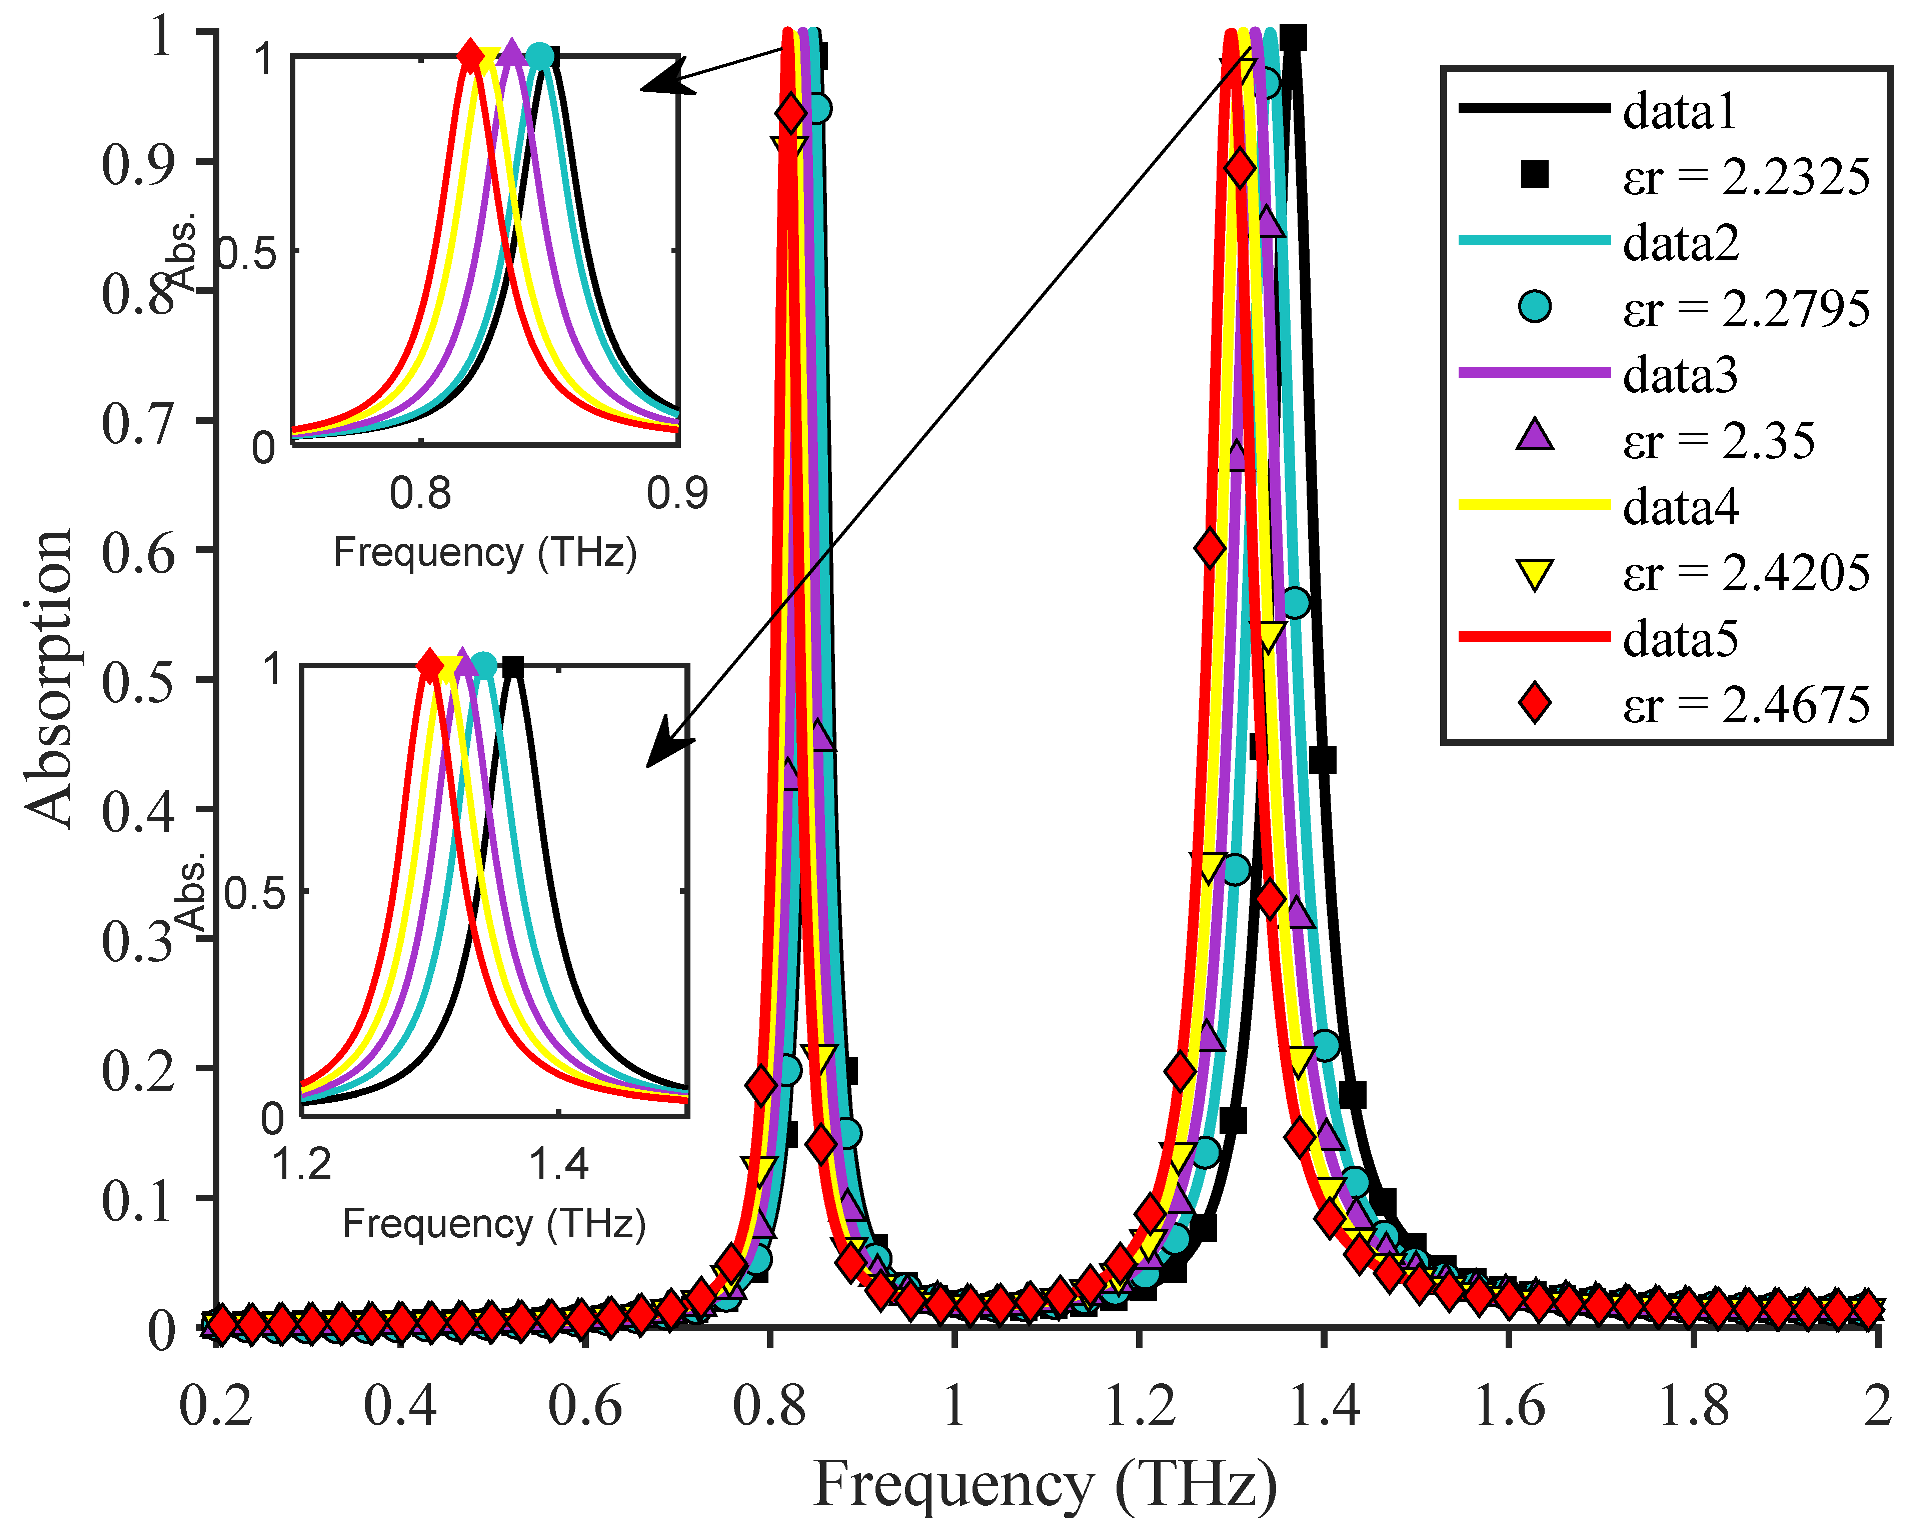
To further verify the self-referencing effect of the dual-peak frequency-interval readout, a controlled numerical perturbation analysis was conducted on the relative permittivity of the TOPAS dielectric layer while keeping the film thickness and refractive index constant. Taking εr = 2.35 as the baseline, −5%, −3%, +3%, and +5% are used as a symmetric numerical stress-test envelope around the nominal parameter. This envelope is introduced to compare common-mode rejection under small and moderately larger perturbations; it is not claimed to be a measured operating variation or a guaranteed commercial-material tolerance. Experimental feasibility in the THz range must be established by measuring the complex permittivity of the actual TOPAS layer and by repeating the analysis under material, temperature, humidity, and fabrication variations. Figure 12 shows that both resonance peaks shift in the same direction as εr changes, providing a common-mode disturbance for evaluating the relative readout.
Figure 12.
Dual-band absorption responses under perturbations of the TOPAS permittivity.
To quantitatively compare the stability of the high-frequency single-peak readout and the dual-peak frequency-interval readout, Table 3 presents the low-frequency peak, f1, high-frequency peak, f2, dual-peak frequency interval, Δf, high-frequency peak drift, δf2, frequency-interval drift, δ(Δf), and drift-suppression ratio, η, under the TOPAS-permittivity perturbations.
Table 3.
Comparison of drift between single-peak readout and dual-peak frequency interval readout under TOPAS-permittivity perturbations.
As shown in Table 3, when the relative permittivity of TOPAS is perturbed, both the low-frequency and high-frequency peaks exhibit frequency drifts, but the absolute drift, |δ(Δf)|, of the dual-peak frequency interval is always smaller than the absolute drift, |δf2|, of the high-frequency single peak.
Apart from the TOPAS-substrate-permittivity perturbation, extra numerical perturbation tests are implemented to mimic other realistic interference factors, including small substrate permittivity offsets simulating moderate temperature drift, artificial frequency offsets representing measurement readout error, and partial surface coverage simulating incomplete analyte loading These simulations only test additive common-mode perturbations. Complete experimental verification under real temperature-cycling conditions will be explored in future work.
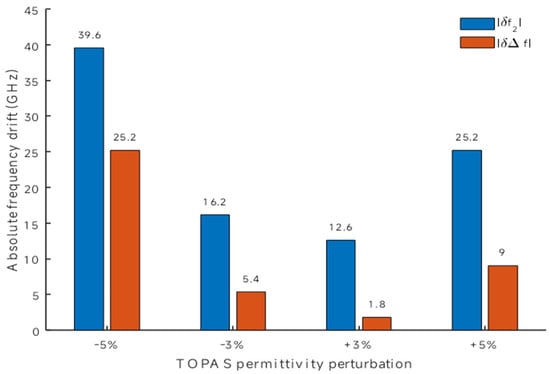
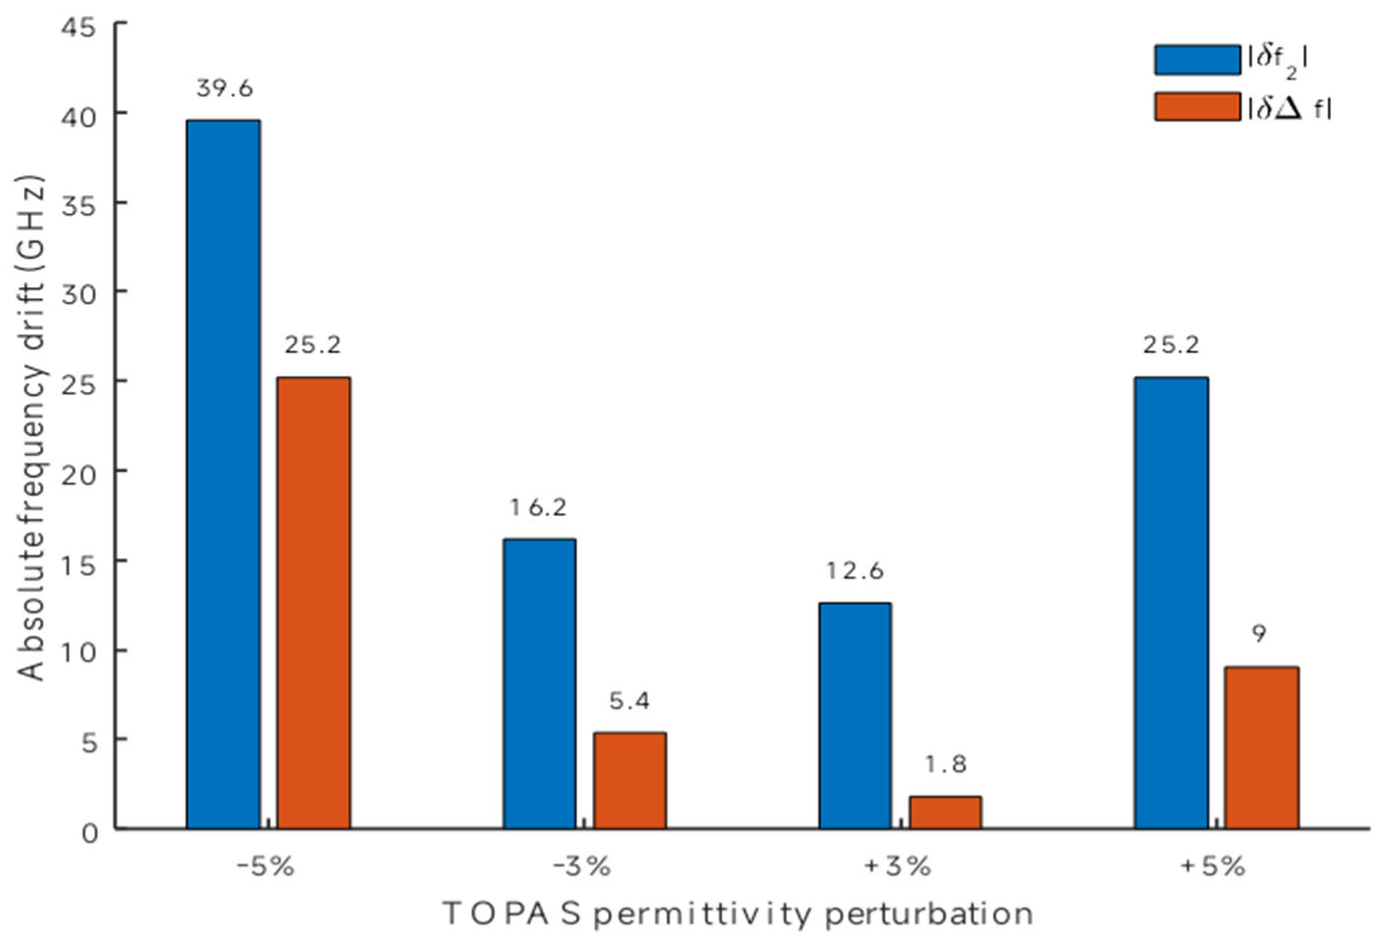
Figure 13 presents a comparison of the drifts between the high-frequency single-peak readout, f2, and the dual-peak frequency interval readout, Δf. It can be clearly observed that under all perturbation conditions, the drift of Δf is consistently smaller than the absolute drift of the high-frequency peak, f2. When εr undergoes a −5% perturbation, the drift of f2 is 39.6 GHz, while the drift of Δf is 25.2 GHz; at −3% perturbation, the corresponding values are 16.2 GHz and 5.4 GHz, respectively; at +3% perturbation, they are 12.6 GHz and 1.8 GHz, respectively; and at +5% perturbation, they are 25.2 GHz and 9.0 GHz, respectively. Further calculation yields drift suppression ratios of the dual-peak frequency interval readout of 36.36%, 66.67%, 85.71%, and 64.29%, respectively. Among these, within the ±3% perturbation range, the suppression effect of Δf on common-mode drifts is particularly pronounced.
Figure 13.
Comparison of the drift between high-frequency single-peak readout and dual-peak frequency interval readout under TOPAS-permittivity perturbations.
The practical meaning of η is the fractional reduction in the disturbance-induced frequency drift obtained using the interval Δf instead of the high-frequency peak, f2, alone. For example, η = 85.71% at +3% means that only 14.29% of the absolute f2 drift remains in the interval signal; η = 36.36% at −5% means that the interval readout removes 36.36% of that modeled drift. Thus, η quantifies the common-mode suppression benefit of the relative readout, but it does not establish experimental accuracy because actual temperature, humidity, fabrication, loading, and instrument noise were not measured in this numerical study.
3.9. Discussion and Limitations
Compared with conventional electric vehicle battery monitoring methods, this work focuses on the terahertz spectral response induced by battery-related films or surface dielectric perturbations. The proposed sensor is a conceptual non-contact complement rather than a replacement for packaged-battery state estimation. Real battery-related materials can exhibit complex refractive indices, absorption losses, roughness, nonuniform thickness, and anisotropy; fabricated resonators also introduce roughness and dimensional tolerances. The frequency-independent gold and TOPAS parameters and the symmetric ±5% TOPAS-permittivity envelope are numerical assumptions, not measured operating properties. Validation will require THz time-domain measurements of actual material optical constants, fabrication and repeated sample loading, uncertainty analysis, and controlled temperature and humidity tests.
4. Conclusions
This paper proposes a dual-band self-referenced terahertz metamaterial sensor for battery-related film monitoring in electric vehicles. The sensor is composed of a split-ring resonator, an I-shaped resonator, a TOPAS dielectric layer, and a bottom metallic reflective layer. In the unloaded state (without film), it exhibits two near-perfect absorption peaks at 0.8354 THz and 1.3250 THz, with absorbances of 99.95% and 99.99%, respectively. Impedance matching, substructure evolution, electric-field distributions, and surface-current distributions collectively verify the dual-band mode division: the low-frequency peak is primarily dominated by the I-shaped resonator, serving as a relative reference mode; the high-frequency peak is primarily dominated by the split-ring resonator, which is more sensitive to external dielectric-environment changes and, thus, serves as the primary detection mode.
In the thickness response analysis, as the film thickness increases from 0 μm to 12 μm, both resonance peaks exhibit red shifts and gradually tend toward saturation, reflecting a finite effective sensing depth. Considering both the frequency shift response and the saturation trend, 4 μm is determined as the operating thickness for subsequent equivalent refractive index sensing analysis. At this thickness, as the refractive index increases from 1.30 to 1.60, the sensitivities of the low-frequency and high-frequency peaks are 96.43 GHz/RIU and 272.57 GHz/RIU, with goodness of fit values of R2 = 0.9973 and R2 = 0.9949, respectively. The sensitivity of the high-frequency peak is approximately 2.83 times that of the low-frequency peak, making it suitable as the primary detection channel; the low-frequency peak exhibits a weaker response with a stable peak shape, enabling it to serve as a relative reference channel. The dual-peak frequency interval sensitivity is 176.14 GHz/RIU with a goodness of fit value of R2 = 0.9887, which can serve as a relative frequency readout parameter. To verify the stability of the self-referenced readout, this paper further introduces TOPAS-permittivity perturbation simulations. The results show that under ±3% and ±5% permittivity perturbations, the drift of the dual-peak frequency interval, Δf, is consistently smaller than the absolute drift of the high-frequency single peak, f2, with drift suppression ratios ranging from 36.36% to 85.71%, indicating that the dual-peak frequency interval readout can mitigate the influence of common-mode frequency drifts. This study demonstrates that the proposed dual-band self-referenced terahertz metamaterial sensor can respond to equivalent refractive index changes in micron-scale battery-related films, providing a conceptual non-contact detection method for scenarios such as electrolyte residue, moisture contamination, polymer coating variations, and separator surface state changes.
It should be noted that this work remains a numerical simulation and proof-of-concept study; actual complex refractive index testing and experimental verification on specific battery materials have not yet been performed. Future work will combine terahertz time-domain spectroscopy to obtain the complex permittivity of actual battery materials and further validate the application feasibility of this method in electric vehicle battery safety monitoring and material state assessment through real film sample loading, temperature and humidity perturbation tests, and device fabrication experiments.
Author Contributions
Conceptualization, X.P.; methodology, X.P., X.C. and C.W.; software, X.P., R.H. and X.C.; validation, R.H.; formal analysis, X.P.; investigation, X.P.; resources, X.C. and C.W.; data curation, X.P., R.H. and C.W.; writing—original draft preparation, X.P.; writing—review and editing, X.P.; visualization, X.P., R.H. and C.W. All authors have read and agreed to the published version of the manuscript.
Funding
This work was supported by 2026 Annual Project Results of the Hunan Province Social Sciences Achievement Evaluation Committee (No. XSP26YBC711); Hunan Provincial Natural Science Foundation Project (No. 2024JJ7195); Key Scientific Research Project of the Education Department of Hunan Province: Research on Key Technologies of Liquid Biopsy Based on Graphene-Microfluidic Technology and Terahertz Sensing System; and the Construct Program of Applied Characteristic Discipline in Hunan Province.
Institutional Review Board Statement
Not applicable.
Informed Consent Statement
Not applicable.
Data Availability Statement
The original contributions presented in this study are included in the article. Further inquiries can be directed to the corresponding author.
Conflicts of Interest
The authors declare no conflicts of interest.
References
- Jamadar, S.; Singaram, G. Dynamic cell charging and Temperature-Based Redistribution Strategy for battery management in solar electric vehicles. Aust. J. Electr. Electron. Eng. 2025, 1–13. [Google Scholar] [CrossRef] [Scilit]
- Ghazali, A.K.; Aziz, N.A.A.; Hassan, M.K. Advanced Algorithms in Battery Management Systems for Electric Vehicles: A Comprehensive Review. Symmetry 2025, 17, 321. [Google Scholar] [CrossRef] [Scilit]
- Tran, M.-K.; Panchal, S.; Khang, T.D.; Panchal, K.; Fraser, R.; Fowler, M. Concept Review of a Cloud-Based Smart Battery Management System for Lithium-Ion Batteries: Feasibility, Logistics, and Functionality. Batteries 2022, 8, 19. [Google Scholar] [CrossRef] [Scilit] [PubMed]
- Liu, Q.; Wang, X.; Zhu, J.; Jiang, G.; Wei, X.; Dai, H. Experimental Study on Distributed Measurement of Internal Pressure in Lithium-Ion Batteries Using Thin-Film Sensors. World Electr. Veh. J. 2025, 16, 270. [Google Scholar] [CrossRef] [Scilit]
- Sbarra, R.G.; Pasquali, M.; Coppotelli, G.; Gaudenzi, P.; di Ienno, D.; Ciancarelli, C.; Picci, N. Digital Twins for Space Battery Management Systems: A Comprehensive Review of Different Approaches for Predictive Maintenance and Monitoring. Energies 2025, 18, 5858. [Google Scholar] [CrossRef] [Scilit]
- Kim, J.; Jung, G.-B.; Park, D.-B.; Jo, M.; Yu, N.-E.; Son, B.; Oh, P.; Son, Y. Novel Terahertz Spectroscopy Analysis for the Electrode with Carbon Nanotubes (CNTs) in Lithium-Ion Batteries. Energies 2022, 15, 2665. [Google Scholar] [CrossRef] [Scilit]
- O’Hara, J.F.; Singh, R.; Brener, I.; Smirnova, E.; Han, J.; Taylor, A.J.; Zhang, W. Thin-Film Sensing with Planar Terahertz Metamaterials: Sensitivity and Limitations. Opt. Express 2008, 16, 1786–1795. [Google Scholar] [CrossRef] [Scilit] [PubMed]
- Islam, M.; Rao, S.J.M.; Kumar, G.; Pal, B.P.; Roy Chowdhury, D. Role of Resonance Modes on Terahertz Metamaterials Based Thin Film Sensors. Sci. Rep. 2017, 7, 7355. [Google Scholar] [CrossRef] [Scilit] [PubMed]
- Landy, N.I.; Sajuyigbe, S.; Mock, J.J.; Smith, D.R.; Padilla, W.J. Perfect Metamaterial Absorber. Phys. Rev. Lett. 2008, 100, 207402. [Google Scholar] [CrossRef] [Scilit] [PubMed]
- Tao, H.; Landy, N.I.; Bingham, C.M.; Zhang, X.; Averitt, R.D.; Padilla, W.J. A Metamaterial Absorber for the Terahertz Regime: Design, Fabrication and Characterization. Opt. Express 2008, 16, 7181–7188. [Google Scholar] [CrossRef] [Scilit] [PubMed]
- Onreabroy, W.; Piemsomboon, S.; Traikunwaranon, S.; Wilaiprajuabsang, N.; Kaewpradap, A. Enhancing Wireless Power Transfer Efficiency Through Innovative Metamaterial Configurations for Electric Vehicles. World Electr. Veh. J. 2025, 16, 48. [Google Scholar] [CrossRef] [Scilit]
- Hakim, M.L.; Alam, T.; Islam, M.T.; Baharuddin, M.H.; Alzamil, A.; Islam, M.S. Quad-Band Polarization-Insensitive Square Split-Ring Resonator (SSRR) with an Inner Jerusalem Cross Metamaterial Absorber for Ku- and K-Band Sensing Applications. Sensors 2022, 22, 4489. [Google Scholar] [CrossRef] [Scilit] [PubMed]
- Hakim, M.L.; Islam, M.T.; Alam, T.; Abdul Rahim, S.K.; Bais, B.; Islam, M.S.; Soliman, M.S. Triple-Band Square Split-Ring Resonator Metamaterial Absorber Design with High Effective Medium Ratio for 5G Sub-6 GHz Applications. Nanomaterials 2023, 13, 222. [Google Scholar] [CrossRef] [Scilit] [PubMed]
- Wu, X.; Pan, X.; Quan, B.; Xu, X.; Gu, C.; Wang, L. Self-Referenced Sensing Based on Terahertz Metamaterial for Aqueous Solutions. Appl. Phys. Lett. 2013, 102, 151109. [Google Scholar] [CrossRef] [Scilit]
- Zhao, X.; Lin, Z.; Wang, Y.; Yang, X.; Yang, K.; Zhang, Y.; Peng, J.; de la Chapelle, M.L.; Zhang, L.; Fu, W. Label-Free Self-Referenced Sensing of Living Cells by Terahertz Metamaterial-Based Reflection Spectroscopy. Biomed. Opt. Express 2019, 10, 1196–1206. [Google Scholar] [CrossRef] [Scilit] [PubMed]
- Duan, G.; Schalch, J.; Zhao, X.; Zhang, J.; Averitt, R.D.; Zhang, X. Analysis of the Thickness Dependence of Metamaterial Absorbers at Terahertz Frequencies. Opt. Express 2018, 26, 2242–2251. [Google Scholar] [CrossRef] [Scilit] [PubMed]
- Cunningham, P.D.; Valdes, N.N.; Vallejo, F.A.; Hayden, L.M.; Polishak, B.; Zhou, X.-H.; Luo, J.; Jen, A.K.-Y.; Williams, J.C.; Twieg, R.J. Broadband Terahertz Characterization of the Refractive Index and Absorption of Some Important Polymeric and Organic Electro-Optic Materials. J. Appl. Phys. 2011, 109, 043505. [Google Scholar] [CrossRef] [Scilit]
- Nielsen, K.; Rasmussen, H.K.; Adam, A.J.L.; Planken, P.C.M.; Bang, O.; Jepsen, P.U. Bendable, Low-Loss TOPAS Fibers for the Terahertz Frequency Range. Opt. Express 2009, 17, 8592–8601. [Google Scholar] [CrossRef] [Scilit] [PubMed]
- Venugopal, G.; Moore, J.; Howard, J.; Pendalwar, S. Characterization of Microporous Separators for Lithium-Ion Batteries. J. Power Sources 1999, 77, 34–41. [Google Scholar] [CrossRef] [Scilit]
- D’Angelo, F.; Mics, Z.; Bonn, M.; Turchinovich, D. Ultra-broadband THz time-domain spectroscopy of common polymers using THz air photonics. Opt. Express 2014, 22, 12475–12485. [Google Scholar] [CrossRef] [Scilit] [PubMed]
- Kalel, S.; Wang, W.-C. Optical properties of PVDF-TrFE and PVDF-TrFE-CTFE films in terahertz band. Mater. Res. Express 2023, 10, 045304. [Google Scholar] [CrossRef] [Scilit]
- Smith, D.R.; Schultz, S.; Markoš, P.; Soukoulis, C.M. Determination of Effective Permittivity and Permeability of Metamaterials from Reflection and Transmission Coefficients. Phys. Rev. B 2002, 65, 195104. [Google Scholar] [CrossRef] [Scilit]
- Watts, C.M.; Liu, X.; Padilla, W.J. Metamaterial Electromagnetic Wave Absorbers. Adv. Mater. 2012, 24, OP98–OP120. [Google Scholar] [CrossRef] [Scilit] [PubMed]

Disclaimer/Publisher’s Note: The statements, opinions and data contained in all publications are solely those of the individual author(s) and contributor(s) and not of MDPI and/or the editor(s). MDPI and/or the editor(s) disclaim responsibility for any injury to people or property resulting from any ideas, methods, instructions or products referred to in the content. |
© 2026 by the authors. Published by MDPI on behalf of the World Electric Vehicle Association. Licensee MDPI, Basel, Switzerland. This article is an open access article distributed under the terms and conditions of the Creative Commons Attribution (CC BY) license.