


Abstract
An equivalent circuit model (ECM) is a highly practical tool for simulating Li-ion battery behavior. There are many relevant studies which compare different ECM variants or suggest algorithms to extract model parameters from the experimental data. However, little attention has been given to the battery tests used for identification of the ECM parameters. Therefore, here the influence of experimental test pulse characteristics on the parameterized ECM accuracy was systematically studied. The test pulse duration was varied in a wide range from 9 s to about 2.5 min. The portion of the relaxation phase data used by the parameter optimization algorithm was also varied in an even wider range. Total 168 ECM parameter sets were obtained. Each parameter set was validated using nine diverse current profiles representing different battery operation conditions, including one based on Urban Dynamometer Driving Schedule (UDDS). The validation results prove that the impact of the test pulse choice on the parameterized ECM accuracy is great to the point that it can overshadow the use of a higher-order Thevenin model. By choosing the optimal parameter set, the simulated voltage root mean square error (RMSE) was reduced to as low as 3.0 mV and 1.2 mV for first- and second-order ECM, respectively, while the second-order model based on arbitrary chosen test pulse on average yields RMSE value above 5 mV.
1. Introduction
Accurate estimation of state of charge (SoC) and state of health (SoH) is crucial for the efficient and safe operation of lithium-ion (Li-ion) batteries in applications such as electric vehicles, portable electronics, aviation, and stationary energy storage systems [1]. Battery Management Systems (BMS) rely on mathematical models to estimate the battery state. An accurate digital Li-ion cell model is also a useful tool for battery pack design and engineering as it can significantly accelerate the design process by enabling virtual experiments and testing. The choice of the most suitable model faces a fundamental trade-off between the model accuracy and its complexity and computational burden, as many applications imply real-time simulations relying on limited on-board computational resources. From a practical perspective, there is another factor—how difficult it is to identify all the required model parameters.
There are three main types of Li-ion battery models: electrochemical models, equivalent circuit models, and data-driven models. The electrochemical models implement an ab initio approach by explicitly taking into account physicochemical processes taking place within an electrochemical cell operation (ions diffusion, charge transfer, reaction kinetics) [2,3]. Such models enable deep analysis of the design–performance relationships and therefore are useful for research and development at the cell level. However, the computational complexity of such models makes them hardly applicable for BMS use and battery pack engineering (since it involves simulations of dozens and hundreds of cells) [4].
Equivalent circuit models (ECM) and data-driven models both use an empirical approach, aiming to predict battery behavior without explicitly modeling the internal processes. The relatively new and promising data-driven models are based on machine learning methods and, potentially, are able to capture complex non-linear dependencies between the input and output signals of the system [5,6]. However, the data-driven models are quite complex to tune and run, usually require an extensive training data set, and may fail badly outside the conditions phase space covered by the training set. Therefore, relatively simple ECMs are the most widely used in BMS and battery design applications.
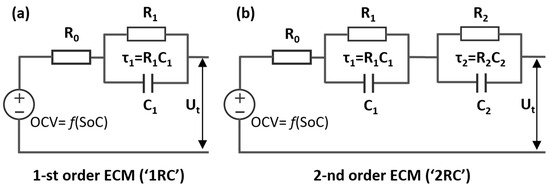
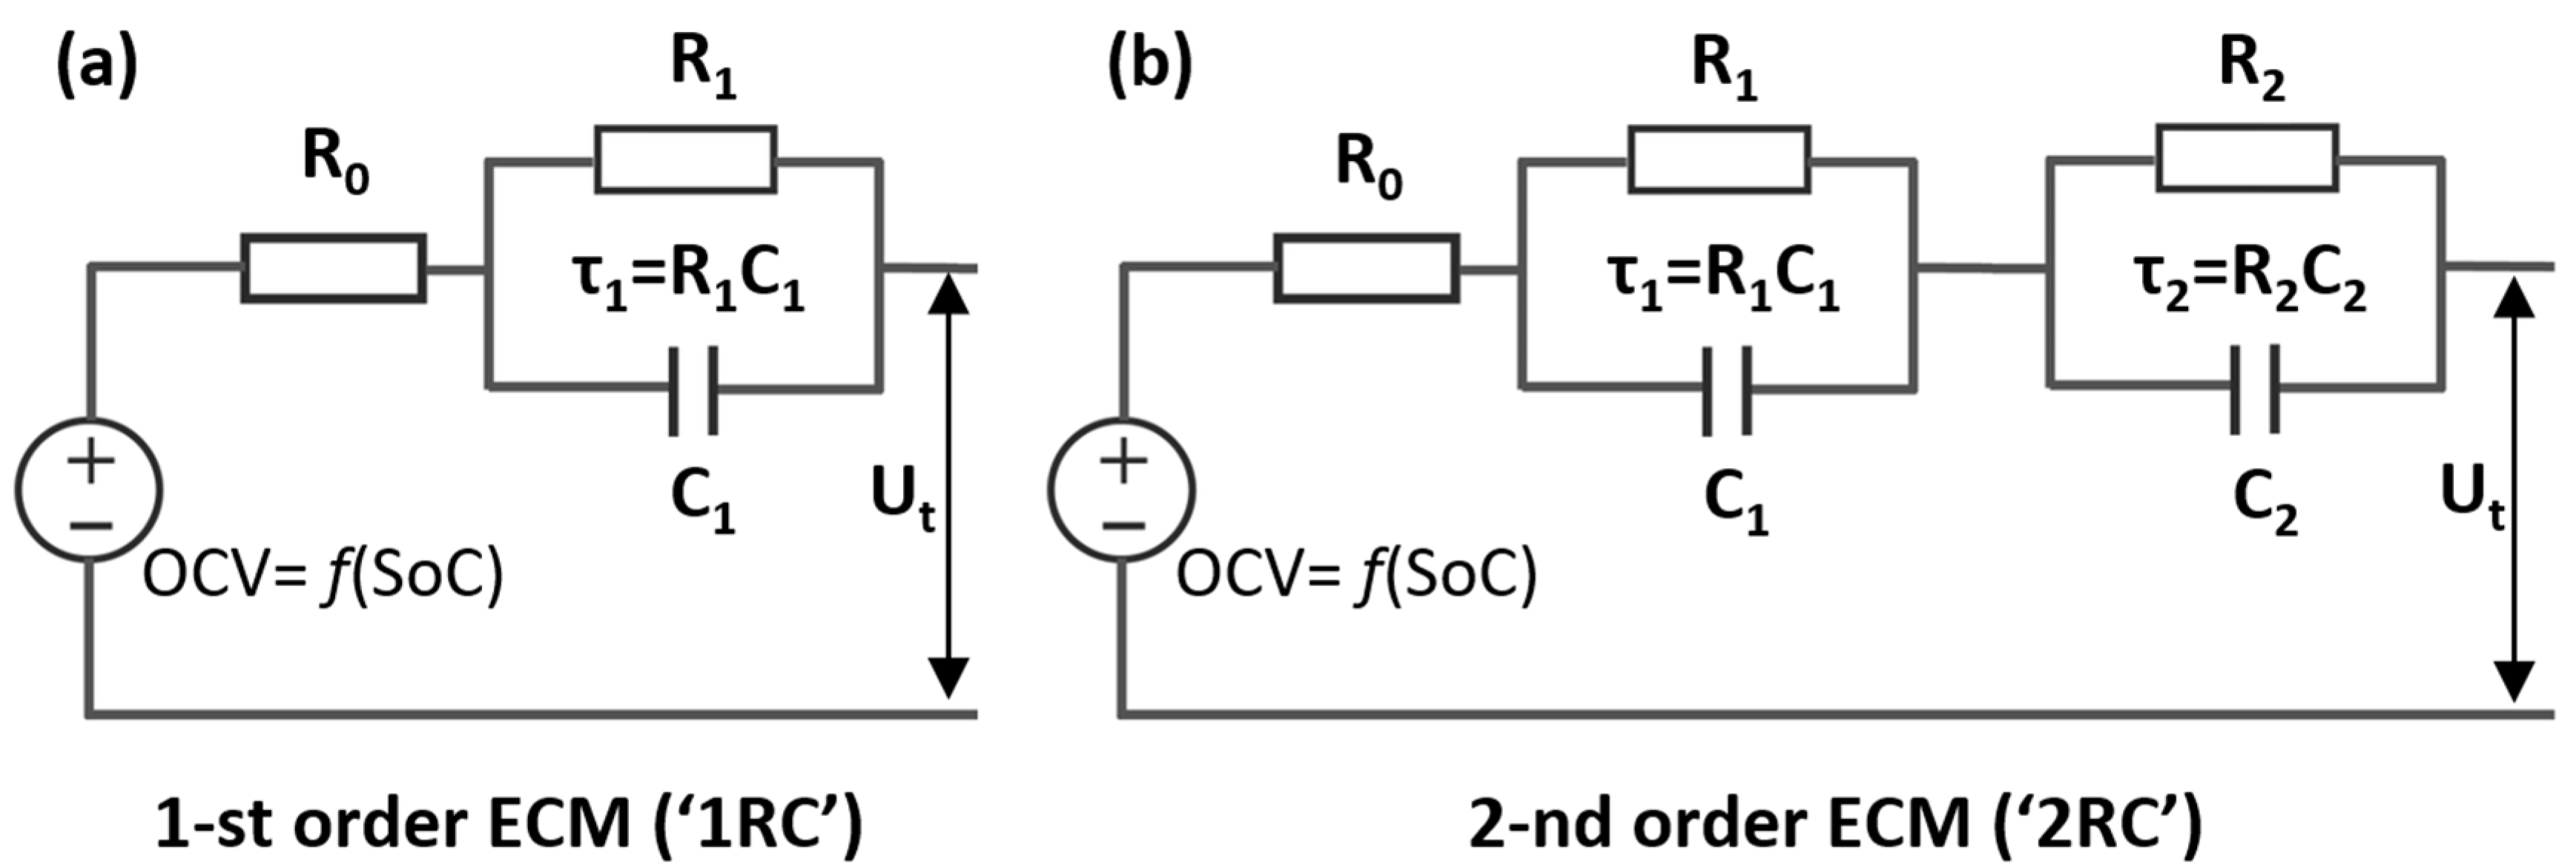
An ECM describes the Li-ion cell as an electric circuit consisting of few components. A Thevenin model is one of the most commonly used ECMs. It consists of a voltage source (open-circuit voltage, OCV), a series ohmic resistance (R0), and a number of resistance-capacitor (RC) pairs that model dynamic polarization [1,7] (see Figure 1). The order of the ECM defines the number of the included RC branches. A relatively simple model design provides several advantages: ease of implementation, low computational load, and physical intuitiveness. The latter means that the parameters of the circuit components can be correlated to the physical parameters of a real electrochemical cell (e.g., electrode surface resistance and ion diffusion coefficients).
Figure 1.
Thevenin equivalent circuit models: (a) first order (‘1RC’); (b) second order (‘2RC’).
Cell voltage relaxation in response to a sudden current change results from multiple dynamic processes with different time scales, such as electric double layer charging, electrolyte diffusion, and solid-phase diffusion [8]. A first-order ECM effectively captures the main dynamic characteristics of the battery response, requiring minimal computational efforts, while only one time-constant identification is required. This model is widely used in industrial applications due to its reliability and ease of parameterization [9,10]. However, it is inherently unable to provide high accuracy. A second-order Thevenin model enables a more accurate approximation of the cell voltage dynamics by separating fast (high-frequency) and slow (low-frequency) transient processes. The first RC branches are often associated with the electric double layer charging process, and the second one—with the solid-phase diffusion [8,11,12]. Therefore, the second-order models are assumed to be significantly more accurate than the first-order models, while maintaining acceptable computational complexity.
Higher-order ECMs (3rd and above) can hypothetically provide even higher accuracy. However, a comparison study has shown that the second-order ECM yields the lowest error [7]. The possible reason is that the identification of the additional parameters describing the extra RC branches makes the results unstable because of the risk of overfitting and difficulties in separating processes with similar time constants. A critical problem highlighted in [13] is the ambiguity in parameter identification: the same voltage transient response can be approximated with equal accuracy by several different sets of ECM parameters. That makes the results of high-order ECM parameterization highly dependent on the chosen algorithm and initial approximations, and consequently, unpredictable and poorly interpretable. Thus, the high-order ECMs are impractical for most applications.
The accuracy of any ECM critically depends on the correct identification of its parameters (R0, R1, τ1, R2, τ2), which, in turn, non-linearly depend on the cell state of charge, operation temperature, and state of health [14,15,16]. In recent years, machine learning methods have gained prominence in identifying ECM parameters lithium-ion batteries. Recently, Ho et al. [17] proposed a deep-learning method that uses time-series of voltage response to a current pulse to identify ECM parameters. The authors provide a comparison study of one-dimensional convolutional neural network (1DCNN), gated recurrent unit (GRU), long short-term memory (LSTM), recurrent neural networks (RNN), and temporal convolutional networks (TCN) algorithms. Leonori et al. [18] proposed an ensemble of neural networks aligned with a switched ECM, achieving up to 50% improvement in voltage prediction over traditional methods (Switched ECM incorporating separate charge and discharge resistances was earlier introduced by Baccari et al. [19]). These studies illustrate the growing potential of ML-enhanced ECMs for robust online parameter estimation and SoC tracking. Nevertheless, traditional ECM identification techniques, such as least squares fitting, remain relevant due to their reliability, transparency, and ease of implementation.
The most common and practical approach to ECM parameterization is based on the analysis of the voltage response to rectangular current pulses, for example, tests using the Hybrid Pulse Power Characterization (HPPC) technique [20]. There are different ways to extract the model parameters from the cell voltage response to the test pulse [21]. Three typical pulse-based methods of offline ECM parameterization are described and compared in [22]. Some authors employ simple analytical equations [11,23] to derive the model parameters based on the cell voltage values at specific moments of the test. Such deterministic point-based approach is excellent for quick parameters estimation and can provide a good initial guess for other more complicated iterative parametrization algorithms. As the information is extracted from only a few experimental points, the approach has severe drawbacks: low accuracy and strong dependence of the results on the points selection.
More often, researchers employ fitting procedures based on least squares algorithms that iteratively adjust the parameters to minimize the difference between the measured voltage and the model prediction. Some of the recent examples are [24,25,26,27]. This approach fully utilizes the information present in the provided experimental data segment. Apart from the least squares algorithms, there is a wide variety of other optimization methods employed for ECM parametrization. Those can be roughly divided into following categories [21]: swarm-based algorithms (e.g., particle Swarm Optimization [28,29] or Gazelle Optimization Algorithm [30]), evolutionary algorithms (e.g., Genetic Algorithm [31]), trajectory-based algorithms (e.g., Simulated Annealing [32]), and hybrid methods. In spite of the great diversity of the optimization algorithms, in most of the cases the objective function is the same—the ECM terminal voltage root means square error (RMSE) or a closely related value. In other words, different mathematical tools are used to solve the same problem—minimizing the difference between the measured cell voltage and the simulated voltage values across the segment of experimental data provided to the optimization algorithm. Thus, the performance of all of these methods would depend on the characteristics of the experimental data segment in a similar way.
Distinguishing of fast and slow dynamics contributions to the cell voltage response is a more intriguing problem from the physical point of view as it connects the ECM parameters to the physicochemical process within the Li-ion cell. Several methods were suggested to explicitly separate the fast and slow relaxation modes. Some of them are based on the electrochemical impedance spectroscopy techniques (EIS) [33], while the others utilize pulse-based tests [13,34,35]. Generally, these studies confirm that excitation of different transient processes depends on the test pulse duration.
However, numerous studies employing pulse excitation techniques (such as HPPC, GITT, DST) for the model parameterization groundlessly select the durations of the test pulse and the following relaxation phase. There is a wide scatter of the test pulse duration values: 1 s [36], 5 s [37], 10 s [37,38,39,40], 18 s [41], 20 s [37,42], 30 s [43], 45 s [13], 60 s [43], 90 s [12,44], 180 s [13,44,45], 360 s [13,44,46], 720 s [47], and 900 s [48]. The length of the post-pulse relaxation segment processed by the parameter identification algorithm is also scattered widely or is not even stated clearly in many sources.
Little attention was given to the investigation into how the characteristics of the test pulse (i.e., amplitude and duration) affect the reliability of the parameterization process and, consequently, the accuracy of the model. Few studies have taken effort to compare different test pulses. However, they are limited to a very small number of combinations of test conditions (e.g., four [49] and five [44]). A notable exception is a systematic study of HPPC test parameters provided in [37]. It includes variation in test pulse amplitudes, pulse duration, and the pause duration between the negative and positive pulses. The Taguchi design of experiments was employed to reduce the number of the required HPPC test configurations down to 16. Unfortunately, the explored pulse durations were within a short range from 5 s to only 20 s, which does not cover the slow relaxation modes.
Based on the conducted literature overview, it can be concluded that researchers employ various test pulses to perform ECM parametrization, often without justifying their choice. Notably, the duration of the test pulse used for this purpose varies widely, ranging from 5 s to several minutes. An even greater uncertainty exists in respect to the length of the relaxation data segment. Thus, despite the abundance of the relevant publications, there is clearly a research gap, as it still remains unclear what are the optimal characteristics of the experimental data for ECM parameterization and to what extent they influence the accuracy of the resulting model.
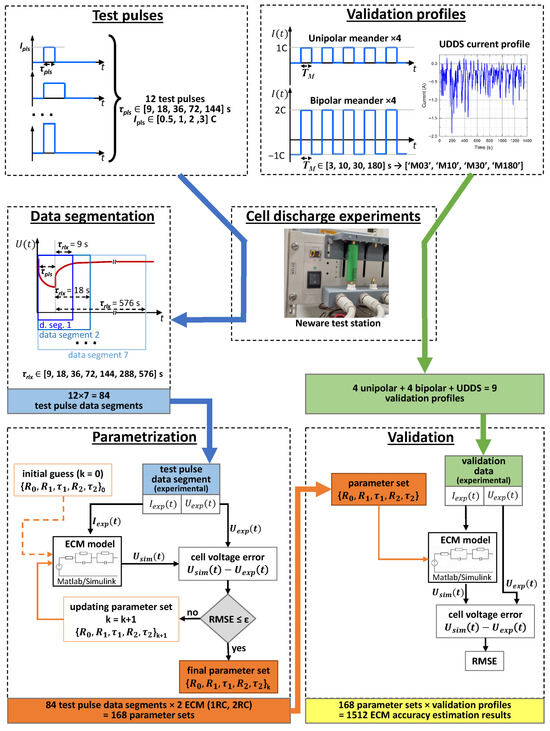
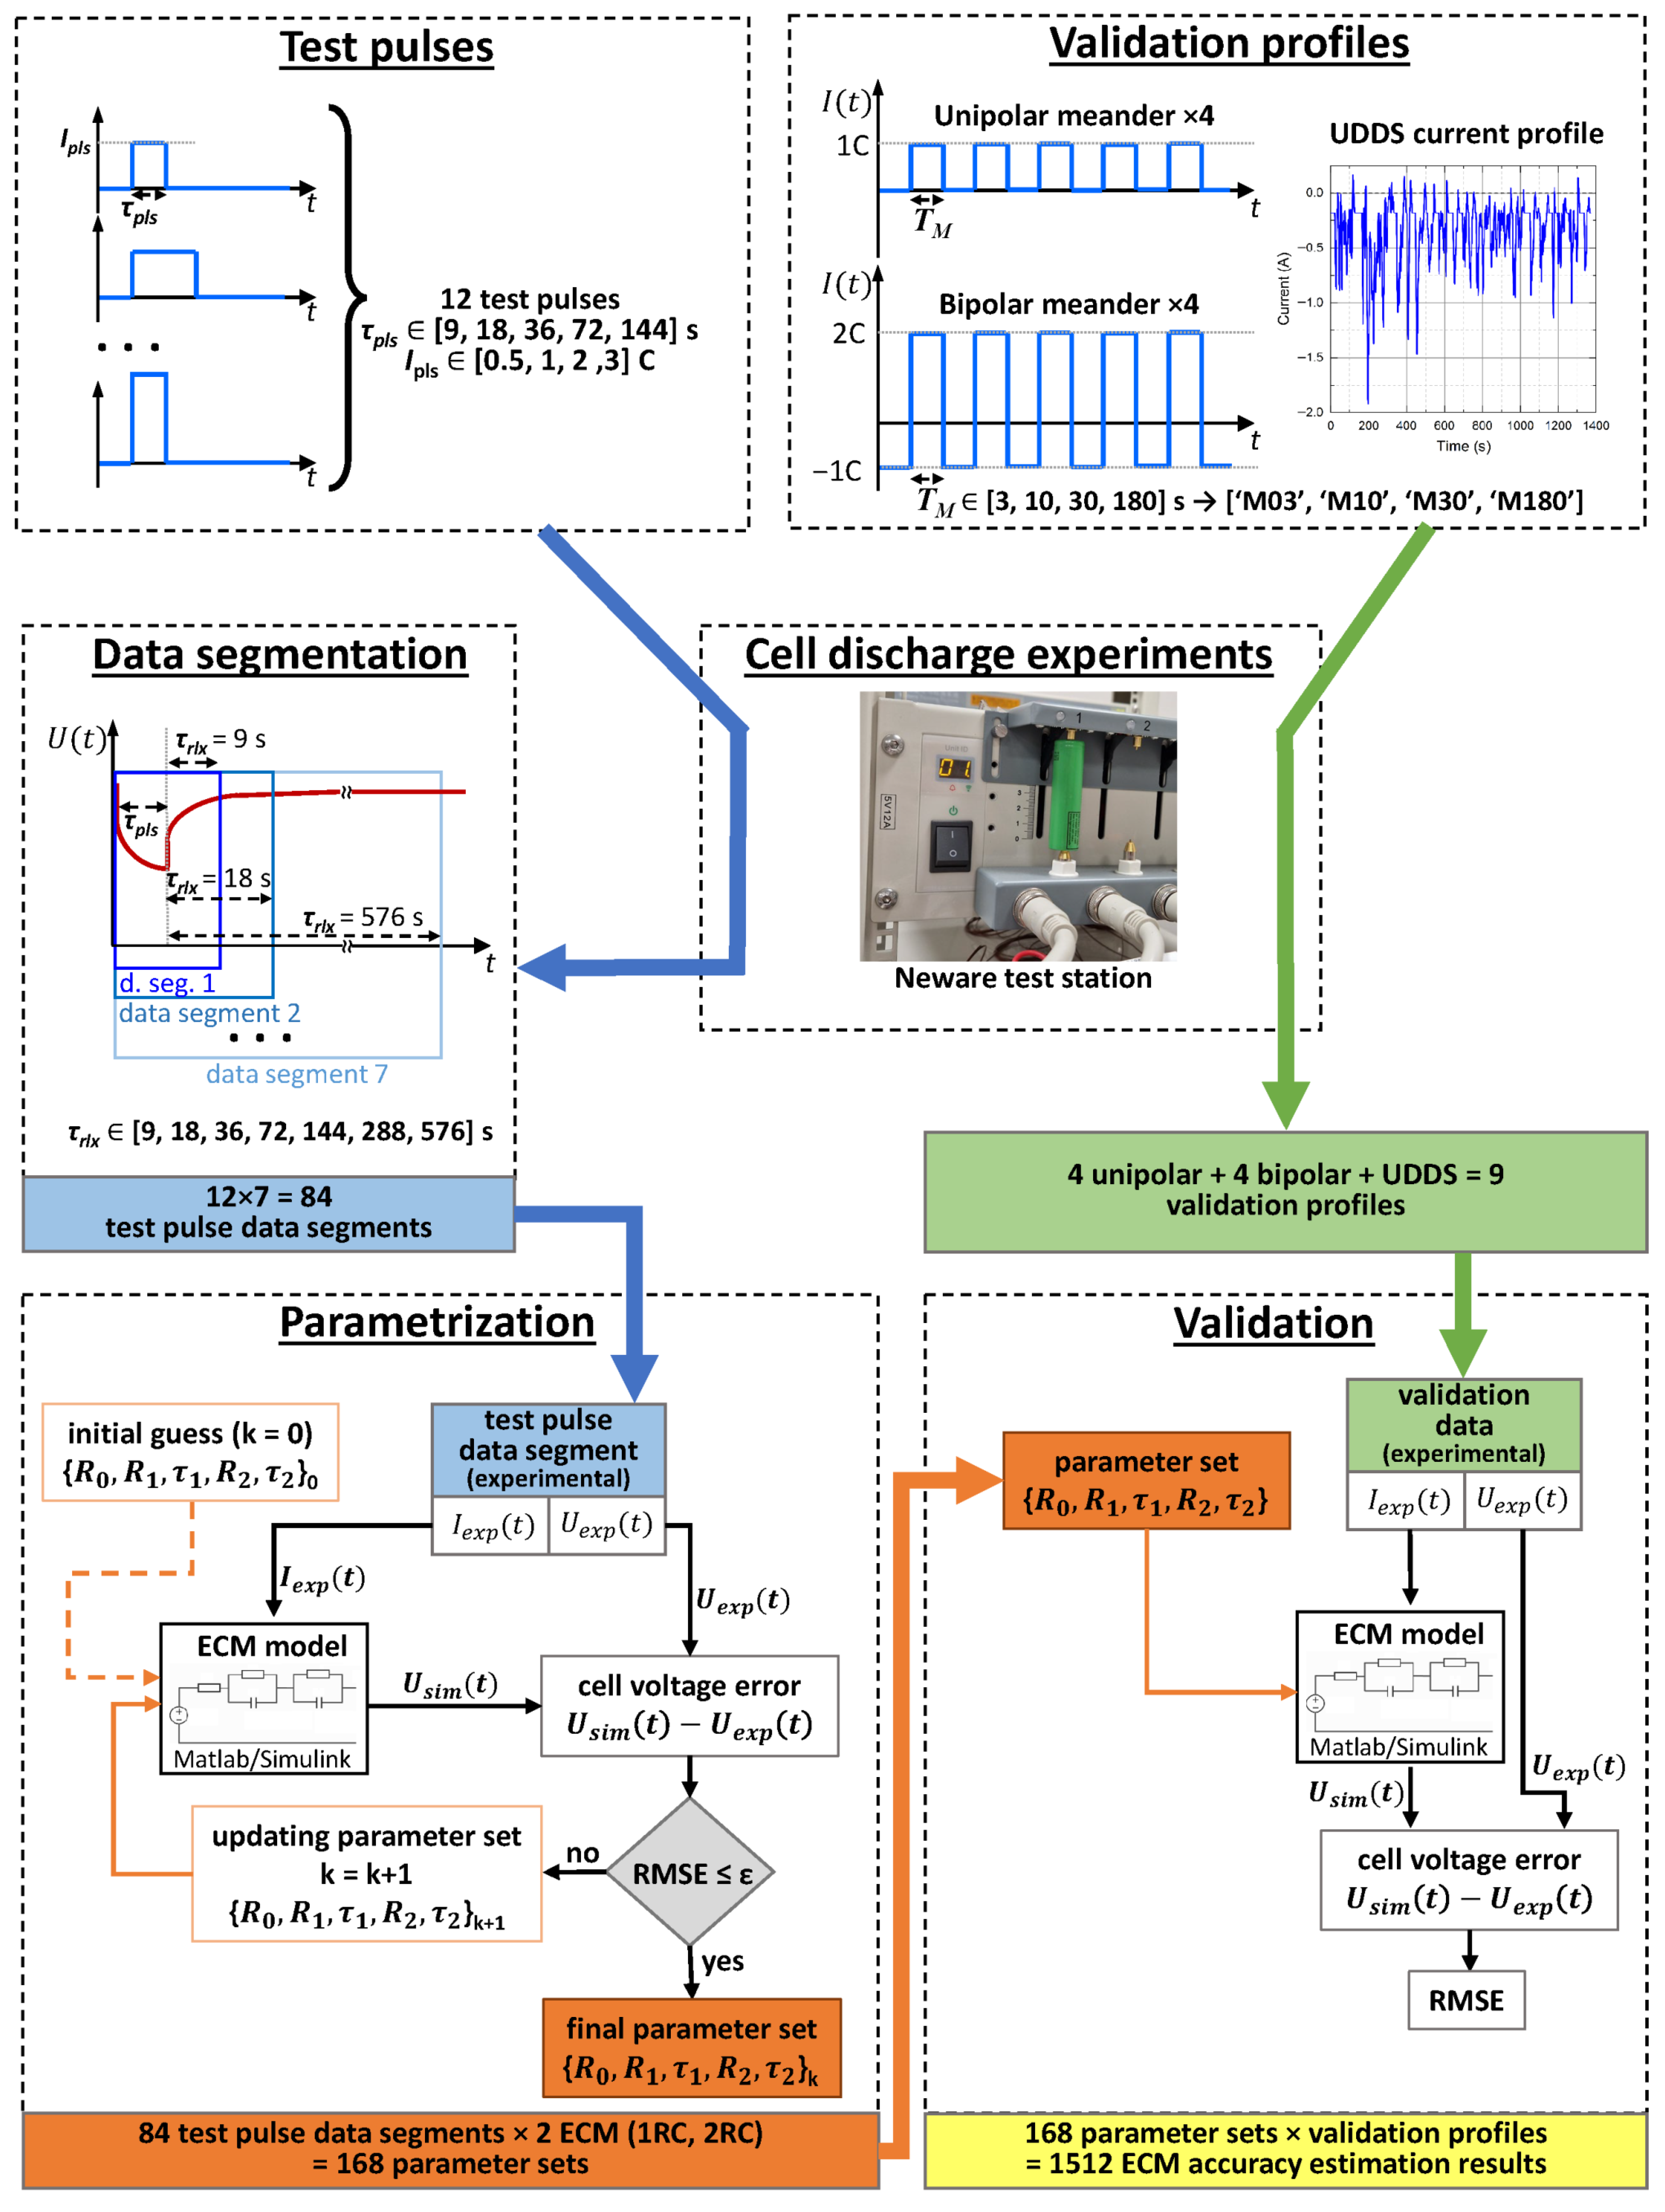
The goal of the current study is to systematically investigate the impact of the test pulse characteristics and the length of the processed relaxation data segment on the accuracy of the Thevenin model conditioned by the identified set of parameters. The general workflow is illustrated in Figure 2 (see Section 2 for details). The ECM parametrization was performed using 12 experimental data sets based on test pulses characterized by different combinations of pulse duration τpls and pulse current Ipls. Two models were parametrized for each data set: 1RC and 2RC (see Figure 1). For a specific test pulse and a selected model, seven parameter sets were obtained by varying the length of the relaxation data segment (τrlx) processed by the parameter fitting algorithm. That yielded 12 × 2 × 7 = 168 parameter sets. In contrast to the available literature data, the extended number of parametrization condition combinations and a wider range of the test pulse duration values enabled us to perform a systematic search for the optimal parametrization conditions. The accuracy of the models was evaluated for each parameter set using experimental data produced for nine different validation profiles, so that the final analysis is based on a total of 1512 individual results. All the generated experimental data including both the test pulses used for ECM parameterization and the validation profiles were made publicly available (see Data Availability Statement). In order to automate mass-scale ECM parameterization/validation and manage the large number of the obtained results, a special set of MATLAB function was developed. It is organized as a class “TEVP” (Thevenin Parameterization) and was made publicly available [50] (see also Data Availability Statement for a direct link to the source code).
Figure 2.
A schematic illustration of the workflow.
In the course of the study it was found that the optimal test pulse characteristics depend on the cell operation regime. Nevertheless, general trends were deduced that favor a longer test pulse duration. By simultaneously tuning the test pulse and relaxation data segment length, it became possible to reach an excellent accuracy of both the first- and second-order ECMs when validated against a realistic current profile typical for the electric vehicle application.
2. Methods
2.1. Theoretical Background
Based on the literature data, two equivalent circuit models were selected for the study, which are first-order (‘1RC’) and second-order (‘2RC’) Thevenin models, as depicted in Figure 1. Besides OCV-SoC dependence, these models require the identification of 3 and 5 SoC-dependent parameters, respectively. Namely, serial resistance R0, polarization resistances R1 and R2, RC-branches time constants τ1, τ2.
For the second-order Thevenin model, the terminal voltage of the cell under a given current excitation can be written as
where ) is the open-circuit voltage, and , denote the voltages across the first and second RC branches, respectively. The dynamics of the RC branches are described by the following first-order linear differential equations:
with τk = (k = 1, 2), where is the capacitance of the corresponding polarization branch.
Response to a Constant-Current Pulse
Consider first the response of a single RC branch (i.e., 1RC ECM) to a constant current pulse excitation, = for 0 < t < and = 0 otherwise. Assuming , the solution during the pulse (0 < t < ) is
with maximum possible polarization voltage being reached at . In case of very short pulse, the RC branch does not have enough time to fully charge, and its contribution to the overall terminal voltage remains small. By analogy, in a lithium-ion cell, electrochemical processes associated with large time constants (inert, slow modes, e.g., solid phase diffusion) are not sufficiently excited by current pulses that are much shorter than characteristic time of the process.
After the current is switched off at t = , i.e., = 0 for t > , the voltage across the considered RC branch relaxes according to
In the case of a 2RC ECM, the total polarization voltage is given by the sum of two exponential contributions
assuming τ1 < τ2, soon after the end of the pulse , both exponent terms contribute to the measured voltage; however, the voltage time derivative is dominated by the ‘fast’ polarization mode . On the other hand, after a longer relaxation period , the ‘fast’ mode decays as → 0, and the observed relaxation is dominated by the ‘slow’ mode .
This analysis implies that both the duration of the excitation pulse and the time window of the relaxation segment () used in the parameter identification procedure control the relative contributions of the fast and slow modes in the experimental data. Small and values emphasize fast processes, whereas larger and values bring more informative about slow polarization dynamics. These considerations are consistent with the discussion presented in work [13], which develops a reliably protocol for separation of multiple dynamic modes of lithium-ion battery response.
2.2. General Concept of the Study
The study was designed to answer the following general question: how do the characteristics of the experimental test pulse data affect the accuracy of the parameterized equivalent circuit model? A detailed workflow scheme is provided in Figure 2. A series of Li-ion cell discharge experiments was performed to obtain two data pools: one was used for ECM parameterization, the other was used for model validation. Each parameterization experiment included single rectangular current pulse and a following long relaxation period. The pulse amplitude and duration were varied, resulting in 12 different combinations. For each parametrization data set, the relaxation portion of the data was truncated at seven different cutoff values (τrlx)—see “Data segmentation” block in Figure 2. The resulting data segments of different lengths were forwarded to the ECM parameter optimization algorithm based on minimization of the voltage error (RMSE). The obtained ECM parameter sets were validated by calculating the RMSE between the model’s voltage response to a validation current profile and the measured voltage profiles from the validation data pool. Nine different validation profiles were employed to estimate ECM accuracy across various cell operation scenarios. The parameterization and validation phases were performed for two ECM variants: 1RC and 2RC. The rest of this section contains a detailed description of the procedures presented in Figure 2.
2.3. Measurements Setup and Procedure
The experimental measurements were performed using a Neware CT-4008Tn-5V12A-S1 test station on a 3500 mAh LG INR18650 MJ1 Li-ion cell. The procedure started with an initial capacity verification cycle to precisely determine the reference capacity. Subsequently, the open circuit voltage (OCV) versus state of charge (SoC) relationship was characterized using two methods: a low-rate (C/20) full cycle and an incremental step discharge test (5% SoC steps) with prolonged relaxation periods to record the equilibrium voltage at each point. According to the low-rate discharge measurements, the cell capacity is 3.36 ± 0.01 Ah; therefore, later on, the current value of 1 C is equal to 3.36 A.
Following the OCV-SoC calibration, pulse tests were performed within a mid-range SoC window (55, 50, 45%) to generate data for ECM parameterization. At least 3 h rest periods were introduced before each pulse to ensure equilibrium initial sate. The validation data sets were obtained by continuously discharging the cell from 55% to 45 SoC according to each of the 9 validation profiles described below. All experiments were carried out in a controlled temperature environment of 27 ± 3 °C.
2.4. Parametrization Procedure
In all cases, the ECM parameters were identified by processing the cell voltage response to the test pulses. The identification was performed for three SoC values: 55%, 50%, and 45%. It is well known that the Li-ion battery OCV demonstrates the most rapid changes near the fully charged and discharged states. Therefore, model parametrization within high and low SoC ranges requires more SoC points. However, in real-life scenarios, batteries operate in the middle SoC range most of the time. Thus, the study is focused on the middle SoC range in order to reduce the number of experiments and avoid sharp parameter changes typical for high and low SoC while investigating the fundamental trends.
As the current study implies generation and validation of large number of parameters sets (more than a thousand of individual validation results), a set of MATLAB (version R2024a) scripts (‘TEVP’) were developed by the authors to automate the procedure and manage the results data base [50] (TEVP itself does not implement any parameterization algorithm, but helps to run calculations and organize the data). A table-based Thevenin Li-ion cell model implemented in the MATLAB Simscape software package was used to simulate cell operation. The parameter identification was carried out by minimizing the cell voltage root mean square error (RMSE):
where Usim[k] is the simulated terminal voltage at the k-th discrete time point, Usim[k] is the measured (experimental) terminal voltage, n is the total number of points within the considered data segment. A non-linear least squares solver using Trusted Region Optimization algorithm was employed for ECM parameters optimization. The robustness of this algorithm was proved in [42]. However, other RMSE minimization-based algorithms could be used for the purpose of this study. The optimization stopping criteria was RMSE < 0.3 mV.
The experimental data segment used for parameter identification consisted of a current test pulse (duration τpls) and the initial segment (duration τrlx) of the following relaxation period, so the total duration of the processed experimental data segment was (τpls + τrlx). It should be noted that the overall relaxation period length was 3 h in order to ensure that the cell had reached the equilibrium state before exerting the next test pulse. However, the relaxation data were cut to τrlx before the parameter identification. This limitation was imposed as even small voltage error at an hour-timescale can overshadow the contribution of the transient processes of interest to the total RMSE value, which is the target value of the minimization algorithm. The impact of the relaxation data cutoff on the parameterization results was studied by varying τrlx in the range of 9, 18, 36, 72, 144, 288, and 576 s.
2.5. Test Pulse Set
In the current study, two parameters of a test pulse were varied: test pulse duration τpls and test pulse current amplitude Ipls. The complete set of the total of 12 combinations considered is presented in Table 1. The current amplitudes are expressed in C-rates, where 1 C corresponds to 3.36 A according to the measured cell capacity. The widely used approach to the battery ECM parameterization implies that the parameters are identified locally with respect to the SoC. Therefore, the test pulse duration and current are limited by the requirement for a small SoC change. The combinations [144 s/0.5 C] and [72 s/1 C] yield a change in SoC 2% that was considered a reasonable upper limit.
Table 1.
The set of test pulses adopted in this study characterized by the pulse duration and amplitude.
2.6. Validation Profiles
For validation of the obtained ECM parameter sets, a total of 9 validation current profiles were used, including 8 meander-like profiles and 1 profile based on the Urban Dynamometer Driving Schedule (UDDS) driving cycle [51]. The shapes of the meander-like validation profiles are presented in Figure 2. The meander period (TM) was set to 3, 10, 30, and 180 s in order to represent battery operation modes characterized by different power consumption time scales. These profiles are labeled below as ‘M03’, ‘M10’, ‘M30’, and ‘M180’, respectively. The mean current value was equal to 0.5 C, so that the average discharge rates are the same for all meander-like validation profiles. However, 4 profiles are unipolar, i.e., include only negative (discharge) current pulses and rest periods, while the other 4 profiles are bipolar, i.e., consist of alternating negative and positive (charge) current pulses. The bipolar profiles represent energy recuperation typical for electric vehicle applications and energy buffering operation mode typical for the grid applications. The ninth UDDS-based validation profile models the electric vehicle battery current demand profile. In contrast to the meander-like profiles, it has irregular shape close to the real-world scenario. It should be noted that the average discharge rate of the UDDS profile is 0.1 C. Therefore, the model error values yielded by the UDDS profile validation should not be compared directly to the error values yielded by the meander profiles validation.
2.7. Udds Profile Adaptation
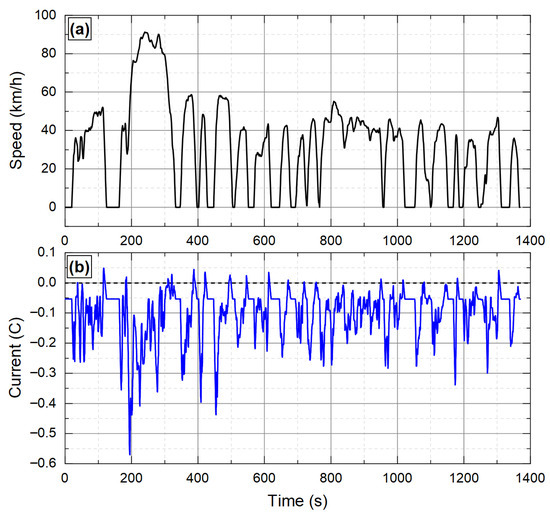
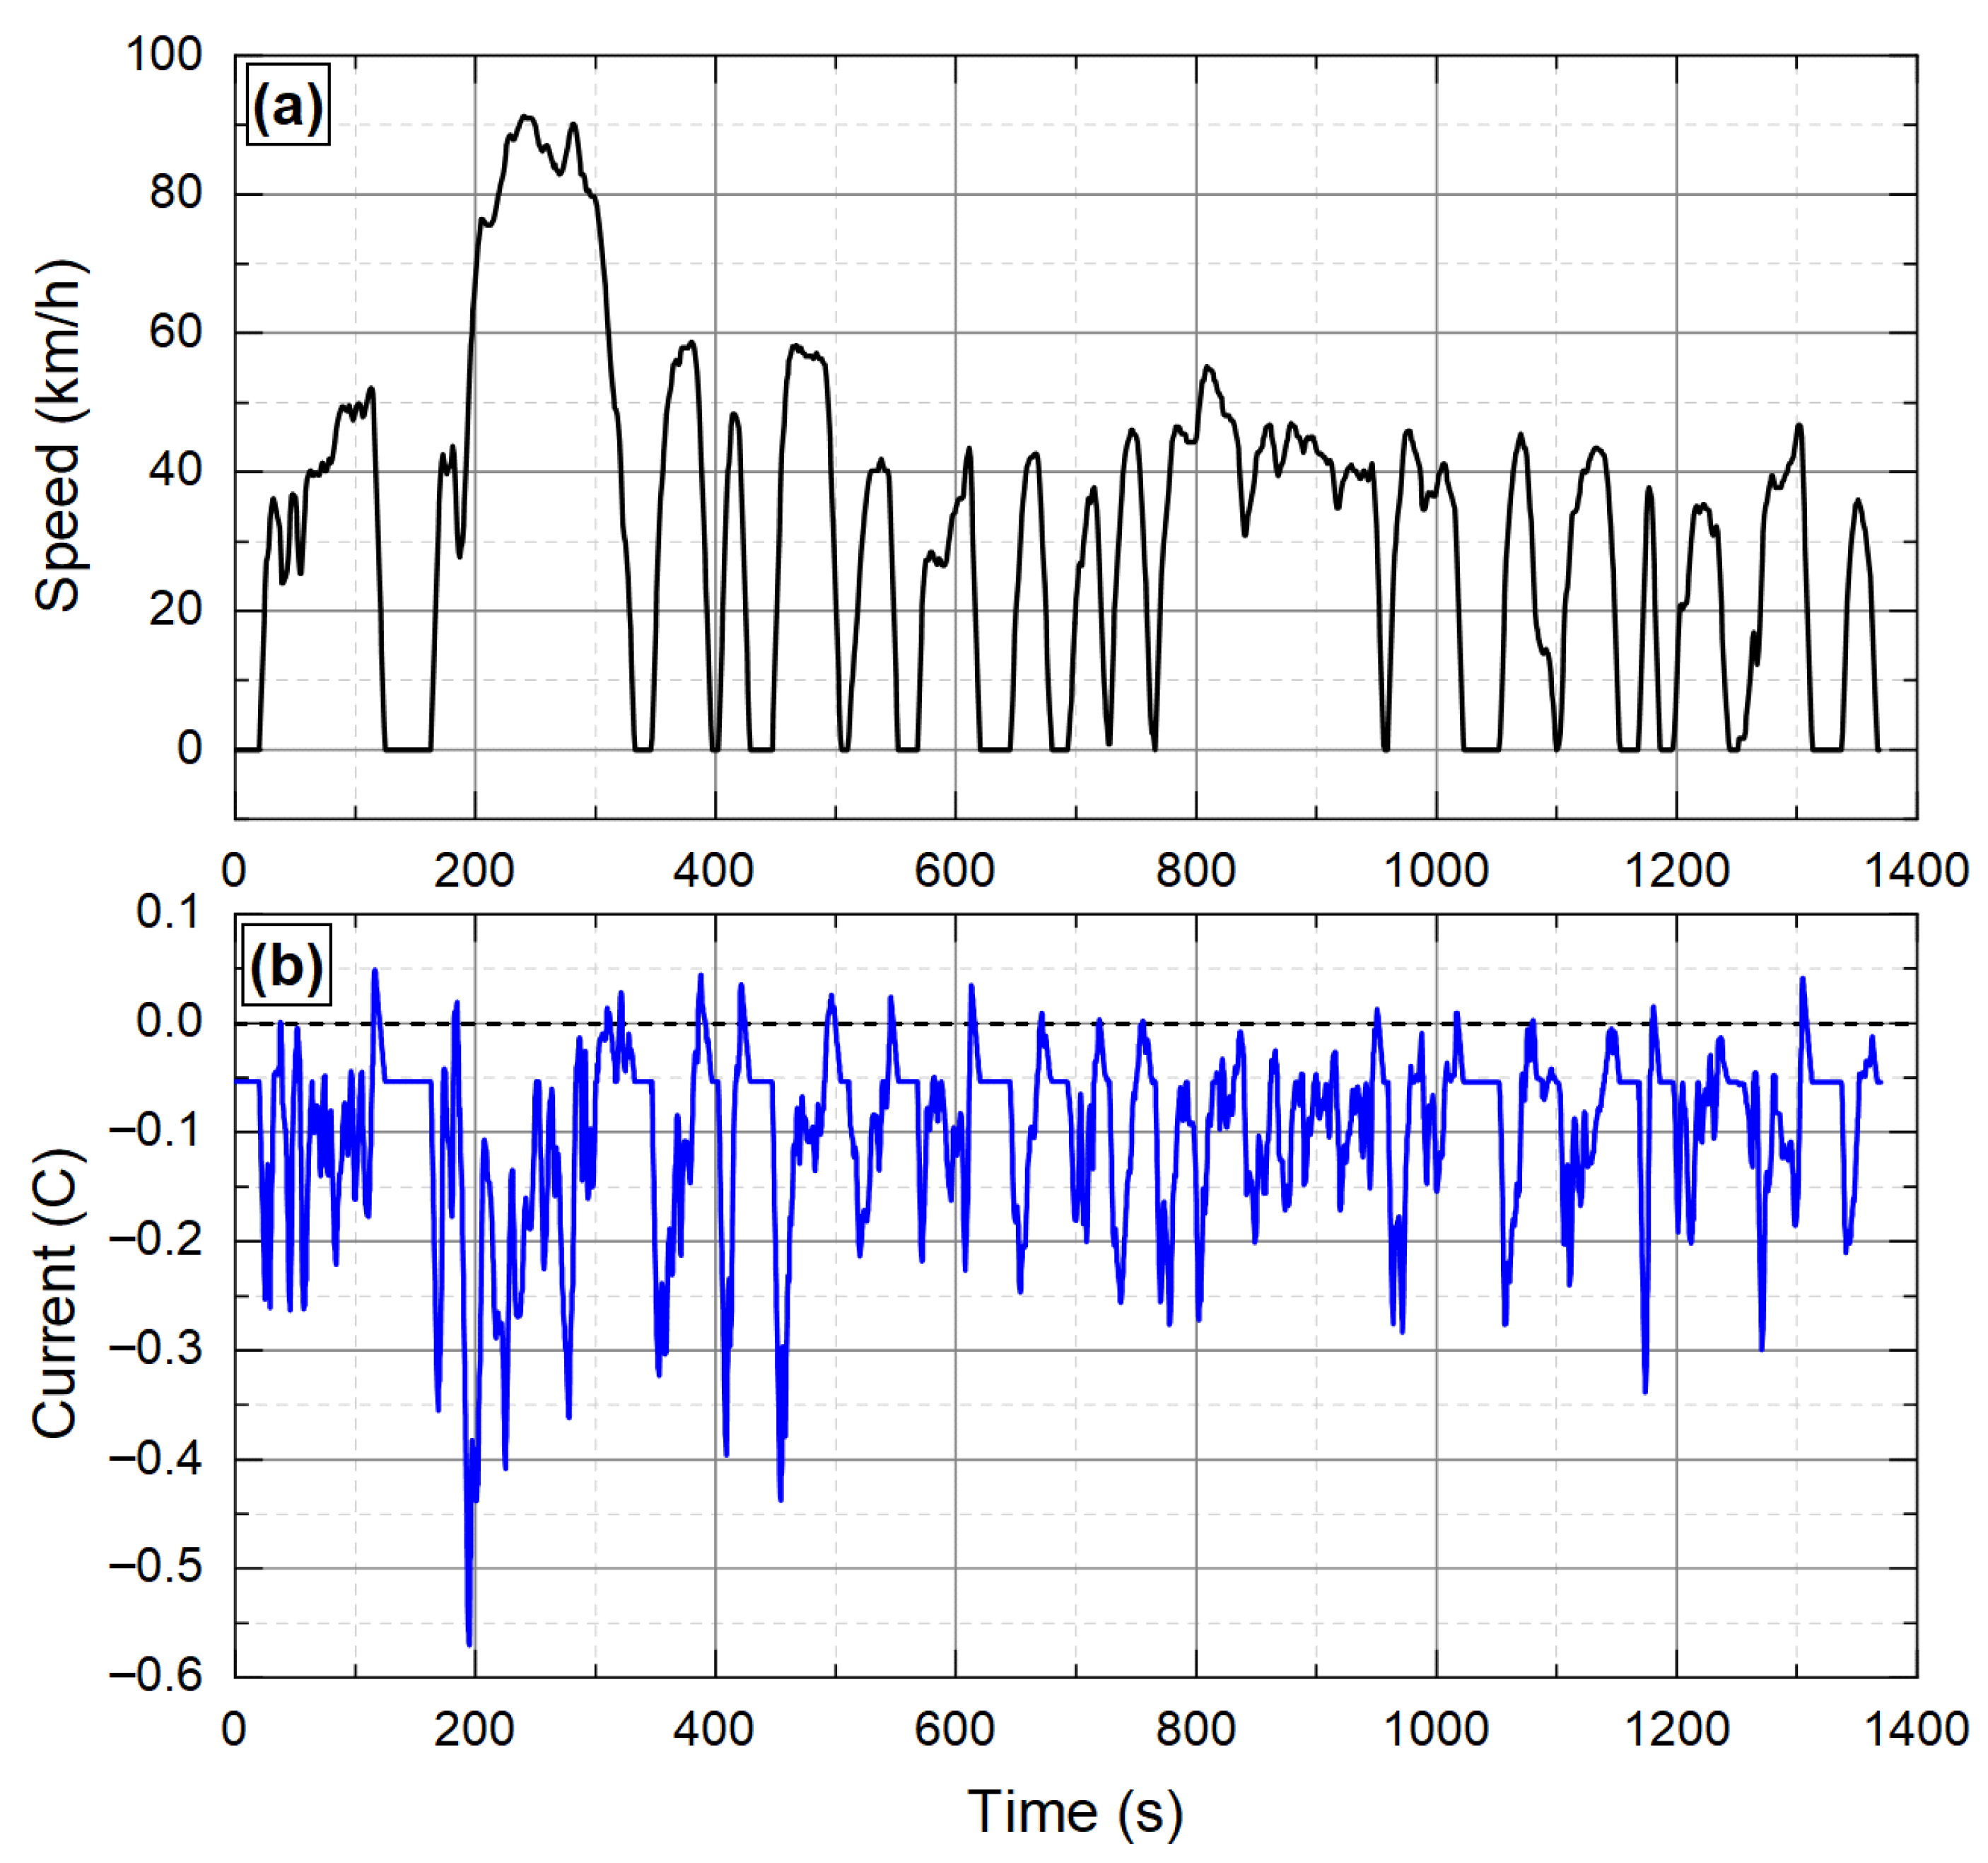
To convert the Urban Dynamometer Driving Schedule (UDDS) speed profile into a battery current profile, a model of an electric vehicle powertrain described in works [52,53] was implemented using AMEsim software (v2404). This approach takes into account the vehicle’s dynamic characteristics, including various resistive forces: aerodynamic drag, rolling resistance, inertia force, and gravitational component on slopes. The UDDS speed profile (Figure 3a) [51] served as an input signal for the electric vehicle model. The power required to maintain the specified speed at the wheels was calculated by the mechanical part of the model and passed to the power conversion part of the model (electric motor, inverter, etc.), which yielded battery power consumption . The battery current was calculated as , where is the battery voltage. The was set as a constant to simplify the calculations at this stage (nominal cell voltage 3.63 V). For the main ECM simulations, the current profile was used instead of the power profile because the cycler controller software worked directly with the current values. The current values were scaled to a single cell.
Figure 3.
(a) UDDS driving cycle velocity profile; (b) the cell current profile used to perform UDDS validation experiment.
The obtained current profile (Figure 3b) preserves all characteristic features of the original UDDS driving cycle: acceleration phases, steady driving, braking, and recuperation (charging current). This ensures an adequate assessment of the ECM performance under conditions close to real electric vehicle operation.
3. Results and Discussion
3.1. ECM Ordder
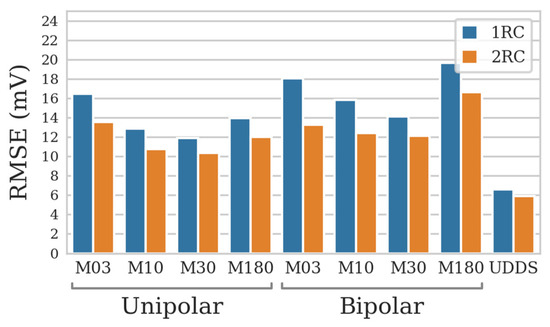
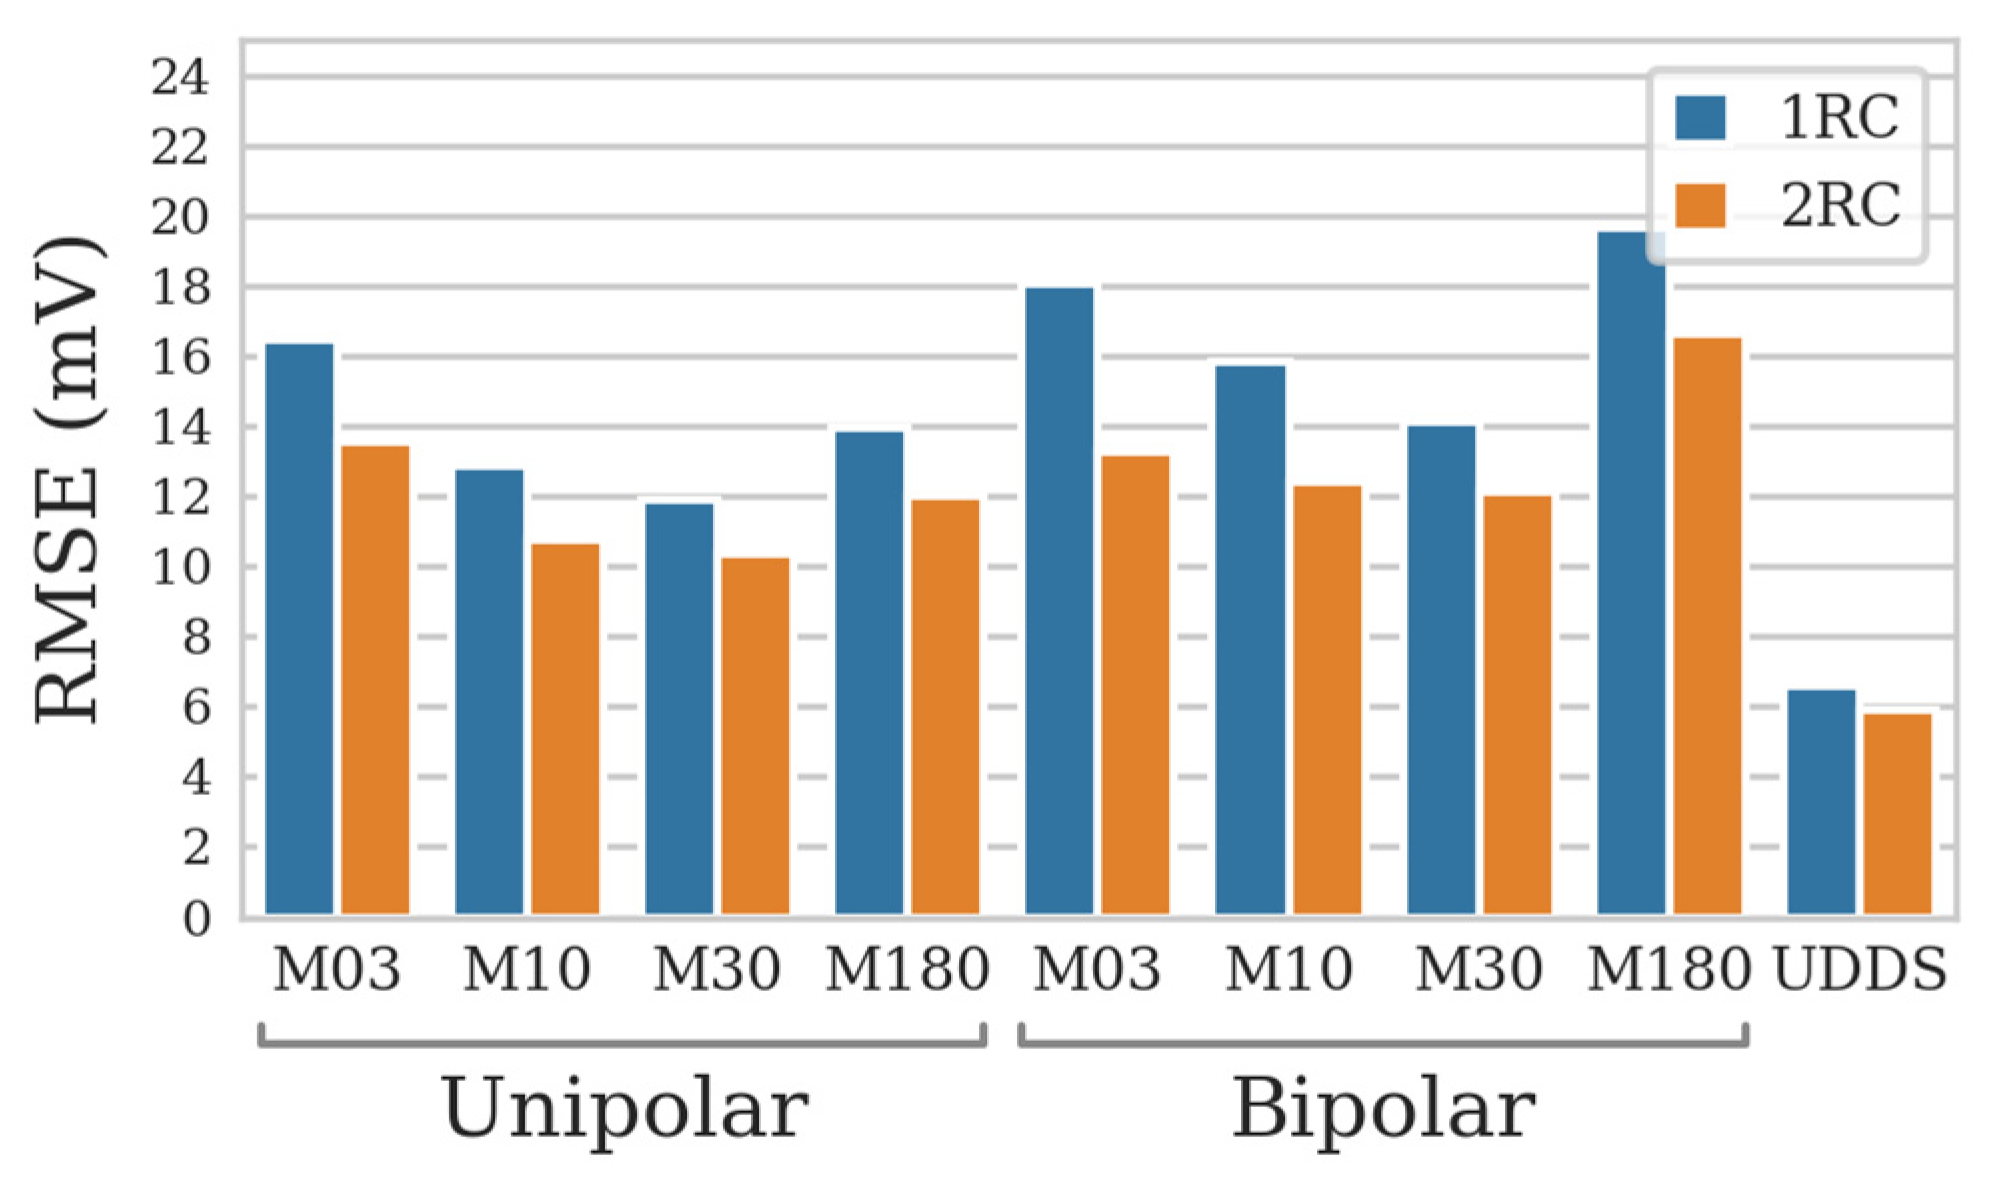
It is reasonable to begin by assessing the impact of the order of the Thevenin model. As was discussed in Section 1, most of the literature sources agree that the second-order ECM is an optimal choice, which provides reasonable accuracy while avoiding high computational costs and problems associated with simultaneous identification of a large number of model parameters. However, direct comparison of models is tricky, because the ECM accuracy heavily depends on the quality of the parameter set used, while different order models require different parameter sets. Therefore, Figure 4 shows the RMSE values for the 1RC and 2RC models averaged over all parameter sets obtained for different τpls, Ipls, τrlx. The 2RC model does yield a smaller average error for every validation case. However, the difference is not crucial. The average relative reduction in the RMSE values ranges from 10% (UDDS) to 26% (M03 bipolar validation profile).
Figure 4.
The RMSE values calculated for different validation profiles and averaged over all the obtained parameter sets.
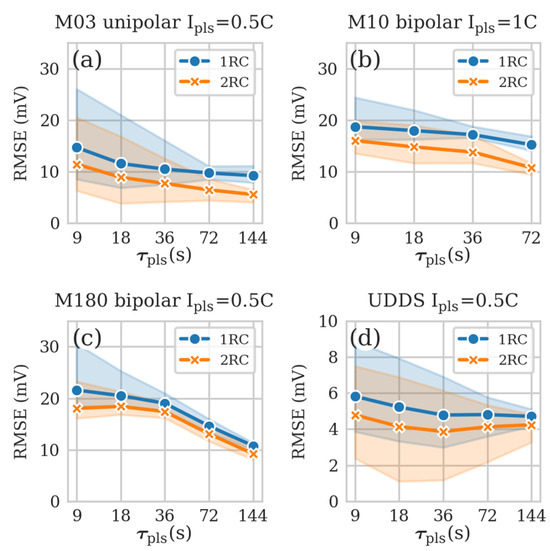
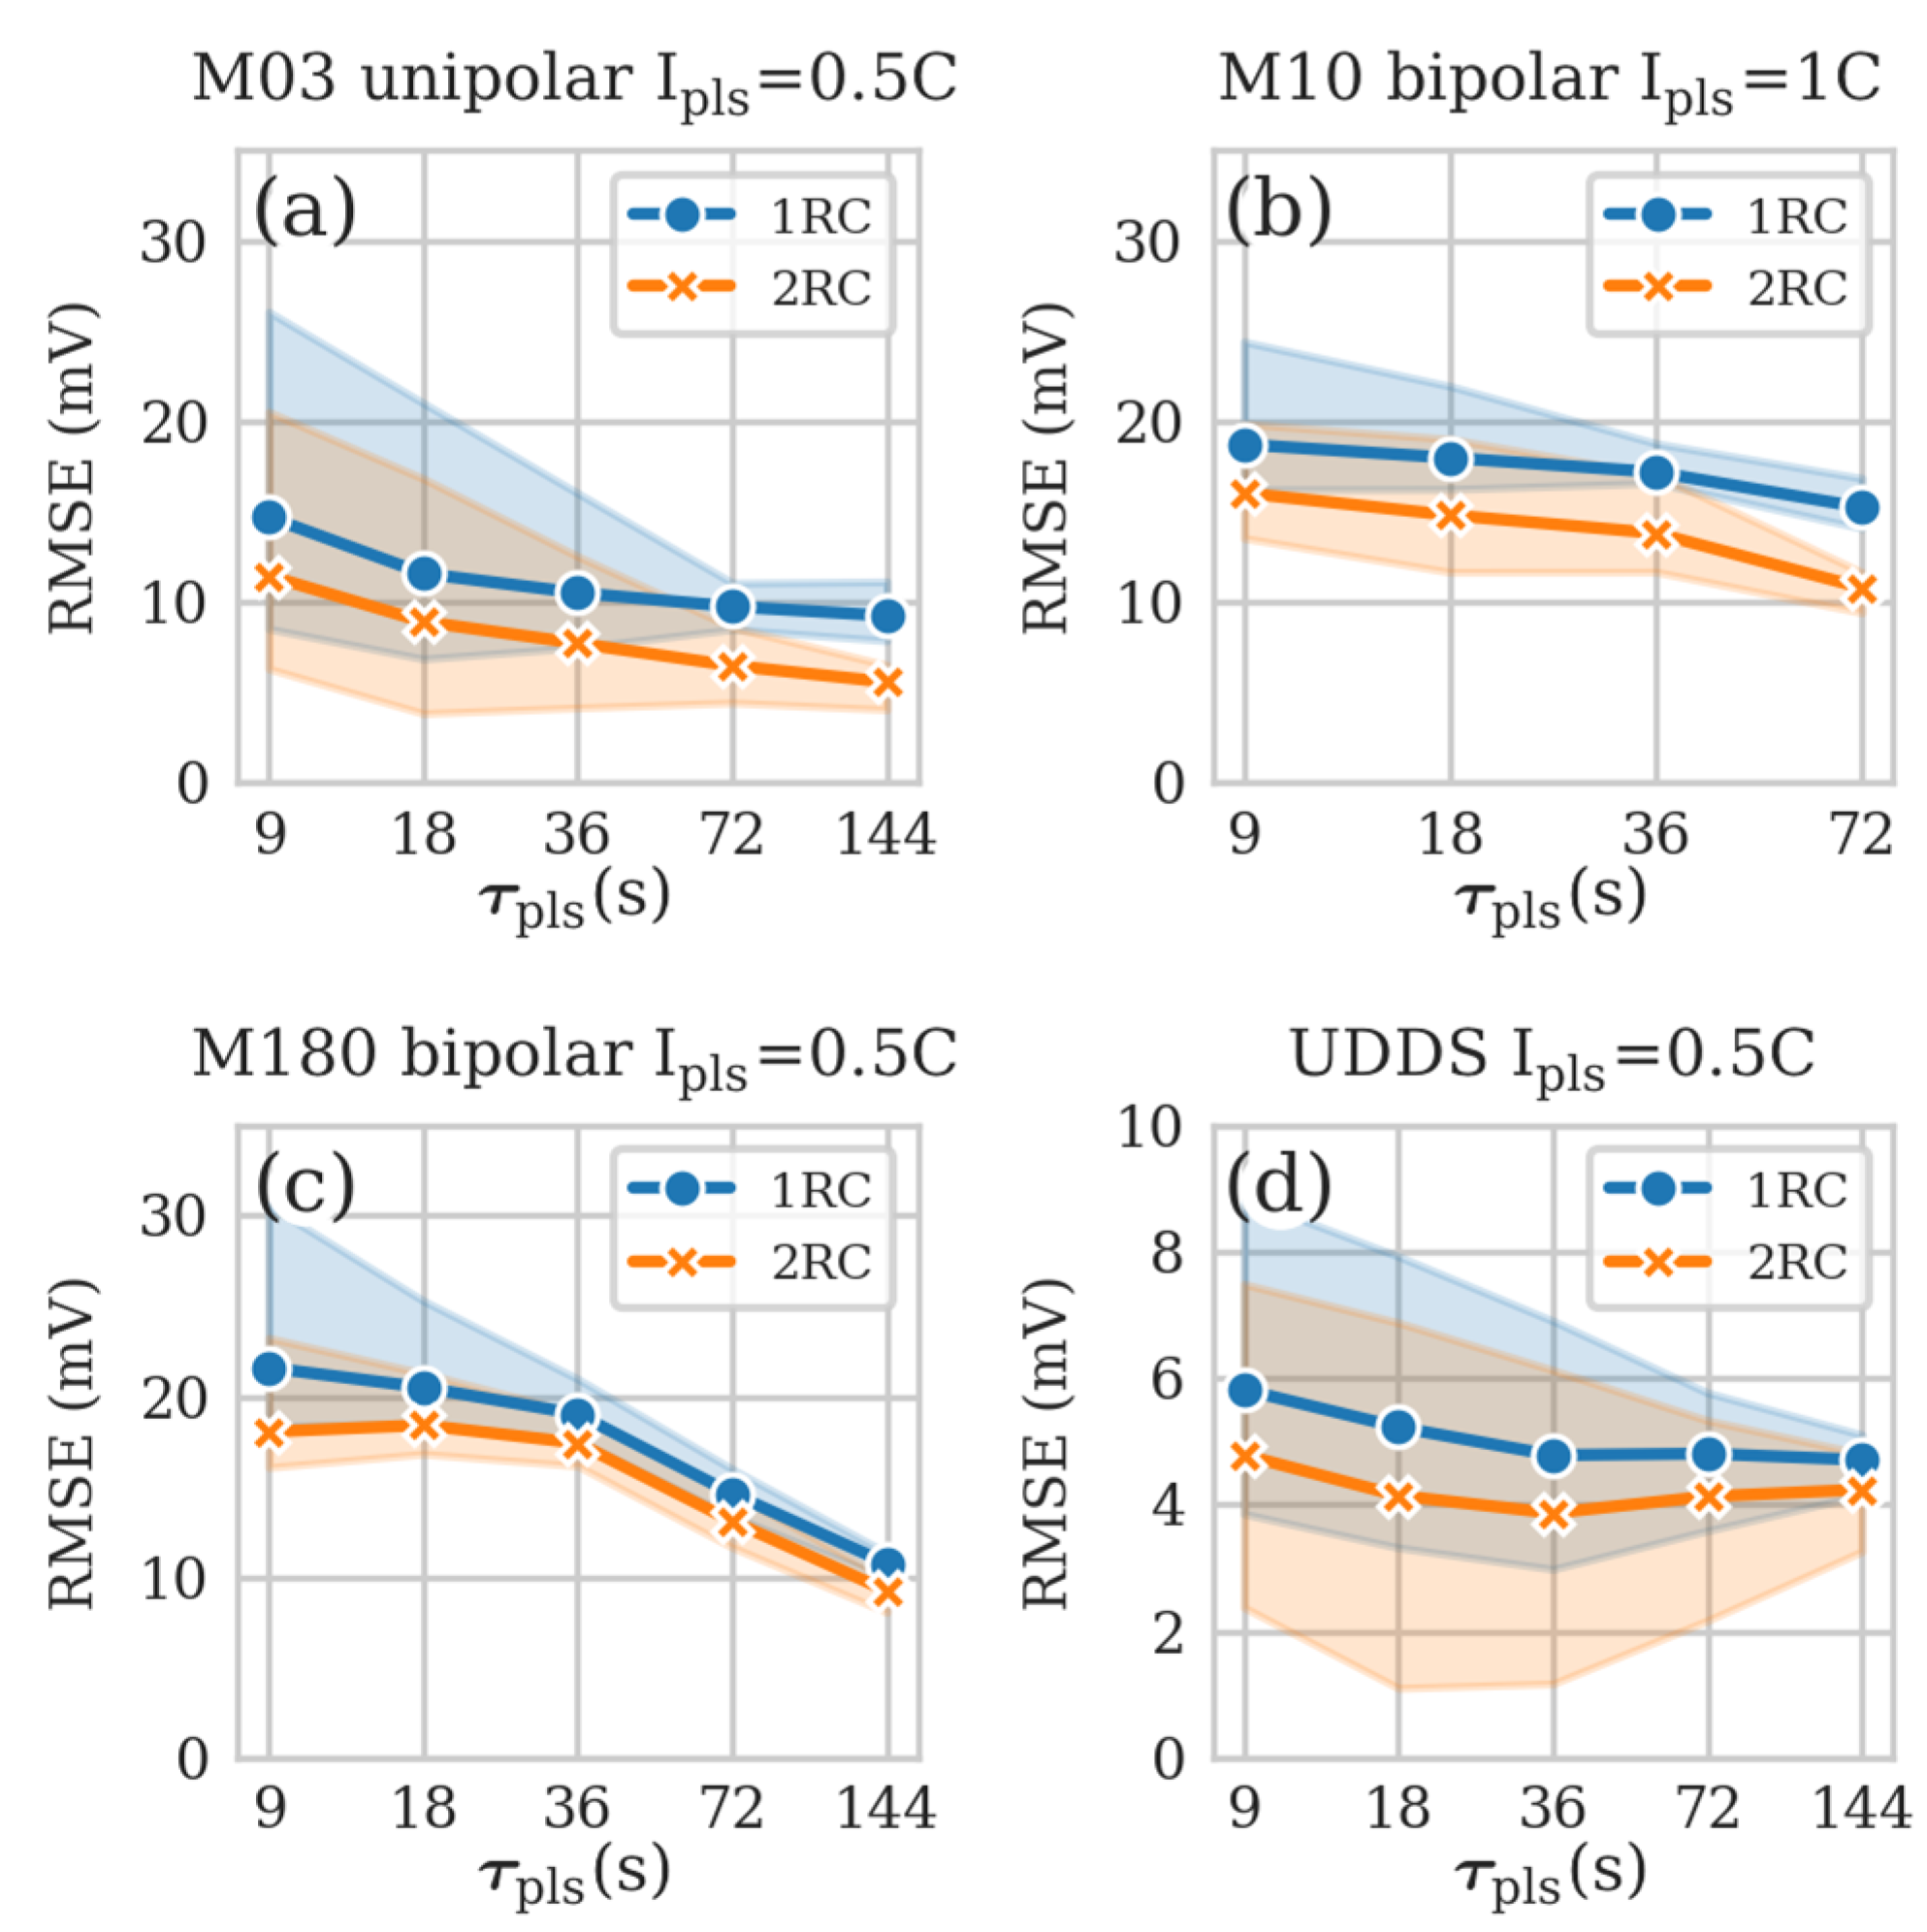
Moreover, the 1RC model based on the optimal parameter set can be more accurate than the 2RC model based on an arbitrary chosen parametrization protocol. For example, Figure 5 shows the spread of the RMSE values for some validation cases. The semitransparent areas depict the error range across the considered relaxation data cutoff values τrlx, the lower edge reflects the best accuracy, the points reflect the average value (calculated across different τrlx under fixed τpls value). Although the minimum possible RMSE value is obtained using the second-order model, the areas associated with the 1RC and 2RC models overlap significantly. The same is true for all the other validation cases. Thus, the higher ECM order per se does not guarantee accuracy superior to the lower-order models if the parameterization procedure was not chosen carefully.
Figure 5.
The dependences of the RMSE on the test pulse duration τpls compared for the 1RC and 2RC models. The RMSE value spread across the relaxation segment lengths τrlx is depicted by the semitransparent areas, the marked lines represent the values averaged over τrlx. The test pulse amplitude values and the validation profiles are respectively (noted above the graphs): (a) M03 unipolar and 0.5 C, (b) M10 bipolar and 1 C, (c) M180 bipolar and 0.5 C, (d) UDDS and 0.5 C.
3.2. Pulse Amplitude
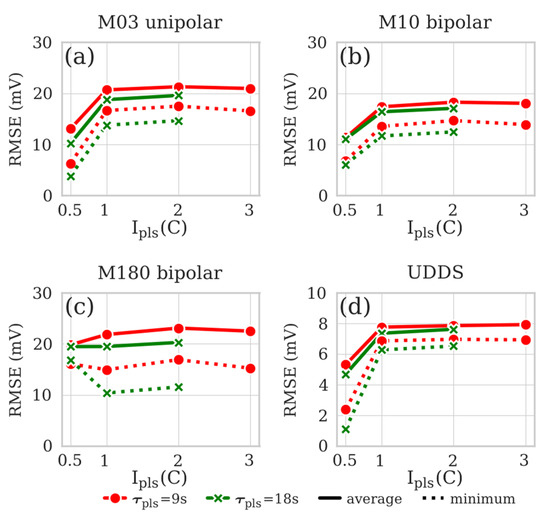
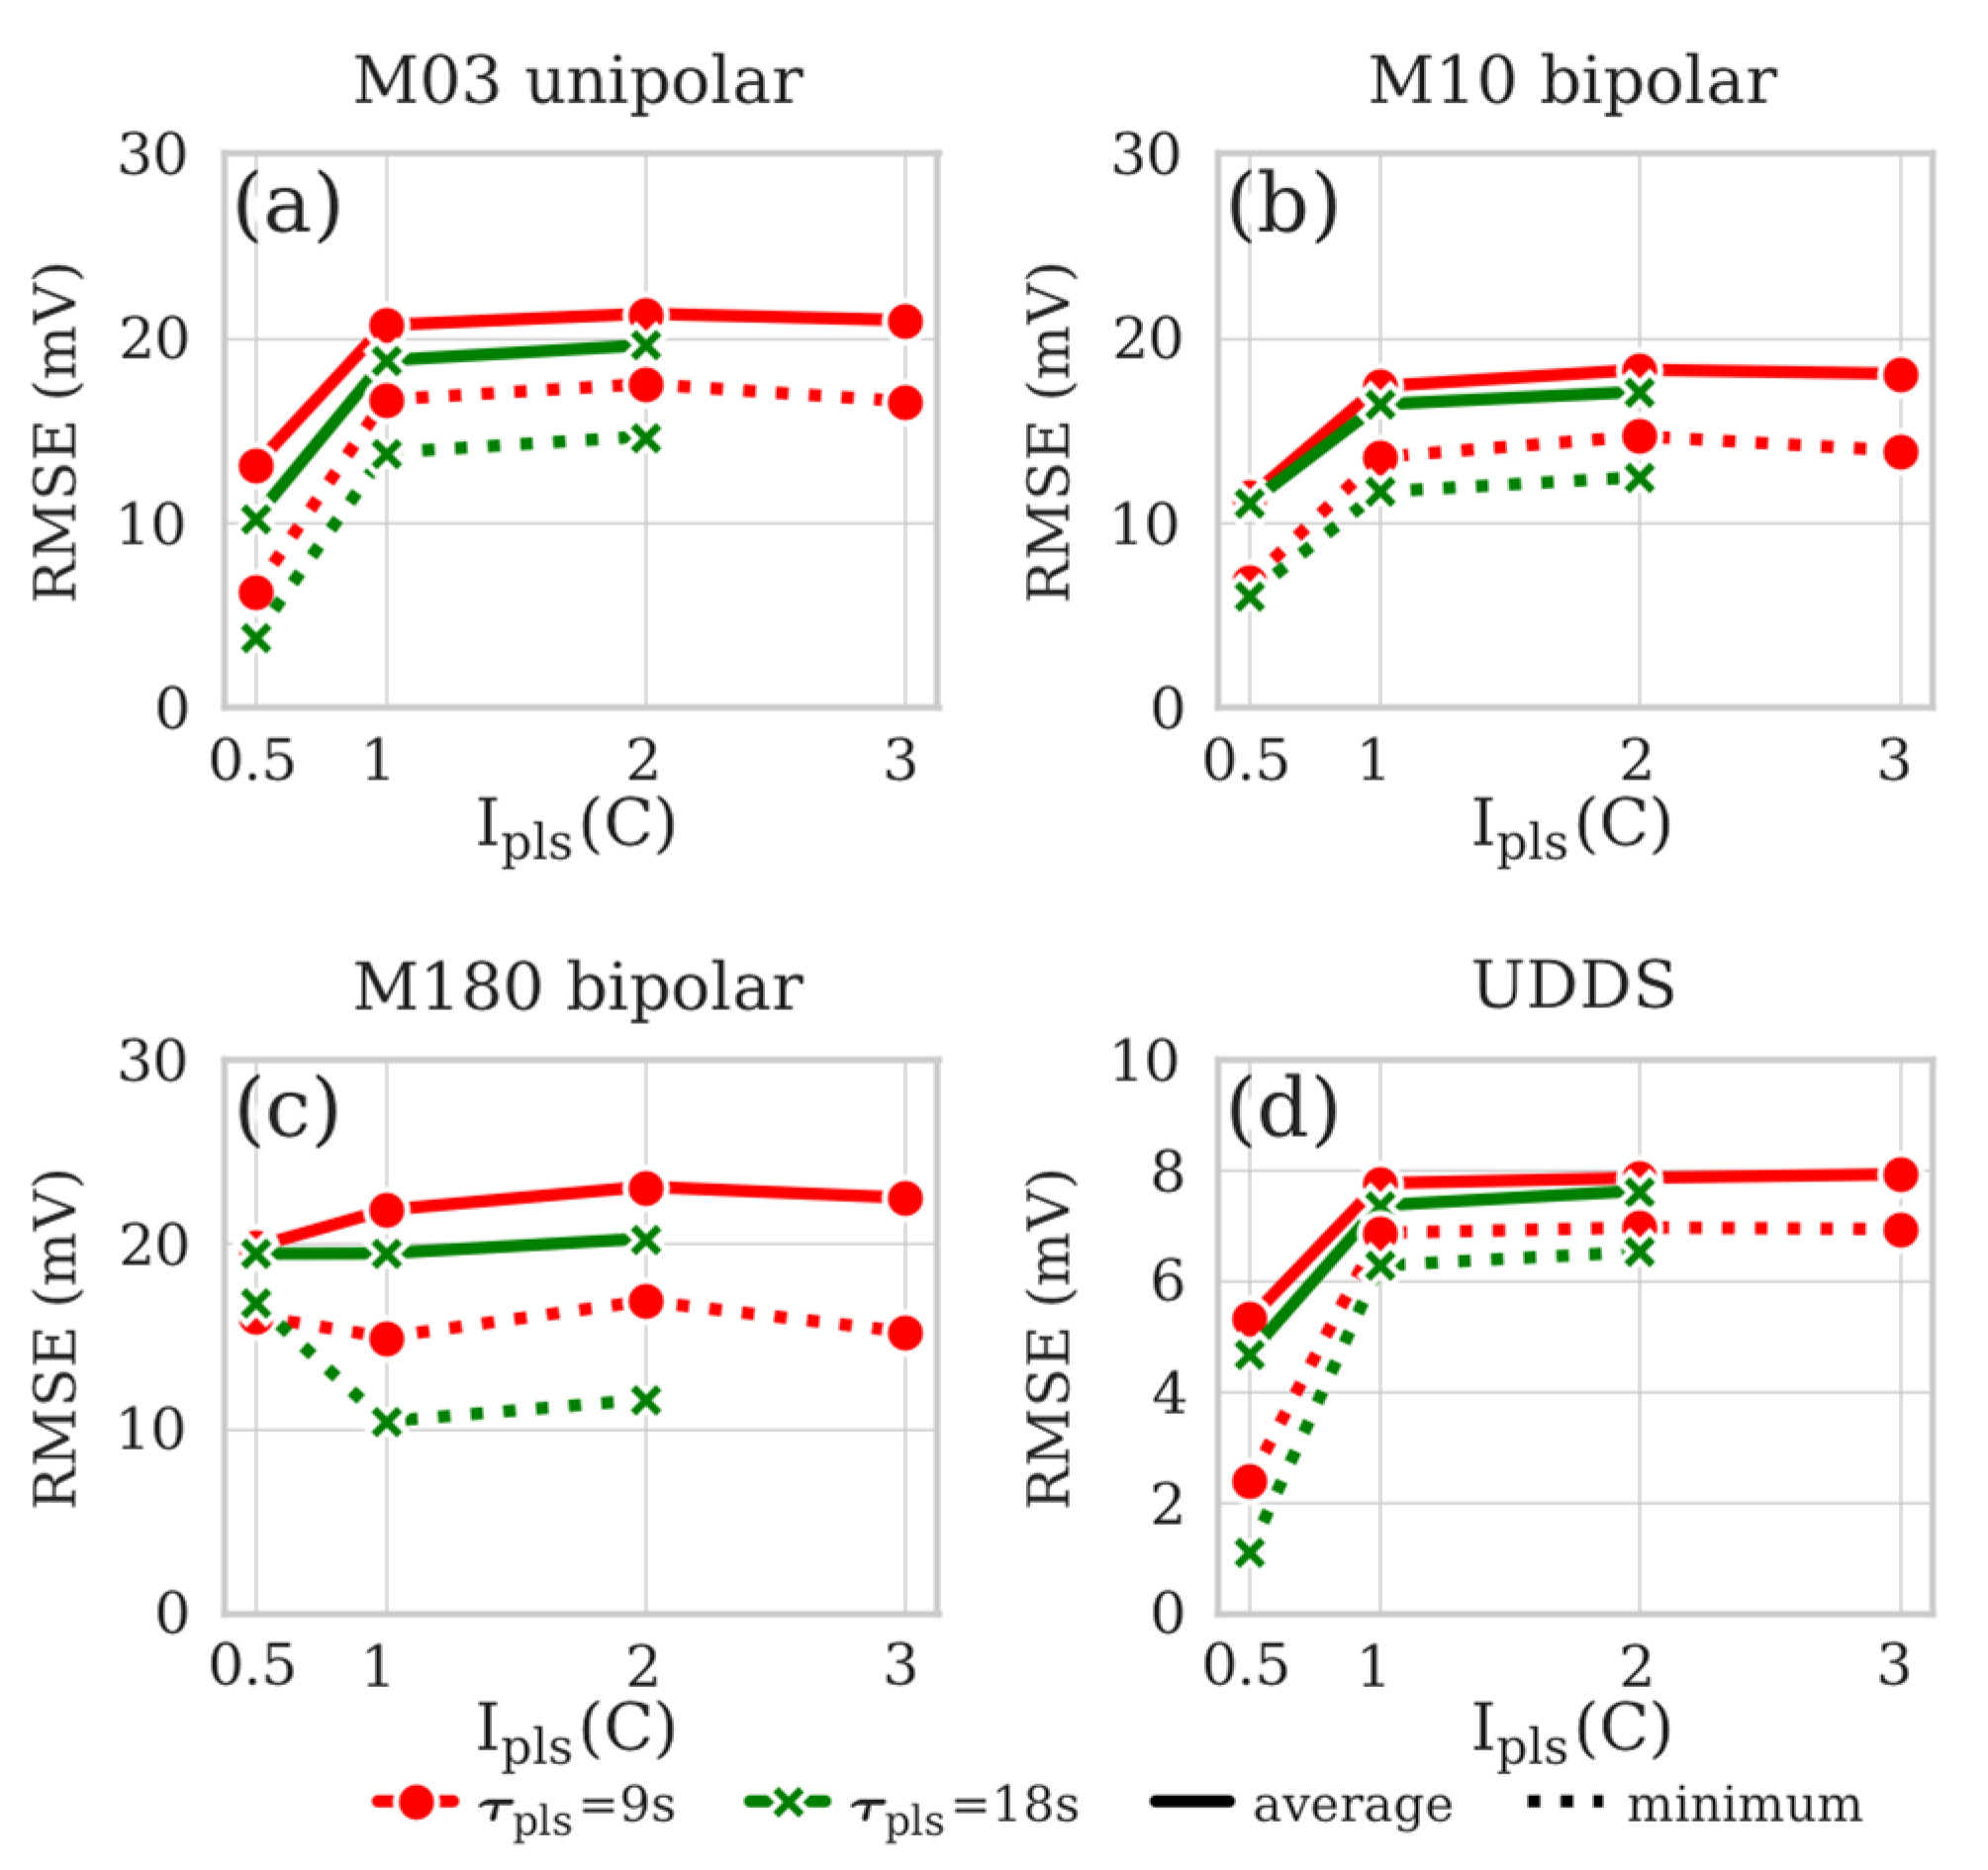
It should be noted that regardless of the number of RC branches, ECM remains a linear system with respect to current–voltage response, while a real battery is only close to linearity to some extent. Therefore, the amplitude of the exciting current pulse may affect the values of the identified model parameters. Figure 6 illustrates the dependence of the model error on the amplitude of the test pulse used for the model parameterization. Two types of error values are shown: the minimum RMSE value across the parameter sets with different τrlx and the mean value across the same sets. In most of the cases, the 0.5 C test pulses yield noticeably more accurate parameter sets than the higher amplitude test pulses (M180 bipolar being the only exception). This result is quite interesting, as the amplitudes of the meander-like current profiles used for the validation were 1 C and 2 C for the unipolar and bipolar profiles, respectively. The Thevenin model is inherently unable to reproduce the non-linear effects, but in order to correctly capture the linear portion of the battery response one should set moderate amplitude of the test pulses. (However, the voltage response must be much greater than the instrumental noise; therefore, the authors discourage the use of extremely low-amplitude test pulses). In the following, our analysis will be limited to parameter sets based only on 0.5 C test pulses (Ipls ≈ 0.5 C).
Figure 6.
The dependences of the RMSE on the test pulse amplitude Ipls for the 2 RC model. The solid lines represent the RMSE value averaged over the relaxation segment lengths τrlx, while the dashed lines represent the best result. The following profiles were used for validation: (a) M03 unipolar, (b) M10 bipolar, (c) M180 bipolar, and (d) UDDS.
3.3. Pulse Duration and Relaxation Segment Length
Although the Thevenin models usually contain more than one RC branch to describe several transient processes with different characteristic times, it is implied that the excitation and relaxation phases of those processes are symmetric with respect to time as the capacitors charging and discharging rates are governed by the same time constant. Battery voltage polarization is the result of several complex physical processes, including lithium intercalation and diffusion within the electrode material. Taking into account that the reaction rate constants and solid-phase diffusion coefficients depend on local lithium concentration [54], there is no guarantee that the characteristic times of the excitation and relaxation phases are exactly the same.
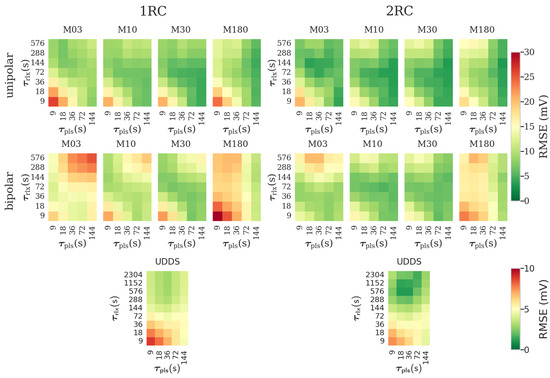
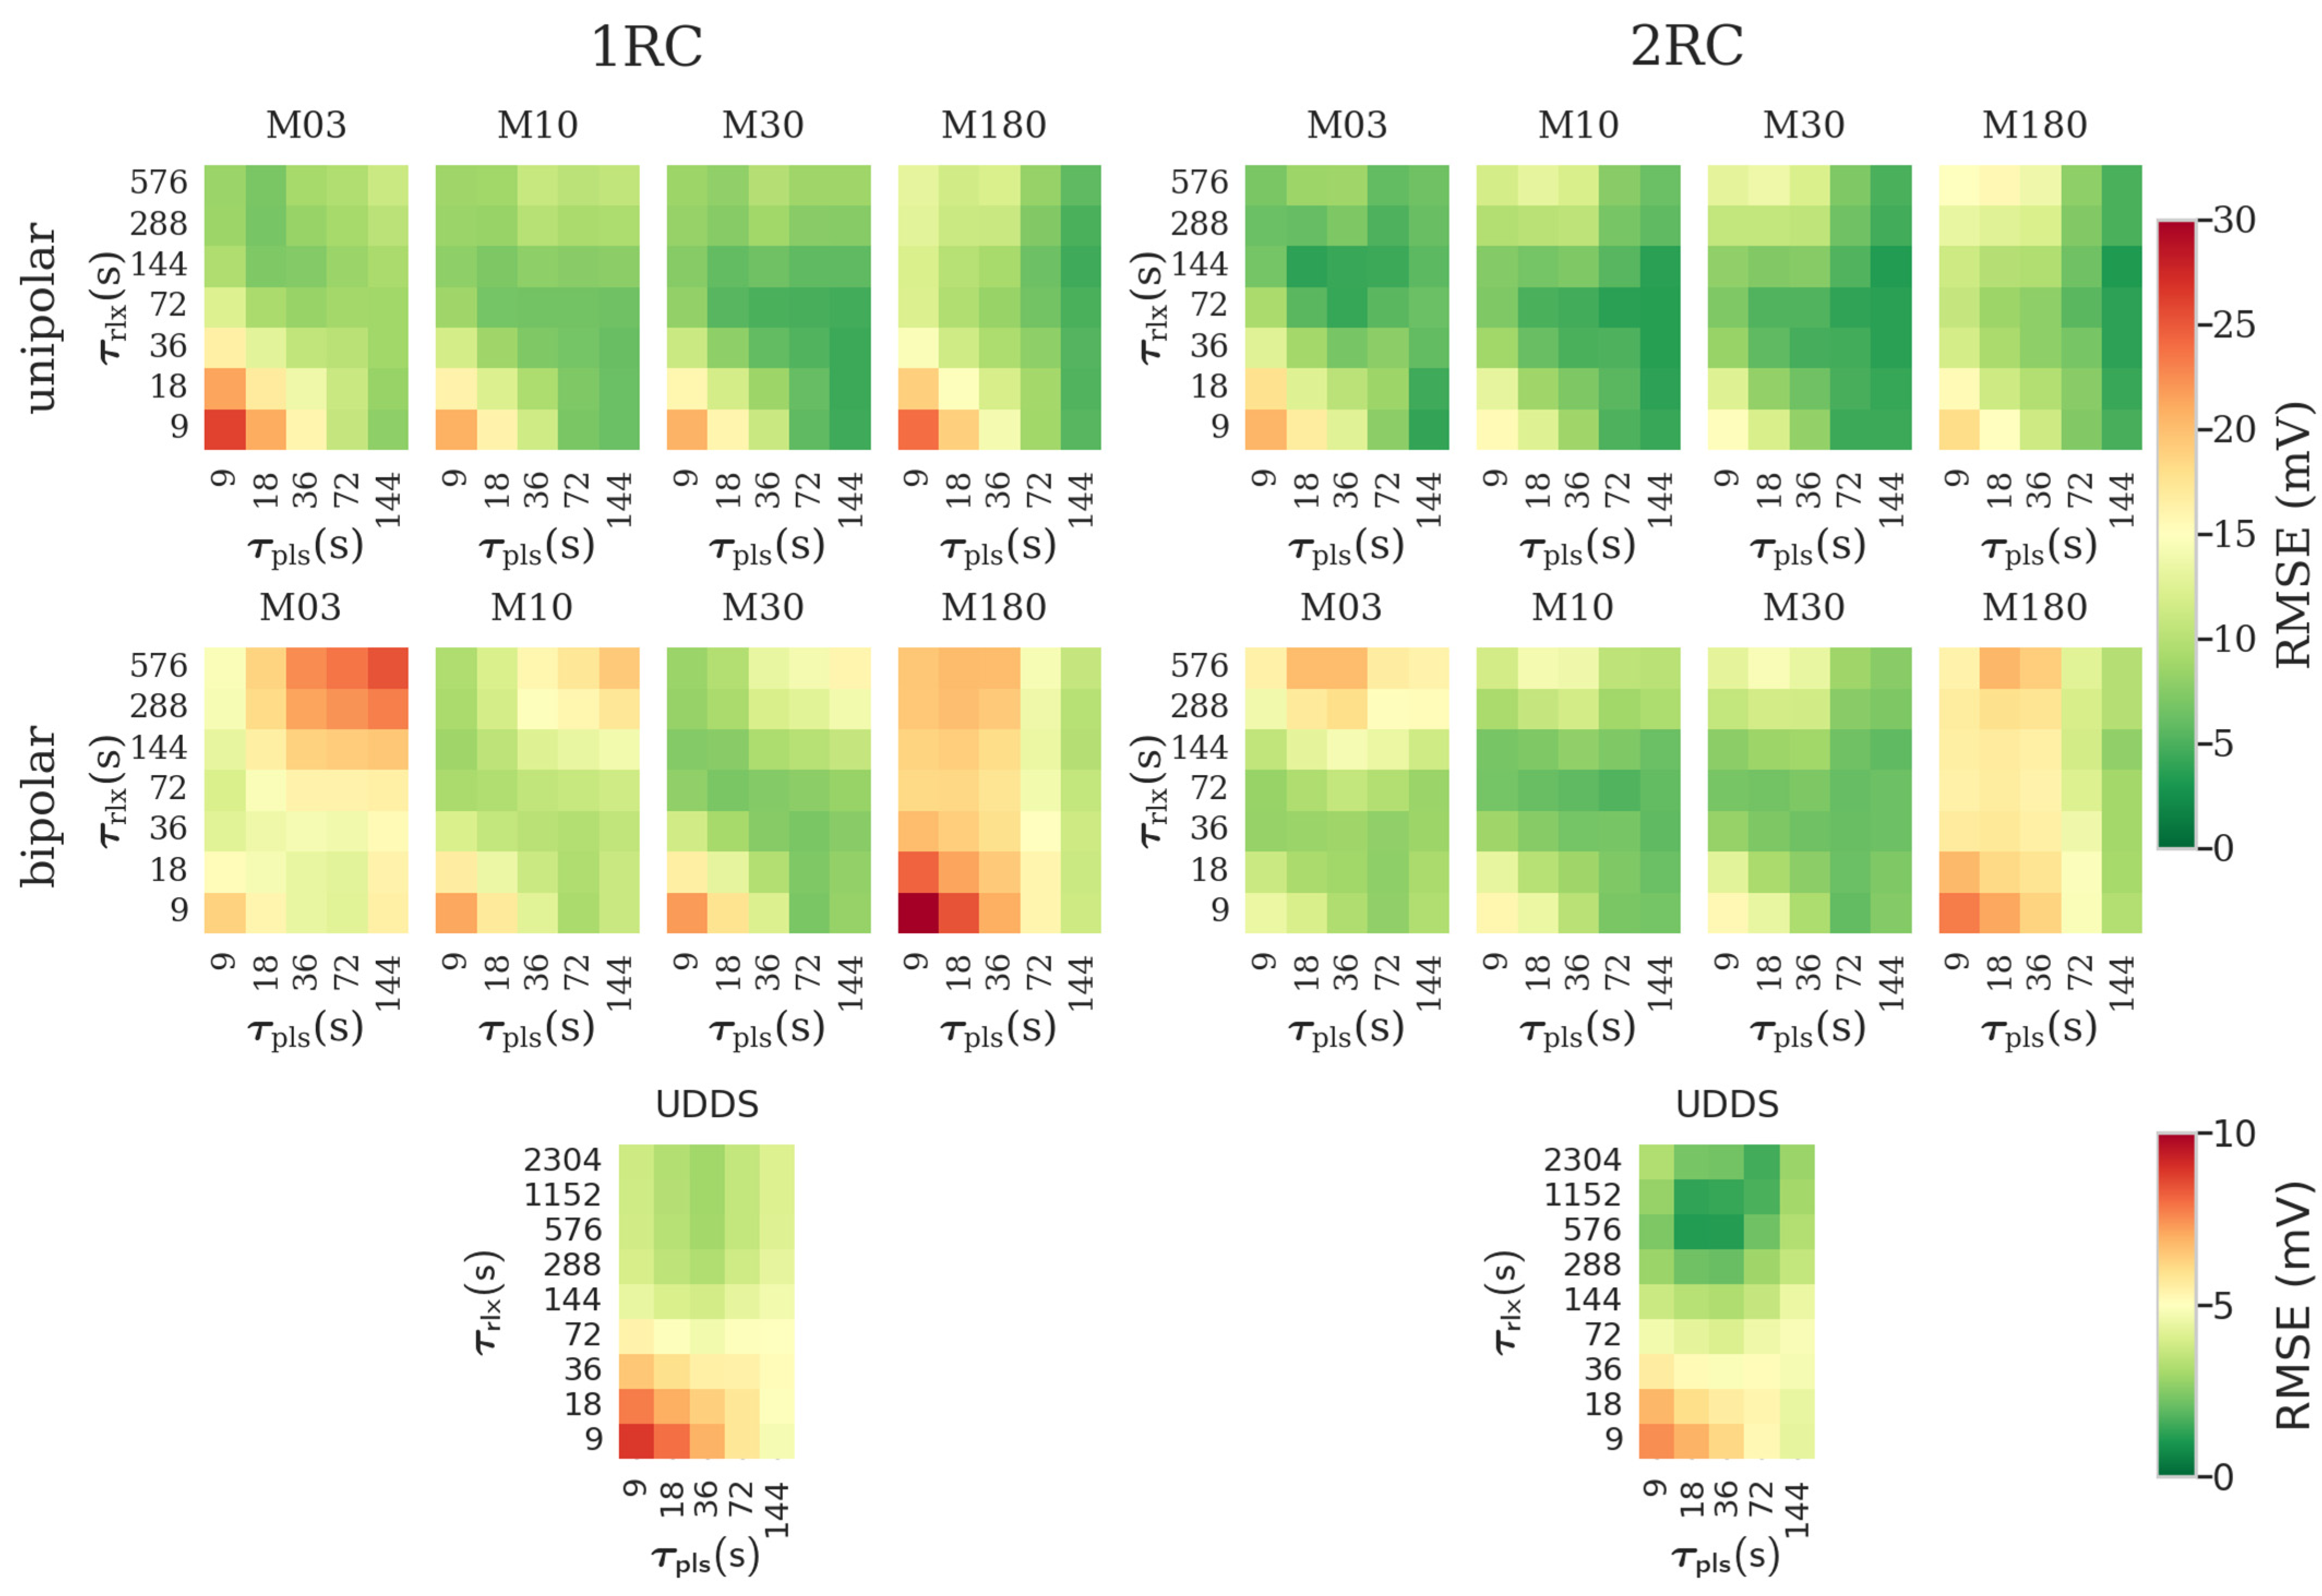
Some researchers suggest identifying the ECM parameters solely on the basis of either the cell voltage dynamics during the excitation phase [11] or the voltage relaxation following the current pulse [44], while others utilize both the pulse and the relaxation data segments [13]. In the current study, the impact of the excitation and relaxation phases on the values of the identified parameters was varied by choosing different combinations of τpls and τrlx. The calculated RMSE values for the parameter sets obtained using 0.5 C current pulses are presented in Figure 7 as a set of heatmaps. Each heatmap covers all combinations of test pulse durations τpls and relaxation data cutoff values τrlx validated using one of the nine current profiles.
Figure 7.
A set of heatmaps visualizing the RMSE of the models based on different parameter sets. The test pulse amplitude is Ipls = 0.5 C. The models were validated with unipolar meander profiles (1st row of heatmaps), bipolar meander profiles (2nd row), and UDDS profile (the bottom row). Note that the UDDS validation heatmaps have a separate color scale.
The shortest pulse duration (τpls = 9 s) supplemented by the shortest relaxation segment (τrlx = 9 s) results in a large error value in all validation cases. However, it is hard to deduce a universal recommendation for choosing the optimal parameter set. The heatmaps in Figure 7 show that the trends with respect to varying τpls and τrlx depend on the validation profile used to estimate the error. Therefore, the optimal model parameterization protocol would depend on the presumptive battery operation regime.
Generally, increasing the duration of the test pulse helps to improve the accuracy. For many validation profiles, the best parameter sets are obtained using the longest τpls = 144 s. This value is very different from the test pulse duration of about 10–30 s commonly used for ECM parameterization according to the literature. The long test pulse duration is especially beneficial for the M30 and M180 validation profiles. Thus, if the battery operation regime implies a constant, slowly changing, or infrequently changing current profile, the test pulse duration should be set to about 2 min or longer. With respect to the relaxation data cutoff, the optimal τrlx is within the range of 36 to 144 s for most of the meander-like profiles. Higher τrlx values decrease the accuracy of the model.
In case of UDDS validation profiles, the optimal conditions are shifted to a shorter τpls (18–36 s) and longer relaxation segment length τrlx = 576. In order to verify that the τrlx = 576 yields the best possible results, additional parameter sets were generated using even larger relaxation cutoff times: 1152 and 2304 s. These parameter sets indeed turned out to be slightly less accurate. Thus, both in the case of meander-like and UDDS validation profiles, there is a certain limit to how increasing the relaxation data segment can improve the model accuracy.
3.4. Achievable Accuracy
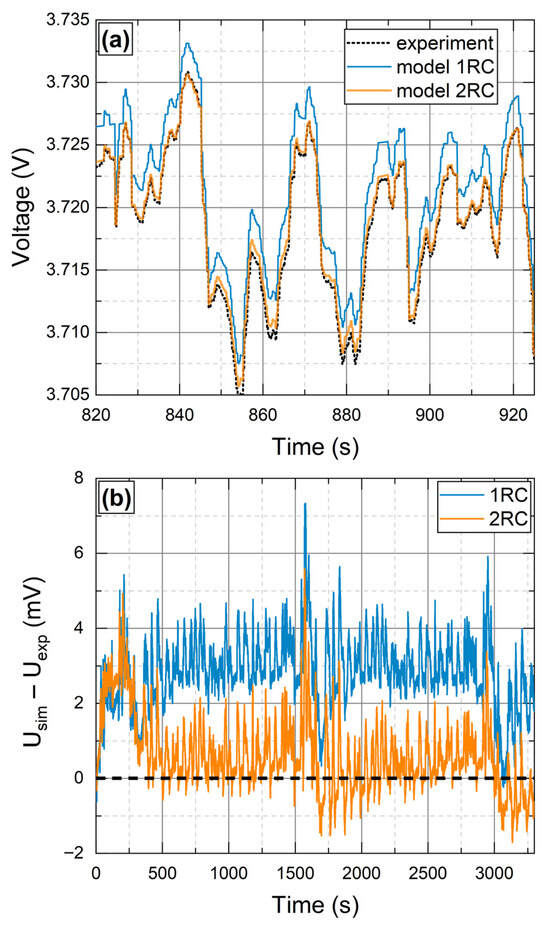
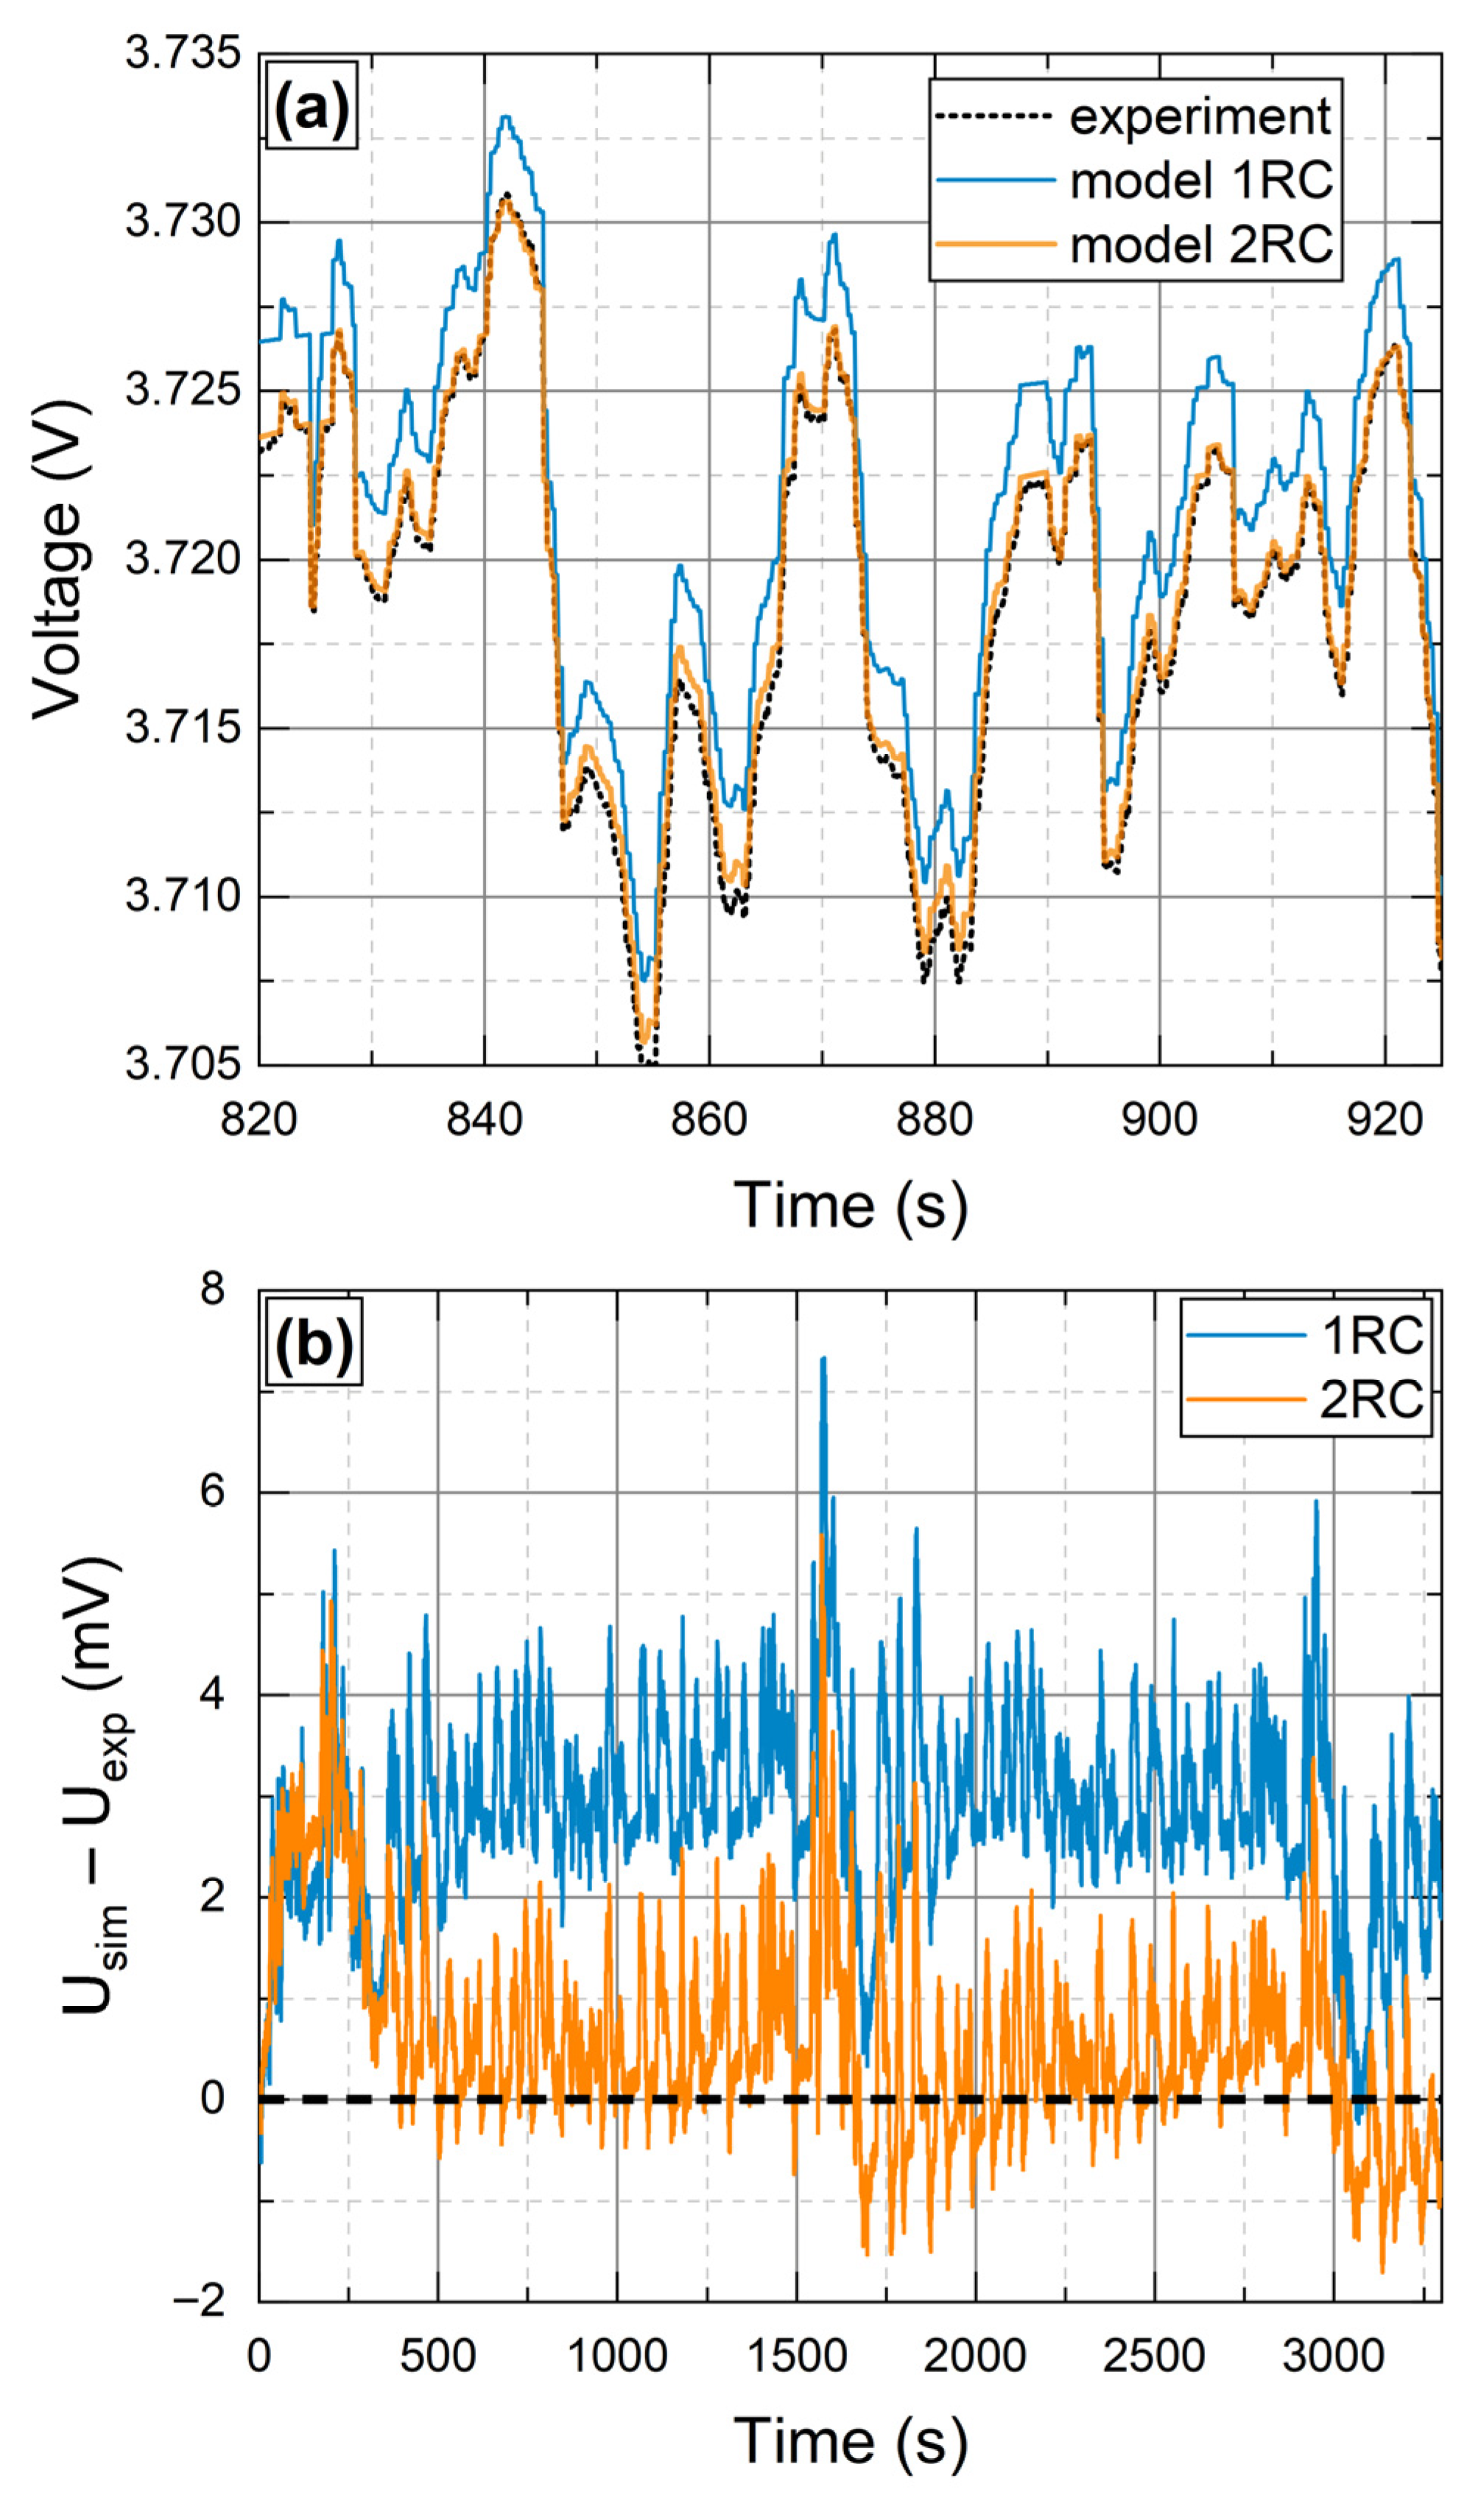
Figure 8 demonstrates the accuracy of the first- and second-order models that rely on the best set of parameters (τpls = 36 s, τrlx = 576 s, Ipls = 0.5 C) obtained for the UDDS validation profile. 1RC: RMSE—3.0 mV, maximum absolute error—7.3 mV; 2RC: RMSE—1.2 mV, maximum absolute error—5.6 mV (τpls = 18 s yields slightly lower RMSE = 1.1 mV for the 2RC model). Note that the RMSE values averaged over all the parameter sets obtained are 6.8 mV (1RC) and 6.5 mV (2RC), so that the errors were reduced by 56% and 82%, respectively. The best results achieved for all validation profiles are summarized in Table 2.
Figure 8.
The best ECM validation results for the UDDS current profile: (a) direct comparison of the simulated cell voltage to the experimentally measured voltage (arbitrary time interval); (b) model error (full validation length).
Table 2.
The lowest achieved validation RMSE and the associated values of the test pulse duration τpls and relaxation data segment length τrlx.
Most of the advanced on-line SoC estimation algorithms [55] (e.g., based on Kalman filter [56]) rely on the ECM. The SoC prediction accuracy of these algorithms are directly limited by the voltage prediction accuracy of the ECM. A typical OCV slope of an NMC battery within the mid-SoC region is about 8–10 mV per 1% SoC. Thus, selection of the optimal parameter set obtained by adjusting τpls and τrlx hypothetically makes it possible to track the battery SoC with less than 0.5% error using the most simple first-order (‘1RC’) ECM. That is a great advantage for on-board BMS which imply strict limitations on the computational resources.
The results obtained in this work, particularly voltage error under realistic drive cycle conditions, seem advantageous in comparison to other results currently presented in the literature. A recent attempt to optimize HPPC test characteristics yielded best RMSE value 5.3 mV for a second-order ECM under WLTP driving cycle conditions [37]. The difference is probably due to short duration of both the test pulse and the relaxation segment. The authors restricted variation in these values by only 20 s for the pulse duration and 80 s for the relaxation segment length. The best accuracy was achieved for the longest considered relaxation segment length—80 s. In fact, the closest test characteristic combinations considered in the current work yielded very similar RMSE values for a driving cycle validation profile: [τpls = 9 s, τrlx = 72 s] → 5.5 mV, [τpls = 18 s, τrlx = 72 s] → 4.3 mV. However, the use of prolonged relaxation segments in the current work have led to a significant improvement—RMSE was reduced down to 1.1 mV ([τpls = 18 s, τrlx = 72 s]).
Hao et al. [36] proposed a pulse response analysis method. The parameterization was based on a low-current test pulse, and the validation was performed under complex custom pulse sequences and zero-mean China Light-duty Vehicle Test Cycle (CLTC) profiles. The authors reported a terminal voltage RMSE in the range of 3.4 mV to 6.1 mV during validation. Leonori et al. [18] adopted a neuro-physical hybrid approach and advanced switching ECM design. Randomly generated sequences of charging/discharging pulses of various amplitude and duration (NASA dataset) were used for model training. Validation using a separate test set from the same randomized pulse protocol yielded a highly accurate voltage with RMSE of 1.8 mV to 2.5 mV. Thus, optimization of the test pulse data characteristics performed in the current work yields significant ECM accuracy improvement comparable or even surpassing other more sophisticated approaches. Combining optimal test pulse selection with the other approaches (e.g., based on neural networks or advanced ECM design) can lead to even better results.
3.5. ECM Parameters Variation
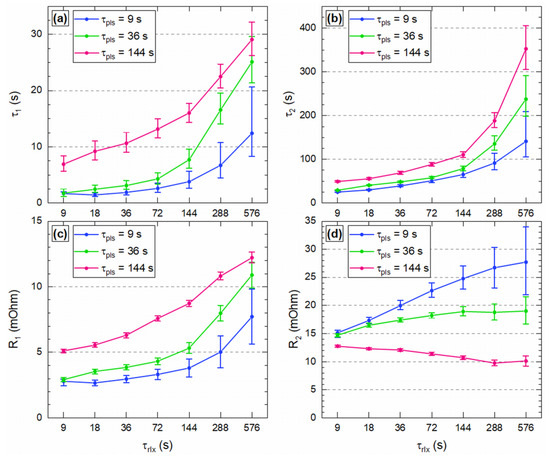
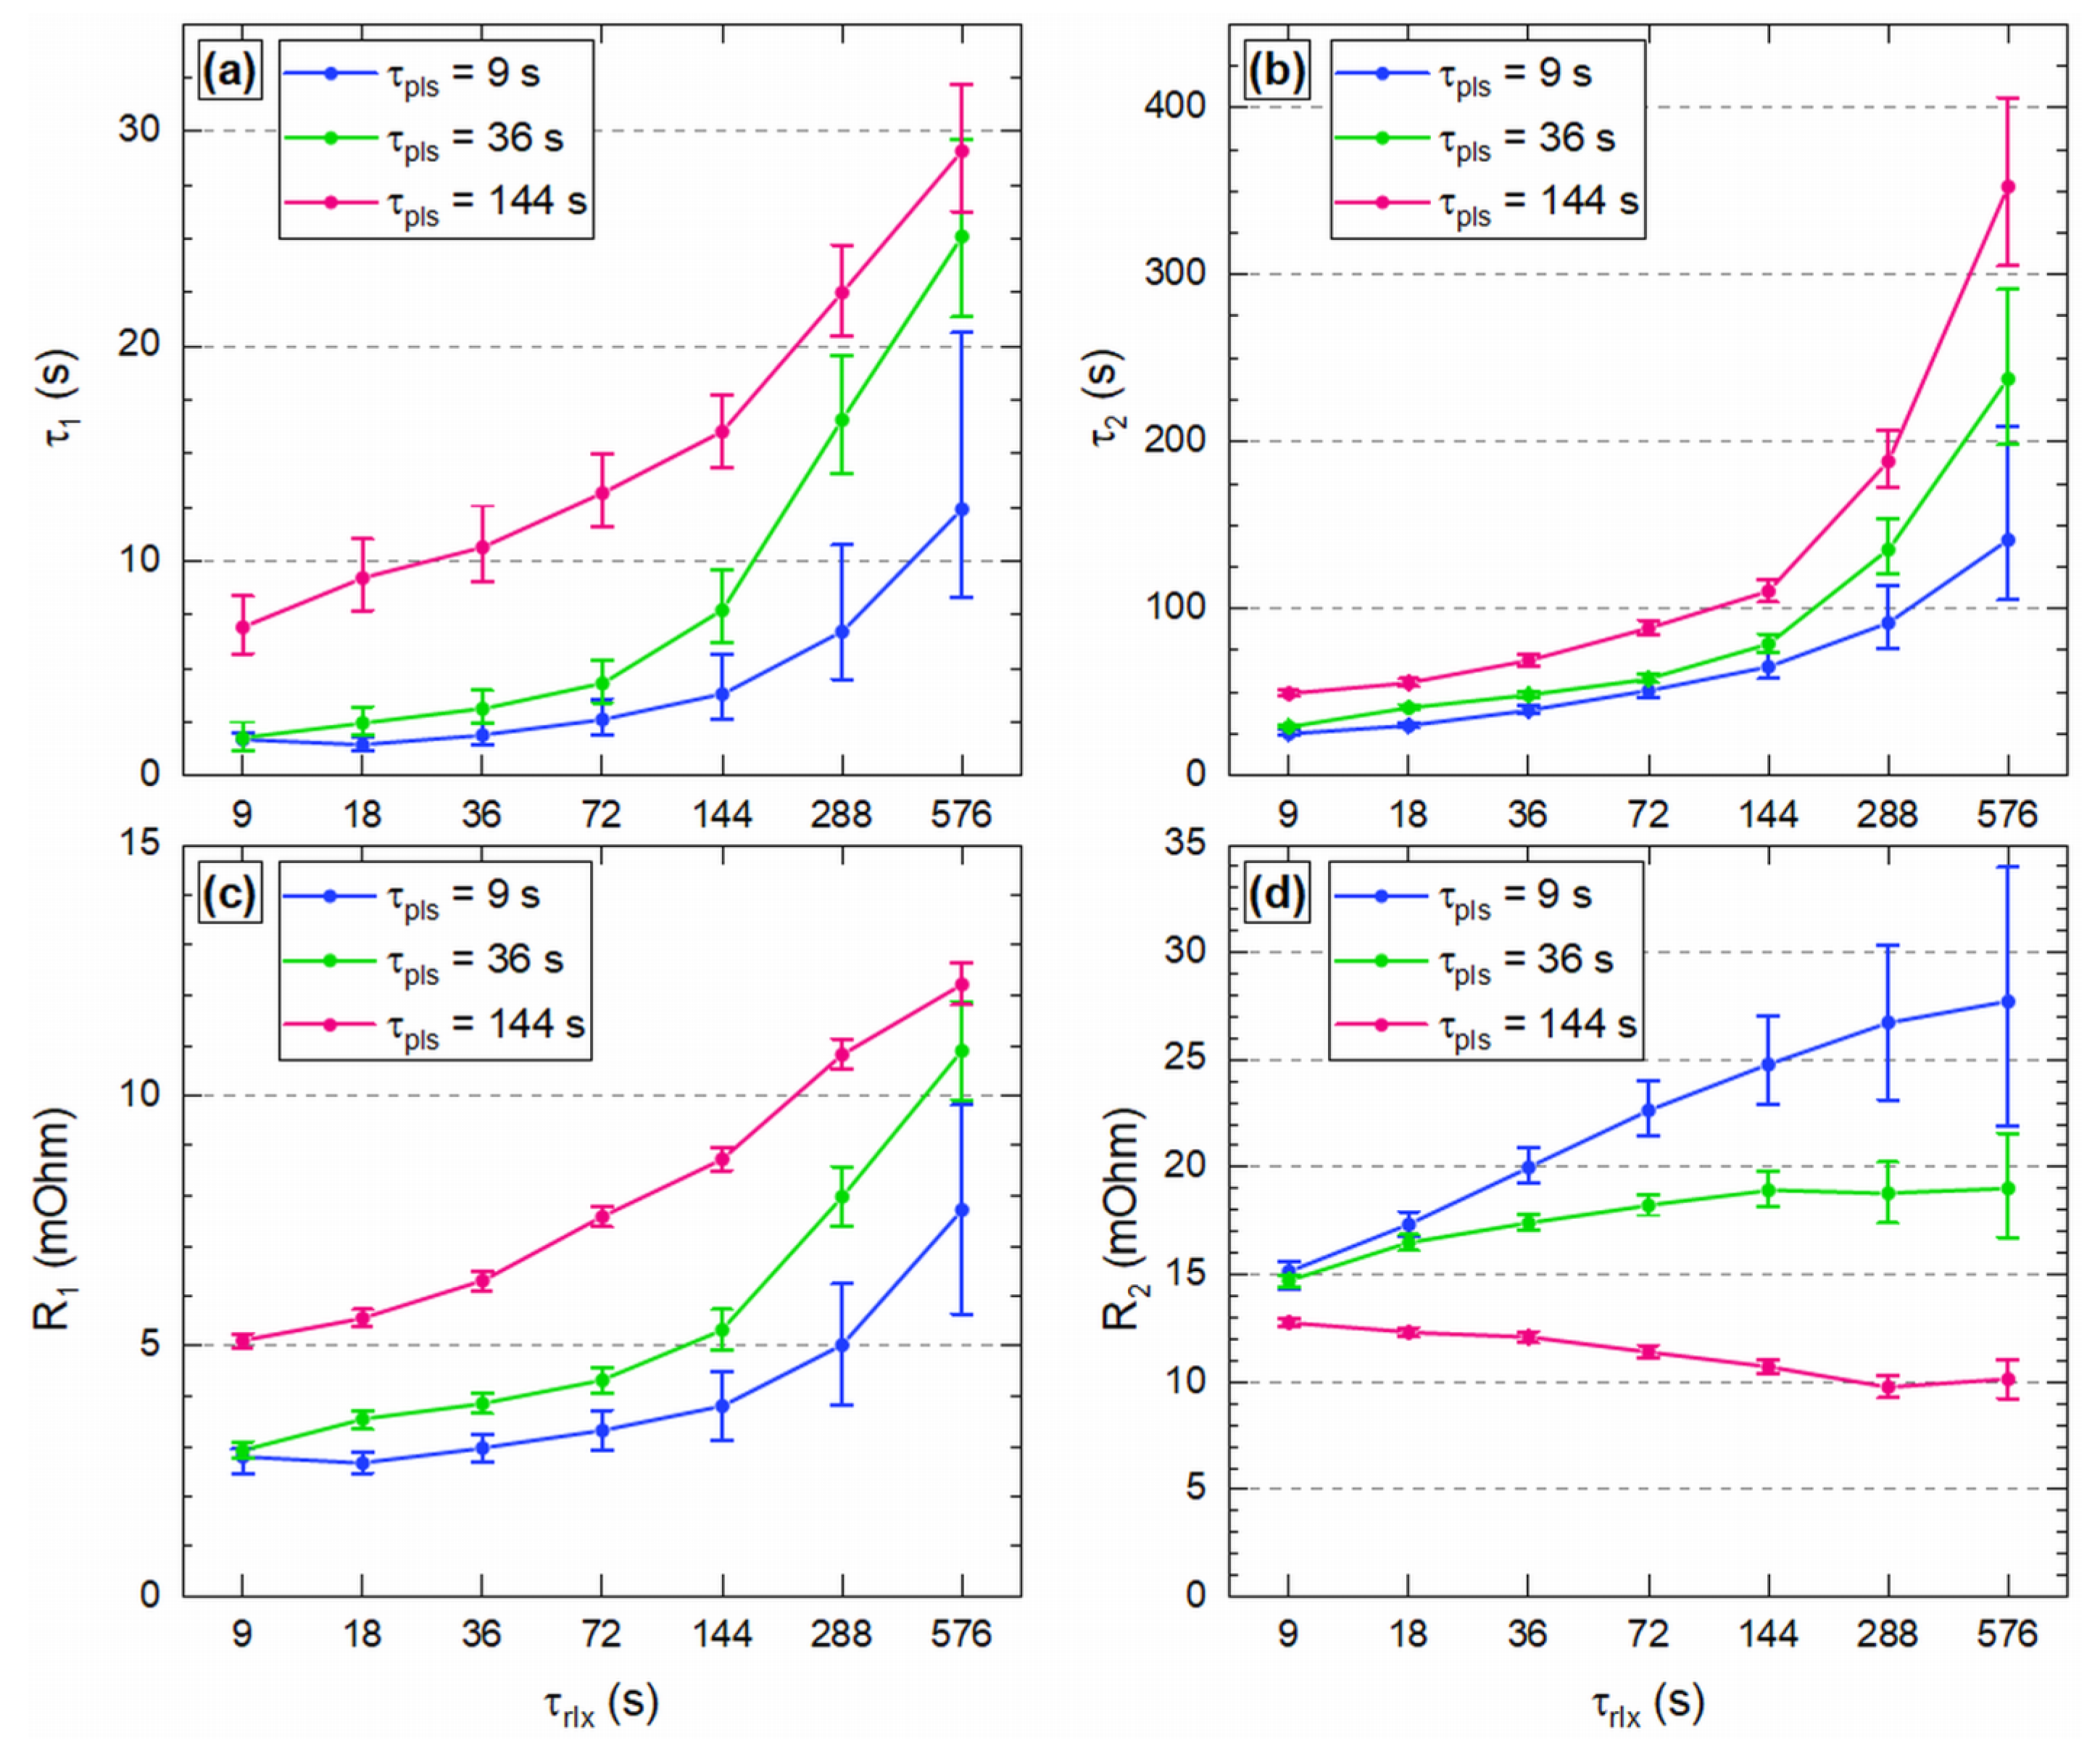
The choice of the test pulse duration τpls and the relaxation data segment length τrlx directly affects the parameters of the polarization RC branches of the ECM. The dependence of these parameters for the 2RC model (R1, τ1, R2, τ2) is illustrated in Figure 9. Both τ1 and τ2 grow substantially upon elongation of the relaxation data segment τrlx. The same is true for increasing the τpls. In case of 1RC model, the single polarization time constant τ1 also increases with τpls and τrlx in a similar way. This result seems reasonable, as the experimental data with longer τpls and τrlx contain more information about the slow relaxation modes of a Li-ion cell. Generally, the second polarization resistance R2 (associated with the ‘slow’ RC branch) is larger than the ‘fast’ resistance R1. The increase of the first polarization resistance R1 strongly correlates with the increase in the time constant τ1. On the other hand, the relative change in the resistance R2 is less prominent and does not correlate with the associated time constant τ2. The relative variation in the serial resistance R0 is less than 10% across all the considered combinations of τpls and τrlx. The full list of the parameter sets obtained in this work is provided in the Supporting Information (Tables S1–S24).
Figure 9.
Dependence of the second-order ECM polarization parameters on the relaxation segment length for three different pulse duration values: (a) τ1; (b) τ2; (c) R1; (d) R2. The parameters set were obtained for Ipls = 0.5 C at 55% SoC. The results of the parameter sensitivity analysis are represented by the error bars.
Local sensitivity analysis was performed to estimate the uncertainty of the identified parameter values. Every ECM parameter was increased and decreased until the RMSE value became 0.1 mV larger to achieve higher and a lower parameter value limits (originally the RMSE tolerance of the parameter optimization algorithm was set to 0.3 mV). The experimental data segments used for the sensitivity analysis were the same as for the original parameter identification. The obtained higher and lower parameter value limits are presented in Figure 9 as error bars. Small τpls values generally yield larger parameter uncertainty. This implicitly argues in favor of using longer test pulses for ECM parameterization.
4. Conclusions
This systematic study demonstrates that the test pulse duration, amplitude, and relaxation data cutoff significantly influence the accuracy of the parameterized equivalent circuit models. The main outcomes of the work are the following:
- A new experimental data set was obtained and made publicly available;
- A special framework of Matlab scripts (“TEVP”) for mass processing of ECM parameterization and validation data was developed and made publicly available [50];
- The test pulse duration and the relaxation data segment length were varied in a broad range up to 144 s and 2300 s, respectively;
- Increasing the test pulse duration and the relaxation data segment length consistently leads to the increase in the identified ECM polarization time constants (τ1 and τ2);
- The influence of the test pulse ampliated, test pulse duration, and relaxation data segment length on the ECM accuracy was investigated through validation of the parameterized models using nine validation profiles;
- The use of the optimal test pulse data characteristics makes it possible to reduce voltage error (RMSE) down to 3.0 mV for the first-order ECM and 1.1 mV for the second-order ECM.
In certain cases, the optimal parameter set yields up to 82% lower RMSE than the error value averaged across all the parameter sets obtained. Consequently, the simplest first-order Thevenin model based on optimal parameterization protocol can be more accurate than the second-order ECM parameterized using an arbitrarily chosen test pulse. The optimal combination of the test pulse duration and the relaxation data cutoff depends on the particular validation profile, i.e., battery operation regime. However, if a thorough optimization of the parameter identification protocol is out of the question due to practical limitations, it is suggested that setting the pulse duration to about 30 s and the relaxation data cutoff to 1–3 min should be a good ‘blind guise’ according to most of our validation tests. The proposed test pulse data optimization can be easily combined with other approaches based on advanced parameterization algorithms to obtain synergetic benefits.
Supplementary Materials
The following supporting information can be downloaded at: https://www.mdpi.com/article/10.3390/wevj17010038/s1, All the obtained ECM parameter sets are provided in the Supporting Information document as Tables S1–S24.
Author Contributions
Conceptualization, A.V.S.; Investigation, D.K.G. and A.V.S.; Formal analysis, A.V.S., A.A.D. and D.K.G.; Visualization, A.A.D.; Writing—original draft, A.V.S., A.A.D. and D.K.G. All authors have read and agreed to the published version of the manuscript.
Funding
This work was funded by the Ministry of Science and Higher Education of the Russian Federation (Goszadanie) 0075-03-2025-662, project No. FSMG-2024-0046.
Data Availability Statement
The obtained experimental data are available at zenodo.org: https://zenodo.org/records/17635365 (accessed on 11 January 2026) (DOI 10.5281/zenodo.17635365). The Matlab class “TEVP” developed by the authors and used to automate ECM parameterization, validation and results analysis is available at: https://github.com/eealexey/TEVP-Thevenin-Equivalent-Model-Parameterization (accessed on 11 January 2026).
Conflicts of Interest
The authors declare no conflicts of interest.
Abbreviations
The following abbreviations are used in this manuscript:
| BMS | Battery Management System |
| ECM | Equivalent Circuit Model |
| HPPC | Hybrid Pulse Power Characterization |
| RMSE | Root Mean Square Error |
| SoC | State of Charge |
| SoH | State of Health |
| OCV | Open Circuit Voltage |
| UDDS | Urban Dynamometer Driving Schedule |
References
- Plett, G.L. Battery Management Systems, Volume I: Battery Modeling; Artech House: Norwood, MA, USA, 2015. [Google Scholar]
- Doyle, M.; Fuller, T.F.; Newman, J. Modeling of Galvanostatic Charge and Discharge of the Lithium/Polymer/Insertion Cell. J. Electrochem. Soc. 1993, 140, 1526–1533. [Google Scholar] [CrossRef] [Scilit]
- Newman, J.; Thomas-Alyea, K.E. Electrochemical Systems, 3rd ed.; John Wiley & Sons: Hoboken, NJ, USA, 2012; ISBN 978-0-471-47756-3. [Google Scholar]
- Ramadesigan, V.; Northrop, P.W.C.; De, S.; Santhanagopalan, S.; Braatz, R.D.; Subramanian, V.R. Modeling and Simulation of Lithium-Ion Batteries from a Systems Engineering Perspective. J. Electrochem. Soc. 2012, 159, R31–R45. [Google Scholar] [CrossRef] [Scilit] [PubMed]
- Severson, K.A.; Attia, P.M.; Jin, N.; Perkins, N.; Jiang, B.; Yang, Z.; Chen, M.H.; Aykol, M.; Herring, P.K.; Fraggedakis, D.; et al. Data-Driven Prediction of Battery Cycle Life before Capacity Degradation. Nat. Energy 2019, 4, 383–391. [Google Scholar] [CrossRef] [Scilit]
- Ren, Z.; Du, C. A Review of Machine Learning State-of-Charge and State-of-Health Estimation Algorithms for Lithium-Ion Batteries. Energy Rep. 2023, 9, 2993–3021. [Google Scholar] [CrossRef] [Scilit]
- He, H.; Xiong, R.; Guo, H.; Li, S. Comparison Study on the Battery Models Used for the Energy Management of Batteries in Electric Vehicles. Energy Convers. Manag. 2012, 64, 113–121. [Google Scholar] [CrossRef] [Scilit]
- Jossen, A. Fundamentals of Battery Dynamics. J. Power Sources 2006, 154, 530–538. [Google Scholar] [CrossRef] [Scilit]
- Li, J.; Klee Barillas, J.; Guenther, C.; Danzer, M.A. A Comparative Study of State of Charge Estimation Algorithms for LiFePO4 Batteries Used in Electric Vehicles. J. Power Sources 2013, 230, 244–250. [Google Scholar] [CrossRef] [Scilit]
- Ria, A.; Dini, P. A Compact Overview on Li-Ion Batteries Characteristics and Battery Management Systems Integration for Automotive Applications. Energies 2024, 17, 5992. [Google Scholar] [CrossRef] [Scilit]
- Stroe, A.I.; Stroe, D.I.; Swierczynski, M.; Teodorescu, R.; Kær, S.K. Lithium-Ion Battery Dynamic Model for Wide Range of Operating Conditions. In Proceedings of the 2017 International Conference on Optimization of Electrical and Electronic Equipment, OPTIM 2017 and 2017 Intl Aegean Conference on Electrical Machines and Power Electronics, ACEMP, Brasov, Romania, 25–27 May 2017; Volume 2017, pp. 660–666. [Google Scholar] [CrossRef] [Scilit]
- Saldaña, G.; San Martín, J.I.; Zamora, I.; Asensio, F.J.; Oñederra, O. Analysis of the Current Electric Battery Models for Electric Vehicle Simulation. Energies 2019, 12, 2750. [Google Scholar] [CrossRef] [Scilit]
- Bruch, M.; Millet, L.; Kowal, J.; Vetter, M. Novel Method for the Parameterization of a Reliable Equivalent Circuit Model for the Precise Simulation of a Battery Cell’s Electric Behavior. J. Power Sources 2021, 490, 229513. [Google Scholar] [CrossRef] [Scilit]
- Plett, G.L. Extended Kalman Filtering for Battery Management Systems of LiPB-Based HEV Battery Packs—Part 3. State and Parameter Estimation. J. Power Sources 2004, 134, 277–292. [Google Scholar] [CrossRef] [Scilit]
- Yajia, P.; Li, J.; Tian’an, W.; Shengxun, Y.; Yunxuan, Z.; Zigang, L.; Yanwen, H. Online Estimation of the State of Health for the Lithium-Ion Battery Based on Open Circuit Model. IEEE Access 2025, 13, 43490–43507. [Google Scholar] [CrossRef] [Scilit]
- Shen, J.; Liu, W.; Shu, X.; Shen, S.; Liu, Y.; Wei, F.; Chen, Z.; Xia, X. Simultaneous Estimation of SOC and Capacity for Lithium-Ion Battery Packs throughout Full Lifespan Based on Migration Modeling. Energy 2025, 336, 138441. [Google Scholar] [CrossRef] [Scilit]
- Ho, K.C.; Khanh, D.N.; Hsueh, Y.F.; Wang, S.C.; Liu, Y.H. Deep Learning Approach for Equivalent Circuit Model Parameter Identification of Lithium-Ion Batteries. Electronics 2025, 14, 2201. [Google Scholar] [CrossRef] [Scilit]
- Leonori, S.; Mostacciuolo, E.; Baccari, S.; Di Luzio, F. An Advanced Li-Ion Cell Equivalent Circuit Model Using a Neuro-Physical Approach. J. Energy Storage 2025, 139, 118623. [Google Scholar] [CrossRef] [Scilit]
- Baccari, S.; Sagnelli, S.; Vasca, F.; Iannelli, L. A Switched Electrical Model with Thermal Effects for Li-Ion Batteries. In Proceedings of the 2021 European Control Conference (ECC), Delft, The Netherlands, 29 June–2 July 2021; IEEE: New York, NY, USA, 2021; pp. 1271–1276. [Google Scholar]
- Jeffrey, R. Belt Battery Test Manual for Plug-In Hybrid Electric Vehicles; Idaho National Lab.: Idaho Falls, ID, USA, 2010.
- Mohamed, M.A.A.; Yu, T.F.; Ramsden, G.; Marco, J.; Grandjean, T. Advancements in Parameter Estimation Techniques for 1RC and 2RC Equivalent Circuit Models of Lithium-Ion Batteries: A Comprehensive Review. J. Energy Storage 2025, 113, 115581. [Google Scholar] [CrossRef] [Scilit]
- Peng, J.; Meng, J.; Wu, J.; Deng, Z.; Lin, M.; Mao, S.; Stroe, D.I. A Comprehensive Overview and Comparison of Parameter Benchmark Methods for Lithium-Ion Battery Application. J. Energy Storage 2023, 71, 108197. [Google Scholar] [CrossRef] [Scilit]
- Xu, B.; Lu, X.; Bai, Y. A Robust Identification Method for Inherent Parameters of Lithium Battery Considering Thermal Distribution and State of Charge. J. Energy Storage 2023, 73, 109284. [Google Scholar] [CrossRef] [Scilit]
- Jiang, Y.; Xu, J.; Jin, C.; Liu, M.; Mei, X. Effects of Stack Pressure on the Equivalent Circuit Model of Lithium-Ion Batteries. J. Energy Storage 2023, 70, 107916. [Google Scholar] [CrossRef] [Scilit]
- Yao, B.; Cai, Y.; Liu, W.; Wang, Y.; Chen, X.; Liao, Q.; Fu, Z.; Cheng, Z. State-of-Charge Estimation for Lithium-Ion Batteries Based on Modified Unscented Kalman Filter Using Improved Parameter Identification. Int. J. Electrochem. Sci. 2024, 19, 100574. [Google Scholar] [CrossRef] [Scilit]
- Di Rienzo, R.; Nicodemo, N.; Roncella, R.; Saletti, R.; Vennettilli, N.; Asaro, S.; Tola, R.; Baronti, F. Cloud-Based Optimization of a Battery Model Parameter Identification Algorithm for Battery State-of-Health Estimation in Electric Vehicles. Batteries 2023, 9, 486. [Google Scholar] [CrossRef] [Scilit]
- Wang, J.; Jia, Y.; Yang, N.; Lu, Y.; Shi, M.; Ren, X.; Lu, D. Precise Equivalent Circuit Model for Li-Ion Battery by Experimental Improvement and Parameter Optimization. J. Energy Storage 2022, 52, 104980. [Google Scholar] [CrossRef] [Scilit]
- Yu, Z.; Xiao, L.; Li, H.; Zhu, X.; Huai, R. Model Parameter Identification for Lithium Batteries Using the Coevolutionary Particle Swarm Optimization Method. IEEE Trans. Ind. Electron. 2017, 64, 5690–5700. [Google Scholar] [CrossRef] [Scilit]
- Xiang, J.; Liu, D.; Wang, S.; Wu, F. An Improved Adaptive Velocity Update Particle Swarm Optimization Algorithm for Parameter Identification of Lithium-Ion Battery. In Proceedings of the 2023 3rd New Energy and Energy Storage System Control Summit Forum (NEESSC), Mianyang, China, 26–28 September 2023; IEEE: New York, NY, USA, 2023; pp. 519–523. [Google Scholar]
- Hasanien, H.M.; Alsaleh, I.; Tostado-Véliz, M.; Alassaf, A.; Alateeq, A.; Jurado, F. Optimal Parameters Estimation of Lithium-Ion Battery in Smart Grid Applications Based on Gazelle Optimization Algorithm. Energy 2023, 285, 129509. [Google Scholar] [CrossRef] [Scilit]
- Maria, E.D.; Dallapiccola, M.; Aloisio, D.; Brunaccini, G.; Sergi, F.; Moser, D.; Barchi, G. A Data-Driven Equivalent Circuit Model’s Parameter Estimation Method Applied to Lithium-Titanate Battery. J. Energy Storage 2023, 74, 109497. [Google Scholar] [CrossRef] [Scilit]
- Lai, X.; Gao, W.; Zheng, Y.; Ouyang, M.; Li, J.; Han, X.; Zhou, L. A Comparative Study of Global Optimization Methods for Parameter Identification of Different Equivalent Circuit Models for Li-Ion Batteries. Electrochim. Acta 2019, 295, 1057–1066. [Google Scholar] [CrossRef] [Scilit]
- Kulkarni, A.; Nadeem, A.; Di Fonso, R.; Zheng, Y.; Teodorescu, R. Novel Low-Complexity Model Development for Li-Ion Cells Using Online Impedance Measurement. J. Energy Storage 2024, 91, 112029. [Google Scholar] [CrossRef] [Scilit]
- LeBel, F.A.; Messier, P.; Sari, A.; Trovão, J.P.F. Lithium-Ion Cell Equivalent Circuit Model Identification by Galvanostatic Intermittent Titration Technique. J. Energy Storage 2022, 54, 105303. [Google Scholar] [CrossRef] [Scilit]
- Hu, Y.; Wang, Y.Y. Two Time-Scaled Battery Model Identification with Application to Battery State Estimation. IEEE Trans. Control Syst. Technol. 2015, 23, 1180–1188. [Google Scholar] [CrossRef] [Scilit]
- Hao, Z.; Zhang, Q.; Wang, D.; Liu, S.; Yang, B.; Li, X. The Application of Pulse Response Analysis Method in Lithium-Ion Battery Modeling and State Estimation. J. Energy Storage 2024, 102, 114074. [Google Scholar] [CrossRef] [Scilit]
- Sun, J.; Kainz, J. Optimization of Hybrid Pulse Power Characterization Profile for Equivalent Circuit Model Parameter Identification of Li-Ion Battery Based on Taguchi Method. J. Energy Storage 2023, 70, 108034. [Google Scholar] [CrossRef] [Scilit]
- Zhang, R.; Xia, B.; Li, B.; Lai, Y.; Zheng, W.; Wang, H.; Wang, W.; Wang, M. Study on the Characteristics of a High Capacity Nickel Manganese Cobalt Oxide (NMC) Lithium-Ion Battery-an Experimental Investigation. Energies 2018, 11, 2275. [Google Scholar] [CrossRef] [Scilit]
- Cao, W.; Wang, S.; Fernandez, C.; Zou, C.; Yu, C.; Li, X. A Novel Adaptive State of Charge Estimation Method of Full Life Cycling Lithium-ion Batteries Based on the Multiple Parameter Optimization. Energy Sci. Eng. 2019, 7, 1544–1556. [Google Scholar] [CrossRef] [Scilit]
- Zhang, H.; Deng, C.; Zong, Y.; Zuo, Q.; Guo, H.; Song, S.; Jiang, L. Effect of Sample Interval on the Parameter Identification Results of RC Equivalent Circuit Models of Li-Ion Battery: An Investigation Based on HPPC Test Data. Batteries 2022, 9, 1. [Google Scholar] [CrossRef] [Scilit]
- Stroe, D.-I.; Swierczynski, M.; Stroe, A.-I.; Knudsen Kær, S. Generalized Characterization Methodology for Performance Modelling of Lithium-Ion Batteries. Batteries 2016, 2, 37. [Google Scholar] [CrossRef] [Scilit]
- Saleem, K.; Mehran, K.; Ali, Z. Online Reduced Complexity Parameter Estimation Technique for Equivalent Circuit Model of Lithium-Ion Battery. Electr. Power Syst. Res. 2020, 185, 106356. [Google Scholar] [CrossRef] [Scilit]
- Zheng, Y.; Gao, W.; Han, X.; Ouyang, M.; Lu, L.; Guo, D. An Accurate Parameters Extraction Method for a Novel On-Board Battery Model Considering Electrochemical Properties. J. Energy Storage 2019, 24, 100745. [Google Scholar] [CrossRef] [Scilit]
- Hentunen, A.; Lehmuspelto, T.; Suomela, J. Time-Domain Parameter Extraction Method for Thévenin-Equivalent Circuit Battery Models. IEEE Trans. Energy Convers. 2014, 29, 558–566. [Google Scholar] [CrossRef] [Scilit]
- Cittanti, D.; Ferraris, A.; Airale, A.; Fiorot, S.; Scavuzzo, S.; Carello, M. Modeling Li-Ion Batteries for Automotive Application: A Trade-off between Accuracy and Complexity. In Proceedings of the 2017 International Conference of Electrical and Electronic Technologies for Automotive, Turin, Italy, 15–16 June 2017; IEEE: New York, NY, USA, 2017; pp. 1–8. [Google Scholar]
- Campagna, N.; Castiglia, V.; Miceli, R.; Mastromauro, R.A.; Spataro, C.; Trapanese, M.; Viola, F. Battery Models for Battery Powered Applications: A Comparative Study. Energies 2020, 13, 4085. [Google Scholar] [CrossRef] [Scilit]
- Ceraolo, M.; Lutzemberger, G.; Poli, D.; Scarpelli, C. Model Parameters Evaluation for NMC Cells. In Proceedings of the 2019 IEEE International Conference on Environment and Electrical Engineering and 2019 IEEE Industrial and Commercial Power Systems Europe (EEEIC/I&CPS Europe), Genova, Italy, 11–14 June 2019; IEEE: New York, NY, USA, 2019; pp. 1–6. [Google Scholar]
- Dvorak, D.; Bauml, T.; Holzinger, A.; Popp, H. A Comprehensive Algorithm for Estimating Lithium-Ion Battery Parameters From Measurements. IEEE Trans. Sustain. Energy 2018, 9, 771–779. [Google Scholar] [CrossRef] [Scilit]
- Li, Z.; Shi, X.; Shi, M.; Wei, C.; Di, F.; Sun, H. Investigation on the Impact of the HPPC Profile on the Battery ECM Parameters’ Offline Identification. In Proceedings of the 2020 Asia Energy and Electrical Engineering Symposium (AEEES), Chengdu, China, 29–31 May 2020; IEEE: New York, NY, USA, 2020; pp. 753–757. [Google Scholar]
- Sergeev, A.V. TEVP Thevenin-Equivalent-Model-Parameterization Framework. Available online: https://github.com/eealexey/TEVP-Thevenin-Equivalent-Model-Parameterization (accessed on 17 December 2025).
- Dynamometer Drive Schedules. Available online: https://www.epa.gov/vehicle-and-fuel-emissions-testing/dynamometer-drive-schedules (accessed on 27 September 2025).
- Mesbahi, T.; Khenfri, F.; Rizoug, N.; Chaaban, K.; Bartholomeüs, P.; Le Moigne, P. Dynamical Modeling of Li-Ion Batteries for Electric Vehicle Applications Based on Hybrid Particle Swarm–Nelder–Mead (PSO–NM) Optimization Algorithm. Electr. Power Syst. Res. 2016, 131, 195–204. [Google Scholar] [CrossRef] [Scilit]
- Micari, S.; Foti, S.; Testa, A.; De Caro, S.; Sergi, F.; Andaloro, L.; Aloisio, D.; Leonardi, S.G.; Napoli, G. Effect of WLTP CLASS 3B Driving Cycle on Lithium-Ion Battery for Electric Vehicles. Energies 2022, 15, 6703. [Google Scholar] [CrossRef] [Scilit]
- Charbonneau, V.; Lasia, A.; Brisard, G. Impedance Studies of Li+ Diffusion in Nickel Manganese Cobalt Oxide (NMC) during Charge/Discharge Cycles. J. Electroanal. Chem. 2020, 875, 113944. [Google Scholar] [CrossRef] [Scilit]
- Dini, P.; Colicelli, A.; Saponara, S. Review on Modeling and SOC/SOH Estimation of Batteries for Automotive Applications. Batteries 2024, 10, 34. [Google Scholar] [CrossRef] [Scilit]
- Xie, J.; Wei, X.; Bo, X.; Zhang, P.; Chen, P.; Hao, W.; Yuan, M. State of Charge Estimation of Lithium-Ion Battery Based on Extended Kalman Filter Algorithm. Front. Energy Res. 2023, 11, 1180881. [Google Scholar] [CrossRef] [Scilit]

Disclaimer/Publisher’s Note: The statements, opinions and data contained in all publications are solely those of the individual author(s) and contributor(s) and not of MDPI and/or the editor(s). MDPI and/or the editor(s) disclaim responsibility for any injury to people or property resulting from any ideas, methods, instructions or products referred to in the content. |
© 2026 by the authors. Published by MDPI on behalf of the World Electric Vehicle Association. Licensee MDPI, Basel, Switzerland. This article is an open access article distributed under the terms and conditions of the Creative Commons Attribution (CC BY) license.