


Abstract
The growing worldwide prevalence of Diabetes Mellitus highlights the urgent need for effective early detection methods to enable prompt intervention. This study develops a machine learning-based decision-support prototype for predicting diabetes risk using health metrics from the DiaHealth dataset, a recently published Bangladeshi open-source dataset for Type 2 diabetes prediction. Five supervised learning algorithms were evaluated: Logistic Regression (LR), Support Vector Machine (SVM), K-Nearest Neighbour (KNN), Decision Tree (DT), and Random Forest (RF). Models were assessed across three stages: before feature scaling, after standardisation, and following hyperparameter optimisation via GridSearchCV, using accuracy, precision, recall, and F1-score as evaluation metrics. LR and SVM showed marked improvements after standardisation, consistent with their sensitivity to feature magnitude, whilst tree-based approaches such as DT and RF remained largely unchanged. KNN displayed minimal sensitivity to scaling, which is discussed in relation to the feature distributions of the dataset. Following hyperparameter tuning, RF achieved the highest accuracy of 95%, outperforming all other models. RF predictions were interpreted using Local Interpretable Model-agnostic Explanations (LIME) to promote transparency in model decision-making. The best-performing model was subsequently deployed as an interactive web-based prototype application using Streamlit, providing real-time prediction outputs. These findings demonstrate how preprocessing choices and hyperparameter tuning can differentially affect algorithm performance and illustrate the potential of combining explainable AI with practical deployment for diabetes risk assessment in a research context.
1. Introduction
Diabetes Mellitus is a chronic metabolic condition affecting millions worldwide and is a leading cause of morbidity and mortality [1]. Its increasing prevalence is linked to lifestyle factors such as poor diet, physical inactivity, and comorbidities, including obesity [2]. Early detection and timely intervention are essential in preventing complications and reducing the long-term burden on healthcare systems [3]. Conventional diagnostic methods are often time-consuming, invasive, and inaccessible in low-resource settings [4], which has driven growing interest in data-driven approaches for early screening and risk prediction [5].
Recent advances in Machine Learning (ML) have created new opportunities in healthcare, particularly in disease prediction and clinical decision support [6]. When combined with explainable methods and user-friendly platforms, ML models can support clinicians and empower patients through accurate, real-time insights [7]. Prior diabetes prediction studies focus primarily on algorithmic accuracy using well-established datasets and rarely examine preprocessing, explainability, and deployment within a unified framework. This study addresses that gap by developing, evaluating, and deploying supervised ML models for diabetes prediction using DiaHealth, a recently published Bangladeshi population-specific dataset, within an end-to-end pipeline that integrates preprocessing analysis, model optimisation, explainable AI, and real-time web deployment [8].
The study aims to (i) develop and evaluate five supervised ML classifiers for diabetes prediction; (ii) investigate the effects of feature scaling and hyperparameter tuning on model performance; (iii) apply explainable AI (XAI) techniques to interpret predictions; and (iv) deploy the best-performing model as an interactive web-based application for real-time diabetes risk assessment.
The following research questions guide the study:
RQ1: How does feature scaling impact the performance of various supervised ML algorithms in predicting the onset of diabetes?
RQ2: Which supervised ML algorithm provides the most accurate and generalisable predictions for diabetes onset, and how does hyperparameter tuning influence its performance?
RQ3: How can XAI techniques such as LIME enhance the interpretability of ML predictions in healthcare applications?
RQ4: How effective is a deployed web-based decision-support tool developed using the best-performing ML model in facilitating early diabetes detection?
2. Related Work
Diabetes Mellitus is a chronic metabolic disorder characterised by hyperglycaemia resulting from elevated blood glucose levels. Glucose from dietary sources is converted into energy through the action of insulin, a hormone that regulates blood sugar homeostasis [9]. Deficiencies in insulin production or cellular resistance to its effects lead to persistent hyperglycaemia, which over time can inflict irreversible damage on vital organs such as the kidneys, heart, and eyes [10]. The primary classifications include Type 1, Type 2, and Gestational Diabetes. Type 1 arises from autoimmune destruction of pancreatic beta cells and predominantly affects children and young adults [11]. Type 2, constituting over 90% of global cases, is marked by insulin resistance and eventual beta-cell dysfunction, with key risk factors including advancing age, obesity, sedentary lifestyle, and genetic predisposition [12]. Gestational Diabetes emerges during pregnancy due to hormonal shifts that impair insulin sensitivity, potentially resolving post-partum but increasing long-term risks for both mother and child [13].
Untreated or poorly managed diabetes frequently leads to debilitating complications such as nephropathy, retinopathy, and cardiovascular disease, highlighting the urgency of early detection [14]. ML has emerged as a promising tool for diabetes prediction, using datasets to identify patterns and risk factors. Olisah et al. (2022) employed polynomial regression for imputing missing values and Spearman correlation for feature selection in building predictive models [15], though their approach lacks robustness against multicollinearity, limiting generalisability to diverse populations. Febrian et al. (2023) compared KNN and Naive Bayes classifiers for early detection, with Naive Bayes yielding superior performance [16]; however, class imbalance was not addressed, which may bias results towards the majority class in real-world settings. Khaleel and Al-Bakry (2023) evaluated multiple algorithms, deeming LR superior to KNN and Naive Bayes [17]; while LR’s interpretability is a strength, the small sample size raises concerns about overfitting and external validity. Khanam and Foo (2021) applied a suite of ML algorithms alongside neural networks (NN) using Pearson’s correlation for feature analysis, with LR and SVM achieving 77% and 78% accuracy, respectively, while a two-hidden-layer NN reached 88.6% [18]; the black-box nature of NN models complicates clinical adoption, and the absence of cross-validation questions the stability of these results. Chang et al. (2022) addressed class imbalance using SMOTE and applied Principal Component Analysis (PCA) for dimensionality reduction, though PCA’s linear assumptions may discard non-linear relationships critical in biological data [19]. Refat et al. (2021) reported 100% accuracy using XGBoost on a 17-attribute dataset [20], which raises concerns regarding data leakage or overfitting, given that such performance is rarely observed in real-world medical prediction. Lyngdoh et al. (2021) evaluated KNN, Naive Bayes, Decision Tree, RF, and SVM, reporting 76% accuracy with KNN (K = 10); whilst overfitting was acknowledged, no mitigation strategies were proposed beyond calling for larger datasets [21]. Hassan et al. (2021) applied LR to a Bangladeshi dataset, achieving 88% accuracy, though regional specificity limits generalisability [22]. Deberneh and Kim (2021) predicted Type 2 diabetes using SVM on a Seoul-based dataset, achieving 73% accuracy, yet ensemble methods were not explored to improve results [23]. Ahmad et al. (2021) emphasised HbA1c over fasting plasma glucose as a predictor, providing valuable biomarker insights, though reliance on single metrics ignores synergistic effects among features [24]. Chou et al. (2023) applied LR, NN, and DT to Taiwanese data, with DT at 95.3% accuracy, though high accuracy on a single dataset invites questions about transferability [25]. Laila et al. (2022) applied ensemble techniques including RF, AdaBoost, and Bagging with 10-fold cross-validation, achieving 97.12% accuracy using RF, though computational overhead and interpretability were not addressed [26].
Most of the literature reports high accuracies without proper clinical benchmarking, frequently relying on outdated and ethnically biassed public datasets such as the PIMA Indian Diabetes. Overfitting, inadequate handling of class imbalance, and limited external validation are recurrent flaws, eroding confidence in these models for practical use. These limitations highlight the need for standardised evaluation frameworks and diverse, population-specific datasets.
ML models in healthcare frequently achieve high accuracy, yet their black-box nature raises ethical and practical concerns, as clinicians require transparency to build trust in AI-assisted decisions [27]. Model-agnostic XAI techniques such as LIME and SHAP address this by explaining individual predictions through feature contributions rather than global model behaviour [28]. However, as post hoc methods, they approximate the model’s behaviour rather than revealing its true internal logic, which can lead to misleading explanations if the surrogate model diverges significantly from the original. Tasin et al. (2023) demonstrated this by applying LIME to an XGBoost model, achieving 81% accuracy and 0.84 AUC for diabetes prediction [29]. SHAP visualisations highlighted feature importance, while LIME identified glucose above 140.25 mg/dL and more than six pregnancies as predictors of diabetes with 0.80 confidence. This instance-level focus neglects global patterns, and the limited dataset size questions the generalisability of explanations. Many studies apply XAI superficially without validating explanations against domain expertise, and few addressescomputational costs or workflow integration.
Argumentation-based approaches represent a formally grounded alternative to post hoc explanation methods. Caroprese et al. [30] proposed argumentation frameworks as a principled basis for explainable AI in medical informatics, demonstrating that structured logical reasoning can anchor AI decisions in verifiable, rule-based justifications rather than statistical approximations. Although such approaches have not yet been widely adopted in applied clinical ML, their development points towards an important direction: moving beyond surrogate explanation models to frameworks that satisfy the transparency demands of clinical practice and data protection regulations such as the GDPR.
Accurate predictive models require effective deployment to achieve real-world clinical impact, yet this aspect remains underexplored. Menon et al. (2022) deployed an SVM-based diabetes prediction model using Flask with pickle serialisation and a user form for real-time predictions, though this approach lacks scalability for high-traffic use and overlooks security vulnerabilities in API endpoints [31]. Sujatha et al. (2021) similarly used Flask for a loan approval model with HTML and CSS interfaces, though the simplicity may not suffice for complex healthcare interactions requiring data privacy compliance [32]. Streamlit offers an alternative for rapid, interactive applications supporting Python libraries and custom interfaces [33], though its prototyping focus may compromise production-grade robustness, such as handling concurrent users or integrating with electronic health records. Most existing studies stop at the experimental stage and do not address practical deployment challenges such as model drift, security, or integration with clinical systems.
Existing studies on diabetes prediction largely focus on isolated algorithmic performance using outdated or population-biassed datasets, with limited attention to preprocessing effects, explainability, or real-world deployment as explained in Table 1. The present study addresses these gaps by adopting an end-to-end, interpretable, and deployment-oriented approach using a newly published Bangladeshi dataset.
Table 1.
Summary comparison of prior diabetes prediction studies.
3. Methods
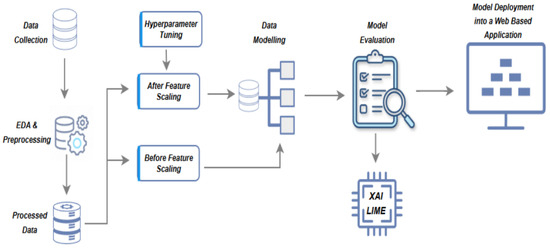
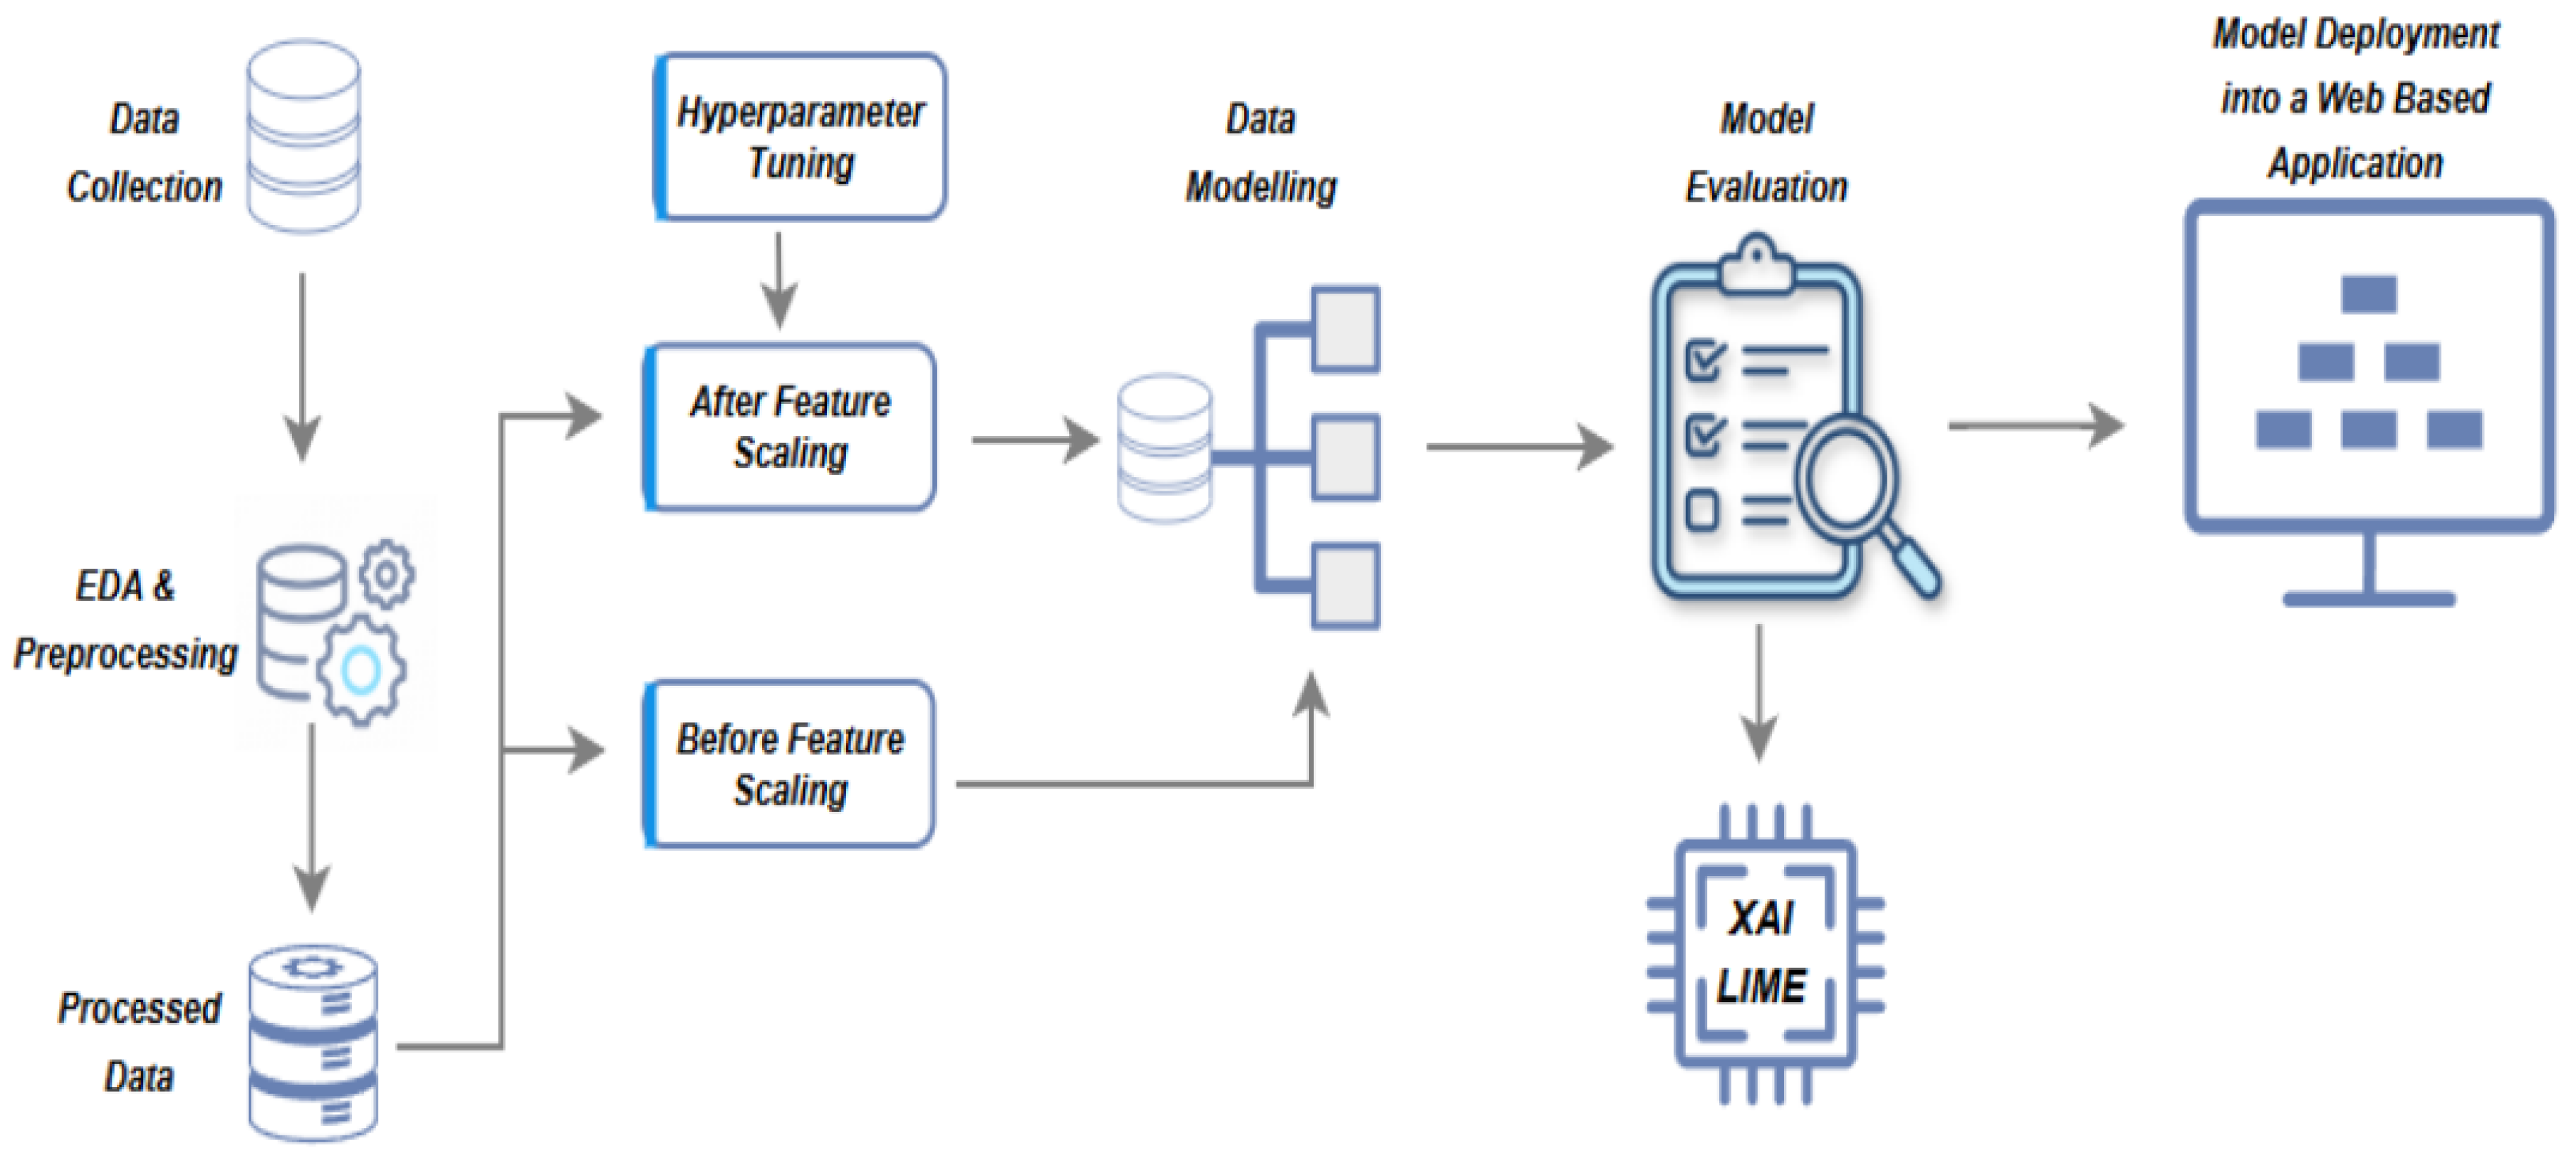
This study follows a structured experimental pipeline encompassing data preprocessing, feature selection, model training, hyperparameter optimisation, and validation explained Figure 1. All models were evaluated using a consistent train–test split protocol alongside standardised performance metrics to ensure equitable comparison and experimental reproducibility. Implementation tools are reported for completeness, while methodological decisions are detailed to enable independent replication. This research was conducted at Teesside University, United Kingdom, during January–April 2025.
Figure 1.
Methodology diagram for the proposed model.
The study used an open-source dataset published on 5 September 2024. The dataset is a supervised classification dataset with a binary target variable. It comprises 5437 rows and 15 columns, making it suitable for the objectives of this study. It includes clinical variables related to patients and is particularly relevant given the limited prior research using this dataset, as it was only recently published.
Figure 1 explains the workflow of the methodology adopted in this research. The dataset consists of both categorical and numerical features. The numerical features are data points represented by numeric values. When certain data points are highly different from the entire dataset, such extreme values are referred to as outliers. This might occur as an error during data computation or distribution. These outliers, if not identified and properly handled, can spoil the analysis [34].
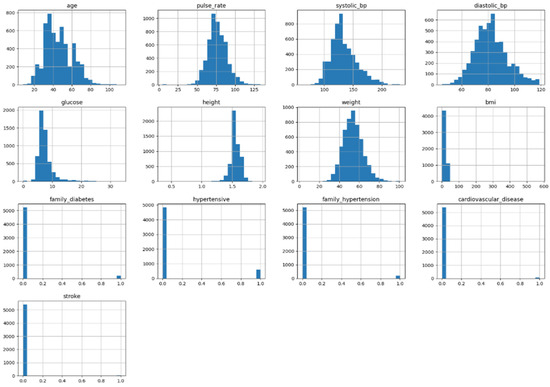
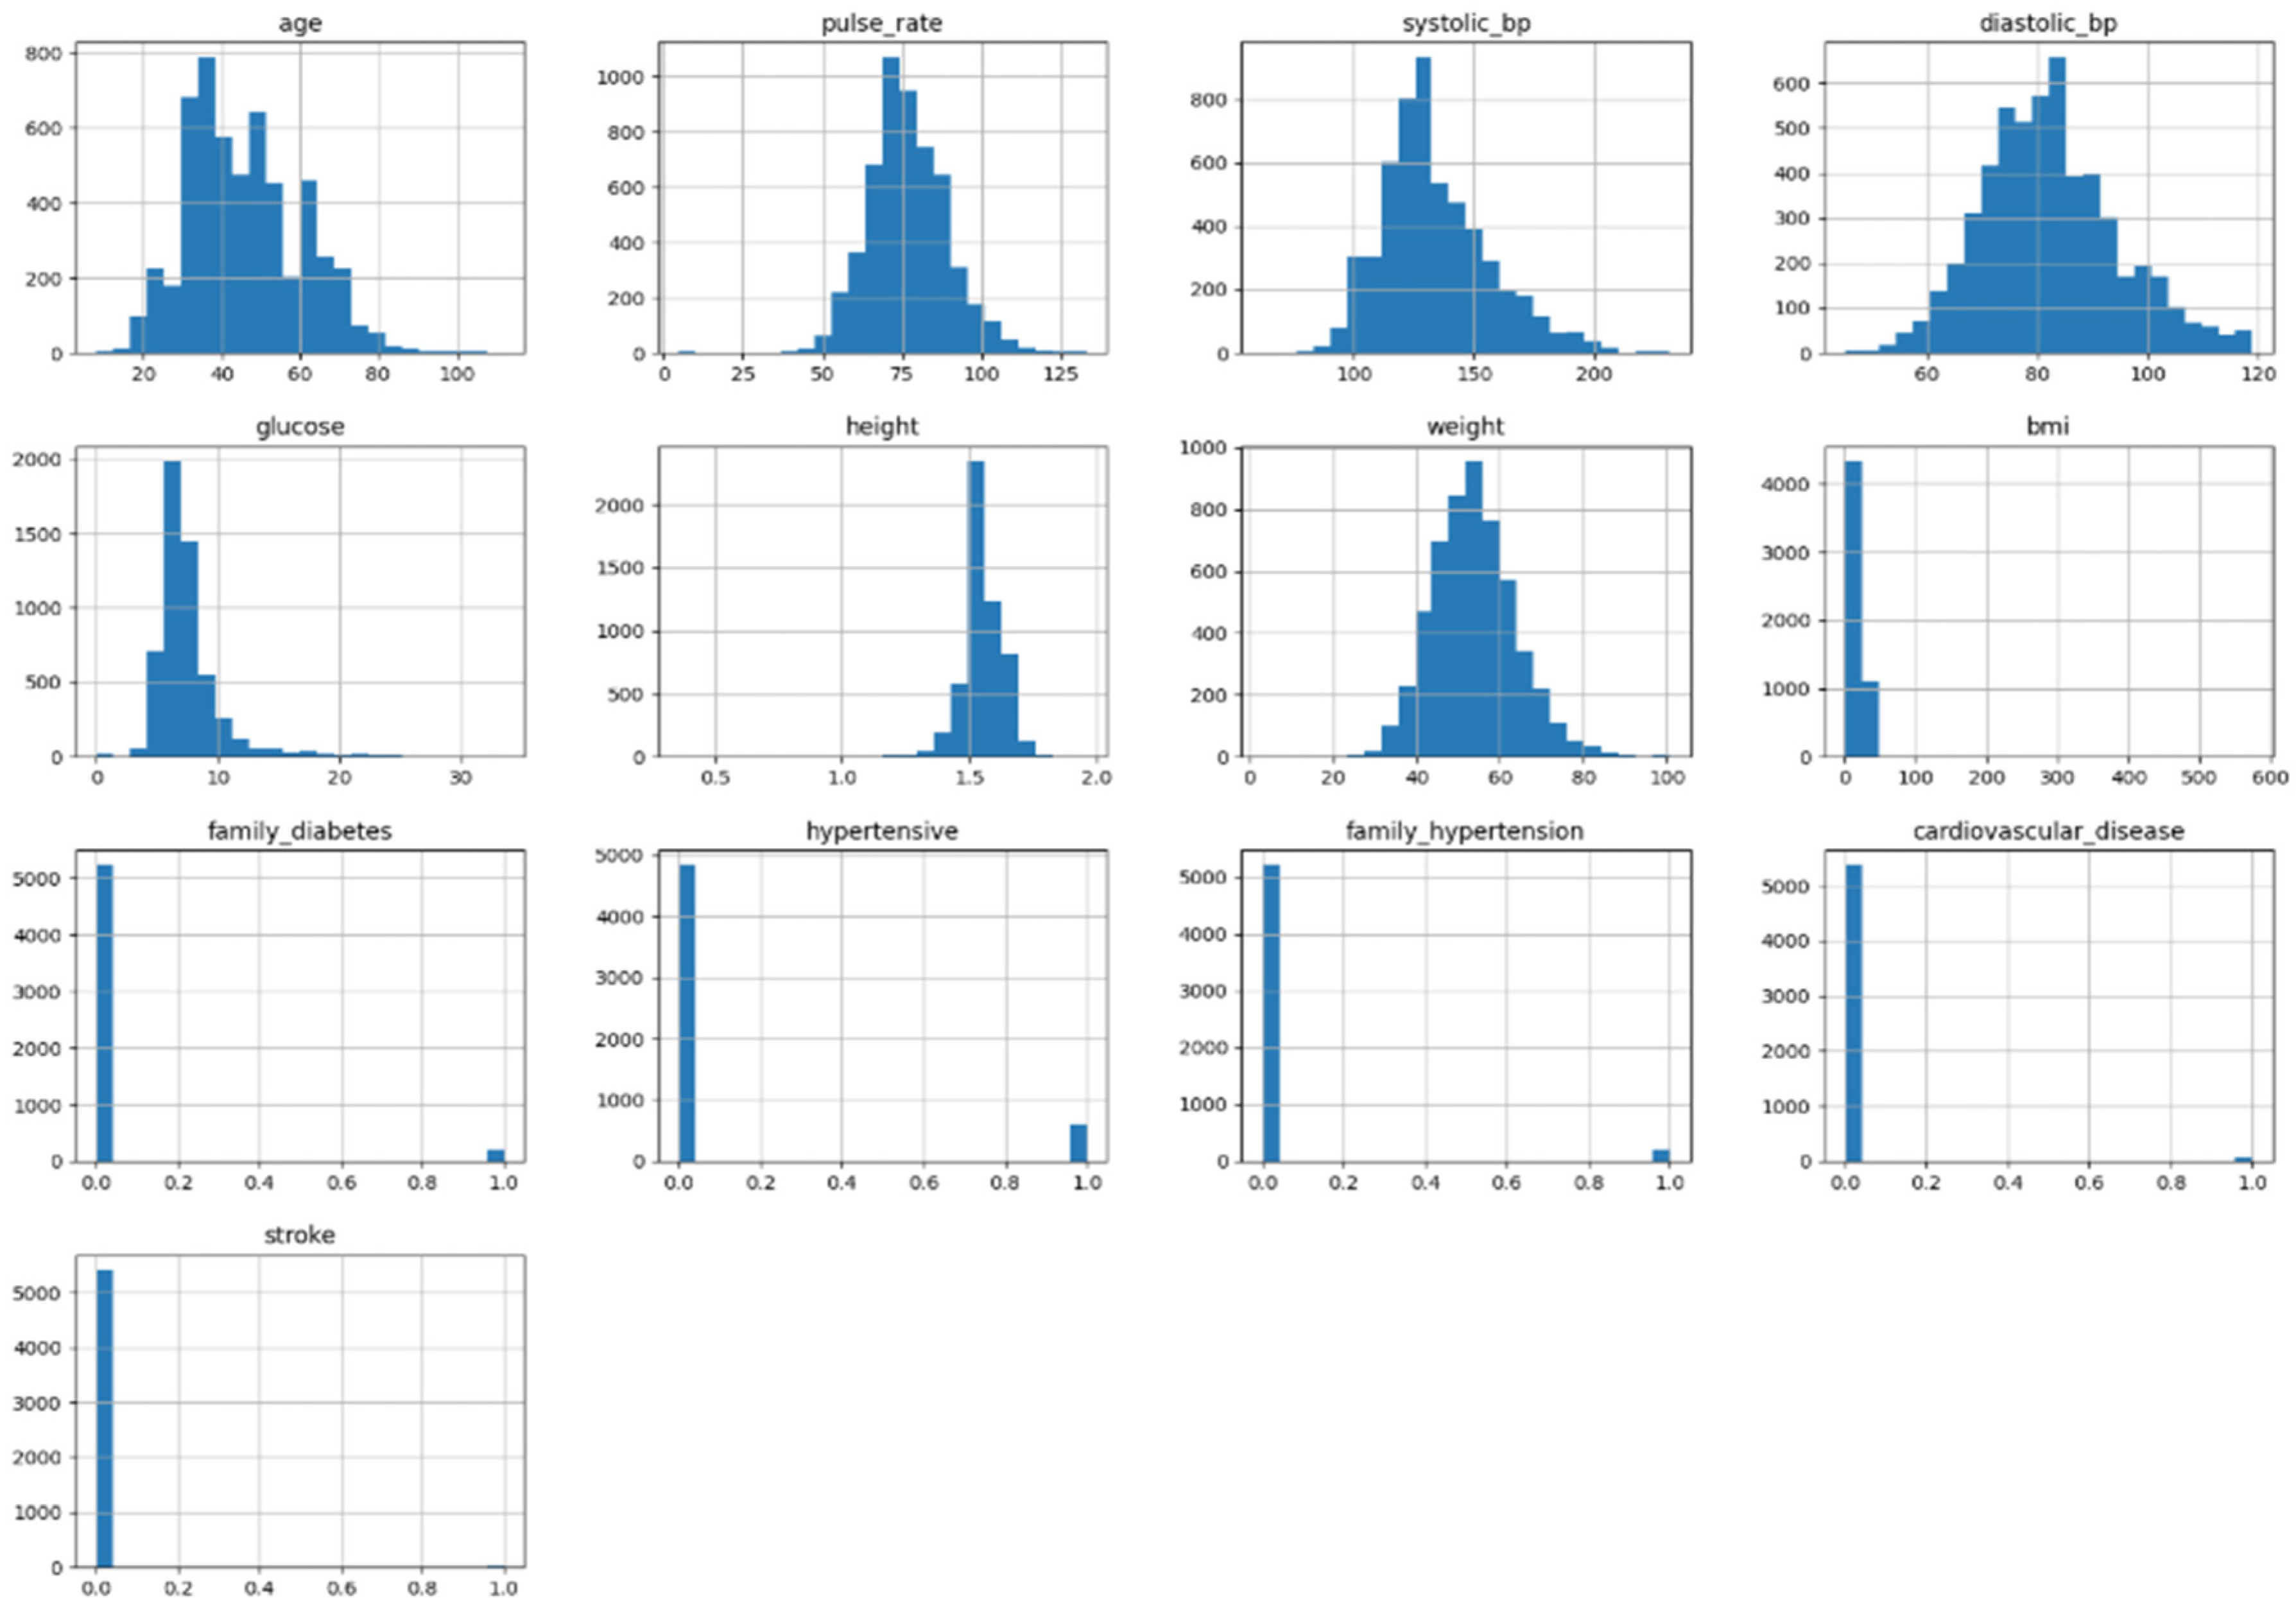
Figure 2 shows a histogram chart illustrating the distribution of the dataset across each feature. It is observed that some features, such as the stroke feature, show no variation in their distribution and may therefore not contribute meaningfully to model predictions. Python 3 was used primarily for data analysis, modelling, and deployment. Code was developed and executed using Visual Studio Code (VS Code- version 1.97) and Google Colab, ensuring reproducibility via Jupyter notebooks shared in the repository.
Figure 2.
A histogram chart showing the distribution of data in the continuous variable.
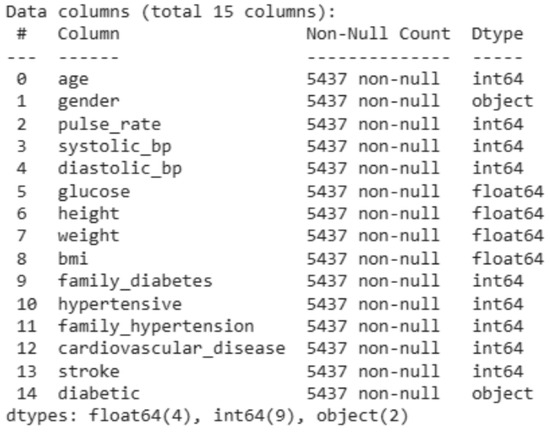
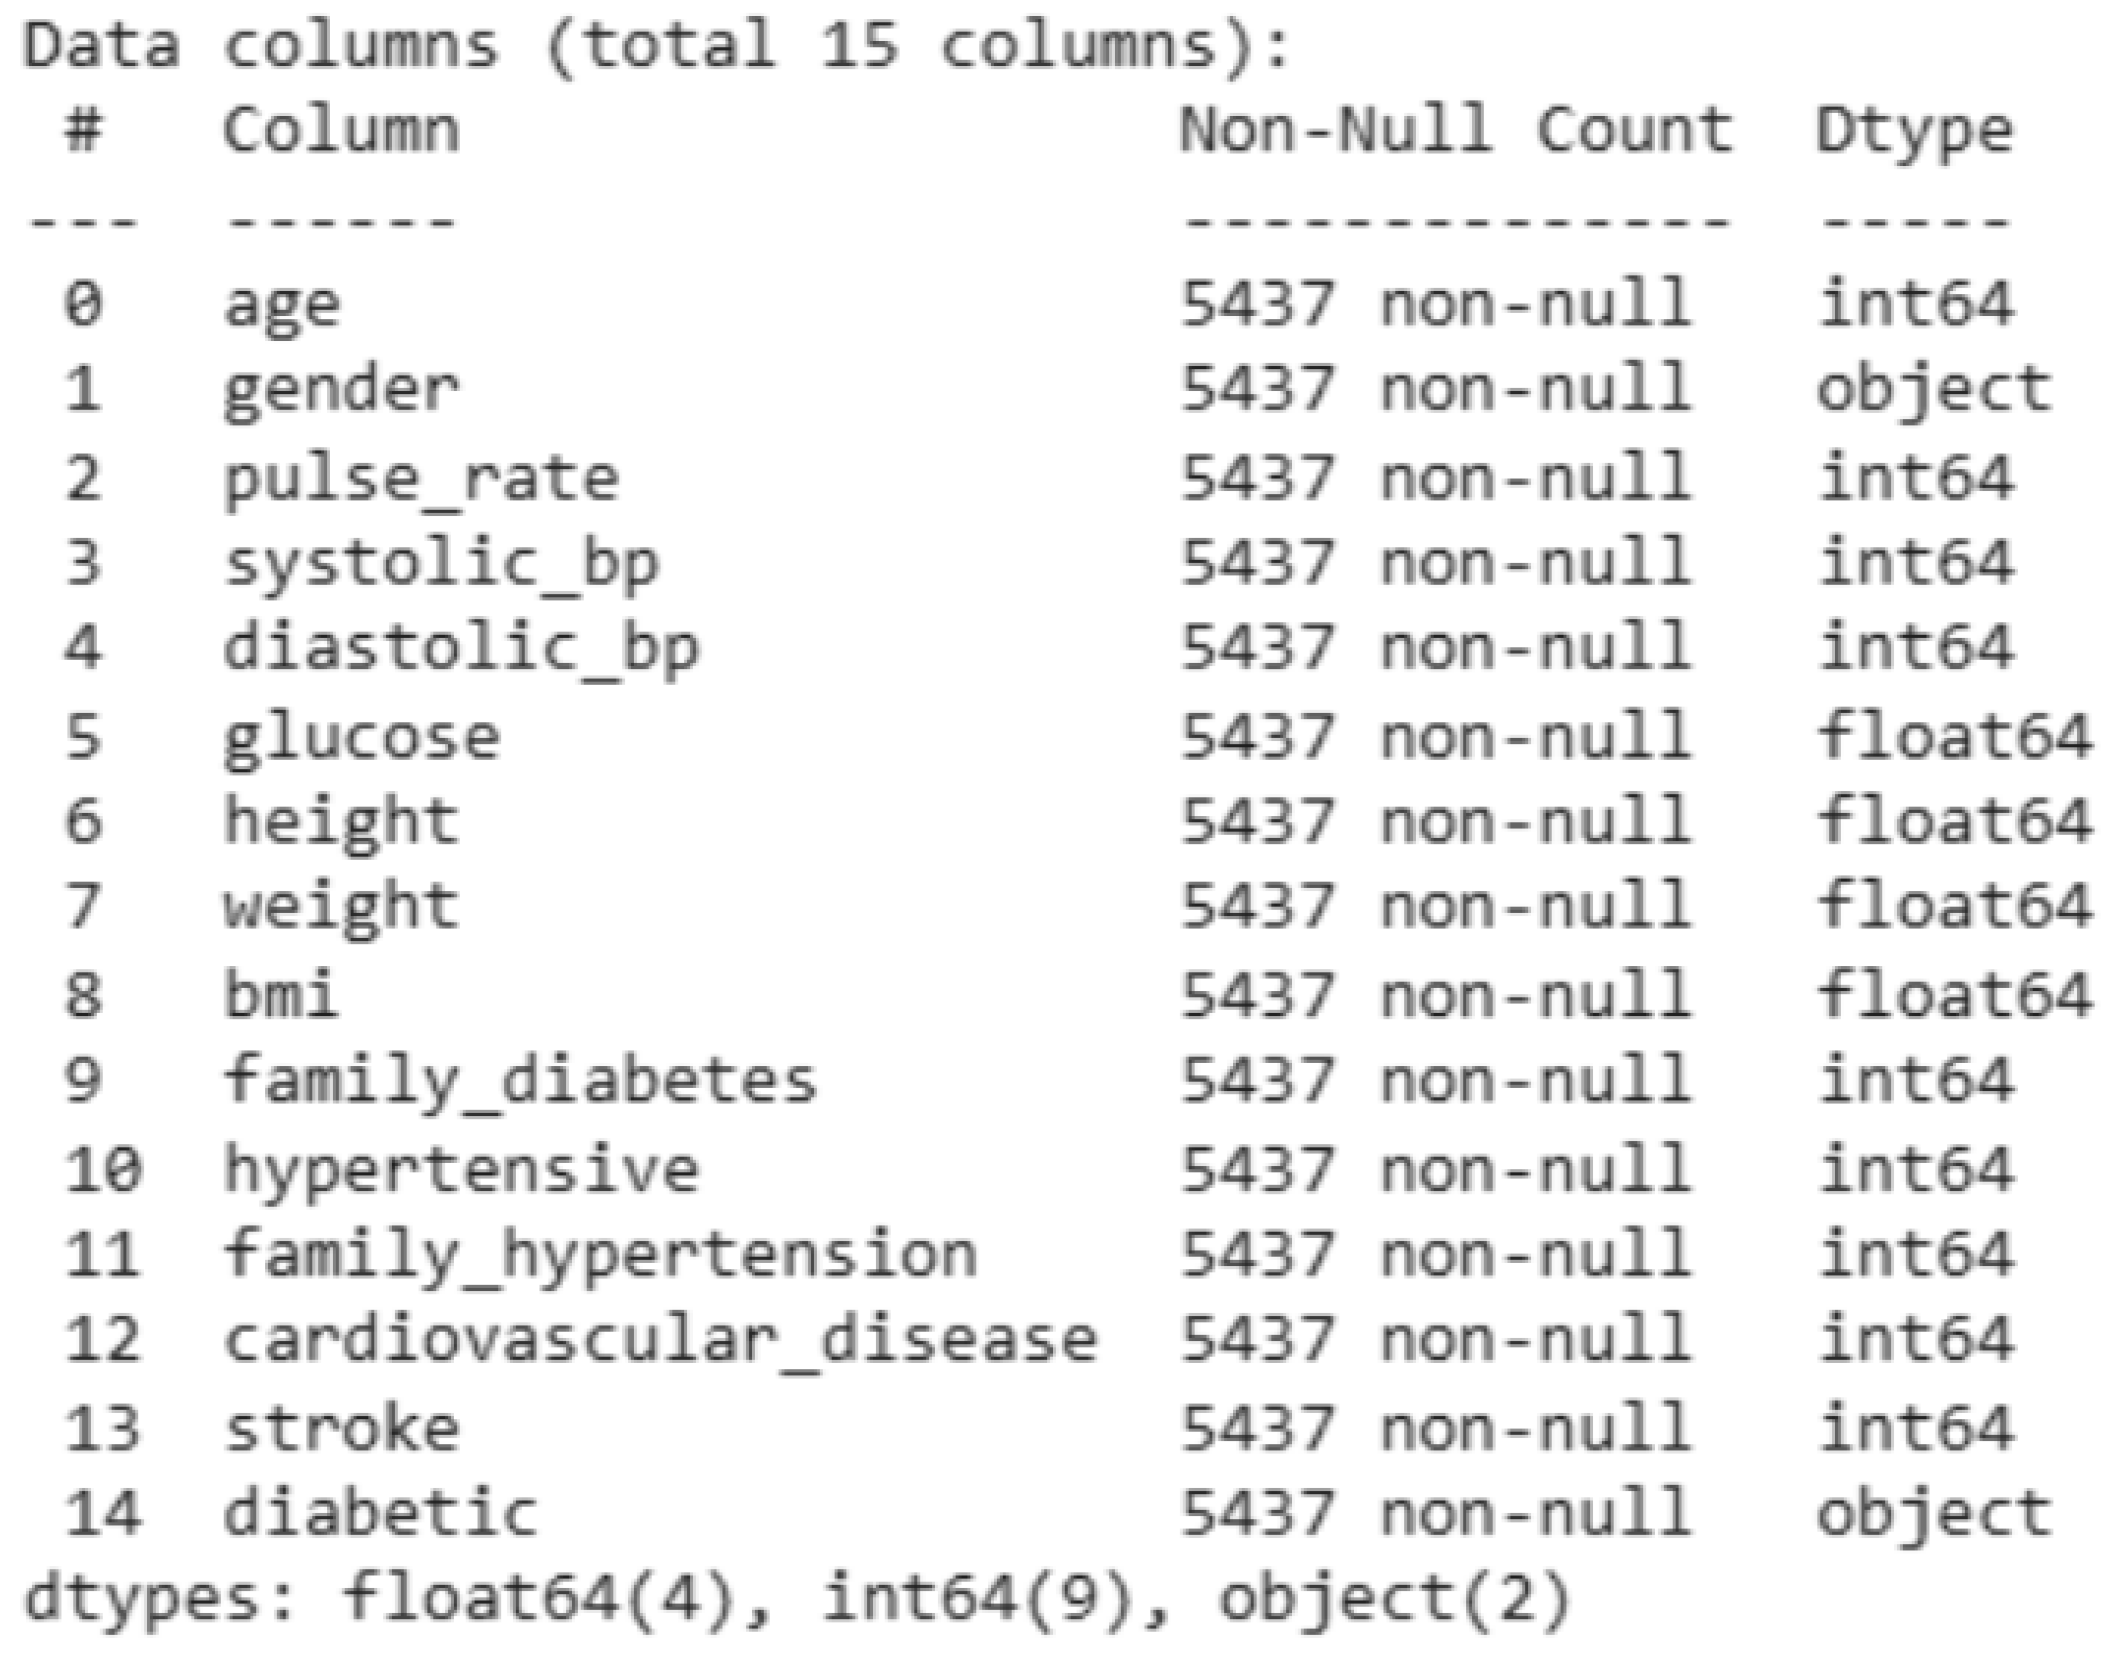
Data preprocessing included categorical encoding, handling class imbalance with SMOTE, outlier analysis, feature selection, and standard scaling. The final step in the preprocessing phase before inputting data into the model was data splitting. Figure 3 shows the data information.
Figure 3.
The data frame information.
The pre-processed data was used to train five supervised ML algorithms suited to classification tasks.
Logistic Regression (LR): LR is an ML algorithm that uses a statistical framework to tackle classification tasks. The model employs the sigmoid function to transform input variables, allowing it to predict the probability that a given instance belongs to a particular class. In binary classification, the two classes are typically represented as 1 and 0. The mathematical formulation of LR is
where
- is the probability that the sample belongs to the positive class;
- is the input variable;
- β0, β1 are the weights or coefficients of the input variables.
Support Vector Machine (SVM): SVM is a supervised ML algorithm that handles classification by categorising data into groups separated by a hyperplane, which in binary classification is a boundary distinguishing two classes. Support vectors are the closest data points to the hyperplane from each class and define the margin. SVM optimises the hyperplane to maximise this margin, reducing classification errors and enhancing accuracy [35].
K-Nearest Neighbour (KNN): KNN is a distance-based supervised ML technique that classifies a new data point by examining the nearest data points from the training set. The closest data points to the new instance are referred to as its neighbours, whilst k denotes the number of nearest neighbours considered. The algorithm assigns the new data point to the class with the greatest number of neighbours. Euclidean distance is used to compute the distance between data points [36,37]. The mathematical expression for Euclidean distance is as follows:
where
- and are the two sample points with coordinates ;
- is the number of dimensions (features) in the sample;
- is the Euclidean distance.
Decision Tree (DT): The DT algorithm classifies data by applying decision rules derived from dataset features. It uses a hierarchical tree structure beginning with a root node representing the full dataset, which splits into decision nodes and eventually into leaf nodes representing final classifications. The algorithm uses Gini impurity or entropy to select features that minimise impurity and maximise information gain, repeating iteratively until reaching maximum depth or a stopping criterion.
Random Forest (RF): RF is an ensemble learning method that combines multiple individual models to make predictions. It employs the bagging technique, which involves generating multiple random subsets from the training dataset. Each subset is used to independently train a DT model. The final prediction is derived by aggregating the outcomes of all individual DTs, which helps mitigate overfitting and improve accuracy [38].
Hyperparameter Tuning: Parameters generated during model computation that aid predictions are referred to as model parameters. Variables defined by the researcher prior to training are termed hyperparameters. The process of selecting the best hyperparameters to maximise model performance is called hyperparameter tuning. Grid Search CV is a widely used technique for this purpose [39]. It tests predefined hyperparameter combinations by training and evaluating each model via k-fold cross-validation, splitting the dataset into k folds and using k−1 folds for training and one for validation.
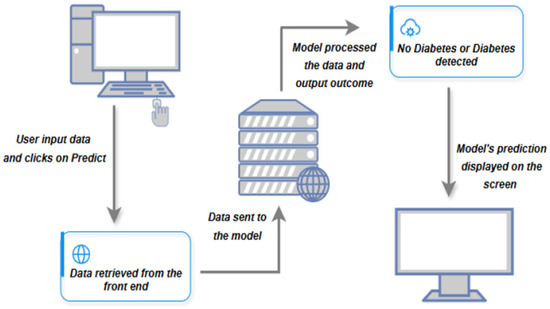
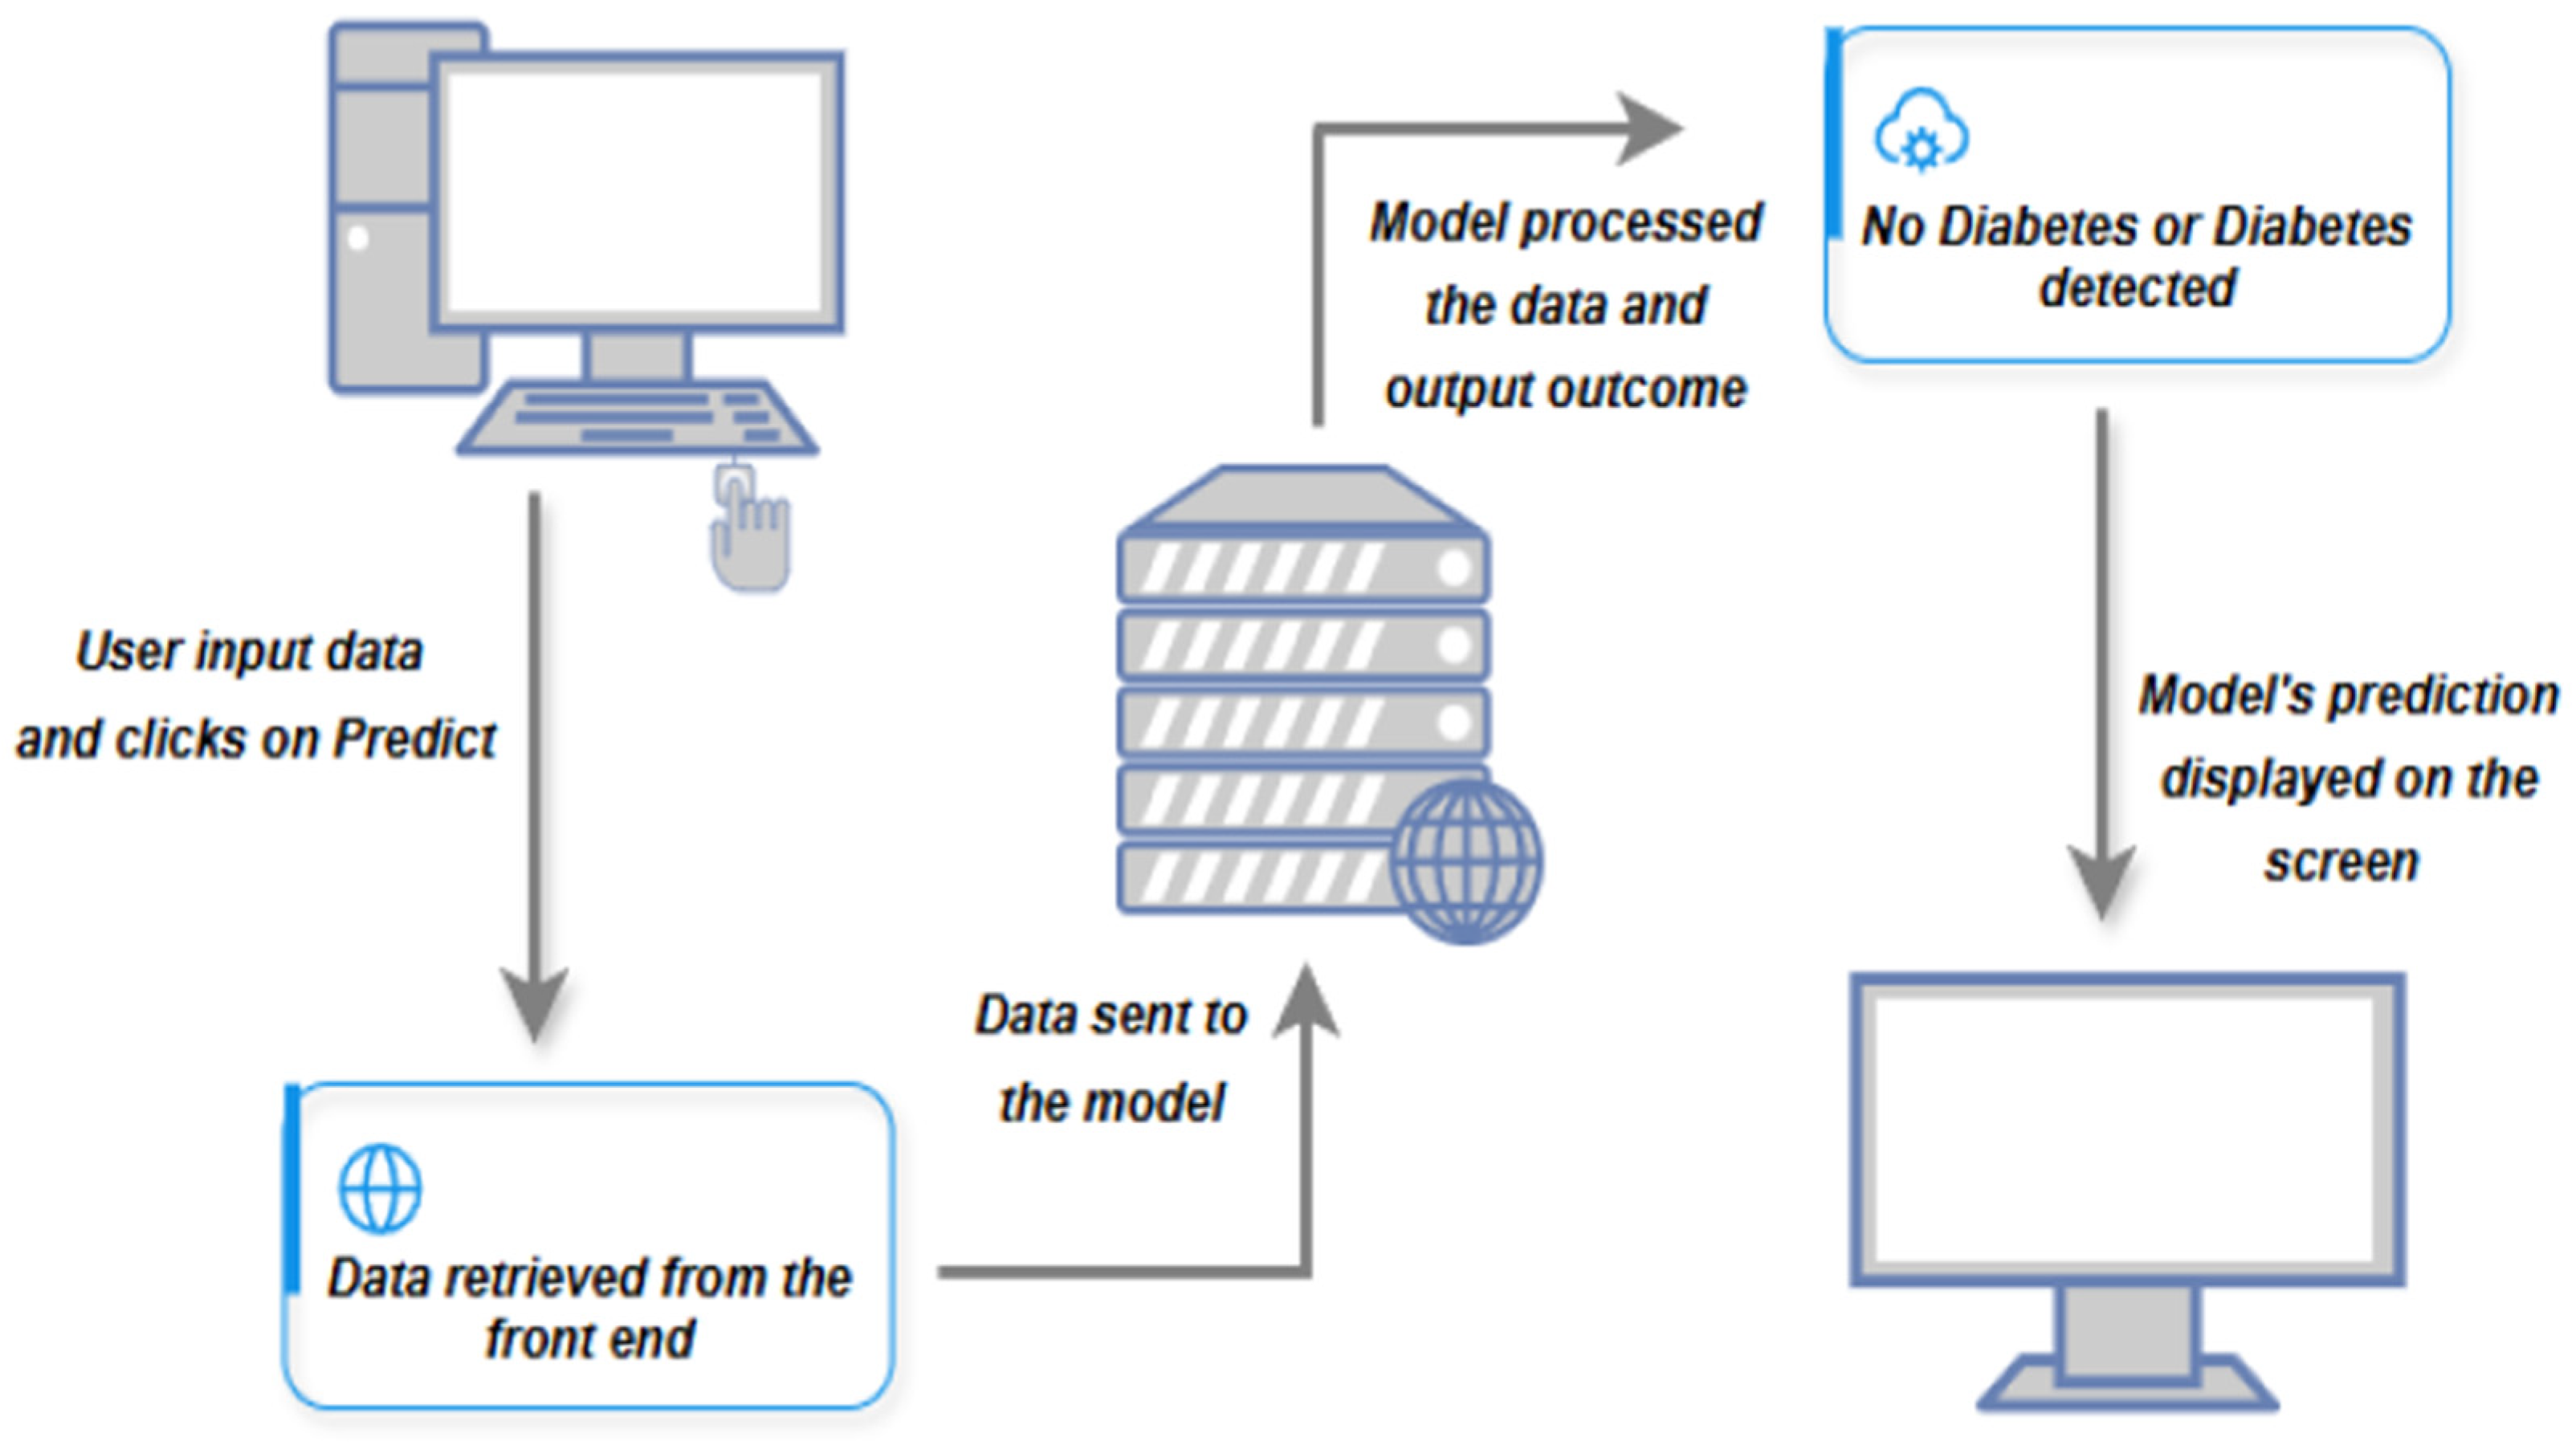
Deployment: The best-performing model was stored in a pickle file and deployed as an interactive web application using the Streamlit framework, an open-source Python-based platform for building and sharing ML applications. CSS and HTML were used to structure and style the front end of the application.
The ML models were selected to represent complementary learning paradigms commonly employed in clinical prediction tasks. LR was included as a transparent interpretable baseline, RF as a robust ensemble benchmark, and KNN, SVM, and DT to enable systematic comparison of preprocessing and optimisation effects across algorithm families.
4. Implementation and Results
The dataset was split into features (X) and target (Y), then divided into 80:20 train–test sets. Five algorithms, LR, KNN, SVM, DT, and RF, were trained in pre- and post-scaling. Hyperparameter tuning was performed using GridSearch with cross-validation. Model performance was assessed using Accuracy, Precision, Recall, and F1-score. After evaluation, the best-performing model was analysed for feature importance and saved as a pickle file for future use. For deployment, the model was integrated into a user-friendly web application using Streamlit, an open-source Python framework for building interactive web apps. The development was carried out in Visual Studio Code (VS Code). The web application features a clean homepage that directs users to a prediction page. Users can input their data, click the Predict button, and receive real-time prediction results instantly. In the first modelling experiment, the training dataset was used without feature scaling. The model was trained using ML algorithms, including LR, KNN, SVM, DT, and RF. Performance metrics shown in Table 2 for each model were evaluated, and the RF model achieved the highest accuracy, with a score of 94%.
Table 2.
Performance metrics of models before feature scaling.
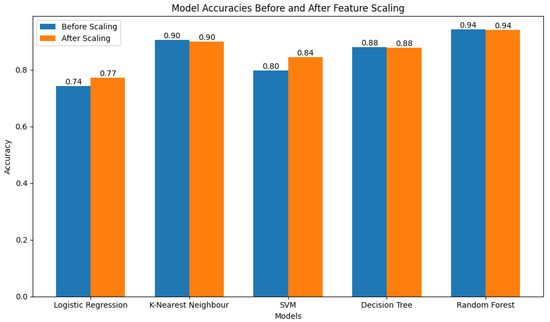
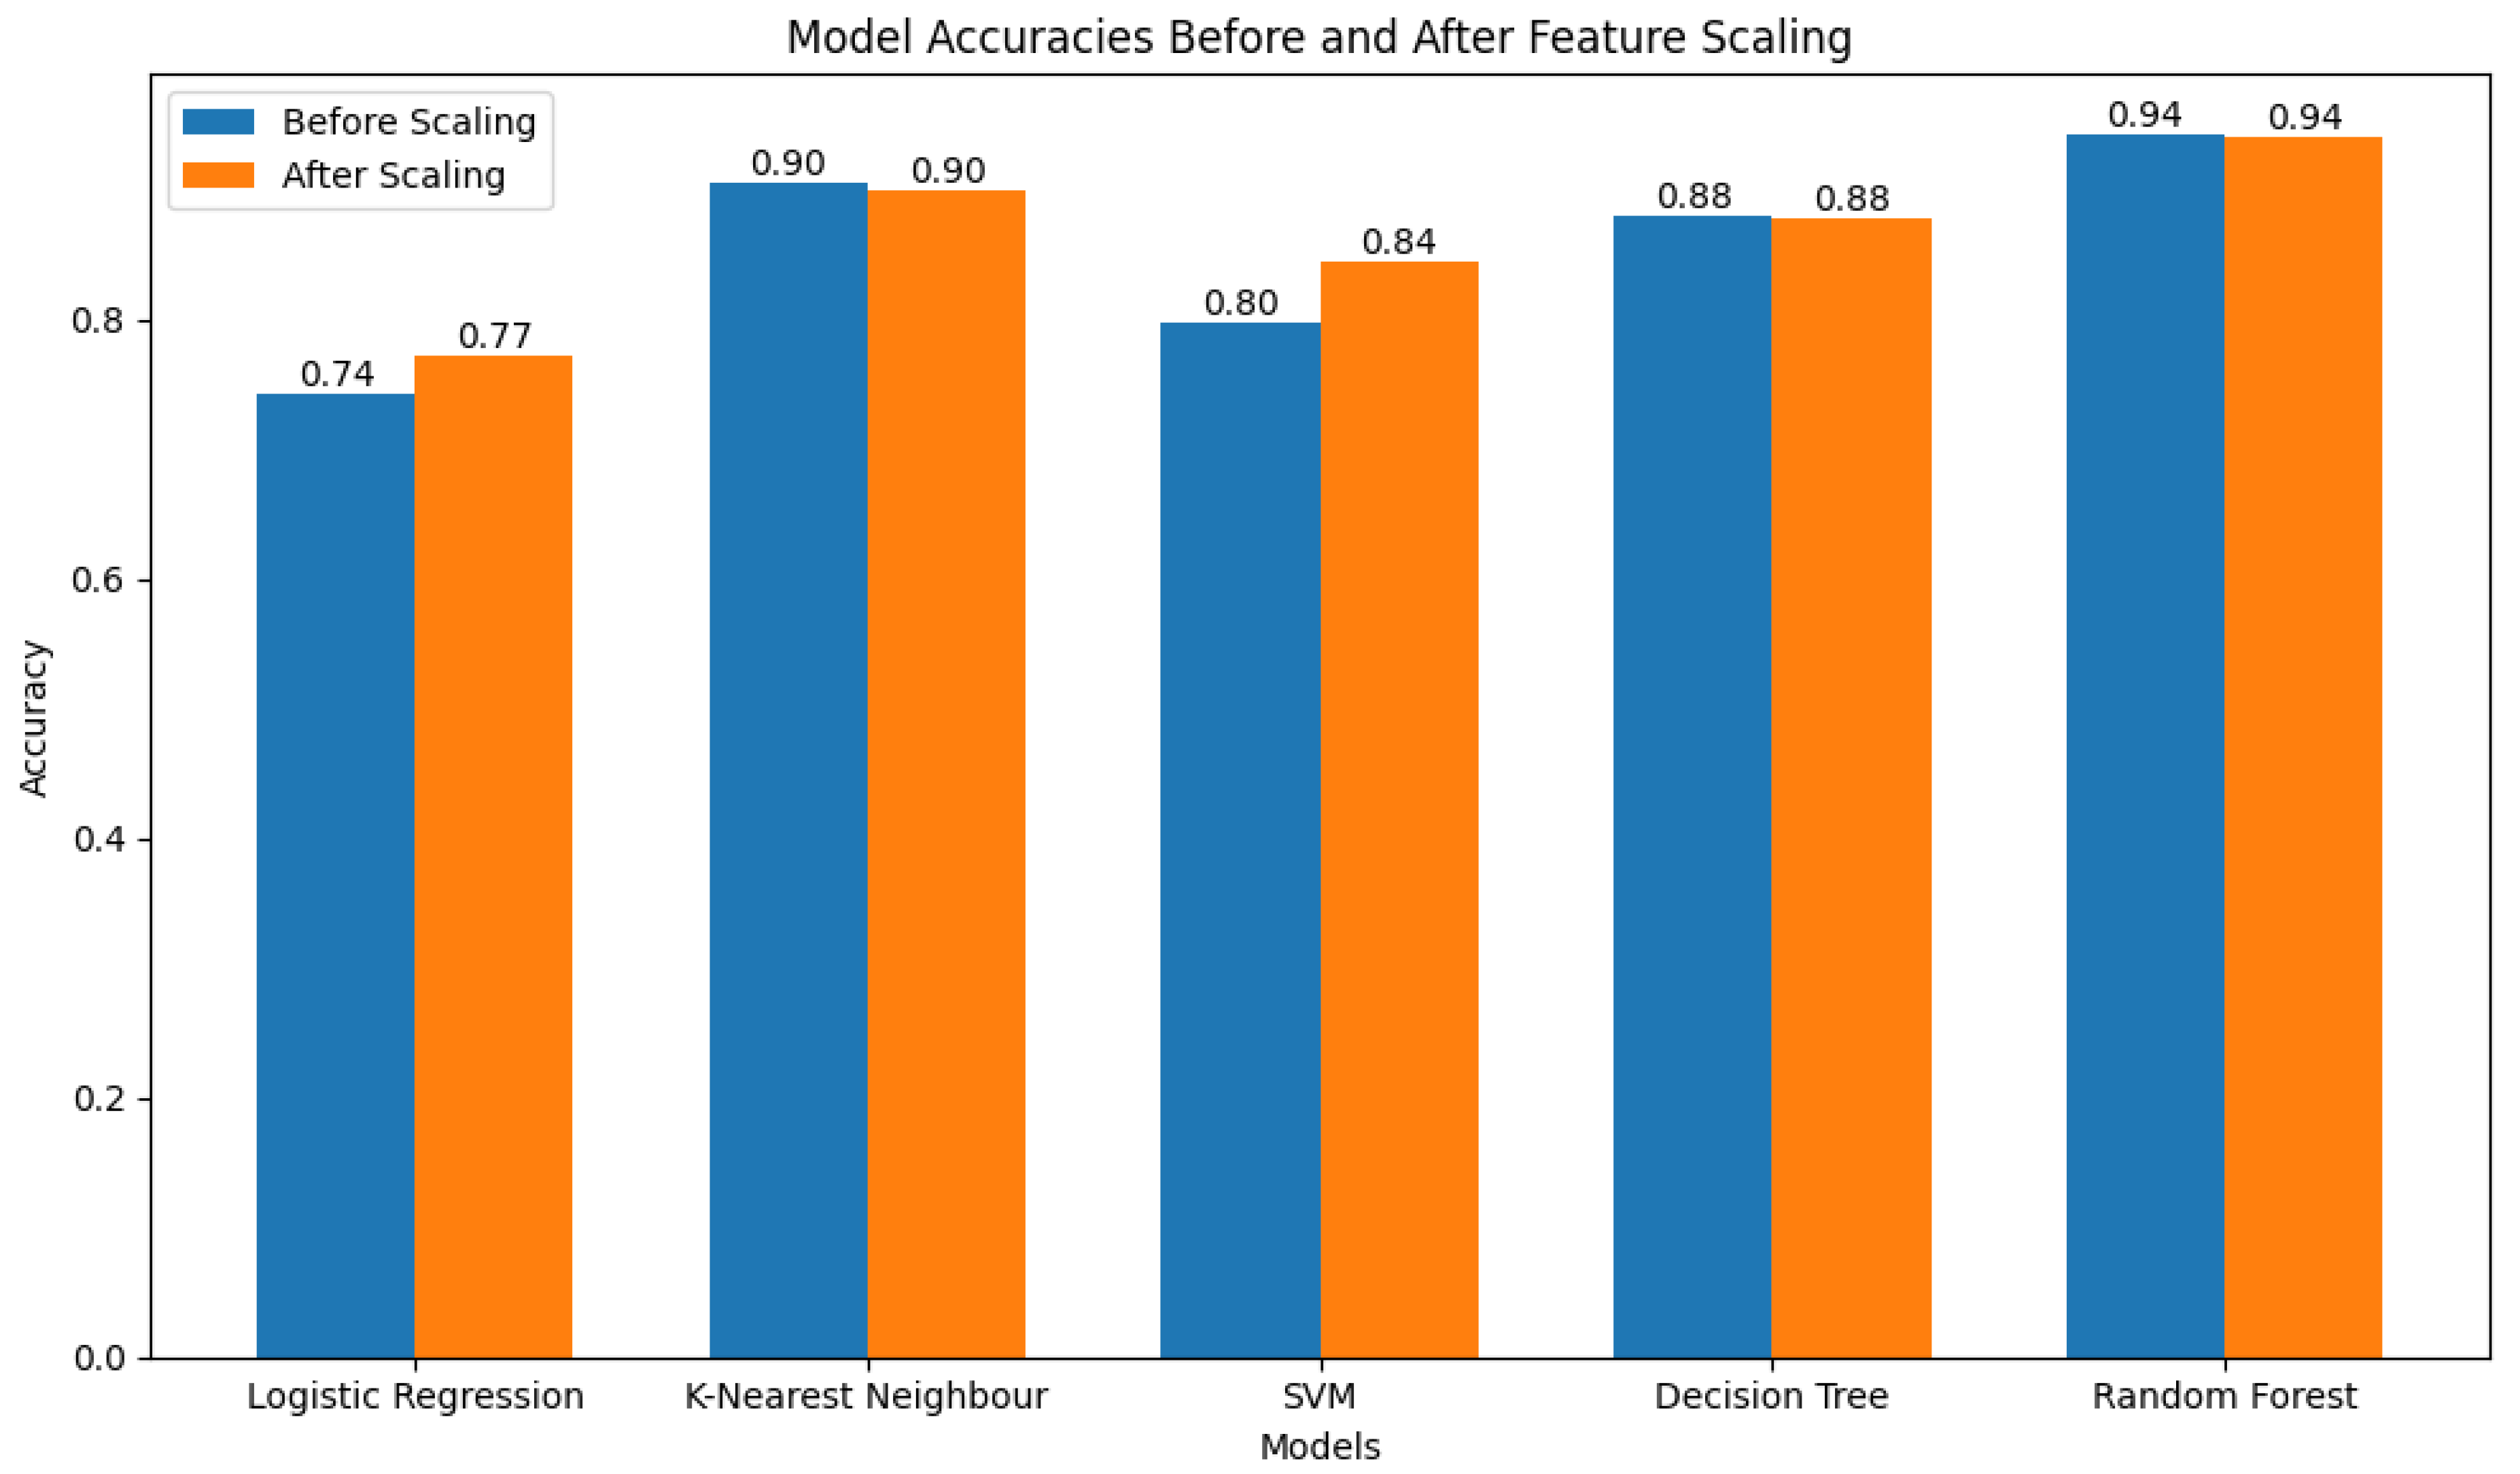
Table 2 reports the baseline performance of all five ML models prior to feature scaling, serving as a reference point for subsequent experiments. Table 3 presents the corresponding results after standardisation, enabling direct assessment of the impact of feature scaling on scale-sensitive algorithms such as Logistic Regression and SVM. The comparative trends across these stages are visually summarised in Figure 4, which highlights how preprocessing choices influence different algorithm families. For the next modelling, an experiment was conducted using the training dataset after the feature scaling technique, and the standard scaler was applied. Performance metrics shown in Table 3 for each model were evaluated, and the RF model still maintained the highest accuracy, with a score of 94%.
Table 3.
Performance metrics of models after feature scaling.
Figure 4.
Comparing model accuracies before and after feature scaling.
Figure 4 shows that the LR and SVM models experience significant improvement after feature scaling, whereas KNN, DT, and RF models did not show any improvement before and after feature scaling.
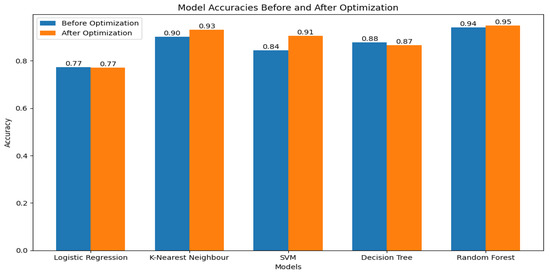
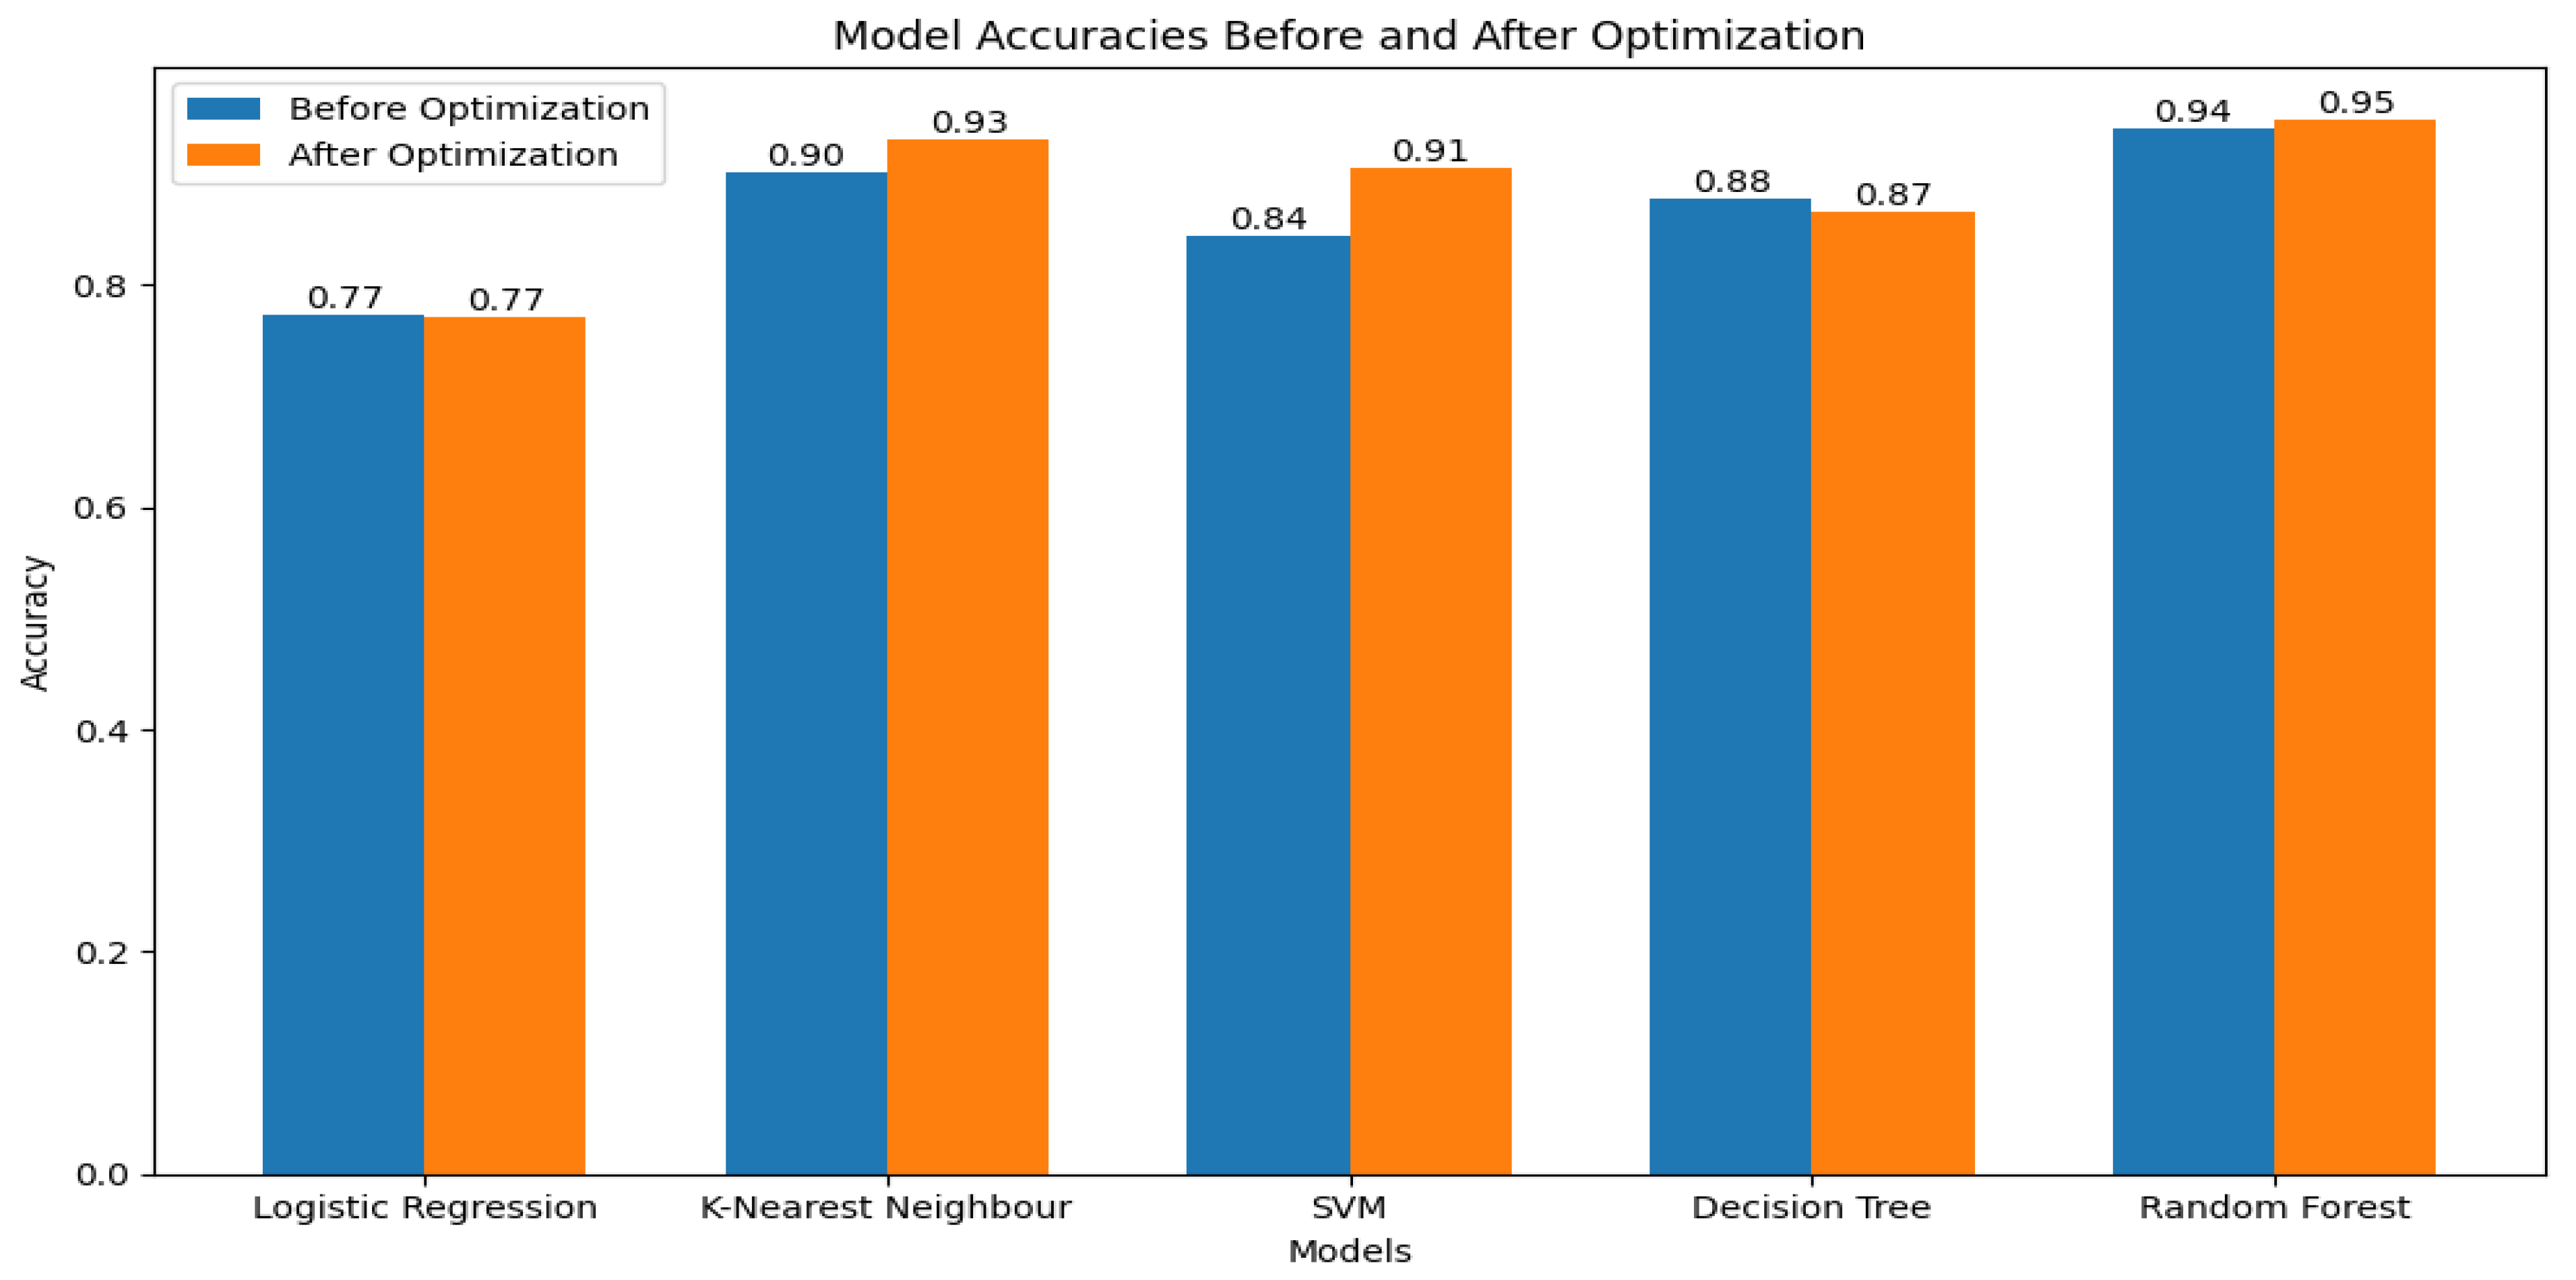
Following feature scaling, hyperparameter optimisation was conducted using GridSearchCV to systematically explore predefined parameter combinations for each model. The selected optimal configurations, reported in Table 4, were determined based on cross-validated performance on the training data. This step ensures that performance improvements are attributable to principled optimisation rather than arbitrary parameter choices. The KNN and SVM models experienced significant improvement after the optimisation, while the RF model had a slight improvement in performance. The LR and DT models were not influenced by the tuning. Table 5 captures the performance metrics of the models after the hyperparameter tuning. With slight improvement after the tuning, the RF model had the best performance with an accuracy of 95%. Figure 5 shows a comparison of model accuracies before and after hyperparameter tuning.
Table 4.
Optimal hyperparameters for models.
Table 5.
Performance metrics of the models after hyperparameter tuning.
Figure 5.
Comparing model accuracies before and after hyperparameter tuning.
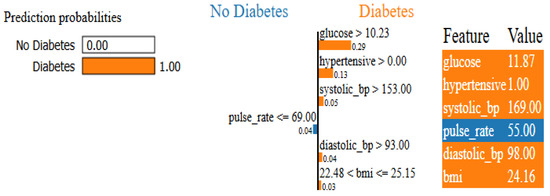
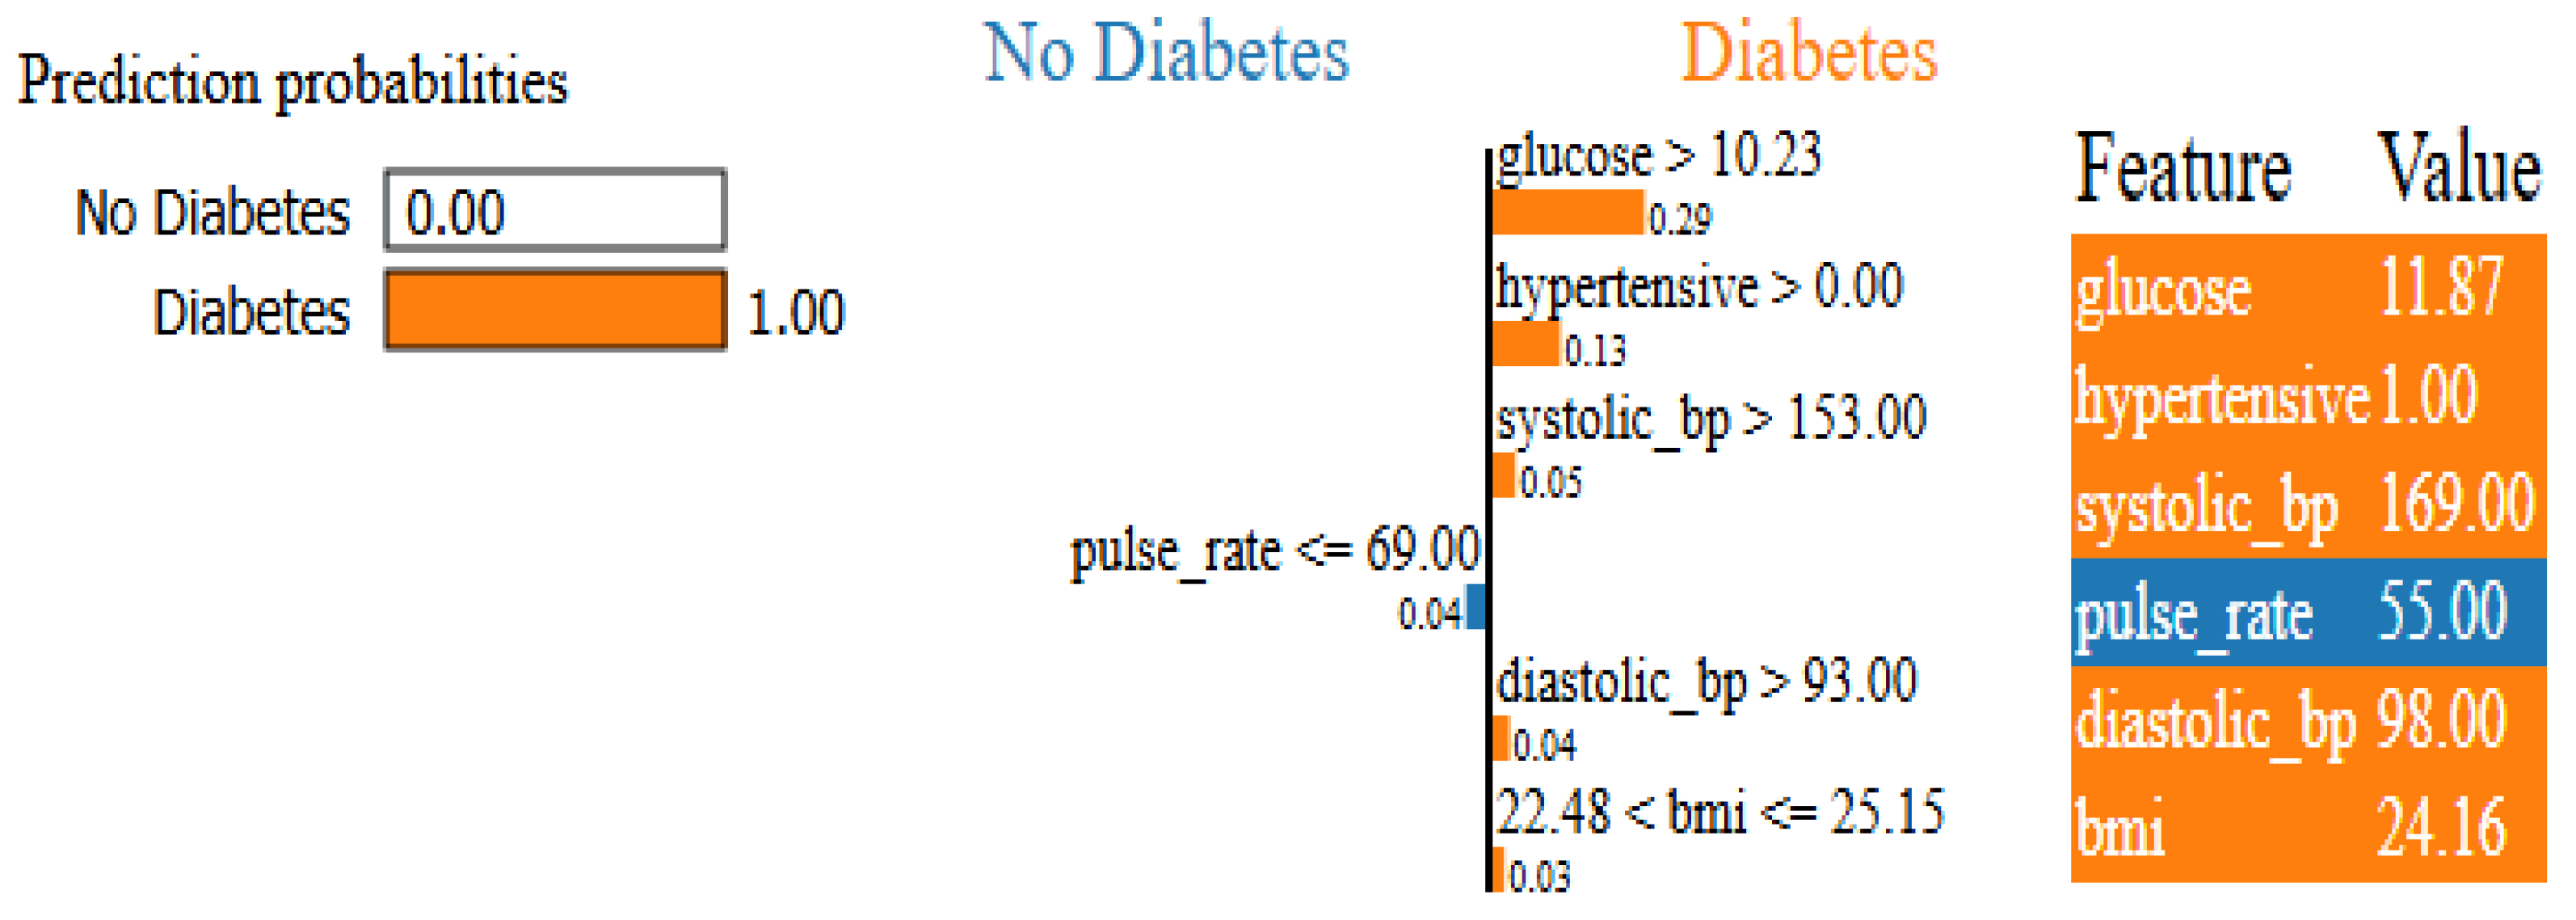
LIME is an interpretability technique used to explain the predictions of an ML model. This technique was applied to explain the individual outcome of the RF model prediction. Figure 6 demonstrates a local explanation generated using LIME for a representative Random Forest prediction.
Figure 6.
LIME visualisation explaining the prediction made by the RF model.
Figure 6 presents the LIME visualisation for a selected illustrative instance from the RF model output. This example was chosen to demonstrate the explanatory capability of LIME and may not represent the typical prediction pattern across the full dataset. The visualisation is segmented into three parts. The top left displays the prediction probabilities for the two classes: No Diabetes and Diabetes. For this instance, the model assigns a probability of 1.00 to the Diabetes class. This value reflects the model’s output score for this specific case and should not be interpreted as a clinical diagnosis or as certainty regarding an individual’s health status.
The middle section presents a tree-like structure showing the sequence of conditions that guided the model towards the positive class prediction. Each condition is a threshold on a feature. From Figure 6, the conditions are
- i.
- Glucose > 10.23, meaning the individual’s glucose level exceeds 10.23 mmol/L.
- ii.
- Hypertension > 0.00, indicating the presence of hypertension, as this is a binary variable.
- iii.
- Systolic_bp > 135.00, meaning the individual’s systolic blood pressure exceeds 135 mmHg.
- iv.
- Pulse_rate ≤ 60.00, meaning the individual’s pulse rate is at or below 60 beats per minute.
- v.
- Diastolic_bp > 93.00, meaning the individual’s diastolic blood pressure exceeds 93 mmHg.
- vi.
- The individual’s body mass index fallingwithin therange of 22.48 < bmi ≤ 25.15.
The final component of the visualisation is a table that captures the input feature values used for the prediction. The value for the features is shown in Table 6 below.
Table 6.
Input feature values from the LIME visual.
The table revealed that all the conditions from the middle tree-like structure were met, which explains why the instance or individual was predicted to have diabetes. Each of these features significantly contributes to diabetes prediction, particularly the high glucose level, presence of hypertension, elevated systolic and diastolic blood pressure, low pulse rate, and BMI in a specific range. LIME has helped break down how the model arrived at this decision, showing which specific rules contributed most to the prediction.
Model Deployment Using Web Application Interface
The RF model was implemented as an interactive web application using the Streamlit library to demonstrate the practical feasibility of deploying a trained ML model within an accessible interface. This prototype is intended as a proofofconcept for research purposes and has not undergone clinical validation or usability testing with healthcare professionals. It should not be used as a substitute for clinical assessment or professional medical judgement.
Upon launch, the application presents a concise introduction to the system, accompanied by a “Start Prediction” button that navigates users to the primary interface. This interface, illustrated in Figure 7, enables users to input relevant health metrics via a sequence of dropdown menus.
Figure 7.
Illustrating the web-based application, starting with user input and providing prediction-based results.
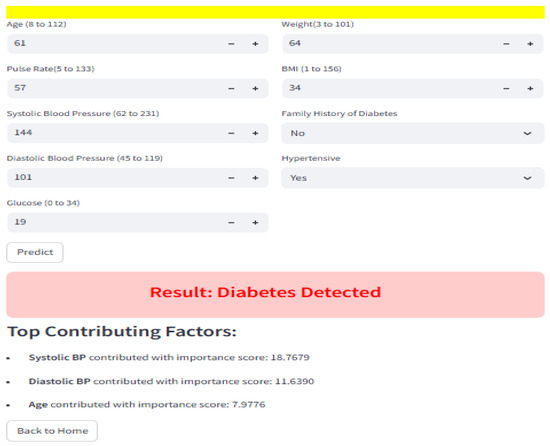
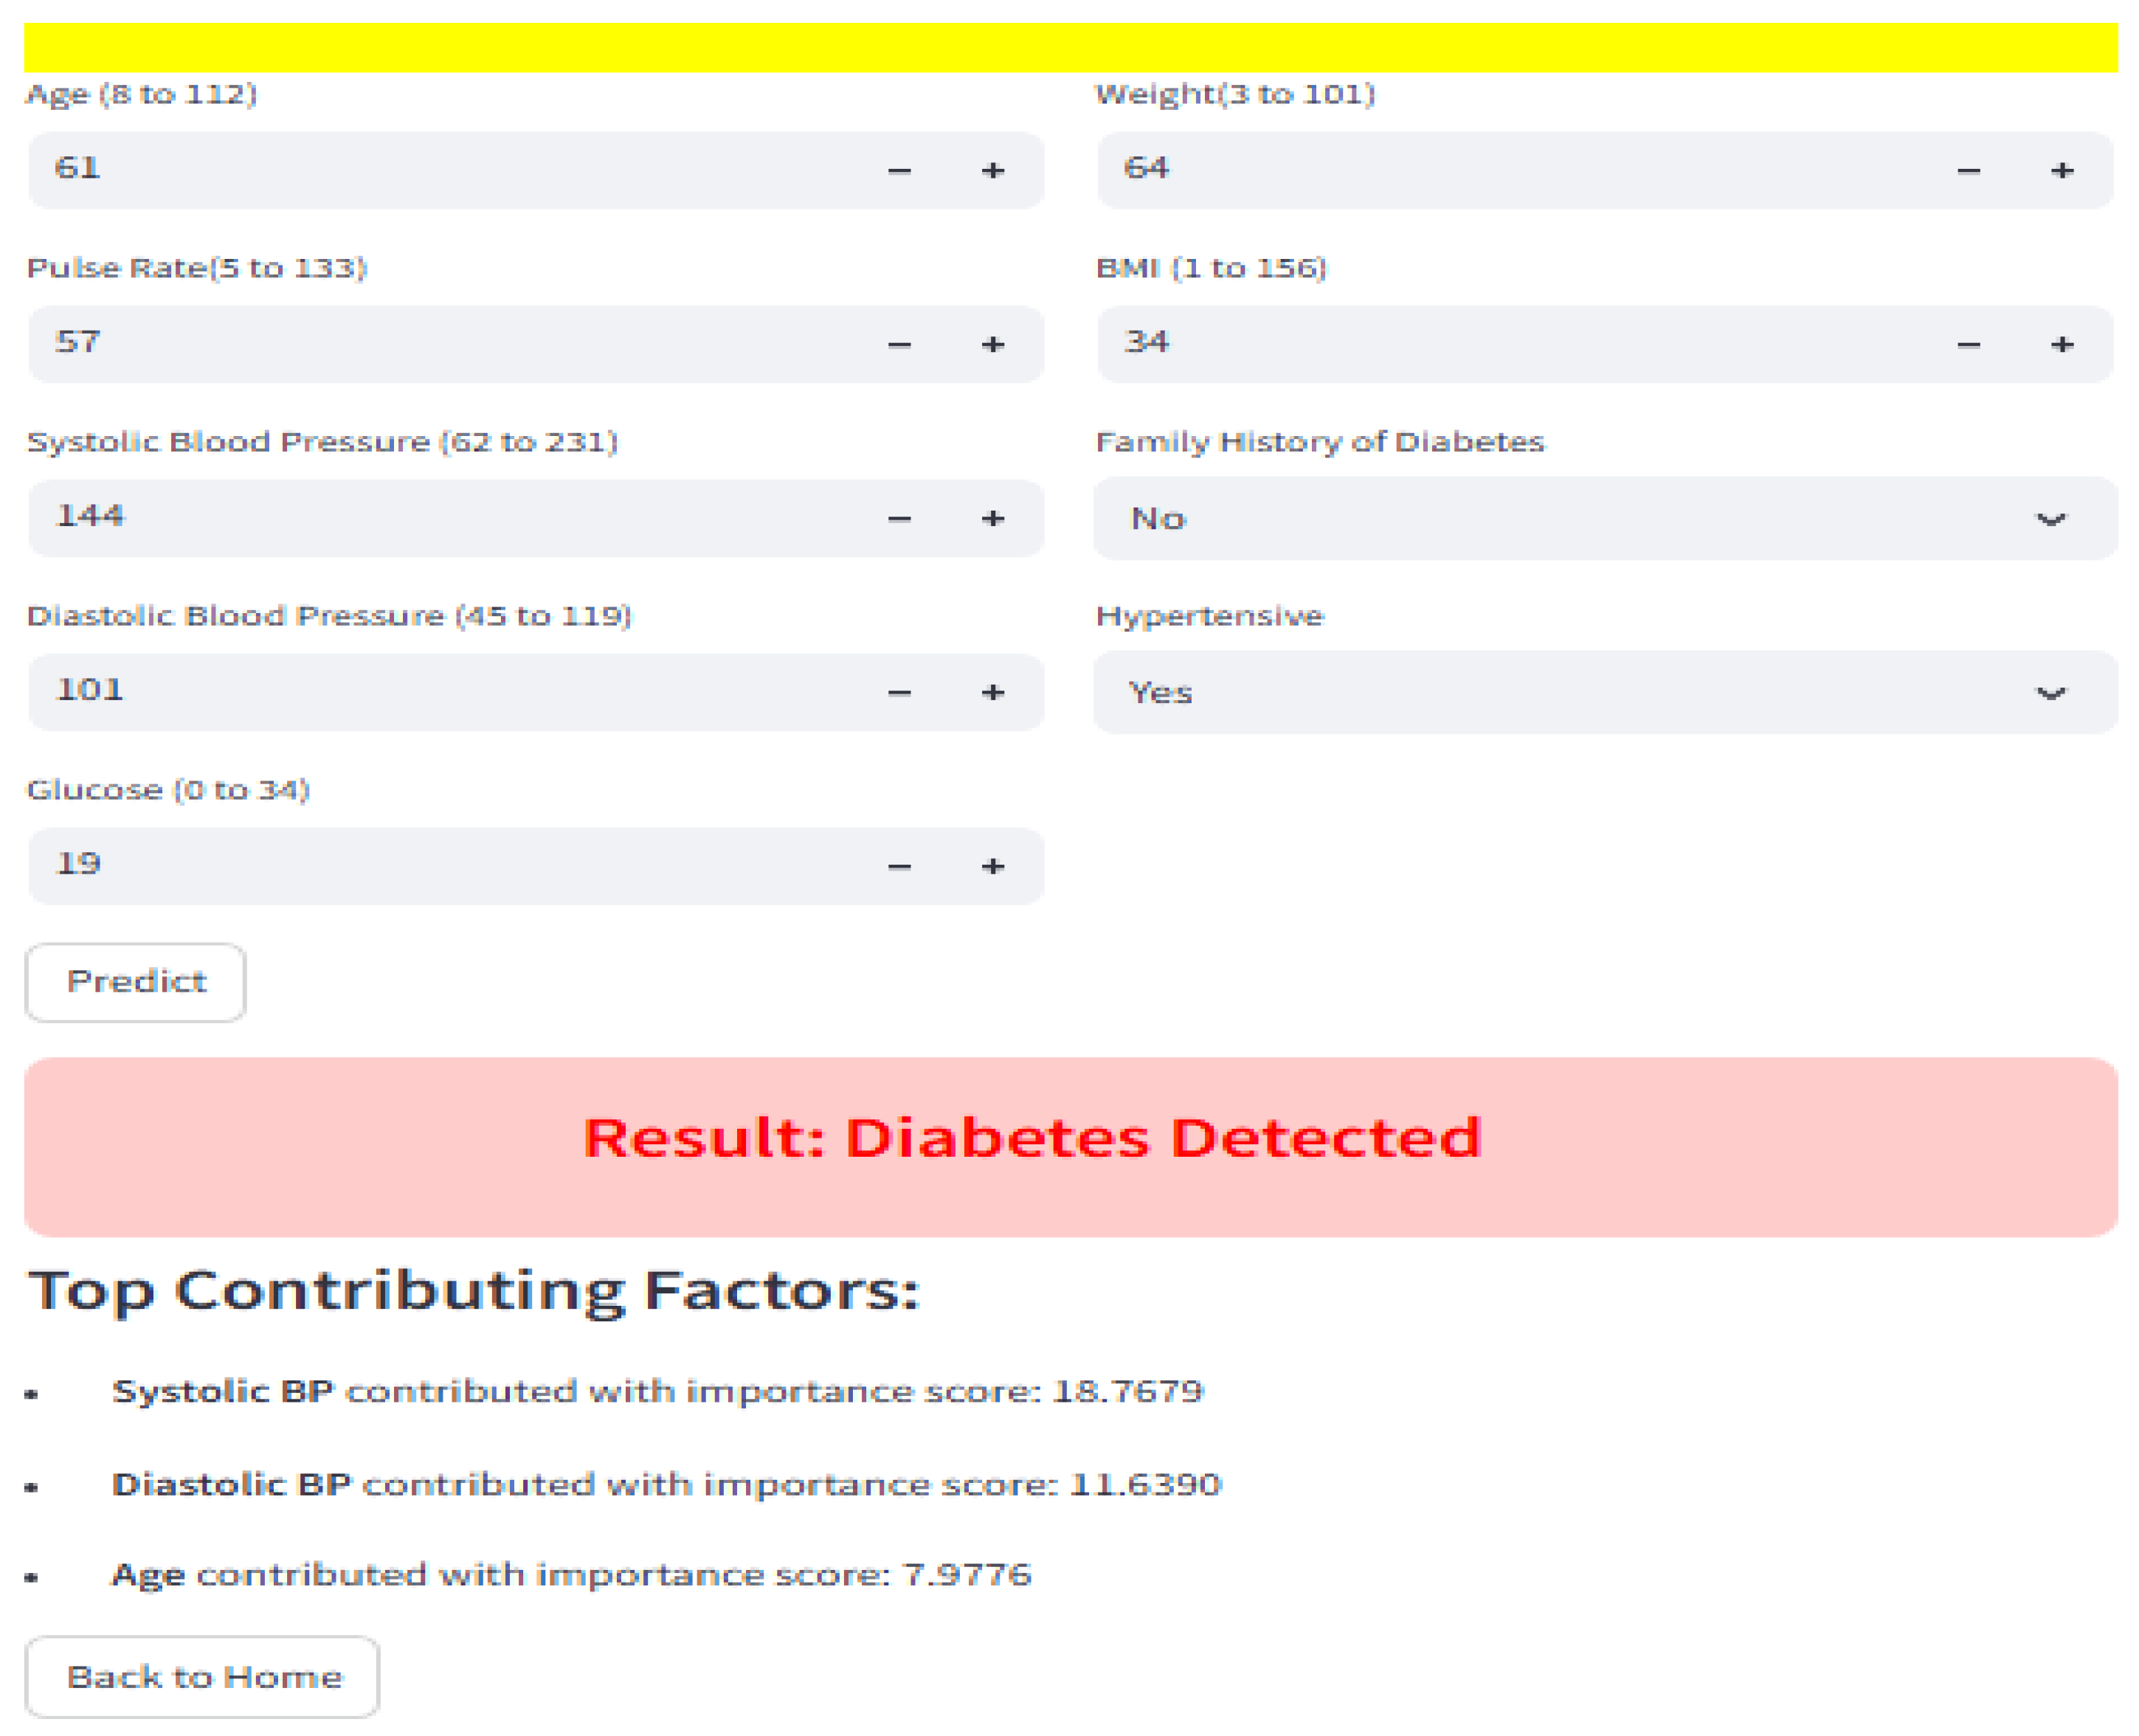
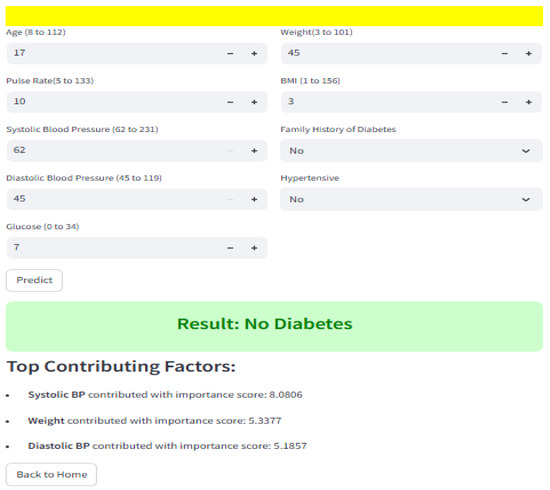
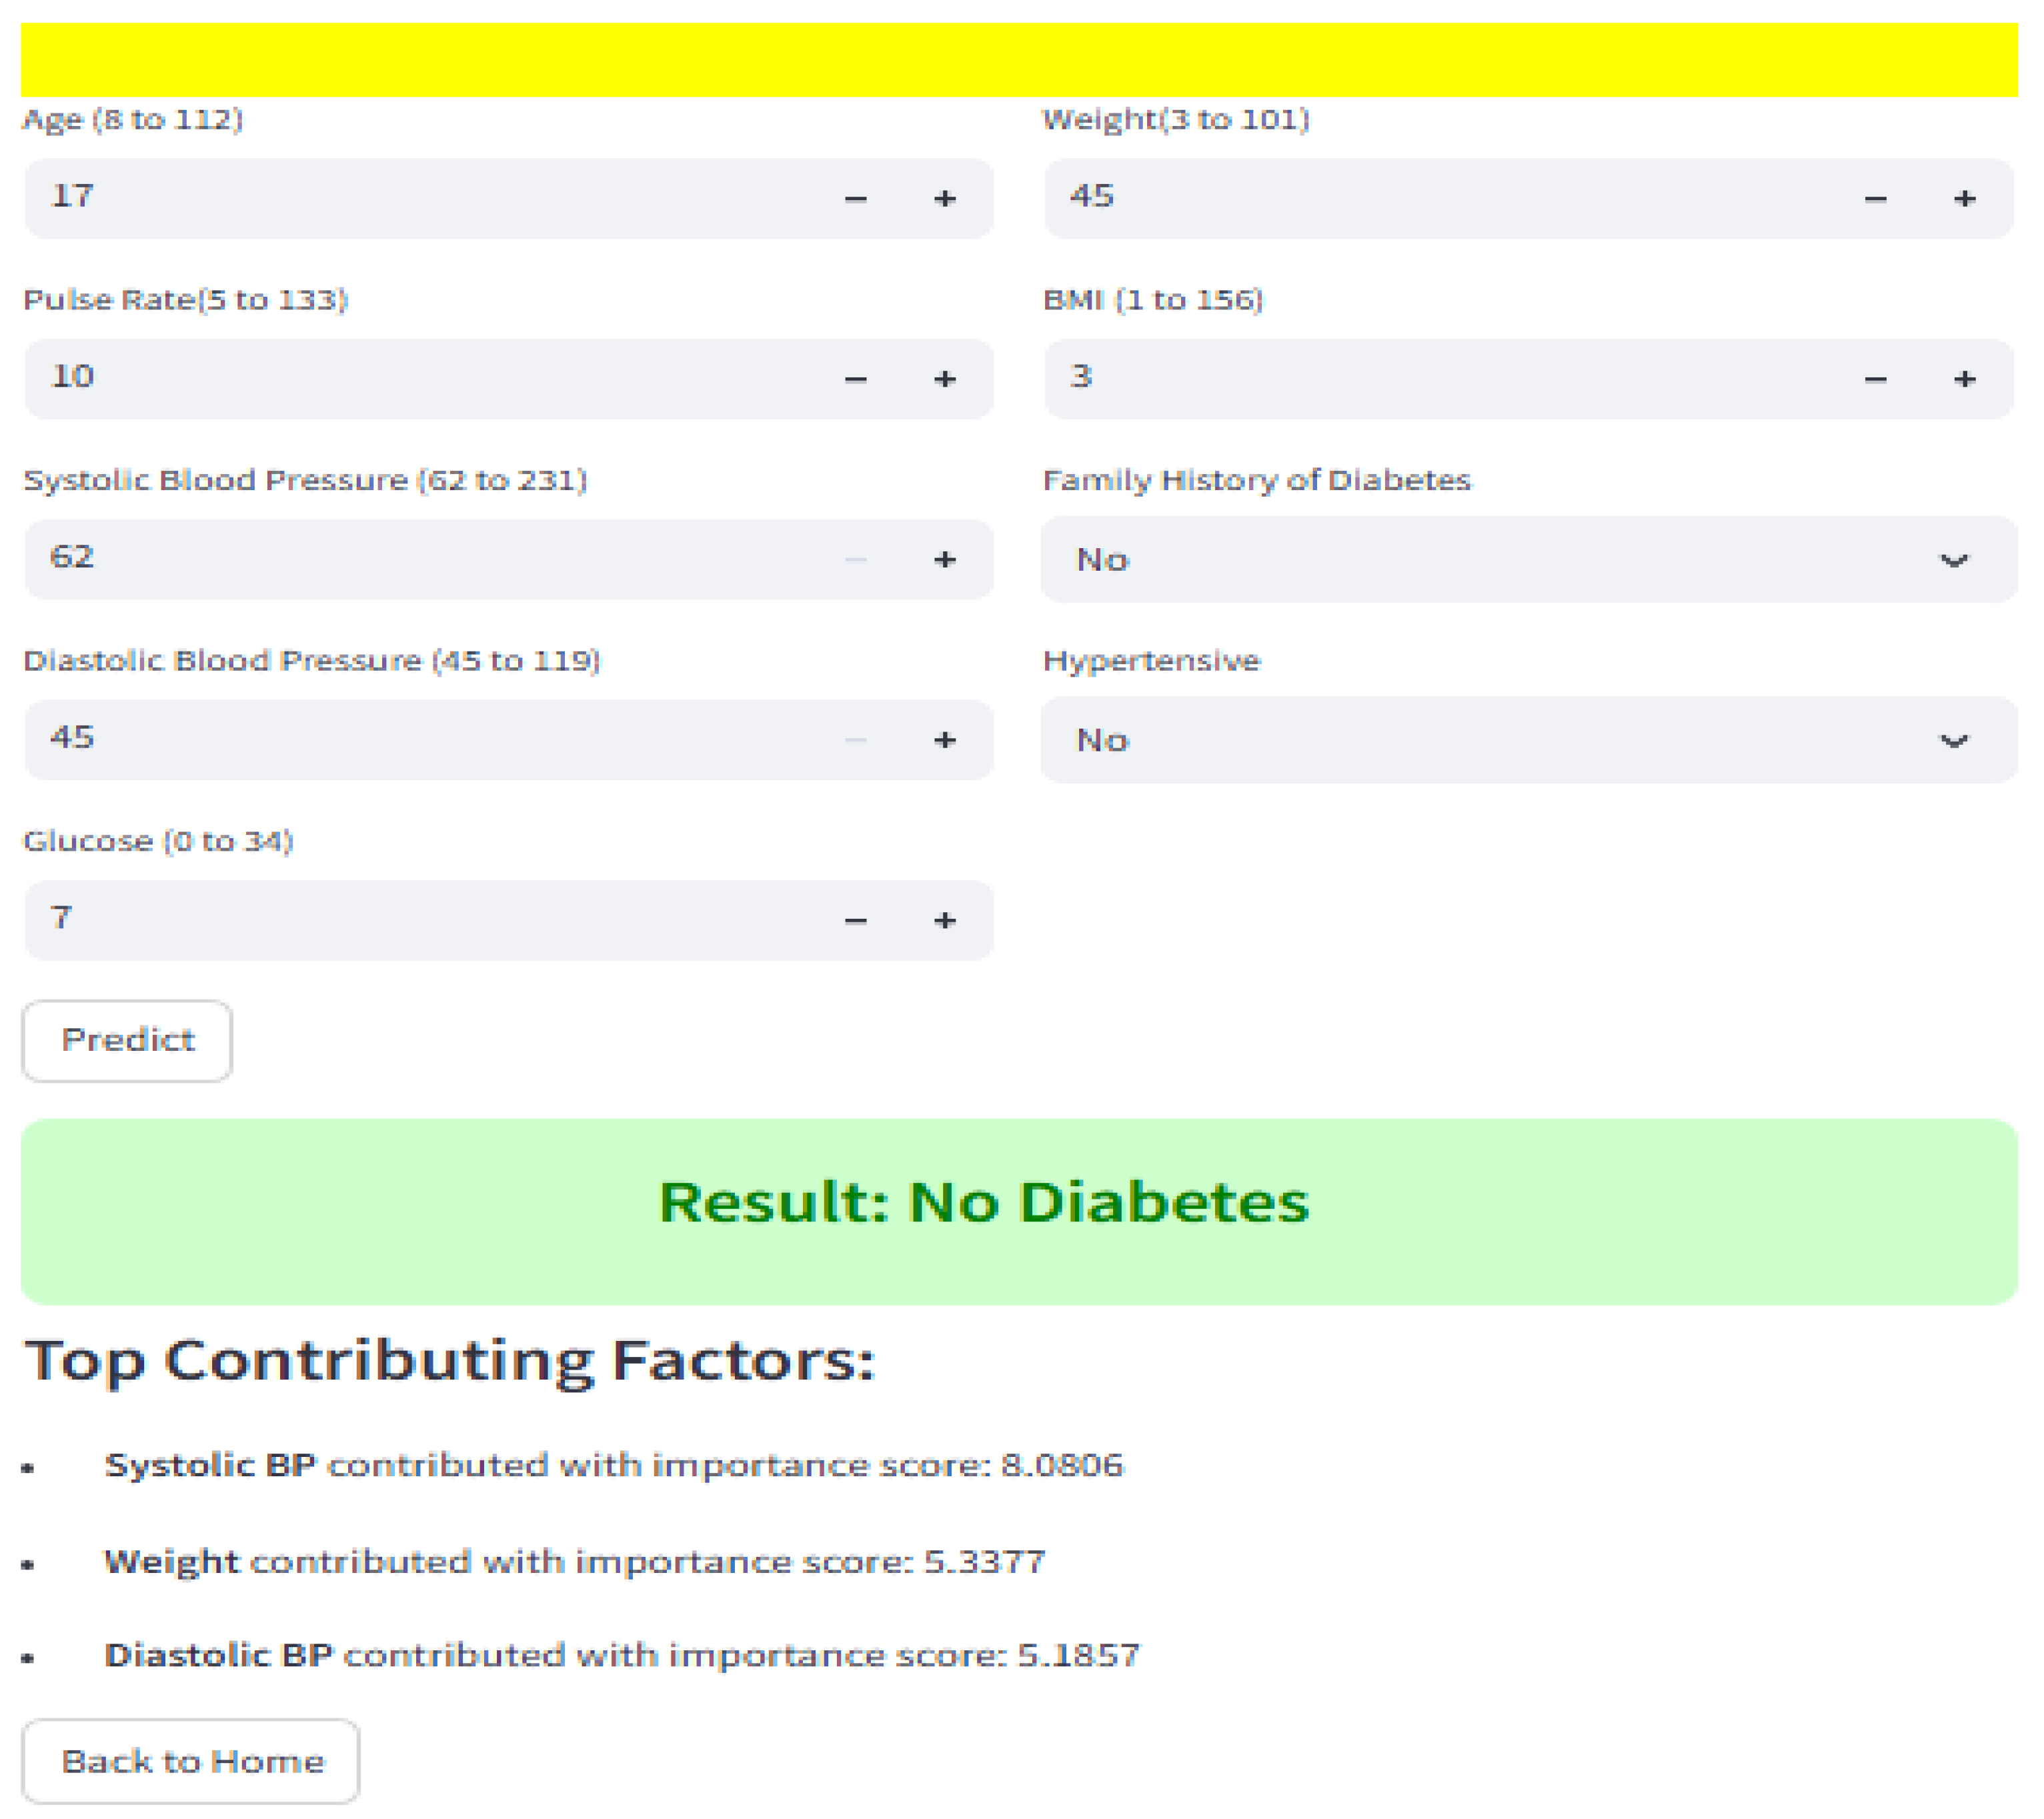
After entering the required inputs, users select the “Predict” button to initiate the prediction process. The model analyses the input data and returns a prediction outcome in real time. Figure 8 and Figure 9 illustrate results for two distinct scenarios: one indicating a positive prediction for diabetes and the other a negative prediction. A red background accompanies a positive prediction to draw attention to the output, whilst a green background accompanies a negative prediction. These outputs reflect the model’s classification based on the provided inputs and should be interpreted accordingly, not as definitive clinical findings.
Figure 8.
Streamlit application landing page displaying a positive diabetes prediction, illustrating a real-time user interface for clinical decision support.
Figure 9.
The web interface shows results when diabetes is not detected.
5. Discussion
To contextualise the reported results, the performance of the proposed models was compared against recent diabetes prediction studies employing similar ML techniques. Prior works typically report accuracy ranging from 70% to 90% for Logistic Regression and SVM, and up to 95% for ensemble methods such as Random Forest. The achieved Random Forest accuracy of 94–95% in this study is therefore consistent with, and in several cases exceeds, reported benchmarks, while offering additional contributions through systematic preprocessing analysis, explainability, and real-time deployment. The observed variation in model performance across preprocessing stages can be explained through established principles of statistical learning theory. Algorithms such as Logistic Regression and Support Vector Machines rely on gradient-based optimisation and distance-based computations, rendering them inherently sensitive to feature magnitude. Their enhanced performance following standardisation aligns with prior findings in medical classification tasks, wherein unscaled features may bias optimisation trajectories. Conversely, the scale-invariant behaviour exhibited by Decision Tree and Random Forest models reflects their reliance on hierarchical threshold-based splitting mechanisms rather than numerical distance metrics, thereby accounting for their stability across preprocessing stages.
RQ1 examined how feature scaling affected the performance of the five ML algorithms. As shown in the comparative bar chart in Figure 4, the impact varied considerably across algorithms, which aligns with their underlying mechanisms. LR accuracy improved from 0.74 to 0.77 following scaling, as expected given that gradient-based optimisation is sensitive to differences in feature magnitude. SVM similarly benefited, improving from 0.80 to 0.84, which reflects its dependence on dot products in kernel space. DT and RF showed no meaningful change, consistent with their use of threshold-based splitting rules that are not influenced by feature scale.
KNN produced an interesting result, maintaining accuracy at approximately 0.90 both before and after scaling, with only a marginal decrease from 90.48% to 90.04%. This is somewhat unexpected for a distance-based algorithm. One plausible explanation is that the features in the DiaHealth dataset, which include clinical measurements such as blood pressure, glucose, and BMI alongside binary-encoded categorical variables, are already distributed within broadly comparable numerical ranges. Under these conditions, standardisation has little effect on the relative distances between data points. The pre-scaling recall of 99.51% supports this view, as it indicates that KNN was already locating correct neighbours effectively. The slight accuracy drop after scaling also suggests the original feature magnitudes were not introducing meaningful distortion. Taken together, these results indicate that feature scaling is beneficial for some algorithms but not universally required, particularly when the dataset’s inherent feature distributions do not create significant scale imbalances.
DT and RF models displayed no change in accuracy (both maintaining 0.88 and 0.94, respectively) after feature scaling. This aligns with the established understanding that tree-based algorithms are inherently invariant to feature scaling, since they split nodes based on feature thresholds rather than distance or gradient calculations [38]. The results reveal that feature scaling enhances the performance of certain algorithms, but some models might not necessarily require feature scaling to perform optimally. When predicting diabetes, feature scaling should be applied in a way that aligns with the specific algorithm being used to ensure the model performs at its best. RQ2 examined which supervised ML algorithm provided the most accurate and generalisable predictions. Identifying the most effective model is important for early disease detection and decision support. In this research, multiple supervised ML algorithms were evaluated for their predictive performance on diabetes onset. Their performances were compared both before and after hyperparameter tuning.
The comparative bar chart (Figure 5) reveals that the RF algorithm consistently outperformed other models, achieving the highest accuracy both before and after hyperparameter optimisation, increasing from 0.94 to 0.95. This marginal gain demonstrates that while RF is inherently robust, fine-tuning still contributes positively to its predictive capabilities. The SVM model experienced a notable improvement in accuracy from 0.84 to 0.91 after hyperparameter tuning. This shows that SVM is highly sensitive to the selection of its kernel, regularisation parameter (C), and gamma values, all of which can be adjusted during tuning [40]. KNN improved from 0.90 to 0.93, showing that selecting the optimal number of neighbours (k) and distance metric can significantly enhance its performance. On the other hand, LR showed no improvement (remained at 0.77), and DT showed a slight decrease (from 0.88 to 0.87), which could be attributed to overfitting during the optimisation process.
The results revealed that RF is the most effective algorithm for predicting diabetes onset in this study, offering both high accuracy and robust generalisation. While hyperparameter tuning improved the performance of most models, particularly SVM and KNN, its impact on RF was relatively minimal due to the algorithm’s inherent resilience and strong baseline performance.
Research Question 3 examines how Local Interpretable Model-agnostic Explanations (LIME) enhances the interpretability of machine learning predictions in healthcare contexts. In clinical settings, understanding the reasoning underlying a prediction is equally critical as the prediction itself; this is precisely where explainable artificial intelligence (XAI) techniques such as LIME become indispensable. LIME constitutes a model-agnostic explanation methodology that facilitates the interpretation of predictions generated by any black-box classifier through local approximation with an interpretable surrogate model. It addresses the fundamental question: “Why did the model render this specific prediction for this particular individual?” Such granular explanations can inform clinical decision-making, foster trust in artificial intelligence systems, and promote ethical and transparent AI deployment.
The results presented in Figure 6 indicate that the model assigned a probability of 1.00 to the positive (diabetes) class for this instance. LIME subsequently identified and quantified the features influencing this determination through feature-level decomposition. Specifically, Figure 6 reveals that the individual presented with glucose levels exceeding 10.23 mmol/L, concurrent hypertension, and elevated systolic blood pressure surpassing 135 mmHg. These variables represent established clinical indicators for diabetes; consequently, the explanation demonstrates strong concordance with medical domain knowledge. Both clinicians and data scientists can thereby visually trace the contribution of each feature to the final prediction.
This study demonstrates that XAI techniques such as LIME are essential for reconciling predictive performance with interpretability in healthcare applications. By furnishing clear, localised explanations for individual predictions, LIME empowers clinicians to make evidence-informed decisions whilst enhancing model transparency and fostering trust. As evidenced in the diabetes prediction case, LIME not only elucidated the rationale underlying the model’s determination but also highlighted clinically relevant features, thereby ensuring alignment between the model’s reasoning and established clinical understanding. The superior performance of Random Forest observed herein is consistent with prior diabetes prediction research, emphasising the robustness of ensemble learning methods in managing feature interactions and noisy clinical data. However, unlike numerous previous studies that report high accuracy without addressing interpretability or practical deployment considerations, the present work demonstrates that ensemble performance can be integrated with transparent, instance-level explanations through XAI methodologies. This integration addresses a critical limitation identified in earlier literature, wherein the black-box nature of complex models impedes clinical trust and subsequent adoption.
In relation to RQ1 and RQ2, the findings confirm that preprocessing and hyperparameter optimisation play a decisive role in algorithm performance, but their impact is model-dependent. This underscores the importance of algorithm-specific pipeline design rather than one-size-fits-all preprocessing. Addressing RQ3, the application of LIME demonstrates that high-performing models can still provide clinically interpretable explanations, aligning model reasoning with established medical risk factors. Despite its utility, LIME operates as a post hoc approximation method and is inherently limited to local, instance-level explanations. Caroprese et al. [40] argue that argumentation-based frameworks offer a more formally grounded and verifiable approach to transparency in medical AI, anchoring predictions in structured logical reasoning rather than statistical surrogates. Future iterations of this work could explore such frameworks to provide more robust and clinically defensible explanations alongside the deployed decision-support tool.
Finally, RQ4 is supported through successful deployment, indicating that predictive accuracy, interpretability, and usability can coexist within a single decision-support framework.
The use of ML in healthcare is transforming how diseases such as diabetes are detected and managed. By deploying a web-based decision-support tool using a trained ML model for RQ4, healthcare professionals and individuals can gain real-time, data-driven insights into their health status. The diabetes prediction web application exemplifies how AI can be translated into practical, accessible, and interpretable tools for early disease detection. The tool generates a prediction such as “No Diabetes” or “Diabetes Detected” based on input values. This immediate feedback is valuable in supporting early intervention. The application not only returns a binary result, but it also lists the top contributing factors with important scores. This supports clinical explainability and patient understanding by revealing why a prediction was made. These insights could help clinicians prioritise further testing or lifestyle recommendations based on specific risk factors. The deployed web-based diabetes prediction tool stands out as an effective decision-support system. By combining real-time prediction, interpretability, and accessibility, it offers significant advantages for early detection and prevention of diabetes. The use of the best-performing model further enhances its clinical utility, trustworthiness, and practical value, making it a strong example of how ML can improve health outcomes when translated into real-world applications.
Limitations
This study is subject to several limitations that warrant consideration when interpreting the findings. First, the dataset employed was relatively modest in size and derived from a single open-source repository, potentially constraining the generalisability of the results to broader, more diverse populations. The omission of critical clinical and lifestyle variables, including glycated haemoglobin (HbA1c) levels, cholesterol profiles, physical activity patterns, smoking status, and dietary habits, may have restricted the model’s capacity to comprehensively capture the multifactorial risk factors associated with Diabetes Mellitus. The analysis was confined exclusively to structured data, thereby excluding alternative data sources of potential diagnostic value, such as unstructured clinical notes or medical imaging. While the study reports accuracy, precision, recall, and F1-score, additional metrics such as ROC-AUC, specificity, and calibration analysis were not included, which would provide a more comprehensive assessment of model performance in clinical settings. Whilst LIME was employed to enhance interpretability, it furnishes exclusively local explanations that may not adequately represent the model’s global behaviour patterns. Dependence upon a singular explanation methodology may additionally circumscribe the depth and robustness of insight available to clinicians for decision-making purposes. Finally, although the developed web application demonstrates considerable practical potential, it has yet to undergo empirical validation with authentic end-users’ clinical environments, an essential prerequisite for comprehensively assessing usability, clinical effectiveness, and trustworthiness in real-world healthcare contexts.
6. Conclusions and Future Work
This research explored the use of ML methods to predict whether someone might develop diabetes, using a newly available dataset from an open platform. A structured approach was used to assess how well the models performed at three stages: before feature scaling, after feature scaling, and following hyperparameter tuning. Among the five techniques tested, the RF method consistently produced the best results, showing the highest level of accuracy and proving to be dependable and adaptable across all stages. To better understand the decision-making process of the best-performing model, feature importance was extracted from the RF algorithm, highlighting the key factors contributing to diabetes risk. In addition to that, the study implemented LIME to improve transparency. LIME enabled the generation of case-level explanations, offering insights into how individual features influenced predictions. This not only made the model more interpretable but also built trust among potential end-users and healthcare stakeholders. In conclusion, the results highlight the significant potential of supervised ML algorithms in supporting early diabetes diagnosis. The results demonstrated that applying feature scaling and tuning model hyperparameters can meaningfully enhance predictive performance. The RF model proved to be the most accurate and reliable, making it especially well-suited to healthcare applications due to its ensemble design and resilience against overfitting. The study addressed common concerns around the “black box” nature of ML models by integrating XAI techniques such as LIME, thereby promoting greater accountability and usability in medical contexts. Finally, deploying the model via a Streamlit-based web application showcased its practical application, paving the way for real-world use as a decision-support tool in clinical or public health settings.
Although this study successfully achieved its aim and objectives, there are some areas where future research could build upon the findings and address the limitations identified. To improve the general usefulness and reliability of the model, future studies should consider using larger and more diverse datasets. Ideally, these datasets should be collected from multiple healthcare systems or regions and include a wider range of health-related information. Features such as glycated haemoglobin (HbA1c) levels, cholesterol readings, physical activity, smoking status, dietary habits, and detailed family medical history could add valuable insight. Including these more comprehensive indicators would likely enhance the model’s accuracy and make it more relevant in real-world clinical settings. It would also help the model work better across different population groups and reduce the risk of bias caused by using a limited or homogenous dataset. Future work could explore other model explanation methods beyond LIME. Techniques such as SHAP or global surrogate models may offer a deeper understanding of how the model makes decisions. These tools could help build greater confidence among healthcare professionals by making the model’s predictions easier to interpret and trust.
Author Contributions
Conceptualization, S.A. and M.Z.I.; methodology, S.A.; software, S.A.; validation, S.A and M.Z.I.; formal analysis, S.A.; investigation, S.A.; resources, S.A.; data curation, S.A.; writing—original draft preparation, S.A. and M.Z.I.; writing—review and editing, S.A., M.Z.I. and M.G.M.T.; visualization, S.A.; supervision, M.Z.I.; project administration, S.A.; funding acquisition, M.Z.I. All authors have read and agreed to the published version of the manuscript.
Funding
This research received no external funding.
Institutional Review Board Statement
Ethical approval was obtained for this study (project number: 27391) from the Teesside University Ethics Committee.
Informed Consent Statement
Not applicable.
Data Availability Statement
All the data used in the study were publicly available at the time of data collection and did not require individual consent for use. The complete source code for data preprocessing, model development, hyperparameter tuning, LIME explainability, and Streamlit web application deployment is publicly available at https://github.com/deniyi88/diabetesML-deployement (accessed on 25 April 2026).
Conflicts of Interest
The authors declare that they have no competing interests.
References
- Lin, X.; Xu, Y.; Pan, X.; Xu, J.; Ding, Y.; Sun, X.; Song, X.; Ren, Y.; Shan, P.F. Global, regional, and national burden and trend of diabetes in 195 countries and territories: An analysis from 1990 to 2025. Sci. Rep. 2020, 10, 14790. [Google Scholar] [CrossRef] [Scilit] [PubMed]
- Hu, F.B.; Manson, J.E.; Stampfer, M.J.; Colditz, G.; Liu, S.; Solomon, C.G.; Willett, W.C. Diet, lifestyle, and the risk of type 2 diabetes mellitus in women. N. Engl. J. Med. 2001, 345, 790–797. [Google Scholar] [CrossRef] [Scilit] [PubMed]
- American Diabetes Association. 2. Classification and Diagnosis of Diabetes: Standards of medical care in diabetes—2021. Diabetes Care 2021, 44, S15–S33. [Google Scholar] [CrossRef] [Scilit] [PubMed]
- World Health Organization. Global Report on Diabetes; WHO: Geneva, Switzerland, 2016; Available online: https://www.who.int/publications/i/item/9789241565257 (accessed on 10 December 2025).
- Kopitar, L.; Kocbek, P.; Cilar, L.; Sheikh, A.; Stiglic, G. Early detection of type 2 diabetes mellitus using machine learning-based prediction models. Sci. Rep. 2020, 10, 11981. [Google Scholar] [CrossRef] [Scilit] [PubMed]
- Rajkomar, A.; Dean, J.; Kohane, I. Machine learning in medicine. N. Engl. J. Med. 2019, 380, 1347–1358. [Google Scholar] [CrossRef] [Scilit] [PubMed]
- Tjoa, E.; Guan, C. A survey on explainable artificial intelligence (XAI): Toward medical XAI. IEEE Trans. Neural Netw. Learn. Syst. 2021, 32, 4793–4813. [Google Scholar] [CrossRef] [Scilit] [PubMed]
- Holzinger, A.; Biemann, C.; Pattichis, C.S.; Kell, D.B. What do we need to build explainable AI systems for the medical domain? arXiv 2017, arXiv:1712.09923. [Google Scholar] [CrossRef] [Scilit]
- Harreiter, J.; Roden, M. Diabetes mellitus: Definition, classification, diagnosis, screening and prevention. Wien Klin Wochenschr 2023, 135, 7–17. [Google Scholar] [CrossRef] [Scilit] [PubMed]
- Tomic, D.; Shaw, J.E.; Magliano, D.J. The burden and risks of emerging complications of diabetes mellitus. Nat. Rev. Endocrinol. 2022, 18, 525–539. [Google Scholar] [CrossRef] [Scilit] [PubMed]
- Rodrigues Oliveira, S.M.; Rebocho, A.; Ahmadpour, E.; Nissapatorn, V.; de Lourdes Pereira, M. Type 1 diabetes mellitus: A review on advances and challenges in creating insulin producing devices. Micromachines 2023, 14, 151. [Google Scholar] [CrossRef] [Scilit] [PubMed]
- Galicia-Garcia, U.; Benito-Vicente, A.; Jebari, S.; Larrea-Sebal, A.; Siddiqi, H.; Uribe, K.B.; Ostolaza, H.; Martín, C. Pathophysiology of Type 2 Diabetes Mellitus. Int. J. Mol. Sci. 2020, 21, 6275. [Google Scholar] [CrossRef] [Scilit] [PubMed]
- Choudhury, A.A.; Rajeswari, V.D. Gestational diabetes mellitus—A metabolic and reproductive disorder. Biomed. Pharmacother. 2021, 143, 112145. [Google Scholar] [CrossRef] [Scilit] [PubMed]
- Jaiswal, V.; Negi, A.; Pal, T. A review on current advances in machine learning based diabetes prediction. Prim. Care Diabetes 2021, 15, 435–443. [Google Scholar] [CrossRef] [Scilit] [PubMed]
- Olisah, C.C.; Smith, L.; Smith, M. Diabetes mellitus prediction and diagnosis from a data preprocessing and machine learning perspective. Comput. Methods Programs Biomed. 2022, 220, 106773. [Google Scholar] [CrossRef] [Scilit] [PubMed]
- Febrian, M.E.; Ferdinan, F.X.; Sendani, G.P.; Suryanigrum, K.M.; Yunanda, R. Diabetes prediction using supervised machine learning. Procedia Comput. Sci. 2023, 216, 21–30. [Google Scholar] [CrossRef] [Scilit]
- Khaleel, F.A.; Al-Bakry, A.M. Diagnosis of diabetes using machine learning algorithms. Mater. Today Proc. 2023, 80, 3200–3203. [Google Scholar] [CrossRef] [Scilit]
- Khanam, J.J.; Foo, S.Y. A comparison of machine learning algorithms for diabetes prediction. ICT Express 2021, 7, 449–454. [Google Scholar] [CrossRef] [Scilit]
- Chang, V.; Bailey, J.; Xu, Q.A.; Sun, Z. Pima Indians diabetes mellitus classification based on machine learning (ML) algorithms. Neural Comput. Appl. 2023, 35, 16157–16173. [Google Scholar] [CrossRef] [Scilit]
- Refat, M.A.R.; Al Amin, M.; Kaushal, C.; Yeasmin, M.N. A Comparative Analysis of Early Stage Diabetes Prediction using Machine Learning and Deep Learning Approach. TechRxiv 2021. [Google Scholar] [CrossRef]
- Lyngdoh, A.; Choudhury, N.; Moulik, S. Diabetes Disease Prediction Using Machine Learning Algorithms. In Proceedings of the 2020 IEEE-EMBS Conference on Biomedical Engineering and Sciences (IECBES), Langkawi Island, Malaysia, 1–3 March 2021; pp. 517–521. [Google Scholar] [CrossRef] [Scilit]
- Ahmed, N.; Ahammed, R.; Islam, M.M.; Uddin, M.A.; Akhter, A.; Talukder, M.A.; Paul, B.K. Machine learning based diabetes prediction and development of smart web application. Int. J. Cogn. Comput. Eng. 2021, 2, 229–241. [Google Scholar] [CrossRef] [Scilit]
- Deberneh, H.M.; Kim, I. Prediction of Type 2 Diabetes Based on Machine Learning Algorithm. Int. J. Environ. Res. Public Health 2021, 18, 3317. [Google Scholar] [CrossRef] [Scilit] [PubMed]
- Islam, M.M.; Ferdousi, R.; Rahman, S.; Bushra, H.Y. Likelihood prediction of diabetes at early stage using data mining techniques. In Computer Vision and Machine Intelligence in Medical Image Analysis; Springer: Singapore, 2020; pp. 113–125. [Google Scholar] [CrossRef] [Scilit]
- Chou, C.Y.; Hsu, D.Y.; Chou, C.H. Predicting the Onset of Diabetes with Machine Learning Methods. J. Pers. Med. 2023, 13, 406. [Google Scholar] [CrossRef] [Scilit] [PubMed]
- Laila, U.E.; Mahboob, K.; Khan, A.W.; Khan, F.; Taekeun, W. An Ensemble Approach to Predict Early-Stage Diabetes Risk Using Machine Learning: An Empirical Study. Sensors 2022, 22, 5247. [Google Scholar] [CrossRef] [Scilit] [PubMed]
- Angelov, P.P.; Soares, E.A.; Jiang, R.; Arnold, N.I.; Atkinson, P.M. Explainable artificial intelligence: An analytical review. WIREs Data Min. Knowl. Discov. 2021, 11, e1424. [Google Scholar] [CrossRef] [Scilit]
- Alicioglu, G.; Sun, B. A survey of visual analytics for explainable artificial intelligence in healthcare. Comput. Graph. 2022, 102, 502–520. [Google Scholar] [CrossRef] [Scilit]
- Tasin, I.; Nabil, T.U.; Islam, S.; Khan, R. Diabetes prediction using machine learning and explainable AI techniques. Healthc. Technol. Lett. 2023, 3, 100184. [Google Scholar]
- Caroprese, L.; Vocaturo, E.; Zumpano, E. Argumentation approaches for explainable AI in medical informatics. Intell. Syst. Appl. 2022, 16, 200109. [Google Scholar] [CrossRef] [Scilit]
- Menon, A.M.; Jyothi, G.N.; Bhavana, K.; Saara, K. Flask Based Web App on Diabetes Prediction Using Machine Learning. In Lecture Notes in Networks and Systems, Proceedings of the 2nd International Conference on Recent Trends in Machine Learning, IoT, Smart Cities and Applications, Telangana, India, 28–29 March 2021; Springer: Singapore, 2022; Volume 237, pp. 647–655. [Google Scholar] [CrossRef] [Scilit]
- Sujatha, C.N.; Gudipalli, A.; Pushyami, B.; Karthik, N.; Sanjana, B.N. Loan prediction using machine learning and its deployment on web application. In Proceedings of the 2021 Innovations in Power and Advanced Computing Technologies (i-PACT), Kuala Lumpur, Malaysia, 27–29 November 2021; IEEE: New York, NY, USA, 2021. [Google Scholar] [CrossRef] [Scilit]
- Shukla, S.; Maheshwari, A.; Johri, P. Comparative Analysis of ML Algorithms & Stream Lit Web Application. In Proceedings of the 2021 3rd International Conference on Advances in Computing, Communication Control and Networking (ICAC3N), Greater Noida, India, 17–18 December 2021; pp. 1–6. [Google Scholar] [CrossRef] [Scilit]
- Nassreddine, G.; Younis, J.; Falahi, T. Detecting Data Outliers with Machine Learning. Al-Salam J. Eng. Technol. 2023, 2, 152–164. [Google Scholar] [CrossRef] [Scilit]
- Tared, S.; RoubehieFissa, M.; Khaouane, L.; Hanini, S. Prediction of diabetes using hybrid support vector machines with Artificial Bee Colony. Int. J. Diabetes Dev. Ctries. 2025, 46, 469–484. [Google Scholar] [CrossRef] [Scilit]
- Zhang, S.; Li, J.; Li, Y. Reachable distance function for KNN classification. IEEE Trans. Knowl. Data Eng. 2022, 35, 7382–7396. [Google Scholar] [CrossRef] [Scilit]
- Salman, H.A.; Kalakech, A.; Steiti, A. Random forest algorithm overview. Babylon. J. Mach. Learn. 2024, 2024, 69–79. [Google Scholar] [CrossRef] [Scilit] [PubMed]
- Feurer, M.; Hutter, F. Hyperparameter optimization. In Automated Machine Learning: Methods, Systems, Challenges; Springer International Publishing: Cham, Switzerland, 2019; pp. 3–33. [Google Scholar] [CrossRef] [Scilit]
- Oture, O.; Iqbal, M.Z.; Wang, X. Enhanced diagnosis of thyroid diseases through advanced machine learning methodologies. Sci 2025, 7, 66. [Google Scholar] [CrossRef] [Scilit]
- Boser, B.E.; Guyon, I.M.; Vapnik, V.N. A training algorithm for optimal margin classifiers. In Proceedings of the Fifth Annual Workshop on Computational Learning Theory, Pittsburgh, PA, USA, 27–29 July 1992; pp. 144–152. [Google Scholar] [CrossRef] [Scilit]

Disclaimer/Publisher’s Note: The statements, opinions and data contained in all publications are solely those of the individual author(s) and contributor(s) and not of MDPI and/or the editor(s). MDPI and/or the editor(s) disclaim responsibility for any injury to people or property resulting from any ideas, methods, instructions or products referred to in the content. |
© 2026 by the authors. Licensee MDPI, Basel, Switzerland. This article is an open access article distributed under the terms and conditions of the Creative Commons Attribution (CC BY) license.