1. Introduction
Modern containerized infrastructures deploy tens to hundreds of heterogeneous services-web servers, API gateways, databases, message brokers, secret stores—interconnected through software-defined networks. Vulnerability scanners routinely report hundreds of Common Vulnerabilities and Exposures (CVE) entries across such deployments, yet patching capacity is finite: administrators must decide which vulnerabilities to address first. This decision has traditionally been guided by two principal scoring systems.
The Common Vulnerability Scoring System [
1] assigns a severity score on a scale from 0 to 10 based on the technical characteristics of a vulnerability, capturing exploitability and impact but not the operational context. The Exploit Prediction Scoring System [
2] improves upon CVSS by estimating the empirical probability that a CVE will be exploited in the wild within 30 days, trained on over 1100 features from the CVE ecosystem. The CISA Known Exploited Vulnerabilities catalogue [
3] complements these with binary signals for actively exploited CVEs. However, all three sources evaluate each CVE in isolation: a critical remote code execution on a database server holding patient records receives the same EPSS score whether it is directly exposed to the internet or buried behind three layers of firewalls and network segmentation. Recent studies on vulnerability lifecycle modeling [
4] and context-aware CVSS prioritization [
5] have highlighted the limitations of context-free scoring, while comprehensive reviews of detection methodologies [
6] underscore the need for structured approaches that integrate CVE, Common Platform Enumeration (CPE), and Common Weakness Enumeration (CWE) data.
Attack graphs address this limitation by modeling how an attacker can chain multiple vulnerabilities to reach a target asset. The field originates with Phillips and Swiler [
7], who proposed graph-based network vulnerability analysis, and evolved through state-enumeration approaches [
8,
9], the scalable exploit-dependency graphs of Ammann et al. [
10], and the MulVAL framework of Ou et al. [
11]. Probabilistic extensions include the Bayesian attack graph models of Frigault et al. [
12] and Poolsappasit et al. [
13], which enable risk quantification under uncertainty. However, Bayesian inference on attack graphs faces difficulties with cyclic structures; Muñoz-González et al. [
14] developed exact inference techniques specifically to address this limitation. A recent survey by Ramos et al. [
15] cataloged over 40 model-based quantitative security metrics, noting that most aggregate CVSS scores along paths without considering the full topological context. Al-Araji et al. [
16] further classified 46 attack graph-based metrics into path-based, probabilistic, and graph-theoretic families.
Despite this rich literature, three practical gaps remain. First, Bayesian propagation does not guarantee monotonic risk reduction upon patching due to the explaining-away phenomenon inherent in directed graphical models. Second, existing tools require manual graph construction or complex infrastructure such as MulVAL with Prolog-based reasoning and Nessus scan imports. Third, the connection between the meso-scale structure of the CWE–CVE–CPE triad and operational patch prioritization remains underexplored, even though directed-graph models for industrial vulnerability analysis [
17], smart grid attack analysis [
18], and data-plane monitoring with attack graphs [
19] have demonstrated the value of structural reasoning in specific domains.
We propose the Dynamic Security Resistance Distance (DSRD) framework, which addresses these gaps through three contributions:
We evaluate DSRD on nine topologies—six Docker Compose and three GNS3—totaling 895 version-relevant vulnerability nodes derived from real CVE data. We formulate four research questions:
- RQ1.
Does topology-aware prioritization outperform score-only approaches at reducing structural risk?
- RQ2.
Does vendor and CWE diversity correlate with the advantage of graph-aware methods?
- RQ3.
Under what conditions does graph-aware prioritization degenerate into score-only behavior?
- RQ4.
Which bio-inspired algorithm performs best for structural patch prioritization?
3. Methodology
3.1. System Architecture
The DSRD pipeline transforms Infrastructure-as-Code configuration files into prioritized patch recommendations through six stages.
Stage 1: Topology Parsing. Infrastructure-as-Code files in Docker Compose YAML, GNS3 JSON, or Containerlab YAML format are parsed to extract components, network connections, exposed ports, and network segmentation. Connections are derived exclusively from shared Docker networks; the depends_on directive, which represents container start order only, is not treated as a network connection.
Stage 2: CPE Identification. Each component’s container image name is resolved to a Common Platform Enumeration identifier via the CPE-Guesser API [
23], which returns the most likely CPE match based on fuzzy string matching against the official NVD CPE dictionary. For GNS3 and Containerlab topologies, where components run as QEMU or cloud-hypervisor virtual machines, the image name resolves to a generic hypervisor CPE that does not describe the guest software. To address this, DSRD implements a two-stage fallback: if the initial CPE is generic, the component’s node name is parsed into keywords (e.g., “FortiGate-Primary” yields
[fortinet, fortigate]), matched against a vendor-hint dictionary of 25 common enterprise products, and re-queried against the CPE-Guesser API. This resolves products such as FortiOS, Microsoft Exchange Server, VMware ESXi, and SolarWinds Orion from their topology labels.
Stage 3: CVE Discovery and Version Filtering. For each CPE, the cvelistV5 [
24] repository is searched using case-insensitive grep on product names, followed by JSON parsing to verify vendor and product matches in the
affected[] fields. Vendor and product names are normalized by stripping all non-alphanumeric characters to handle mismatches between the CPE format—where “Palo Alto Networks” becomes
paloaltonetworks—and the free-text vendor fields in CNA containers. CWE identifiers are extracted from the
problemTypes[].descriptions[] structure, checking both the dedicated
cweId field and regex matching on the
description text.
After the initial CVEs discovery, a version-aware filtering stage reduces version-irrelevant CVE candidates by matching discovered CVEs against the specific software version deployed. The version is extracted from the Docker image tag using regex pattern matching—for example, redis:7.2-alpine yields version 7.2, while jenkins/jenkins:2.426.1-lts yields 2.426.1. Each CVE’s affected[].versions[] ranges from cvelistV5 are then checked: CVEs whose affected ranges do not include the deployed version are discarded. When the image tag does not contain a numeric version—as with nginx:latest or images without tags—a fallback strategy retains only CVE affecting the three most recent versions mentioned across all CVE records for that product. This heuristic ensures conservative coverage while still eliminating CVEs targeting obsolete versions. On the tested topologies, version filtering reduces CVEs counts by 75–97% for products with explicit version tags: Jenkins from 1480 to 323 CVEs, Redis from 59 to 2, Grafana from 81 to 8, and PHP from 471 to 50.
Stage 4: EPSS Enrichment. Exploitation probabilities are fetched in batches from the FIRST.org EPSS API [
2] for all discovered CVEs. Scores are cached per session to avoid redundant API calls across topologies sharing common software.
Stage 5: Attack Graph Construction. A directed weighted graph is built with four node types and three edge types. The node types are: ENTRY nodes representing services with exposed ports; VULNERABILITY nodes representing individual CVEs associated with a component; COMPROMISED nodes representing hosts reachable after successful exploitation; and TARGET nodes representing critical assets such as databases, authentication services, or secret stores, detected via CPE keyword matching. The edge types with their respective conductances are:
ACCESS edges with conductance , representing network reachability between components on shared networks;
EXPLOIT edges with conductance , combining the empirical exploitation probability with normalized severity into an expected-impact weight;
REACH edges with conductance , representing lateral movement from a compromised host to adjacent vulnerabilities.
To maintain a tractable graph size, only the top 20 CVEs per component—ranked by descending EPSS score—are included as vulnerability nodes. CVEs with zero EPSS are excluded entirely, as they contribute no conductance to the graph. This cap explains why the vulnerability node count in the attack graph is substantially lower than the total CVE count after version filtering (
Table 1).
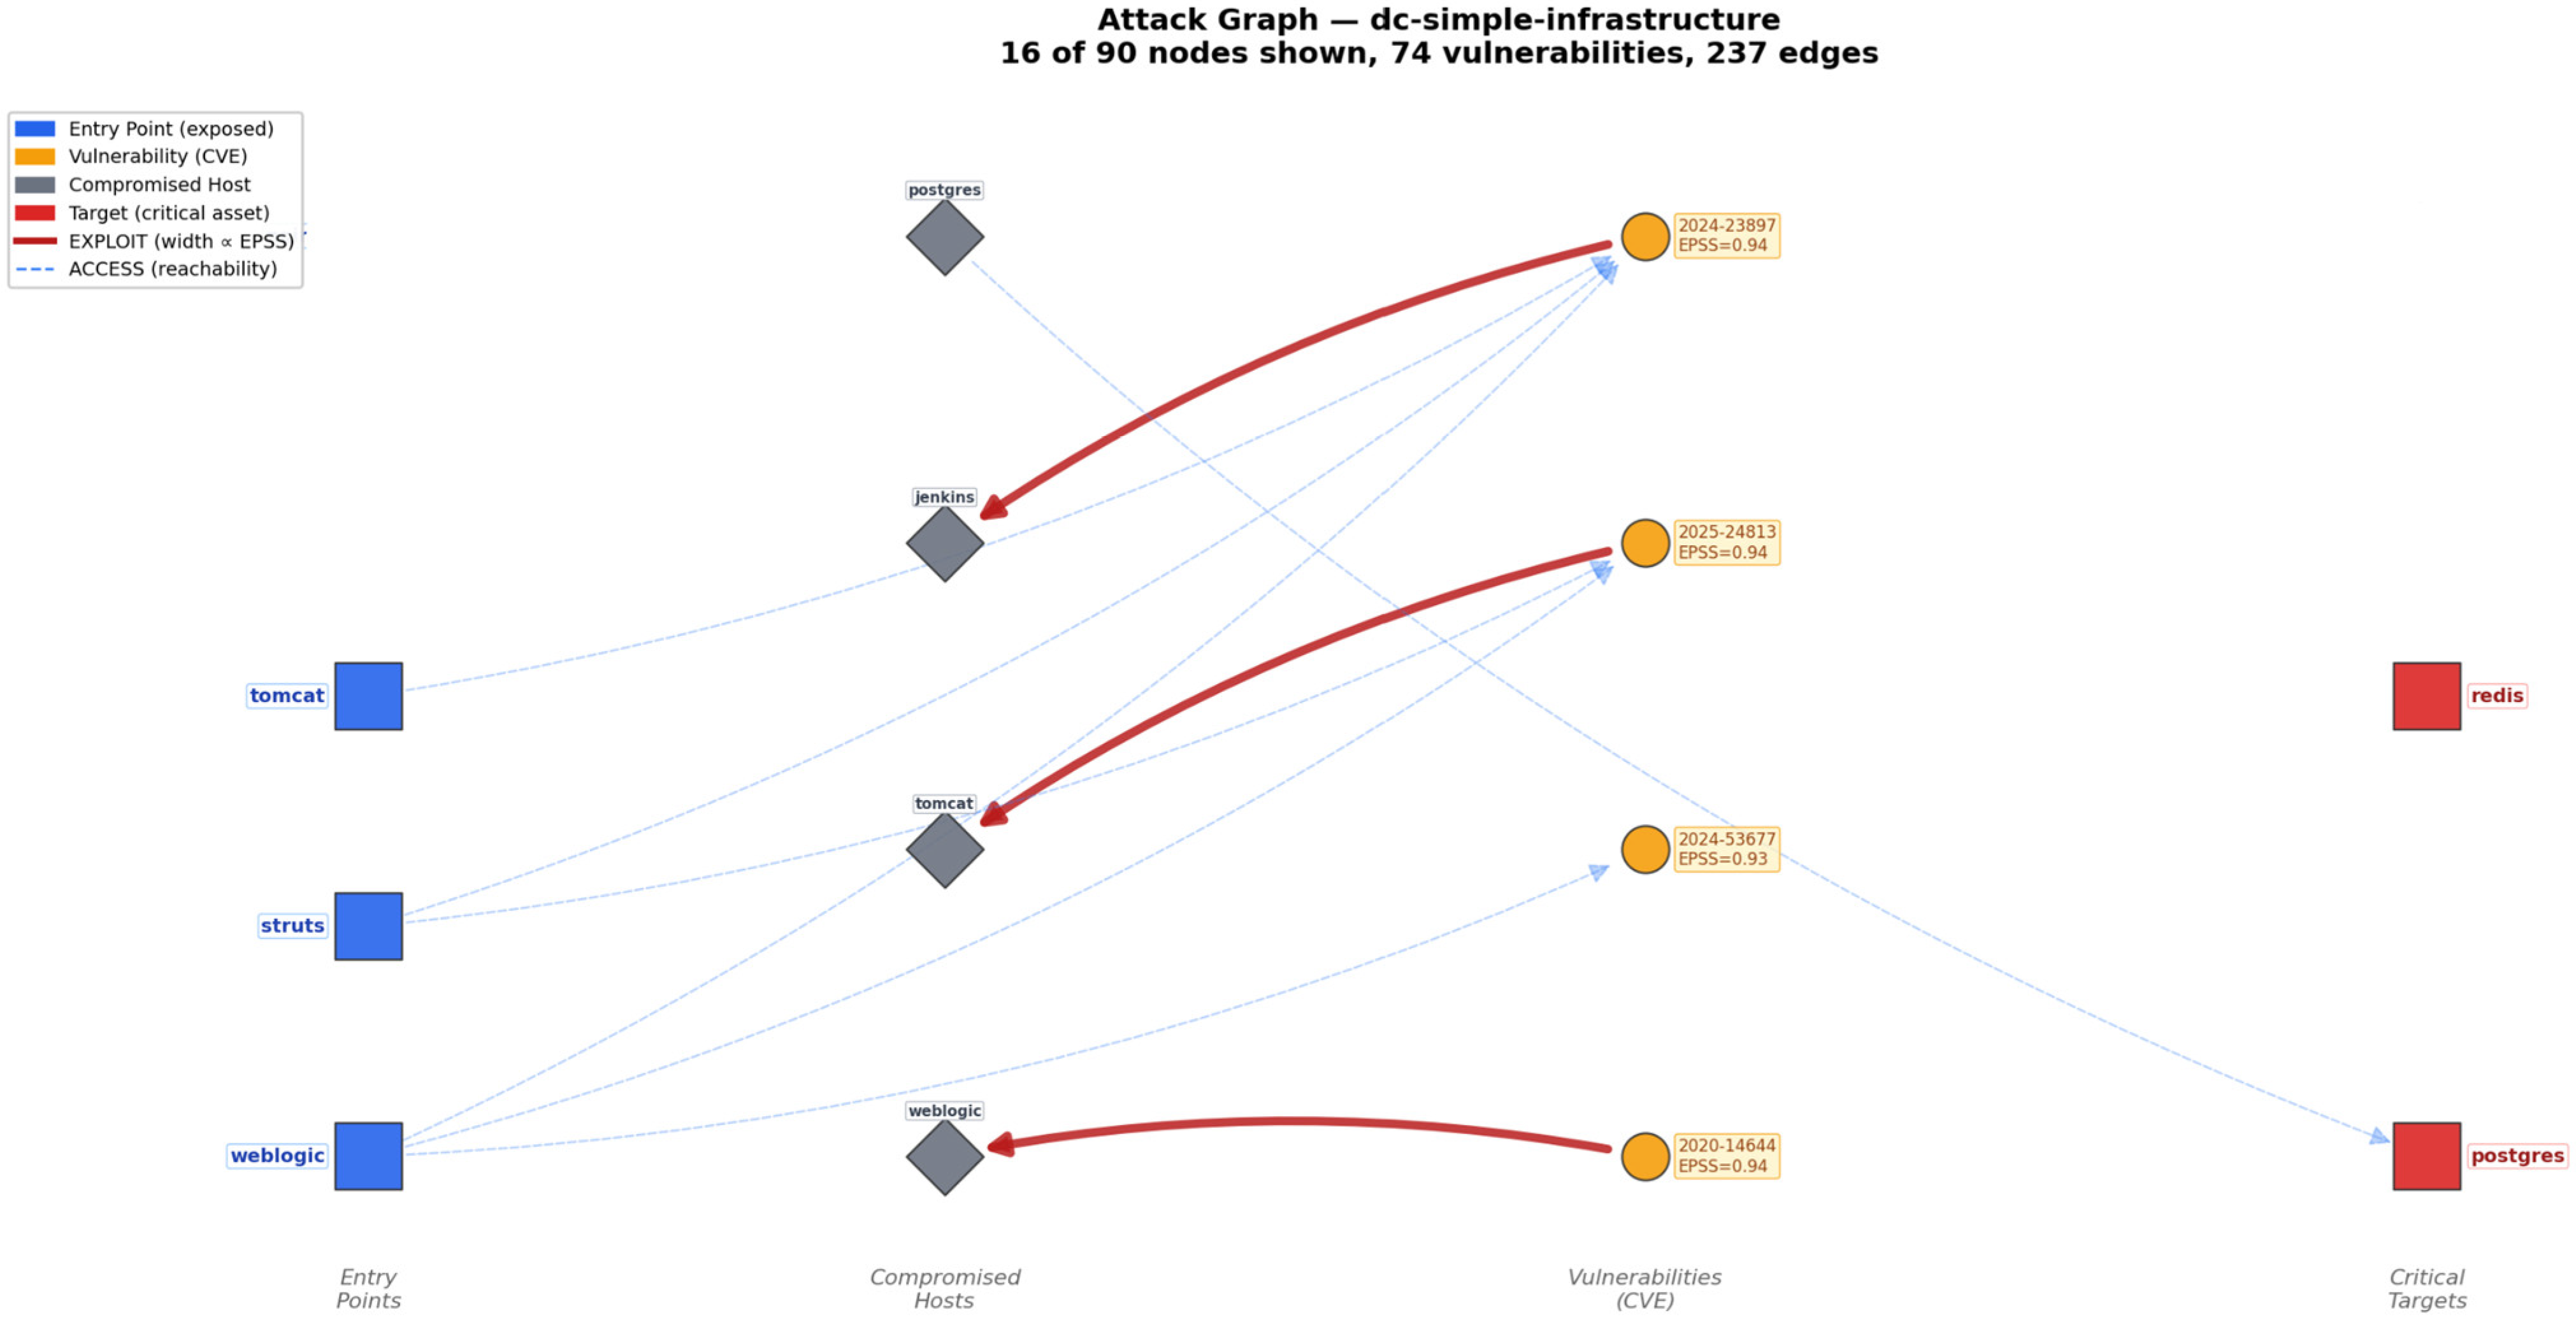
Figure 1 illustrates a representative attack graph generated from the simple-infrastructure Docker Compose topology, showing the structural relationships between entry points, vulnerabilities, compromised hosts, and targets.
Stage 6: Ranking and Validation. Bio-inspired and baseline algorithms rank vulnerabilities by their structural impact; the PatchSimulator evaluates cumulative risk reduction curves by iteratively removing EXPLOIT edges in ranked order and recomputing the Average Structural Compromise Exposure (ASCE) after each removal.
We use the EPSS score as the conductance of EXPLOIT edges, not as a conditional probability of traversing a specific edge in the local attack graph. EPSS estimates the probability that a CVE will be exploited in the wild within 30 days—a global, population-level signal—whereas edge traversal in an attack graph is a local, topology-dependent event. We do not claim semantic equivalence between these two quantities. Instead, we treat EPSS as an empirical exploitability signal that modulates the attack-facilitation weight of each vulnerability: a higher EPSS score indicates lower impedance to exploitation and therefore higher conductance, exactly as a low-resistance component in an electrical circuit. We further scale by normalized CVSS to incorporate severity: a vulnerability that is both likely to be exploited and high-impact produces a proportionally higher conductance than one that is likely but low-impact. The choice of conductance rather than resistance is deliberate: vulnerabilities that are easier to exploit reduce the impedance of the attack path, and the Kirchhoff framework naturally aggregates these reductions across all parallel paths. This monotone mapping from exploitability to conductance preserves the ordering of EPSS scores while embedding them in a topological context that EPSS alone cannot provide.
3.2. Kirchhoff Effective Resistance
Given the attack graph
with the weighted adjacency matrix
W, where
denotes the conductance of edge
, we symmetrize via
and compute the graph Laplacian:
The effective resistance between nodes
i and
j is defined as:
where
denotes the Moore–Penrose pseudoinverse of the Laplacian [
21]. Unlike shortest-path or maximum-flow metrics,
integrates contributions from all parallel paths between
i and
j, weighting each by its total conductance.
We convert effective resistance to a structurally compromised affinity:
This mapping yields two limiting cases: as —achievable only in the degenerate limit of infinite conductance— approaches 1; as , the nodes are disconnected and . For any finite-conductance edge, and therefore ; a direct connection with conductance g yields and . Intermediate values provide an interpretable risk score that accounts for both direct and indirect attack paths. We emphasize that SCA is a monotone structural surrogate, not a calibrated probability; it preserves the resistance ordering and guarantees that patching cannot increase the score, but it does not estimate the absolute likelihood of compromise within a given time window.
SCA should be understood as a topological ordering tool: it ranks node pairs by how structurally exposed the target is to the entry point, integrating all parallel paths and their conductances. It does not model attacker skill, exploit reliability, defender response time, or any operational variable beyond EPSS-weighted connectivity. Two topologies with identical SCA values may have vastly different real-world risk profiles depending on factors outside the graph model. The value of SCA lies exclusively in relative comparison—ranking CVEs within a single topology or comparing the effect of alternative patch orderings on the same graph—not in absolute risk quantification.
The aggregate risk metric, the Average Structural Compromise Exposure (ASCE), averages SCA over all entry–target pairs:
where
and
are the sets of entry and target nodes, respectively. ASCE takes values in
: higher values indicate greater structural exposure to compromise, and lower values indicate a stronger security posture.
By Theorem 4.5 of Ellens et al. [
22], the effective resistance is a non-increasing function of edge weights. Removing an EXPLOIT edge, that is patching a CVE, cannot decrease
and therefore cannot increase
. This provides a formal guarantee for the structural risk metric, not for real-world breach probability that is absent from Bayesian propagation approaches, where the explaining-away phenomenon can cause counterintuitive risk increases upon patching.
DSRD operates on an undirected relaxation of the directed attack graph: symmetrization via
is not merely a technical convenience but a deliberate modeling choice that constitutes one of the central assumptions of the framework. The cost of this relaxation is the loss of attack directionality—the symmetrized graph implicitly allows information flow in both directions along edges that are unidirectional in the real attack model. The benefit is twofold: first, it enables the use of Kirchhoff effective resistance with its well-studied spectral properties and the monotonicity guarantee of Theorem 4.5 [
22]; second, it admits the commute-time interpretation of Chandra et al. [
35], under which effective resistance equals the expected round-trip time of a random walk, providing a reasonable model for an attacker exploring the network under incomplete knowledge of topology. We consider this an acceptable trade-off: DSRD is an undirected relaxation of directed attack reachability designed to guarantee monotone structural ranking, and its practical utility is validated empirically in
Section 5. Extensions to directed effective resistance [
36] would preserve directionality but do not yet provide the same monotonicity guarantees and are discussed as future work.
3.3. Bio-Inspired Ranking Algorithms
The primary ranking method is Greedy Kirchhoff, which directly optimizes ASCE by exhaustive single-step evaluation. In addition, three bio-inspired heuristics simulate realistic attacker traversal patterns on the attack graph: each models a different aspect of how an attacker with incomplete network knowledge might explore, learn, and exploit paths toward critical assets. When these behaviorally distinct traversal strategies converge on the same high-priority CVEs as the mathematically optimal Greedy method, this provides independent evidence that the identified vulnerabilities are genuine structural bottlenecks—not artifacts of the optimization objective alone.
Greedy Kirchhoff. This deterministic algorithm directly optimizes ASCE at each step: for every unpatched CVE, it simulates removal of the corresponding EXPLOIT edge, recomputes ASCE, and selects the CVE producing the largest risk reduction. Greedy Kirchhoff provides an upper bound on single-step optimality and follows the greedy resistance optimization paradigm of Predari et al. [
28]. Its runtime is
for
k patches on
n nodes, which is tractable for the topologies tested but may become a bottleneck on graphs exceeding approximately 500 nodes.
Ant Colony Optimization. Following Dorigo and Stützle [
25], artificial ants construct stochastic paths from entry nodes to target nodes, depositing pheromone proportional to path conductance. This models a collaborative multi-probe attacker: multiple independent agents explore the network simultaneously, sharing intelligence about productive paths through pheromone signals. Vulnerabilities on high-pheromone paths those most frequently traversed by successful attack simulations are prioritized. The algorithm uses pheromone importance
, heuristic importance
, evaporation rate
, and runs for 200 iterations.
Physarum Polycephalum. Inspired by the slime-mold network optimization of Tero et al. [
27], this algorithm models the attack graph as a network of tubes connecting entry and target nodes. Tube conductances evolve according to flow magnitude: edges carrying high flow—corresponding to critical attack paths—are reinforced, while low-flow edges are attenuated. This models an adaptive persistent attacker who gradually learns the network topology through repeated probing, concentrating effort on paths that yield the most progress toward targets. After 200 iterations with decay parameter
, vulnerabilities are ranked by the final conductance of their EXPLOIT edges.
Fungal Network Growth. This algorithm draws on the biological observation that foraging fungi such as Phanerochaete velutina solve transport network optimization problems through a three-phase developmental programme: initial over-production of exploratory hyphae, selective reinforcement of high-throughput pathways via nutrient-driven positive feedback, and recycling of redundant branches, as characterized experimentally by Bebber et al. [
39]. This models an exploratory attacker with resource constraints: broadly scanning the network in early stages, selectively investing in productive attack chains, and abandoning dead-end paths. In our computational adaptation, virtual hyphae grow stochastically from entry nodes, branch at intermediate nodes with probability proportional to local connectivity, and undergo anastomosis when branches from different tips meet. Nutrient flow—modeled as conductance-weighted signal propagation from target nodes—reinforces edges carrying high cumulative flow and prunes those carrying negligible flow. After convergence, vulnerabilities are ranked by the final reinforced conductance of their EXPLOIT edges.
The three bio-inspired methods avoid repeated pseudoinverse computation by ranking vulnerabilities through path-based traversal dynamics, offering both a scalability advantage on larger graphs and an independent behavioral validation channel: if stochastic attacker simulations identify the same critical vulnerabilities as the analytical Kirchhoff method, this strengthens the case that those vulnerabilities are genuinely structurally important.
3.4. Baselines
Three topology-unaware baselines represent current industry practice. EPSS-only ranks vulnerabilities by descending EPSS score, reflecting the state-of-the-art recommendation for prioritization without structural context. CVSS-only ranks by descending CVSS v3.1 base score, representing the traditional severity-first approach. EPSS × CVSS ranks by the product , combining exploitation likelihood with severity into an expected-value metric. All three baselines ignore the network topology entirely.
To distinguish whether the advantage of DSRD stems from using topology at all versus using effective resistance specifically, we additionally compare against three topology-aware structural baselines that do not use Kirchhoff resistance: node betweenness centrality (the fraction of shortest entry–target paths passing through a vulnerability node), path count, and weighted degree centrality. These baselines use the same attack graph but rank vulnerabilities by local or path-based structural importance rather than all-path resistance.
3.5. Validation Framework
For each topology, algorithm rankings are compared against the EPSS-only baseline using three complementary criteria:
Kendall rank correlation, where lower absolute values indicate more divergent—and therefore more topology-informed—rankings.
ASCE advantage , measuring the cumulative structural risk reduction after K patches. Positive values indicate that the algorithm reduces risk more effectively than the baseline.
Structural advantage criterion: we consider a graph-aware algorithm to provide meaningful advantage over the baseline when —indicating a substantially different ranking—and , the latter threshold chosen to exclude numerical noise from floating-point computation of the Laplacian pseudoinverse. This is an operational decision rule, not a formal statistical test.
5. Results
Throughout the evaluation, we distinguish four terms precisely. Structural compromise affinity (SCA) is the per-pair score derived from effective resistance; it is a topological ordering tool, not a calibrated probability. Average Structural Compromise Exposure (ASCE) is SCA averaged over all entry–target pairs. Risk reduction () is the decrease in ASCE after K patches. Attack success rate refers exclusively to Monte Carlo simulation outcomes and is a model-internal consistency check, not an estimate of real-world breach probability.
5.1. RQ1: Graph-Aware vs. Score-Only Prioritization
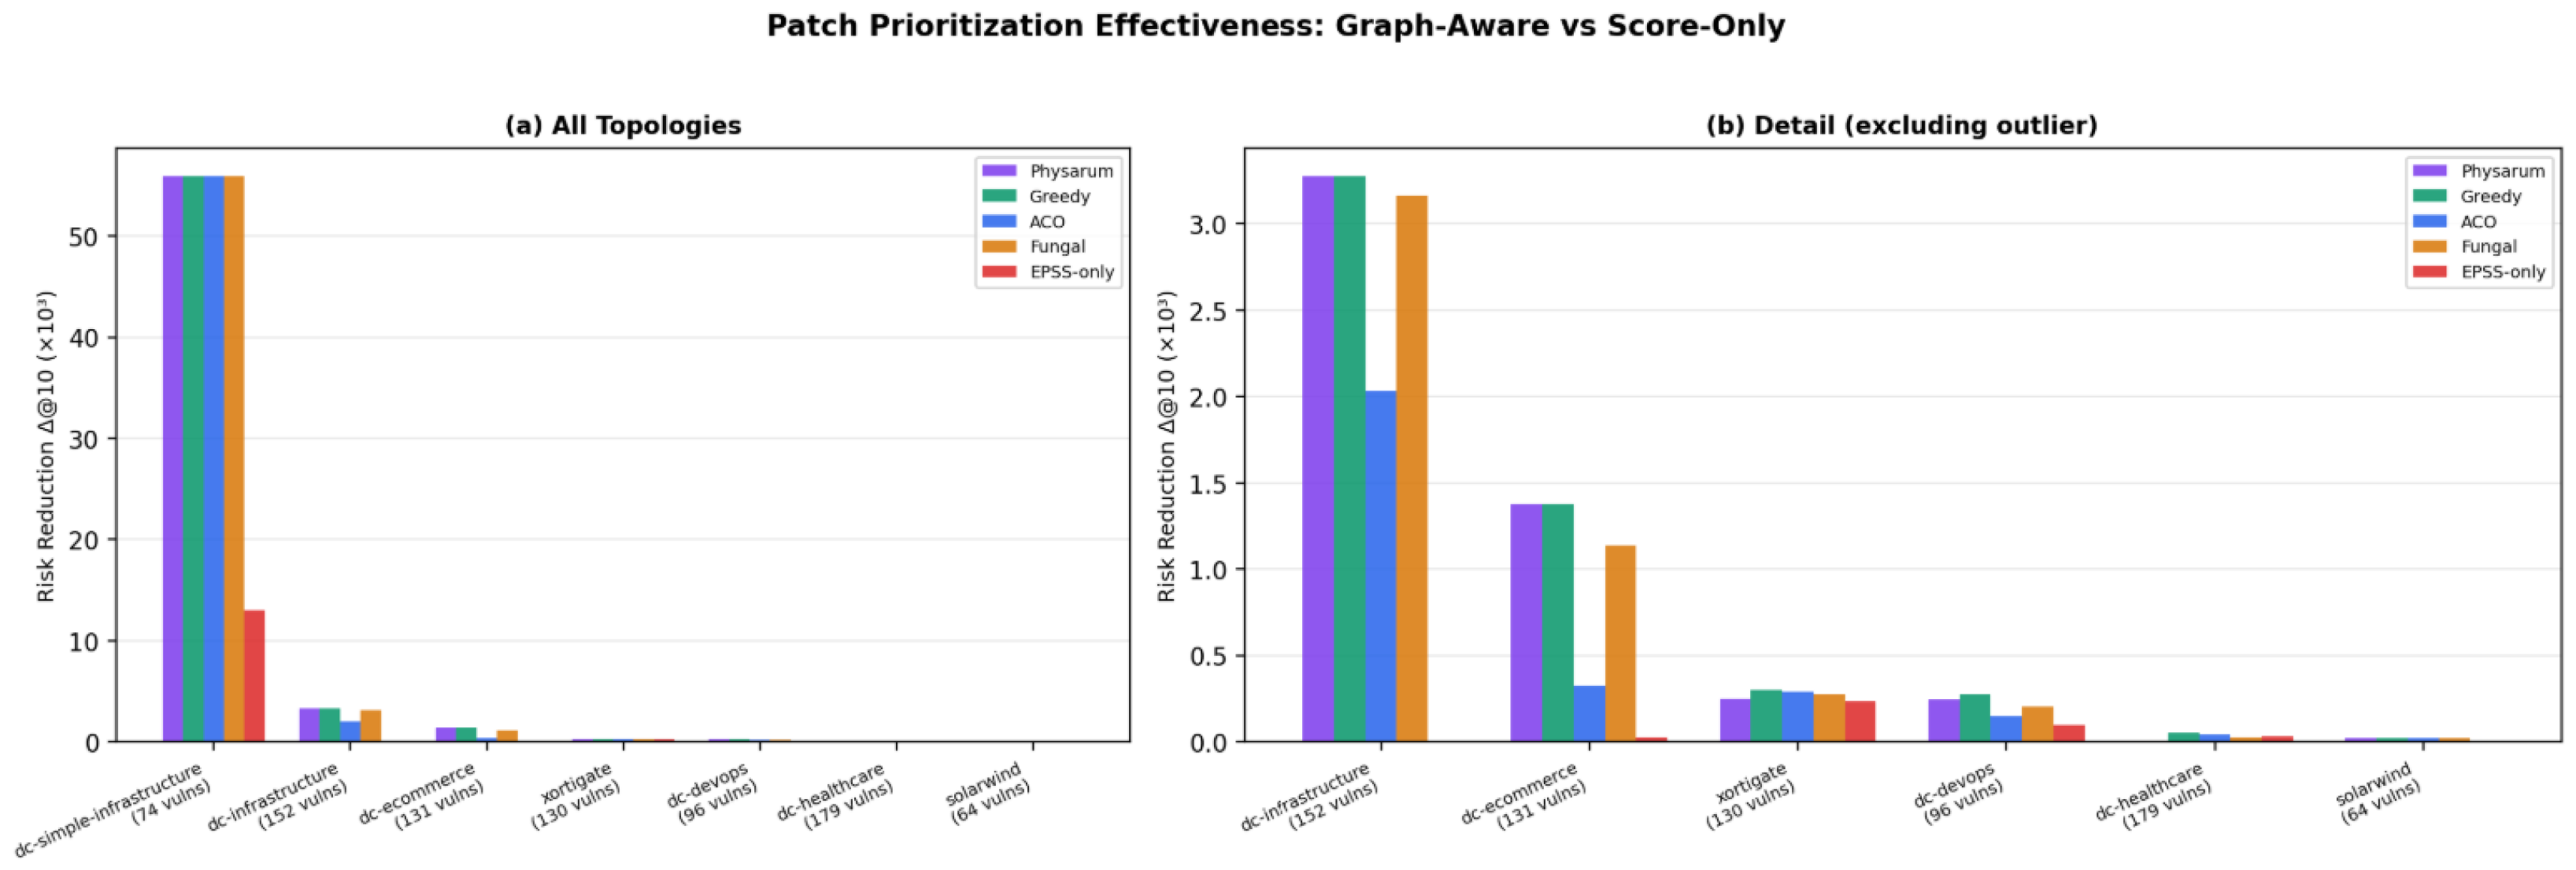
Figure 2 presents the risk reduction
achieved by each algorithm after 10 patches across all topologies with sufficient vulnerability diversity.
Table 2 provides the corresponding numerical values.
Finding 1. Graph-aware algorithms outperform EPSS-only on all tested heterogeneous topologies with sufficient vulnerability diversity. On four topologies—infrastructure, ecommerce, healthcare, and solarwind—EPSS-only produces zero structural improvement as measured by ASCE, while graph-aware methods achieve measurable risk reduction on all but solarwind. On simple-infrastructure, EPSS-only does achieve after 10 patches, but graph-aware methods achieve —a 4.4× improvement—because they prioritize a single bottleneck CVE on a target node rather than distributing effort across high-EPSS entry-point vulnerabilities.
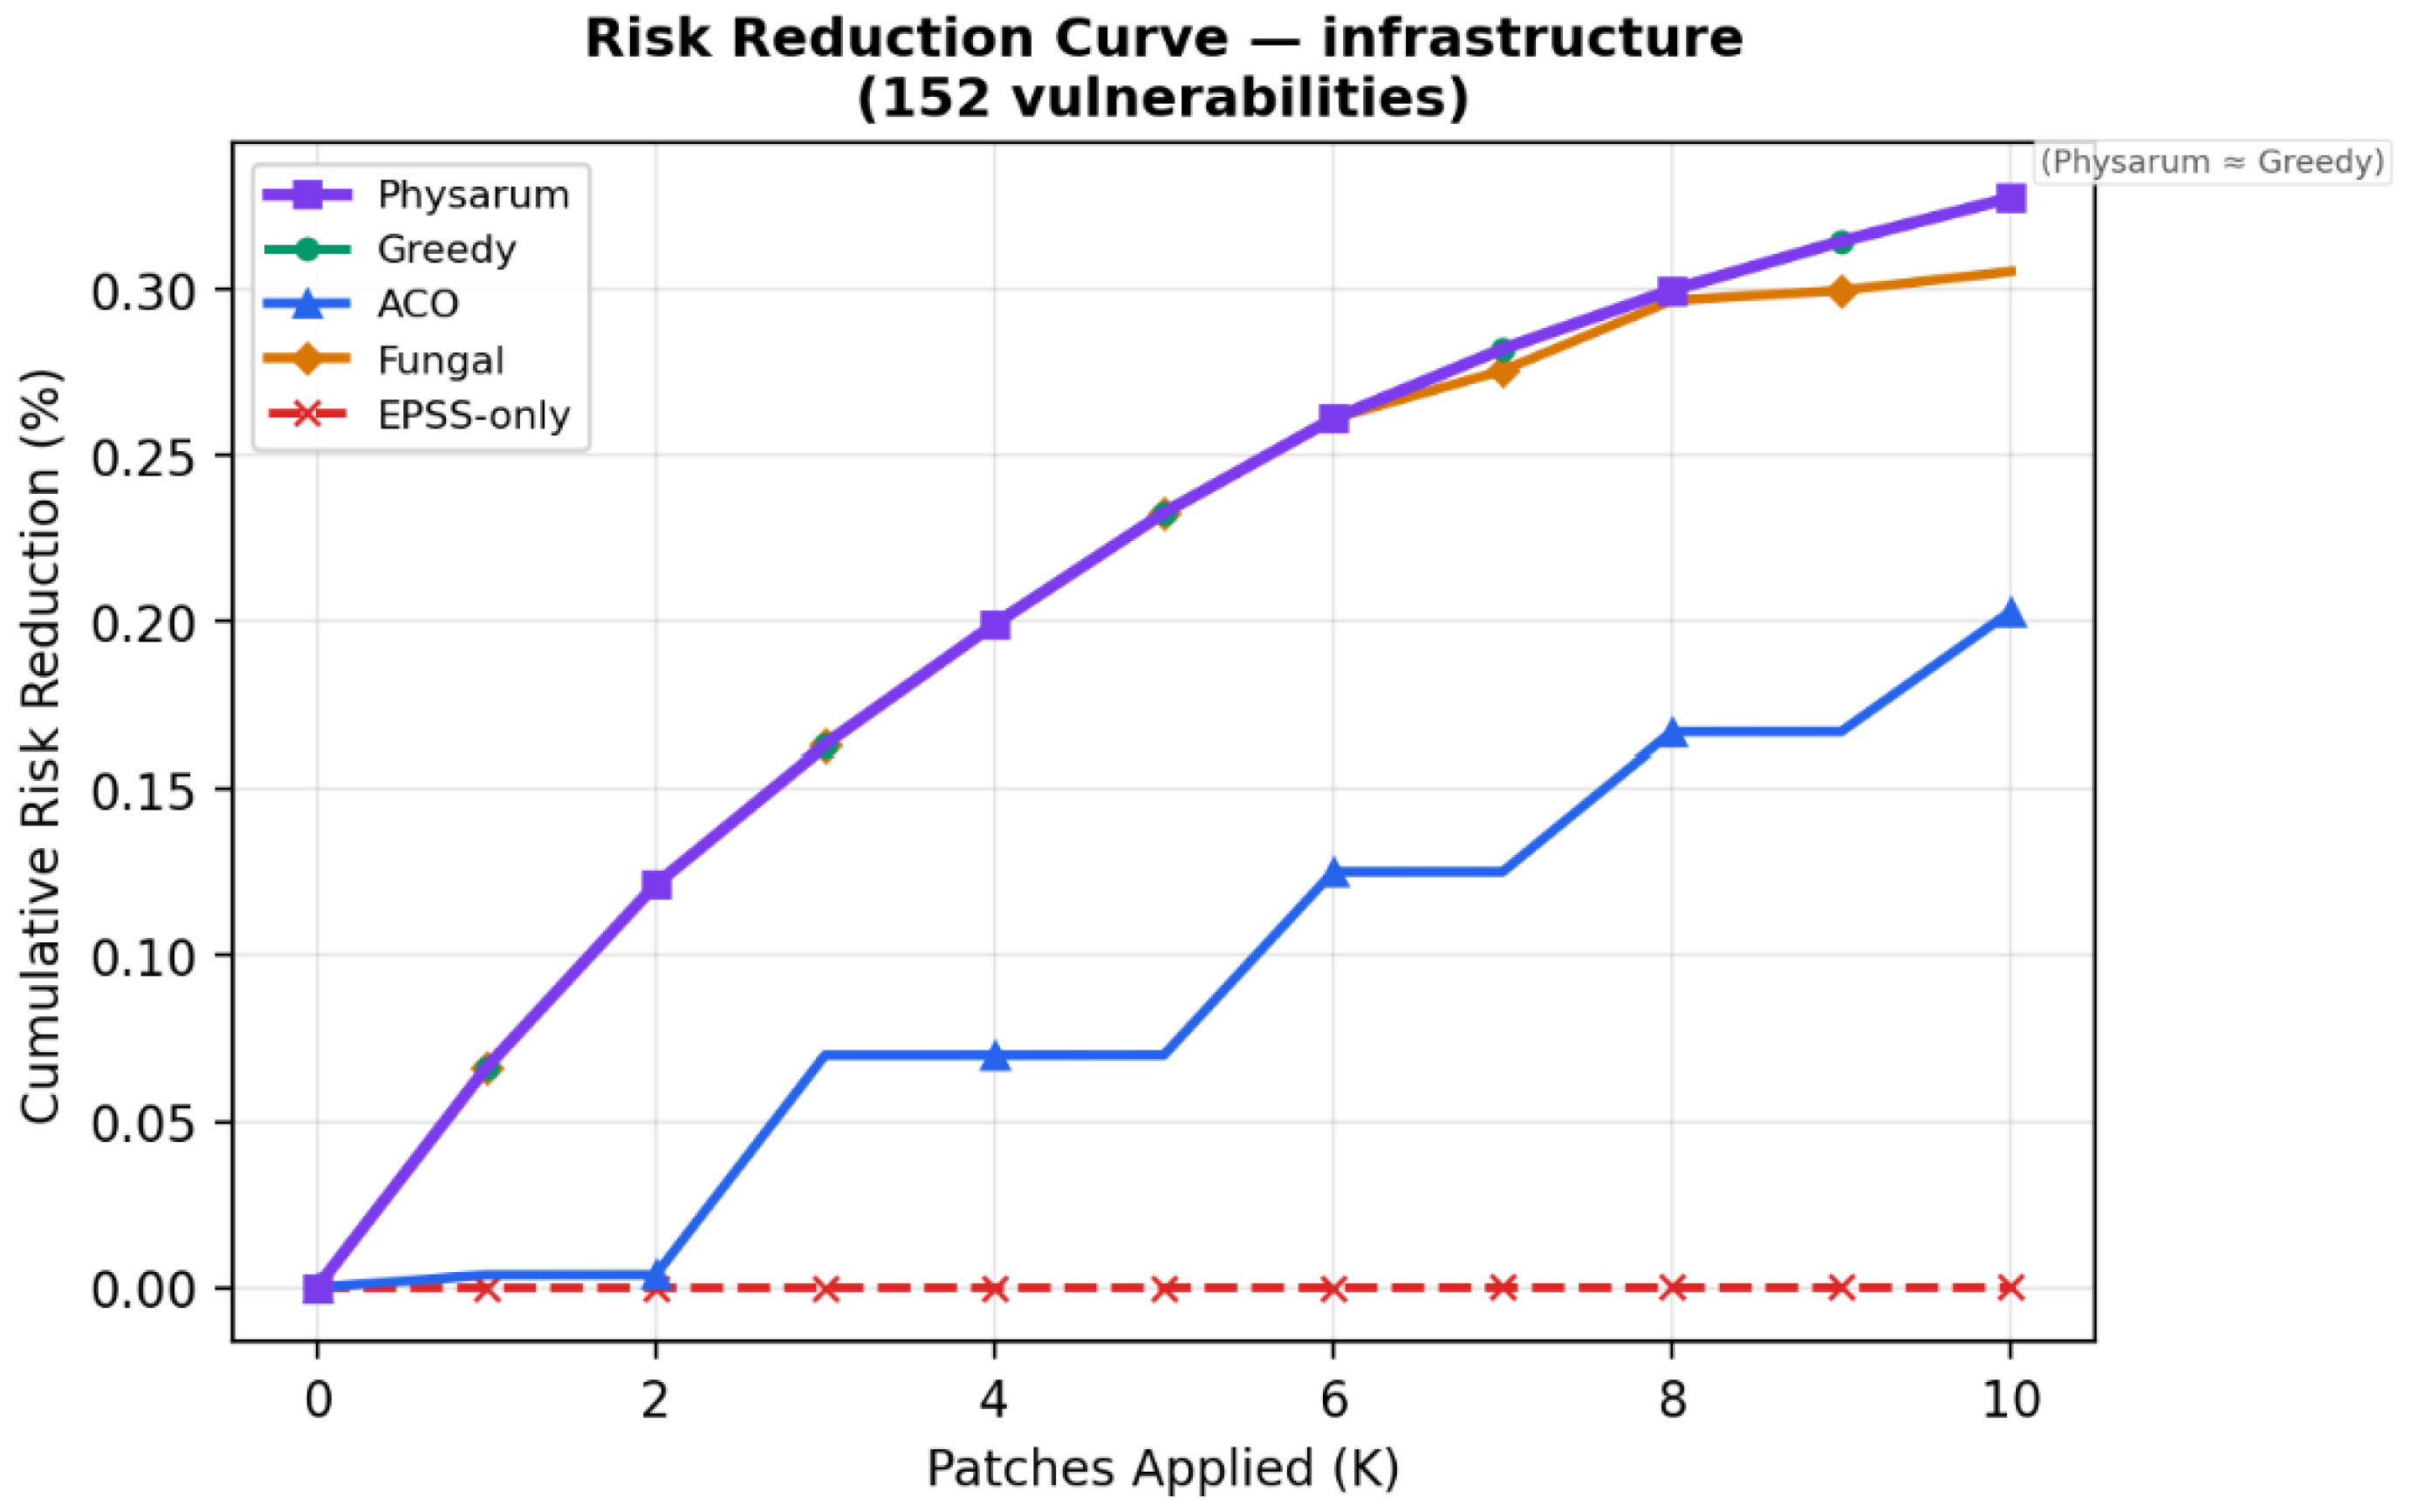
Finding 2. On the infrastructure topology, Physarum and Greedy converge to the same optimal solution, both selecting CVE-2023-6337 on HashiCorp Vault as the top priority. This vulnerability has an EPSS score of only 0.010; yet, its structural importance derives from its position on a target node—the secrets store—making it a bottleneck on multiple critical attack paths. EPSS-only instead selects CVE-2022-46169 on Cacti with EPSS of 0.945, a vulnerability on an entry point where hundreds of alternative exploit paths remain after patching.
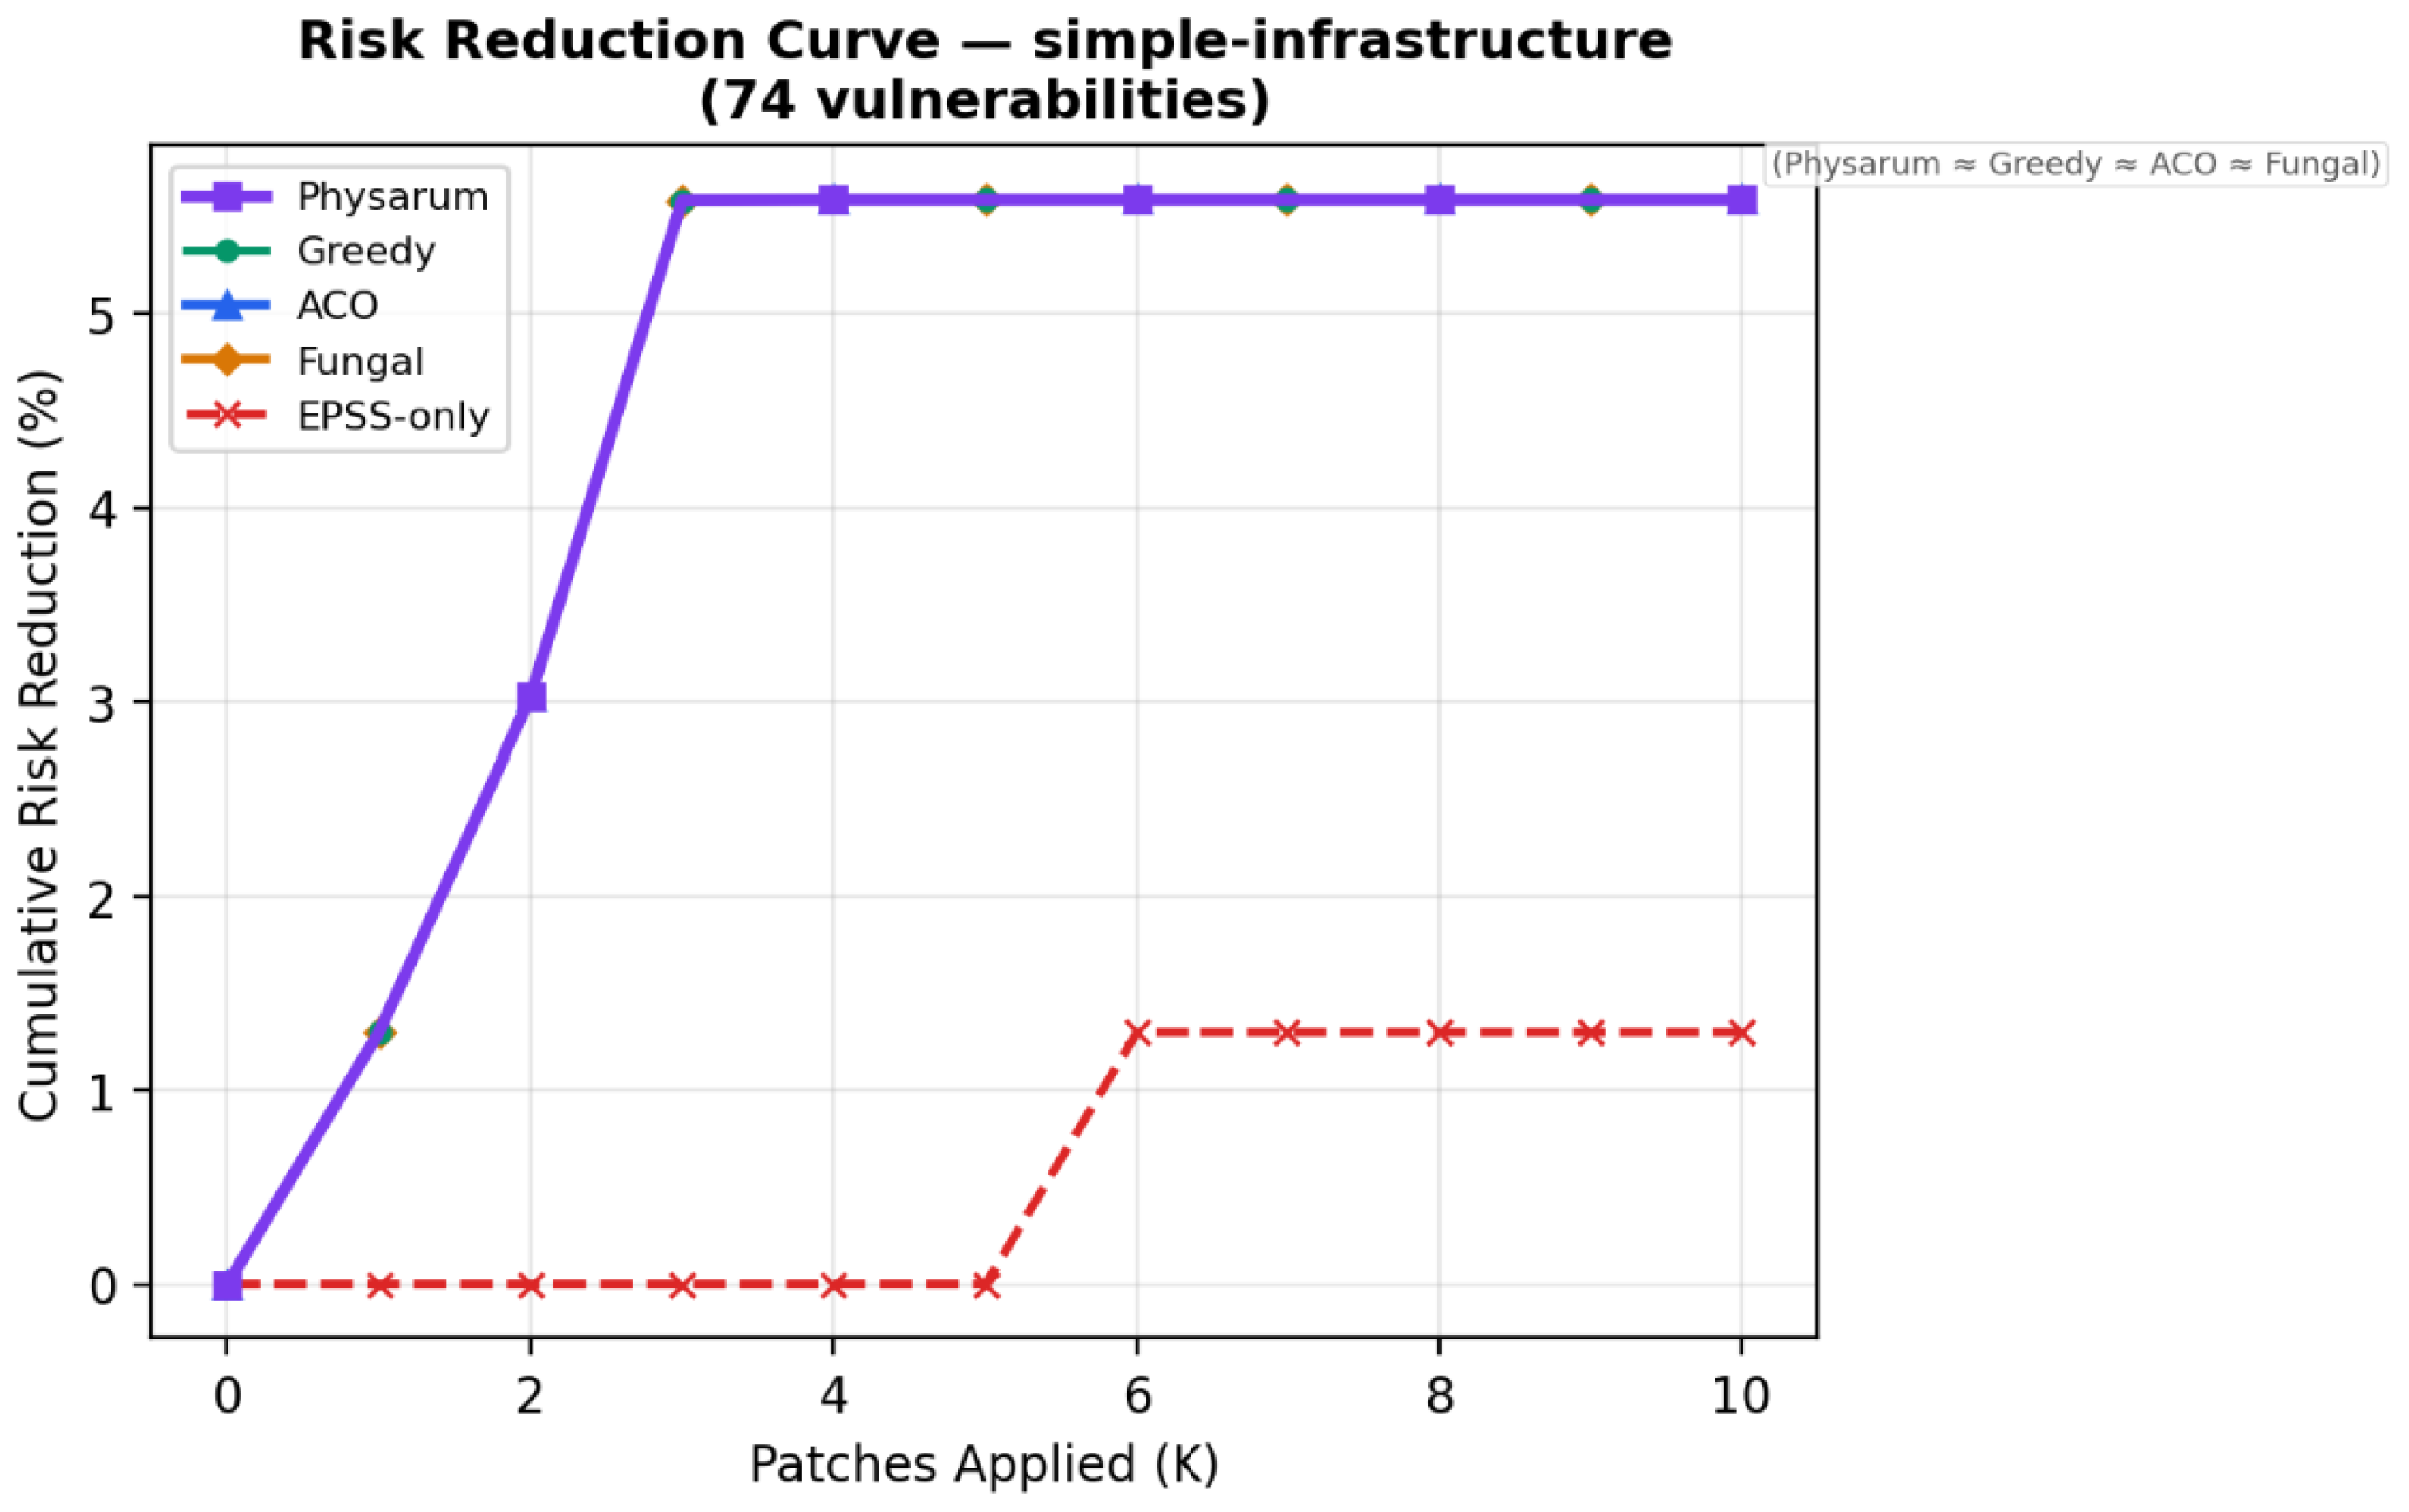
Figure 3 shows the cumulative risk reduction curve for the simple-infrastructure topology, which is the best-performing case.
Figure 4 shows the infrastructure topology, which best illustrates algorithm differentiation.
Finding 3. On simple-infrastructure, all four graph-aware algorithms converge to , selecting CVE-2023-36824, a Redis heap overflow on a target node—as the top priority. EPSS-only instead selects CVE-2024-23897, a Jenkins arbitrary file read with EPSS of 0.945, which sits on an entry point where patching one of 324 vulnerabilities has negligible structural impact.
5.2. RQ2: Vendor and CWE Diversity
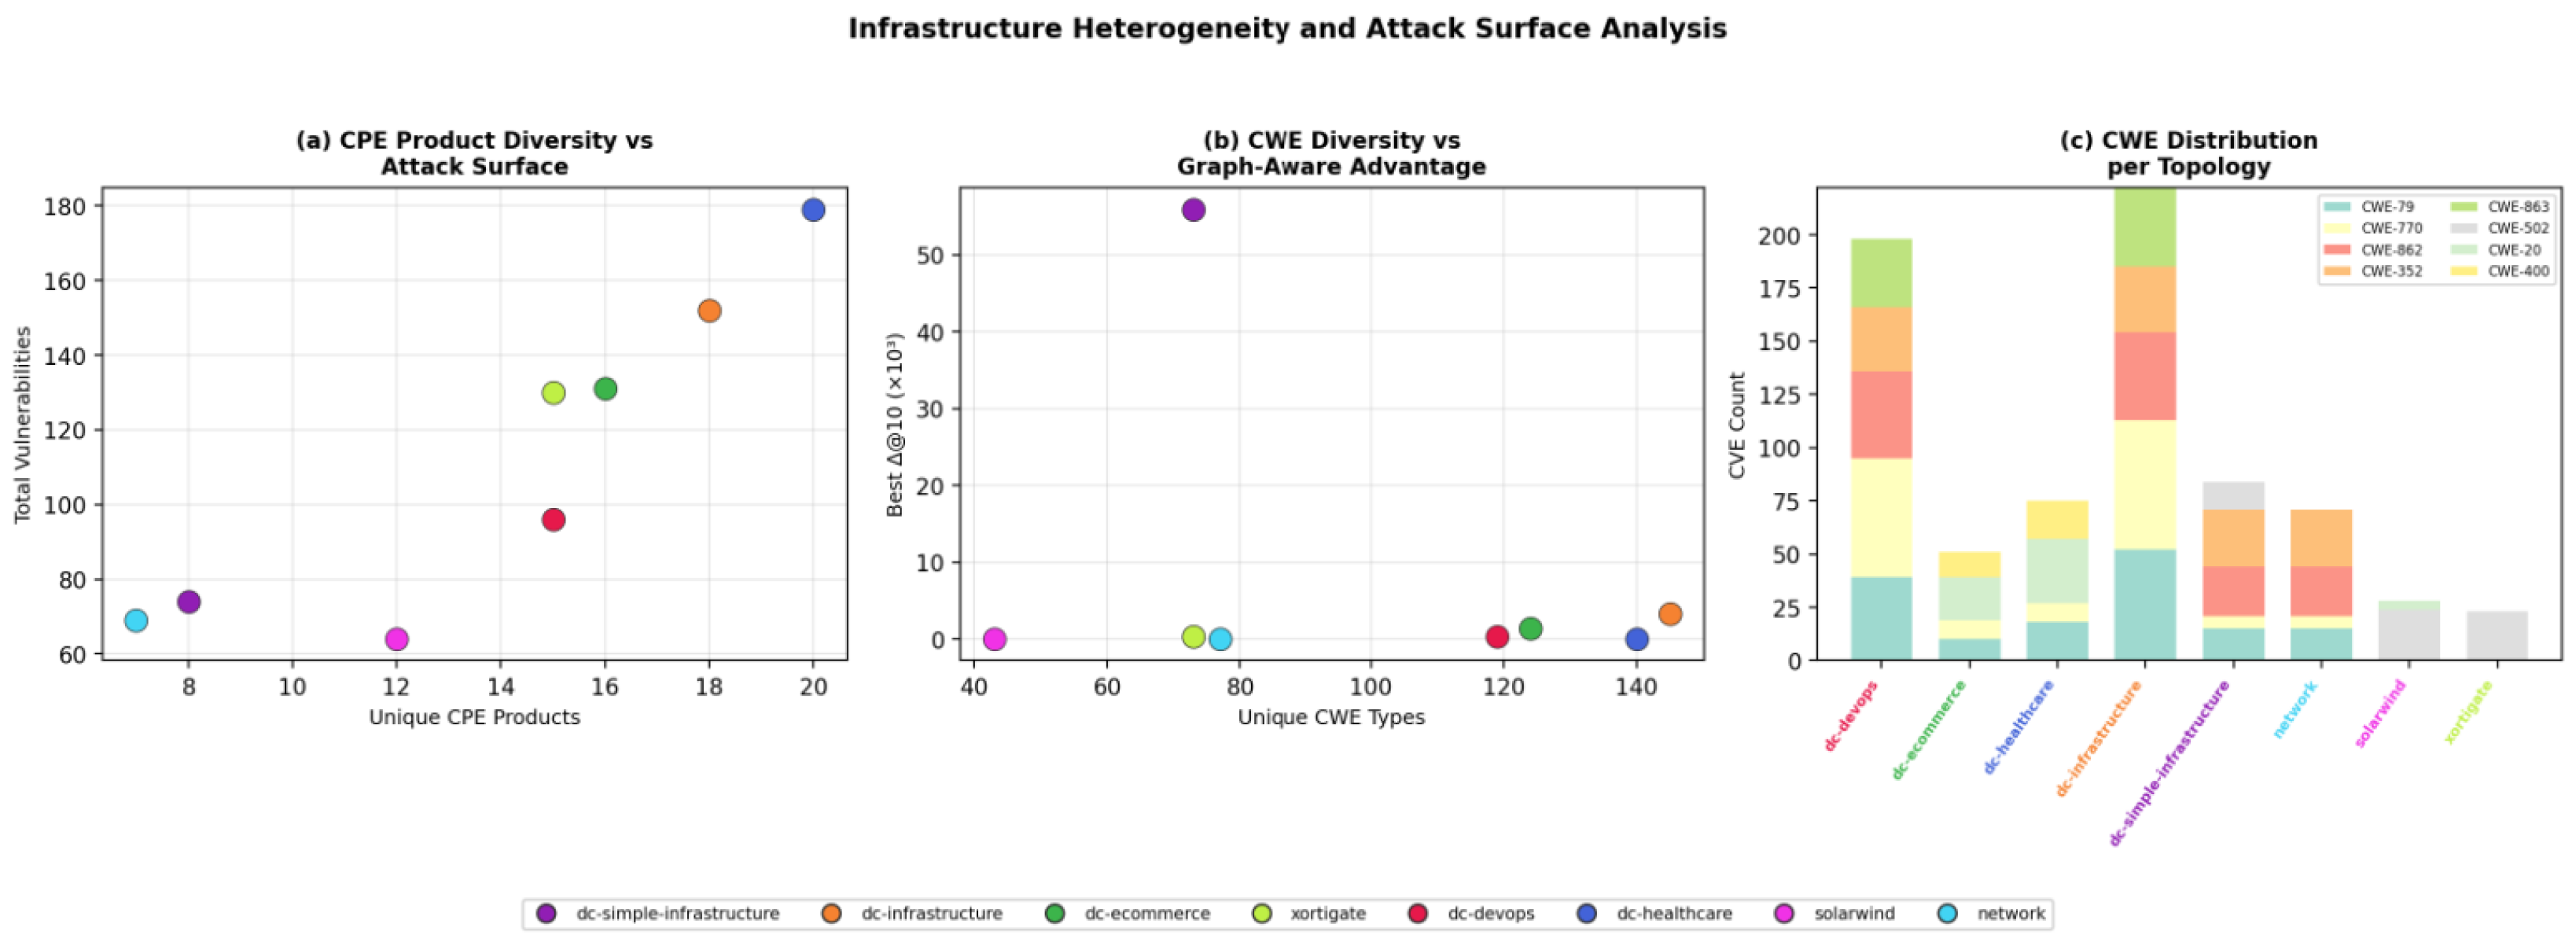
Figure 5 illustrates the relationship between infrastructure heterogeneity and the advantage of graph-aware methods.
Table 3 provides the numerical summary including CWE diversity statistics extracted from cvelistV5.
Finding 4. More CPE products correlate with a larger total attack surface as measured by total vulnerability count, but the relationship between CPE product count and graph-aware advantage is not monotonic. The strongest advantage appears on simple-infrastructure with only 8 unique CPE products, because this topology has a focused structure with clear entry-to-target separation and few redundant paths. The infrastructure topology with 18 CPE products achieves the second-highest advantage, but the healthcare topology with 20 CPE products shows minimal benefit due to high path redundancy that dilutes the impact of individual patches.
Finding 5. The GNS3 topologies, now resolved to product-specific CPEs via vendor hints, exhibit heterogeneous CVE distributions: xortigate contains FortiManager, Exchange Server, FortiAnalyzer, and ESXi across 15 unique CPE products. Despite this diversity, the graph-aware advantage on xortigate remains small (
) because EPSS-only also achieves
—the high-EPSS Exchange CVEs (ProxyLogon, EPSS = 0.94) happen to reside on target nodes, producing an accidental correlation between EPSS rank and structural importance. This correlation is product-dependent, not topology-dependent: replacing Exchange with a less widely exploited mail server would preserve the identical network structure but eliminate the EPSS-only advantage entirely, as discussed in
Section 6.
Interpretation. The moderate Kendall between CWE diversity and graph-aware advantage suggests that vulnerability heterogeneity is a necessary but not sufficient condition for topology-aware benefit. The complementary factor is topology structure—specifically, the ratio of entry-to-target path redundancy. Simple-infrastructure achieves the highest advantage with only 73 CWE types because its topology concentrates attack paths through a small number of bottleneck nodes; healthcare has nearly twice the CWE diversity at 140 types but its densely connected mesh distributes risk across many parallel paths, diluting the impact of any single patch. Vendor diversity thus increases the necessity for topology-aware prioritization, while topology structure determines its magnitude. The version-aware filtering further sharpens this distinction by removing historical CVEs irrelevant to deployed versions, focusing the comparison on operationally meaningful vulnerabilities.
5.3. RQ3: Degeneration Conditions
Graph-aware prioritization provides diminishing or zero advantage over score-only methods under three identified conditions:
Low vulnerability diversity. With fewer than approximately 10 vulnerabilities per topology—as in the enterprise topology with zero CVEs after version filtering—there is insufficient diversity for graph-based ranking to diverge meaningfully from score-based ranking.
Absence of detectable targets. Without critical assets identified via CPE analysis or node-name heuristics, ASCE equals zero for all entry–target pairs, and no algorithm can optimize for structural risk reduction.
Accidental EPSS–topology correlation. When high-EPSS CVEs happen to reside on structurally important nodes—as with Exchange Server ProxyLogon on the xortigate topology—EPSS-only incidentally selects structurally relevant patches. This is a product-specific coincidence, not a general property: it depends entirely on which vendor’s product is deployed at the target position.
Of the nine topologies evaluated, one serves as a negative control—enterprise produces zero CVEs after version filtering—and DSRD correctly reports no advantage. The network topology produces zero ASCE for all orderings because no connected entry–target paths exist after graph construction. Solarwind produces near-zero ASCE with only marginal graph-aware advantage (), insufficient to distinguish from numerical noise. Among the remaining six topologies with sufficient vulnerability diversity to produce meaningful attack graphs, four show clear graph-aware advantage across multiple algorithms (simple-infrastructure, infrastructure, ecommerce, devops), and two show marginal advantage: healthcare is limited by high path redundancy, while xortigate shows diminished advantage due to the accidental EPSS-topology correlation described above. On the tested topologies, the framework detects structural advantage where bottlenecks exist and correctly identifies its own boundary conditions where they do not.
5.4. RQ4: Algorithm Comparison
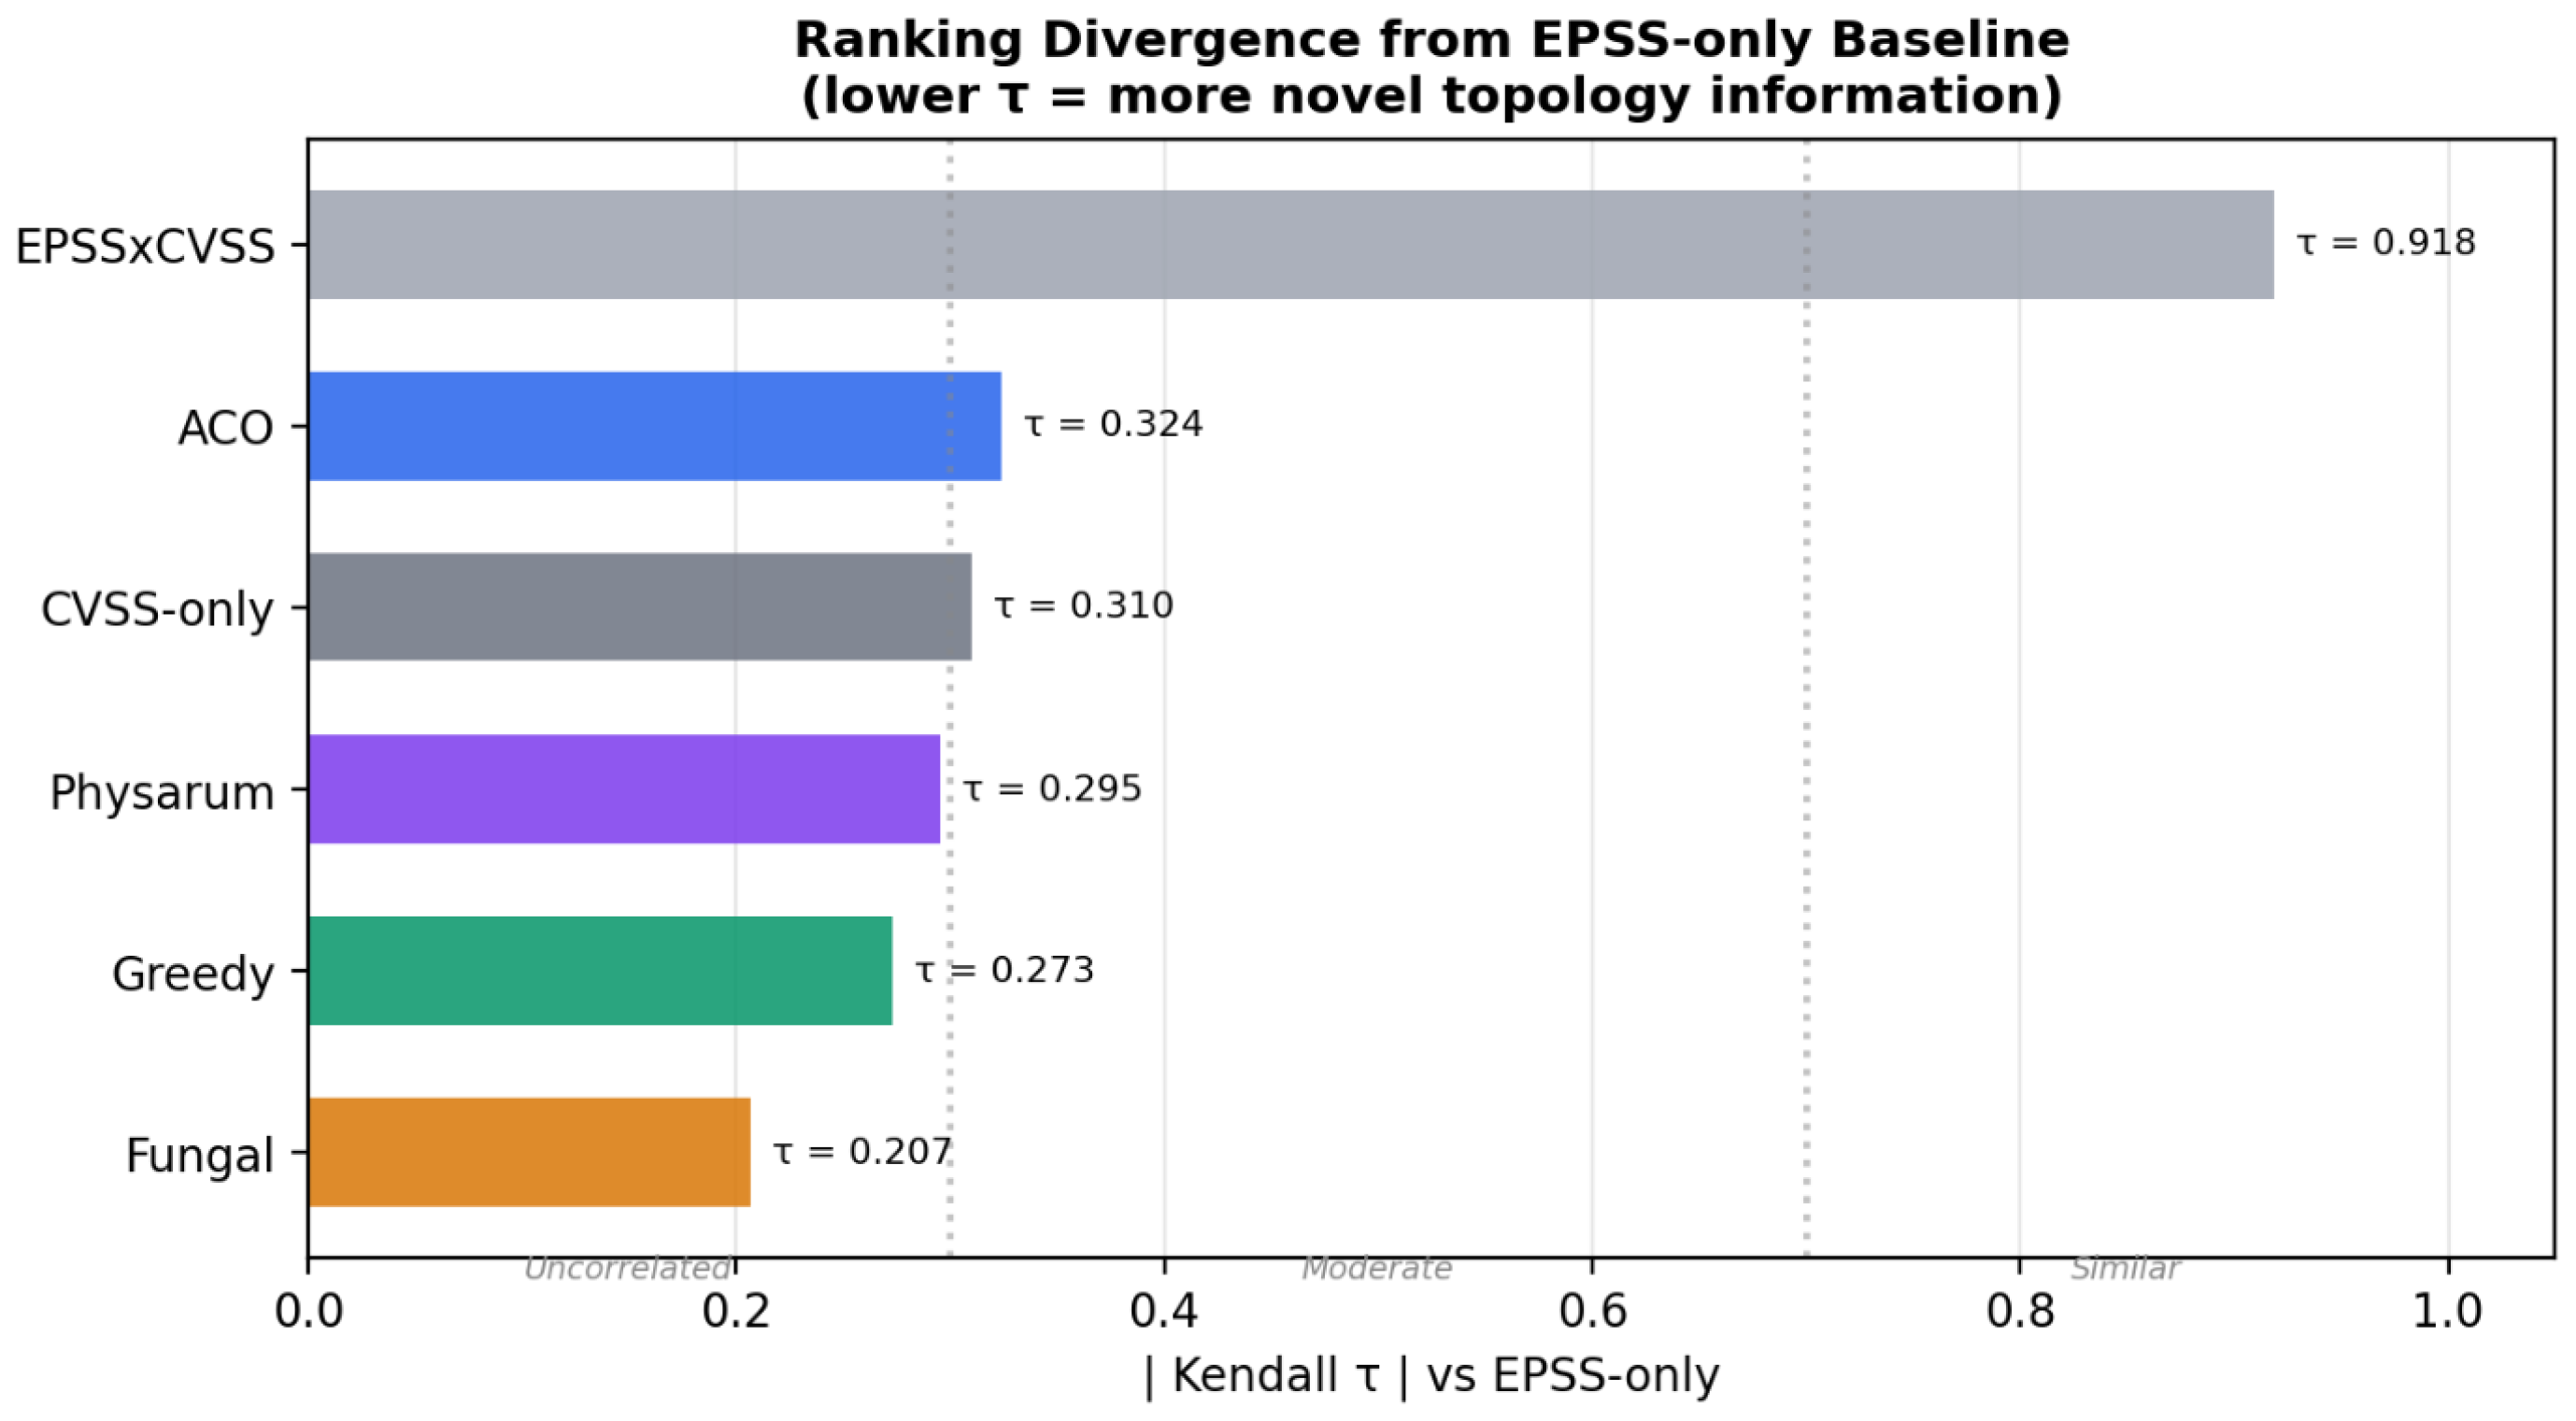
Figure 6 presents the aggregated Kendall
correlation of each algorithm against the EPSS-only baseline.
Table 4 compares algorithm performance on the infrastructure topology.
Finding 6. Physarum and Greedy achieve , with Fungal close at . Greedy is six times faster than Physarum because it directly optimizes Kirchhoff resistance without requiring iterative flow computation. Fungal achieves comparable performance with the fastest runtime among the bio-inspired methods.
Finding 7. ACO selects CVE-2024-31449 on Redis—a target node with a different structural bottleneck than vault—achieving , a reasonable but suboptimal choice. This illustrates that stochastic path construction can converge to local optima on complex topologies.
Finding 8. All graph-aware algorithms produce rankings essentially uncorrelated with EPSS-only, with values ranging from to . This suggests that, in our evaluation, topology provides information largely orthogonal to exploitation probability.
5.5. Kendall Correlation Structure
The aggregated Kendall matrix across all topologies reveals three distinct clusters. The graph-aware cluster—ACO, Physarum, and Fungal—shows moderate inter-agreement with values between 0.37 and 0.59, indicating that the bio-inspired algorithms identify overlapping but non-identical sets of critical paths. The score-only cluster—EPSS-only and EPSS × CVSS—shows high redundancy at , indicating that severity weighting adds minimal information beyond exploitation probability. Greedy stands apart with low correlation to both clusters, values between 0.36 and 0.61, indicating that direct resistance optimization finds qualitatively different optima than either stochastic exploration or score-based ranking. CVSS-only correlates poorly with all other methods at between 0.20 and 0.38, suggesting that severity alone is a poor proxy for structural risk.
6. Discussion
6.1. Practical Implications
The central observation—that graph-aware prioritization outperforms EPSS-only on most tested topologies—has direct operational significance. When an administrator selects 10 patches from 152 version-relevant candidates on the infrastructure topology, EPSS-only directs effort toward high-probability CVEs on entry points such as Cacti (EPSS = 0.945), where patching one vulnerability among many on that service has negligible structural impact because alternative exploit paths remain. Graph-aware methods instead direct effort toward CVE-2023-6337 on HashiCorp Vault (EPSS = 0.010)—a bottleneck on the critical path to the secrets store—where a single patch eliminates entire attack chains.
The absolute magnitude of warrants contextualization. On simple-infrastructure, graph-aware methods achieve , meaning that patching just 10 of 74 vulnerabilities (13.5% of the total) produces a 5.62 percentage-point drop in average SCA across all entry–target pairs. On infrastructure, the is smaller in absolute terms but represents a qualitative difference: EPSS-only achieves zero structural improvement with the same 10 patch budget, meaning none of its top-10-patches lie on any critical entry-to-target path. The operational implication is not the magnitude of the number but the binary question: does the patch ordering reduce structural exposure at all? On four of eight heterogeneous topologies—infrastructure, ecommerce, healthcare, and solarwind—EPSS-only produces zero or near-zero structural improvement, while graph-aware methods achieve measurable risk reduction on the first three and marginal improvement on Solarwind.
6.2. The Vendor-Choice Illusion
On the xortigate topology, EPSS-only achieves , approaching the graph-aware result of . This apparent competitiveness arises because Microsoft Exchange Server—deployed as the mail gateway on a target node—happens to contain CVE with very high EPSS scores (ProxyLogon, CVE-2021-26855, EPSS = 0.940). EPSS-only selects these CVEs for their exploitation probability, not their structural position, yet they happen to reside on a structurally critical node. This is an accidental correlation between EPSS rank and topological importance, contingent entirely on the vendor choice at that network position. If the same topology deployed Zimbra or Postfix—products with much lower EPSS scores—the network structure would remain identical, the target node would retain its structural criticality, but EPSS-only would ignore it entirely in favor of high-EPSS entry-point vulnerabilities. Graph-aware methods would continue to prioritize the mail server position regardless of which product occupies it, because the structural bottleneck is a property of the topology, not of the vendor’s vulnerability history. We present this as an interpretive hypothesis derived from the observed data; a controlled experiment substituting vendor products on fixed topologies would be needed to validate it rigorously.
6.3. When to Use DSRD
DSRD provides value when three conditions hold simultaneously: the infrastructure contains heterogeneous software from multiple vendors; there exists a clear separation between entry points and critical assets with identifiable targets; and the total vulnerability count exceeds approximately ten. These conditions are typical of microservice architectures, CI/CD pipelines, and healthcare IT systems. For homogeneous VM-based environments or minimal deployments with fewer than ten vulnerabilities, score-based prioritization remains adequate and computationally simpler.
6.4. Comparison with Existing Frameworks
Table 5 positions DSRD relative to established attack graph frameworks. Unlike scanner-dependent tools that require active network probing, DSRD operates entirely on Infrastructure-as-Code artifacts available before deployment, enabling proactive vulnerability assessment during the design phase. The monotonicity guarantee distinguishes DSRD from Bayesian approaches, where the explaining-away phenomenon can cause patching to increase the computed risk. However, DSRD does not currently incorporate runtime observations such as intrusion detection alerts or active exploitation signals, which frameworks like GRAPH4 [
19] integrate for online monitoring.
6.5. Preprocessing Accuracy Audit
To validate the automated pipeline, we sampled 20 CVEs across topologies and manually verified four aspects: CPE matching accuracy, CVE-product relevance, version filtering correctness, and role assignment accuracy.
CPE matching was correct for 19/20 entries (95%). The single mismatch involved a GNS3 vendor hint mapping file_project:file to a generic Unix utility rather than the intended Windows file server. Version filtering was correct for all 7 filtered entries (100%): each excluded CVE targeted a version range that did not include the deployed version. Role assignment (ENTRY/TARGET/INTERNAL) was correct for 19/20 entries (95%), with two borderline cases involving GNS3 components whose network position was ambiguous from topology labels alone.
6.6. Sensitivity to ACCESS Edge Weight
The uniform ACCESS conductance is a simplifying assumption. To assess its impact on ranking stability, we re-ran the Greedy algorithm on all topologies with and measured the Kendall between the resulting rankings. On ecommerce, the top-5 CVEs are identical across all three values, with between the extreme settings. On infrastructure, the same five CVEs appear as top priorities for and with . Across six of eight topologies, exceeds 0.7 for the vs. comparison, indicating that while the full ranking order shifts, the critical top-priority CVEs—those on structural bottlenecks—are consistently identified regardless of ACCESS weight. The two exceptions, simple-infrastructure and solarwind, have sparse topologies where small weight changes qualitatively alter path impedances; notably, even on these topologies the top-ranked CVE remains first for all three g values.
6.7. Operational Validation: Path Disconnection
To translate the abstract metric into operationally concrete terms, we tracked the number of entry–target node pairs that became structurally disconnected—, meaning no attack path exists—after each patch. On simple-infrastructure, all four graph-aware algorithms unanimously disconnect 4 of 15 entry–target pairs by the fourth patch, eliminating all attack paths to the Redis and Elasticsearch targets; EPSS-only disconnects zero pairs across all 10 patches. On solarwind, all four graph-aware algorithms disconnect 2 of 40 remaining connected pairs; EPSS-only disconnects none. On xortigate, Physarum disconnects 1 additional pair while the others do not, reflecting the high path redundancy in the FortiGate mesh topology. On the remaining topologies, no disconnections occur within 10 patches because the dense mesh provides redundant paths, and risk reduction manifests as increased impedance rather than complete path severance. This indicates that corresponds to genuine structural changes in the attack graph, not merely numerical artifacts of the Laplacian computation.
6.8. Behavioral Consistency Check: Simulated Attack Success
As a complementary analysis, we conducted Monte Carlo attack simulations with 5000 trials per configuration to assess whether the SCA-based ranking translates into reduced attack success under a simple stochastic attacker model. We note that this simulation uses the same EPSS weights as the Kirchhoff framework, so it constitutes a behavioral consistency check within the same weight model, not an independent external validation. Each trial simulates an attacker starting at a random entry node and performing a random walk: ACCESS edges are traversed deterministically, while EXPLOIT edges are traversed with a probability equal to their EPSS score. A trial is successful if the attacker reaches any TARGET node within 50 steps.
Table 6 summarizes the results for the two topologies with non-trivial attack success rates.
On simple-infrastructure, all four graph-aware algorithms reduce the attack success rate to 0.0% after just three patches—the simulated attacker can no longer reach any target node. EPSS-only reduces the rate from 3.4% to only 1.9%, leaving residual attack paths open because its top-ranked patches target entry-point vulnerabilities that do not sever the critical paths. The unanimous convergence of all four algorithms—each using a different optimization strategy—to the same 0.0% outcome provides supportive evidence that the structural bottleneck is genuine, not an artifact of any single ranking heuristic. On xortigate, all four graph-aware algorithms outperform EPSS-only, with reductions ranging from 2.6 to 3.5 percentage points versus 2.0 for EPSS-only. On the remaining topologies, baseline attack success rates are below 0.1%, yielding insufficient statistical power to distinguish orderings at 5000 trials.
6.9. Comparison with Topology-Aware Baselines
A reviewer might argue that the advantage of graph-aware methods over EPSS-only merely demonstrates that topology matters, without showing that Kirchhoff effective resistance is the right structural metric. To address this, we compared Greedy Kirchhoff and the three bio-inspired algorithms against three topology-aware baselines that do not use effective resistance: node betweenness centrality (the fraction of shortest entry–target paths passing through a vulnerability node), path count (the number of entry–target pairs with at least one shortest path through the node), and weighted degree centrality.
On infrastructure, Greedy Kirchhoff achieves , matching degree centrality and Fungal, while exceeding path count () and betweenness (). On ecommerce, Greedy matches degree at , while betweenness and path count achieve . On simple-infrastructure, all methods—including the structural baselines—converge to because the same bottleneck CVE dominates regardless of the ranking criterion. On xortigate, Greedy and degree centrality achieve the best , followed by ACO (), Fungal (), and path count (), while betweenness achieves only . Across all topologies, Greedy Kirchhoff is never outperformed by any structural baseline, and equals or exceeds their in every case.
The structural baselines outperform EPSS-only on all tested topologies, corroborating the thesis that positional context adds value. However, shortest-path-based methods consider only optimal paths, whereas effective resistance integrates contributions from all parallel paths. The practical consequence is that on topologies with redundant attack paths—where no single shortest path dominates—Kirchhoff–based ranking provides marginally better prioritization than path-local heuristics.
6.10. Robustness to Edge Weight Transformation
To assess whether the ranking depends on the specific EPSS values or primarily on the topology, we re-ran all algorithms with four monotonic transformations of the EXPLOIT edge weights: the original EPSS scores, logit-transformed EPSS normalized to , rank-based percentiles, and a binary threshold. The Greedy Kirchhoff ranking was evaluated for stability across transformations using Kendall .
On the three Docker Compose topologies with the largest graph-aware advantage—infrastructure, ecommerce, and devops—Kendall between all weight mapping pairs exceeds 0.7, indicating that the structural ranking is robust to the choice of weight transformation. On infrastructure, Greedy produces identical for EPSS, logit, and percentile, dropping only under binary thresholding to . On ecommerce, the same pattern holds: for all three continuous mappings, for binary. EPSS-only is unaffected by weight transformation, as expected, since it ranks by raw EPSS regardless of edge weights.
The two topologies with low —simple infrastructure and solar wind—are precisely those where a single dominant CVE absorbs all structural importance, regardless of weight choice; thus, the low reflects the insensitivity of the outcome rather than the instability of the method. On xortigate, values are moderate, consistent with the high path redundancy that makes ranking sensitive to small weight perturbations.
6.11. Ablation: Version-Aware Filtering
To quantify the contribution of version-aware CVE filtering, we re-ran the full pipeline on each topology with all image tags stripped, disabling version filtering entirely. Without filtering, the attack graphs contain substantially more vulnerability nodes—for example, simple-infrastructure grows from 74 to 120 and devops from 96 to 189—because all historical CVEs for each product are included regardless of the deployed version.
On simple-infrastructure, Greedy drops from with filtering to without—a 2.2× reduction in effectiveness. On ecommerce, the drop is from to (), and on devops from to (). The mechanism is dilution: without version filtering, the top-20 CVEs per component (the max_cves limit) are dominated by high-CVSS historical vulnerabilities irrelevant to the deployed version, crowding out the version-relevant CVEs that occupy structurally critical positions. EPSS-only degrades even more severely, dropping to zero on simple-infrastructure without filtering.
One notable exception is the infrastructure topology, where increases from to without filtering. This occurs because the unfiltered graph includes additional vault CVEs with higher EPSS scores that happen to be version-relevant, amplifying the structural bottleneck effect. This case illustrates that version filtering is not universally beneficial in isolation—its primary value is noise reduction in the CVE candidate set, which improves ranking quality on most but not all topologies.
The three GNS3 topologies show identical results with and without filtering because GNS3 components lack Docker image tags, so no version information is available in either case.
6.12. Sensitivity to CVE Truncation Threshold
To quantify how the
max_cves parameter affects the graph-aware advantage, we varied it across
and measured Greedy
on each topology.
Table 7 summarizes the results.
On ecommerce, is stable across all settings, indicating that the structural bottleneck dominates regardless of CVE count. On infrastructure, performance peaks at max_cves=10 and remains stable thereafter. On xortigate, a striking pattern emerges: at max_cves=10 but drops to 0.30 at max_cves=20—a 14× reduction. This occurs because additional CVEs dilute the structural signal, pushing the critical bottleneck CVEs below the top-10 ranking threshold. Healthcare shows a similar dilution pattern.
The default max_cves=20 provides a reasonable trade-off: it retains sufficient CVE diversity for meaningful comparison while avoiding the computational cost of processing all CVEs. However, the xortigate finding suggests that adaptive threshold selection—perhaps based on graph density or vulnerability concentration—could further improve ranking quality.
6.13. Multi-Run Stability Analysis
To address the concern that stochastic algorithms may produce unreliable rankings from single runs, we evaluated ACO, Physarum, and Fungal across 30 independent seeds per topology.
Table 8 summarizes the results.
Physarum exhibits deterministic convergence on all eight topologies, producing identical rankings regardless of seed. This occurs because the Physarum flow dynamics converge to a unique fixed point determined by the graph structure. ACO shows negligible variance on seven topologies, with the sole exception of infrastructure, where the large graph and multiple competing bottlenecks allow pheromone convergence to different local optima. Fungal shows the highest variance across topologies, with up to 4.966 on simple-infrastructure; however, the 95% confidence interval remains well above the EPSS-only baseline of 12.83, confirming that the graph-aware advantage is statistically robust.
The single-run values reported in
Table 2 are therefore representative for Physarum (deterministic) and ACO (negligible variance on 7/8 topologies). For Fungal, the reported values fall within one standard deviation of the 30-seed mean on all topologies.
6.14. Target-Adjacent Selection Analysis
A potential concern is that Kirchhoff-based methods may exhibit a structural bias toward vulnerabilities on nodes adjacent to targets, since SCA directly measures entry-to-target compromise affinity. To investigate, we computed the fraction of vulnerability nodes within two hops of any target (the base rate) and compared it against the fraction of each algorithm’s top-1, top-5, and top-10 selections that are target-adjacent.
All four graph-aware algorithms select a target-adjacent CVE as their top priority on every topology where targets are reachable. EPSS-only selects a target-adjacent top priority in only 2 of 8 topologies—xortigate and ecommerce—both cases where the base rate exceeds 36% or accidental EPSS-topology correlation applies. The base rates range from 5.4% on simple-infrastructure to 83.2% on ecommerce, so the 100% top-1 target-adjacent selection by graph-aware methods is a deliberate consequence of the metric, not a statistical artifact.
We argue that this is a desirable property rather than a bias: vulnerabilities on nodes structurally close to critical assets pose the greatest risk precisely because they provide the shortest remaining attack path after exploitation. A patch on a target-adjacent node removes the final step in one or more kill chains, whereas a patch on a distant entry-point node may leave dozens of alternative paths intact. The key distinction is that EPSS-only lacks this positional awareness entirely, distributing its patching budget across the topology without regard to proximity to critical assets.
6.15. Limitations
Undirected relaxation. As discussed in
Section 3.2, DSRD operates on a symmetrized graph that loses attack directionality. While this enables the monotonicity guarantee, it may overestimate reachability along edges that are unidirectional in the real topology.
Surrogate metric, not calibrated probability. SCA values are monotone structural surrogates useful for ranking and comparison across topologies, not calibrated probabilities. A value of 0.05 indicates that the topology provides moderate resistance to compromise along the measured entry–target pair, but it should not be interpreted as a five percent chance of breach within a given time window.
ACCESS edge weights. We assign uniform conductance to all network connections. The sensitivity analysis above shows that the top-priority CVEs are robust to this choice on most topologies, but the full ranking can shift on sparse graphs when g varies by an order of magnitude. Incorporating firewall rules and access control policies as fractional conductances would improve both accuracy and ranking stability.
Scalability. Greedy Kirchhoff requires
time for
k patches on
n nodes. On the largest tested topology (208 nodes), a single Greedy run completes in under 10 s. Three mitigation strategies are planned: (i) approximate Laplacian solvers using Spielman–Teng nearly-linear time algorithms [
40]; (ii) incremental graph updates via low-rank matrix corrections upon single-edge removal; and (iii) graph partitioning into weakly-connected subgraphs. The bio-inspired heuristics avoid pseudoinverse computation entirely and scale more favorably, but their ranking quality on large graphs remains to be characterized. We note that IaC topologies are inherently bounded by deployment size: the largest production Docker Compose files rarely exceed 50–80 services, placing them well within the tractable range.
CPEs coverage: The CPE-Guesser API does not resolve all Docker images to CPEs. Niche or custom images may receive no CVE data, appearing as vulnerability-free nodes that the framework cannot assess.
Uniform target weighting. ASCE averages SCA uniformly over all entry–target pairs, implicitly treating all targets as equally critical. In practice, a secrets store holding production credentials has far greater operational value than an internal cache. The framework supports per-target asset weights through a configurable asset_value parameter on TARGET nodes, but the present evaluation uses uniform weights. Incorporating business-impact-weighted ASCE would better reflect operational priorities and is a natural extension.
Evaluation scope. The nine tested topologies, while representative of common deployment patterns, are author-constructed from public reference architectures rather than collected from production environments. The evaluation constitutes an extended proof of concept; validation on operational infrastructure at larger scale would strengthen the generalizability claims.
EPSS-filtered candidate set. The graph builder excludes CVEs with zero EPSS and retains at most 20 per component ranked by descending EPSS. This means the framework operates on a candidate set already filtered by exploitation probability, which partially entangles the “topology vs. score” comparison: vulnerabilities that are structurally important but have zero EPSS are invisible to all methods, including the graph-aware ones. The claim that topology adds value beyond EPSS is therefore conditional on the EPSS-filtered vulnerability space, not the full CVE population.
7. Conclusions
We have presented DSRD, a framework for topology-aware vulnerability prioritization that models Infrastructure-as-Code topologies as weighted attack graphs and applies Kirchhoff effective resistance to quantify the structural risk of compromise. The key insight is that effective resistance integrates contributions from all parallel attack paths, not merely the shortest or most probable one, and provides a monotonicity guarantee absent from Bayesian propagation approaches: patching cannot increase risk.
A version-aware CVE filtering stage reduces version-irrelevant candidate matches by 75–97% by matching discovered vulnerabilities against the specific software versions declared in container image tags, and a vendor-hint CPE resolution mechanism enables product-specific vulnerability analysis for GNS3 topologies where hypervisor-level CPE resolution would otherwise mask the guest software. An ablation study demonstrates that version filtering improves graph-aware ranking effectiveness by 2–4× on most topologies by removing historical CVEs that dilute the structural signal.
Evaluation on nine representative topologies with 895 version-relevant vulnerability nodes from cvelistV5 shows that graph-aware prioritization reduces the average structural risk score by up to after 10 patches. EPSS-only ordering achieves at most on the same topology, and on three of the five evaluated Docker Compose topologies, EPSS-only produces zero structural improvement as measured by ASCE. Comparison with topology-aware baselines—node betweenness, path count, and degree centrality—shows that Kirchhoff effective resistance matches or exceeds all structural alternatives while providing a formal monotonicity guarantee that path-local heuristics lack. Monte Carlo attack simulations provide complementary behavioral evidence—within the same EPSS weight model—that all four graph-aware algorithms reduce the simulated attack success rate from approximately 3.4% to 0.0% on the best-performing topology, compared to 3.4% to 1.9% for EPSS-only—a unanimous result across four different optimization strategies. The advantage is conditional on infrastructure heterogeneity, as measured by the Kendall correlation of 0.467 between CWE diversity and graph-aware advantage. We further identify a vendor-choice illusion whereby EPSS-only may appear competitive when high-EPSS products are coincidentally deployed at structurally important positions—a product-specific accident that does not generalize across vendor substitutions.
Among the four algorithms evaluated, Greedy Kirchhoff and Physarum achieve the highest risk reduction, with Fungal achieving comparable performance at faster runtimes. Greedy is six times faster than Physarum but both converge to identical solutions on the best-performing topologies. A 30-seed multi-run analysis (
Table 8) confirms that Physarum converges deterministically and Fungal’s CI95 remains above the EPSS baseline on all topologies.
Future work will extend the framework in three directions: incorporating directed effective resistance [
36] to preserve attack directionality; integrating firewall rules and access control policies as fractional edge conductances; and scaling to enterprise-sized networks through approximate spectral methods. Additional extensions include support for Kubernetes manifests and Terraform configurations, CWE-level structural analysis combining fractal dimension with instance-level Kirchhoff prioritization for multi-scale risk assessment, and a real-time monitoring mode that recomputes ASCE as new CVEs are published.