


Abstract
Quantitative assessment of information security in 5G telecommunications infrastructure is difficult because individual security metrics are heterogeneous and rarely interpreted together. Conventional multi-criteria decision-making (MCDM) applications rank alternatives by compensatory aggregation, so a violated metric can be offset by others. This study proposes a standard-traceable method in which MCDM only weights the metrics, while measured values are evaluated against tolerable values by a non-compensatory exceedance indicator and a three-level status rule. Twenty-four metrics were derived from ISO/IEC 27011:2024 controls through the ISO/IEC 27004 measurement chain and grouped into three domains. The analytic hierarchy process (AHP) weighted three quality criteria of a metric (significance 62.6%, correctness 28.9%, measurability 8.5%), and the weighted aggregated sum product assessment (WASPAS) method used them to derive the metric weights, cross-checked by the fuzzy technique for order of preference by similarity to ideal solution (Fuzzy TOPSIS). Validation combined synthetic deterioration scenarios, Monte Carlo analysis and comparison with alternative MCDM methods. In three 12-month scenarios, the exceedance indicator flagged each violation in the month it occurred, whereas compensatory aggregation lagged by three to six months or did not react. The domain status remained stable in 85.3–100% of Monte Carlo draws under perturbed tolerable values and measurements. Compared with conventional MCDM-based aggregation, the advantage lies in traceable metric selection, normalization against tolerable values and the non-compensatory status rule.
1. Introduction
The number of 5G network subscriptions worldwide exceeded 3.1 billion by the end of the first quarter of 2026 and is projected to reach 6.4 billion by 2031 [1]. 5G infrastructure is operated by multiple stakeholders, including service providers, network operators, virtualization infrastructure providers and data center providers, whose assets require differentiated security strategies. The virtualization of the 5G core through software-defined networking (SDN) and network function virtualization (NFV) improves network elasticity but introduces new and complex threats [2].
A similar escalation of threats is observed across industries: an analysis of 9261 cyber-related news publications (October 2023–December 2024) showed that the IT and telecommunications sector was the most frequently targeted (4762 entries) and accounted for the largest share of zero-day exploits (1150 cases) [3]. At the same time, social engineering remained a persistent threat regardless of industry, recorded 1397 times over the observation period [3].
In 5G, these risks are amplified by network slicing, which allows independent virtual networks of different tenants to operate over shared physical infrastructure. SDN and NFV expand the attack surface, and threats such as denial of service, API exploitation and configuration tampering are amplified in virtualized multi-tenant environments [4]. A malicious tenant may exploit vulnerabilities to compromise others, and the compromise of a shared component, such as a hypervisor or a physical host, can disrupt all slices that depend on it [4]. These risks are not merely theoretical: a vulnerability disclosed in the 5G core slicing design was shown to enable cross-slice data access, denial of service and unauthorized access to the data of other enterprise customers [5].
To mitigate these risks, 3GPP specifications define a common security architecture for the 5G system [6], which includes the service-based architecture of the 5G core, user-plane integrity protection, unified access control, and the isolation of critical traffic through dedicated network slices [7]. However, the continuous integration of new device classes and services keeps expanding the attack surface; for example, compromised devices may be used to exhaust shared network resources and degrade services for other users [7].
Existing threat assessments for 5G, however, remain largely qualitative. ENISA characterizes its own vulnerability analysis as specification-based and hypothetical and calls for risk assessments of specific parts of the 5G infrastructure [2], while recent attack taxonomies for 5G network slicing are explicitly positioned as a basis for future risk assessment models rather than as quantitative evaluation tools [4]. Quantitative technical security metrics have been adapted to 5G, but the layered nature and multi-ownership of the infrastructure limit the information that a single stakeholder can collect about assets it does not own [8], and static, compliance-oriented assessments are insufficient for networks in which multiple parties are involved in service delivery [9]. As a result, an organization cannot rely solely on technical measurements of shared infrastructure; it must also demonstrate, in a measurable way, that its own security management processes are effective.
This requirement is increasingly formalized by regulation. The NIS2 Directive applies to providers of public electronic communications networks and services, requiring relevant entities to establish policies and procedures for assessing the effectiveness of cybersecurity risk-management measures [10]. In parallel, the proposed revision of the EU Cybersecurity Act seeks to make key measures of the previously voluntary EU 5G Security Toolbox mandatory [11]. At the organizational level, ISO/IEC 27001 requires organizations to evaluate the information security performance and the effectiveness of their information security management system (ISMS) [12], ISO/IEC 27011 adapts its controls to the specific needs of telecommunications organizations [13], and ISO/IEC 27004 provides guidance on monitoring and measurement [14]. However, classical information security metrics are typically single-variable, which makes comprehensive assessment time-consuming, and in practice security decisions are often based on expert opinion. Similar limitations of individual indicators have been observed at the network layer of 5G, where single quality-of-service (QoS) parameters are only weakly associated with handover events, whereas models combining multiple interacting network conditions perform substantially better [15]. Aggregating metrics with multi-criteria decision-making (MCDM) methods has been shown to make the assessment faster and more interpretable but has so far been applied only to a limited number of ISO/IEC 27001 domains [16].
Taken together, this evidence shows that the quantitative and reproducible assessment of telecommunications infrastructure security is increasingly required not only by network operators themselves but also by regulators [10,11]. This motivates the aggregated security metrics for 5G infrastructure proposed in this work.
As the review in Section 2 shows, existing MCDM applications in information security cannot be transferred to this problem directly, for three reasons. First, they rank external alternatives, such as investment options, platforms or risks, whereas a security indicator must report the state of a domain against a reference level accepted by the organization. Second, most of them aggregate criteria compensatorily, so that a severe deficiency in one criterion can be offset by good performance in others; in security monitoring, such offsetting hides exactly the violations that require action. Third, expert-derived weights carry uncertainty that is rarely propagated to the final decision, although established techniques for representing and propagating it are available. The method proposed here addresses these three gaps: it links each metric to a tolerable value, adds a non-compensatory exceedance indicator with an explicit status rule, and quantifies how uncertainty in weights, thresholds and measurements affects the status of each domain.
This study aims to develop aggregated information security metrics for 5G telecommunications infrastructure based on the security controls of ISO/IEC 27011:2024, expert assessment and the AHP, WASPAS and Fuzzy TOPSIS methods, and to equip them with a decision rule that prevents a violation of one metric from being masked by the others.
The main contributions of our study are as follows:
- We provide a comparative analysis of existing approaches to security measurement in 5G networks, ISMS effectiveness assessment and MCDM applications in information security, and identify the absence of aggregated security metrics for 5G telecommunications infrastructure.
- We define a set of classical security metrics for 5G networks mapped to the controls of ISO/IEC 27011:2024 and grouped into three domains, namely Network and Data Transmission Security, Operational Security, and Infrastructure and Access Security, and select the most important metrics in each domain based on a two-round expert assessment.
- We adapt the methodology of aggregated information security metrics [16] to 5G networks: criteria weights are obtained by AHP, metric weights by WASPAS and cross-checked by Fuzzy TOPSIS, with robustness tested against four alternative MCDM methods, and metric directions are harmonized so that all ratios to tolerable values increase as security deteriorates.
- We introduce a non-compensatory exceedance indicator and a three-level status rule (acceptable, attention, corrective action) that prevent a violation of a single metric from being masked by the remaining metrics of the domain.
- We evaluate the indicators on an illustrative reporting period and on three synthetic 12-month deterioration scenarios, and assess their robustness to criteria weights, expert composition, normalization, MCDM method, metric selection, tolerable values and measurement error.
The remainder of this paper is organized as follows. Section 2 reviews related work and identifies the research gap addressed in this study. Section 3 describes the materials and methods, including the conceptual framework, the classical security metrics for 5G networks, the quality criteria of security metrics, the expert assessment procedure and the MCDM methods used to construct the aggregated metrics, and the non-compensatory status rule. Section 4 presents the results of the expert assessment, the weighting coefficients of the classical metrics, the aggregated security metrics, the sensitivity and robustness analyses, and the scenario-based evaluation. Section 5 discusses the results, their practical implications and the limitations of the study. Finally, Section 6 concludes the paper and outlines directions for future research.
2. Related Work
2.1. ISMS Effectiveness and Its Measurement
Research on ISO/IEC 27001 was systematized in [17], which reviewed fifteen years of studies and structured the field into five research foci: relations with other standards, adoption motivations, implementation issues, outcomes and contextual factors. The review shows that research has concentrated on certification decisions and organizational outcomes, whereas the quantitative measurement of security management across the domains of the standard has received little attention.
At the governance level, the study in [18] shows that implementing security processes alone does not guarantee security unless these processes are embedded in a unified governance system. The authors identify five recurring governance deficiencies (strategy and goals, standardized processes, enforcement and accountability, high-level supervision, and resources) and propose a cybersecurity management model; however, the model remains conceptual and does not include an instrument for measuring the resulting level of security.
A quantitative alternative for critical infrastructure is presented in [19], where expert evaluations are processed with the analytic hierarchy process over pairwise comparisons of confidentiality, integrity, availability and observability to obtain a quantitative security-level criterion. Verified on a national confidential communication system, the model demonstrates that expert-based quantitative assessment is feasible with limited statistical data, but it is tied to national regulatory protection profiles rather than to the management domains of ISO/IEC 27001.
Empirical evidence on measurement practice is provided in [20], where ISMS effectiveness measurement was analyzed through interviews with eight organizations of varying size and sector. Key performance indicators were grouped into governance, risk and incident response, and the results revealed a wide maturity spectrum: organizations with a strong ISMS use automated, proactive metrics, whereas those with a weaker ISMS rely on ad hoc manual audits. Based on these findings, the authors propose an analysis framework for evaluating ISMS effectiveness, which confirms the practical demand for quantifiable, ISO-aligned metrics. The authors further note that existing measurement approaches are largely aligned with ISO/IEC 27001 and the measurement guidance of ISO/IEC 27004:2016, applying indicators such as access-control effectiveness, policy compliance and mean time to recover [20].
2.2. Regulatory Context of Telecommunications Security
The study in [21] examines the maintenance of critical telecommunications infrastructure under the NIS2 Directive, analyzing the technical, operational and organizational challenges imposed by its broader requirements and proposing a conceptual compliance framework. The work, however, does not address how the effectiveness of compliance should be measured. Barriers to NIS2 compliance are modeled quantitatively in [22] using the DEMATEL method: of fourteen expert-validated barriers, lack of awareness and the evolving threat landscape emerge as the main driving factors, while inadequate risk assessment and high reporting costs appear as dependent outcomes. Although methodologically close to the present work in its expert-driven multi-criteria treatment, the study models barriers to compliance rather than the level of security management.
2.3. MCDM Methods in Information Security
A systematic review of MCDM methods applied to information security risk assessment [23] classifies the techniques into multi-attribute utility, outranking, compromise and other methods, documents a growing trend towards hybrid models, and calls for new hybrids that integrate risk-assessment elements into MCDM techniques. In enterprise decision-making, an integrated AHP–TOPSIS framework has been proposed for cybersecurity investment decisions [24], illustrating the widespread use of this pairing for prioritization under conflicting criteria. A recent extension is the fuzzy framework in [25], which combines Fuzzy AHP, Fuzzy TOPSIS, Fuzzy VIKOR and Fuzzy COPRAS through a consensus mechanism to select cybersecurity platforms under PESTEL criteria, showing that agreement across complementary methods yields reproducible decisions under expert uncertainty. Unlike these frameworks, which rank external alternatives, the present work measures the state of information security management itself.
These frameworks also illustrate the methodological limitations of current MCDM practice in information security. Hybrid models, which combine a weighting method with a ranking method, such as AHP with TOPSIS [24] or fuzzy AHP with several fuzzy ranking methods [25], are increasingly common [23], but the choice of the combination is rarely justified, although different combinations can produce different rankings. Fuzzy extensions represent the vagueness of linguistic judgments, but the fuzzy intervals widen when experts disagree, which compresses the differences between alternatives, as observed for Fuzzy TOPSIS in [16]. Criteria weights are usually derived from the pairwise judgments of a small expert panel, although the choice of weights is one of the most influential and debated steps in the construction of composite indicators [26]. Finally, rankings are validated mainly by their agreement across methods [25] or by rank correlation between two methods [16]; such agreement shows that the methods are consistent with each other, but not that the result is robust to the uncertainty of the weights and inputs, which requires an uncertainty and sensitivity analysis [27].
Expert-based MCDM models are subject to two sources of uncertainty. The first is the vagueness of individual expert judgments, which fuzzy MCDM methods represent by fuzzy numbers [25]. The second is the uncertainty of the construction choices and inputs of the model itself, including the weights, the normalization, the aggregation rule and the input data; for composite indicators, it is assessed by uncertainty and sensitivity analysis, in which these inputs are varied, for example by Monte Carlo simulation, and the stability of the result is examined [26,27]. The dependence of the weights on the particular experts consulted can be assessed by resampling the expert panel, for example by the bootstrap [28]. In the information security applications reviewed above, uncertainty is handled mainly through consistency checks or fuzzy numbers, whereas the robustness of the final decision to construction choices and inputs is rarely examined. The present study addresses both sources by combining a fuzzy representation of expert judgments with resampling of the expert panel and Monte Carlo variation in tolerable values and measurements.
2.4. Quantitative Security Assessment in 5G Networks
Few studies propose quantitative security measures designed for 5G. Zhao et al. [8] argue that conventional IT security metrics do not capture the layered structure and multi-ownership of 5G and propose a modular computation of security metrics, in which cross-layer projection allows layers owned by different stakeholders to share the information needed for metric computation; the approach is evaluated through simulation. Abdelrazek et al. [9] model the security lifecycle of each network function as a state machine and combine three metrics (attack-surface exposure, impact of vulnerabilities and effectiveness of applied security controls) into a security score that can be computed per node or aggregated over security domains or the whole network; the methodology is illustrated with practical examples. At the product level, 3GPP security assurance specifications define test requirements for network equipment [29], and the security challenges of 5G architectures have been systematized in [30]; neither provides an indicator of the operational security state. These frameworks measure the technical exposure of network functions. They do not link measurements to ISMS controls or tolerable values, and they do not address how individual measurements should be weighted or how a violation should be detected at the domain level.
2.5. Prior Work
The present work extends our previous study [16], in which classical single-variable security metrics were combined into aggregated multicriteria metrics using weighting coefficients derived from expert judgment with three MCDM methods (AHP, WASPAS and Fuzzy TOPSIS) across three ISO/IEC 27001 management domains. A verification experiment showed that aggregated metrics provide a faster and more intelligible assessment than classical ones. The present paper extends this methodology to the telecommunications sector.
A comparative summary of these studies, together with the identified research gap, is presented in Table 1.
Table 1.
Related work and identified research gaps.
As Table 1 illustrates, the reviewed literature falls into two separate strands: conceptual or expert-driven approaches to information security governance and measurement [17,18,19,20,21], and MCDM-based methods applied to compliance barriers [22], information security risk assessment [23], or the selection of external alternatives such as investment options or security platforms [24,25]. Empirical evidence further shows that organizations typically measure ISMS effectiveness through separate indicators rather than as an integrated system, and that measurement practices vary considerably across organizations and sectors [20]. However, none of the reviewed studies constructs aggregated information security metrics for 5G telecommunications infrastructure. The studies on 5G security measurement [8,9] propose individual technical metrics but do not combine them into domain-level indicators, while the methodology of aggregated metrics proposed in [16] has been applied only to the management domains of ISO/IEC 27001 and has not been adapted to the telecommunications sector. In particular, the use of the telecommunications-specific controls of ISO/IEC 27011 together with the measurement principles of ISO/IEC 27004 as a basis for selecting, weighting and aggregating security metrics for 5G networks remains unexplored.
The present study addresses this gap by adapting the methodology of aggregated metrics [16] to 5G telecommunications infrastructure. Classical security metrics are mapped to the controls of ISO/IEC 27011 and grouped into three 5G-oriented security domains, and their weighting coefficients are determined using the AHP, WASPAS and Fuzzy TOPSIS methods based on expert assessment. The resulting aggregated metrics, whose tolerable values are linked to service level agreements and security objectives, are intended to provide telecom operators and security managers with a quantitative instrument for monitoring the security state of each domain. Such an instrument can also support the assessment of the effectiveness of cybersecurity risk-management measures required by the NIS2 Directive [10].
Table 2 compares the methodological properties of the quantitative frameworks discussed above with those of the present study. The MCDM frameworks [19,22,24,25] rank or classify external alternatives rather than report the state of a system against a reference level.
Table 2.
Methodological comparison of quantitative security assessment frameworks.
Except for the causal analysis in [22], they aggregate the criteria compensatorily, so that a deficiency in one criterion can be offset by the others [26]. They treat uncertainty, if at all, through consistency checks or fuzzy numbers, without examining how uncertainty in weights and inputs affects the final decision [27]. The 5G frameworks [8,9] compute technical scores without expert weighting. None of them combines standard-traceable metrics, tolerable values, a non-compensatory decision rule and an explicit analysis of how uncertainty affects the final decision.
3. Materials and Methods
This section presents the methodology of the proposed approach for assessing information security in 5G telecommunications infrastructure. It introduces the conceptual framework, compares the relevant ISO/IEC standards, and defines the proposed 5G security domains. Classical security metrics are then selected and classified, evaluated using expert-defined quality criteria, and ranked and weighted using MCDM methods. Finally, the selected metrics are combined to construct aggregated security metrics for each security domain.
3.1. Conceptual Framework
Figure 1 presents the overall architecture of the proposed framework for assessing information security in 5G telecommunications infrastructure using aggregated security metrics.
Figure 1.
MCDM-based aggregation approach for 5G Network Infrastructure.
The framework extends the multicriteria aggregation approach introduced in our previous study [16], where classical information security metrics were evaluated and combined using AHP, WASPAS, and Fuzzy TOPSIS. In that study, the AHP method was used to determine the weights of the metric quality criteria, while WASPAS was subsequently applied to rank the classical security metrics; Fuzzy TOPSIS provided an alternative evaluation path based on linguistic expert assessments. The present framework retains this MCDM-based aggregation principle but adapts and extends it to the security assessment of 5G telecommunications infrastructure.
The first layer of the framework establishes the standards-based foundation of the assessment. ISO/IEC 27001:2022 provides the general ISMS requirements and security controls, while ISO/IEC 27011 provides telecommunications-specific guidance for the implementation of information security controls. ISO/IEC 27004 provides the measurement perspective required for monitoring, measurement, analysis, and evaluation of information security. Accordingly, the proposed framework does not replace the control structure defined by the standards; instead, it introduces a measurement and aggregation layer for translating security-related observations from 5G infrastructure into quantitative security indicators.
The second layer defines the 5G infrastructure as the object of measurement. The considered infrastructure comprises User Equipment (UE), the Radio Access Network (RAN/gNB), the transport network, including fronthaul, midhaul, and backhaul, 5G Core functions, Edge/Cloud infrastructure, including multi-access edge computing (MEC), and Management and Orchestration systems [6]. Rather than assessing these components independently, security measurements obtained from them are mapped to three security domains specifically defined for the 5G environment: Network and Data Transmission Security, Operational Security, and Infrastructure and Access Security. This mapping establishes an explicit relationship between the physical and logical components of the 5G architecture and the security metrics used for their assessment.
The Network and Data Transmission Security domain consolidates metrics characterizing the security of communications and data flows across UE, RAN, transport, and 5G Core components. The Operational Security domain incorporates metrics related to the secure operation and maintenance of 5G network functions and services, including configuration, monitoring, vulnerability management, incident handling, and service continuity. The Infrastructure and Access Security domain covers metrics associated with the protection of network elements, virtualized and cloud resources, identity and access management, privileged access, and management and orchestration functions. Thus, the three domains provide a 5G-oriented classification of classical security metrics rather than reproducing the thematic grouping of controls defined in ISO/IEC 27001:2022.
The next stage performs a two-round expert assessment of the classical metrics. In the first round, telecommunications and information security specialists select the most important candidate metrics in each domain. In the second round, the selected metrics are evaluated according to three quality criteria: correctness, measurability, and significance. These criteria are inherited from the methodology used in our previous study [16], in which they were employed to determine the suitability and relative importance of classical information security metrics. The expert assessment therefore provides the input data for the subsequent multicriteria analysis.
The MCDM layer implements two complementary evaluation paths based on the methodology proposed in [16]. In the first path, AHP is applied to determine the relative weights of the quality criteria, followed by WASPAS to rank the classical security metrics. In the second path, Fuzzy TOPSIS is used to evaluate and rank the metrics using fuzzy representations of expert judgments. This combination was originally introduced for constructing aggregated information security metrics from classical metrics and their weighting coefficients. In the proposed framework, the same principle is applied separately within each of the three 5G security domains.
Finally, the highest-ranked classical metrics and their corresponding weights are combined to form three aggregated 5G security metrics: A1 for Network and Data Transmission Security, A2 for Operational Security, and A3 for Infrastructure and Access Security. In contrast to individual classical metrics, which characterize specific security parameters, the aggregated metrics provide domain-level assessments that integrate several heterogeneous measurements into a more compact representation of the security state. The underlying aggregation concept follows our earlier definition of an aggregated security metric as a combination of multiple classical metrics whose contributions are differentiated through weighting coefficients.
3.2. Comparative Analysis of ISO/IEC Standards and Definition of 5G Security Domains
Table 3 summarizes the roles of ISO/IEC 27001:2022 [12], ISO/IEC 27011:2024 [13], and ISO/IEC 27004 [14] in the proposed framework and shows how their requirements and guidance are used to define, measure, and classify information security metrics for 5G telecommunications infrastructure into three security domains.
Table 3.
Comparative Analysis of ISO/IEC Standards and Definition of 5G Security Domains.
Compared with ISO/IEC 27001:2013, ISO/IEC 27001:2022 substantially restructures Annex A by replacing the previous 14 control domains with four thematic categories: organizational, people, physical, and technological controls [12,31]. The total number of controls was reduced from 114 to 93, primarily through consolidation, while 11 new controls were introduced to address emerging security areas, including threat intelligence, information security for use of cloud services, ICT readiness for business continuity, configuration management, data leakage prevention, monitoring activities, and secure coding [12,31]. This restructuring changes the organization of the control baseline but does not eliminate the need to measure and evaluate the effectiveness of implemented information security controls.
ISO/IEC 27001:2022 establishes the requirement for monitoring and evaluating ISMS performance but does not prescribe a specific methodology for constructing security metrics. Hence, ISO/IEC 27004 is used as the measurement basis of the proposed framework, providing guidance for defining measurement objects, base and derived measures, indicators, and procedures for data collection, analysis, interpretation, and reporting [14]. For telecommunications organizations, this generic measurement framework is complemented by ISO/IEC 27011:2024, which provides sector-specific guidance for applying information security controls in the telecommunications environment [13].
Based on the complementary roles of these standards, the proposed framework introduces a 5G-oriented classification of classical information security metrics. Rather than reproducing the four control themes of ISO/IEC 27001:2022, measurable security parameters associated with UE, RAN, transport network, 5G Core, Edge/Cloud, and Management and Orchestration are organized into three functional domains: Network and Data Transmission Security, Operational Security, and Infrastructure and Access Security. These domains form the basis for the subsequent expert assessment, MCDM-based ranking, and construction of aggregated 5G security metrics.
Figure 2 presents the general measurement model in accordance with the ISO/IEC 27004 standard [14]. Using this model, together with the industry-specific standard ISO/IEC 27011, we build a table of classic metrics for a telecom organization providing 5G services.
Figure 2.
ISO/IEC 27004 measurement chain.
The transformation of security controls into measurable indicators follows the measurement principles of ISO/IEC 27004 [13]. For example, for a vulnerability management control applied to a 5G Core network function, the numbers of detected and remediated vulnerabilities are used as base measures. These values can be combined into a derived measure, such as the percentage of vulnerabilities remediated within the specified time, which is then interpreted against a predefined threshold as a security indicator.
3.3. Selection and Classification of Classical Security Metrics for 5G
Classical security metrics were selected by correlating the telecommunications-specific security controls of ISO/IEC 27011:2024 with the measurement principles of ISO/IEC 27004. For each relevant security control, a measurable property of the corresponding 5G infrastructure component was identified and expressed as a quantitative metric. The resulting metrics were then classified into the three security domains proposed in this study: Network and Data Transmission Security, Operational Security, and Infrastructure and Access Security. Table 4 presents the results of the selection and classification of classical information security metrics for 5G telecommunications infrastructure based on ISO/IEC 27011 and the measurement principles of ISO/IEC 27004.
Table 4.
Classical security metrics for 5G infrastructure mapped to ISO/IEC 27011.
Each metric is assigned an identifier Mx.y, where x denotes the domain and y the number of the metric within the domain; these identifiers are used in all subsequent tables.
3.4. Quality Criteria of Security Metrics as the Basis for Aggregation
This research adopts three quality criteria of security metrics as the basis for aggregation: correctness, measurability, and significance. The choice of the above quality criteria is based on the work [32], in which the author combined a literature analysis with an expert survey and interviews with 141 experts from 21 countries and identified 19 quality criteria for security metrics. He designated these three as foundational. According to his findings, they form the basis for the credibility and sufficiency of security metrics and the associated measurements, and the remaining criteria are derived from or supplementary to them.
More recent studies confirm the relevance of this set of criteria. The authors of [33] developed a framework for constructing metrics for security operations centers (SOCs) and used the criteria of [32] as mandatory quality requirements for a metric. Their model groups the detailed characteristics under these criteria:
- Correctness is expressed through granularity, completeness, objectivity, and unbiasedness;
- Measurability is expressed through data availability and reproducibility;
- Significance is expressed through impact on activities, clarity of interpretation, and comparability.
The authors emphasize that correctness is the most important quality criterion and is achieved by reducing subjectivity and bias [33]. Their scheme also includes a fourth criterion, usability. However, it concerns the practical deployment of a metric (portability, scalability, presentability) rather than its credibility, and is therefore not decisive for aggregation.
The authors of [34] carried out a systematic selection of security metrics for industrial cyber–physical systems. Starting from 278 metrics collected from the literature, filtering and validation produced a final set of 32 metrics. The selection relies on characteristics traceable to Savola’s work, and validation uses the Conditions for Sound Security Metrics (CSSM). Its three conditions correspond in meaning to the criteria of [32]:
- A well-defined metric corresponds to correctness;
- A reproducible metric corresponds to measurability;
- A progressive metric, whose value evolves consistently with the actual level of security, corresponds to significance.
The authors of [34] note in their conclusion that an important condition for an aggregate metric is the soundness of each classical metric it comprises. It follows that the quality of an integral assessment is determined by the quality of its components. The aggregation criteria should therefore verify the fundamental properties of each classical metric.
Thus, the choice of the three criteria is justified as follows:
- Correctness ensures that a metric reflects the security property being assessed, fully serves its intended purpose, and is not distorted by subjective judgment. An incorrect individual metric introduces systematic error into the aggregate assessment.
- Measurability ensures that the input data are available and that results can be reproduced by different evaluators under different conditions. Without it, aggregation is technically impossible, and results cannot be compared over time or across systems.
- Significance ensures that a metric’s value can be interpreted and is linked to the actual level of security and to the decision-maker’s objectives. Without it, the aggregate assessment loses its practical value for security management.
All three criteria rest on expert consensus [32] and recur consistently in recent research across different domains, namely SOCs [33] and industrial enterprises [34]. They can therefore be regarded as a well-founded and robust basis for aggregating security metrics.
3.5. Methodology Stages and Expert Assessment Procedure
The assessment presented in this section is based on the methodology for constructing aggregated information security metrics proposed by Abdiraman et al. [16]. According to this methodology, an aggregated metric is formed from several classical security metrics combined with weighting coefficients, which are determined using multi-criteria decision-making methods based on expert assessment. In [16], the methodology was applied to the information security management domains of ISO/IEC 27001; in this study, it is adapted to 5G networks using classical metrics mapped to the controls of ISO/IEC 27011. The procedure consists of four stages: (1) definition of the alternatives, i.e., expert selection of the most important classical security metrics in each domain; (2) definition of the evaluation criteria based on the three quality criteria of security metrics identified by Savola [32]: correctness, measurability and significance; (3) determination of the criteria weights by the AHP method and calculation of the weighting coefficients of the classical metrics in the aggregated metrics by the WASPAS method; and (4) calculation of the weighting coefficients by the Fuzzy TOPSIS method as an alternative solution for verifying the results obtained at the third stage.
The expert assessment was carried out in two rounds using online questionnaires (Google Forms) in August 2026. Participation was voluntary and anonymous; the experts were informed about the purpose of the study and the use of their responses in aggregated form only. Specialists in information security and telecommunications were invited through professional networks of the authors, including telecom operators, security integrators, equipment vendors and academic institutions.
The first stage of the methodology involved defining the alternatives, which are the most relevant classical security metrics selected from those presented in Table 4. In the first round, the experts provided information on their field of activity, position, professional experience, experience with 5G networks and self-assessed competence in security metrics (on a 10-point scale). Each expert then rated the importance of the 24 classical metrics listed in Table 4 on a 1–5 scale and selected the five most important metrics in each domain. The selection frequency of each metric was used as the main selection criterion, with ties resolved by the mean importance score. The agreement among experts was assessed using Cochran’s Q test for the binary selection data and Kendall’s coefficient of concordance W for the importance ratings.
The metrics included in each aggregated metric were determined by the experts as the most important for the corresponding domain. In the first round, each retained metric was selected by the majority of the panel (58–95% of the experts) and received a high mean importance score (4.21–4.84 on the 1–5 scale, Table 5); the agreement among experts on the selection was statistically significant in two of the three domains (Cochran’s Q, Table 5). In the second round, the experts directly involved in 5G confirmed the quality of the selected metrics with respect to correctness, measurability and significance. Because all candidate metrics were derived from relevant controls of ISO/IEC 27011, most of them were rated as important (mean scores of 3.89–4.84), so the absolute ratings alone could not discriminate between them; the experts were therefore also asked to select a fixed number of five metrics per domain, which elicits their relative priorities. The experts did discriminate between the candidates: selection frequencies ranged from 21% to 95%. A small number of selected metrics also keeps the evaluation in the second round within the number of elements that experts can assess consistently [35,36]. The effect of the selection on the results is examined in Section 4.1, where the selection is repeated without the experts lacking 5G experience, and in Section 4.6, where each metric is removed in turn.
Table 5.
Results of the expert assessment of classical 5G security metrics.
The second stage of the methodology involved defining the evaluation criteria. Rather than conducting a separate expert selection of criteria, the quality criteria of security metrics substantiated in [32] were adopted. Their relevance has been confirmed by more recent studies on security metrics for security operations centers [33] and industrial cyber–physical systems [34], and the same criteria were applied in the methodology of [16].
The third and fourth stages were based on the second round of the survey. Only experts directly involved in 5G, either in operating, designing or securing 5G networks or in 5G research and teaching, were invited to the second round. In this round, the experts compared the three quality criteria pairwise on Saaty’s 1–9 scale for the AHP method and evaluated the importance of the criteria and the selected classical metrics with respect to each criterion using seven linguistic terms (VL, L, BA, A, AA, H, VH) for the WASPAS and Fuzzy TOPSIS methods. The consistency of the individual pairwise comparison matrices was checked using the consistency ratio.
3.6. MCDM Methods for Constructing Aggregated Security Metrics
This section describes the calculation procedures used at the third and fourth stages of the methodology. The AHP method was applied to determine the weights of the quality criteria, the WASPAS method to calculate the weighting coefficients of the classical metrics, and the Fuzzy TOPSIS method to verify these coefficients. The detailed computational steps of all three methods follow [16]; therefore, only the key expressions required for interpreting the results are given below.
The individual judgments of the experts were aggregated by the geometric mean into the group pairwise comparison matrix G (Table 6). The consistency of the individual and aggregated matrices was evaluated using the consistency index (CI) and the consistency ratio (CR) [16]:
where λmax is the principal eigenvalue of the pairwise comparison matrix, n is the number of criteria (n = 3), and RI is the random index (RI = 0.58 for n = 3). A matrix is considered consistent if CR ≤ 0.10.
Table 6.
Pairwise comparison matrices of the experts (E1–E9) and the aggregated matrix G.
The criteria weights obtained by the AHP method were used to calculate the weighting coefficients of the classical metrics by the WASPAS method, which combines the weighted sum model (WSM) and the weighted product model (WPM) [16]. For each domain, a decision matrix X = [xij]m × n was formed, where the alternatives are the selected classical metrics (m = 5) and the criteria are correctness, measurability and significance (n = 3). The linguistic assessments of the experts were converted into numerical values according to the scale given in [16] (from VL = 0 to VH = 9), and the element xij was calculated as the average assessment of the i-th metric with respect to the j-th criterion over all experts.
Since a higher assessment indicates higher quality of the metric for all three criteria, all criteria were treated as beneficial, and the decision matrix was normalized as follows:
where is the normalized value of . The first optimality criterion, based on the WSM, and the second optimality criterion, based on the WPM, were then calculated for each metric:
where wj is the weight of the j-th criterion obtained by the AHP method. The generalized optimality criterion of the i-th metric was calculated as a weighted combination of the two criteria:
where λ = 0.5, in accordance with [16]. Finally, the generalized optimality criteria were converted into the weighting coefficients of the classical metrics in the aggregated metric of each domain:
where Kai is the weighting coefficient of the i-th classical metric in the aggregated metric and m is the number of metrics in the domain. These weighting coefficients are then used to calculate the aggregated metric of each domain using Formula (10).
To verify the results obtained by the WASPAS method, the weighting coefficients of the classical metrics were also calculated by the Fuzzy TOPSIS method, which takes into account the uncertainty of expert judgments by representing linguistic assessments as triangular fuzzy numbers [16]. The experts evaluated both the importance of the quality criteria and the selected classical metrics with respect to each criterion using the same seven linguistic terms (VL, L, BA, A, AA, H, VH), which were converted into triangular fuzzy numbers according to the scale given in [16]. The construction of the fuzzy decision matrix, its normalization and weighting, the determination of the fuzzy positive and negative ideal solutions and the calculation of the distances di+ and di− were performed according to the procedure described in detail in [16]. Based on these distances, the closeness coefficient of each metric was calculated:
where m is the number of metrics in the domain. A higher value of CCi indicates that the metric is closer to the ideal solution. The closeness coefficients were then converted into the weighting coefficients of the classical metrics in the aggregated metric:
where Kai is the weighting coefficient of the i-th classical metric in the aggregated metric of the corresponding domain.
The weighting coefficients obtained by the WASPAS and Fuzzy TOPSIS methods were then compared to assess the stability of the ranking of the classical metrics and the consistency of the resulting aggregated metrics.
Each computational choice follows from the measurement purpose. Geometric-mean aggregation of individual pairwise matrices preserves the reciprocal property of the Saaty scale and is the usual procedure for group AHP [16]. Linear max normalization (Formula (3)) keeps the normalized scores proportional to the expert assessments, which matters because these scores are converted into weights; vector and sum normalization give the same weights within 0.01 percentage points (Section 4.6). WASPAS was chosen because the joint use of the additive and multiplicative models is more accurate than either model alone [37], and λ = 0.5 gives both models equal influence. Fuzzy TOPSIS was retained as an independent path that represents the spread of expert judgments by triangular fuzzy numbers. Crisp TOPSIS was not used to derive weights because, with five alternatives, it assigns a closeness close to zero to the lowest-rated metric and would practically exclude a metric selected by the experts (Section 4.6). The ranking of the metrics serves only for interpretation: the aggregated metrics depend on the weighting coefficients, not on the ranks, so near-ties in the ranking do not affect the assessment of a domain. Uncertainty is treated at three levels: the vagueness of expert judgments by fuzzy numbers, the dependence on the composition of the panel by leave-one-out and bootstrap resampling (Section 4.2), and the uncertainty of tolerable values and measurements by Monte Carlo analysis (Section 4.6).
The aggregated security metric of each domain was calculated using the formula proposed in [16]:
where f is the aggregated metric of the domain, ai is the current value of the i-th classical metric, Nai is its tolerable value set by the organization, Kai is the weighting coefficient of the i-th classical metric obtained by the WASPAS or Fuzzy TOPSIS method and n is the number of classical metrics in the aggregated metric. When applying this formula, the weighting coefficients must sum to 100%:
In this study, the tolerable values Nai are defined based on published service level agreements (SLAs) of telecom operators and information security objectives, which specify the acceptable levels of service unavailability, recovery time and incident handling. This is consistent with the ISO/IEC 27004 principle of interpreting measurement results against predefined target values [14].
Formula (10) assumes that an increase in the value of a classical metric indicates a deterioration of security. Several of the selected 5G metrics, however, have the opposite direction (e.g., network availability, secure connections, privileged accounts reviewed). For such metrics, ai is taken as the complementary value (100% minus the metric value), for example, service unavailability instead of network availability, and Nai is the corresponding tolerable level defined as described above. Thus, for all metrics, the ratio ai/Nai equals 1 when the metric is at its tolerable level, is less than 1 when the metric is better than required and exceeds 1 when the tolerable level is violated. Accordingly, f = 0 when all classical metrics are at their tolerable levels, negative values of f indicate that the security state of the domain is better than required, and positive values indicate a violation of the tolerable levels that requires attention.
3.7. Non-Compensatory Exceedance Indicator and Status Rule
The indicators introduced in this section belong to the aggregation stage of the method: the weighting coefficients Kai obtained by WASPAS and Fuzzy TOPSIS (Section 3.6) enter them as fixed parameters, and the measured values of the metrics are evaluated against the tolerable values set by the organization. The distance-based logic of TOPSIS is not used for this purpose, because it measures deviations from the best attainable value in both directions and relative to the other alternatives, whereas the status of a domain must be assessed against a fixed tolerable level and must distinguish violations from reserves.
Formula (10) belongs to the class of additive aggregation rules, which assume that the components of a composite indicator are fully substitutable: a shortfall in one component can be offset by a surplus in another [26,38]. Because the weighting coefficients sum to one, the sign of the aggregated metric is determined by the weighted mean of the relative deviations of the metrics from their tolerable values, where the ratio exceeds one when the i-th metric violates its tolerable value and is below one when it performs better than required. A metric that violates its tolerable value can therefore be offset by metrics that perform better than required. In security monitoring, such offsetting hides exactly the violations that require corrective action.
Several approaches have been proposed to limit compensation in composite indicators. Munda and Nardo [38] replace additive aggregation with non-compensatory rules derived from multi-criteria analysis and social choice. Mazziotta and Pareto [39] keep an additive mean but subtract a penalty proportional to the imbalance between components. A third approach censors each component at a reference level, so that only deviations on one side of the threshold enter the indicator. A well-known example is the family of poverty measures of Foster, Greer and Thorbecke [40]. In these measures, each individual contributes the relative shortfall of income below the poverty line, (z − yi)/z, and individuals above the line contribute zero, so that their surplus cannot reduce measured poverty.
Following the censoring approach of [40], we separate the relative deviations of the metrics into exceedances and reserves. The relative exceedance of a tolerable value, max(ri − 1, 0), plays the role of the relative shortfall (z − yi)/z in [40], and metrics within their tolerable levels contribute zero. The exceedance indicator E and the reserve indicator R of a domain are defined as
where Kai, ai, Nai and n are defined as in Formula (10). The aggregated metric of Formula (10) then decomposes as
A = E − R
The weighting coefficients Kai and the factor 1/n are retained from Formula (10), so that E and A are expressed on the same scale. E corresponds to the case α = 1 of [40], i.e., the weighted mean relative exceedance. Higher powers of the exceedance, as for α = 2 in [40], would weight large violations more strongly. We use α = 1 to keep E directly comparable with A.
Formula (13) makes the compensation in Formula (10) explicit: a domain is classified as acceptable by A whenever its reserve R exceeds the exceedance E, regardless of how large the exceedance is. E = 0 if and only if no metric of the domain exceeds its tolerable value. Its value grows with the weighted size of the violations, and performance better than required cannot reduce it.
The two indicators are combined into a three-level status: acceptable if A ≤ 0 and E = 0; attention if A ≤ 0 and E > 0, i.e., the domain as a whole is within its tolerable level, but at least one metric is violated; and corrective action if A > 0. An operator may additionally designate critical metrics, for example the share of successful network attacks (M1.5) or unauthorized management-interface access attempts (M3.8), whose violation leads to corrective action regardless of A. This follows the argument of Munda and Nardo [38] that complete compensability among indicators is often undesirable, because very poor performance in an individual indicator should not be concealed by good performance in others. A remains informative as a measure of the overall margin of the domain, while E and the status rule ensure that no violation is hidden.
The complete procedure, from the selection of metrics to the status of each domain, is shown in Figure 3. Stages I and II are performed once and repeated only when the expert panel or the metric set changes (Step 9); Stage III is performed in each reporting period.
Figure 3.
Workflow for constructing and using the aggregated 5G security indicators.
4. Results
4.1. Expert Selection of Classical 5G Security Metrics
The first round of the survey involved 19 experts, including information security and telecommunications specialists from Kazakhstan. Most experts represented the industry: security integrators and consulting companies (7 experts, 37%), telecom operators and service providers (6, 32%), and telecom equipment and software vendors (2, 11%). Two experts (11%) were from academia, and two (11%) were from in-house information security departments. In terms of position, 8 experts (42%) held managerial roles (CISO, head of the security or network department), 6 (32%) were security or network engineers, 2 (11%) were security analysts, 2 (11%) were researchers or lecturers, and one was an auditor. Most experts had substantial professional experience: 6–10 years (8 experts, 42%) or more than 10 years (6, 32%); 4 experts (21%) had 3–5 years and one had less than 3 years of experience. Regarding 5G networks, 2 experts (11%) were directly involved in operating, designing or securing 5G networks, 3 (16%) worked with 4G/LTE networks and were familiar with the 5G architecture, 7 (37%) studied 5G in research or teaching, and 7 (37%) had no direct experience with 5G. The mean self-assessed competence of experts in security metrics and measurement was 7.3 on a 10-point scale (range 4–10).
Each expert rated the importance of the 24 classical metrics on a scale from 1 to 5 and selected the five most important metrics in each of the three domains. Equal weights were used for the expert assessments. For each metric, the selection frequency, mean score, standard deviation and median were calculated; in each domain, the five metrics with the highest selection frequency were selected, with ties resolved by the mean score. The agreement among experts was tested using Cochran’s Q test (for metric selection) and Kendall’s coefficient of concordance W (for importance ratings). The results are presented in Table 5. For each metric, the selection frequency shows the number of experts who included it among the five most important metrics in the domain, with the percentage of the total number of experts (n = 19) given in brackets. The mean score, standard deviation (SD) and median were calculated from the experts’ importance ratings on the 1–5 scale, and the rank reflects the position of the metric within its domain. Below each domain, the results of Cochran’s Q test and Kendall’s coefficient of concordance W are given; values marked with an asterisk are statistically significant at p < 0.05.
Table 5 summarizes the results of the expert assessment of classical 5G security metrics, highlighting their relative importance based on expert judgments. The 15 classical metrics selected on the basis of the expert assessment are shown in bold in Table 5 above. To verify the robustness of the selection, the analysis was repeated excluding the seven experts who had no direct experience with 5G networks (n = 12). In the Network and Data Transmission Security and Infrastructure and Access Security domains, the same five metrics were selected. In the Operational Security domain, M2.1 (detected vulnerabilities) replaced M2.2 (vulnerabilities remediated within target time), as it was selected by 8 experts compared with 7 for M2.2. This difference corresponds to the low agreement among experts in this domain (Cochran’s Q, p = 0.238), and M2.2 was retained, since it is normalized and directly linked to risk reduction.
4.2. Weights of the Quality Criteria Obtained by the AHP Method
The second round involved nine experts directly involved in 5G: two experts engaged in operating, designing or securing 5G networks and seven experts studying 5G in research or teaching. Experts working with 4G/LTE networks and experts without 5G experience were not included in the second round. The results of the pairwise comparison of the criteria by the AHP method are presented in Table 6.
The CR of the individual matrices ranged from 0.000 to 0.081; therefore, the judgments of all nine experts were considered consistent. The aggregated matrix G also showed high consistency (λmax = 3.008, CI = 0.004, CR = 0.007). Based on the matrix G, the following criteria weights were obtained: significance—62.6%, correctness—28.9% and measurability—8.5%. As a result, the experts considered significance to be the most important quality criterion of classical 5G security metrics, while measurability was assigned the lowest importance. These weights are consistent with the ranking of the criteria obtained in [16] (significance—55.2%, correctness—35.9%, measurability—8.9%), which indicates the stability of the expert assessment of the quality criteria when the methodology is applied to 5G networks.
To assess how strongly the weights depend on the composition of the panel, the AHP calculation was repeated nine times, each time without one expert, and 5000 bootstrap samples of the nine experts were drawn [28]. Excluding any single expert changed the criteria weights by at most 1.6 percentage points (correctness 27.3–29.7%, measurability 8.0–8.9%, significance 61.5–64.1%). The bootstrap 95% confidence intervals were 24.4–34.6% for correctness, 7.2–10.2% for measurability and 56.6–67.9% for significance. All nine experts ranked the criteria in the same order, significance > correctness > measurability (Kendall’s W = 1.00, χ2 = 18.0, df = 2, p < 0.001). The criteria weights are therefore determined by a ranking shared by the whole panel rather than by individual experts.
4.3. Weighting Coefficients of Classical Metrics Obtained by the WASPAS Method
The linguistic assessments of the selected classical metrics provided by the nine experts were converted into numerical values (from VL = 0 to VH = 9) according to [16] and averaged, forming one decision matrix for each domain. The matrices were normalized using Formula (3), and the optimality criteria were calculated using Formulas (4)–(7) with the AHP-derived weights of the criteria (correctness = 0.289, measurability = 0.085, significance = 0.626). The results are presented in Table 7.
Table 7.
Decision matrices and weighting coefficients of the classical metrics (WASPAS).
In the Network and Data Transmission Security domain, the highest weight was obtained by M1.1 (network availability, 21.29%); in the Operational Security domain, by M2.7 (mean time to respond, 20.69%); and in the Infrastructure and Access Security domain, by M3.8 (unauthorized management-interface access attempts, 22.44%). These results indicate that the experts prioritized service availability and protection of management interfaces, which are critical attack surfaces in virtualized 5G networks. At the same time, the weighting coefficients within each domain vary within a relatively narrow range (18.50–21.29%, 18.45–20.69% and 16.53–22.44%, respectively), which indicates that all selected classical metrics contribute substantially to the aggregated metrics and none of them dominates the assessment.
Because correctness and measurability may overlap conceptually [33], their interdependence was examined across the 15 selected metrics. The mean expert assessments were positively correlated (Pearson’s r = 0.74 between correctness and measurability, 0.66 between correctness and significance, and 0.60 between measurability and significance), which indicates partial redundancy of the criteria. Its effect on the results is small because measurability received only 8.5% of the criteria weight: removing this criterion altogether changed the weighting coefficients by at most 0.21 percentage points and the aggregated metrics by at most 0.0003.
4.4. Weighting Coefficients of Classical Metrics Obtained by the Fuzzy TOPSIS Method
The linguistic assessments of the importance of the quality criteria were converted into triangular fuzzy numbers and aggregated, which resulted in the following fuzzy weights: correctness (0.500, 0.811, 1.000), measurability (0.300, 0.678, 1.000) and significance (0.700, 0.944, 1.000). The fuzzy assessments of the metrics were aggregated in the same way, normalized and weighted according to [16]; the ideal solutions were defined as A+ = (1, 1, 1) and A− = (0, 0, 0). The aggregated fuzzy decision matrices, the distances to the ideal solutions, the closeness coefficients and the resulting weighting coefficients are presented in Table 8.
Table 8.
Aggregated fuzzy decision matrices and weighting coefficients of the classical metrics.
According to the Fuzzy TOPSIS method, the highest weights were obtained by M1.1 (network availability, 20.49%) in the Network and Data Transmission Security domain, M2.6 (mean time to detect, 20.31%) in the Operational Security domain and M3.8 (unauthorized management-interface access attempts, 20.65%) in the Infrastructure and Access Security domain. In all three domains, the lowest weights were assigned to the same metrics as in the WASPAS method: M1.3 (secure connections), M2.8 (systems with current security updates) and M3.6 (security-related infrastructure failures). This may be explained by the fact that encryption of 5G interfaces and regular updating of network functions are largely regulated by 3GPP specifications and vendor processes, so these metrics are perceived by the experts as baseline requirements rather than distinguishing indicators of the security state. The weighting coefficients obtained by Fuzzy TOPSIS vary within a narrower range (19.19–20.65%) than those obtained by WASPAS, which reflects the wide fuzzy intervals of the expert assessments: the upper bound of almost all aggregated assessments equals 10, indicating that at least one expert rated each metric as very high for each criterion.
A comparison of the weighting coefficients obtained by the two methods is given in Table 9.
Table 9.
Comparison of the weighting coefficients of the classical metrics obtained by WASPAS and Fuzzy TOPSIS.
In the Network and Data Transmission Security and Infrastructure and Access Security domains, the rankings of the metrics obtained by the two methods were highly consistent (Spearman’s rank correlation coefficient ρ = 0.90 and ρ = 1.00, respectively), whereas in the Operational Security domain the rankings differed (ρ = 0.10). In all domains, the Fuzzy TOPSIS method produced a narrower range of weighting coefficients than WASPAS, which is consistent with the results reported in [16] and is explained by the smoothing effect of the fuzzy aggregation. The differences in the Operational Security domain correspond to the lower agreement among experts observed for this domain in the first round (Table 5). Following [16], the coefficients obtained by the WASPAS method were used to construct the aggregated metrics. Overall, the agreement between the two methods in two of the three domains supports the robustness of the obtained weighting coefficients.
The low agreement in the Operational Security domain was analyzed further. First, the non-significant agreement in the first round (Cochran’s Q, p = 0.238; Kendall’s W = 0.041, p = 0.613) concerns the selection and importance ratings of the candidate metrics in the first round, not their weights; its consequence is that the selection in this domain is less certain, as shown by the replacement of M2.2 by M2.1 when the experts without 5G experience were excluded (Section 4.1). Second, the low rank correlation (Spearman’s ρ = 0.10, Kendall’s τ = 0.00) reflects near-ties rather than a disagreement in magnitude: the WASPAS weights span 18.45–20.69% and the Fuzzy TOPSIS weights 19.19–20.31%, and the four highest-ranked metrics differ by less than 0.7 percentage points in both methods. Under such small differences, a swap caused by 0.1 percentage points counts as a full rank change. The largest difference between the two methods in this domain is 0.74 percentage points, and A2 equals 0.0208 with the WASPAS weights, 0.0202 with the Fuzzy TOPSIS weights and 0.0207 with equal weights. The ordering of metrics within this domain is therefore not interpreted, and its weights are regarded as practically uniform. In the other two domains, Kendall’s τ between the two methods was 0.80 and 1.00.
4.5. Aggregated Security Metrics for 5G Networks
Based on the weighting coefficients obtained in Section 4.3 and Section 4.4, three aggregated security metrics were constructed using Formula (10): A1 for Network and Data Transmission Security, A2 for Operational Security and A3 for Infrastructure and Access Security. Table 10 presents, for each selected classical metric, the quantity ai used in Formula (10), its tolerable value Ni, the source of this value and the weighting coefficients obtained by the WASPAS and Fuzzy TOPSIS methods.
Table 10.
Parameters of the aggregated security metrics for 5G networks.
For metrics whose increase indicates better security, the complementary value (100% minus the metric value) was used, so that for all metrics the ratio ai/Ni increases as security deteriorates. The tolerable values related to service availability, downtime and restoration time were defined on the basis of published service level agreements of telecom operators [41] and the requirements for 5G ultra-reliable low-latency communication services [42]. The tolerable values of metrics not covered by SLAs were defined as information security objectives, as required by ISO/IEC 27001:2022 (Clause 6.2) [12], taking into account the remediation deadlines established in industry and government requirements [43,44]. For count-type metrics, for which no generally accepted thresholds exist, the tolerable value was defined as the operator’s baseline B, i.e., the mean monthly value over the previous 6–12 months.
Substituting the weighting coefficients obtained by the WASPAS method into Formula (10), the aggregated metrics take the following form:
where ai, bi and ci are the current values of the classical metrics of the corresponding domains (Table 10). A value of the aggregated metric equal to zero means that all classical metrics of the domain are at their tolerable levels; negative values indicate that the domain performs better than required, and positive values indicate that the tolerable levels are exceeded and corrective actions are needed.
To illustrate the application of the proposed aggregated metrics, a calculation was performed for one monthly reporting period. Since the operational data of telecom operators are confidential, hypothetical values of the classical metrics were used, chosen to represent a typical situation in which most metrics are within their tolerable levels while some exceed them. The baseline values for the count-type metrics M3.6 and M3.8 were assumed to be 6.2 and 15 events per month, respectively. The input data and results of the calculation are presented in Table 11.
Table 11.
Illustrative calculation of the aggregated metrics for one month.
The calculation yields A1 = −0.043, A2 = 0.021 and A3 = −0.061. The negative values of A1 and A3 indicate that the Network and Data Transmission Security and Infrastructure and Access Security domains are, on the whole, within their tolerable levels. In the first domain, this holds even though the share of successful network attacks exceeds its tolerable value (ai/Ni = 1.5); this violation is compensated by the good performance of the remaining metrics, but it remains visible at the level of the classical metric. The positive value of A2 shows that the Operational Security domain exceeds its tolerable level, mainly due to the share of vulnerabilities not remediated in time (ai/Ni = 1.6), the share of systems without current updates (1.2) and the mean time to respond (1.17). Thus, instead of analyzing fifteen classical metrics, the security manager obtains three domain-level indicators, immediately identifies Operational Security as the domain requiring corrective action and can then drill down to the classical metrics responsible for the deviation.
The non-compensatory indicator (Formulas (12) and (13)) changes the assessment of the first domain (Table 12). Although A1 is negative, E1 = 0.020 because the share of successful network attacks exceeds its tolerable value, and the domain receives the status attention; if M1.5 is designated as critical, the status becomes corrective action. The Operational Security domain requires corrective action (A2 = 0.021, E2 = 0.039), and the Infrastructure and Access Security domain is acceptable (E3 = 0). The violation in the network domain is thus reported at the domain level and not only in the drill-down.
Table 12.
Status of the domains for the illustrative reporting period.
4.6. Sensitivity Analysis
To assess the robustness of the results to the subjectivity of the expert-derived criteria weights, a sensitivity analysis of the WASPAS-based weighting coefficients was performed. Three groups of scenarios were considered: (1) the weight of each criterion was varied by ±10%, ±20% and ±30%, with the remaining weights adjusted proportionally so that their sum remained equal to one; (2) the AHP weights were replaced by equal weights and by the criteria weights obtained in [16]; and (3) the WASPAS parameter λ was varied from 0 (pure WPM) to 1 (pure WSM).
Four indicators were calculated for each scenario. The maximum absolute change in the weighting coefficient (max|ΔK|) shows the largest deviation, in percentage points, of the weighting coefficient of any classical metric from its baseline value across all three domains. The minimum Spearman’s rank correlation coefficient (min ρ) shows the lowest agreement between the new and the baseline rankings of the metrics among the three domains, where ρ = 1 means that the rankings are identical. The number of rank changes is the total number of metrics in all domains whose position in the ranking changed. Finally, the values of the aggregated metrics were recalculated for the illustrative data given in Table 11 to determine whether the change in the criteria weights affects the final assessment of the security state of the domains. The results are presented in Table 13.
Table 13.
Sensitivity of the weighting coefficients and aggregated metrics to the criteria weights and λ.
The weighting coefficients of the classical metrics proved to be highly robust. Changing the weight of any criterion by up to ±30% altered the coefficients by no more than 0.51 percentage points, and even replacing the AHP weights with equal weights changed them by at most 0.79 percentage points. The coefficients were practically insensitive to the weight of measurability and to the parameter λ (changes of up to 0.06 and 0.03 percentage points, respectively), and the use of the criteria weights from [16] did not change any ranking. Consequently, the values of the aggregated metrics A1–A3 changed by no more than 0.001 in all scenarios, and their signs, which determine whether a domain is within its tolerable level, did not change.
At the same time, small changes in the rankings were observed for metrics with almost equal weighting coefficients. In the Network and Data Transmission Security domain, a decrease in the weight of correctness or an increase in the weight of significance led to an exchange of positions between M1.2 and M1.5, whose baseline coefficients differ by only 0.07 percentage points; with an increase in the weight of significance by 20–30%, M1.5 also moved ahead of M1.7 (minimum ρ = 0.70). In the Operational Security domain, a decrease in the weight of significance by 20–30% or the use of equal weights led to an exchange of the first two positions between M2.7 and M2.2 (difference of 0.13 percentage points), and with equal weights M2.4 and M2.6 also exchanged positions. These changes concern metrics whose weighting coefficients differ by less than 0.3 percentage points and therefore have no practical effect on the aggregated metrics. The ranking in the Infrastructure and Access Security domain remained stable in all scenarios. Thus, the proposed aggregated metrics are robust to reasonable variations in the expert-derived criteria weights and of the parameters of the WASPAS method.
The analysis was extended in four further directions: the MCDM method, the normalization procedure, the selection of metrics, and the uncertainty of tolerable values and measurements (Table 14).
Table 14.
Extended robustness analysis of the weighting coefficients and the domain status.
Alternative methods. The decision matrices of Table 7 were processed with the same AHP criteria weights by SAW, WPM, TOPSIS and VIKOR. SAW and WPM reproduced the WASPAS weights within 0.03 percentage points and the rankings exactly. TOPSIS and VIKOR reproduced the rankings in the Operational Security and Infrastructure and Access Security domains (ρ = 1.00) and largely in the network domain (ρ = 0.90 and 0.70). However, the TOPSIS closeness coefficients converted into weights by Formula (9) assigned 0–1.7% to the lowest-rated metric of each domain, i.e., they would practically remove a metric selected by the experts; this is why crisp distance-based methods were not used to derive the weights. Fuzzy TOPSIS does not show this effect because the fuzzy intervals of all metrics overlap.
Normalization and rank reversal. Replacing linear max normalization by vector or sum normalization changed the WASPAS weights by at most 0.01 percentage points. Removing each metric in turn and recomputing WASPAS for the remaining four metrics did not change their relative order in any of the 15 cases.
Metric selection. When each metric was removed in turn from the aggregated metric of Table 11, the status changed only when the removed metric was itself the violated one: removing M1.5 made the network domain acceptable, and removing M2.2 turned A2 negative (−0.006), while E2 remained positive (0.022) and the domain kept the status attention. The aggregated metrics are therefore sensitive to which metrics are included, but not to small changes in their weights, and E keeps flagging a domain as long as any violated metric remains in it.
Tolerable values and measurements. Following the uncertainty analysis approach for composite indicators [27], in a Monte Carlo analysis with 20,000 draws, the tolerable values Ni and the measured values ai shown in Table 11 were varied independently and uniformly. With tolerable values or measurements varying by ±10%, the status of all three domains was unchanged in all draws. With tolerable values varying by ±20%, the status was preserved in 100%, 98.0% and 98.4% of draws for the three domains, and with ±20% tolerable values combined with ±10% measurements in 100%, 96.6% and 85.3% of draws. The most sensitive domains are those whose aggregated metric lies close to zero (A2 = 0.021) or whose metrics lie close to their tolerable values (three ratios of about 0.8 in the third domain); for them, the tolerable values should be set with particular care.
Equal weighting. Replacing the WASPAS weights by equal weights (20% per metric) gave A1 = −0.043, A2 = 0.021 and A3 = −0.060, and the share of Monte Carlo draws with unchanged status differed from that of the WASPAS weights by at most 0.1 percentage points. Because the 15 metrics had already been selected as the most important and were rated high on all criteria, the MCDM step produced near-uniform weights (16.5–22.4%); in the present data, it does not change decisions compared with equal weighting. The weights become decisive when metrics of unequal quality are aggregated, for example when 5G-native metrics are added (Section 5.4).
4.7. Scenario-Based Evaluation
Because the operational data of telecom operators are confidential, the ability of the indicators to detect security deterioration was evaluated on synthetic 12-month time series. In each domain, months 1–4 represent a stable state in which all metrics are within their tolerable levels, and from month 5 a controlled deterioration is injected. In scenario S1, a DDoS campaign increases the ratio ai/Ni of successful network attacks (M1.5) by 0.2 per month and that of the mean time to recover (M1.7) by 0.05 per month. In S2, a growing remediation backlog increases the ratio for vulnerabilities not remediated in time (M2.2) by 0.15 per month, followed from month 7 by systems without current updates (M2.8, 0.08 per month). In S3, virtual and cloud assets gradually drift out of compliance (M3.7, 0.1 per month). The WASPAS weights of Table 7 were used. The results are presented in Table 15.
Table 15.
Aggregated metrics and status in three synthetic deterioration scenarios.
In all three scenarios, the exceedance indicator E became positive in the month of the first threshold violation (months 6, 6 and 7), and the status changed from acceptable to attention in that month. The compensatory metric A reacted only after the deterioration outweighed the remaining metrics: in month 12 in S1 (six months later), in month 9 in S2 (three months later) and not at all within 12 months in S3. To check that this behavior is not an artifact of the deterministic profiles, each ratio was perturbed by uniform noise of ±5% in 2000 replications. E flagged the violation in the month of its occurrence in all replications, with no false alarms in months 1–4, whereas A lagged by 5.9 months on average in S1 (and did not react within 12 months in 3.4% of replications), by 3.3 months in S2, and did not react in S3. These scenarios illustrate the detection behavior of the indicators; they do not replace validation on operator data (Section 5.4).
5. Discussion
5.1. Interpretation of the Results
The expert assessment showed that significance is the dominant quality criterion of classical 5G security metrics (62.6%), followed by correctness (28.9%), while measurability received the lowest weight (8.5%). This suggests that, for the experts, a metric is valuable primarily when its value can be directly interpreted and used in security decision-making. A possible explanation for the low weight of measurability is that data availability may be perceived as a technical issue that can be solved through the monitoring and automation tools typical of virtualized 5G infrastructures. The selected metrics reflect the specific features of 5G networks: service availability and recovery time in the network domain, the speed of incident detection and response in the operational domain, and the protection of management interfaces and virtualized assets in the infrastructure domain, which correspond to the main attack surfaces introduced by network function virtualization and centralized orchestration.
Methodologically, the results show where the value of the proposed approach lies. The MCDM step produced near-uniform weights because the experts had selected the most important metrics of each domain and rated them high on all criteria; the weights therefore confirm that the selected metrics are of comparable importance, but they do not change decisions relative to equal weighting (Section 4.6). The decisive elements are the standard-traceable selection of metrics, their normalization against tolerable values with a common direction, and the non-compensatory status rule, which in the scenarios of Section 4.7 detected every violation in the month it occurred, whereas the compensatory metric lagged by three to six months or did not react.
5.2. Comparison with Previous Studies
The experts ranked the quality criteria in the same order as in our previous study [16], which addressed the ISO/IEC 27001 management domains. In both studies, significance received the highest weight, correctness the second highest and measurability the lowest. In the present study, the weights were 62.6%, 28.9% and 8.5%, respectively, compared with 55.2%, 35.9% and 8.9% in [16]. This agreement was obtained even though the experts, the application domain and the set of metrics were different. This suggests that the relative importance of the quality criteria may be largely independent of the application domain, which supports the use of the criteria proposed by Savola [32] as a general basis for aggregation. Consistent with [16], Fuzzy TOPSIS produced a narrower range of weighting coefficients than WASPAS, and the rankings obtained by the two methods agreed in two of the three domains. Compared with the studies summarized in Table 1, which either remain conceptual [18,21] or apply MCDM methods to compliance barriers [22] and the selection of external alternatives [24,25], the present study applies MCDM methods to construct aggregated metrics directly tied to the security controls of ISO/IEC 27011 and to the infrastructure components of 5G networks.
Compared with the quantitative 5G frameworks of Zhao et al. [8] and Abdelrazek et al. [9] (Table 2), the proposed indicators operate at a different level. Zhao et al. [8] address the multi-layer, multi-owner structure of 5G by computing security metrics modularly across layers, and Abdelrazek et al. [9] compute a technical security score of network functions from attack-surface exposure, vulnerability impact and control effectiveness. The present indicators assess the security state of a single operator and the effectiveness of its security controls against ISO/IEC 27011 and tolerable values, which is the evidence required by ISO/IEC 27001 (Clause 9.1) [12] and by the NIS2 Directive [10]. The approaches are complementary: the score of [9], for example, could serve as an additional classical metric of the Infrastructure and Access Security domain, with a tolerable value set by the operator. A benchmark on identical data is not possible, because the frameworks use different inputs (network-function telemetry versus measurements of security controls) and produce outputs of different types.
5.3. Practical Implications
The proposed aggregated metrics allow a telecom operator to replace fifteen heterogeneous classical metrics with three domain-level indicators whose sign immediately shows whether a domain is within its tolerable level. Because the tolerable values are linked to SLA parameters and security objectives, the aggregated metrics can be integrated into existing monthly ISMS reporting and used to prioritize corrective actions, as illustrated in Section 4.5. Such quantitative, auditable indicators can also support the assessment of security measures required by regulatory frameworks such as the NIS2 Directive. At the same time, the illustrative example showed that a violation of a single classical metric can be compensated by the good performance of the others; for this reason, each aggregated metric is reported together with the non-compensatory indicator E and the status rule (Section 3.7), and the classical metrics remain available for drill-down.
The indicators can be computed from systems that operators already run (Table 16). Most inputs are produced by the network management and operations support systems (NMS/OSS), the security information and event management (SIEM) and security orchestration, automation and response (SOAR) platforms of the security operations center (SOC), vulnerability and configuration management tools, and identity and privileged access management systems. The ratios ai/Ni, A and E can be calculated in the SIEM as scheduled queries or in a reporting layer on top of it, with the status shown in the SOC dashboard and in the monthly ISMS report. The two count-type metrics (M3.6 and M3.8) require a baseline of 6–12 months; if historical records are not available, the indicators become fully operational after this period.
Table 16.
Data sources for the classical metrics in telecom security monitoring.
5.4. Limitations and Future Research
This study has several limitations. First, the expert panel consisted only of specialists from Kazakhstan: 19 experts in the first round and nine in the second. Seven first-round experts had no direct experience with 5G; excluding them left the selection unchanged in two domains and replaced one metric in the third (Section 4.1). All weights were derived from the nine second-round experts, of whom two operate, design or secure 5G networks and seven study or teach 5G. The resampling analysis (Section 4.2) shows that the criteria weights do not depend on individual experts and that all experts shared the same criteria ranking, which agrees with [16], obtained with a different panel. The method itself does not depend on the national context, because the metrics are derived from international standards and the quality criteria from an international expert survey [32]; only the selection of metrics and their weights are panel-specific. Nevertheless, the metric weights reflect the views of this panel; operators applying the method should recompute them with their own experts, and an international panel with more practitioners is planned.
Second, a ceiling effect was observed in the importance ratings, and the agreement on metric selection in the Operational Security domain was not statistically significant, so the selection in this domain is less certain (Section 4.4).
Third, the tolerable values of several metrics were defined by the authors as security objectives (Table 10). Their rationale is given in Section 4.5: availability, downtime and recovery values follow published SLAs and 3GPP service requirements [41,42], remediation-related values follow industry and government remediation requirements [43,44], and count-type metrics use the operator’s own baseline. The Monte Carlo analysis (Section 4.6) shows that the domain status is stable under ±10% variation in the tolerable values, but domains close to their limits are sensitive to ±20% variation. Tolerable values therefore have to be set by each operator in its information security objectives (ISO/IEC 27001, Clause 6.2) and reviewed at least annually; the values in Table 10 are a reference starting point, not universal thresholds.
Fourth, the indicators were evaluated on a hypothetical reporting period and on synthetic scenarios. Validation on operator data should compare the monthly status with recorded incidents and audit findings and estimate the lead time and false-alarm rate of the indicators. Fifth, the 15 selected metrics do not cover 5G-specific security risks, such as network slice isolation and roaming security, because ISO/IEC 27011 is technology-neutral. Specifically, the standard does not include controls explicitly addressing network slicing and covers roaming only through the general control on interconnected telecommunications services (Clause 5.38). In contrast, the corresponding 5G-specific security mechanisms are defined in 3GPP TS 33.501 [6]. Table 17 lists candidate metrics for these areas based on 3GPP TS 33.501 [6]. Since Formulas (10) and (12) accept any number of metrics, these candidates can be added to the corresponding domains once operators collect them, with weights obtained by repeating Steps 3–5 in Figure 3.
Table 17.
Candidate 5G-native metrics for extending the domains.
Future research will address validation on operator data, an international expert panel, adaptive weighting that updates the weights as new data accumulate, and the extension of the framework to network slicing security, multi-access edge computing and large-scale cloud-native deployments. For 6G networks, which are expected to rely further on AI-native network management and distributed computing, the method remains applicable because it depends on the control structure of ISO/IEC 27011 and on measurable properties of infrastructure components rather than on a specific radio technology; the metric set and the tolerable values, however, will have to be revised.
6. Conclusions
This study proposed a standard-traceable method for constructing aggregated information security indicators for 5G telecommunications infrastructure. Twenty-four classical metrics were derived from the controls of ISO/IEC 27011:2024 through the ISO/IEC 27004 measurement chain and grouped into three domains, and a two-round expert assessment identified the five most important metrics of each domain. AHP assigned the highest weight to significance (62.6%), followed by correctness (28.9%) and measurability (8.5%); all nine experts shared this ranking, and excluding any single expert changed the weights by no more than 1.6 percentage points.
The methodological contribution lies in three elements: the traceable conversion of ISO/IEC 27011 controls into directional metrics with tolerable values; the decomposition of the aggregated metric into exceedance and reserve components, with the non-compensatory exceedance indicator E and a three-level status rule; and the quantification of how uncertainty in weights, expert composition, thresholds and measurements affects the domain status. In the illustrative example, E revealed a violation in the network domain that the compensatory metric hid, and in three synthetic scenarios it flagged each deterioration in the month of the first violation, whereas the compensatory metric lagged by three to six months or did not react. The MCDM weights were near-uniform and led to the same decisions as equal weighting; they were consistent across WASPAS, SAW, WPM and Fuzzy TOPSIS, except for the near-tied ranking in the Operational Security domain.
The indicators can be computed from data already collected by NMS/OSS, SIEM, vulnerability, configuration and access management systems and reported monthly in the ISMS. Future research will validate the indicators on operator data, involve an international panel with more practitioners, introduce adaptive and uncertainty-aware weighting, and add 5G-native metrics for network slicing, roaming, edge and cloud-native deployments.
Author Contributions
Conceptualization, A.A. (Aliya Abdiraman) and L.A.; formal analysis, A.A. (Aliya Abdiraman) and D.M.; investigation, A.A. (Akzhibek Amirova) and A.A. (Aliya Abdiraman); resources, M.A.; data curation, L.A.; writing—original draft preparation, A.A. (Aliya Abdiraman) and A.A. (Akzhibek Amirova); writing—review and editing, A.A. (Akzhibek Amirova), D.M. and D.Y.; supervision, D.Y.; project administration, L.A.; funding acquisition, D.Y.; visualization, M.A. All authors have read and agreed to the published version of the manuscript.
Funding
This research has been funded by the Committee of Science of the Ministry of Science and Higher Education of the Republic of Kazakhstan (Grant No. BR24992852 “Intelligent models and methods of Smart City digital ecosystem for sustainable development and the citizens’ quality of life improvement”).
Data Availability Statement
Dataset available on request from the authors.
Conflicts of Interest
The authors declare no conflicts of interest.
Abbreviations
The following abbreviations are used in this manuscript:
| AHP | analytic hierarchy process |
| BSS | business support system |
| CMDB | configuration management database |
| DEMATEL | decision-making trial and evaluation laboratory |
| DoS/DDoS | denial of service/distributed denial of service |
| Fuzzy TOPSIS | fuzzy technique for order of preference by similarity to ideal solution |
| IAM | identity and access management |
| IDS/IPS | intrusion detection/prevention system |
| ISMS | information security management system |
| ITSM | IT service management |
| MCDM | multi-criteria decision-making |
| MEC | multi-access edge computing |
| MTTD | mean time to detect |
| MTTR | mean time to respond |
| NFV | network function virtualization |
| NMS | network management system |
| OAM | operations, administration and maintenance |
| OSS | operations support system |
| PAM | privileged access management |
| PLMN | public land mobile network |
| QoS | quality of service |
| RAN | radio access network |
| SAW | simple additive weighting |
| SBA | service-based architecture |
| SDN | software-defined networking |
| SEPP | security edge protection proxy |
| SIEM | security information and event management |
| SLA | service level agreement |
| SOAR | security orchestration, automation and response |
| SOC | security operations center |
| SUCI | subscription concealed identifier |
| UE | user equipment |
| VIKOR | multi-criteria optimization and compromise solution |
| WASPAS | weighted aggregated sum product assessment |
| WPM | weighted product model |
| WSM | weighted sum model |
References
- Ericsson. Ericsson Mobility Report; Ericsson: Stockholm, Sweden, 2026; Available online: https://www.ericsson.com/en/reports-and-papers/mobility-report (accessed on 6 August 2026).
- European Union Agency for Cybersecurity (ENISA). ENISA Threat Landscape for 5G Networks: Updated Threat Assessment for the Fifth Generation of Mobile Telecommunications Networks (5G); ENISA: Athens, Greece, 2020. [Google Scholar] [CrossRef]
- Sufi, F.; Alsulami, M. Mathematical Modeling and Clustering Framework for Cyber Threat Analysis Across Industries. Mathematics 2025, 13, 655. [Google Scholar] [CrossRef] [Scilit]
- Dias, J.; Pinto, P.; Santos, R.; Malta, S. 5G Network Slicing: Security Challenges, Attack Vectors, and Mitigation Approaches. Sensors 2025, 25, 3940. [Google Scholar] [CrossRef] [Scilit]
- AdaptiveMobile Security. A Slice in Time: Slicing Security in 5G Core Networks; Technical Report; AdaptiveMobile Security: Dublin, Ireland, 2021. [Google Scholar]
- 3GPP. Security Architecture and Procedures for 5G System; TS 33.501, Release 18; 3rd Generation Partnership Project: Sophia Antipolis, France, 2024. [Google Scholar]
- I, P.R.; Jain, K.; N, H.N.; N, S.S.; Krishnan, P. A Comprehensive Survey on 5G RedCap: Technologies, Security Vulnerabilities, and Attack Vectors. Future Internet 2026, 18, 118. [Google Scholar] [CrossRef] [Scilit]
- Zhao, L.; Oshman, M.S.; Zhang, M.; Moghaddam, F.F.; Chander, S.; Pourzandi, M. Towards 5G-ready Security Metrics. In Proceedings of the ICC 2021—IEEE International Conference on Communications, Montreal, QC, Canada, 14–23 June 2021. [Google Scholar] [CrossRef] [Scilit]
- Abdelrazek, L.; ElMalki, R.; Rebecchi, F.; Cho, D. Measuring Security in 5G and Future Networks. arXiv 2025, arXiv:2505.08799. [Google Scholar]
- European Parliament and Council of the European Union. Directive (EU) 2022/2555 of the European Parliament and of the Council of 14 December 2022 on Measures for a High Common Level of Cybersecurity across the Union (NIS 2 Directive). Off. J. Eur. Union 2022, L 333, 80–152. [Google Scholar]
- European Commission. Proposal for a Regulation on ENISA, the European Cybersecurity Certification Framework and ICT Supply Chain Security, and Repealing Regulation (EU) 2019/881; COM(2026) 11 final; European Commission: Brussels, Belgium, 2026. [Google Scholar]
- ISO/IEC 27001:2022; Information Security, Cybersecurity and Privacy Protection—Information Security Management Systems—Requirements. ISO: Geneva, Switzerland, 2022.
- ISO/IEC 27011:2024; Information Security, Cybersecurity and Privacy Protection—Information Security Controls Based on ISO/IEC 27002 for Telecommunications Organizations. ISO: Geneva, Switzerland, 2024.
- ISO/IEC 27004:2016; Information Technology—Security Techniques—Information Security Management—Monitoring, Measurement, Analysis and Evaluation. ISO: Geneva, Switzerland, 2016.
- Amirova, A.; Abdiraman, A.; Aldasheva, L.; Shayea, I.; Yedilkhan, D.; Tussupov, A. Data-Driven and Machine Learning-Based Analysis of Handover Behavior and Network Stability in Mobile Networks. Future Internet 2026, 18, 290. [Google Scholar] [CrossRef] [Scilit]
- Abdiraman, A.; Goranin, N.; Balevicius, S.; Nurusheva, A.; Tumasonienė, I. Application of Multicriteria Methods for Improvement of Information Security Metrics. Sustainability 2023, 15, 8114. [Google Scholar] [CrossRef] [Scilit]
- Culot, G.; Nassimbeni, G.; Podrecca, M.; Sartor, M. The ISO/IEC 27001 information security management standard: Literature review and theory-based research agenda. TQM J. 2021, 33, 76–105. [Google Scholar] [CrossRef] [Scilit]
- Svanadze, V.; Iavich, M.; Gnatyuk, S. Challenges and Solutions for Cybersecurity and Information Security Management in Organizations. In Proceedings of the CPITS-2024: Cybersecurity Providing in Information and Telecommunication Systems, Kyiv, Ukraine, 28 February 2024; CEUR Workshop Proceedings: Aachen, Germany, 2024. [Google Scholar]
- Gnatyuk, S.; Sydorenko, V.; Yudin, O.; Paziuk, A.; Polozhentsev, A. Experimental study of the model for calculating the quantitative criteria for assessing the security level of information and communication systems of the state critical infrastructure. In Proceedings of the CSDP—2024: Cyber Security and Data Protection, Lviv, Ukraine, 30 June 2024; CEUR Workshop Proceedings: Aachen, Germany, 2024. [Google Scholar]
- El Moutaouakil, S.; Lindström, J.; Andersson, K. Evaluating the Effectiveness of Information Security Management Systems: An Analysis Framework and Key Metrics. J. Cybersecur. Priv. 2026, 6, 73. [Google Scholar] [CrossRef] [Scilit]
- Grgurević, I.; Majić, D.; Malarić, T. Maintenance of Critical Telecommunication Infrastructure in Compliance with the NIS2 Directive: Challenges and Recommendations. Transp. Res. Procedia 2025, 91, 289–296. [Google Scholar] [CrossRef] [Scilit]
- Mentzelou, K.; Chountalas, P.; Kitsios, F.; Magoutas, A.; Dasaklis, T.K. Identifying and Modeling Barriers to Compliance with the NIS2 Directive: A DEMATEL Approach. J. Cybersecur. Priv. 2025, 5, 97. [Google Scholar] [CrossRef] [Scilit]
- Maček, D.; Magdalenić, I.; Begičević Ređep, N. A Systematic Literature Review on the Application of Multicriteria Decision Making Methods for Information Security Risk Assessment. Int. J. Saf. Secur. Eng. 2020, 10, 161–174. [Google Scholar] [CrossRef] [Scilit]
- Aggarwal, A.; Ansari, M.; Sharma, K. An integrated AHP–TOPSIS framework for optimal cybersecurity investment decision-making in enterprise environments. EDPACS 2026, 1–9. [Google Scholar] [CrossRef] [Scilit]
- Ighravwe, D.E.; Kokofi, C.; Ojo, O.; Babatunde, O.M.; Olanrewaju, O.A. A Fuzzy Multi-Criteria Decision Framework for Selecting Cybersecurity Platforms Under Strategic PESTEL Factors. Appl. Sci. 2026, 16, 6326. [Google Scholar] [CrossRef] [Scilit]
- OECD; European Commission Joint Research Centre. Handbook on Constructing Composite Indicators: Methodology and User Guide; OECD Publishing: Paris, France, 2008. [Google Scholar]
- Saisana, M.; Saltelli, A.; Tarantola, S. Uncertainty and Sensitivity Analysis Techniques as Tools for the Quality Assessment of Composite Indicators. J. R. Stat. Soc. Ser. A Stat. Soc. 2005, 168, 307–323. [Google Scholar] [CrossRef] [Scilit]
- Efron, B.; Tibshirani, R.J. An Introduction to the Bootstrap; Chapman & Hall: New York, NY, USA, 1993. [Google Scholar]
- 3GPP. Catalogue of General Security Assurance Requirements; TS 33.117, Release 18; 3rd Generation Partnership Project: Sophia Antipolis, France, 2024. [Google Scholar]
- Ahmad, I.; Kumar, T.; Liyanage, M.; Okwuibe, J.; Ylianttila, M.; Gurtov, A. Overview of 5G Security Challenges and Solutions. IEEE Commun. Stand. Mag. 2018, 2, 36–43. [Google Scholar] [CrossRef] [Scilit]
- ISO/IEC 27002:2022; Information Security, Cybersecurity and Privacy Protection—Information Security Controls. ISO: Geneva, Switzerland, 2022.
- Savola, R. Quality of security metrics and measurements. Comput. Secur. 2013, 37, 78–90. [Google Scholar] [CrossRef] [Scilit]
- Forsberg, J.; Frantti, T. Technical performance metrics of a security operations center. Comput. Secur. 2023, 135, 103529. [Google Scholar] [CrossRef] [Scilit]
- Gori, G.; Rinieri, L.; Melis, A.; Al Sadi, A.; Callegati, F.; Prandini, M. A Systematic Analysis of Security Metrics for Industrial Cyber–Physical Systems. Electronics 2024, 13, 1208. [Google Scholar] [CrossRef] [Scilit]
- Saaty, T.L.; Ozdemir, M.S. Why the Magic Number Seven Plus or Minus Two. Math. Comput. Model. 2003, 38, 233–244. [Google Scholar] [CrossRef] [Scilit]
- Miller, G.A. The Magical Number Seven, Plus or Minus Two: Some Limits on Our Capacity for Processing Information. Psychol. Rev. 1956, 63, 81–97. [Google Scholar] [CrossRef] [Scilit]
- Zavadskas, E.K.; Turskis, Z.; Antucheviciene, J.; Zakarevicius, A. Optimization of Weighted Aggregated Sum Product Assessment. Elektron. Elektrotech. 2012, 122, 3–6. [Google Scholar] [CrossRef] [Scilit]
- Munda, G.; Nardo, M. Noncompensatory/Nonlinear Composite Indicators for Ranking Countries: A Defensible Setting. Appl. Econ. 2009, 41, 1513–1523. [Google Scholar] [CrossRef] [Scilit]
- Mazziotta, M.; Pareto, A. On a Generalized Non-compensatory Composite Index for Measuring Socio-economic Phenomena. Soc. Indic. Res. 2016, 127, 983–1003. [Google Scholar] [CrossRef] [Scilit]
- Foster, J.; Greer, J.; Thorbecke, E. A Class of Decomposable Poverty Measures. Econometrica 1984, 52, 761–766. [Google Scholar] [CrossRef] [Scilit]
- Verizon Business. Global Private IP Service Level Agreement. Available online: https://www.verizon.com/business/service_guide/reg/cp/pip/plus/sla.htm (accessed on 2 August 2026).
- 3GPP. Service Requirements for the 5G System; Stage 1; TS 22.261, Release 18; 3rd Generation Partnership Project: Sophia Antipolis, France, 2024. [Google Scholar]
- Cybersecurity and Infrastructure Security Agency (CISA). Binding Operational Directive 19-02: Vulnerability Remediation Requirements for Internet-Accessible Systems; U.S. Department of Homeland Security: Washington, DC, USA, 2019. Available online: https://www.cisa.gov/binding-operational-directive-19-02 (accessed on 2 August 2026).
- PCI Security Standards Council. Payment Card Industry Data Security Standard: Requirements and Testing Procedures, Version 4.0.1; PCI SSC: Wakefield, MA, USA, 2024; Available online: https://www.pcisecuritystandards.org/document_library/ (accessed on 2 August 2026).
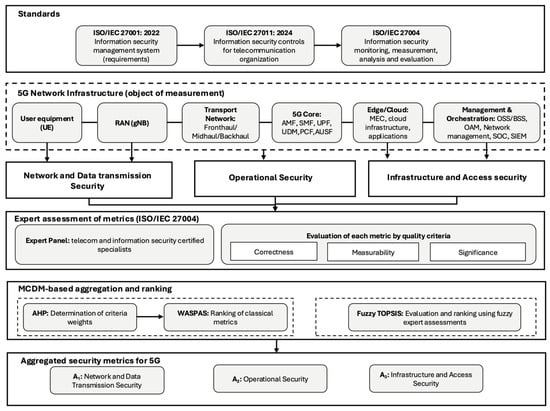
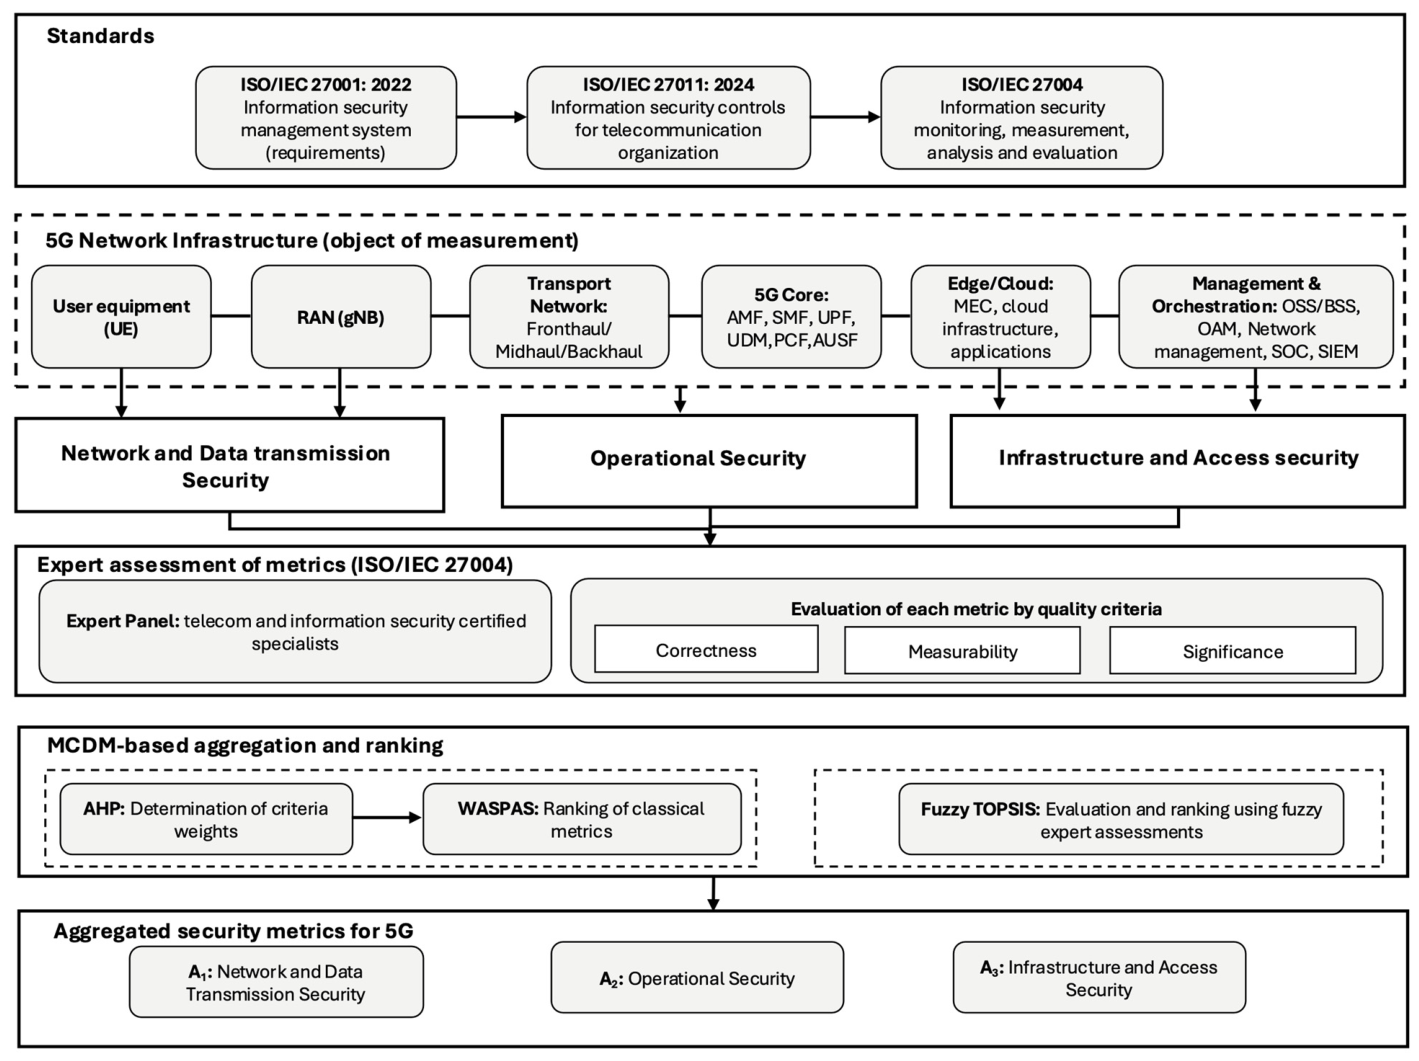


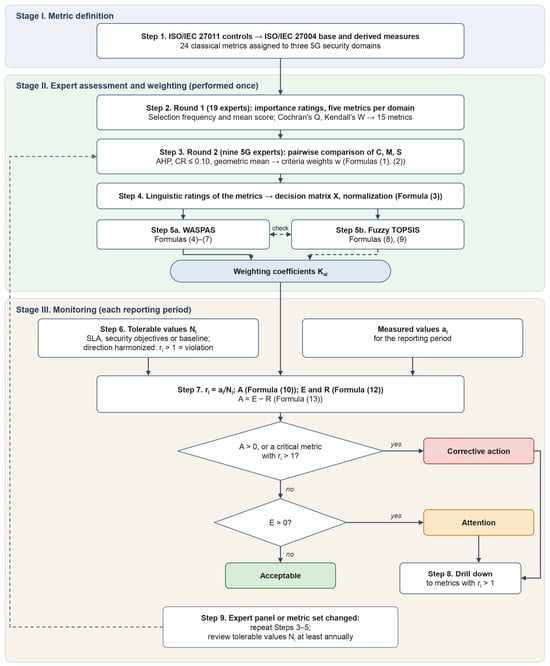
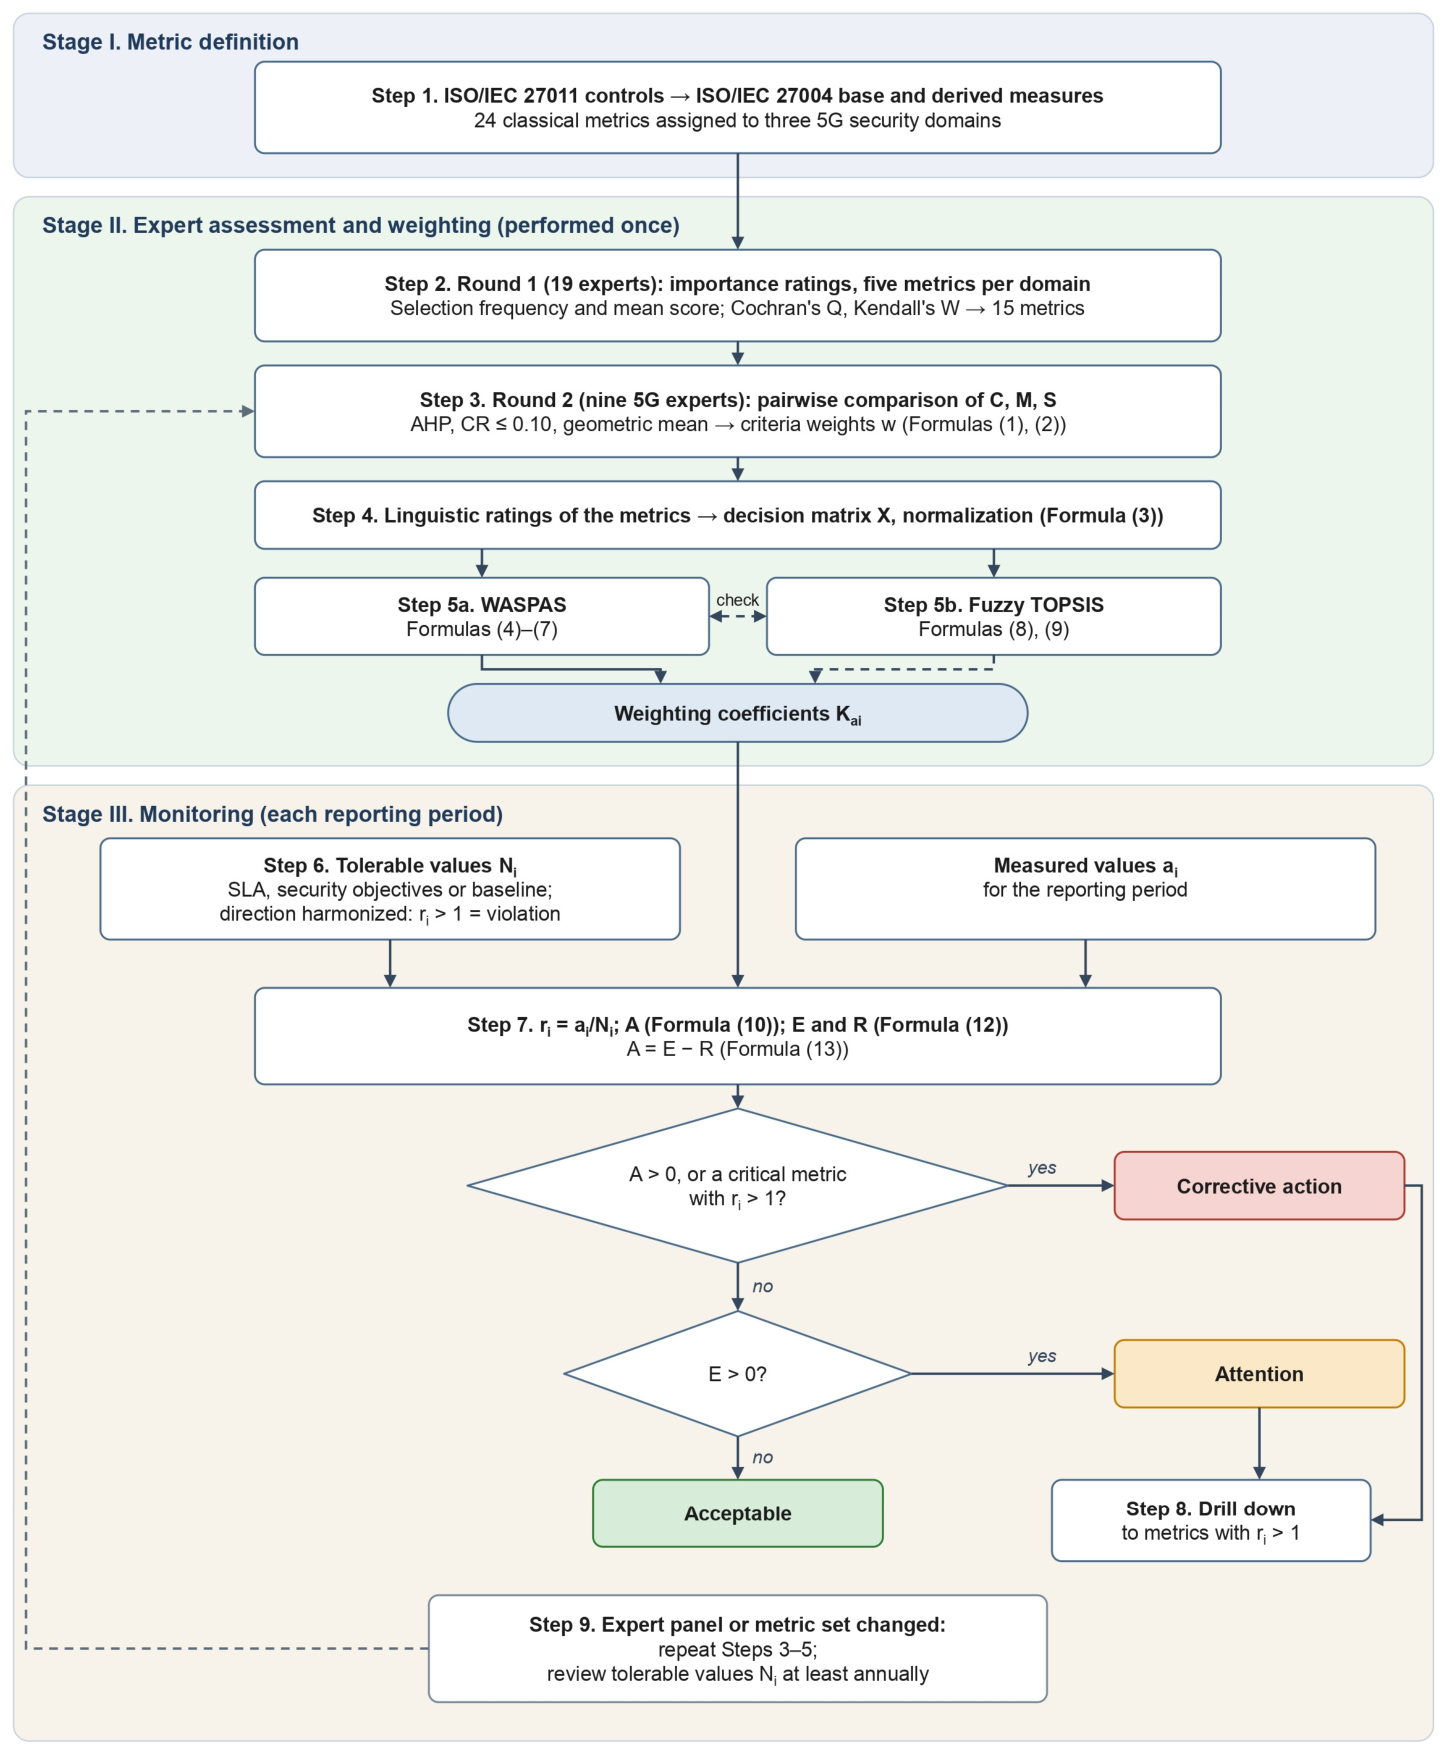

Disclaimer/Publisher’s Note: The statements, opinions and data contained in all publications are solely those of the individual author(s) and contributor(s) and not of MDPI and/or the editor(s). MDPI and/or the editor(s) disclaim responsibility for any injury to people or property resulting from any ideas, methods, instructions or products referred to in the content. |
© 2026 by the authors. Licensee MDPI, Basel, Switzerland. This article is an open access article distributed under the terms and conditions of the Creative Commons Attribution (CC BY) license.