


Abstract
This study investigates the ultimate bearing capacity of engineered bamboo columns of varying lengths under eccentric loading using a data-driven machine learning (ML) approach. Although previous studies have investigated engineered bamboo columns under axial or eccentric compression, few have systematically examined the combined effects of load eccentricity and column length. A database containing 432 records was established, with eccentricity, column length, cross-sectional area, compressive strength, and elastic modulus used as input features. Six tree-based ML algorithms were used to develop predictive models, all of which achieved satisfactory predictive accuracy. Shapley additive explanations analysis indicated that the trained random forest (RF) and extreme gradient boosting (XGBoost) models relied most strongly on eccentricity, followed by compressive strength, cross-sectional area, and column length, whereas elastic modulus made the smallest contribution within the range covered by the database. A new functional form was proposed for predicting the ultimate bearing capacity based on the eccentricity ratio, slenderness ratio, stability factor, compressive strength, and cross-sectional area. Two ML-assisted explicit models were developed using predictions generated by the trained RF and XGBoost models. Validation against both the developed database and an independent dataset showed that the explicit model derived from the XGBoost predictions achieved higher predictive accuracy than the RF-based model.
1. Introduction
In the context of global sustainable development, renewable materials with low environmental impact have attracted increasing attention in the construction industry [1,2,3]. Engineered bamboo has emerged as a promising construction material because of its excellent mechanical properties, environmental benefits, and the short growth cycle of bamboo [4,5,6,7]. Common types of engineered bamboo include laminated bamboo and bamboo scrimber [8,9,10], which are generally manufactured by laminating bamboo strips and densifying resin-impregnated bamboo fiber bundles, respectively [10,11]. Engineered bamboo combines high strength with a lower density than conventional construction materials such as concrete and steel and has therefore been increasingly used to manufacture structural members such as beams and columns [12,13].
In engineering applications, engineered bamboo columns are often subjected to eccentric compression [14,15]. Eccentric compression occurs when the line of action of the applied load does not coincide with the centroidal axis of the structural member, resulting in combined axial compression and bending. Under this loading condition, the stress state of the column depends not only on the applied load but also on its geometric characteristics and material properties. Compared with axial compression, eccentric compression produces a non-uniform stress distribution and an additional bending moment, which may increase lateral deformation and lead to material failure or structural instability [16]. Specifically, the side of an engineered bamboo column closer to the line of action of the eccentric load generally experiences higher compressive stress, whereas the opposite side experiences reduced compressive stress and may be subjected to tension when the eccentricity is sufficiently large. This non-uniform stress distribution influences the deformation response and may reduce the overall stability of the column.
When investigating the eccentric compression behavior of engineered bamboo columns, column length is also a crucial parameter. Variations in column length can significantly affect the ultimate bearing capacity and deformation characteristics [17]. For a given cross-sectional geometry, material properties, and load eccentricity, increasing the column length generally increases the slenderness ratio and susceptibility to lateral deformation [18,19]. The increased slenderness makes the column more susceptible to flexural instability, ultimately reducing its bearing capacity. However, many existing studies on eccentrically compressed engineered bamboo columns have not adequately considered the effect of column length, thereby limiting the generalizability of prediction models developed from the available experimental results. In particular, the combined effects of load eccentricity and slenderness ratio have not been systematically addressed.
Accurately predicting the eccentric compression behavior of engineered bamboo columns of different lengths is important for their structural design. Data-driven machine learning (ML) methods provide a useful approach for addressing this problem [20,21,22,23]. By learning from existing experimental data, ML models can capture complex nonlinear relationships among the input variables and support accurate prediction of the bearing capacity [24,25].
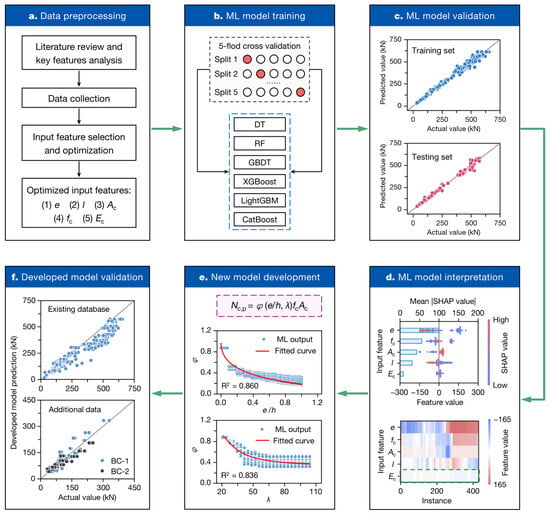
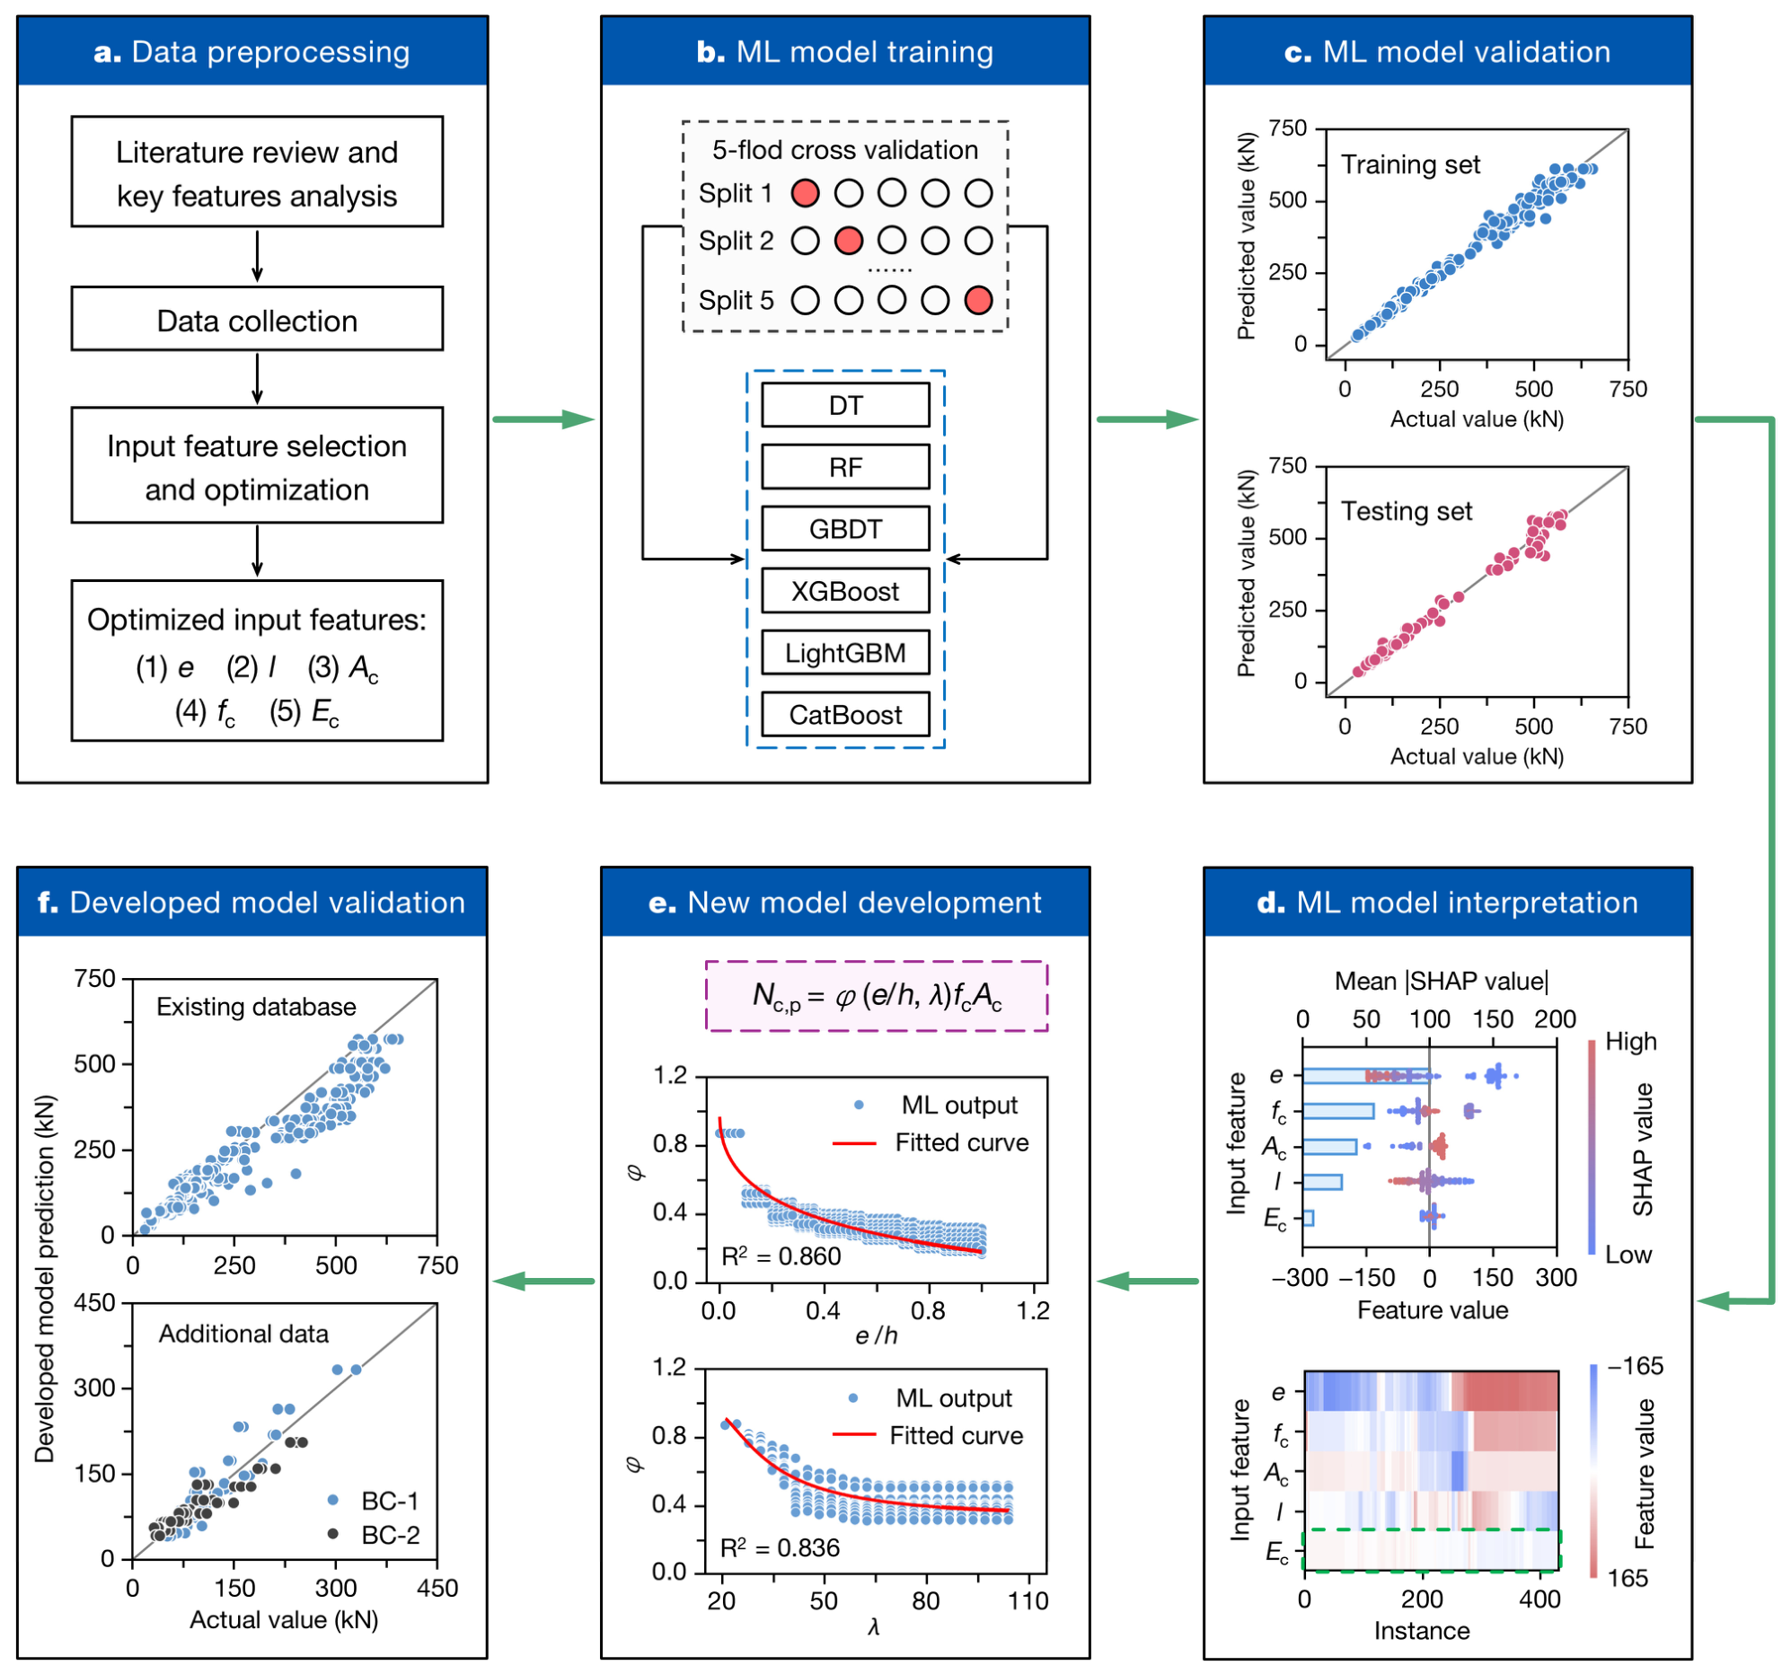
To address these research gaps, this study developed a data-driven framework for predicting the ultimate bearing capacity of engineered bamboo columns under eccentric loading, as illustrated in Figure 1. Unlike previous ML studies that focused primarily on predicting individual material or structural properties of engineered bamboo, the present study investigates the combined effects of load eccentricity and column length and further converts the ML-derived response trends into interpretable explicit formulations. A database comprising 432 reported and reconstructed records covering different eccentricities and column lengths was developed. Six tree-based algorithms, namely decision tree (DT), random forest (RF), gradient boosting decision tree (GBDT), extreme gradient boosting (XGBoost), light gradient boosting machine (LightGBM), and categorical boosting (CatBoost), were used to develop predictive models. Shapley additive explanations (SHAP) were employed to quantify the contribution of each input feature. Furthermore, a new functional form was developed based on the eccentricity ratio, slenderness ratio, stability factor, compressive strength, and cross-sectional area, while the effects of other material properties were represented by the fitted regression coefficients within the calibration range. Predictions from the trained RF and XGBoost models were used to develop two corresponding ML-assisted explicit models. Validation against the developed database and an independent dataset showed that the explicit model derived from the XGBoost predictions achieved higher predictive accuracy than the RF-based model.
Figure 1.
Overall workflow of developing ML models and ML-assisted explicit models.
2. Analysis of Input-Feature Relationships
2.1. Eccentric Compression Testing
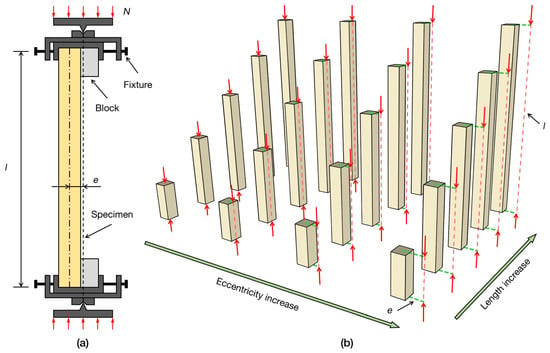
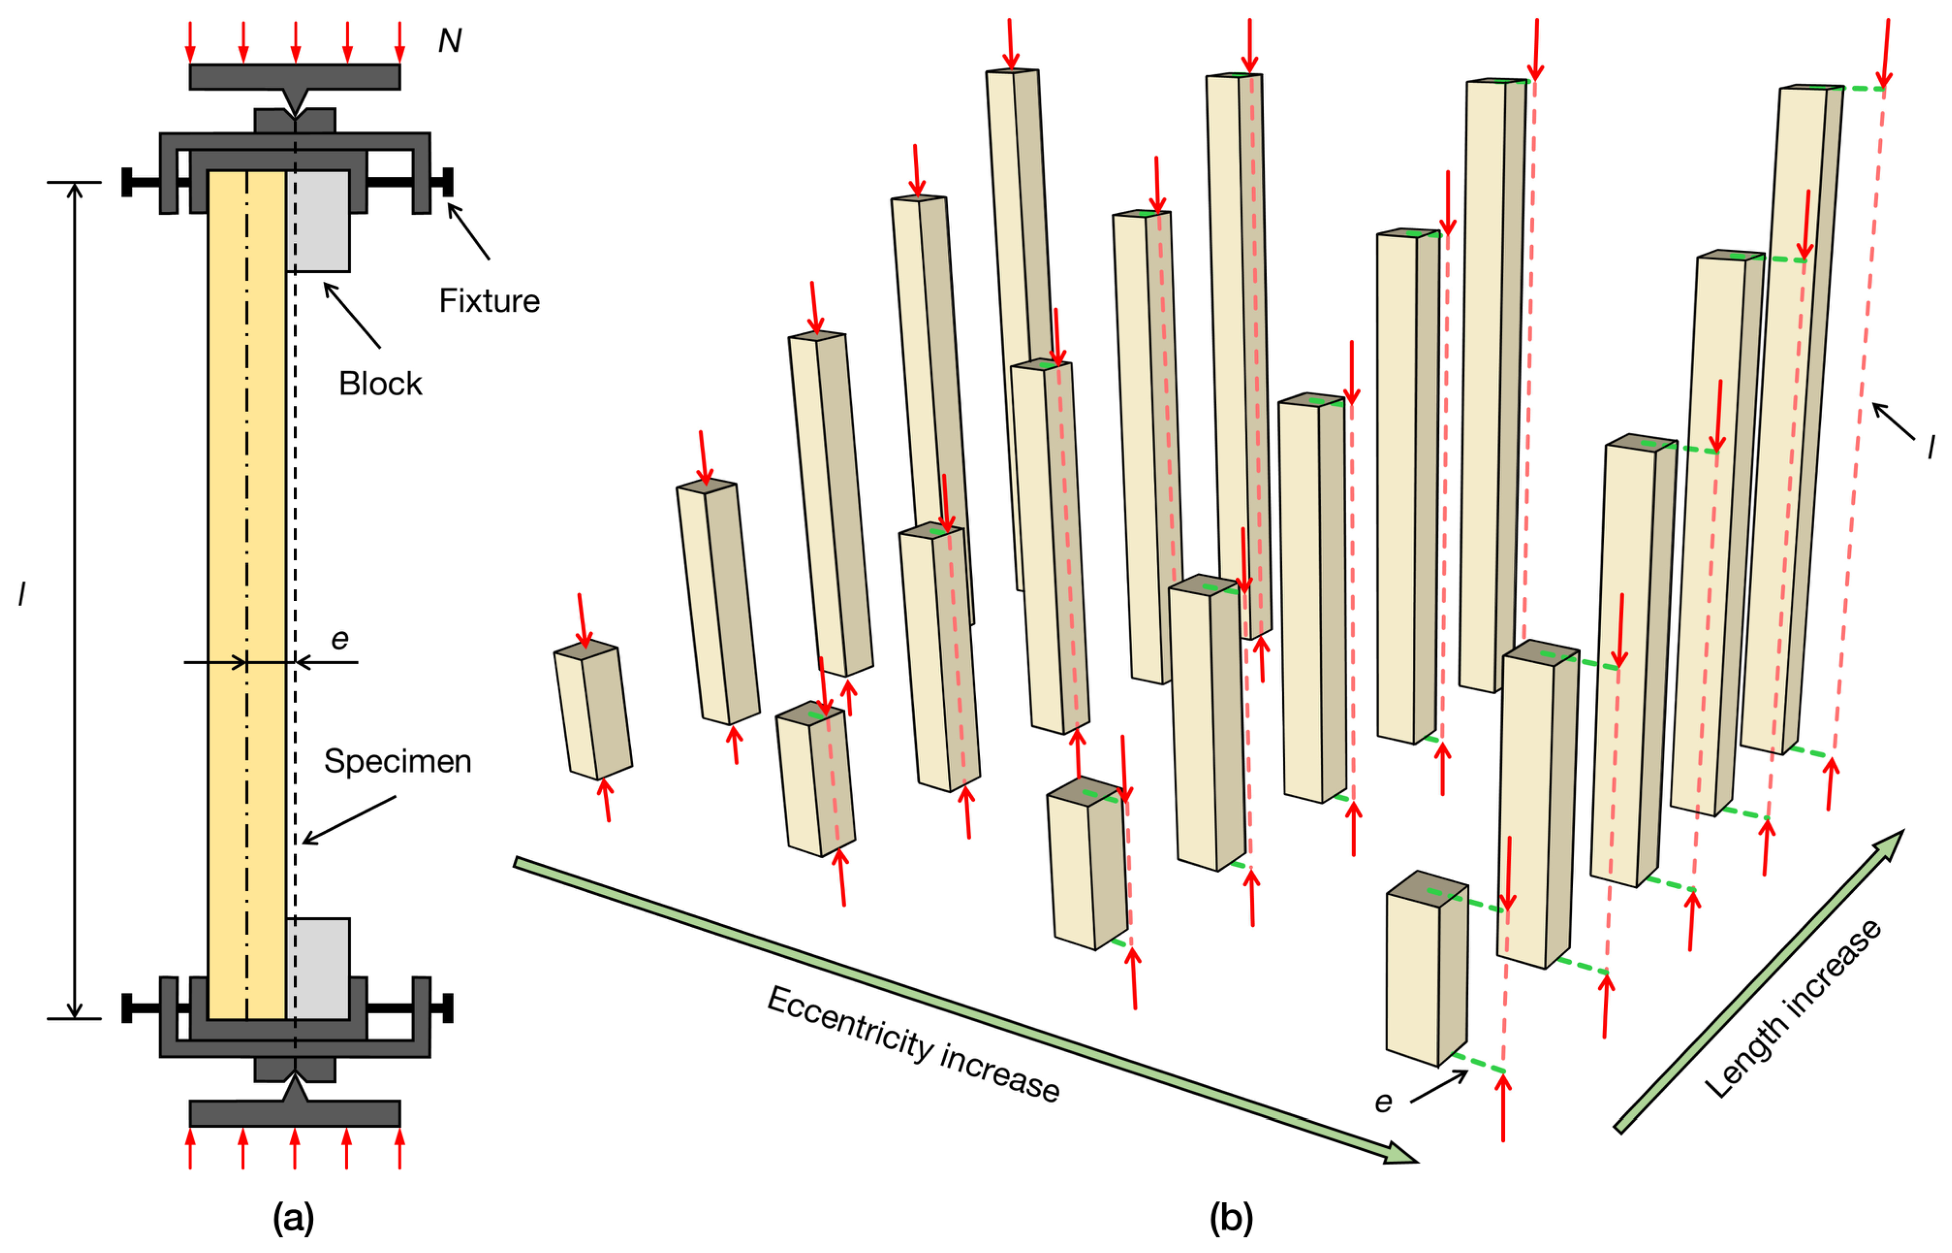
Figure 2a presents a typical test setup for eccentric compression [26,27]. The loading fixtures at both ends of the specimen incorporate hinged supports to transfer the eccentric compressive load (N) while allowing end rotation and lateral deflection in the plane of eccentricity. This setup approximates the mechanical behavior of pin-ended structural members under eccentric compression. Eccentric loading is achieved by adjusting the eccentricity (e), defined as the perpendicular distance between the load line of action, which passes through the center of the ball hinge, and the centroidal axis of the column specimen. For tests without an additional adjustment fixture for fine-tuning the eccentricity, Wei et al. [26] suggested that reliable eccentric loading could be achieved by aligning the center of the ball hinge with the centroid of the combined cross-section formed by the specimen and the bearing block (i.e., corbel). Moreover, specimens subjected to axial or eccentric compression are characterized by their length (l) and typically have square cross-sections, with the cross-sectional height (h) equal to the width (b). Figure 2b presents engineered bamboo column specimens of different lengths subjected to eccentric compression. Conducting a comprehensive experimental program covering different combinations of eccentricity and column length is costly and time-consuming. Consequently, existing experimental studies often focus on either eccentricity or column length. As a result, the combined effects of eccentricity and column length on the ultimate bearing capacity of engineered bamboo columns remain insufficiently understood.
Figure 2.
Compression test configurations for engineered bamboo columns: (a) typical test setup and (b) specimens of varying lengths subjected to eccentric compression.
2.2. Analysis of Parameter Relationships
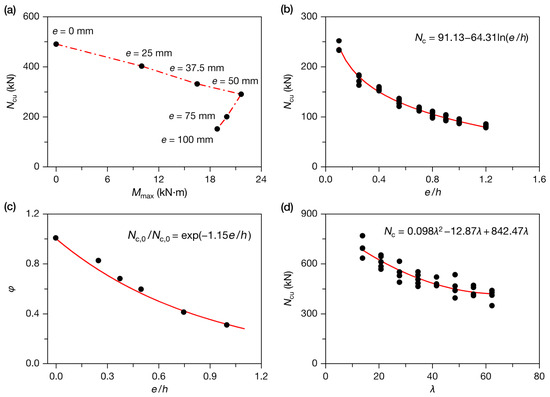
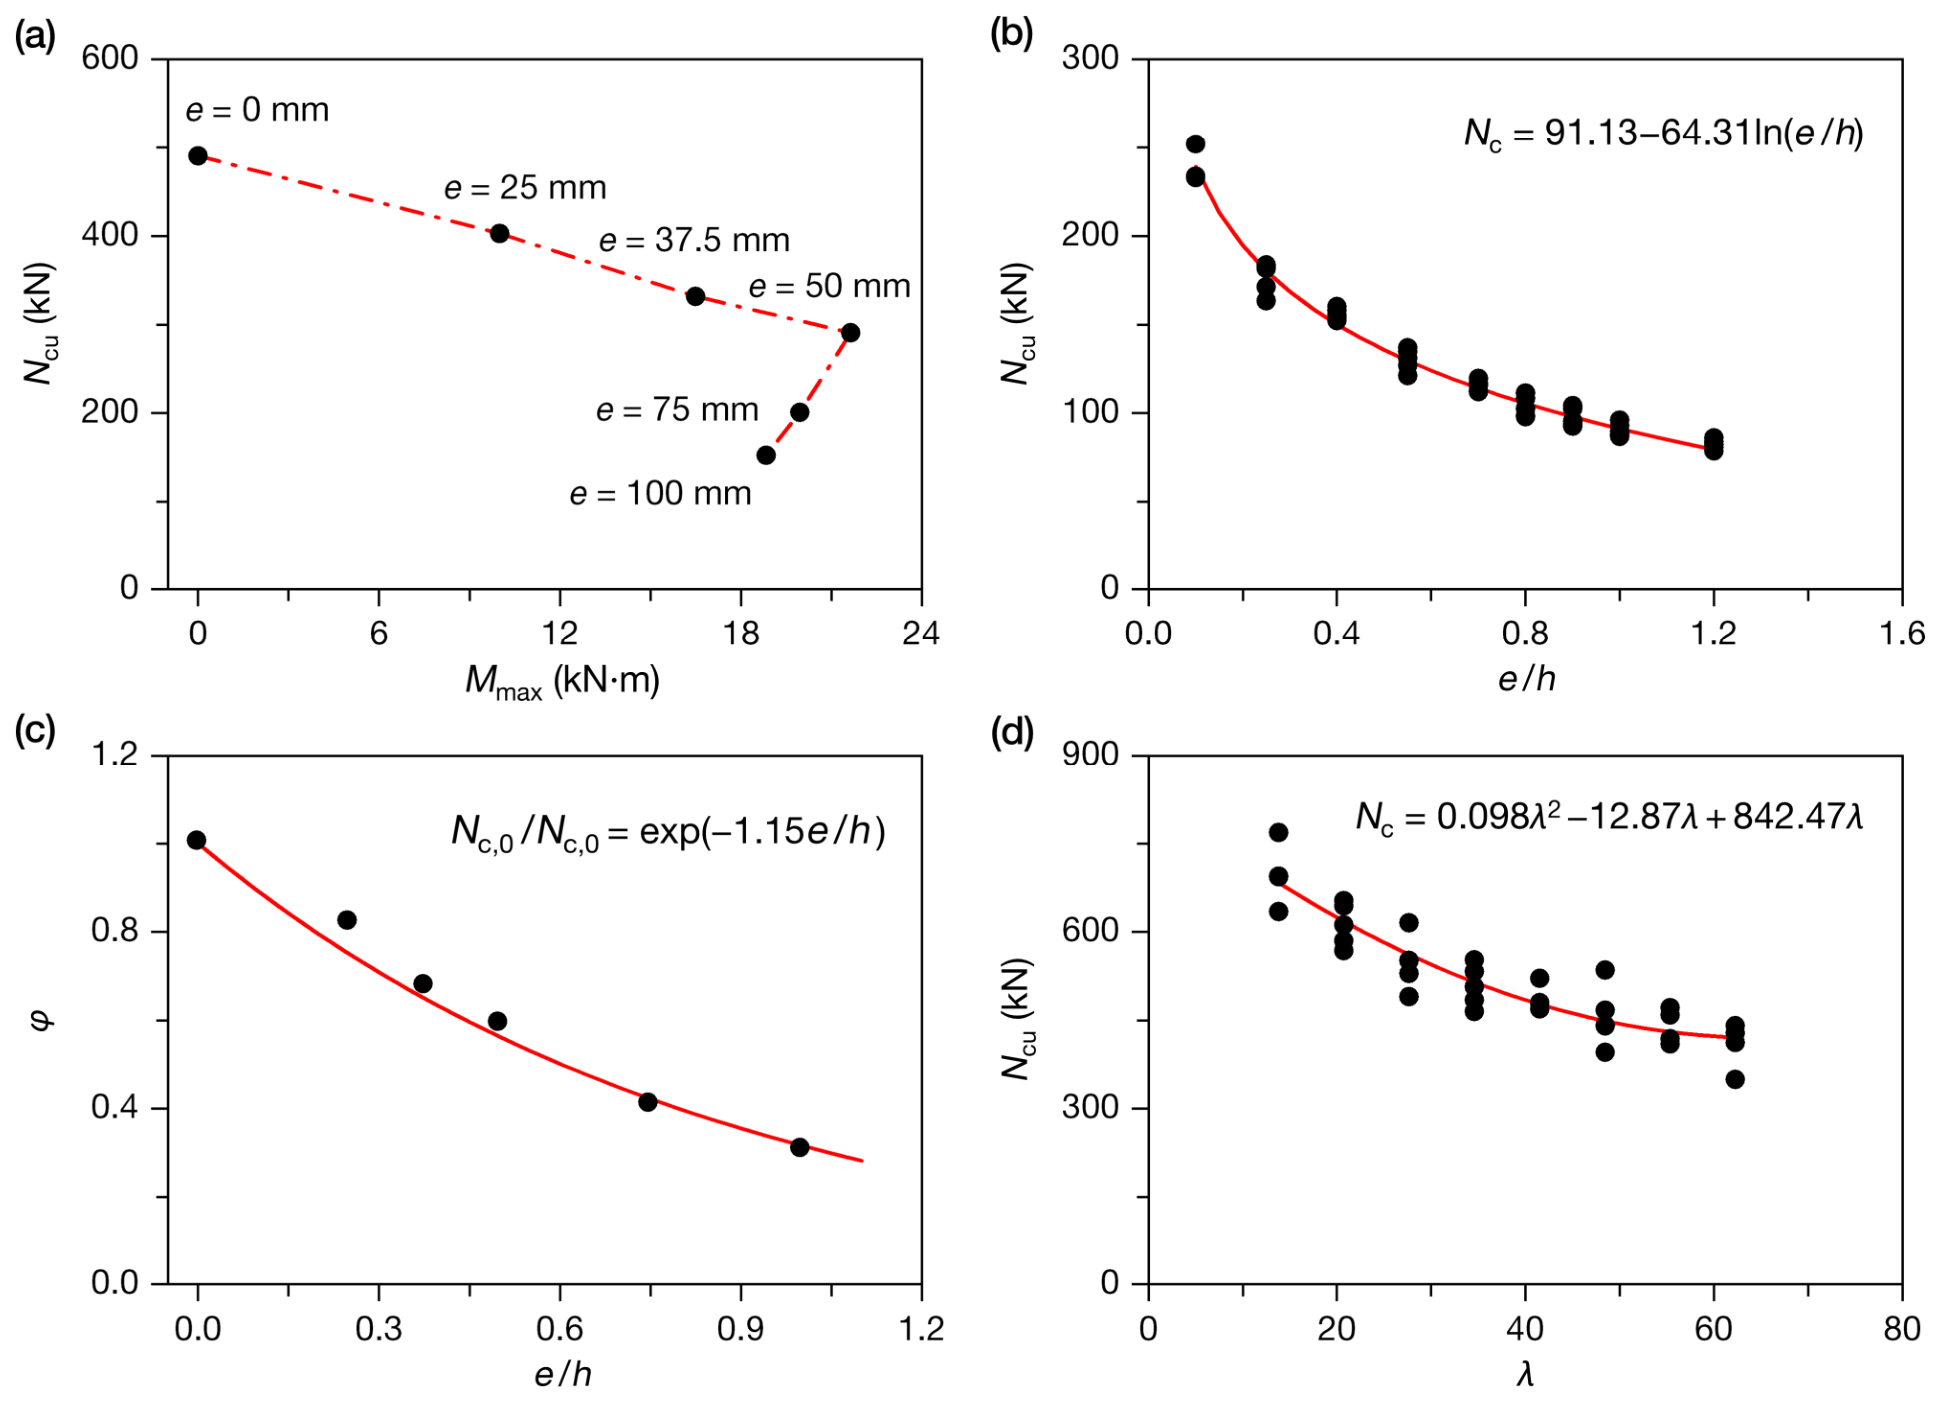
Although bamboo scrimber and laminated bamboo differ in their manufacturing processes and material structures, their differences are represented in the present analysis primarily through mechanical properties such as strength and modulus of elasticity. The effects of e and l on the compressive response were found to follow similar trends for both types of engineered bamboo. Taking bamboo scrimber as an example, the relationships among the key parameters were analyzed. Figure 3a presents the relationship between the maximum bending moment (Mmax) and ultimate bearing capacity (Ncu) of eccentrically loaded bamboo scrimber columns. As e increases, Ncu decreases continuously, whereas Mmax initially increases and then decreases. Specifically, Mmax increases as e increases from 0 mm to 50 mm but decreases as e increases from 50 mm to 100 mm, indicating different response characteristics in the lower and higher eccentricity ranges. Figure 3b,c show the influence of the eccentricity ratio (e/h) on Ncu and the stability factor (φ), respectively. φ is defined as the ratio of the ultimate bearing capacity to the nominal axial compressive capacity. Both Ncu and φ decrease gradually as e/h increases. However, Ncu decreases more rapidly at low e/h values. In addition, under axial compression, the Ncu of bamboo scrimber columns decreases gradually as the slenderness ratio (λ) increases. In summary, geometric parameters such as e, h, and l, together with the mechanical properties of the material, are key factors influencing the ultimate bearing capacity of engineered bamboo columns. These observed relationships provided a basis for selecting the input variables of the ML models and formulating the explicit models.
Figure 3.
Bearing capacity analysis of bamboo scrimber columns: (a) relationship between Mmax and Ncu under eccentric compression [26], (b) relationship between e/h and Ncu under eccentric compression [28], (c) relationship between e/h and φ under eccentric compression [26], and (d) relationship between λ and Ncu under axial compression [29].
3. ML Modeling for Ultimate Bearing Capacity
3.1. Data Overview
A database containing 432 records was compiled from Refs. [26,27,28,29,30,31,32,33,34,35,36]. The database was randomly divided at the sample level into a training set containing 80% of the records and a test set containing the remaining 20%, using a random seed of 42. The compressive strength (fc) and modulus of elasticity (Ec) were selected as input features because of their physical relevance to Ncu of engineered bamboo columns, consistent with the governing parameters used in the Ylinen model [37], the Rankine–Gordon model [38], and the Euler critical load model [39]. To maintain consistency in specimen geometry, reinforcement conditions, and end restraints, specimens with chamfers, bonded fiber-reinforced polymer reinforcement, or end conditions other than hinged supports at both ends were excluded from the database.
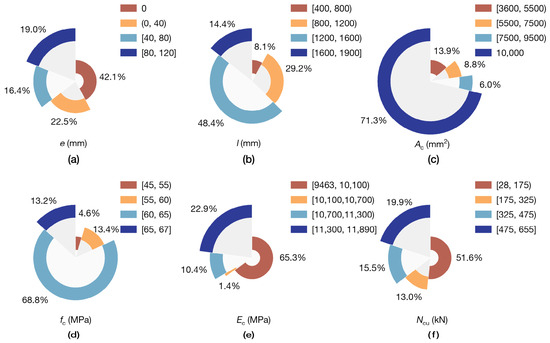
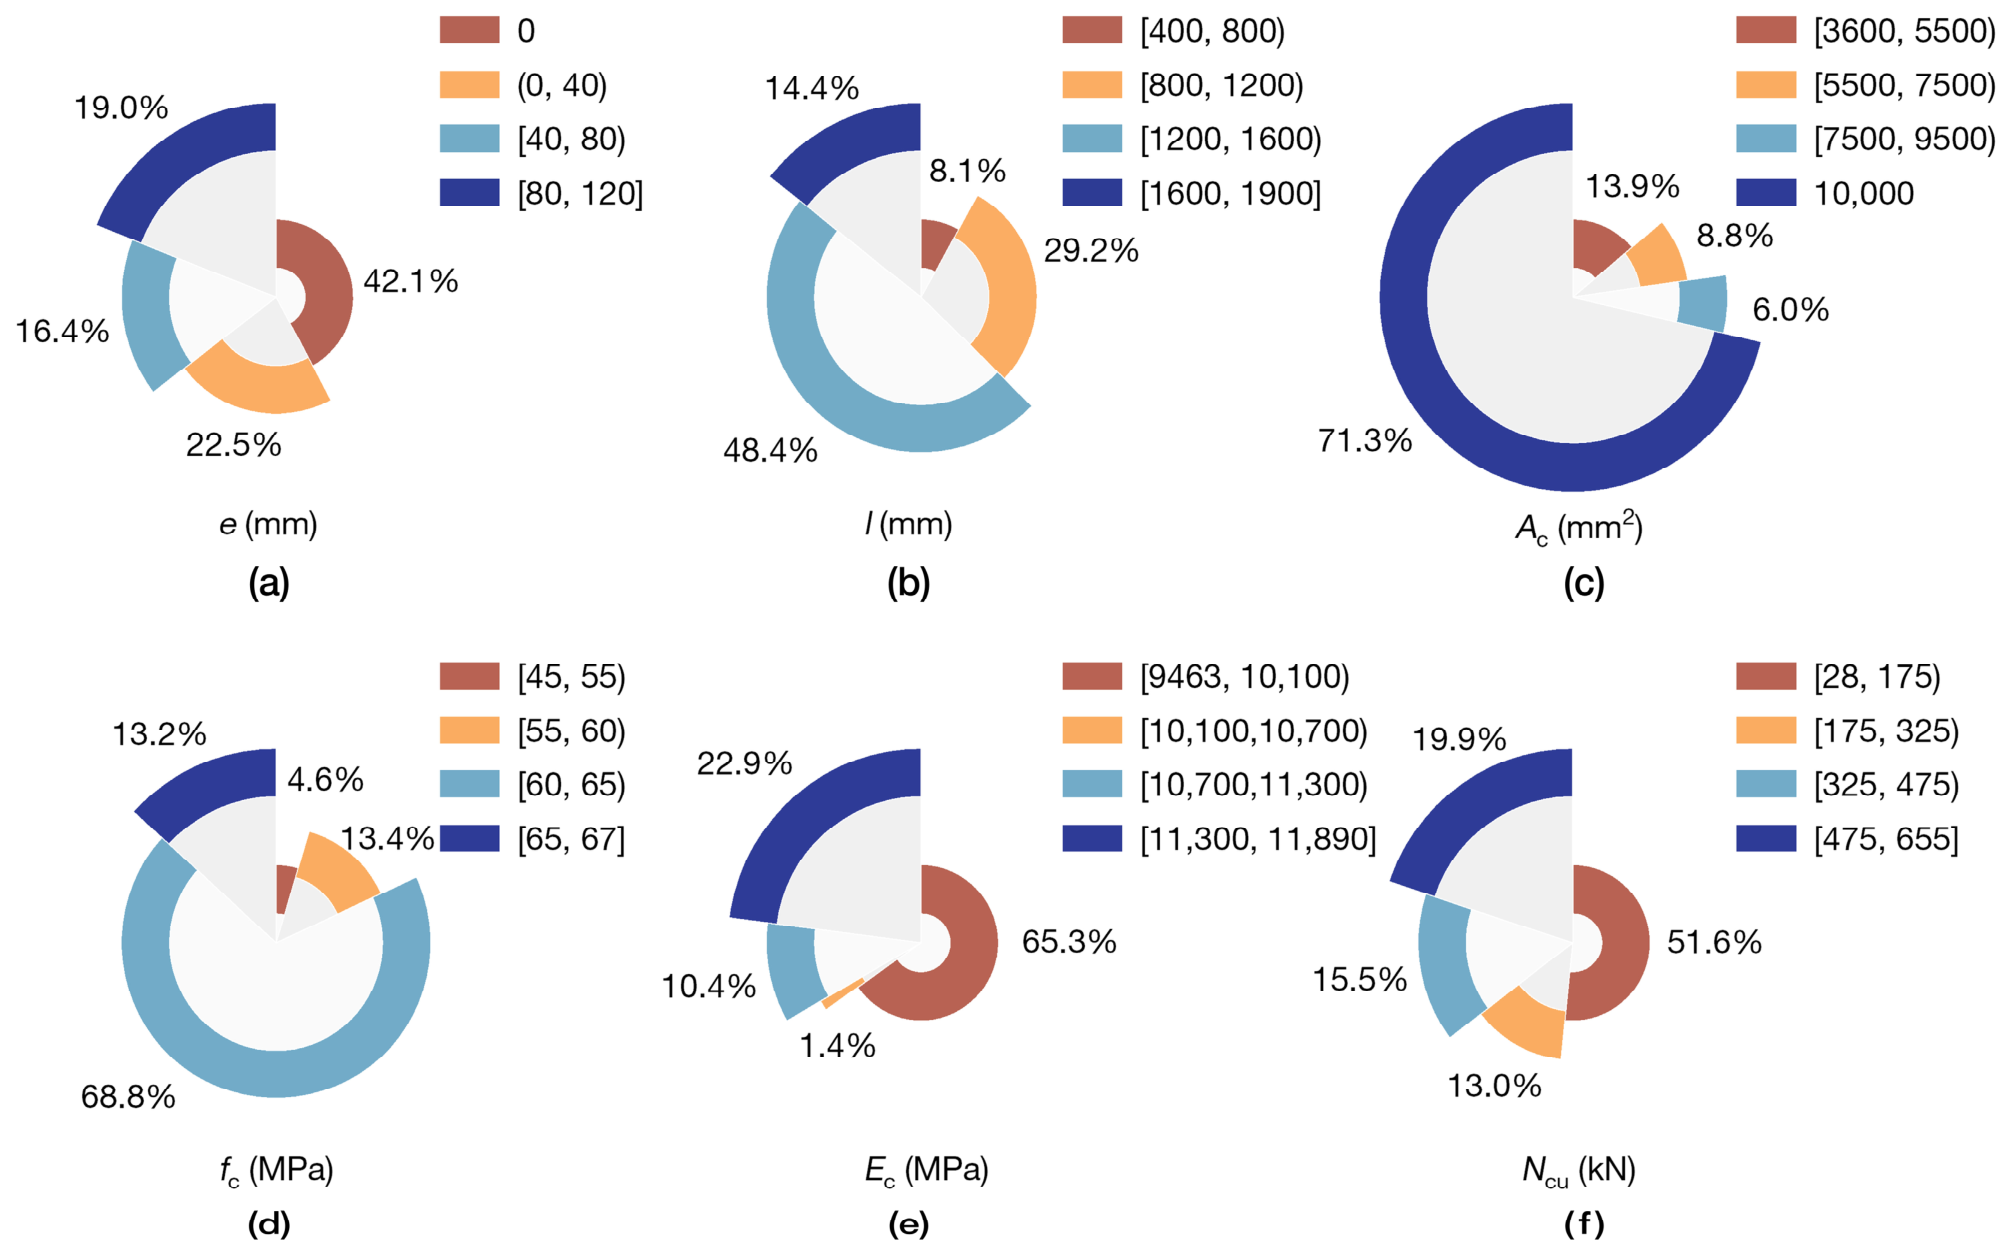
The distributions of the preliminarily selected variables in the developed database, including e, l, Ac, fc, Ec, and Ncu, are presented in Figure 4. Other potential input features, such as density, moisture content, and additional mechanical properties, were excluded to limit model complexity and potential redundancy among the input variables. The final feature set was also selected to facilitate the development of explicit models based on the ML predictions.
Figure 4.
Distributions of the input features and output variable in the developed database: (a) eccentricity, (b) column length, (c) cross-sectional area, (d) compressive strength, (e) modulus of elasticity, and (f) ultimate bearing capacity.
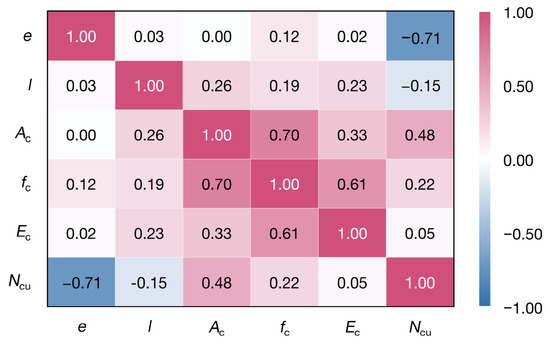
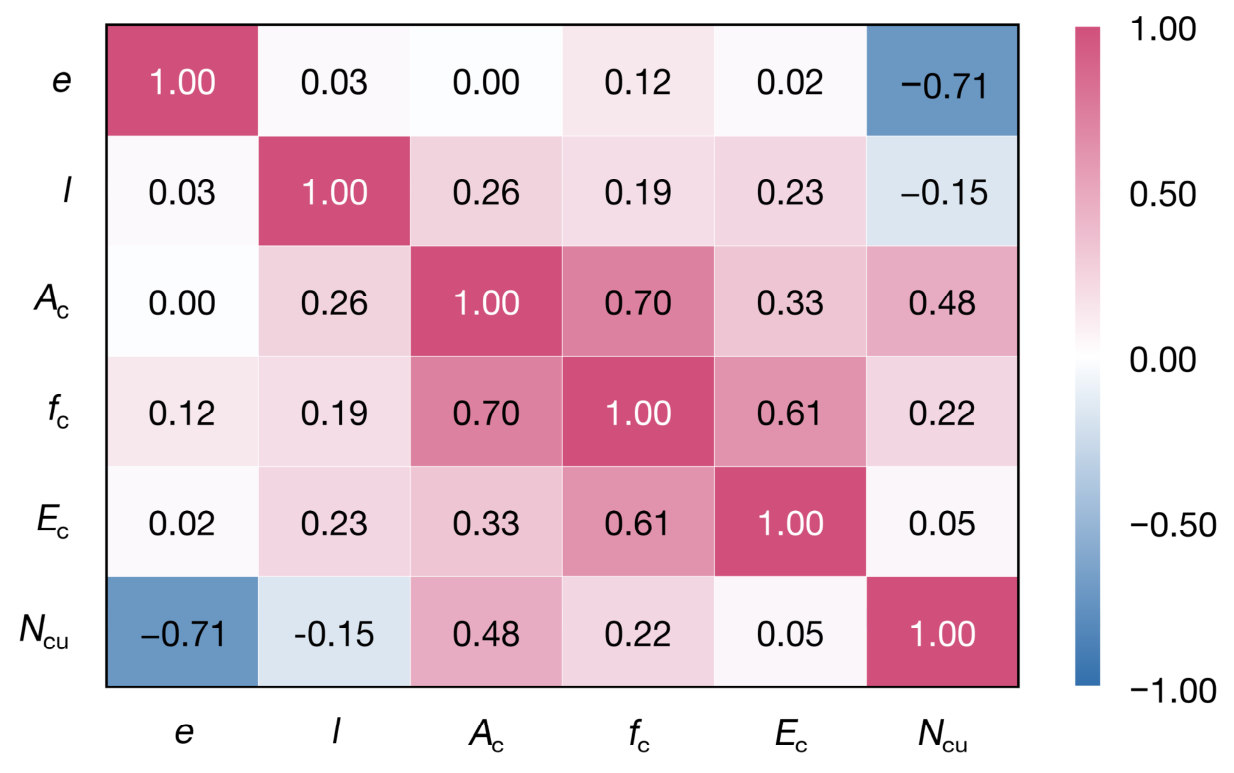
Figure 5 presents a heatmap of the correlations among the input and output variables, in which the Pearson correlation coefficients between some input features exceed 0.5. To examine multicollinearity among the input features, the variance inflation factor (VIF) method was employed. The VIF values for the input features e, l, Ac, fc, and Ec were 1.04, 1.11, 2.17, 3.04, and 1.72, respectively, all of which were below 5. Therefore, no substantial multicollinearity was detected among the selected input features.
Figure 5.
Heatmap based on the Pearson correlation coefficient.
3.2. ML Algorithms Used
Decision tree (DT), random forest (RF), gradient boosting decision tree (GBDT), extreme gradient boosting (XGBoost), light gradient boosting machine (LightGBM), and categorical boosting (CatBoost) algorithms were employed to develop ML models for Ncu prediction. The DT model splits the data based on feature thresholds, forming a tree-like structure in which each terminal leaf provides a predicted value. It is simple, easy to interpret, and suitable for both classification and regression tasks [40]. The RF model builds an ensemble of decision trees using random subsets of data and features to improve predictive performance [41]. By averaging the predictions of multiple trees, RF can improve generalization and reduce overfitting compared with a single decision tree. GBDT is an ensemble method that builds decision trees sequentially, with each new tree fitted to the residual errors of the preceding ensemble. It is effective for capturing complex patterns but can be computationally intensive [42]. XGBoost enhances GBDT by introducing regularization, parallel processing, and system optimization techniques to improve both speed and accuracy [43]. LightGBM uses histogram-based algorithms and a leaf-wise growth strategy to accelerate training and reduce memory usage [44]. It is highly efficient for large-scale datasets and supports the native handling of categorical features. CatBoost employs ordered boosting to reduce prediction bias and the risk of overfitting [45]. Although CatBoost supports categorical features, this capability was not used because all input features in the present study were numerical. Because all six algorithms were tree-based, feature scaling was not required. The parameter settings of the six ML models are summarized in Table 1.
Table 1.
Parameter settings of ML models.
3.3. Evaluation Metrics
The coefficient of determination (R2), root mean square error (RMSE), and mean absolute error (MAE) were used to quantitatively assess the performance of the prediction models:
where is the actual value; is the predicted value; is the average of all actual observed values; and is the number of observations. RMSE and MAE are reported in kN throughout the following sections.
4. Evaluation of ML Predictions
4.1. ML Models
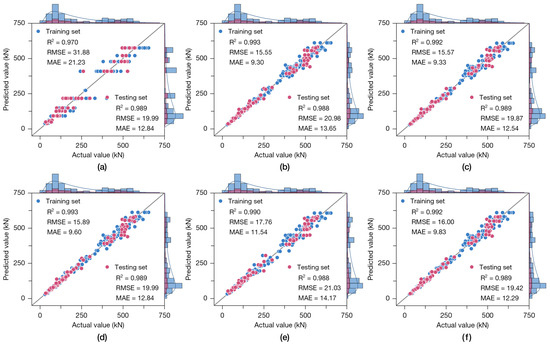
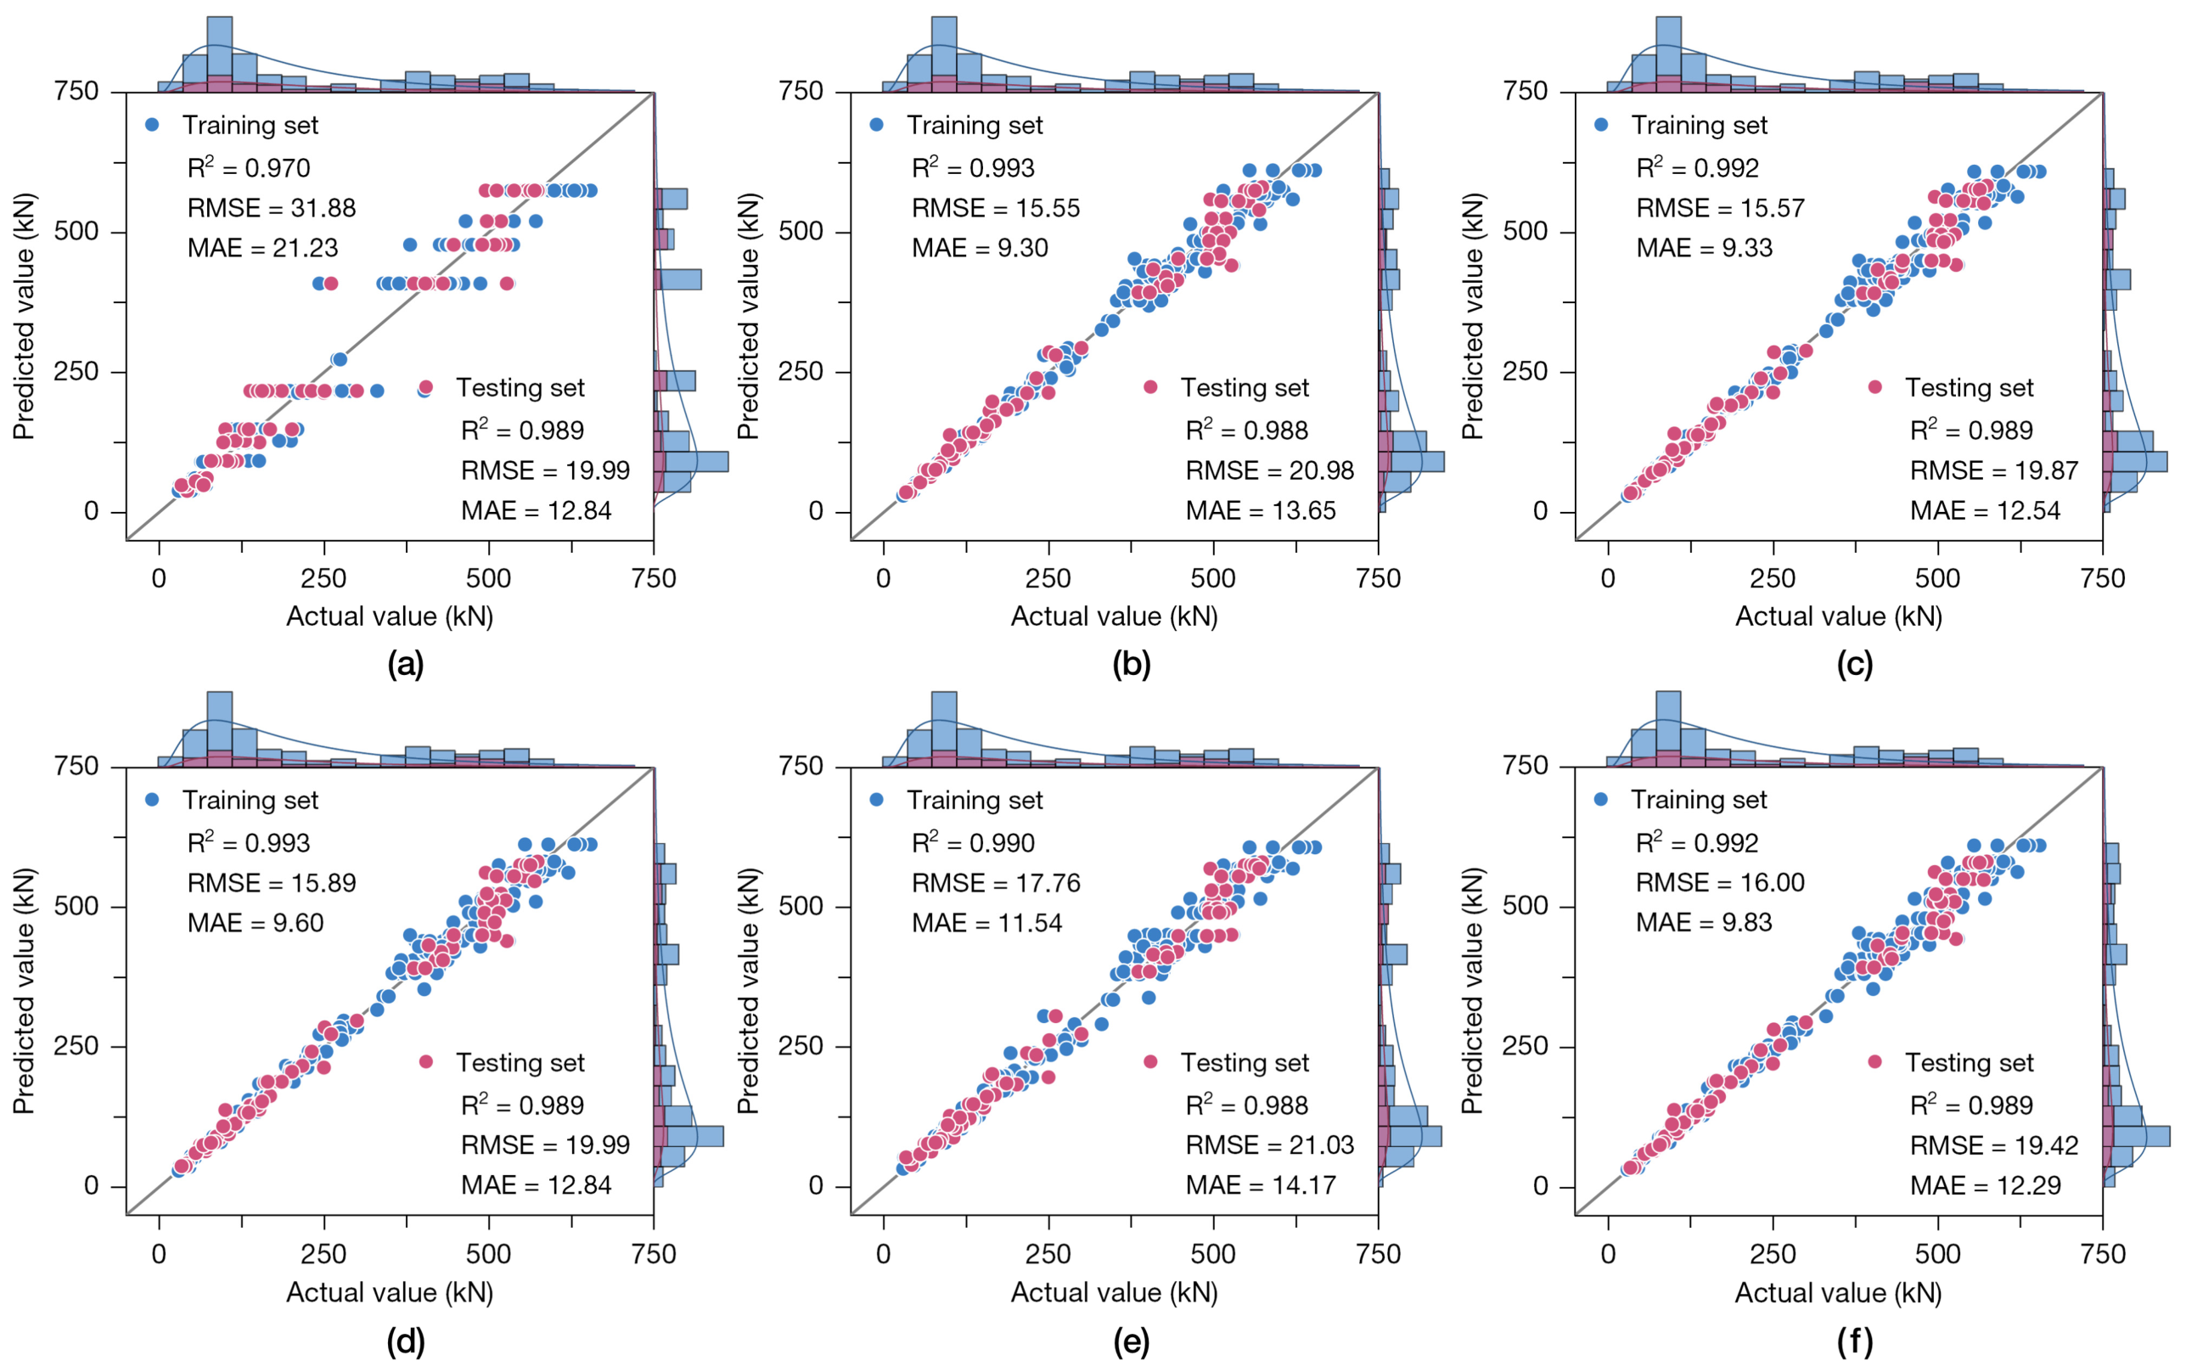
Figure 6 presents the prediction results of the DT, RF, GBDT, XGBoost, LightGBM, and CatBoost models on both the training and testing sets. In terms of the evaluation metrics, all six models demonstrated satisfactory predictive performance. Moreover, the comparable performance on the training and testing sets indicates that the models generalized consistently under the adopted random sample-level split within the developed database. However, this result does not demonstrate study-wise generalization to unseen experimental sources.
Figure 6.
Evaluation of ML model prediction performance: (a) DT model, (b) RF model, (c) GBDT model, (d) XGBoost model, (e) LightGBM model, and (f) CatBoost model.
4.2. Model Interpretations
This section interprets the ultimate bearing capacity predictions of the RF and XGBoost models using TreeSHAP [46]. TreeSHAP leverages the structure of tree-based models to efficiently calculate the contribution of each input feature to individual predictions.
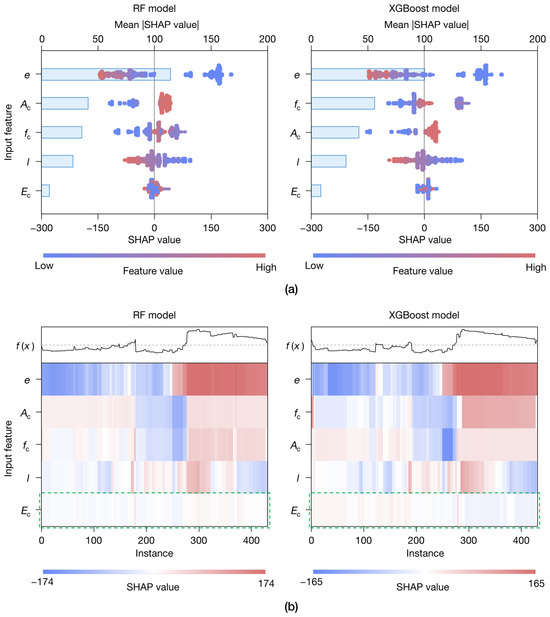
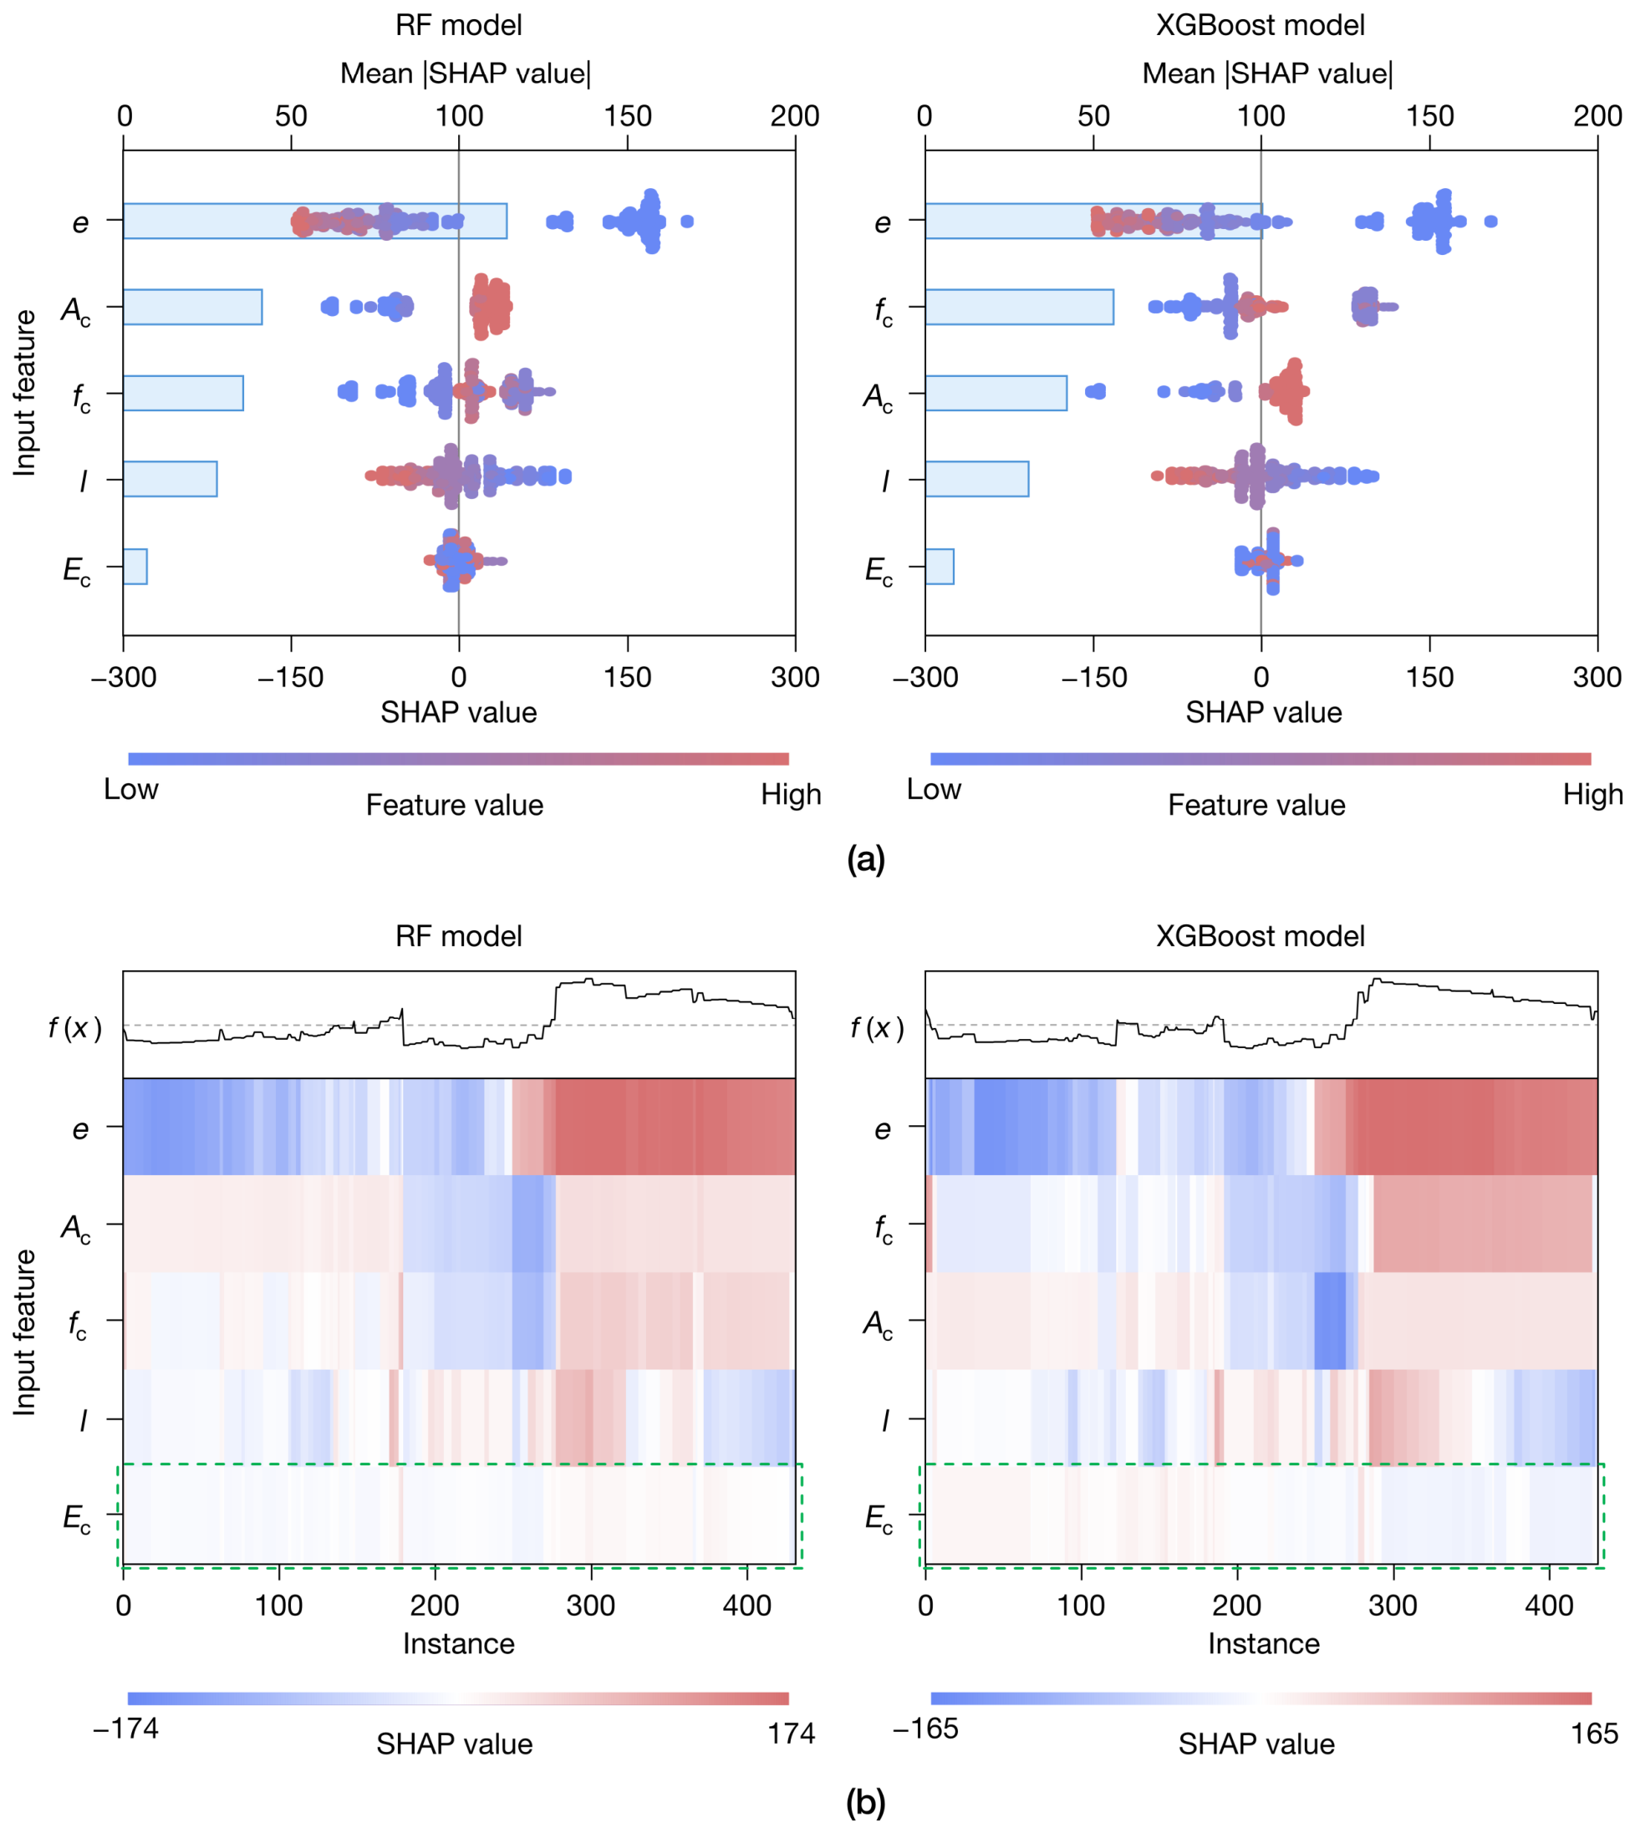
Figure 7a presents the mean absolute SHAP values and individual SHAP values for each input feature based on the RF and XGBoost models. In both models, the mean absolute SHAP value for e was the highest. The values for fc and Ac were lower than that for e but relatively close to each other. l ranked next, while Ec had the lowest mean absolute SHAP value. The individual SHAP value plots further illustrate the direction and distribution of the effects of the input features. Each dot represents one sample and is colored according to the value of the corresponding input feature, ranging from low (blue) to high (red). The horizontal position represents the SHAP value, while the vertical stacking reflects the density of samples with similar SHAP values. For both models, the SHAP values generally increased as e and l decreased. In contrast, the SHAP values generally increased with increasing fc and Ac. For Ec, the SHAP values were concentrated within a relatively narrow range, with no clear color gradient observed in either model. Therefore, the low SHAP importance of elastic modulus should be interpreted only within the range and distribution represented in the current database and should not be regarded as evidence of its generally negligible mechanical effect.
Figure 7.
Interpretability analysis of the RF and XGBoost models using SHAP: (a) mean absolute SHAP values and SHAP values for each input feature and (b) heatmap of the SHAP values for all input features.
As shown in Figure 7b, the row corresponding to Ec in the heatmap displayed very light shading (indicated by the green box), further indicating its limited contribution to the model predictions across the entire dataset. A potential explanation is the relatively narrow range of Ec in the database, which varied from approximately 9500 MPa to 12,000 MPa for bamboo scrimber and laminated bamboo. Although the modulus of elasticity is theoretically important for column stability, its limited variation in the present database may have restricted the contribution captured by the models, resulting in a lower mean absolute SHAP value.
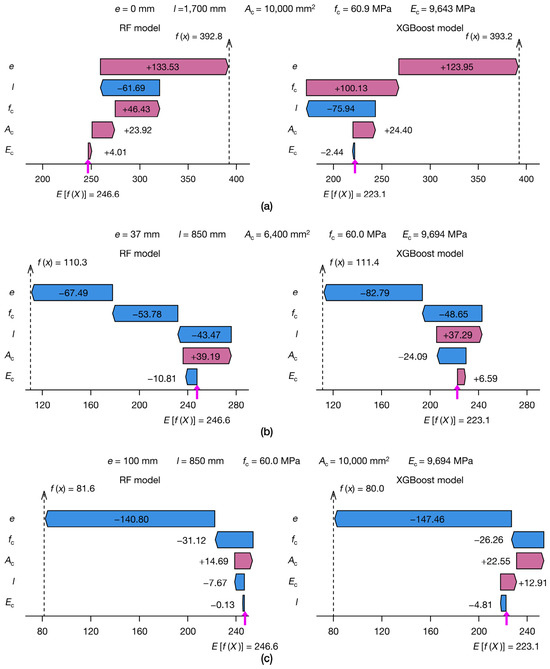
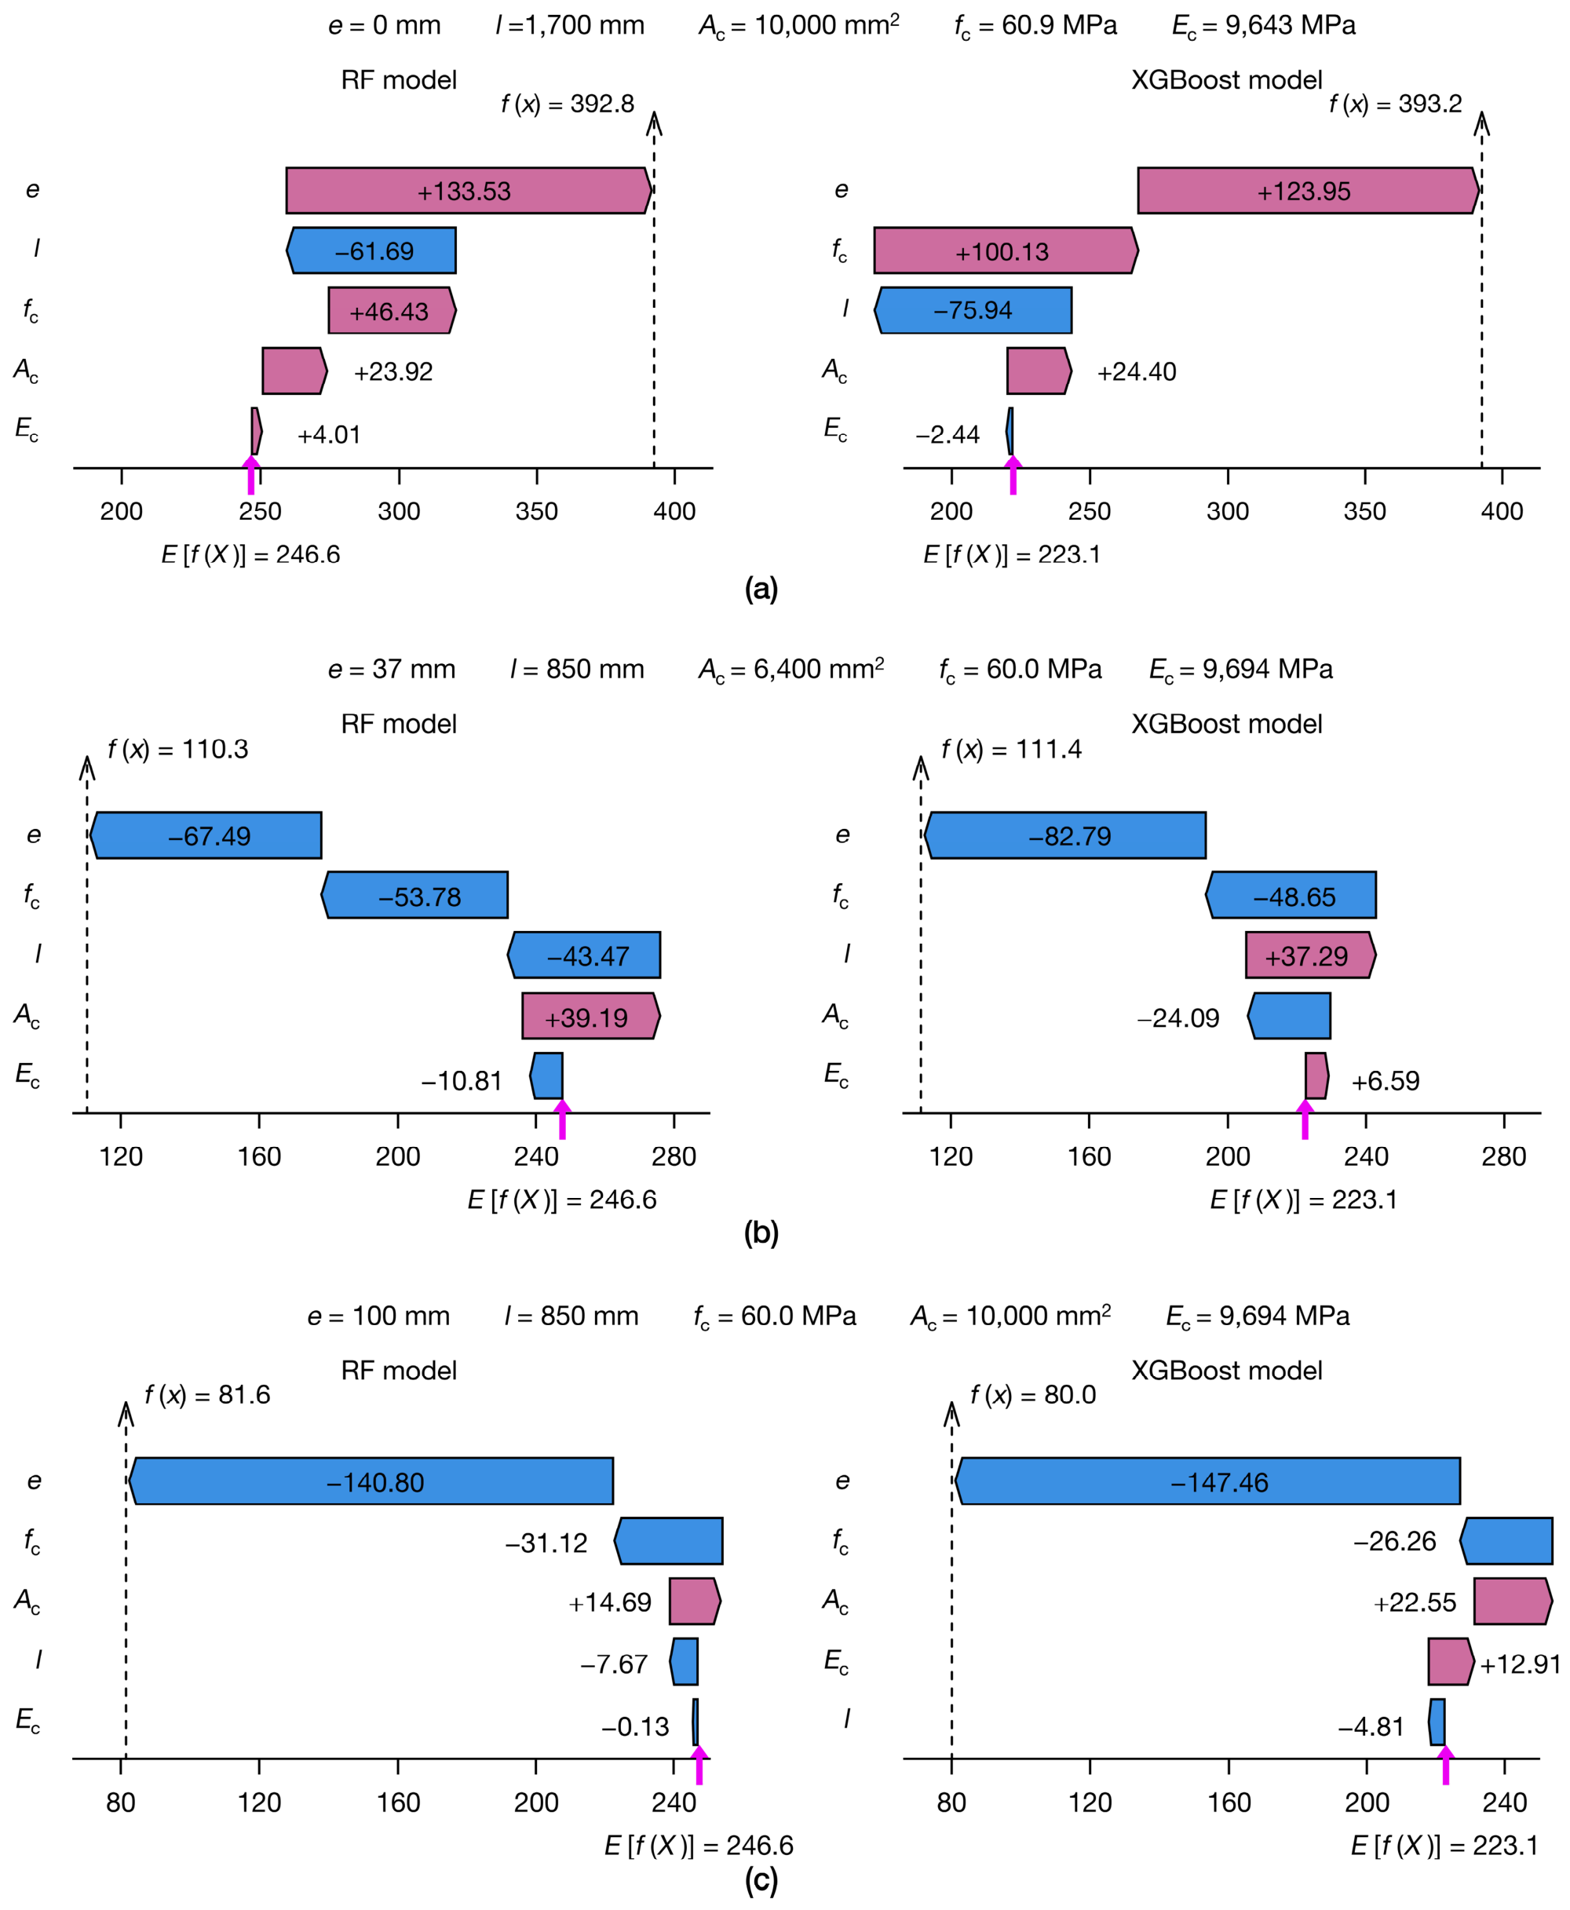
Three specimens were randomly selected from the test set to illustrate the prediction processes of the RF and XGBoost models, as shown in Figure 8. E[f(X)] and f(x) represent the expected model output over the background data and the prediction for a specific input x, respectively.
Figure 8.
Individual interpretations of selected specimens based on the RF and XGBoost models using SHAP: (a) selected specimen-1, (b) selected specimen-2, and (c) selected specimen-3.
In different specimens and ML models, the influence of input features varied, but e generally made the largest contribution to the predicted Ncu. Specifically, taking the SHAP output of the XGBoost model as an example, the e values of specimens 1–3 were 0 mm, 37 mm, and 100 mm, respectively, with corresponding SHAP contributions of +123.95 kN, −82.79 kN, and −147.46 kN. The contributions of the remaining input features differed among the specimens. For instance, in the SHAP output of the XGBoost model, the l values of selected specimens 1–3 were 1700 mm, 850 mm, and 850 mm, respectively, with corresponding SHAP contributions of −75.94 kN, +37.29 kN, and −4.81 kN. A negative SHAP value indicated that the corresponding feature lowered the predicted ultimate bearing capacity relative to the model baseline for the specific specimen. In mechanical terms, a larger eccentricity increased the additional bending moment and aggravated the non-uniform stress distribution in the section, whereas a larger length increased the slenderness ratio and the tendency toward instability. Therefore, negative SHAP values for eccentricity and length were consistent with their adverse effects on the compressive resistance of engineered bamboo columns under eccentric loading.
Furthermore, even for the same specimen, the SHAP contribution of a given input feature differed between the two ML models. These differences can be largely attributed to the different learning mechanisms of the two algorithms. For instance, RF constructs multiple decision trees using random subsets of features, whereas XGBoost sequentially builds trees to correct the prediction errors of the preceding ensemble.
5. Analysis and Modeling of Key Combined Features
5.1. Case Study
For engineered bamboo columns with cross-sectional dimensions of 100 mm × 100 mm (Ac = 10,000 mm2), l varied from 0.6 m to 3.4 m, and e ranged from 0 mm to 100 mm. fc was 65 MPa, and Ec was 9600 MPa. The column lengths in the training database ranged from 400 to 1900 mm. Therefore, predictions for values greater than 1900 mm were used only to examine the boundary behavior of the models and were not considered validated predictions. By inputting these parameters into the trained RF and XGBoost models, the predicted Ncu values were obtained.
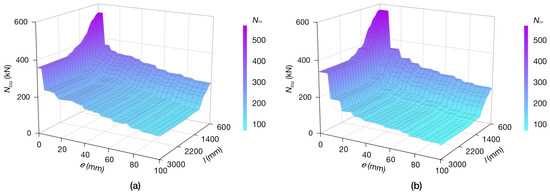
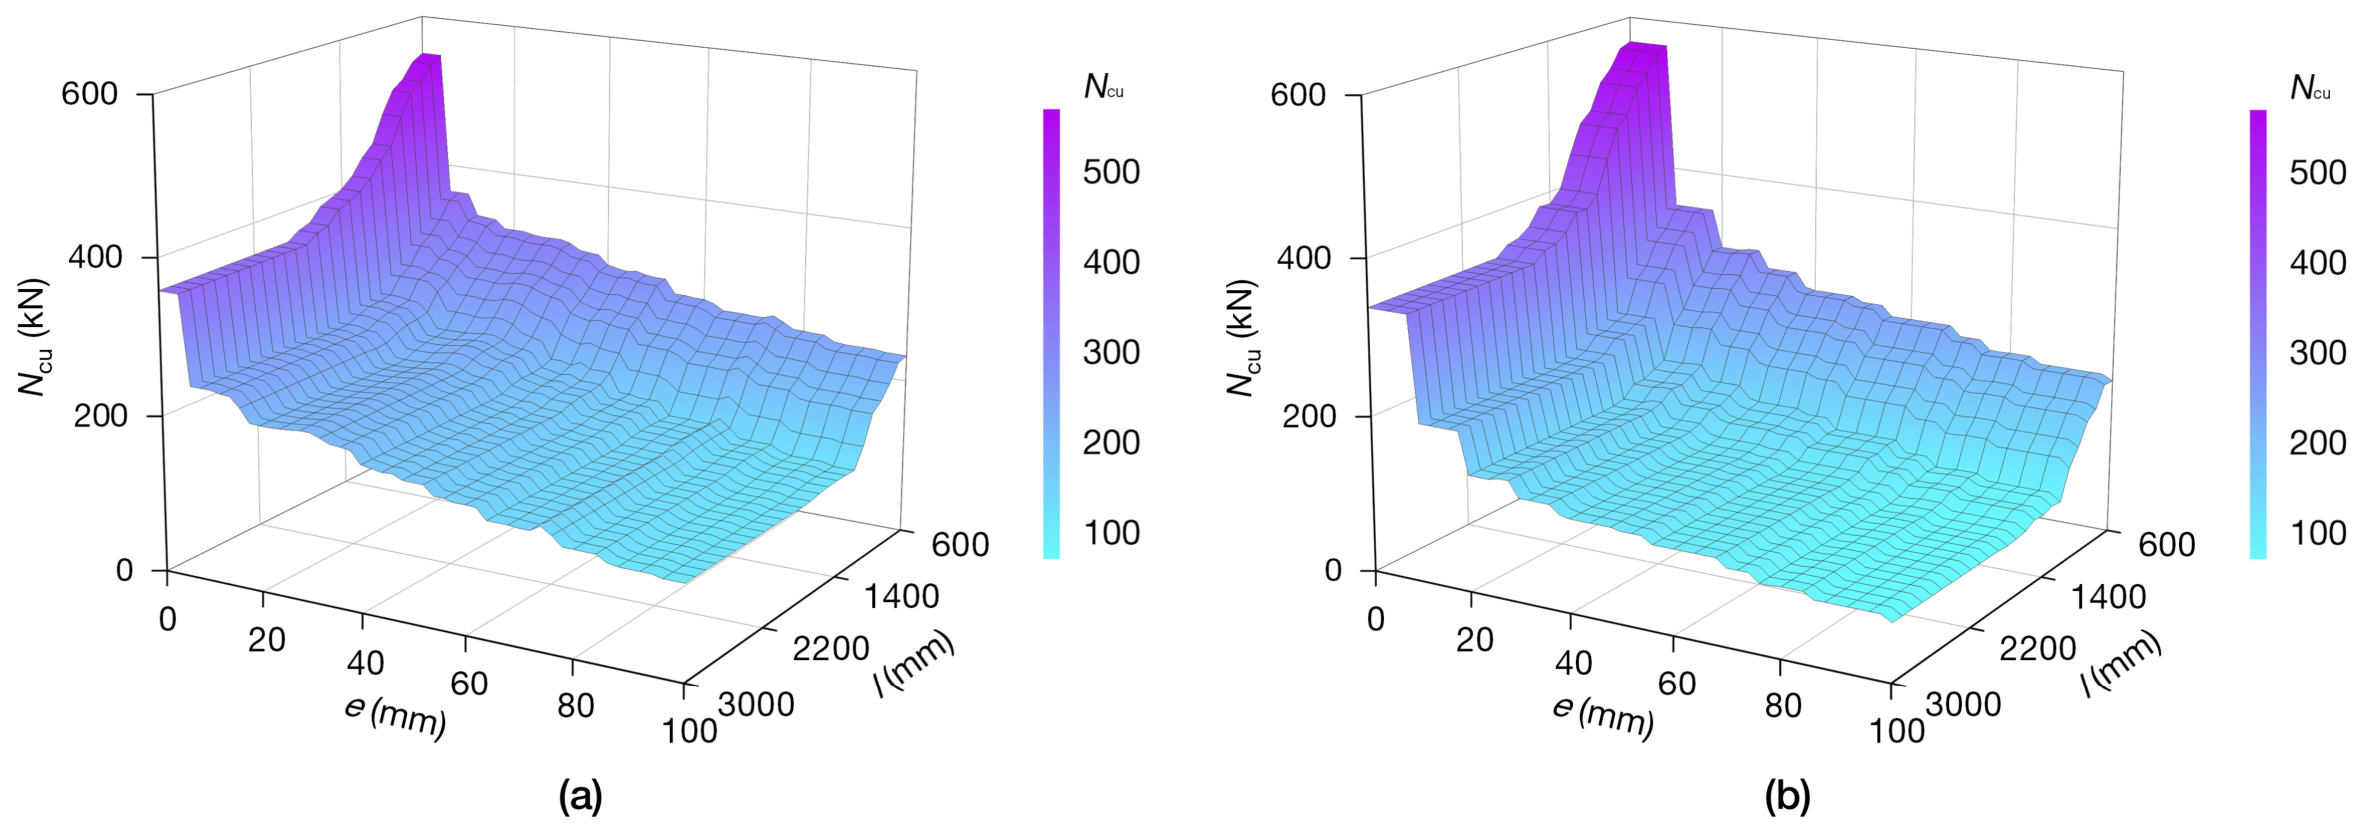
Figure 9 presents the response of Ncu to variations in e and l. Although there were some differences in detail between the RF and XGBoost models, the overall trend was consistent. When l remained constant, Ncu changed only slightly over the lower range of e, corresponding to the plateau on the left side of the curve. As e increased further, Ncu exhibited a decreasing trend.
Figure 9.
Response surfaces of Ncu as functions of e and l: (a) predictions from the RF model and (b) predictions from the XGBoost model.
This decline occurred in two stages: after the plateau, a small increase in e led to a sharp drop in Ncu, a result that was also observed in the experiments by Huang et al. [27] and Li et al. [32]. Following a sharp decrease, Ncu entered a second stage of gradual reduction. When e remained constant, Ncu generally decreased as l increased within the range covered by the training database. For l values greater than 1900 mm, the predictions represent extrapolation beyond the training domain. Based on the identified effects of e and l on Ncu, an explicit prediction model was subsequently developed.
5.2. Modeling Based on Key Combined Features
Existing theoretical models, such as the Ylinen and Perry–Robertson models, provide useful references for column stability analysis. However, these models were not specifically developed for engineered bamboo columns, which restricts their applicability in predicting the bearing performance of such columns. A new functional form is proposed herein to describe the effects of eccentricity and length on Ncu. By fitting the proposed formulation to the outputs of the trained ML models, the corresponding explicit empirical models can be obtained. The advantage of this method lies in its combination of the predictive capability of ML with the simplicity of an explicit model.
Due to the sharp local variations in Ncu under the combined influence of e and l, direct multivariable fitting is particularly challenging. Although higher-order functions can provide good fitting results, their increased complexity reduces practical applicability and is inconsistent with established mechanics-based formulations. Based on existing knowledge of bamboo and wood columns under eccentric and axial compression, the effects of e and l on Ncu were represented by e/h and λ, respectively. Here, the slenderness ratio was derived from the column length and cross-sectional area rather than used as an independent ML input. It was calculated by dividing the effective column length by the radius of gyration. For the pinned–pinned boundary condition, the effective length was equal to the actual column length. For the square cross-section, the radius of gyration was calculated as the side length divided by the square root of 12, and the side length was taken as the square root of the cross-sectional area.
To isolate the effect of λ, each λ–φ curve at a given e/h was multiplied by the ratio of the peak φ value of the reference curve at the minimum e/h to that of the current curve. Similarly, to isolate the effect of e/h, each e/h–φ curve at a given λ was multiplied by the ratio of the peak φ value of the reference curve at the minimum λ to that of the current curve. Each scaling factor was applied uniformly to all points on the corresponding curve. The two rescaling procedures were applied independently to the original ML-generated response surface rather than sequentially. The resulting datasets were then used to fit φ(λ) and φ(e/h), respectively.
The relationship between e/h and φ can be fitted using the three-parameter decay function given in Equation (4):
where ai (i = 1, 2, and 3) are the coefficients determined by fitting.
The relationship between λ and φ can be fitted using Equation (5), which adopts a form based on the Ylinen and Perry–Robertson models:
where bi (i = 1, 2, …, 6) are the coefficients determined by fitting.
The φ response surface can be expressed as
where α is a prescribed empirical correction exponent. In the present study, α = 0.9 is adopted to reduce potential systematic discrepancies between the simplified explicit model and the ML-based prediction trend.
The predicted ultimate bearing capacity (Ncu,p) can be expressed as
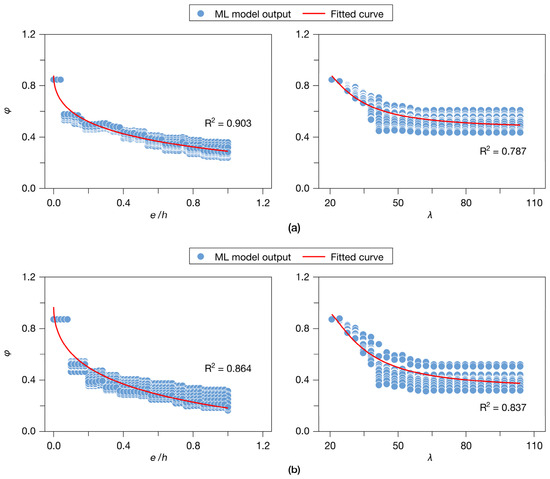
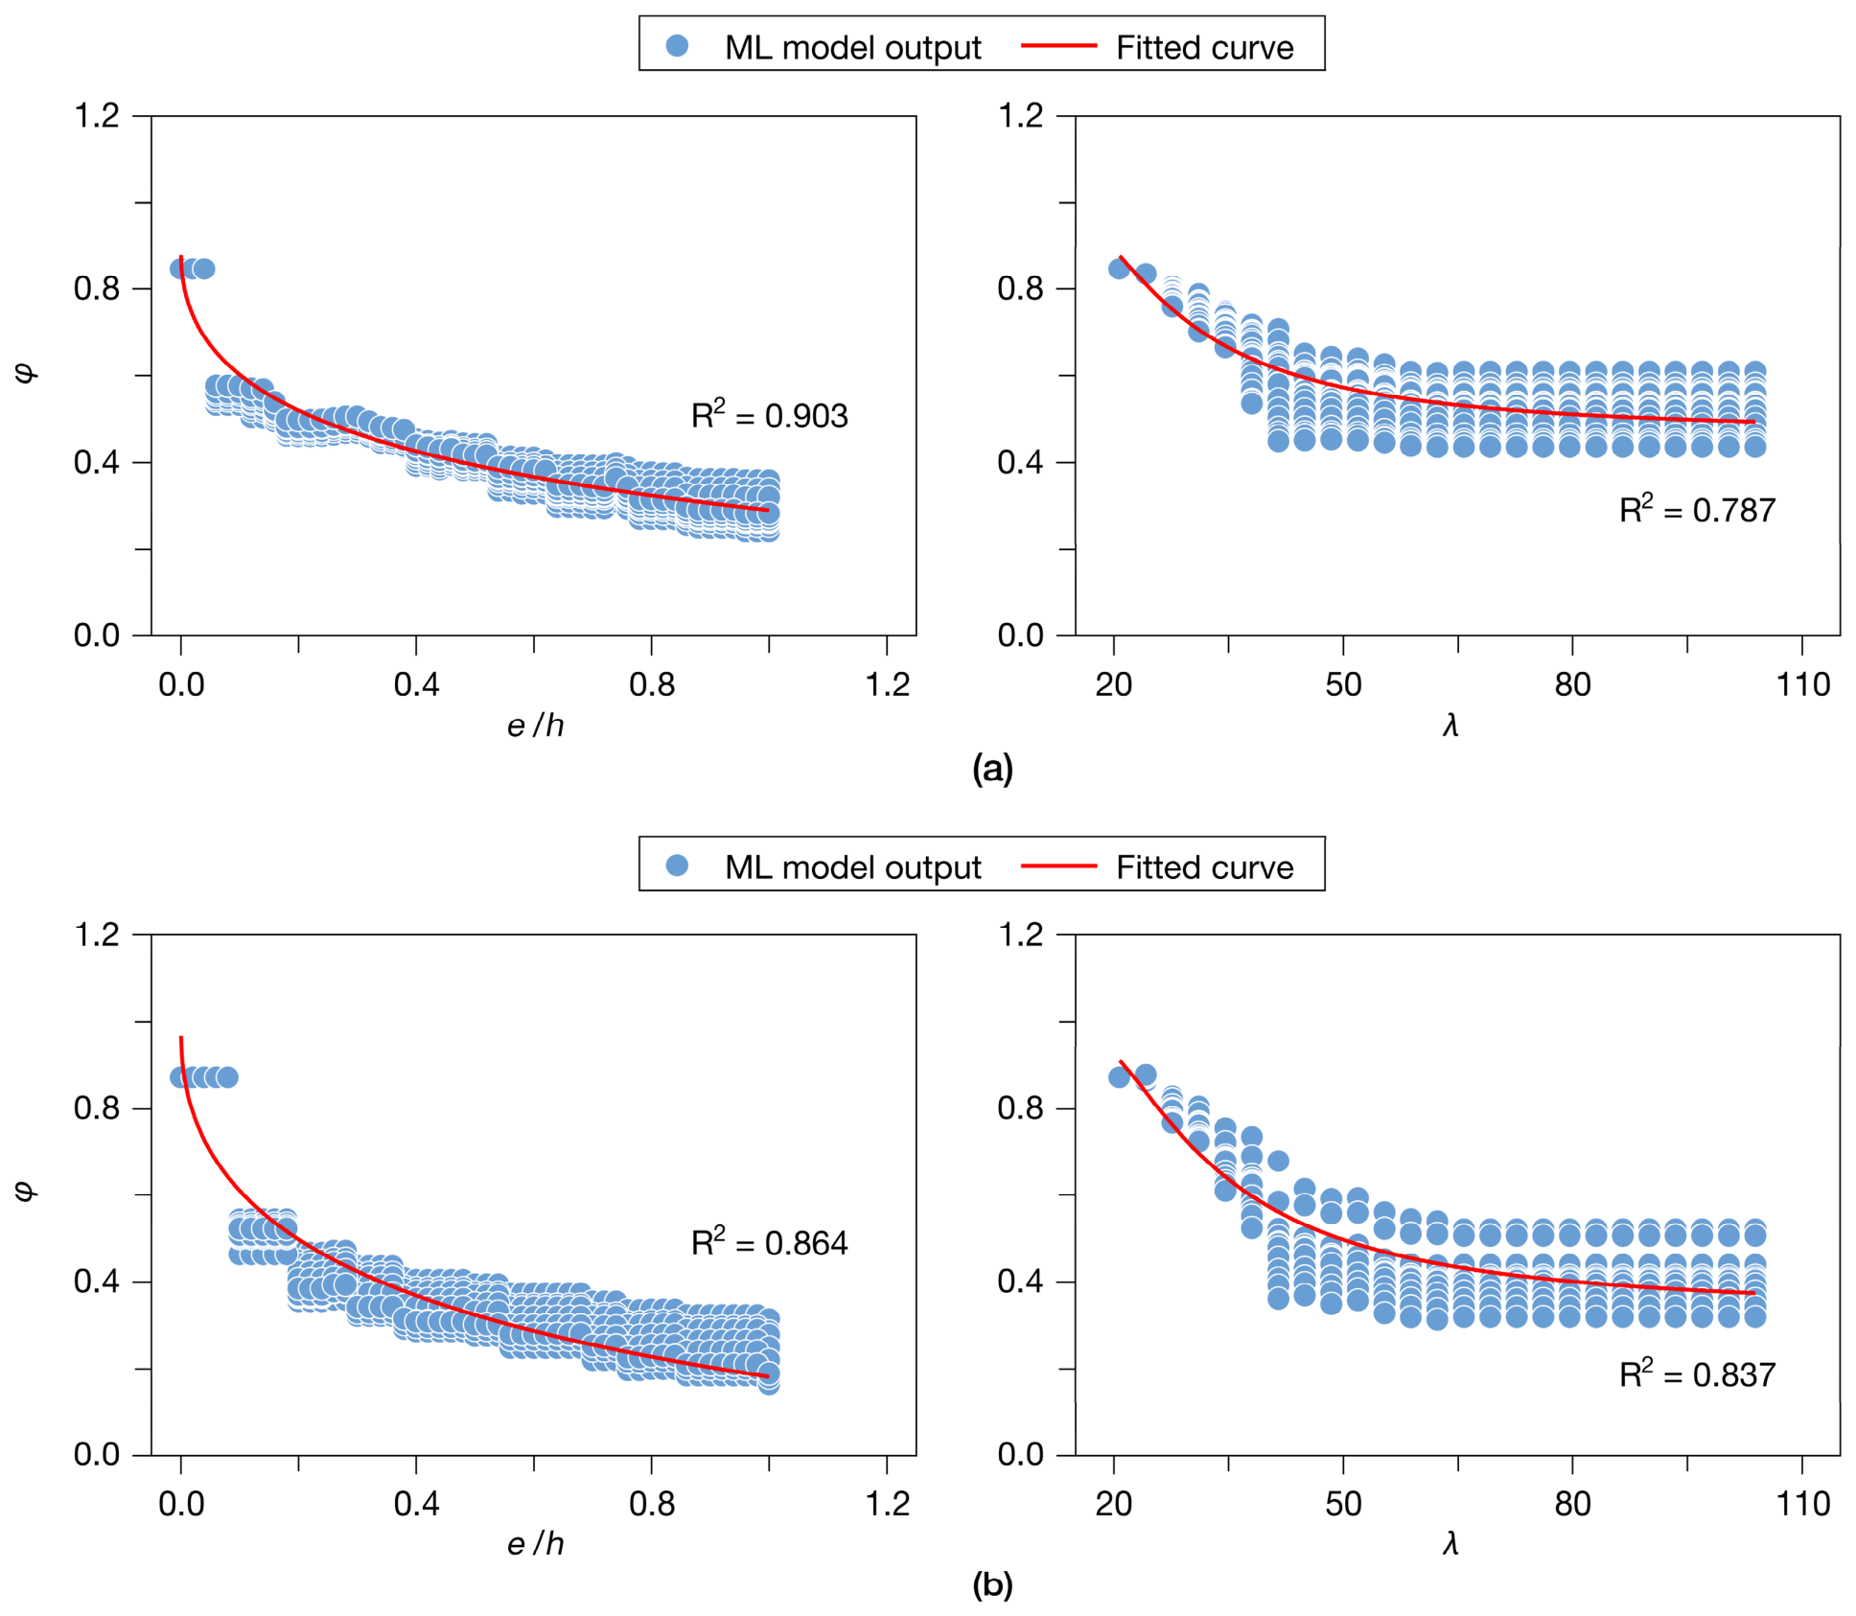
Figure 10a presents the curve-fitting results based on the trained RF model output data, with the specific fitting models provided in Equations (8) and (9).
Figure 10.
Fitting results for e/h versus φ (left) and λ versus φ (right): (a) based on the RF model and (b) based on the XGBoost model.
Figure 10b presents the curve-fitting results based on the trained XGBoost model output data, with the specific fitting models provided in Equations (10) and (11).
At e/h = 0, Equations (8) and (10) give values of 0.880 and 0.968, respectively. These values should not be interpreted as independent eccentricity reduction factors because the eccentricity- and slenderness-dependent functions were jointly used in Equation (6) and were not separately normalized. Therefore, the predicted axial capacity at e = 0 remains dependent on the slenderness ratio and may be lower than the nominal compressive capacity because of column instability and unavoidable imperfections. The axial-compression data in Figure 3d show the same decreasing trend in bearing capacity with increasing slenderness ratio, providing an internal check of this boundary behavior. These data were included in the developed database and therefore do not constitute an independent validation dataset.
5.3. Model Calibration Based on the Developed Database
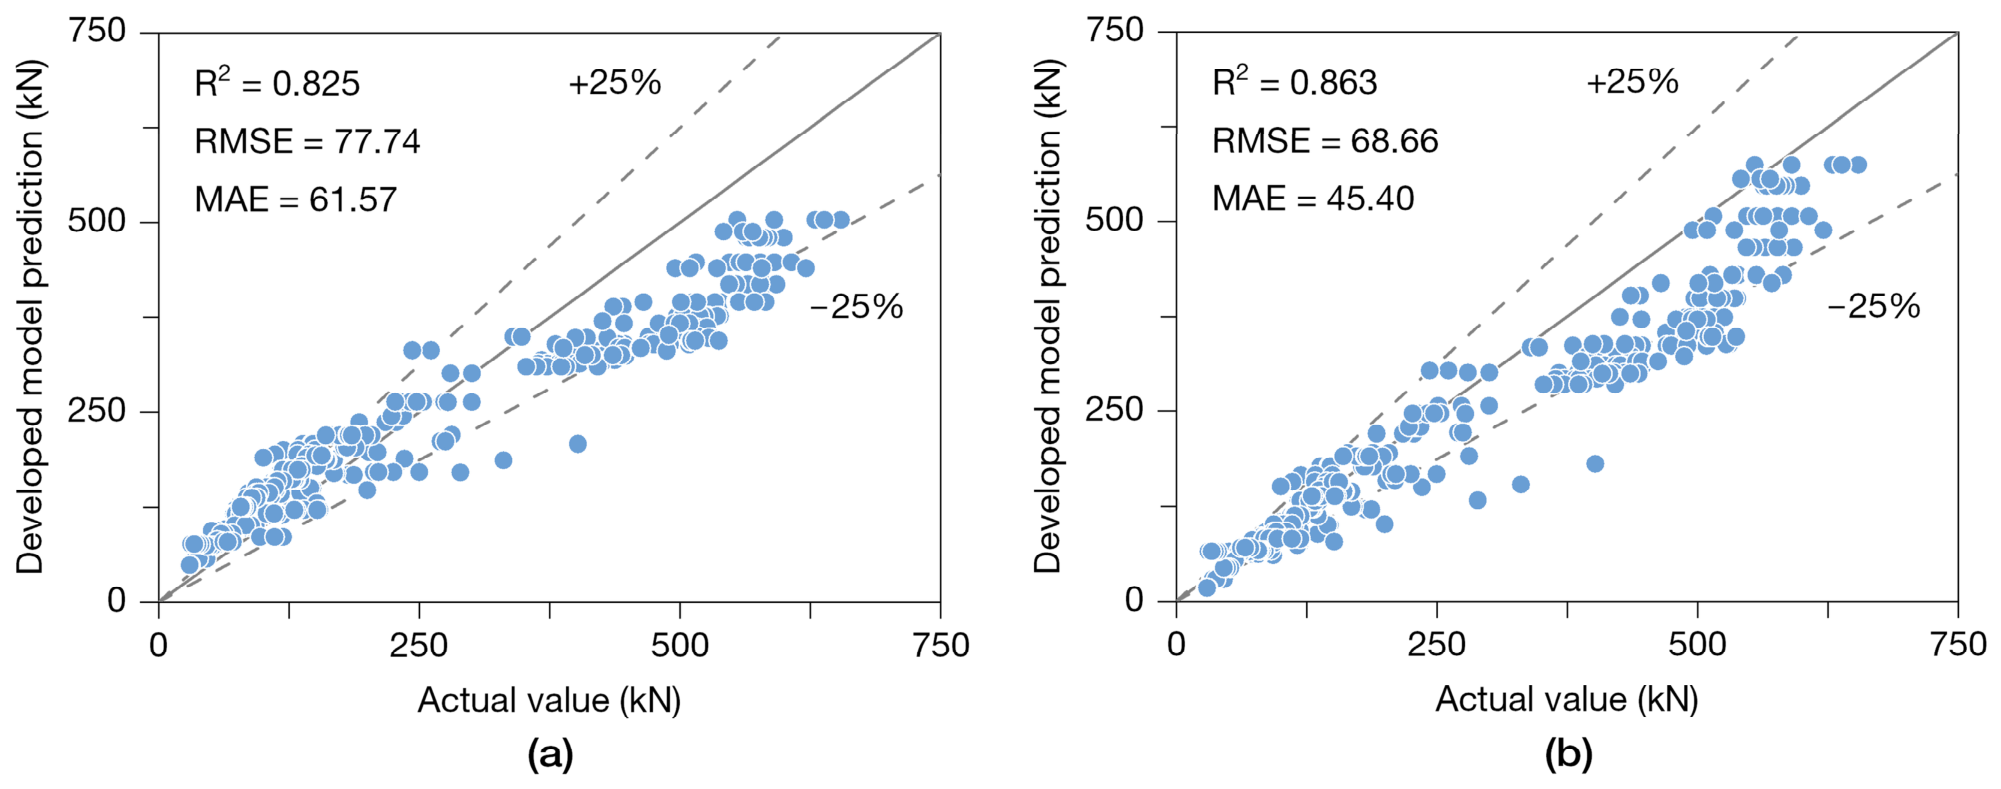
Figure 11 presents the prediction results of the developed explicit models based on the trained RF and XGBoost models. When evaluated against the developed database, the developed model based on XGBoost demonstrated better predictive performance than that based on RF. The developed explicit models had larger prediction errors than the direct ML outputs because they were simplified empirical expressions fitted to the ML-predicted trends. Although these formulations improved transparency and practical applicability, they could not fully capture the complex nonlinear interactions between eccentricity and slenderness ratio.
Figure 11.
Evaluation of the predictive performance of the developed models using the developed database: (a) model based on RF and (b) model based on XGBoost.
5.4. Model Validation Based on Additional Data Sources
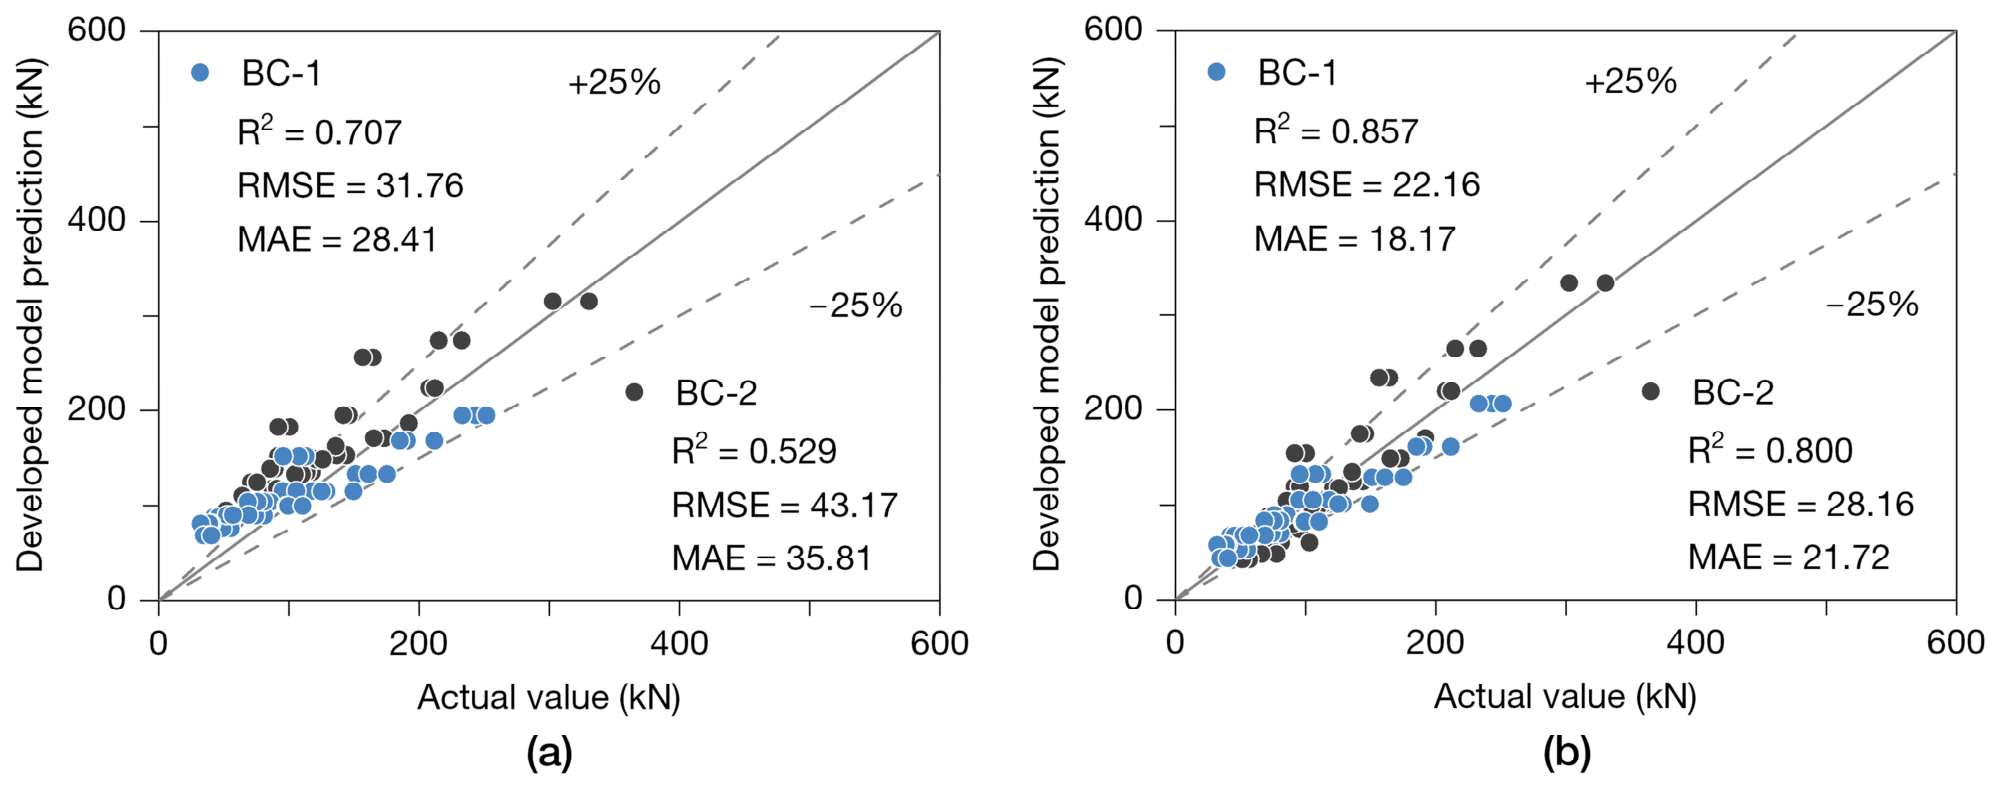
Eccentric compression test data for engineered bamboo columns of varying lengths from Refs. [47,48] were reserved for independent validation of the developed models. Detailed specimen information from these sources is summarized in Table 2. In addition, an fc value of 49.3 MPa was adopted for Ref. [47] based on the material properties reported in Ref. [49]. Figure 12 summarizes the predictions obtained using the developed models. Of the two explicit models, the XGBoost-based model demonstrated higher predictive accuracy than the RF-based model, with most prediction errors falling within ±25%.
Table 2.
Ranges of the key parameters in the additional data sources.
Figure 12.
Evaluation of the predictive performance of the developed models using additional data sources: (a) model based on RF and (b) model based on XGBoost.
6. Conclusions
This study developed a dataset comprising 432 records based on a review and analysis of existing research. The ultimate bearing capacity of engineered bamboo columns with different lengths under eccentric loading was analyzed using data-driven ML methods, and ML-assisted explicit models were developed for ultimate bearing capacity prediction.
ML models with good predictive performance for the ultimate bearing capacity of engineered bamboo columns were developed based on DT, RF, GBDT, XGBoost, LightGBM, and CatBoost algorithms. SHAP analysis of the trained RF and XGBoost models indicated that eccentricity made the largest contribution to their predictions, while the contributions of the other input features varied with the selected specimen and ML model. The relatively low contribution of elastic modulus reflects its narrow range in the database rather than its mechanical unimportance for column stability.
A functional form was proposed to express the stability factor in terms of the eccentricity ratio and slenderness ratio and thereby predict the ultimate bearing capacity. The compressive strength and cross-sectional area were explicitly incorporated through fc and Ac, respectively, while the effects of other material properties were represented by the fitted regression parameters within the calibration range. Validation using the developed database and an independently prepared dataset demonstrated that the explicit model derived from the XGBoost output achieved higher prediction accuracy than that derived from the RF output. The proposed framework should be considered an aid for preliminary estimation rather than a replacement for experimental validation.
Author Contributions
Conceptualization, H.L.; methodology, Q.G., G.H., B.J.W., B.-Y.L., Y.L. and H.L.; formal analysis, X.Z. and Q.G.; investigation, X.Z., G.H., B.J.W., Y.L. and H.L.; data curation, X.Z. and Q.G.; writing—original draft preparation, X.Z. and H.L.; writing—review and editing, X.Z., Q.G., G.H., B.-Y.L., B.J.W., Y.L. and H.L.; supervision, H.L.; project administration, H.L.; funding acquisition, H.L. All authors have read and agreed to the published version of the manuscript.
Funding
This research was funded by the Scientific Research Development Foundation of Zhejiang A&F University, grant number 2025LFR019.
Data Availability Statement
The data that support the findings of this study are available from the corresponding author upon reasonable request.
Conflicts of Interest
Author Qing Guo was employed by The Third Construction Co., Ltd. of China Construction Third Engineering Bureau. Author Ben-Yue Li was employed by The Architecture Design & Research Institute of Zhejiang University Co., Ltd. Author Brad Jianhe Wang was employed by Ningbo Sino-Canada Low-Carbon Technology Research Institute. Author Yihan Lan was employed by Zhejiang Provincial Forestry Survey, Planning, and Design Co., Ltd. The remaining authors declare that the research was conducted in the absence of any commercial or financial relationships that could be construed as a potential conflict of interest.
References
- Chen, L.; Hu, Y.; Wang, R.Y.; Li, X.; Chen, Z.H.; Hua, J.M.; Osman, A.I.; Farghali, M.; Huang, L.P.; Li, J.J.; et al. Green building practices to integrate renewable energy in the construction sector: A review. Environ. Chem. Lett. 2024, 22, 751–784. [Google Scholar] [CrossRef] [Scilit]
- Li, H.; Wang, L.B.; Wei, Y.; Wang, B.J. Off-axis compressive behavior of cross-laminated timber and glued-laminated timber. Wood Mater. Sci. Eng. 2025, 1–13. [Google Scholar] [CrossRef] [Scilit]
- Lou, Z.; Zheng, Z.; Yan, N.; Jiang, X.; Zhang, X.; Chen, S.; Xu, R.; Liu, C.; Xu, L. Modification and application of bamboo-based materials: A review—Part II: Application of bamboo-based materials. Forests 2023, 14, 2266. [Google Scholar] [CrossRef] [Scilit]
- Li, H.; Semple, K.E.; Wang, B.J.; Dai, C.P. Block shear and delamination performance of cross-laminated bamboo and timber: An experimental investigation. Wood Mater. Sci. Eng. 2025, 1–9. [Google Scholar] [CrossRef] [Scilit]
- Wang, C.; Chen, G.; Zhang, E.H.; Zhu, W.L.; Chen, F.C. Hysteresis behavior of laminated bamboo lumber (LBL)-framed nailed connections: Experimental investigations and theoretical modelling. Wood Mater. Sci. Eng. 2025, 1–24. [Google Scholar] [CrossRef] [Scilit]
- Zheng, Z.; Yan, N.; Lou, Z.; Jiang, X.; Zhang, X.; Chen, S.; Xu, R.; Liu, C.; Xu, L. Modification and application of bamboo-based materials: A review—Part I: Modification methods and mechanisms. Forests 2023, 14, 2219. [Google Scholar] [CrossRef] [Scilit]
- Su, J.W.; Tian, Y.K.; Guo, Y.J.; Li, H.T.; Xiong, Z.H.; Sayed, U.; Cheng, G.S.; Lorenzo, R. Load-bearing performance of laminated bamboo lumber-steel plate single-bolt connections. Sustain. Struct. 2026, 6, 000100. [Google Scholar] [CrossRef] [Scilit]
- Bai, T.; Panahi-Sarmad, M.; Yan, J.; Bi, R.; He, M.; Dai, C.P.; Han, G.P.; Chen, C.J.; Rojas, O.J. Engineering bamboo as a multiscale platform for carbon-negative materials. Nat. Rev. Mater. 2026. [Google Scholar] [CrossRef] [Scilit]
- Wang, J.; Yang, H.; Lv, Q.; Lu, Y. Experimental and analytical studies on the axial compressive performance of steel-confined timber composite columns. Thin-Walled Struct. 2026, 225, 114807. [Google Scholar] [CrossRef] [Scilit]
- Yang, S.Y.; Li, S.Y.; Li, M.Y.; Zhang, S.B.; Ren, H.Q.; Wu, G.F.; Zhong, Y. The axial compression behavior and failure mechanism transition of bamboo-wood composites under quasi-static and low-velocity impact load. Ind. Crops Prod. 2026, 242, 123000. [Google Scholar] [CrossRef] [Scilit]
- Li, X.Y.; Li, L.M.; Li, N.; Bao, M.Z.; Bao, Y.J.; Wu, Z.X.; Wang, J.L.; Rao, F.; Chen, Y.H. Sustainable production of engineered bamboo scrimber composites for construction and flooring applications. Constr. Build. Mater. 2022, 347, 128615. [Google Scholar] [CrossRef] [Scilit]
- Li, H.T.; Xue, X.; Xiong, Z.H.; Ashraf, M.; Lorenzo, R.; Shuchi, S. Application case of laminated bamboo lumber structure–Building of Sentai Bamboo Research Center. Sustain. Struct. 2024, 4, 000043. [Google Scholar] [CrossRef] [Scilit]
- Zhou, S.C.; Chu, F.Z.; Lv, X.H.; Xiao, Y. Experimental studies on glubam columns under axial compression. J. Build. Eng. 2022, 49, 103453. [Google Scholar] [CrossRef] [Scilit]
- Cui, Z.Y.; Xu, M.; Li, A.; Tu, L.H.; Zhu, J.; Shen, Y.R. Fire resistance evaluation of laminated bamboo lumber column under eccentric compression. Eng. Struct. 2023, 288, 116226. [Google Scholar] [CrossRef] [Scilit]
- Hong, C.K.; Li, H.T.; Xiong, Z.H.; Lorenzo, R.; Corbi, I.; Corbi, O. Experimental and numerical study on eccentric compression properties of laminated bamboo columns with a chamfered section. J. Build. Eng. 2021, 43, 102901. [Google Scholar] [CrossRef] [Scilit]
- Zhou, S.R.; Shi, L.L.; Xiong, G.; Kang, S.B.; Qin, Y.L.; Yan, H.Q. Global buckling behaviour of bamboo scrimber box columns under axial compression: Experimental tests and numerical modelling. J. Build. Eng. 2023, 63, 105435. [Google Scholar] [CrossRef] [Scilit]
- Chen, T.S.; Chen, Z.H.; Liu, J.D. Axial-compression performance of cold-formed thin-walled steel-fast-growing timber composite columns. Structures 2024, 67, 107013. [Google Scholar] [CrossRef] [Scilit]
- Xu, F.Y.; Xuan, S.Q.; Li, W.; Meng, X.M.; Gao, Y. Compressive performance of steel-timber composite L-shaped columns under concentric loading. J. Build. Eng. 2022, 48, 103967. [Google Scholar] [CrossRef] [Scilit]
- Sciomenta, M.; Bedon, C.; Fragiacomo, M. Experimental and numerical column buckling analysis of hardwood cross-laminated timber panels. J. Struct. Eng. 2024, 150, 04024030. [Google Scholar] [CrossRef] [Scilit]
- Durodola, J.F. Machine learning for design, phase transformation and mechanical properties of alloys. Prog. Mater. Sci. 2022, 123, 100797. [Google Scholar] [CrossRef] [Scilit]
- Li, H.; Hu, G.J.; Wang, L.B.; Wei, Y.; Zong, Z.L. Bond strength between FRP bars and concrete under seawater corrosion environments: Data-driven machine learning analysis. Polym. Compos. 2026, 47, 2854–2865. [Google Scholar] [CrossRef] [Scilit]
- Li, H.; Semple, K.E.; Dai, C.P. Embedment strength of cross-laminated timber: Brief review and data-driven investigation. Eur. J. Wood Wood Prod. 2026, 84, 44. [Google Scholar] [CrossRef] [Scilit]
- Hu, G.J.; Zimba, C.; Li, H. Data-driven analysis of critical load for Mode I fracture in engineered bamboo. Strength Mater. 2026, 58, 549–561. [Google Scholar] [CrossRef] [Scilit]
- Zhou, X.; Lu, D.C.; Zhao, J.D.; Zhang, Y.N.; Gao, Z.W.; Rabczuk, T.; Du, X.L. Material characteristic length insensitive nonlocal modelling: A computationally efficient scaled nonlocal integral method. Comput. Geotech. 2025, 188, 107587. [Google Scholar] [CrossRef] [Scilit]
- Li, H.; Yu, C.Q.; Tong, J.Z. Compressive strength perpendicular to the grain of cross-laminated timber: Experimental, theoretical, and machine learning analyses. Eng. Appl. Artif. Intell. 2026, 182, 116104. [Google Scholar] [CrossRef] [Scilit]
- Wei, Y.; Zhou, M.Q.; Yuan, L.D. Mechanical performance of glulam bamboo columns under eccentric loading. Acta Mater. Compos. Sin. 2016, 33, 379–385. [Google Scholar] [CrossRef]
- Huang, D.S.; Bian, Y.L.; Huang, D.M.; Zhou, A.P.; Sheng, B.L. An ultimate-state-based-model for inelastic analysis of intermediate slenderness PSB columns under eccentrically compressive load. Constr. Build. Mater. 2015, 94, 306–314. [Google Scholar] [CrossRef] [Scilit]
- Li, H.T.; Wu, G.; Zhang, Q.S.; Su, J.W. Mechanical evaluation for laminated bamboo lumber along two eccentric compression directions. J. Wood Sci. 2016, 62, 503–517. [Google Scholar] [CrossRef] [Scilit]
- Tan, C.; Li, H.T.; Wei, D.D.; Lorenzo, R.; Yuan, C.G. Mechanical performance of parallel bamboo strand lumber columns under axial compression: Experimental and numerical investigation. Constr. Build. Mater. 2020, 231, 117168. [Google Scholar] [CrossRef] [Scilit]
- Li, H.T.; Su, J.W.; Deeks, A.J.; Zhang, Q.S.; Wei, D.D.; Yuan, C.G. Eccentric compression performance of parallel bamboo strand lumber columns. BioResources 2015, 10, 7065–7080. [Google Scholar] [CrossRef] [Scilit]
- Li, H.T.; Wei, D.D.; Su, J.W.; Yuan, C.G.; Chen, G. Experimental study on PSBL under eccentric compression. J. Build. Mater. 2016, 19, 561–565+583. [Google Scholar] [CrossRef]
- Li, H.T.; Qiu, Z.Y.; Wu, G.; Corbi, O.; Wei, D.D.; Wang, L.B.; Corbi, I.; Yuan, C.G. Slenderness ratio effect on eccentric compression properties of parallel bamboo strand lumber columns. J. Struct. Eng. 2019, 145, 04019077. [Google Scholar] [CrossRef] [Scilit]
- Li, H.T.; Wu, G.; Zhang, Q.S.; Chen, G. Experimental study on side pressure LBL under tangential eccentric compression. J. Hunan Univ. Nat. Sci. 2016, 43, 90–96. [Google Scholar] [CrossRef]
- Li, H.T.; Chen, G.; Zhang, Q.S.; Ashraf, M.; Xu, B.; Li, Y.J. Mechanical properties of laminated bamboo lumber column under radial eccentric compression. Constr. Build. Mater. 2016, 121, 644–652. [Google Scholar] [CrossRef] [Scilit]
- Li, H.T.; Su, J.W.; Zhang, Q.S.; Deeks, A.J.; Hui, D. Mechanical performance of laminated bamboo column under axial compression. Compos. Part B Eng. 2015, 79, 374–382. [Google Scholar] [CrossRef] [Scilit]
- Li, H.T.; Liu, R.; Lorenzo, R.; Wu, G.; Wang, L.B. Eccentric compression properties of laminated bamboo columns with different slenderness ratios. Proc. Inst. Civ. Eng. Struct. Build. 2019, 172, 314–326. [Google Scholar] [CrossRef] [Scilit]
- Ylinen, A. A method of determining the buckling stress and the required cross-sectional area for centrally loaded straight columns in elastic and inelastic range. Mem. Assoc. Int. Ponts Charpentes 1956, 16, 529–550. [Google Scholar]
- Rankine, W.J.M. A Manual of Applied Mechanics, 6th ed.; Charles Griffin and Company: London, UK, 1872. [Google Scholar]
- Euler, L. Methodus Inveniendi Lineas Curvas Maximi Minimive Proprietate Gaudentes Sive Solutio Problematis Isoperimetrici Latissimo Sensu Accepti; Birkhäuser: Basel, Switzerland, 1952. [Google Scholar]
- Loh, W.-Y. Classification and regression trees. WIREs Data Min. Knowl. Discov. 2011, 1, 14–23. [Google Scholar] [CrossRef] [Scilit]
- Breiman, L. Random forests. Mach. Learn. 2001, 45, 5–32. [Google Scholar] [CrossRef] [Scilit]
- Friedman, J.H. Greedy function approximation: A gradient boosting machine. Ann. Stat. 2001, 29, 1189–1232. [Google Scholar] [CrossRef] [Scilit]
- Chen, T.Q.; Guestrin, C. XGBoost: A scalable tree boosting system. In Proceedings of the 22nd ACM SIGKDD International Conference on Knowledge Discovery and Data Mining, San Francisco, CA, USA, 13–17 August 2016; pp. 785–794. [Google Scholar]
- Ke, G.L.; Meng, Q.; Finley, T.; Wang, T.F.; Chen, W.; Ma, W.D.; Ye, Q.W.; Liu, T.Y. LightGBM: A highly efficient gradient boosting decision tree. In Proceedings of the 31st Conference on Neural Information Processing Systems, Long Beach, CA, USA, 4–9 December 2017; pp. 3146–3154. [Google Scholar]
- Prokhorenkova, L.; Gusev, G.; Vorobev, A.; Dorogush, A.V.; Gulin, A. CatBoost: Unbiased boosting with categorical features. In Proceedings of the 32nd Conference on Neural Information Processing Systems, Montréal, QC, Canada, 2–8 December 2018; pp. 6639–6649. [Google Scholar]
- Lundberg, S.M.; Erion, G.; Chen, H.; DeGrave, A.; Prutkin, J.M.; Nair, B.; Katz, R.; Himmelfarb, J.; Bansal, N.; Lee, S.I. From local explanations to global understanding with explainable AI for trees. Nat. Mach. Intell. 2020, 2, 56–67. [Google Scholar] [CrossRef] [Scilit] [PubMed]
- Zhao, E.R.; Liu, J.H.; Zhang, X.; Wang, F. Eccentric compression behavior of inorganic-bonded bamboo composite columns. Structures 2025, 72, 108287. [Google Scholar] [CrossRef] [Scilit]
- Chen, W. Analysis and Experimental Study on Mechanical Properties of Glued Laminated Bamboo Columns Under Uniaxial Eccentric Load. Master’s Thesis, Southeast University, Nanjing, China, 2015. [Google Scholar]
- Zhang, X.; Zhao, M.Y.; Zhao, E.; Liu, J.H.; Liu, Q.L.; Li, S.M.; Yin, H.; Yang, C.; Li, X.R. Experimental investigation into mechanical properties of inorganic-bonded bamboo composite for structural applications. Constr. Build. Mater. 2024, 427, 136247. [Google Scholar] [CrossRef] [Scilit]

Disclaimer/Publisher’s Note: The statements, opinions and data contained in all publications are solely those of the individual author(s) and contributor(s) and not of MDPI and/or the editor(s). MDPI and/or the editor(s) disclaim responsibility for any injury to people or property resulting from any ideas, methods, instructions or products referred to in the content. |
© 2026 by the authors. Licensee MDPI, Basel, Switzerland. This article is an open access article distributed under the terms and conditions of the Creative Commons Attribution (CC BY) license.