


Abstract
Farmland shelterbelts can provide broad microclimatic and production benefits, but these benefits may coexist with localized competition near the tree–crop interface. Their effects also vary with environmental conditions, shelterbelt attributes, and crop type. We searched Web of Science and China National Knowledge Infrastructure for field studies conducted in China and published between 1980 and 2023. A total of 120 studies were retained, providing 1377 treatment–control comparisons. Log response ratios and random-effects models were used to quantify shelterbelt effects on wind speed, summer air temperature, air relative humidity, crop yield, thousand-grain weight, and crop yield in study-defined edge zones. Subgroup analyses examined the moderating effects of mean annual precipitation, shelterbelt structure, main−belt spacing, shelterbelt height, stand age, orientation, and crop type. Shelterbelts reduced wind speed and summer air temperature by 35.80% and 4.01%, respectively, and increased air relative humidity by 13.45%. Crop yield and thousand−grain weight increased by 16.57% and 12.28%, respectively, whereas crop yield in study−defined edge zones decreased by 20.47%. Shelterbelt height and stand age significantly moderated microclimatic responses and edge-zone yield loss, while crop type significantly moderated crop yield and thousand−grain weight. These results demonstrate that broad protective and production benefits can coexist with localized near−tree yield penalties. The findings provide evidence for context−specific shelterbelt management and highlight the need to account for spatial variation in tree–crop interactions.
1. Introduction
Farmland shelterbelts consist of tree belts arranged around fields with specific structures, spacing, and orientations. They reduce meteorological stresses such as wind and blowing sand and regulate near-surface water and heat conditions. They are important agroecological infrastructure in the northern plains and major grain–producing regions of China [1,2]. As drought, strong winds, and extreme heat intensify, the sustained protective and production–support functions of shelterbelts depend not only on their presence but also on their structure, developmental stage, and spatial configuration relative to farmland [3,4]. Identifying their actual effects and controlling factors is therefore essential for shelterbelt renewal and management.
Shelterbelts first affect farmland by altering near–surface airflow and energy exchange. Tree stems, branches, foliage, and crowns obstruct the approaching airflow. Part of the flow is displaced over or around the belt, while the remainder passes through it. This process creates a low–wind–speed zone and a turbulent wake on the leeward side and reduces wind speed within and downwind of the shelterbelt network [5,6]. Lower wind speed alters near–surface turbulent exchange and the transport of sensible heat and water vapor, thereby affecting air temperature and air relative humidity within the network [7]. Meanwhile, canopy shade and tree transpiration modify the surface radiation balance and vapor exchange. These changes further affect soil evaporation, crop transpiration, and field evapotranspiration [8].
These microclimatic changes can influence crop performance through several pathways [9]. Shelterbelts may reduce mechanical wind damage, including leaf tearing, abrasion, sand injury, and lodging [10]. They may also alleviate water stress by improving soil water conditions and crop water relations [11]. Under substantial wind or drought stress, a favorable sheltered environment can support flowering, fruit set, and grain filling, thereby increasing crop yield and yield components [5,12,13]. However, crop responses are not uniform. Maize yield responses can vary with rainfall conditions, shelterbelt structure, and distance from the trees [14,15], while wheat productivity also changes with distance from the windbreak [8]. Thus, crop–specific responses reflect both biological differences and the environmental context in which shelterbelts operate.
Shelterbelts may also cause localized crop yield losses near the tree line, even while improving the field environment as a whole [16]. Large areas within a shelterbelt network often benefit from lower wind speed and improved water and thermal conditions. In contrast, crops immediately adjacent to the trees may suffer from canopy shade and competition with tree roots for water and nutrients [17,18,19]. As shelterbelts grow, their height, crown width, and root extent change. Their protected area and the zone of edge competition may also shift [16]. A shelterbelt can therefore generate both interior–field benefits and edge–zone yield-loss effects. Its net production effect depends on the spatial balance between them [20]. Previous studies have usually examined wind protection, yield gains, or edge competition separately [5,12,17,18,19]. A synthesis that integrates shelterbelt structure, protection range, and the spatial response of crop yield is still lacking.
Two broader questions remain unresolved in shelterbelt research. First, it is unclear whether different microclimatic indicators respond consistently to environmental conditions and shelterbelt attributes. Studies based on a single indicator cannot fully characterize integrated microclimatic regulation. Second, it remains uncertain whether broad protective and production benefits consistently coexist with localized yield penalties near the tree–crop interface, and how shelterbelt development influences this spatial trade–off. Existing studies differ substantially in site conditions, shelterbelt configuration, crop type, and measurement methods [8,11,14,16,21]. Individual experiments therefore cannot readily distinguish general patterns from local phenomena. Meta–analysis provides a common effect–size framework for estimating average effects and examining moderators across heterogeneous studies.
China provides a particularly informative evidence base for addressing these questions because farmland shelterbelts are widely distributed across major agricultural regions spanning strong climatic gradients, and a substantial body of field research has accumulated in both Chinese– and English–language literature. We therefore compiled published studies of farmland shelterbelts in China from 1980 to 2023. We used the log response ratio and random-effects models to quantify effects of shelterbelts on wind speed, summer air temperature, air humidity, crop yield, thousand–grain weight, and edge–zone crop yield. We also assessed the moderating roles of mean annual precipitation, shelterbelt structure, main–belt spacing, shelterbelt height, stand age, shelterbelt orientation, and crop type. The study addressed three questions: (1) What are the overall directions and magnitudes of shelterbelt effects on the six response variables? (2) Do environmental conditions, shelterbelt attributes, and crop type significantly moderate microclimatic, production, and edge–zone effects? (3) Do broad ecological and production benefits coexist with localized edge–zone yield loss, and do shelterbelt height and stand age show similar moderating patterns for these two effect types? By addressing general shelterbelt questions within a geographically defined but environmentally diverse evidence base, this study provides context–dependent evidence for shelterbelt configuration, renewal, and edge–zone management.
2. Materials and Methods
2.1. Literature Search and Study Selection
We searched Web of Science (WOS) and China National Knowledge Infrastructure (CNKI) for studies on farmland shelterbelts in China published from 1980 to 2023. The search strings included the Chinese and English equivalents of “farmland shelterbelt”, “shelterbelt”, “ecology”, “crop yield”, and “negative edge effect”. We then screened the reference lists of relevant reviews and included studies to identify additional records.
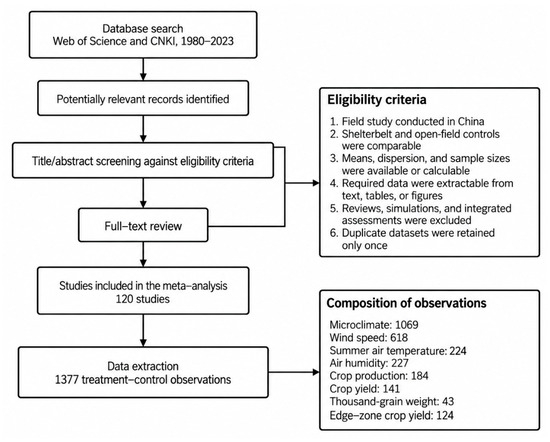
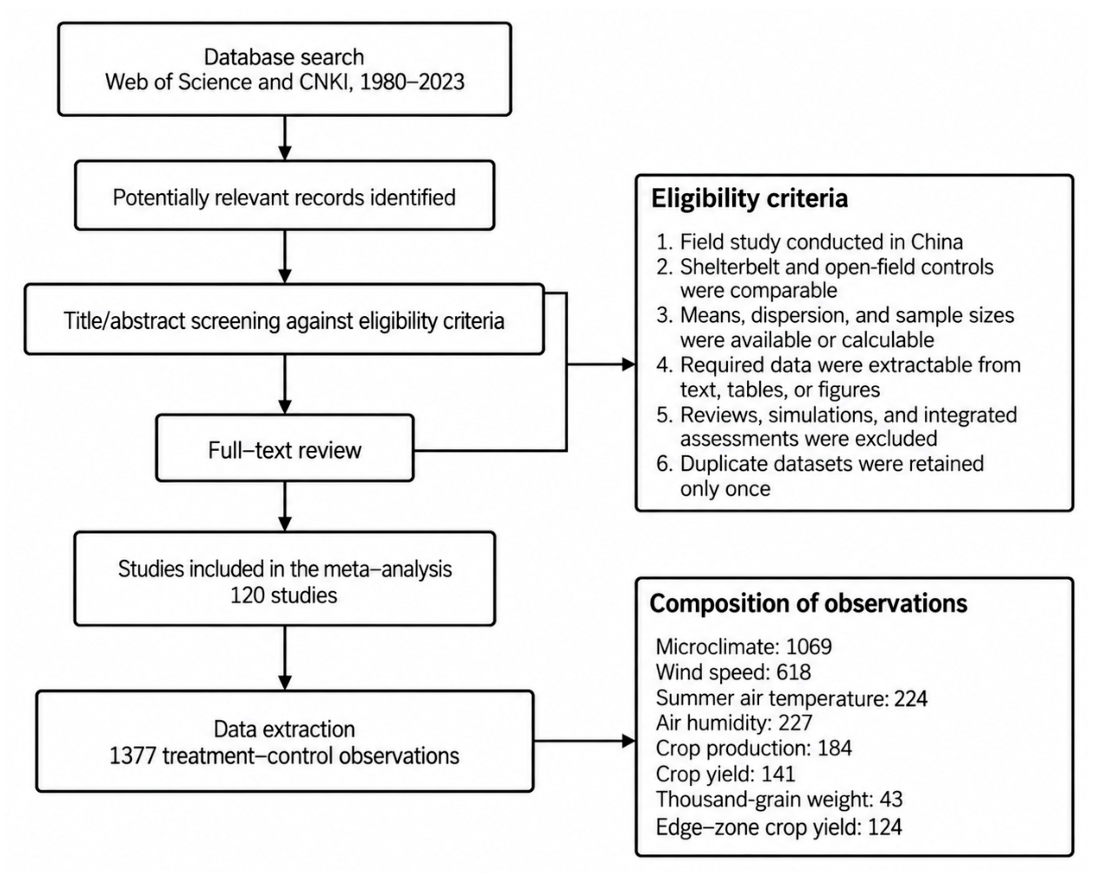
The study–selection process and data composition are shown in Figure 1. Records were screened by title and abstract and then by full text using predefined criteria. A total of 120 studies (Supplementary Table S1) meeting the following criteria were included: (1) the experiment was conducted in China; (2) farmland with and without shelterbelts was compared, and other experimental conditions were broadly comparable; (3) treatment and control means, measures of dispersion, and sample sizes were reported or could be derived; (4) the required data could be extracted or calculated from the text, tables, and/or figures; (5) the study was a field experiment, whereas reviews, simulations, and integrated assessments were excluded; and (6) when multiple publications reported the same experiment, only the most complete record was retained.
Figure 1.
Study selection workflow and composition of the extracted observations.
2.2. Data Extraction and Database Construction
We extracted basic study information, including the first author, experimental location, study period, and study object. We also recorded geographic variables, including latitude, longitude, mean annual temperature and precipitation. Potential moderators included mean annual precipitation, shelterbelt structural type or porosity, main–belt spacing, shelterbelt height, stand age, shelterbelt orientation, and crop type.
Farmlands with and without shelterbelts were treated as the treatment and control group, respectively. For each group, we extracted the mean, standard deviation, and sample size. Response variables included wind speed, summer air temperature, air relative humidity, crop yield, thousand–grain weight, and crop yield within the shelterbelt edge zone. Air temperature observations in the primary studies were concentrated from late May to early September. We therefore analyzed daytime summer air temperature only.
The analytical records were treatment–control comparisons rather than statistically paired observations. Multiple comparisons from the same publication were retained when they represented distinct study locations, observation years or periods, or explicitly differentiated treatment conditions. This approach preserved ecologically meaningful variation among experimental settings rather than treating the publication itself as the statistical unit. The shelterbelt edge zone was operationally defined according to the near–tree or edge–affected zone identified in each primary field study. Accordingly, edge–zone observations represent study–defined near–tree crop responses rather than responses within a single fixed physical distance from the shelterbelt.
Data reported in tables and text were extracted directly. Data presented only in figures were digitized with GetData Graph Digitizer (version 2.23). When a study reported standard errors (SEs) only, standard deviations (SDs) were calculated as follows:
where N is the sample size (i.e., the number of replicates) in the corresponding treatment or control group. When neither an SD nor an SE was reported, the SD was estimated as 10% of the mean [22,23].
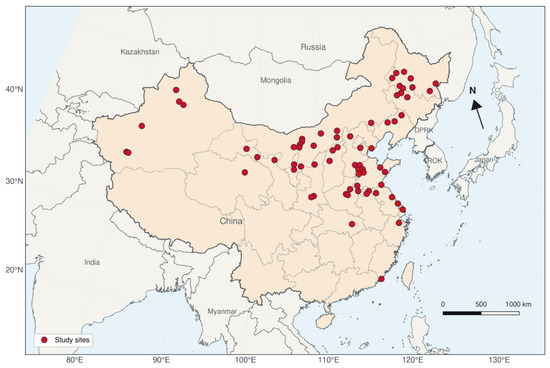
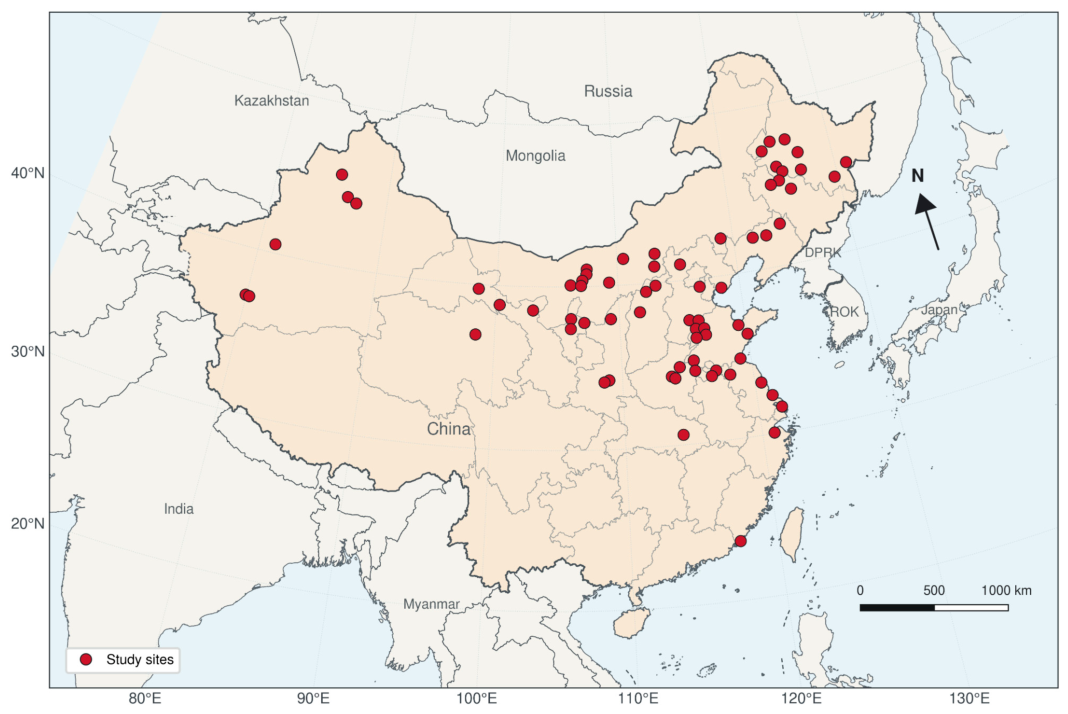
We extracted 1377 treatment–control comparisons. The microclimate dataset contained 1069 comparisons, including 618 for wind speed, 224 for summer air temperature, and 227 for air relative humidity. The crop–production dataset contained 184 comparisons (141 for crop yield and 43 for thousand–grain weight). The edge–zone dataset contained 124 comparisons of crop yield. Study sites were mainly located in eastern, northern, northeastern, and northwestern China, primarily in plain agricultural areas and major grain–producing regions where shelterbelt networks are widespread (Figure 2). Because the response variables differed in both sample size and ecological meaning, each variable was analyzed separately. Effect sizes were not pooled across response variables.
Figure 2.
Spatial distribution of the study sites included in the meta–analysis. The base map was derived from Natural Earth geographic data. Study–site locations were referenced to the WGS 84 geographic coordinate system (EPSG:4326) and displayed using an Albers Equal Area Conic projection.
2.3. Moderators and Subgroup Classification
The effects of farmland shelterbelts may depend on several factors. We therefore treated mean annual precipitation, shelterbelt structural type, main–belt spacing, shelterbelt height, stand age, shelterbelt orientation, and crop type as categorical moderators (Table 1). Each moderator was evaluated in a separate univariate subgroup analysis to test differences among subgroups [24].
Table 1.
Classification of moderators used in subgroup meta–analyses.
2.4. Effect-Size Calculation
We used random–effects models [25,26] to evaluate the ecological, yield–enhancing, and edge–zone effects of farmland shelterbelts in China. The effect of a shelterbelt was expressed as the natural logarithm of the response ratio (lnRR) [27,28]:
where and are the means for farmland with and without shelterbelts, respectively, for observation i. For wind speed, summer air temperature, and edge–zone crop yield, lnRR < 0 indicates a reduction caused by shelterbelts. For air relative humidity, crop yield, and thousand–grain weight, lnRR > 0 indicates an increase.
The sampling variance of each effect size was calculated as follows:
where and are the SD of the treatment and control groups, respectively, and and are their sample sizes.
For interpretation, pooled effect sizes were converted to percentage changes:
Here, D > 0 indicates a relative increase, whereas D < 0 indicates a relative decrease.
2.5. Meta-Analysis and Subgroup Tests
Because the included studies differed in location, climate, shelterbelt configuration, and crop type, all overall and subgroup effects were estimated with random–effects models. The weight assigned to effect size was:
where is the weight of effect size , is its sampling variance, and is the between–study variance, estimated by restricted maximum likelihood [29]. The weighted mean effect size was calculated as:
The SE and 95% confidence interval were calculated as follows:
where is the pooled effect size, is effect size , and n denotes the number of treatments–control effect–size comparisons included in the corresponding meta-analysis. The complete evidence base comprised 120 source studies (Supplementary Table S1). An effect was considered significant when its 95% confidence interval excluded zero. An interval entirely above zero indicated a significant positive effect, whereas an interval entirely below zero indicated a significant negative effect [30].
Subgroup analyses used the same random–effects framework as the overall analysis. The between–group heterogeneity statistic was used to test overall differences among subgroup means [31]. The associated probability was denoted by Pbetween. When Pbetween < 0.05, at least one subgroup mean was considered significantly different from the others. The moderator was then considered to have a significant moderating effect [32].
where m is the number of subgroups, is the total weight of subgroup j, and is the pooled effect size of subgroup j.
GetData Graph Digitizer was used for data extraction, and Microsoft Excel 2021 was used to organize the database. Meta–analyses were conducted using MetaWin 2.1. Forest plots were generated with Matplotlib 3.8.4 in Python 3.11.9.
3. Results
3.1. Overall Effects of Farmland Shelterbelts
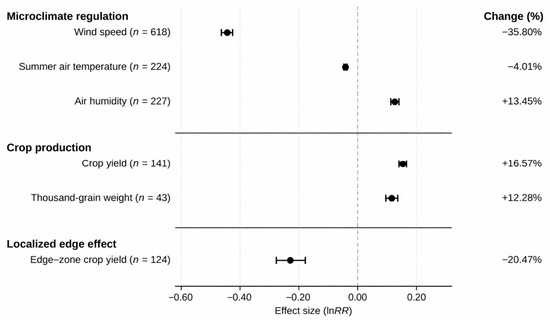
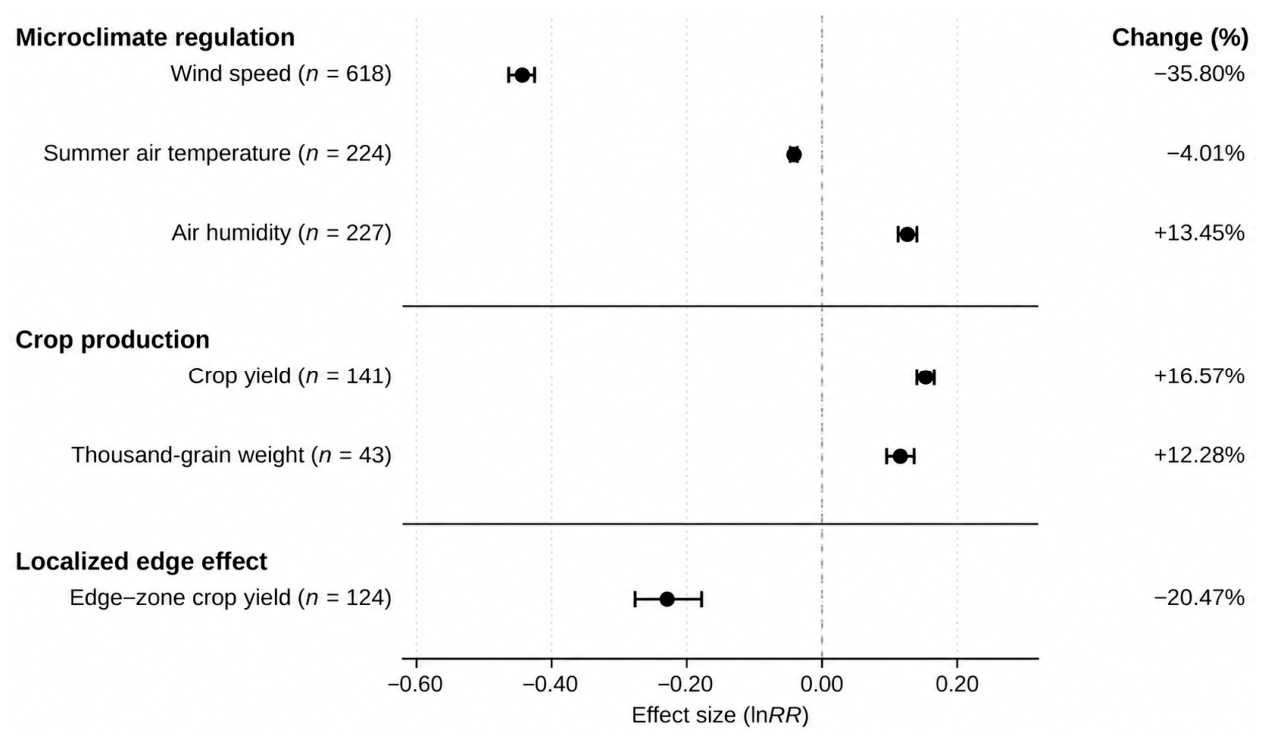
Compared with unsheltered farmland, farmland shelterbelts significantly altered field microclimate (Figure 3). Wind speed and summer air temperature decreased by 35.80% and 4.01%, respectively. Air relative humidity increased by 13.45%. The 95% confidence intervals for all three variables excluded zero. Shelterbelts therefore produced significant wind–speed reduction, summer cooling, and humidification.
Figure 3.
Overall effects of farmland shelterbelts on microclimate, crop production, and edge–zone crop yield.
Microclimatic improvements were accompanied by significantly positive crop–production responses. Crop yield within sheltered farmland increased by 16.57%, and thousand–grain weight increased by 12.28%. In contrast, crop yield within study–defined shelterbelt edge zones showed a significant localized reduction averaging 20.47% (Figure 3).
Overall, farmland shelterbelts produced microclimatic regulation, crop–production benefits, and localized edge–zone yield losses. Both positive and negative effects were present. The overall yield gain and the edge–zone yield loss were derived from different observations and spatial extents. They therefore cannot be directly subtracted or used to estimate net yield at the field scale.
Points represent the pooled mean effect sizes expressed as the natural logarithm of the response ratio (lnRR), and horizontal lines represent the corresponding 95% confidence intervals. The vertical dashed line denotes no effect (lnRR = 0). Values in parentheses indicate the number of observations (n), and values on the right indicate the back–transformed percentage changes. Negative values for wind speed, summer air temperature, and edge–zone crop yield indicate reductions, whereas positive values for air relative humidity, crop yield, and thousand–grain weight indicate increases.
3.2. Moderators of Microclimatic and Crop-Yield Effects
3.2.1. Microclimate
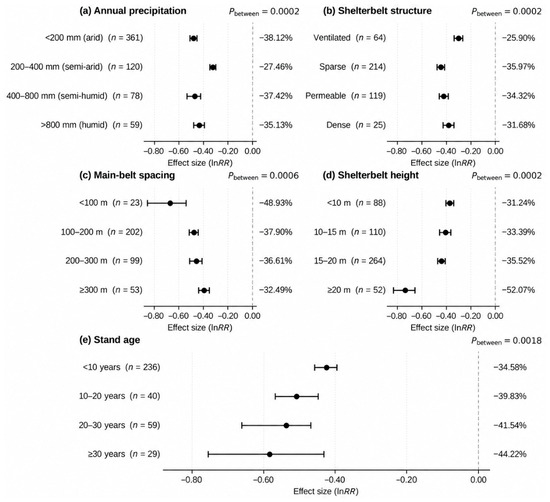
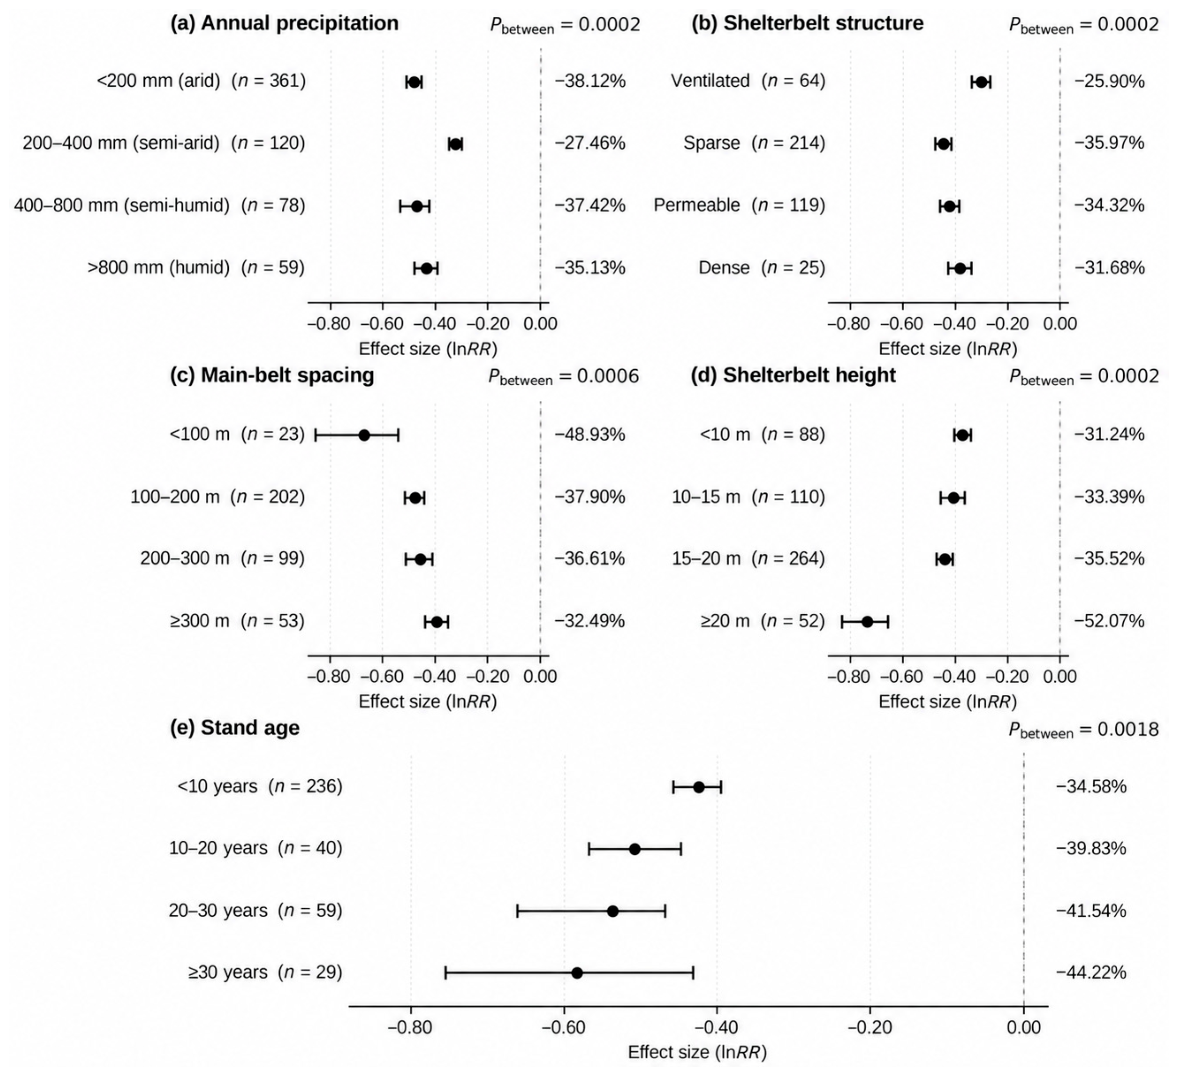
Wind–speed reduction differed significantly among subgroups of mean annual precipitation, shelterbelt structure, main–belt spacing, shelterbelt height, and stand age (Figure 4). Across precipitation zones, wind speed decreased by 27.46%–38.12%. The smallest reduction occurred in the semi–arid zone and the largest in the arid zone. The response did not change monotonically with precipitation (Figure 4a; Pbetween = 0.0002). Among shelterbelt structures, sparse belts produced the largest reduction efficacy (35.97%), whereas ventilated belts produced the smallest reduction efficacy (25.90%; Figure 4b; Pbetween = 0.0002). As main–belt spacing increased from <100 m to ≥300 m, wind–speed reduction decreased from 48.93% to 32.49% (Figure 4c; Pbetween = 0.0006). Wind protection generally strengthened with shelterbelt height and stand age, reaching 52.07% in the tallest–height group and 44.22% in the oldest–age group (Figure 4d,e).
Figure 4.
Effects of environmental conditions and shelterbelt attributes on wind–speed reduction by farmland shelterbelts. (a) Mean annual precipitation; (b) shelterbelt structure; (c) main–belt spacing; (d) shelterbelt height; and (e) stand age. Points represent the pooled mean effect sizes (lnRR), and horizontal lines represent the corresponding 95% confidence intervals. The vertical dashed line denotes no effect (lnRR = 0). Values in parentheses indicate the number of observations (n), and values on the right indicate the back–transformed percentage changes. Negative values indicate reductions in wind speed. Pbetween indicates the statistical significance of differences among subgroups.
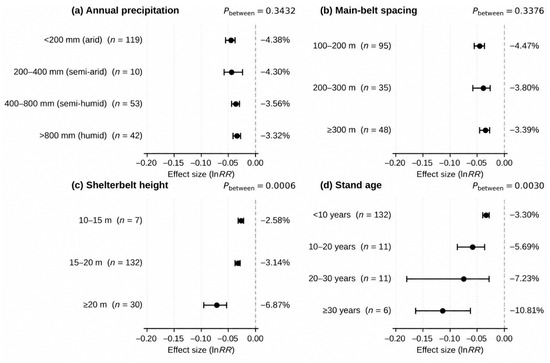
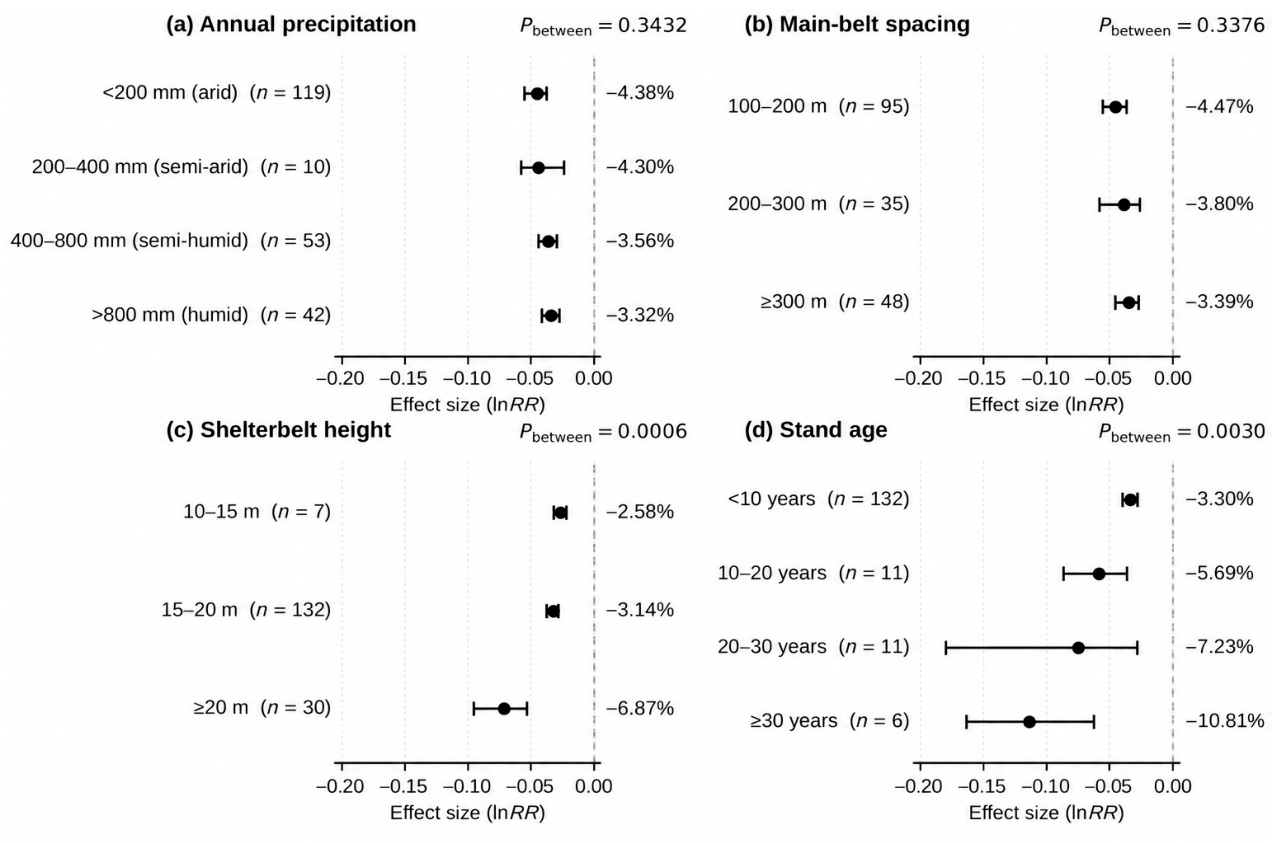
Summer air temperature decreased significantly within every mean–annual-precipitation and main–belt–spacing subgroup. However, differences among subgroups were not significant for either moderator (Figure 5a,b; mean annual precipitation: Pbetween = 0.3432; main–belt spacing: Pbetween = 0.3376). In contrast, shelterbelt height and stand age significantly moderated cooling. As shelterbelt height increased from 10–15 m to ≥20 m, the temperature reduction increased from 2.58% to 6.87% (Figure 5c; Pbetween = 0.0006). As stand age increased from <10 years to ≥30 years, the reduction increased from 3.30% to 10.81% (Figure 5d; Pbetween = 0.0030). Overall, the cooling effect of shelterbelt strengthened mainly with the shelterbelt height and stand age.
Figure 5.
Effects of environmental conditions and shelterbelt attributes on summer air–temperature reduction by farmland shelterbelts. (a) Mean annual precipitation; (b) main–belt spacing; (c) shelterbelt height; and (d) stand age. Points represent the pooled mean effect sizes (lnRR), and horizontal lines represent the corresponding 95% confidence intervals. The vertical dashed line denotes no effect (lnRR = 0). Values in parentheses indicate the number of observations (n), and values on the right indicate the back–transformed percentage changes. Negative values indicate reductions in summer air temperature. Pbetween indicates the statistical significance of differences among subgroups. No valid observations were available for shelterbelt heights of <10 m or main–belt spacing of <100 m.
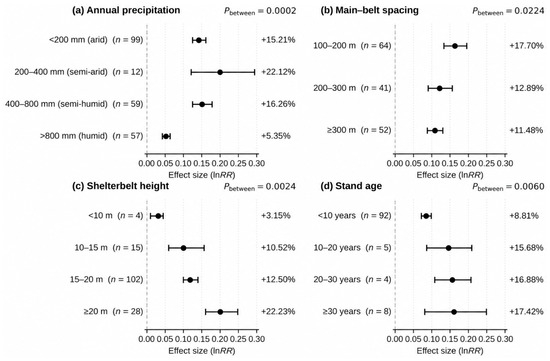
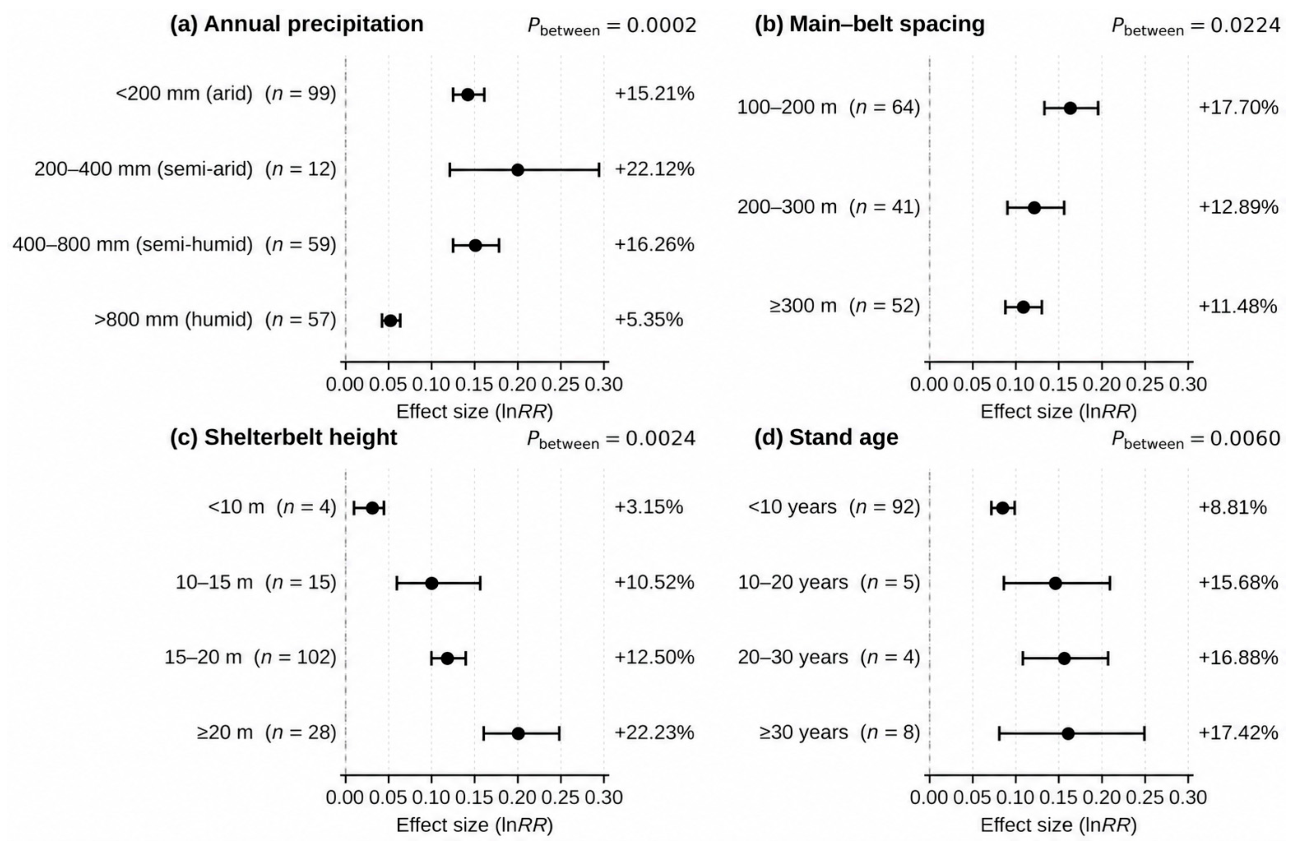
Air relative humidity responses differed significantly among subgroups of mean annual precipitation, main–belt spacing, shelterbelt height, and stand age (Figure 6). The largest (22.12%) and smallest (5.35%) increases in humidity were recorded in the semi–arid and humid zone, respectively (Figure 6a; Pbetween = 0.0002). As main–belt spacing increased from 100–200 m to ≥300 m, the increase in air relative humidity declined from 17.70% to 11.48% (Figure 6b; Pbetween = 0.0224). Humidification generally strengthened with shelterbelt height and stand age. Air relative humidity increased by 3.15% for shelterbelts <10 m high and by 22.23% for those ≥20 m high (Figure 6c; Pbetween = 0.0024). It increased by 8.81% and 17.42% for stands <10 and ≥30 years old, respectively (Figure 6d; Pbetween = 0.0060).
Figure 6.
Effects of environmental conditions and shelterbelt attributes on increases in air relative humidity induced by farmland shelterbelts. (a) Mean annual precipitation; (b) main–belt spacing; (c) shelterbelt height; and (d) stand age. Points represent the pooled mean effect sizes (lnRR), and horizontal lines represent the corresponding 95% confidence intervals. The vertical dashed line denotes no effect (lnRR = 0). Values in parentheses indicate the number of observations (n), and values on the right indicate the back–transformed percentage changes. Positive values indicate increases in air relative humidity. Pbetween indicates the statistical significance of differences among subgroups. No valid observations were available for main–belt spacing of <100 m.
Across the three microclimatic responses, shelterbelt height and stand age showed broadly consistent moderating patterns. Taller and more mature shelterbelts generally produced stronger wind–speed reduction, summer cooling, and humidification. Main–belt spacing mainly moderated wind–speed reduction and humidification. Its moderating effect on summer air temperature was not statistically significant.
3.2.2. Crop-Production Responses
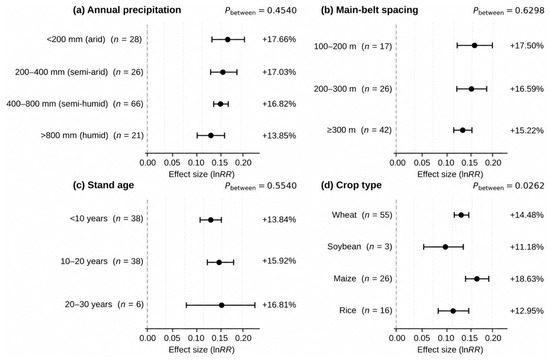
Neither mean–annual–precipitation nor main–belt spacing significantly moderated the positive effect of farmland shelterbelts on crop yield (Figure 7). Crop yield increased by 17.67%, 17.03%, 16.82%, and 13.85% in the arid, semi–arid, semi–humid, and humid zones, respectively (Figure 7a; Pbetween = 0.4540). At main–belt spacings of 100–200, 200–300, and ≥300 m, crop yield increased by 17.50%, 16.59%, and 15.22%, respectively. The subgroup difference was not significant (Figure 7b; Pbetween = 0.6298). The available evidence therefore does not show that mean annual precipitation or main–belt spacing significantly moderates the yield benefit within shelterbelts.
Figure 7.
Effects of environmental conditions, shelterbelt attributes, and crop type on crop–yield responses to farmland shelterbelts. (a) Mean annual precipitation; (b) main–belt spacing; (c) stand age; and (d) crop type. Points represent the pooled mean effect sizes (lnRR), and horizontal lines represent the corresponding 95% confidence intervals. The vertical dashed line denotes no effect (lnRR = 0). Values in parentheses indicate the number of observations (n), and values on the right indicate the back–transformed percentage changes. Positive values indicate increases in crop yield. Pbetween indicates the statistical significance of differences among subgroups. No valid observations were available for main–belt spacing of <100 m or stand age of ≥30 years.
Farmland shelterbelts significantly increased crop yield in every stand–age subgroup, with increases of 13.84%–16.81% across stand ages from <10 to 20–30 years. The point estimates increased gradually with stand age, but the differences among age groups were not statistically significant (Figure 7c; Pbetween = 0.5540).
The effect of farmland shelterbelts on crop yield differed significantly among crop types (Figure 7d; Pbetween = 0.0262). Maize showed the largest increase with 18.63%, followed by wheat, rice, and soybean, with 14.4%, 12.95%, and 11.18%, respectively. All four crops responded positively. However, the soybean subgroup contained only three effect sizes. Its estimate is therefore uncertain and requires confirmation by additional studies.
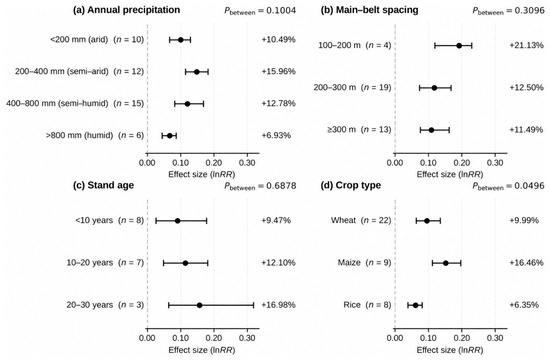
Thousand–grain–weight responses differed numerically among mean–annual–precipitation (+6.93%–15.96%; Pbetween = 0.1004), main–belt–spacing (+11.49%–21.13%; Pbetween = 0.3096), and stand–age subgroups (+9.47%–16.98%; Pbetween = 0.6878), but none of these subgroup differences were statistically significant (Figure 8).
Figure 8.
Effects of environmental conditions, shelterbelt attributes, and crop type on thousand–grain–weight responses to farmland shelterbelts. (a) Mean annual precipitation; (b) main–belt spacing; (c) stand age; and (d) crop type. Points represent the pooled mean effect sizes (lnRR), and horizontal lines represent the corresponding 95% confidence intervals. The vertical dashed line denotes no effect (lnRR = 0). Values in parentheses indicate the number of observations (n), and values on the right indicate the back–transformed percentage changes. Positive values indicate increases in thousand–grain weight. Pbetween indicates the statistical significance of differences among subgroups. No valid observations were available for main-belt spacing of <100 m, a stand age of ≥30 years, or soybean.
The increase in thousand-grain weight differed significantly among crop types (Figure 8d; Pbetween = 0.0496). The thousand–grain weight of maize increased by 16.46%, compared with only 9.99% for wheat and 6.35% for rice. No valid observations were available for soybean. Crop type was the only moderator that significantly affected both crop yield and thousand–grain weight.
3.3. Edge-Zone Yield Loss and Its Moderators
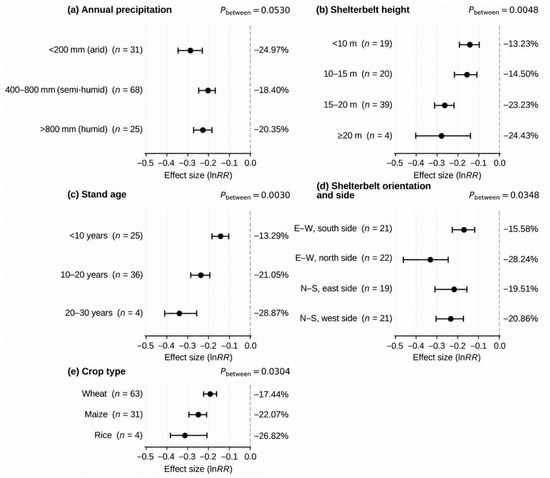
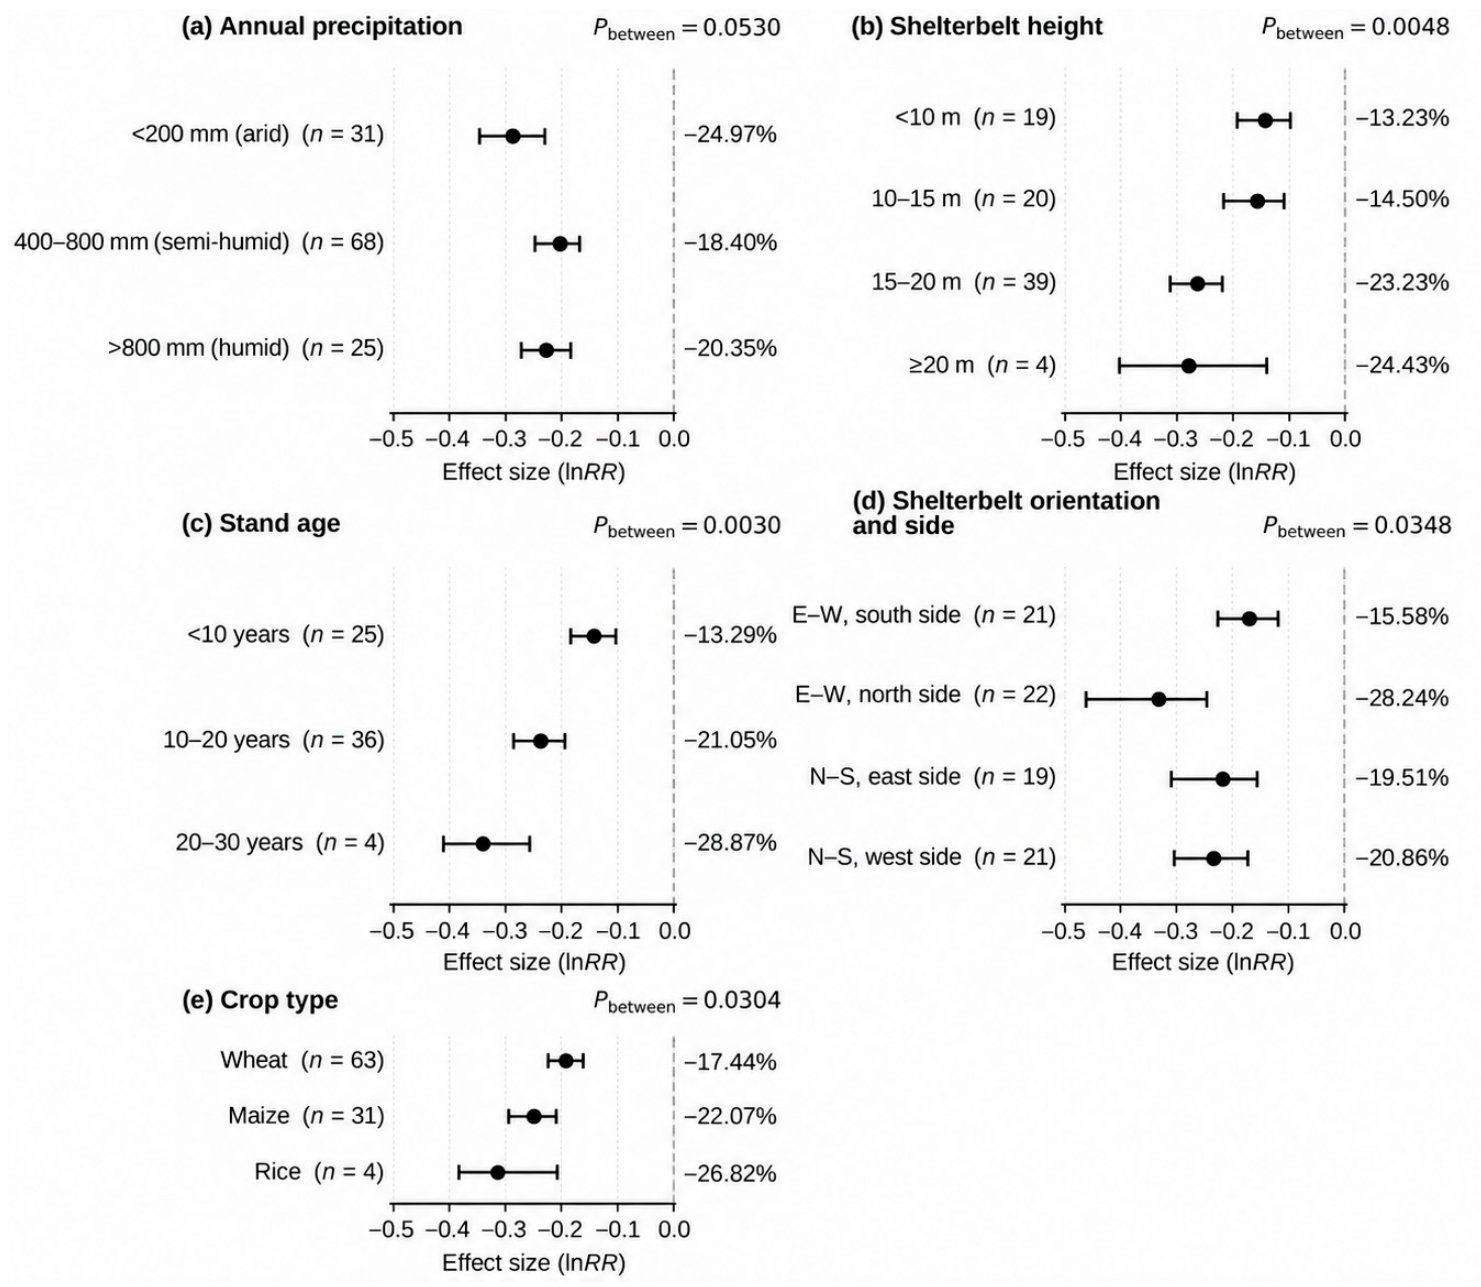
Crop yield within the study–defined shelterbelt edge zone was negatively affected in every annual precipitation subgroup, but the subgroup difference was not significant (Figure 9a; Pbetween = 0.0530). Yield losses were 24.97%, 18.40%, and 20.35% in the arid, semi–humid, and humid zones, respectively.
Figure 9.
Effects of environmental conditions, shelterbelt attributes, shelterbelt orientation, edge position, and crop type on edge–zone crop–yield reduction associated with farmland shelterbelts. (a) Mean annual precipitation; (b) shelterbelt height; (c) stand age; (d) shelterbelt orientation and relative edge position; and (e) crop type. Points represent the pooled mean effect sizes (lnRR), and horizontal lines represent the corresponding 95% confidence intervals. The vertical dashed line denotes no effect (lnRR = 0). Values in parentheses indicate the number of observations (n), and values on the right indicate the back–transformed percentage changes. Negative values indicate reductions in crop yield within the shelterbelt edge zone. Pbetween indicates the statistical significance of differences among subgroups. No valid observations were available for the semi–arid precipitation subgroup, stand age of ≥30 years, or soybean.
Shelterbelt height significantly moderated the magnitude of edge–zone yield loss. Losses generally increased with height (Figure 9b; Pbetween = 0.0048). As shelterbelt height increased from <10 m to ≥20 m, the yield reduction increased largely from 13.23% to 24.43%.
Stand age also significantly moderated edge–zone yield loss (Figure 9c; Pbetween = 0.0030). Crop yield decreased by 13.29%, 21.05%, and 28.87% for stand ages of <10, 10–20, and 20–30 years, respectively. Yield loss therefore intensified with stand age.
Furthermore, shelterbelt orientation and relative edge position significantly affected the magnitude of yield loss (Figure 9d; Pbetween = 0.0348). The north side of east–west shelterbelts showed the largest reduction of 28.24%. The west and east sides of north–south shelterbelts showed reductions of 20.86% and 19.51%, respectively. The south side of east–west shelterbelts showed the smallest reduction with only 15.58%.
Crop type also moderated edge–zone yield loss (Figure 9e; Pbetween = 0.0304). Edge–zone yields of wheat, maize, and rice decreased by 17.44%, 22.07%, and 26.82%, respectively.
Overall, shelterbelt height, stand age, shelterbelt orientation and relative edge position, and crop type significantly explained differences in edge–zone yield loss among subgroups. The moderating effect of mean annual precipitation was not statistically significant (Figure 9). These findings were derived from univariate subgroup analyses and do not establish independent causal effects of the moderators.
4. Discussion
4.1. Microclimatic Regulation by Farmland Shelterbelts and Its Moderators
By integrating microclimatic regulation, crop–production responses, and localized near–tree yield penalties within a single framework, this synthesis reveals a spatial trade-off between the broad protective functions of farmland shelterbelts and tree–crop competition near the shelterbelt edge. Aerodynamic regulation emerged as the most pronounced microclimatic process. Tree stems, branches, foliage, and crowns obstruct airflow. Part of the flow is displaced upward or laterally, while flow passing through the canopy loses kinetic energy through vegetation drag and turbulent dissipation [5,6]. Lower wind speed may also alter near–surface turbulent exchange and the transport of heat and water vapor, linking wind-speed reduction, cooling, and humidification mechanistically [5]. However, the three microclimatic indicators were not always obtained from the same experimental comparisons, so their relationships could not be tested directly. Future studies should measure wind speed, temperature, and relative humidity simultaneously within the same shelterbelt and observation period, so that multivariate approaches can evaluate these pathways more explicitly.
Shelterbelt structure and main-belt spacing were important moderators of wind–speed reduction [21,33,34]. Sparse shelterbelts produced greater average wind reduction than ventilated belts, indicating that effective protection requires sufficient aerodynamic resistance [35]. This pattern does not identify a universally optimal structure or porosity, because porosity affects both maximum wind-speed reduction and the leeward turbulent wake and protection distance [36]. These responses are jointly modified by shelterbelt height, width, number of rows, and vertical structure [5,37]. Wind–speed reduction and humidification also tended to weaken as main–belt spacing increased, possibly because protected zones of adjacent belts overlapped less.
The absence of a significant spacing effect on summer air temperature indicates that different microclimatic variables do not respond synchronously to shelterbelt configuration. Air temperature depends not only on airflow exchange but also on solar radiation, surface moisture, observation time, and distance from the shelterbelt [9]. These factors were not controlled consistently among the included studies and may have obscured differences among spacing groups. Long–term observations in the chestnut–soil zone of southern Russia similarly showed that the shelterbelt effects on wind speed, air temperature, relative humidity, and soil hydrothermal conditions varied with season, time of day, and distance from the trees [38]. In contrast, taller and more mature shelterbelts generally produced stronger wind–speed reduction, cooling, and humidification. As a shelterbelt develops, height, canopy structure, vertical continuity, and aerodynamic resistance often change together, potentially expanding its influence on airflow, radiation, and vapor exchange [5,39,40]. Because shelterbelt height, stand age, tree–species composition, and management condition may be correlated, these patterns describe the integrated effect of shelterbelt development rather than an independent causal effect of height or age.
Mean annual precipitation moderated wind–speed reduction and humidification, but not summer cooling. The stronger relative-humidity response under drier background conditions may reflect differences in atmospheric moisture and evaporative demand. Previous studies show that shelterbelt effects on relative humidity, vapor–pressure deficit, and evapotranspiration depend strongly on time and environmental conditions and can be more pronounced under high evaporative demand [41,42]. Field studies in arid and Mediterranean agricultural systems also show that lower wind speed can substantially reduce crop evapotranspiration and atmospheric water demand [8]. In addition, we used a response ratio as the effect size. With similar absolute increases in humidity, a higher control humidity in humid zones would produce a smaller relative change. Background moisture conditions may therefore influence the humidification response, but the present subgroup analyses cannot establish causality.
4.2. Microclimatic Improvement and Crop-Production Responses
The positive crop–production responses observed across protected fields are consistent with the capacity of shelterbelts to reduce mechanical crop damage and wind-driven water loss and to modify evapotranspiration, temperature, and soil moisture [7,8,13]. However, the microclimate and production indicators were not always obtained from the same experimental comparisons. The results therefore do not demonstrate that microclimatic improvement directly caused the yield response. Crop performance near shelterbelts is also influenced by canopy shade, tree–crop competition, and distance from the trees [20], meaning that production responses can vary substantially across field positions.
The moderating patterns for microclimatic and crop–production effects were not fully consistent. Shelterbelt height, stand age, and main-belt spacing moderated one or more microclimatic responses, whereas mean annual precipitation, main–belt spacing, and stand age did not significantly moderate crop yield or thousand–grain weight. Stronger wind–speed reduction, cooling, or humidification therefore does not necessarily translate into a proportional yield increase. Crop yield is also shaped by soil conditions, shelterbelt status, and field management. Other limiting factors may weaken the production response to local environmental improvement [12,43,44].
Crop type significantly moderated crop yield and thousand–grain weight, with maize showing comparatively strong point estimates. Regional observations and modeling studies indicate that shelterbelt effects on maize depend on climatic production potential, shelterbelt structure, and distance from the trees [12,15]. The observed differences among crop subgroups may therefore reflect not only crop traits but also regional climate, shelterbelt configuration, and observation position. Because interactions among these factors and pairwise comparisons among crop subgroups were not tested, the results do not establish a universal ranking of crop responsiveness.
Overall, microclimatic improvement is an important mechanism underlying the production benefits of shelterbelts, but it is not the only pathway controlling yield. The available data do not establish a direct causal chain linking wind speed, air temperature and humidity, soil conditions, and crop yield. The overall yield benefit should therefore not be attributed to any single microclimatic indicator. Future experiments should measure microclimate, soil moisture, crop physiological processes, and yield components simultaneously. Paired analyses or multivariate models could then separate the relevant pathways.
4.3. Spatial Characteristics and Drivers of Edge-Zone Yield Loss
Farmland shelterbelts can adversely affect crops immediately adjacent to the trees even while improving field microclimate and supporting production across the wider protected area. Near the tree line, canopy shade and competition from tree roots for water and nutrients can reduce crop performance [45]. Field studies also show that soil moisture and crop yield often improve with increasing distance from the shelterbelt [16,46]. The edge–zone result therefore does not negate the broader function of shelterbelts; rather, it demonstrates that crop responses are spatially heterogeneous. Because the physical width of the study–defined edge zone varied among primary studies, the pooled edge–zone estimate should be interpreted as evidence of a localized near–tree penalty rather than as an effect within a universal fixed distance.
Shelterbelt height and stand age moderated edge–zone yield loss, which generally intensified as shelterbelts became taller and older. As trees grow, zones influenced by canopy shade and roots may expand and increase resource limitation for adjacent crops [20]. Shelterbelt orientation and relative edge position also influenced the magnitude of loss, plausibly through differences in the duration and position of shade. However, shading effects also depend on latitude, season, tree height, and crown width, so the analysis does not identify one universally optimal orientation. Moreover, the microclimatic and edge–zone responses were derived from different sets of observations; similar moderator patterns do not demonstrate that stronger protection directly causes greater edge losses.
Crop type also moderated edge–zone yield loss. Differences in phenology, canopy structure, light requirements, root distribution, and water management may alter crop sensitivity to shade and belowground competition. Studies of temperate alley–cropping systems likewise show that tree effects on crop yield vary with crop type and distance from the tree row [45,47]. However, the rice subgroup contained only four observations, and no valid data were available for soybean. Crop types also tended to occur in different regions and under different irrigation and cultivation systems. A stable ranking of crop sensitivity cannot therefore be established.
The absence of a significant precipitation moderator effect on edge–zone yield loss does not imply that precipitation is unimportant. Rather, it suggests that the available evidence does not reveal a consistent difference among precipitation groups. Shade, root competition, and distance from the trees may exert more direct local controls on adjacent crops, while regional precipitation can interact with these factors in ways that are not resolved by the present univariate subgroup analyses.
The overall yield gain and the edge–zone yield loss were measured across different spatial extents and cannot be directly subtracted. The integrated field–scale outcome depends on both the magnitude and the area of the gain and loss zones. It is especially sensitive to the width of the edge–affected zone and the proportion of the field that it occupies. Modeling studies likewise show that field–scale production assessments must account for both gains within the protected zone and losses within the near–tree competition zone [20]. Thus, this synthesis demonstrates coexistence of broad benefits and localized penalties but does not quantify a universal net field–scale yield effect.
4.4. Management Implications and Research Priorities
Shelterbelt design should not seek only the greatest possible wind–speed reduction or cooling. It should balance microclimatic improvement, crop-production benefits, and localized edge losses. Shelterbelt structure, main–belt spacing, and renewal timing may therefore be evaluated in relation to regional wind hazards, water conditions, dominant crops, and field geometry. For tall or mature shelterbelts with locally confirmed edge competition, site–specific options such as canopy pruning, root pruning, root barriers, or adjustment of edge–zone cropping could be tested. For example, in a mature hybrid-walnut alley-cropping system in southern France, pollarding at 4 m temporarily improved crop light availability and crop performance, but the benefit declined within several years as the canopy regrew [48]. At a Nebraska windbreak–soybean interface, root pruning improved soil–water conditions mainly close to the windbreak, illustrating the distance dependence of belowground competition management [49]. These examples demonstrate why such interventions should be treated as locally tested, maintenance–dependent options rather than universally applicable prescriptions. An illustrative application of the present synthesis would be a wind–exposed maize field protected by tall, mature shelterbelts: the broad protective function of the belt could be retained, while near–tree crop rows showing persistent local yield suppression could be managed as a separate edge zone and evaluated for targeted intervention without weakening the entire shelterbelt network.
This study also has several limitations. Subgroup analyses describe average differences among conditions. The largest observed effects should not be used directly as engineering design thresholds [32]. The evidence was unevenly distributed among regions, response variables, and subgroups. Primary studies also differed in observation period, measurement position, shelterbelt classification, and crop management. Multiple comparisons from the same publication were retained only when they represented differentiated locations, years or observation periods, or treatment conditions; nevertheless, residual within–publication dependence cannot be completely excluded. Continuous variables such as precipitation, shelterbelt height, stand age, and spacing were categorized, and some measures of dispersion were estimated, both of which add uncertainty. In addition, many edge–zone studies did not simultaneously report exact sampling distance and shelterbelt height, preventing consistent standardization of distance as d/H across the full evidence base. Because the included studies span heterogeneous climatic, structural, and agronomic settings, pooled estimates should be interpreted as average responses across the available evidence rather than predictions for a specific shelterbelt system. The subgroup analyses were therefore used to characterize major sources of contextual variation. Future field studies should report shelterbelt structure, crown width, root extent, absolute distance from the tree line, and distance relative to shelterbelt height consistently, while measuring microclimate, soil resources, and crop yield simultaneously.
5. Conclusions
Farmland shelterbelts generate spatially contrasting effects: broad microclimatic and crop–production benefits can coexist with localized crop penalties near the tree–crop interface. This trade–off is a general consideration when evaluating the ecological and productive functions of shelterbelt systems. Within the Chinese evidence base synthesized here, shelterbelt development and configuration were associated more consistently with microclimatic regulation and edge–zone responses than with crop–production responses, while crop type also contributed to variation in production effects. These patterns indicate that maximizing a single protective function is unlikely to provide a universally optimal management strategy. Shelterbelt design, renewal, and edge–zone management should therefore be evaluated in relation to regional climate, stand development, crop type, field geometry, and the spatial extent of near–tree competition. Because edge–zone distances and experimental conditions varied among primary studies, the pooled estimates should be interpreted as average patterns rather than universal engineering thresholds or predictions for a specific site. Future research should standardize the reporting of edge distance, including distance relative to shelterbelt height, and integrate microclimate, soil conditions, and crop yield to quantify net field–scale outcomes more explicitly.
Supplementary Materials
The following supporting information can be downloaded at: https://www.mdpi.com/article/10.3390/f17091115/s1, Table S1: Studies included in the meta-analysis.
Author Contributions
Conceptualization and methodology, Y.H. and H.S.; data processing, Y.H. and Q.Y.; visualization and formal analysis, F.T. and X.Z.; writing—original draft preparation, Y.H.; writing—review and editing, H.S. and Z.W.; funding acquisition, Y.H. and H.S. All authors have read and agreed to the published version of the manuscript.
Funding
This work was funded by the Natural Science Foundation of Jiangsu Province (BK20241896), the Fujian Provincial Water Conservancy Science and Technology Project (MSK202620), and the National Natural Science Foundation of China (42277352).
Data Availability Statement
The datasets used and analyzed during the current study are available from the corresponding author on reasonable request.
Conflicts of Interest
The authors declare no conflicts of interest.
References
- Zhu, J.J.; Zheng, X. The prospects of development of the Three-North Afforestation Program (TNAP): On the basis of the results of the 40-year construction general assessment of the TNAP. Chin. J. Ecol. 2019, 38, 1600–1610. (In Chinese) [Google Scholar] [CrossRef]
- Fang, H. Quantifying farmland shelterbelt impacts on catchment soil erosion and sediment yield for the black soil region, northeastern China. Soil Use Manag. 2021, 37, 181–195. [Google Scholar] [CrossRef] [Scilit]
- Aili, A.; Bakayisire, F.; Xu, H.; Waheed, A. Enhancing agroecological resilience in arid regions: A review of shelterbelt structure and function. Agriculture 2025, 15, 2004. [Google Scholar] [CrossRef] [Scilit]
- Li, X.; Lv, P.; Zhang, Z.; Li, L.; Yang, X.; Zhou, Z.; Wang, Y.; Tan, K.; Tang, C.; Jin, Q.; et al. Microclimatic responses to shelterbelt structural configuration in an arid cotton agroforestry system. Front. Plant Sci. 2026, 17, 1859047. [Google Scholar] [CrossRef] [Scilit]
- Heisler, G.M.; DeWalle, D.R. Effects of windbreak structure on wind flow. Agric. Ecosyst. Environ. 1988, 22–23, 41–69. [Google Scholar] [CrossRef] [Scilit]
- McNaughton, K.G. Effects of windbreaks on turbulent transport and microclimate. Agric. Ecosyst. Environ. 1988, 22–23, 17–39. [Google Scholar] [CrossRef] [Scilit]
- Cleugh, H.A. Effects of windbreaks on airflow, microclimates and crop yields. Agrofor. Syst. 1998, 41, 55–84. [Google Scholar] [CrossRef] [Scilit]
- Campi, P.; Palumbo, A.D.; Mastrorilli, M. Effects of tree windbreak on microclimate and wheat productivity in a Mediterranean environment. Eur. J. Agron. 2009, 30, 220–227. [Google Scholar] [CrossRef] [Scilit]
- Jacobs, S.R.; Webber, H.; Niether, W.; Grahmann, K.; Lüttschwager, D.; Schwartz, C.; Breuer, L.; Bellingrath-Kimura, S.D. Modification of the microclimate and water balance through the integration of trees into temperate cropping systems. Agric. For. Meteorol. 2022, 323, 109065. [Google Scholar] [CrossRef] [Scilit]
- Cleugh, H.A.; Miller, J.M.; Böhm, M. Direct mechanical effects of wind on crops. Agrofor. Syst. 1998, 41, 85–112. [Google Scholar] [CrossRef] [Scilit]
- Nuberg, I.K. Effect of shelter on temperate crops: A review to define research for Australian conditions. Agrofor. Syst. 1998, 41, 3–34. [Google Scholar] [CrossRef] [Scilit]
- Zheng, X.; Zhu, J.; Xing, Z. Assessment of the effects of shelterbelts on crop yields at the regional scale in Northeast China. Agric. Syst. 2016, 143, 49–60. [Google Scholar] [CrossRef] [Scilit]
- Kort, J. Benefits of windbreaks to field and forage crops. Agric. Ecosyst. Environ. 1988, 22–23, 165–190. [Google Scholar] [CrossRef] [Scilit]
- Rivest, D.; Vézina, A. Maize yield patterns on the leeward side of tree windbreaks are site-specific and depend on rainfall conditions in eastern Canada. Agrofor. Syst. 2015, 89, 237–246. [Google Scholar] [CrossRef] [Scilit]
- Liu, Y.; Li, H.; Yuan, F.; Shen, L.; Wu, M.; Li, W.; Wang, A.; Wu, J.; Guan, D. Estimating the impact of shelterbelt structure on corn yield at a large scale using Google Earth and Sentinel-2 data. Environ. Res. Lett. 2022, 17, 044060. [Google Scholar] [CrossRef] [Scilit]
- Onyewotu, L.O.Z.; Ogigirigi, M.A.; Stigter, C.J. A study of competitive effects between a Eucalyptus camaldulensis shelterbelt and an adjacent millet (Pennisetum typhoides) crop. Agric. Ecosyst. Environ. 1994, 51, 281–286. [Google Scholar] [CrossRef] [Scilit]
- Singh, H.P.; Kohli, R.K.; Batish, D.R. Impact of Populus deltoides and Dalbergia sissoo shelterbelts on wheat: A comparative study. Int. Tree Crops J. 1999, 10, 51–60. [Google Scholar] [CrossRef] [Scilit]
- Kowalchuk, T.E.; de Jong, E. Shelterbelts and their effect on crop yield. Can. J. Soil Sci. 1995, 75, 543–550. [Google Scholar] [CrossRef] [Scilit]
- Zhu, Y.W.; Wang, Y.H.; Chen, Q.M.; Wu, W.; Chu, F.F. Soil-coerced effect on farmland shelterbelt of Xinjiang 150 Regiment. Prot. For. Sci. Technol. 2010, 4, 9–11. (In Chinese) [Google Scholar] [CrossRef]
- Iwasaki, K.; Torita, H.; Touze, M.; Wada, H.; Abe, T. Modeling optimal windbreak design in maize fields in cool humid climates: Balancing between positive and negative effects on yield. Agric. For. Meteorol. 2021, 308–309, 108552. [Google Scholar] [CrossRef] [Scilit]
- Sun, Q.; Zheng, B.; Liu, T.; Zhu, L.; Hao, X.; Han, Z. The optimal spacing interval between principal shelterbelts of the farm-shelter forest network. Environ. Sci. Pollut. Res. 2022, 29, 12680–12693. [Google Scholar] [CrossRef] [Scilit]
- Luo, Y.; Hui, D.; Zhang, D. Elevated CO2 stimulates net accumulations of carbon and nitrogen in land ecosystems: A meta-analysis. Ecology 2006, 87, 53–63. [Google Scholar] [CrossRef] [Scilit]
- Gattinger, A.; Müller, A.; Haeni, M.; Skinner, C.; Fliessbach, A.; Buchmann, N.; Mäder, P.; Stolze, M.; Smith, P.; El-Hage Scialabba, N.; et al. Enhanced top soil carbon stocks under organic farming. Proc. Natl. Acad. Sci. USA 2012, 109, 18226–18231. [Google Scholar] [CrossRef] [Scilit]
- Zheng, H.; Ying, H.; Yin, Y.; Wang, Y.; He, G.; Bian, Q.; Cui, Z.; Yang, Q. Irrigation leads to greater maize yield at higher water productivity and lower environmental costs: A global meta-analysis. Agric. Ecosyst. Environ. 2019, 273, 62–69. [Google Scholar] [CrossRef] [Scilit]
- Borenstein, M.; Hedges, L.V.; Higgins, J.P.T.; Rothstein, H.R. A basic introduction to fixed-effect and random-effects models for meta-analysis. Res. Synth. Methods 2010, 1, 97–111. [Google Scholar] [CrossRef] [Scilit]
- Viechtbauer, W. Conducting meta-analyses in R with the metafor package. J. Stat. Softw. 2010, 36, 1–48. [Google Scholar] [CrossRef] [Scilit]
- Wang, L.; Li, Q.; Coulter, J.A.; Xie, J.; Luo, Z.; Zhang, R.; Deng, X.; Li, L. Winter wheat yield and water use efficiency response to organic fertilization in northern China: A meta-analysis. Agric. Water Manag. 2020, 229, 105934. [Google Scholar] [CrossRef] [Scilit]
- Hedges, L.V.; Gurevitch, J.; Curtis, P.S. The meta-analysis of response ratios in experimental ecology. Ecology 1999, 80, 1150–1156. [Google Scholar] [CrossRef]
- Veroniki, A.A.; Jackson, D.; Viechtbauer, W.; Bender, R.; Bowden, J.; Knapp, G.; Kuss, O.; Higgins, J.P.T.; Langan, D.; Salanti, G. Methods to estimate the between-study variance and its uncertainty in meta-analysis. Res. Synth. Methods 2016, 7, 55–79. [Google Scholar] [CrossRef] [Scilit]
- Dong, L.; Shi, X.Z.; Xu, S.X.; Wang, M.Y. Effects of different management practices on soil profile organic carbon in Chinese croplands: A meta-analysis. Soils 2021, 53, 1290–1298. (In Chinese) [Google Scholar]
- Hedges, L.V.; Pigott, T.D. The power of statistical tests for moderators in meta-analysis. Psychol. Methods 2004, 9, 426–445. [Google Scholar] [CrossRef] [Scilit]
- Borenstein, M.; Higgins, J.P.T. Meta-analysis and subgroups. Prev. Sci. 2013, 14, 134–143. [Google Scholar] [CrossRef] [Scilit]
- Torita, H.; Satou, H. Relationship between shelterbelt structure and mean wind reduction. Agric. For. Meteorol. 2007, 145, 186–194. [Google Scholar] [CrossRef] [Scilit]
- Wang, J.; Patruno, L.; Zhao, G.; Tamura, Y. Windbreak effectiveness of shelterbelts with different characteristic parameters and arrangements by means of CFD simulation. Agric. For. Meteorol. 2024, 344, 109813. [Google Scholar] [CrossRef] [Scilit]
- Li, Y.P.; Feng, Y.Z.; Yang, G.H. Study on the windbreak effect of farmland shelterbelts in northern arid regions. J. Northwest A&F Univ. (Nat. Sci. Ed.) 2009, 37, 92–98. (In Chinese) [Google Scholar]
- Torshizi, M.R.; Miri, A.; Davidson-Arnott, R. Sheltering effect of a multiple-row Tamarix windbreak—A field study in Niatak, Iran. Agric. For. Meteorol. 2020, 287, 107937. [Google Scholar] [CrossRef] [Scilit]
- Wu, T.; Zhang, P.; Zhang, L.; Wang, J.; Yu, M.; Zhou, X.; Wang, G.G. Relationships between shelter effects and optical porosity: A meta-analysis for tree windbreaks. Agric. For. Meteorol. 2018, 259, 75–81. [Google Scholar] [CrossRef] [Scilit]
- Potashkina, Y.N.; Koshelev, A.V. Impact of field-protective forest belts on the microclimate of agroforest landscape in the zone of chestnut soils of the Volgograd Region. Forests 2022, 13, 1892. [Google Scholar] [CrossRef] [Scilit]
- Wang, J.; Patruno, L.; Chen, Z.; Yang, Q.; Tamura, Y. Windbreak effectiveness of single and double-arranged shelterbelts: A parametric study using large eddy simulation. Forests 2024, 15, 1760. [Google Scholar] [CrossRef] [Scilit]
- Marais, Z.E.; Baker, T.P.; Hunt, M.A.; Mendham, D. Shelterbelt species composition and age determine structure: Consequences for ecosystem services. Agric. Ecosyst. Environ. 2022, 329, 107884. [Google Scholar] [CrossRef] [Scilit]
- Baker, T.P.; Moroni, M.T.; Hunt, M.A.; Worledge, D.; Mendham, D.S. Temporal, environmental and spatial changes in the effect of windbreaks on pasture microclimate. Agric. For. Meteorol. 2021, 297, 108265. [Google Scholar] [CrossRef] [Scilit]
- Veste, M.; Littmann, T.; Kunneke, A.; du Toit, B.; Seifert, T. Windbreaks as part of climate-smart landscapes reduce evapotranspiration in vineyards, Western Cape Province, South Africa. Plant Soil Environ. 2020, 66, 119–127. [Google Scholar] [CrossRef] [Scilit]
- Liu, Y.; Li, H.; Wu, M.; Wang, A.; Wu, J.; Guan, D. Estimating the legacy effect of post-cutting shelterbelt on crop yield using Google Earth and Sentinel-2 data. Remote Sens. 2022, 14, 5005. [Google Scholar] [CrossRef] [Scilit]
- Wu, Y.; Wang, W.; Wang, Q.; Zhong, Z.; Wang, H.; Yang, Y. Farmland shelterbelt changes in soil properties: Soil depth-location dependency and general pattern in Songnen Plain, Northeastern China. Forests 2023, 14, 584. [Google Scholar] [CrossRef] [Scilit]
- Reuse, C.; Langhof, M. The impact of tree height and distance on crop yields in a temperate short rotation alley cropping agroforestry system: A multi-year study. Agrofor. Syst. 2025, 99, 140. [Google Scholar] [CrossRef] [Scilit]
- Qiao, Y.; Fan, J.; Wang, Q. Effects of farmland shelterbelts on accumulation of soil nitrate in agro-ecosystems of an oasis in the Heihe River Basin, China. Agric. Ecosyst. Environ. 2016, 235, 182–192. [Google Scholar] [CrossRef] [Scilit]
- Majaura, M.; Böhm, C.; Freese, D. The influence of trees on crop yields in temperate zone alley cropping systems: A review. Sustainability 2024, 16, 3301. [Google Scholar] [CrossRef] [Scilit]
- Dufour, L.; Gosme, M.; Le Bec, J.; Dupraz, C. Does pollarding trees improve the crop yield in a mature alley-cropping agroforestry system? J. Agron. Crop Sci. 2020, 206, 640–649. [Google Scholar] [CrossRef] [Scilit]
- Hou, Q.; Brandle, J.; Hubbard, K.G.; Schoeneberger, M.; Nieto, C.; Francis, C.A. Alteration of soil water content consequent to root-pruning at a windbreak/crop interface in Nebraska, USA. Agrofor. Syst. 2003, 57, 137–147. [Google Scholar] [CrossRef] [Scilit]

Disclaimer/Publisher’s Note: The statements, opinions and data contained in all publications are solely those of the individual author(s) and contributor(s) and not of MDPI and/or the editor(s). MDPI and/or the editor(s) disclaim responsibility for any injury to people or property resulting from any ideas, methods, instructions or products referred to in the content. |
© 2026 by the authors. Licensee MDPI, Basel, Switzerland. This article is an open access article distributed under the terms and conditions of the Creative Commons Attribution (CC BY) license.