


Abstract
Hydroclimatic variability in Central China affects forest ecosystem stability, agricultural production, and regional water resources, but short instrumental records limit the long-term evaluation of recent droughts. We developed earlywood and latewood tree-ring carbon isotope discrimination (Δ13C) chronologies of Pinus massoniana from Zhushan County, Hubei Province, and reconstructed August–September Standardized Precipitation Evapotranspiration Index (SPEI) variability. During 1951–2018, latewood Δ13C showed the strongest relationship with August–September SPEI (r = 0.646, p < 0.001), and the linear regression model explained 41.7% of the observed variance. Sequential leave-20-out calibration–verification tests supported the model’s stability and predictive skill. The 1839–2022 reconstruction provides a 184-year record characterized by pronounced interannual variability and lower-frequency changes. Fourteen extreme dry years and six extreme wet years were identified using the mean ± 1.5 standard deviation criterion. The most severe dry years were 1900, 1928, 1923, 1999, and 2016, indicating that several recent droughts were also prominent in the long-term context. Spatial correlations showed that the reconstruction primarily represents moisture variability over Hubei Province and adjacent parts of Central China. These results support latewood Δ13C as a seasonal proxy for late-growing-season water-balance variability in humid subtropical forests.
1. Introduction
Central China lies in the central part of China’s eastern monsoon region and is defined here as Henan, Hubei, and Hunan Provinces [1]. The region exhibits pronounced north–south hydrothermal gradients and encompasses mountains, hills, basins, and plains. Regional precipitation is jointly influenced by the seasonal migration of the East Asian summer monsoon, topographic uplift, and large-scale circulation anomalies [2]. Although Central China is generally characterized by humid to semi-humid monsoon conditions, precipitation is unevenly distributed throughout the year. During late summer and early autumn, precipitation decreases in some areas after the midsummer maximum, and regional water balance reflects the combined effects of reduced precipitation and atmospheric evaporative demand. Recent analyses indicate that Central China experiences both persistent light droughts and short-term severe droughts, with short-term severe events exerting stronger effects on crop yields [3]. Persistent summer–autumn droughts in Central China and the middle reaches of the Yangtze River further demonstrate that high temperature, insufficient precipitation, and enhanced evaporative demand can jointly produce substantial moisture stress even in regions with relatively abundant annual precipitation [4,5]. Under climate warming, regional water-balance variability and drought risk may be further affected by rising temperature and changes in climate extremes [6]. Understanding long-term drought–wetness variability in Central China is therefore important for forest conservation, agricultural production, water-resource management, and drought-risk assessment.
Evaluating the relative severity of recent droughts within a long-term historical context requires continuous hydroclimatic records extending beyond the instrumental period. However, continuous meteorological observations in much of central and eastern China generally begin in the mid-twentieth century; the common period between the Shiyan station records and the tree-ring Δ13C chronologies used here is only 1951–2018. Although records of this length are adequate for assessing interannual climate responses, they are insufficient for fully characterizing multidecadal-to-centennial drought–wetness variability or for evaluating extreme events during the nineteenth and early twentieth centuries. Tree rings are exactly dated, annually resolved, and continuous archives that have been widely used to extend temperature, precipitation, and drought records beyond the instrumental era [7,8]. Tree-ring-based climate reconstructions place recent droughts within longer historical sequences and provide a long-term context for characterizing the historical range of drought–wetness variability [9,10].
In humid subtropical China and adjacent regions, climatic information recorded by trees has been investigated using multiple tree-ring parameters, including ring width, stable isotopes, and blue intensity [11,12,13]. Xu et al. [11] evaluated the potential of tree-ring cellulose δ18O to record precipitation variability in the lower Yangtze River region, and Xu et al. [12] subsequently reconstructed early-summer precipitation for 1845–2011. More recently, tree-ring chronologies were used to reconstruct long-term SPEI variability in southeastern coastal China [14], while tree-ring cellulose δ18O from south-central China was used to reconstruct June–October relative humidity back to 1808 [15]. These studies demonstrate that stable isotopes can preserve seasonally specific hydroclimatic information even in warm and humid environments. Tree-ring width, by comparison, may be affected simultaneously by climate, tree age, site conditions, and stand competition, whereas stable-isotope records are more directly linked to tree physiological processes and environmental moisture conditions [16]. Long-term late-summer SPEI reconstructions based specifically on latewood Δ13C nevertheless remain limited in Central China, particularly in northwestern Hubei Province.
P. massonianais widely distributed across subtropical China and is an important conifer in humid subtropical forests. Previous studies have shown that its radial growth and intrinsic water-use efficiency respond to warming and moisture deficits [17,18]. Tree-ring carbon isotope discrimination (Δ13C) is mainly governed by the balance between photosynthetic carbon assimilation rate and stomatal conductance. Under moisture stress, stomatal closure lowers intercellular CO2 concentration and reduces carbon isotope discrimination; under wetter conditions, higher stomatal conductance is generally associated with higher Δ13C values [16,19,20]. Tree-ring Δ13C therefore has a clear physiological basis for recording changes in moisture availability and drought stress during wood formation.
The timing of intra-annual wood formation determines the seasonal climate information potentially retained by different tree-ring components. Conifer earlywood and latewood are formed during different portions of the growing season and may therefore respond to distinct climate conditions [21,22]. A recent systematic review highlighted both the potential and methodological challenges of intra-annual stable-isotope analysis, including studies that divide annual rings into earlywood and latewood [23]. Intra-annual δ13C observations from semi-arid China further showed that drought effects can vary through the growing season and may be particularly evident in late-season wood formation [24]. Compared with whole-ring or earlywood records, latewood commonly forms later in the growing season and may preserve moisture information from late summer to early autumn. Records from the Shiyan meteorological station show that precipitation is concentrated from May to September, reaches its seasonal maximum in July, and declines thereafter, whereas mean and maximum temperatures generally reach their seasonal maxima in July–August before decreasing toward autumn. This seasonal transition provides a basis for evaluating whether latewood Δ13C covaries with August–September water-balance conditions.
The Standardized Precipitation Evapotranspiration Index (SPEI) integrates precipitation supply and potential evapotranspiration demand and can characterize climatic water balance over multiple timescales [25]. Compared with precipitation alone, SPEI is better suited to identifying seasonal moisture deficits intensified by high temperature and enhanced evaporative demand in warm and humid regions. In this study, we developed earlywood and latewood Δ13C chronologies from P. massoniana in Zhushan County, Hubei Province. The objectives were to (1) analyze the relationships of earlywood and latewood Δ13C with monthly and seasonal temperature, precipitation, and SPEI; (2) identify the seasonal hydroclimatic variable and response window showing the strongest relationship with latewood Δ13C; and (3) develop a long-term hydroclimatic reconstruction based on the strongest relationship identified above and assess its reliability and spatial representativeness.
2. Materials and Methods
2.1. Study Area and Tree-Ring Materials
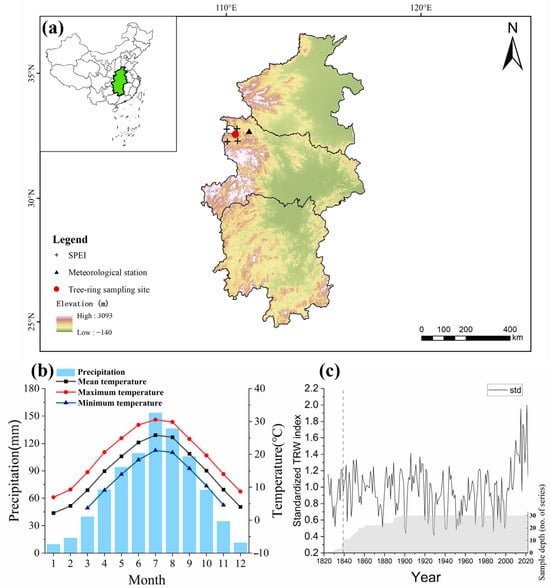
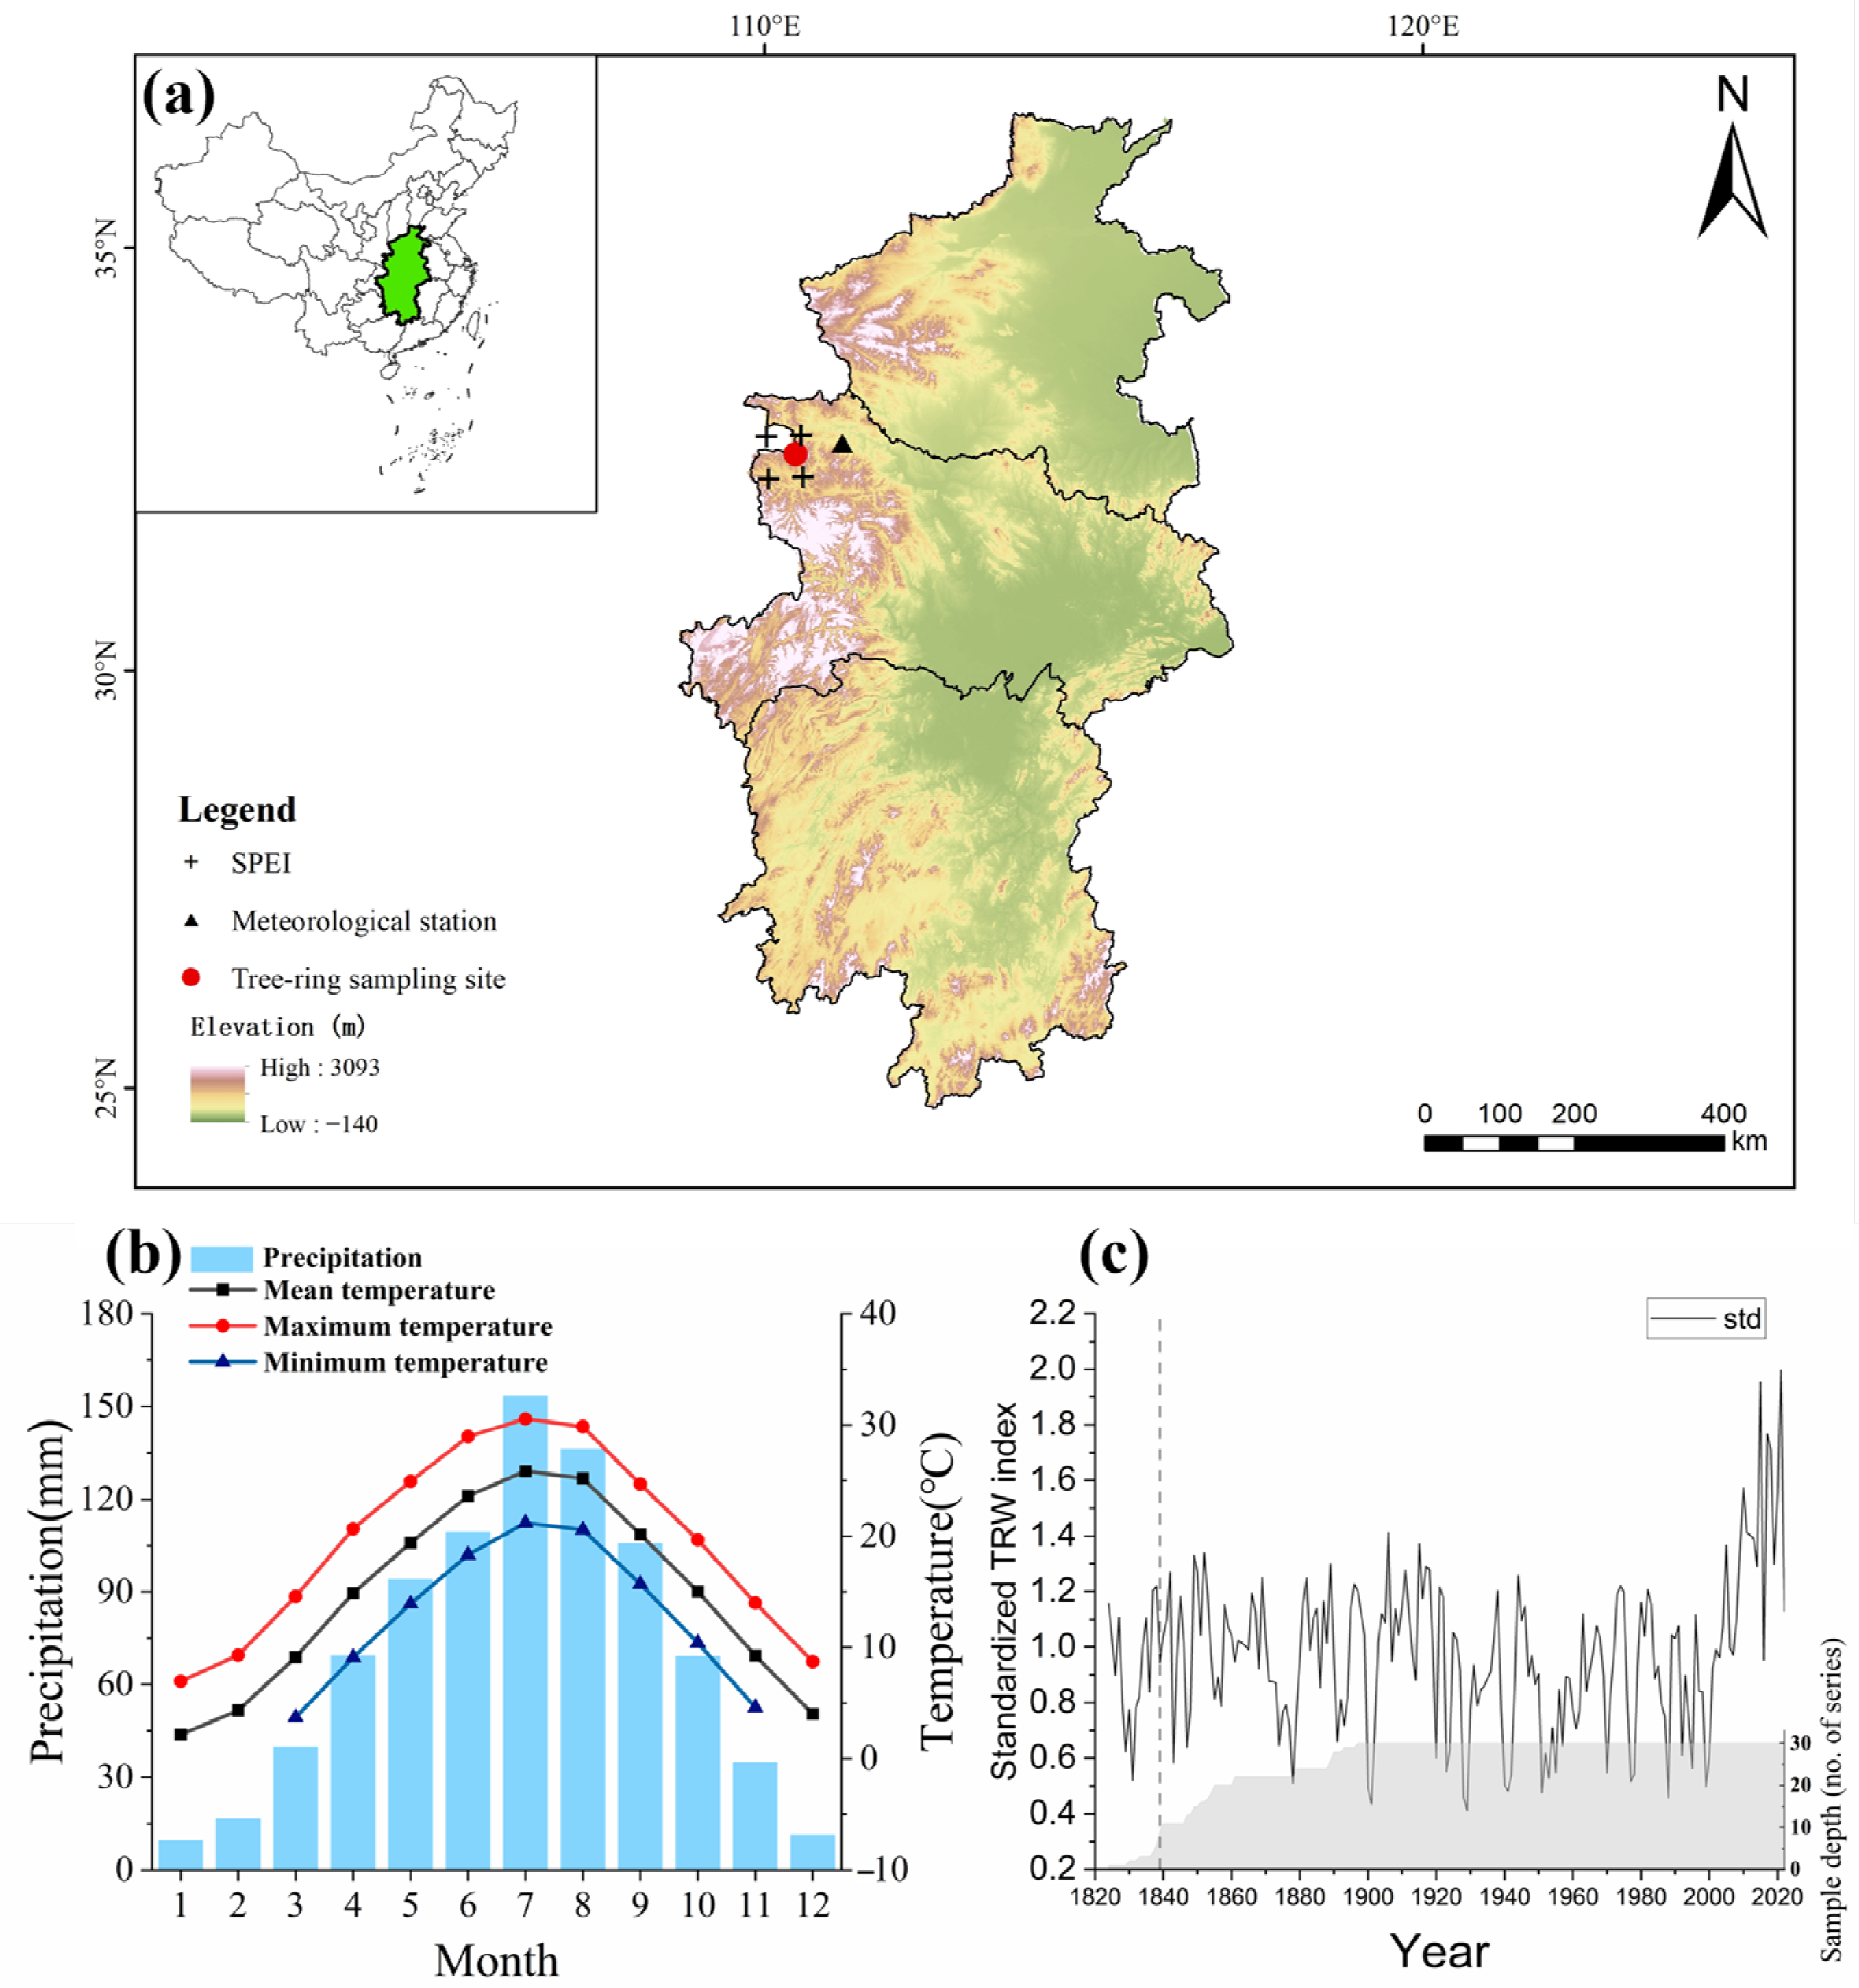
Tree-ring samples were collected near Shuiping Village, Shuangtai Township, Zhushan County, Shiyan City, Hubei Province, China (32.52373° N, 110.14978° E; 693 m a.s.l.; Figure 1a). The sampling site is located in northwestern Hubei Province, in the western part of Central China. The region is influenced by the East Asian monsoon and exhibits pronounced seasonal hydrothermal variability [2].
Figure 1.
Study area, climatic background, and tree-ring chronology of the Zhushan sampling site. (a) Location of the tree-ring sampling site in Zhushan County, Hubei Province, Central China, together with the Shiyan meteorological station and the four SPEI grid cells used in this study. (b) Climatological mean monthly precipitation and mean, maximum, and minimum temperatures at the Shiyan meteorological station during 1951–2018. (c) Standardized tree-ring-width chronology and sample depth of P. massoniana. The black line represents the annual standardized TRW chronology, the gray shaded area indicates annual sample depth, and the vertical dashed line marks the beginning of the reliable period used in this study (1839–2022).
The sampled species was P. massoniana, which is widely distributed in subtropical China. Its annual ring boundaries are relatively clear, and earlywood and latewood can be visually distinguished, making it suitable for seasonally resolved tree-ring stable-isotope analysis [7,16]. A total of 34 increment cores were collected at breast height from mature, healthy trees using an increment borer. Detailed information on individual tree age, inter-tree spacing, and stand-management history was not available for the sampled trees. Tree-ring radial width (TRW) was measured to a precision of 0.001 mm using a LINTAB 6 system (RINNTECH, Heidelberg, Germany). Cross-dating quality was further assessed using TSAP-Win and COFECHA TSAP-Win software (Version 4.64, RINNTECH, Heidelberg, Germany) and COFECHA program (Holmes, 1983) [26]. The tree-ring width chronology spans 1824–2022, and the reliable period used in this study is 1839–2022 (Figure 1c).
For stable carbon isotope analysis, six well-preserved cores from six different trees were selected from the 34 increment cores. The selected cores had clear ring boundaries, no obvious growth disturbances, and broadly consistent growth patterns. Earlywood and latewood were separated annually from each selected core for stable carbon isotope analysis.
2.2. Climate Data
Instrumental climate data were obtained from the Shiyan meteorological station (32.63° N, 110.84° E; Figure 1a), the nearest station to the sampling site. Monthly mean temperature, maximum temperature, minimum temperature, and total precipitation were used to evaluate the climate responses of the earlywood and latewood Δ13C chronologies. The common period between the tree-ring Δ13C chronologies and the instrumental records was 1951–2018, and this period was used for correlation analysis.
Monthly climate records from the Shiyan station show pronounced seasonal variations in temperature and precipitation (Figure 1b). Precipitation is concentrated mainly from May to September and reaches a maximum in July. Mean, maximum, and minimum temperatures generally peak in July–August and subsequently decline toward autumn. Thus, August–September encompasses the period immediately following the midsummer precipitation maximum and the transition from peak-summer to autumn temperature conditions.
Monthly gridded 1-month SPEI (SPEI-01) data were obtained from the CSIC SPEIbase dataset at a spatial resolution of 0.5° × 0.5° [25]. SPEI integrates precipitation and potential evapotranspiration and is therefore suitable for characterizing drought–wetness variability under changing temperature conditions. To represent hydroclimatic variability around the sampling site, SPEI values from the four surrounding 0.5° × 0.5° grid cells were averaged. For each year, August–September SPEI was calculated as the arithmetic mean of the August and September values. The resulting series was used as the target climate variable for correlation analysis and reconstruction during 1951–2018.
2.3. Earlywood–Latewood Separation, α-Cellulose Extraction, and Stable Carbon Isotope Measurement
Under a stereomicroscope, earlywood and latewood were separated annually from each core with a blade according to visible differences in wood color, density, and anatomical structure. Earlywood and latewood materials were processed separately throughout sample preparation. For each calendar year, earlywood from the six selected trees was pooled into one annual earlywood sample, and latewood from the same trees was pooled into one annual latewood sample. The pooled samples were then processed separately for α-cellulose extraction and stable carbon isotope measurement. Pooling is commonly used in tree-ring stable-isotope studies and can provide representative isotope chronologies when multiple samples are combined before analysis [27,28,29,30].
α-Cellulose was extracted from the pooled earlywood and latewood samples using a modified Jayme–Wise method [16,31,32]. The wood material was cut into small pieces and treated with absolute ethanol to remove resins, lipids, and other extractives. The samples were then purified through an acid–alkali–acid pretreatment, delignified with acidified sodium chlorite, and treated with 17.5% NaOH to remove hemicellulose and other non-cellulosic components [31,32]. After each chemical treatment, the samples were repeatedly rinsed with deionized water until neutral pH was reached. The purified α-cellulose was homogenized in deionized water using an ultrasonic cell disruptor JY92-IIN (Ningbo Scientz Biotechnology Co., Ltd., Ningbo, Zhejiang, China), freeze-dried at −50 °C for 72 h, and stored in sealed containers with desiccant until isotope measurement [33].
Approximately 0.08–0.12 mg of dry α-cellulose was weighed into tin capsules for stable carbon isotope analysis. The α-cellulose δ13C values were measured using a MAT 253 isotope-ratio mass spectrometer (Thermo Electron Corporation, Bremen, Germany) coupled to an EA Flash 2000 elemental (Thermo Fisher Scientific, Bremen, Germany) analyzer at 1050 °C. Carbon isotope composition was expressed in delta notation relative to Vienna Pee Dee Belemnite (VPDB) [34]:
where Rsample and Rstandard are the 13C/12C ratios of the α-cellulose sample and the VPDB standard, respectively. Wheat Flour Standard OAS (Elemental Microanalysis Ltd. Okehampton, UK; δ13C = −27.21‰) was used as the reference material, and one standard was measured after every ten cellulose samples to monitor instrumental stability. Analytical precision was assessed through replicate measurements, with the standard deviation maintained below 0.15‰.
To reduce the influence of long-term changes in atmospheric CO2 δ13C caused by fossil-fuel emissions, measured tree-ring δ13C values were converted to carbon isotope discrimination (Δ13C) following established theory [16,19,35]:
where δ13Ca is the δ13C value of atmospheric CO2 and δ13Cp is the measured α-cellulose δ13C value. Annual atmospheric CO2 δ13C values for the study period were obtained from the compiled atmospheric δ13CO2 records described by Belmecheri and Lavergne [36]. This compilation provides updated atmospheric δ13CO2 records extending beyond the 1850–2003 period covered by McCarroll and Loader [16]. The same annual atmospheric CO2 δ13C value was applied to both earlywood and latewood samples within each calendar year. The resulting earlywood and latewood Δ13C chronologies were then used for climate-response analysis.
2.4. Climate-Response Analysis and SPEI Reconstruction
Relationships between the earlywood and latewood Δ13C chronologies were first evaluated using Pearson correlations for contemporaneous and one-year lead–lag relationships. To assess whether their contemporaneous association was influenced by common long-term trends, linear trends were removed separately from both chronologies, and the correlation was recalculated using the detrended series. Pearson correlation analysis was used to examine the relationships between the earlywood and latewood Δ13C chronologies and monthly climate variables during the common period 1951–2018 [7]. The tested variables included monthly mean temperature, maximum temperature, minimum temperature, total precipitation, and SPEI. Single-month correlations were calculated from April of the previous year to September of the current year to evaluate lagged and current-year climate effects on tree-ring Δ13C. Based on the single-month correlation results, adjacent months showing relatively coherent or stronger relationships with the Δ13C chronologies were combined into selected current-year seasonal windows. Accordingly, February–March, May–June, June–July, and August–September were examined to evaluate seasonally integrated relationships between the earlywood and latewood Δ13C chronologies and climate variables. Pearson correlation coefficients and corresponding p-values were calculated in MATLAB R2024b (MathWorks, Natick, MA, USA) using two-tailed tests. Values of p < 0.05, p < 0.01, and p < 0.001 were used to identify progressively stronger statistical evidence.
Based on the correlation results, August–September SPEI showed the strongest seasonal relationship with latewood Δ13C. A linear regression model was therefore established between latewood Δ13C and August–September SPEI during 1951–2018, following standard dendroclimatic reconstruction procedures [7,8]:
where SPEIAug–Sep is the mean August–September SPEI averaged across the four 0.5° × 0.5° grid cells surrounding the sampling site, Δ13C is annual latewood carbon isotope discrimination, and a and b are regression coefficients. The final model was calibrated using all available instrumental data during 1951–2018 and applied to the reliable period of the latewood Δ13C chronology to reconstruct August–September SPEI for 1839–2022.
Model stability and predictive skill were evaluated using a sequential leave-20-out calibration–verification procedure, with reliability assessed based on calibration explained variance (CEV), verification explained variance (VEV), verification reduction of error (VRE), and verification coefficient of efficiency (VCE). In each iteration, a continuous 20-year segment of observed August–September SPEI was withheld for verification, and the remaining years were used for calibration. The 20-year verification window was then moved forward by one year until the entire instrumental period had been tested. Because the common period contains 68 years, the procedure generated 49 calibration–verification models. Comparable calibration–verification strategies are widely used in dendroclimatic reconstruction [7,8,37,38]. These calibration–verification statistics were used to evaluate the robustness and predictive reliability of the reconstruction.
For each iteration, calibration explained variance (CEV), verification explained variance (VEV), verification coefficient of efficiency (VCE), and verification reduction of error (VRE) were calculated to assess model performance [7,8,37,38]. CEV was calculated as:
where Ycal and Ŷcal are the observed and fitted SPEI values during the calibration period, respectively, and Ȳcal is the mean observed calibration-period SPEI. VEV was calculated as the squared correlation between observed and estimated verification-period values:
where Yver and Ŷver are the observed and estimated verification-period SPEI values, respectively. VRE and VCE were calculated as:
where Ȳver is the mean observed SPEI during the verification period. Positive VRE and VCE values indicate predictive skill relative to the calibration-period and verification-period means, respectively [7,8,37].
2.5. Spatial Representativeness, Low-Frequency Variability, Extreme-Year Identification, and SST Correlation Analysis
The spatial representativeness of the reconstructed August–September SPEI series was evaluated using the KNMI Climate Explorer, provided by the Royal Netherlands Meteorological Institute (KNMI) [39,40]. Monthly gridded SPEI data were obtained from the CSIC SPEIbase dataset at a spatial resolution of 0.5° × 0.5° [25]. The observed August–September SPEI series, averaged across the four grid cells surrounding the sampling site, was first correlated with gridded August–September SPEI during 1951–2018. The reconstructed August–September SPEI series was then correlated with gridded SPEI over the same period. The spatial extent and strength of significant correlations were used to assess regional representativeness. Statistical significance was based on p-values generated by the KNMI Climate Explorer [39,40], and only areas reaching p < 0.10 were displayed.
Possible links between August–September moisture variability and large-scale ocean–atmosphere variability were explored using spatial correlations with sea surface temperature (SST). Monthly SST data were obtained from the Hadley Centre Sea Ice and Sea Surface Temperature dataset version 1 (HadISST1), which provides global monthly SST fields at a spatial resolution of 1° × 1° from 1870 onward [41]. For each year, August–September SST was calculated as the arithmetic mean of August and September monthly SST.
To compare SPEI–SST correlation patterns between the instrumental and pre-instrumental periods, two analyses were performed. First, the observed August–September SPEI series averaged across the four surrounding grid cells was correlated with concurrent August–September HadISST1 SST during 1951–2018. Second, the reconstructed August–September SPEI series was correlated with concurrent August–September HadISST1 SST during 1870–1950. Both analyses were conducted using the KNMI Climate Explorer, and only correlations reaching p < 0.10 are shown. These analyses were used to identify possible large-scale oceanic associations and were not interpreted as direct evidence of a specific physical mechanism or causal relationship.
Low-frequency variability in the 1839–2022 reconstruction was highlighted using a fourth-order Butterworth low-pass filter. The sampling frequency was set to one observation per year, the cutoff period was 30 years, and the corresponding cutoff frequency was 1/30 year−1. Zero-phase filtering was implemented in MATLAB R2024b (MathWorks, Natick, MA, USA) using the bidirectional filtfilt function to avoid phase shifts [42]. The reconstructed August–September SPEI series contained no missing values. The filtered series was used only to describe long-term variation and did not affect model calibration, verification, or annual extreme-event identification.
Extreme dry and wet years were identified using the mean ± 1.5 standard deviation criterion applied to the reconstructed August–September SPEI series. Years below the series mean minus 1.5 standard deviations were defined as extreme dry years, whereas years above the mean plus 1.5 standard deviations were defined as extreme wet years.
3. Results
3.1. Chronology and Sample Depth
The standardized tree-ring-width (TRW) chronology spans 1824–2022 (Figure 1c). Sample depth was relatively low during the earliest part of the chronology but increased rapidly during the nineteenth century. In 1839, nine series contributed to the chronology, and sample replication continued to increase thereafter, reaching 30 series by the late nineteenth century. Based on the chronology replication and cross-dating quality, the period 1839–2022 was retained as the reliable period for subsequent analyses.
3.2. Earlywood and Latewood Carbon Isotope Chronologies
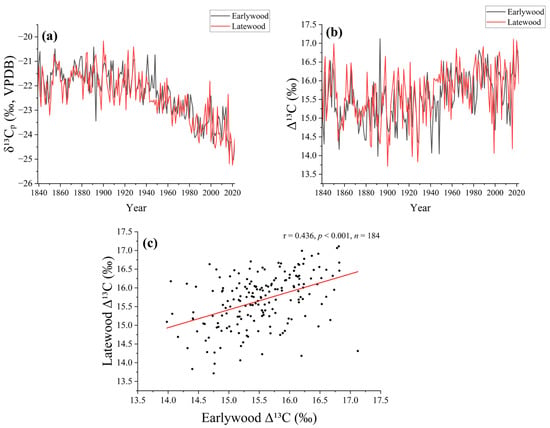
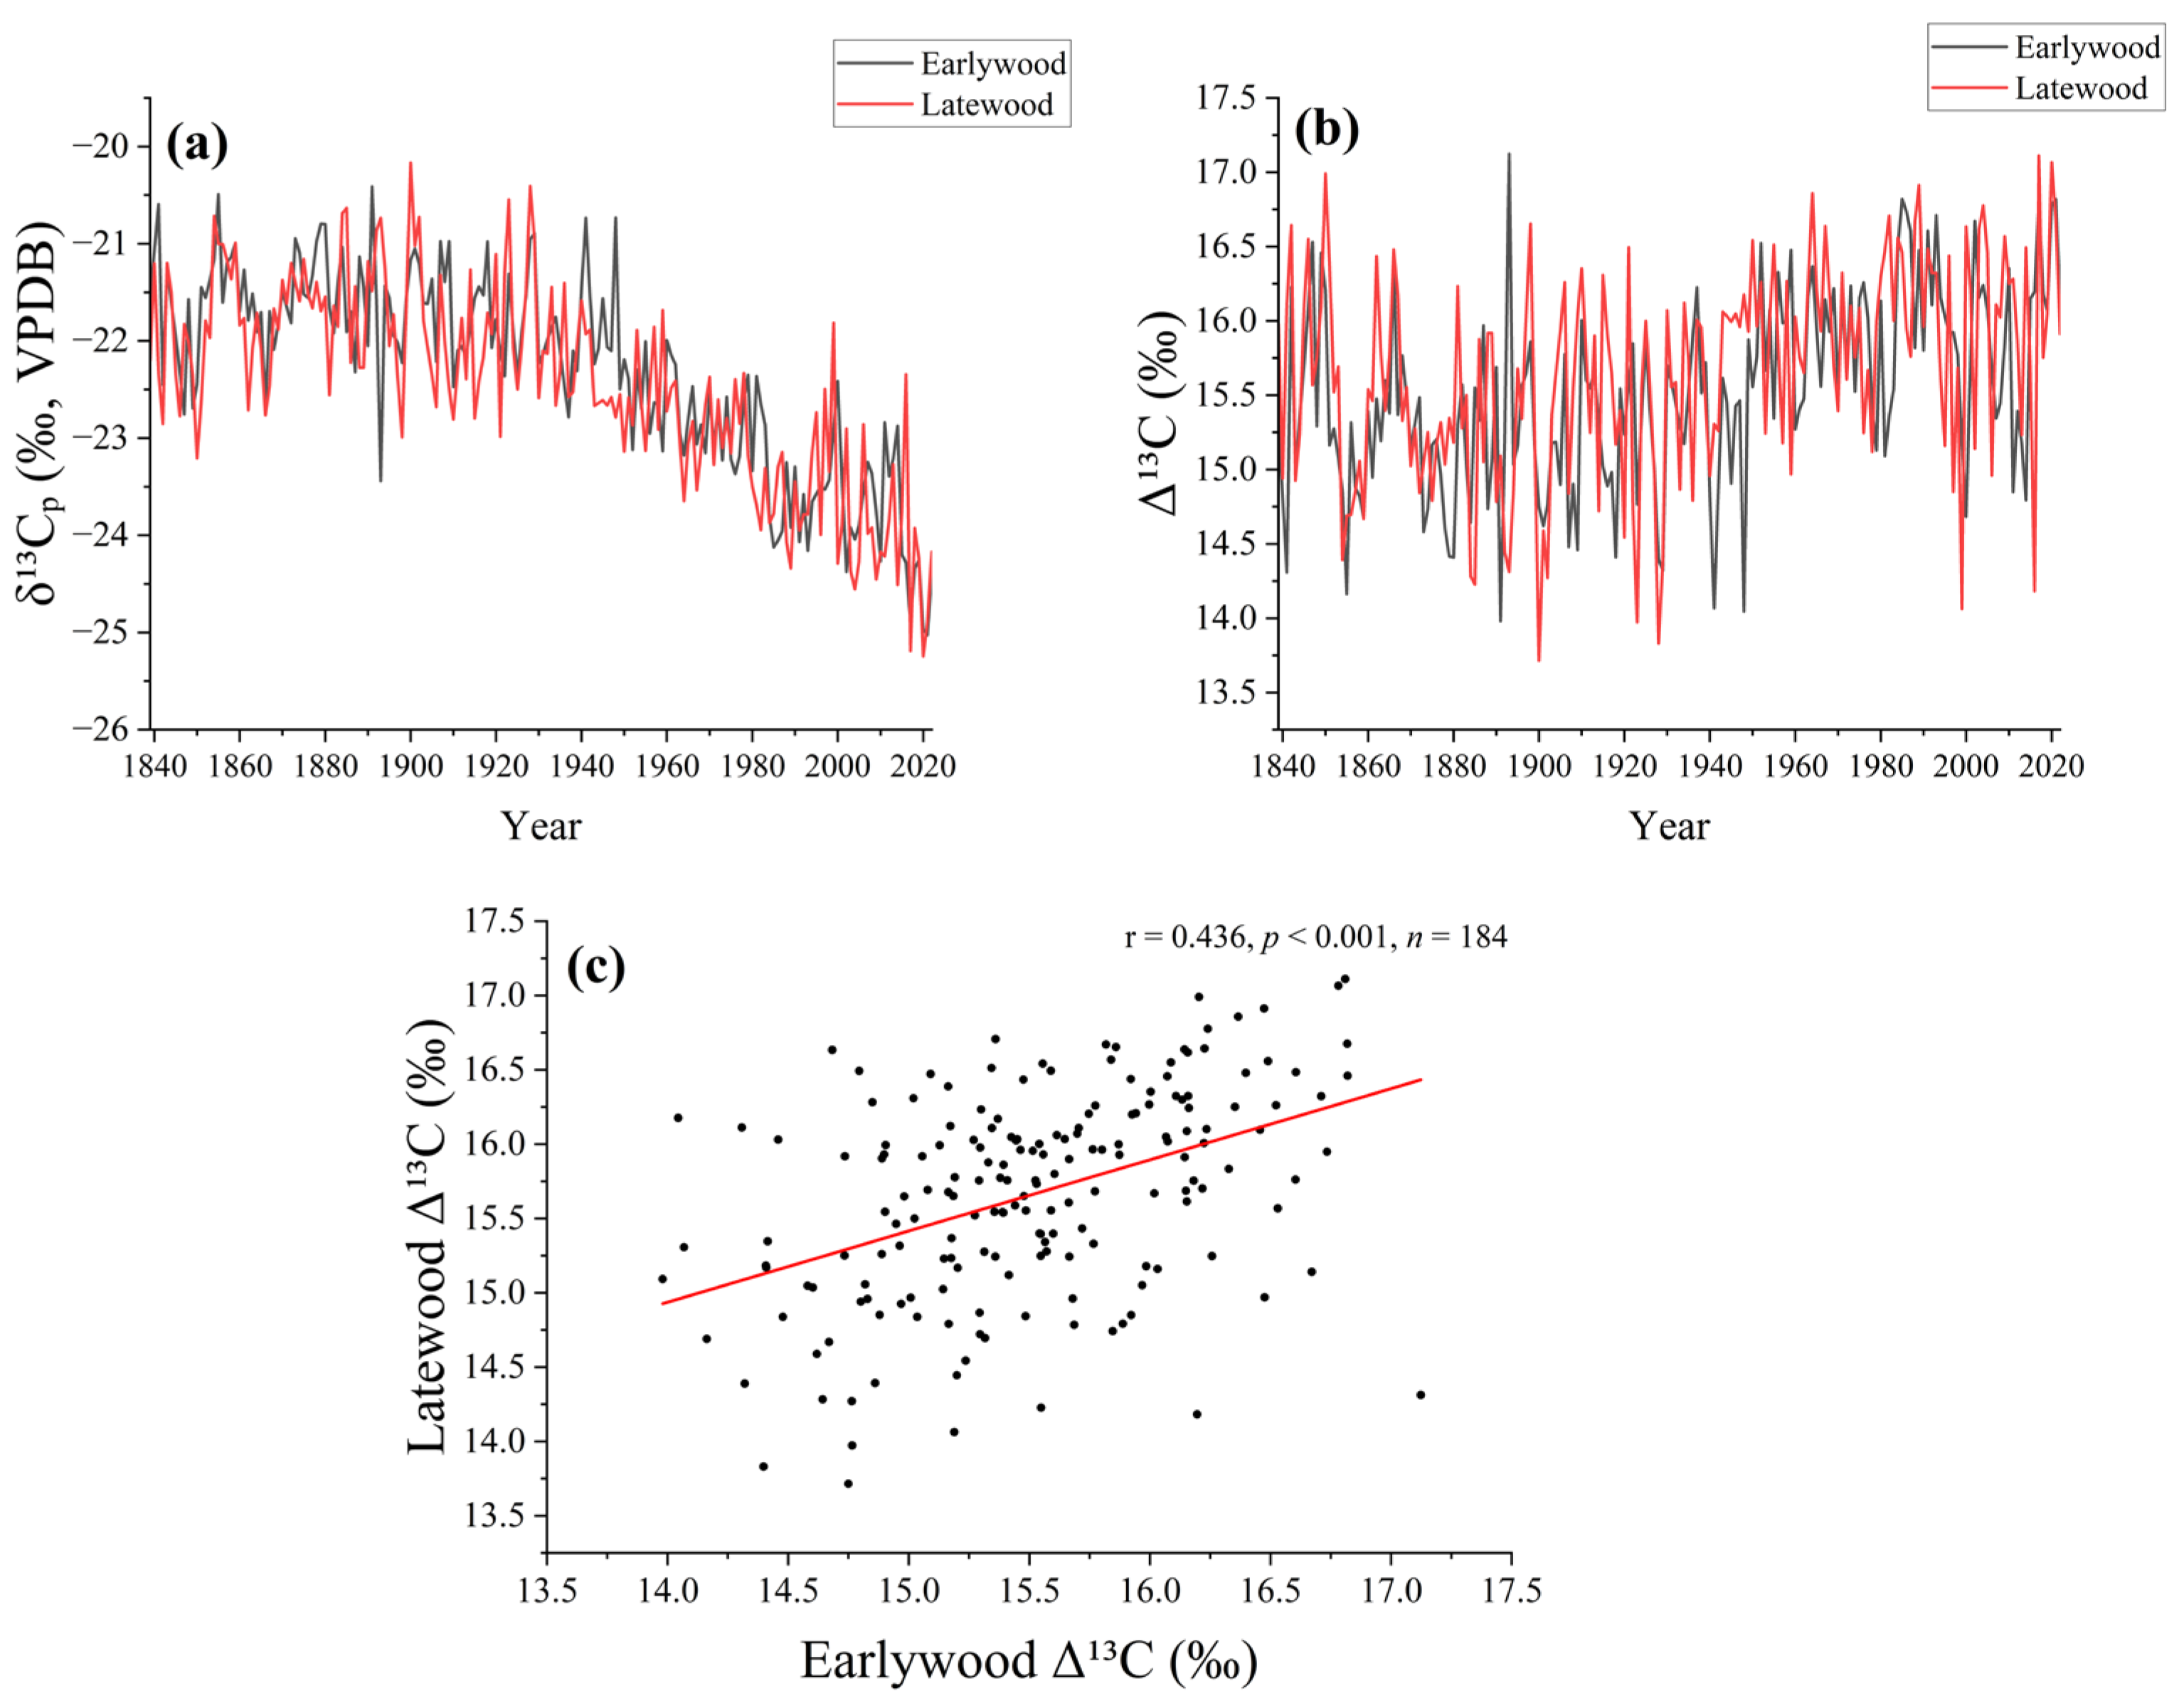
Earlywood and latewood cellulose δ13C chronologies were first examined for the period 1839–2022 (Figure 2). The measured cellulose δ13C series exhibited substantial interannual variability together with pronounced long-term changes (Figure 2a). After conversion to carbon isotope discrimination (Δ13C), both the earlywood and latewood chronologies retained marked interannual variability (Figure 2b).
Figure 2.
Earlywood and latewood carbon isotope chronologies of P. massoniana during 1839–2022. (a) Measured earlywood and latewood cellulose δ13C values. (b) Earlywood and latewood carbon isotope discrimination (Δ13C) chronologies after accounting for temporal changes in atmospheric CO2 δ13C. (c) Relationship between contemporaneous earlywood and latewood Δ13C. The red line indicates the linear regression fit.
The earlywood and latewood Δ13C chronologies showed a significant positive contemporaneous correlation (r = 0.436, p < 0.001, n = 184; Figure 2c). After removal of their respective linear trends, the contemporaneous relationship remained significant (r = 0.343, p < 0.001). Current-year earlywood Δ13C was also significantly correlated with previous-year latewood Δ13C (r = 0.327, p < 0.001), whereas its relationship with subsequent-year latewood Δ13C was weak and not statistically significant (r = 0.141, p = 0.058). These results indicate that earlywood and latewood shared part of their interannual variability while also retaining distinct intra-annual information.
3.3. Climate Response of Earlywood and Latewood Δ13C
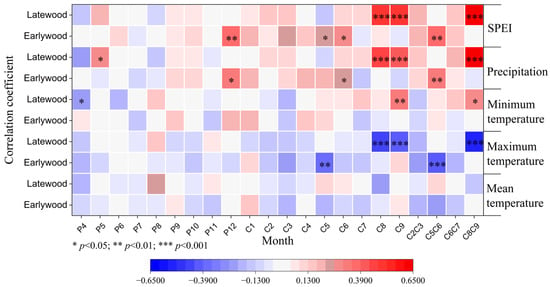
Correlations between the earlywood and latewood Δ13C chronologies and monthly or seasonal climate variables were calculated for 1951–2018 (Figure 3). Although both chronologies were analyzed, latewood Δ13C showed a stronger and more coherent relationship with late-growing-season climate conditions. Among all variables and seasonal windows examined, the highest correlation occurred between latewood Δ13C and August–September SPEI (r = 0.646, p < 0.001), indicating a strong statistical association between latewood Δ13C and late-growing-season water-balance conditions.
Figure 3.
Pearson correlations between earlywood and latewood Δ13C chronologies and monthly or seasonal climate variables during 1951–2018. Climate variables include mean temperature, maximum temperature, minimum temperature, precipitation, and SPEI. Monthly correlations were calculated from April of the previous year to September of the current year, and selected seasonal windows were also tested. Asterisks indicate statistical significance: * p < 0.05, ** p < 0.01, and *** p < 0.001. Prefixes P and C denote months of the previous and current years, respectively.
The seasonal correlation pattern further supports this interpretation. Latewood Δ13C was significantly and positively correlated with August SPEI (r = 0.488, p < 0.001) and September SPEI (r = 0.477, p < 0.001), and the correlation strengthened when August and September were combined. Precipitation showed a similar seasonal pattern: latewood Δ13C was positively correlated with August precipitation (r = 0.473, p < 0.001), September precipitation (r = 0.424, p < 0.001), and August–September precipitation (r = 0.609, p < 0.001). These results indicate that latewood Δ13C is sensitive to moisture availability across the late growing season rather than to a single month alone.
Among the temperature variables, maximum temperature showed the clearest inverse response. Latewood Δ13C was negatively correlated with maximum temperature in August (r = −0.443, p < 0.001), September (r = −0.400, p < 0.001), and August–September (r = −0.556, p < 0.001). Higher late-summer maximum temperatures were therefore generally associated with lower latewood Δ13C values, potentially reflecting increased evaporative demand and enhanced moisture stress under warmer conditions. This interpretation is consistent with the physiological basis of carbon isotope discrimination in C3 plants, in which water stress reduces stomatal conductance and Δ13C [16,19]. Responses to mean and minimum temperature were weaker and less coherent than those to SPEI and precipitation.
Because SPEI integrates precipitation supply and potential evapotranspiration, it provides a more comprehensive representation of water-balance conditions than precipitation or temperature alone [25]. The significant positive relationship indicates that higher latewood Δ13C values generally correspond to wetter late-growing-season conditions, whereas lower values correspond to drier conditions. August–September SPEI was therefore selected as the reconstruction target.
3.4. Calibration and Verification of the August–September SPEI Reconstruction
A linear regression model was established using the significant positive relationship between latewood Δ13C and August–September SPEI during 1951–2018. The validated model was then applied to reconstruct August–September SPEI for 1839–2022. The reliability of the reconstruction was assessed using calibration–verification statistics, including explained variance, reduction of error, and coefficient of efficiency. The final equation was:
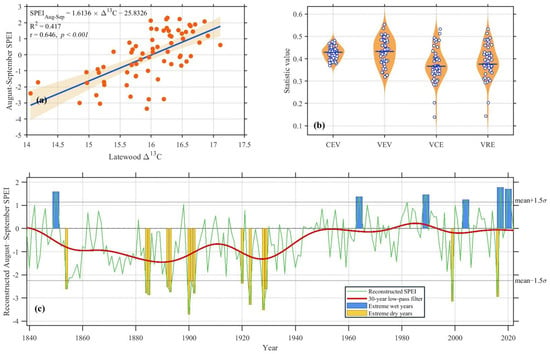
The model explained 41.7% of the variance in observed August–September SPEI, with r = 0.646 (p < 0.001; Figure 4a). This level of explained variance indicates a statistically significant association between latewood Δ13C and late-growing-season moisture conditions. The remaining variance may reflect other climatic influences, local site conditions, biological effects, and measurement or reconstruction uncertainty.
Figure 4.
Calibration, verification, and reconstruction of August–September SPEI based on latewood Δ13C. (a) Linear regression between latewood Δ13C and observed August–September SPEI during 1951–2018; orange dots represent individual observations, the blue line indicates the linear regression fit, and the shaded area indicates the 95% confidence interval. the shaded area indicates the 95% confidence interval. (b) Distributions of sequential leave-20-out calibration–verification statistics, including calibration explained variance (CEV), verification explained variance (VEV), verification coefficient of efficiency (VCE), and verification reduction of error (VRE); blue hollow circles represent individual statistical values, and horizontal lines indicate medians. horizontal lines indicate medians. (c) Reconstructed August–September SPEI during 1839–2022. The green line represents annual reconstructed values, and the red line represents the fourth-order Butterworth 30-year low-pass filtered series. Blue bars indicate extreme wet years and yellow bars indicate extreme dry years identified using the mean ± 1.5 standard deviation criterion.
The sequential leave-20-out procedure generated 49 calibration–verification models over 1951–2018. Model performance remained stable across the moving calibration and verification windows (Figure 4b). Mean CEV and VEV values were 0.426 and 0.430, respectively, indicating that the model explained approximately 40% of the variance in both calibration and verification periods. Mean VCE and VRE values were 0.373 and 0.386, respectively. All 49 verification tests yielded positive VCE and VRE values, indicating that the regression model retained predictive skill throughout the calibration–verification procedure.
Together, the significant calibration relationship and consistently positive verification statistics support the use of latewood Δ13C to reconstruct August–September SPEI back to 1839. Because the reconstruction is based on a linear model with moderate explained variance, however, it should be interpreted as an estimate of regional late-growing-season drought–wetness variability rather than an exact reproduction of observed SPEI.
3.5. Reconstructed August–September SPEI Variability Since 1839
The calibrated regression model was used to reconstruct August–September SPEI for 1839–2022 from the latewood Δ13C chronology (Figure 4c). The reconstruction shows pronounced interannual variability, indicating frequent alternation between dry and wet conditions over the past 184 years. Reconstructed SPEI ranges from −3.70 in 1900 to 1.78 in 2017, with a mean of −0.56 and a standard deviation of 1.13. These values indicate substantial year-to-year variation in late-growing-season moisture conditions in parts of Central China represented by the reconstruction.
The 30-year low-pass filtered series indicates lower-frequency variation in reconstructed August–September SPEI. Filtered values were generally lower from the late nineteenth century to the early twentieth century and gradually approached the full-period mean after the mid-twentieth century. Pronounced interannual variability nevertheless persisted throughout the reconstruction, and individual severe dry or wet years occurred even during periods with relatively stable low-frequency conditions.
Using the mean ± 1.5 standard deviation criterion, the thresholds were −2.25 for extreme dry years and 1.14 for extreme wet years. Fourteen extreme dry years and six extreme wet years were identified during 1839–2022 (Table 1).
Table 1.
Extreme dry and wet years identified from the reconstructed August–September SPEI series.
The five most severe reconstructed dry years were 1900, 1928, 1923, 1999, and 2016, with SPEI values of −3.70, −3.52, −3.29, −3.14, and −2.95, respectively. Many extreme dry years occurred from the late nineteenth century to the early twentieth century, including 1884, 1885, 1892, 1893, 1900, 1901, 1902, 1920, 1923, 1928, and 1929. This clustering indicates that severe late-growing-season droughts were relatively frequent during this interval. The occurrence of 1999 and 2016 among the five driest reconstructed years also shows that recent drought events were prominent within the full 184-year context.
Extreme wet years were less frequent and were distributed more widely through time. The identified years were 2017, 2020, 1850, 1989, 1964, and 2004, with reconstructed SPEI values of 1.78, 1.71, 1.58, 1.46, 1.37, and 1.24, respectively. The larger number of extreme dry years than extreme wet years indicates more frequent severe negative than positive departures in the reconstruction, although this pattern partly depends on the selected threshold and the statistical properties of the regression model.
Overall, the reconstruction indicates pronounced interannual variability and lower-frequency changes in August–September moisture conditions since 1839. Severe droughts were relatively frequent from the late nineteenth century to the early twentieth century, whereas low-frequency values during the late twentieth and early twenty-first centuries were generally closer to the series mean, despite individual severe drought years.
3.6. Spatial Representativeness of the Reconstruction
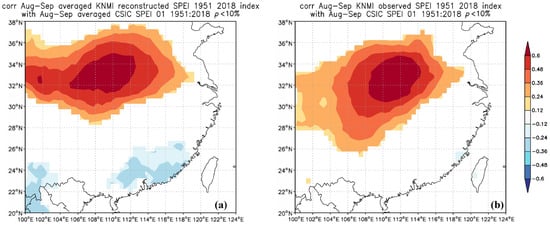
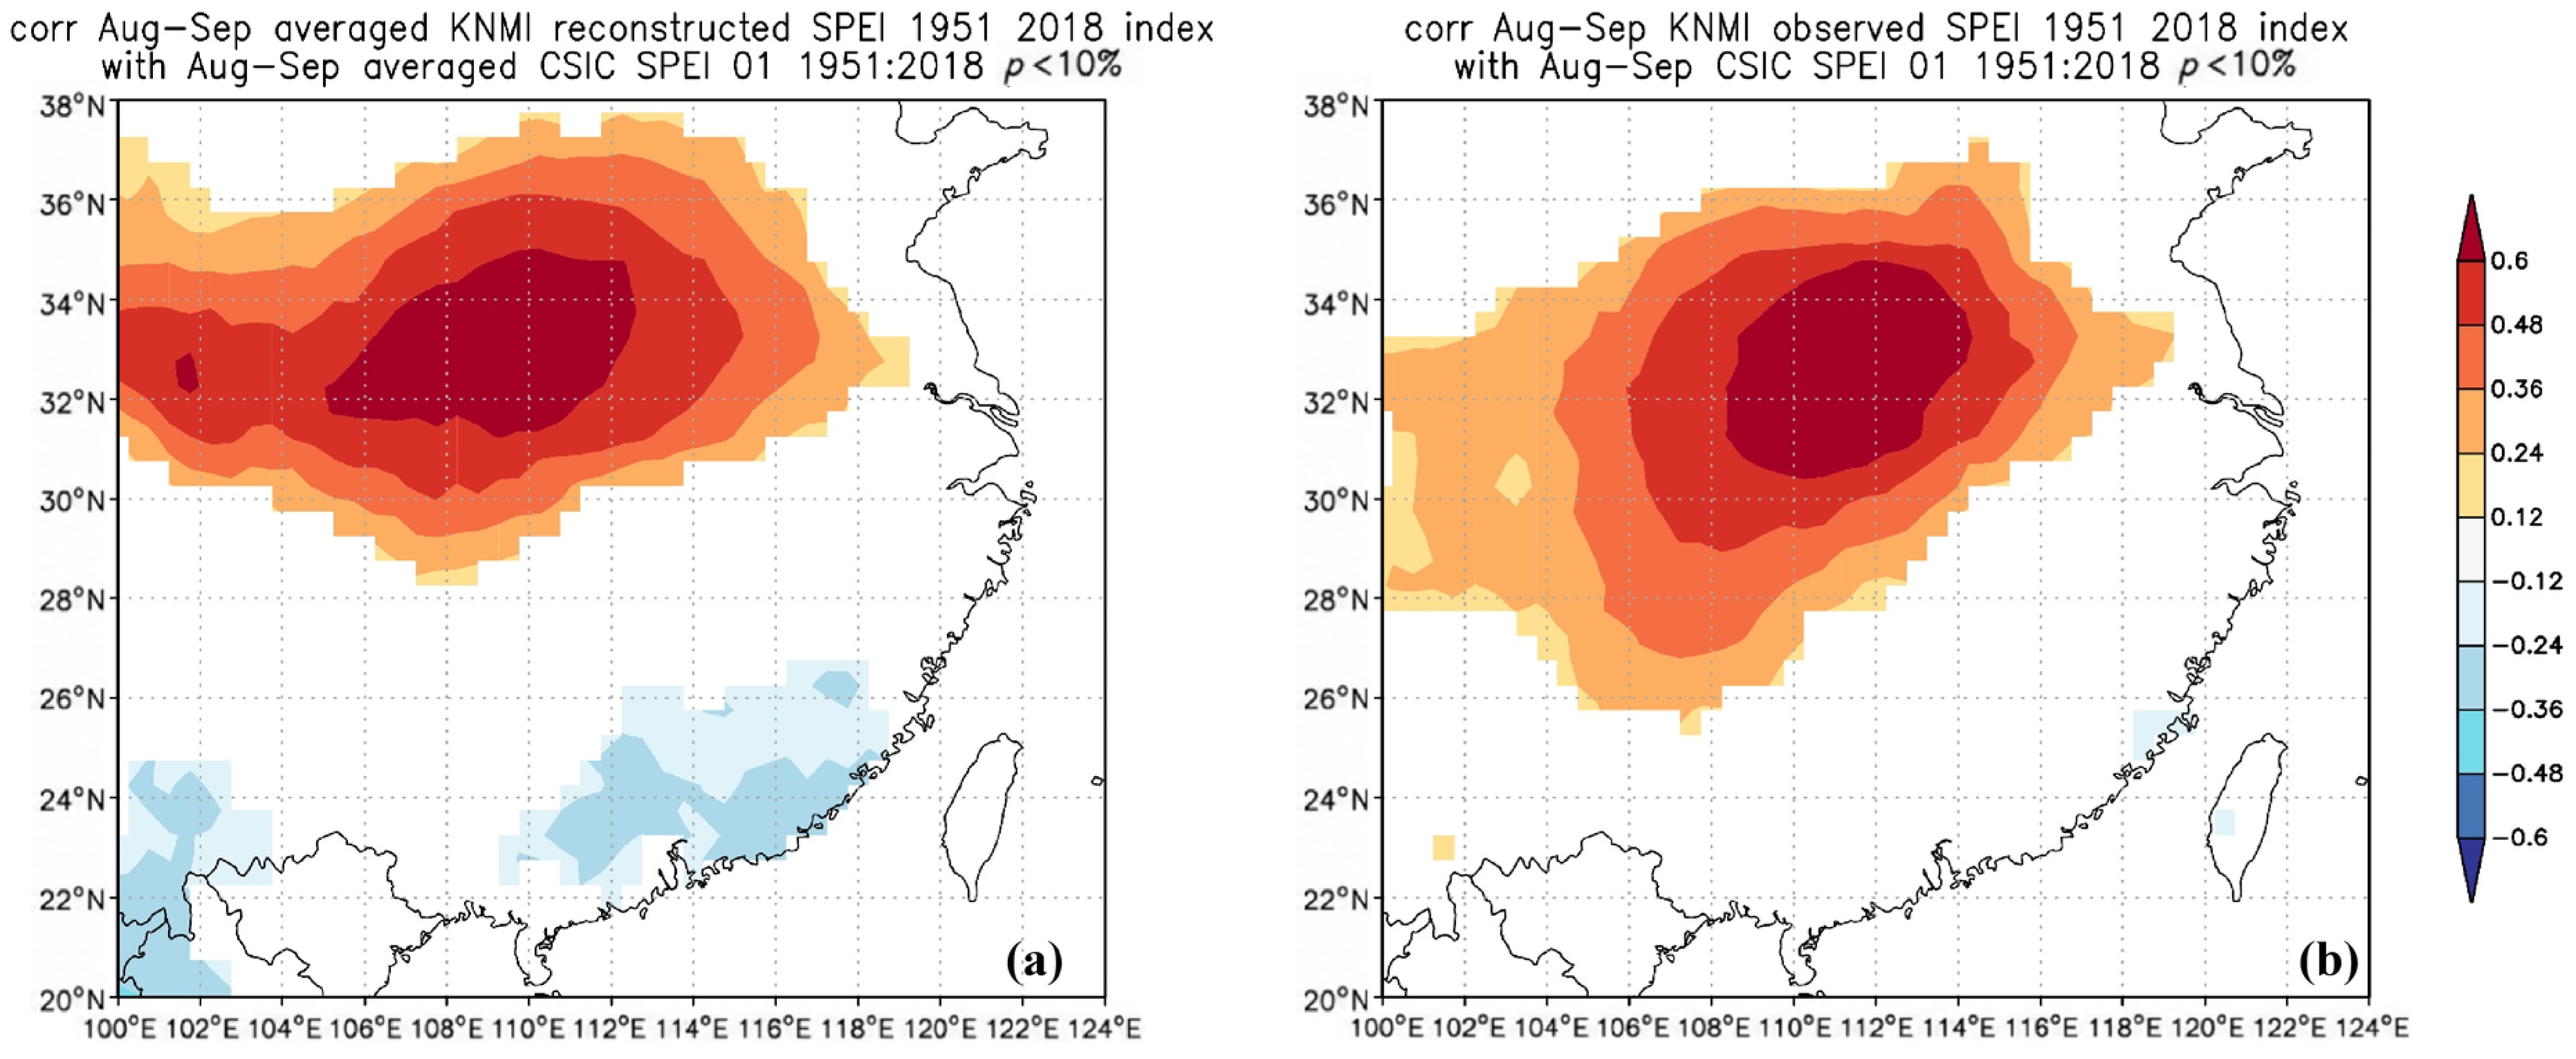
The spatial representativeness of the latewood Δ13C-based reconstruction was evaluated by correlating reconstructed August–September SPEI with gridded August–September SPEI during 1951–2018. For comparison, the observed August–September SPEI series averaged across the four grid cells surrounding the sampling site was correlated with gridded SPEI over the same period (Figure 5).
Figure 5.
Spatial correlations between gridded August–September CSIC SPEI-01 and (a) the latewood Δ13C-based reconstructed August–September SPEI series and (b) the observed August–September SPEI series averaged across the four grid cells surrounding the sampling site during 1951–2018. Only correlations reaching p < 0.10 are shown.
The reconstructed series showed a relatively coherent field of significant positive correlations across Central China (Figure 5a). The main positive region was centered over Hubei Province and adjacent areas and extended into other parts of Central China. This pattern indicates that the reconstruction represents regional drought–wetness variability in addition to local moisture variability near the sampling site. Correlation strength and spatial continuity varied among areas, however, indicating that representativeness is not spatially uniform across Central China.
The observed August–September SPEI series showed a broadly similar spatial pattern, with significant positive correlations also concentrated over Hubei Province and adjacent areas (Figure 5b). Agreement in the principal correlation center indicates that the latewood Δ13C reconstruction retains the main regional spatial pattern of the observed target series. The reconstructed field extended farther in the east–west direction than the observed field. This difference may reflect variation in the regional signal-to-noise structure represented by the proxy and the local target series, as well as sampling uncertainty, and should not be interpreted as evidence of stronger spatial representativeness.
Weak negative correlations occurred in parts of South China, but these areas were spatially separated from the dominant positive field and were not considered representative of the primary spatial pattern of the reconstruction. Overall, the spatial correlations indicate that the reconstruction mainly represents late-summer to early-autumn moisture variability over Hubei Province and adjacent parts of Central China. Because correlation strength is not uniform across the region, the series should not be interpreted as having equal representativeness throughout Central China.
3.7. Spatial Correlations Between August–September SPEI and SST
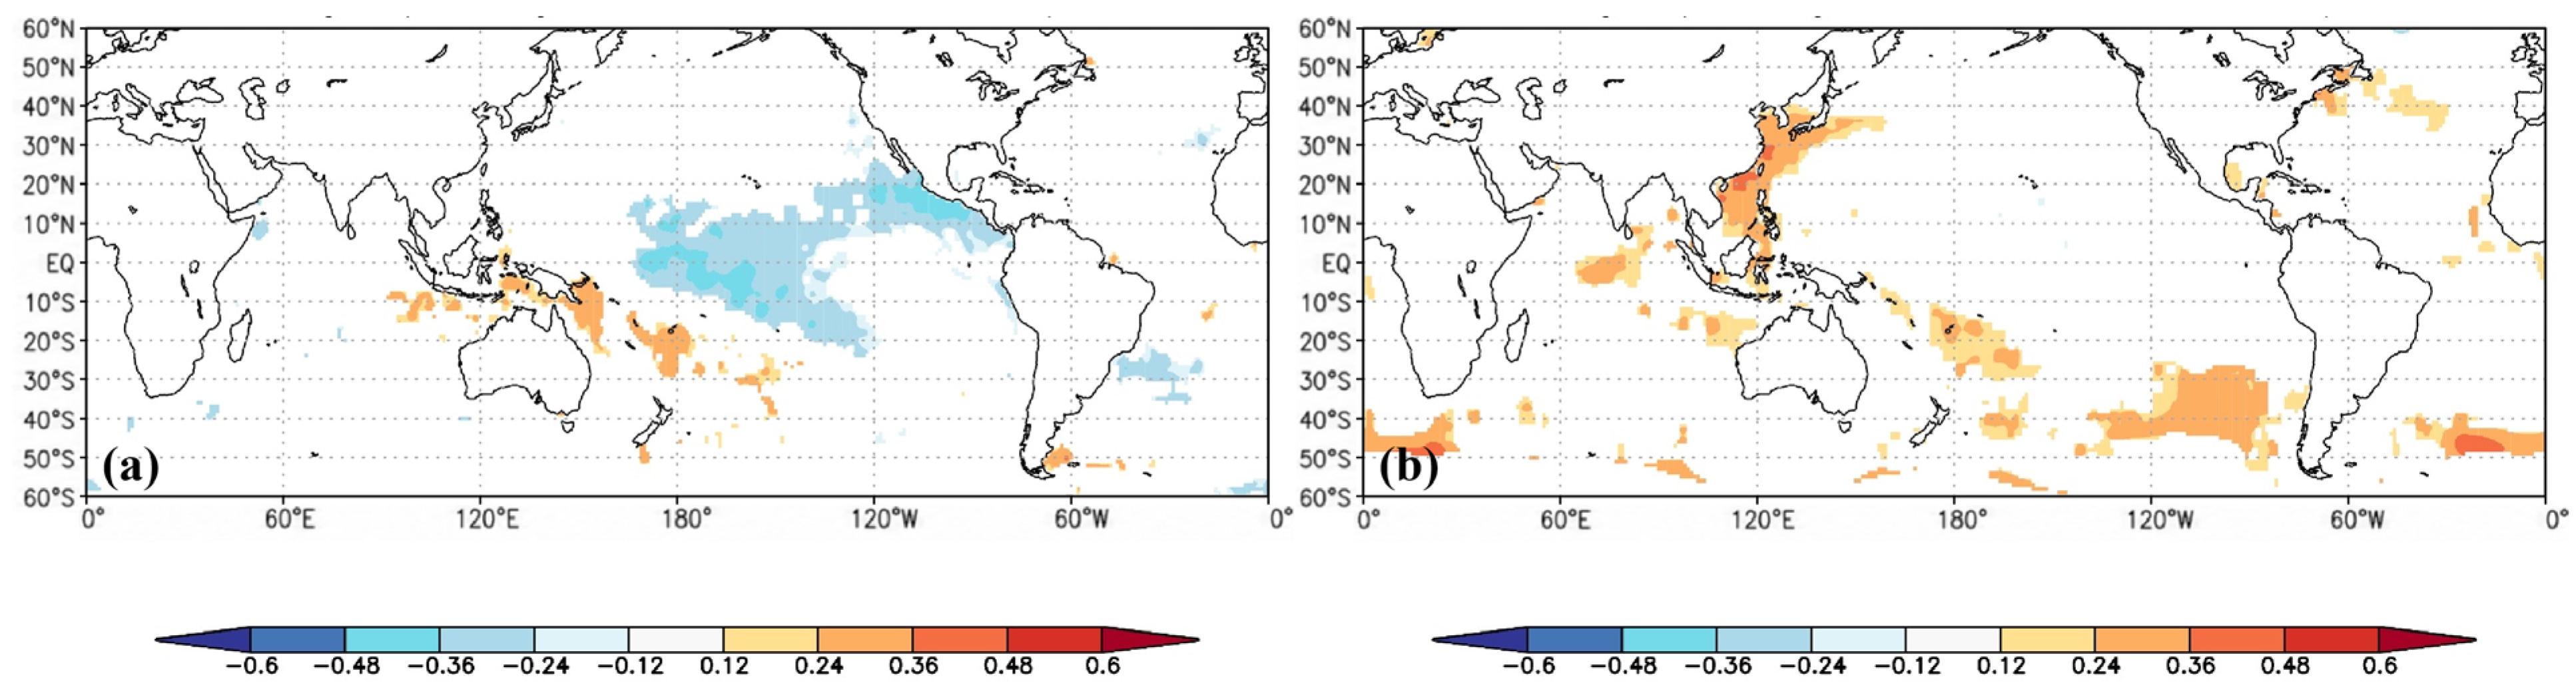
Exploratory spatial correlation analysis indicated associations between August–September SPEI and concurrent SST. During 1951–2018, observed August–September SPEI was negatively correlated with SST over parts of the central-to-eastern tropical Pacific and positively correlated with SST over parts of the western Pacific–Maritime Continent region (Figure 6a).
Figure 6.
Spatial correlations of August–September HadISST1 SST [41] with (a) the observed August–September SPEI series during 1951–2018 and (b) the reconstructed August–September SPEI series during 1870–1950. Only correlations reaching p < 0.10 are shown.
During 1870–1950, significant correlations between reconstructed August–September SPEI and SST were more spatially scattered and less coherent than those during the instrumental period (Figure 6b).
4. Discussion
4.1. Interpretation and Regional Significance of the Latewood Δ13C-Based SPEI Reconstruction
The significant relationship between latewood Δ13C and August–September SPEI indicates that latewood carbon isotope discrimination covaries strongly with late-growing-season moisture conditions [16,18]. This result is physiologically plausible because tree-ring carbon isotope discrimination is governed mainly by the balance between photosynthetic carbon assimilation rate and stomatal conductance [16,19,20]. Under dry conditions, stomatal closure lowers intercellular CO2 concentration and reduces Δ13C, whereas wetter conditions generally permit higher stomatal conductance and higher Δ13C values. In this study, latewood Δ13C was positively correlated with August–September SPEI and precipitation and negatively correlated with maximum temperature during the same period. These relationships indicate that latewood Δ13C primarily reflects late-growing-season water balance rather than temperature or precipitation alone. Comparable intra-annual δ13C evidence from Chinese pine (Pinus tabuliformis) in semi-arid China showed that drought-related δ13C responses may become particularly evident toward the end of the growing season [24], although the species, environmental setting, and intra-annual sampling approach differ from those examined here.
The selection of August–September SPEI as the reconstruction target is also supported by the seasonal climate background of the study area. SPEI incorporates both precipitation supply and atmospheric evaporative demand and is therefore suitable for characterizing drought–wetness variability under warm, humid monsoon conditions [25,43]. Precipitation in the study area reaches its seasonal maximum in July and declines thereafter, while temperatures generally peak in July–August and then decrease toward autumn. The strong relationship between latewood Δ13C and August–September SPEI therefore reflects water-balance variability during this late-growing-season transition rather than simply a period of persistently high temperature. The observed association between latewood Δ13C and August–September SPEI is therefore consistent with regional seasonality and the timing of latewood development [16,18].
The reconstruction provides a long-term perspective on August–September moisture variability in Central China since 1839. The 30-year low-pass filtered series indicates relatively dry background conditions from the late nineteenth century to the early twentieth century, during which many of the identified extreme dry years were concentrated. In contrast, the low-frequency reconstruction moved closer to the long-term mean after the mid-twentieth century, while most extreme wet years occurred during the latter half of the record, including 1964, 1989, 2004, 2017, and 2020. This temporal contrast suggests a shift from a period characterized by more frequent severe negative moisture anomalies toward generally less negative background conditions, although substantial interannual variability and individual severe droughts persisted. Importantly, this pattern should not be interpreted as a monotonic wetting trend, because prominent recent droughts such as 1999 and 2016 remain evident and the reconstruction explains only part of the observed SPEI variability. A tree-ring cellulose δ18O reconstruction from south-central China likewise documented pronounced long-term hydroclimatic variability and increased extreme drought occurrence during the last century [15], although that record represents a different season and isotope system. Several of the most severe dry years, including 1900, 1928, and 1923, occurred before widespread instrumental observations, illustrating the value of tree-ring stable-isotope records for extending drought histories beyond the instrumental era [9,11,16]. The recent dry years 1999 and 2016 also rank among the most severe events, indicating that these droughts were prominent within the context of the past 184 years.
Spatial correlations further indicate that the reconstruction is not solely representative of local conditions. Significant positive correlations with gridded SPEI were centered over Hubei Province and adjacent areas and extended into other parts of Central China, suggesting that the latewood Δ13C chronology records regional moisture variability. Nevertheless, the reconstruction is based on a single sampling site, and the regression model explains 41.7% of observed SPEI variance. The series is therefore better regarded as an estimate of August–September drought–wetness variability over Hubei Province and adjacent parts of Central China than as an exact reconstruction of SPEI at every grid point across the entire region.
Overall, the P. massoniana latewood Δ13C chronology provides a useful seasonal proxy for reconstructing August–September SPEI variability in Central China [16,18]. The reconstruction extends regional late-summer moisture information into the nineteenth century, provides a long-term context for comparing historical and recent droughts [9,11,14,15], and supports exploratory analysis of large-scale climatic factors potentially associated with late-summer moisture variability.
4.2. Possible Oceanic Influence and Uncertainties
The SST correlation patterns identified in Section 3.7 suggest that August–September moisture variability in Central China may be linked to tropical Pacific SST anomalies and associated large-scale circulation variability. During the instrumental period, the negative correlations over parts of the central-to-eastern tropical Pacific and positive correlations over the western Pacific–Maritime Continent region resemble, in a broad sense, SST configurations that can accompany ENSO-related variability. Such anomalies may influence East Asian hydroclimate through changes in the western North Pacific circulation, the Pacific–East Asian teleconnection, and related moisture transport [44,45]. However, the present analysis was based on concurrent spatial correlations rather than a specific ENSO index, and therefore does not demonstrate a direct or stable ENSO control on the reconstructed August–September SPEI.
The weaker and more spatially scattered SPEI–SST correlations during 1870–1950 further indicate that the ocean–atmosphere association was not temporally stable. This instability may reflect changes in teleconnection strength, uncertainty in early SST fields, and uncertainty in the tree-ring reconstruction itself. The SST analysis is therefore interpreted as exploratory evidence of possible large-scale oceanic influence rather than as proof of a persistent ENSO- or SST-driven mechanism.
Several additional uncertainties should be noted. First, the reconstruction is based on a latewood Δ13C chronology from a single site, limiting its ability to represent all parts of Central China. Second, the regression model explains 41.7% of observed August–September SPEI variance, leaving a substantial proportion of moisture variability unexplained. Third, SST correlation analysis alone cannot reveal the complete physical pathway connecting oceanic anomalies to regional drought. Finally, potential age-related (ontogenetic) effects cannot be completely excluded because the exact biological ages and cambial ages represented by the individual samples were unavailable. Age-related and juvenile trends in tree-ring δ13C have been reported for Pinus species and may influence the early portions of isotope chronologies [46,47,48]. Although all trees were mature at the time of sampling, the earliest portions of the chronologies may therefore still contain age-related variability. Pooling material from multiple individuals may reduce tree-specific effects but does not necessarily eliminate systematic ontogenetic trends. This uncertainty should therefore be considered when interpreting the long-term isotope variability. Additional tree-ring stable-isotope records from Henan, Hubei, and Hunan Provinces would help better constrain the spatial extent represented by the reconstruction. Combining these records with atmospheric circulation indices, moisture-transport diagnostics, and monsoon-circulation analyses would further improve understanding of its potential mechanisms.
5. Conclusions
Latewood tree-ring Δ13C of P. massoniana from Zhushan County is strongly associated with late-growing-season moisture conditions and provides a useful proxy for reconstructing August–September drought–wetness variability in Central China. The resulting 1839–2022 SPEI reconstruction extends regional hydroclimatic information well beyond the instrumental period and reveals pronounced interannual variability together with repeated severe drought events during the late nineteenth and early twentieth centuries.
Spatial correlations indicate that the reconstruction primarily represents moisture variability over Hubei Province and adjacent parts of Central China. Several recent drought events were also prominent within the long-term record. Nevertheless, the reconstruction is based on a single sampling site and captures only part of the observed climate variance. Additional multi-site stable-isotope chronologies would help improve the spatial representativeness and robustness of future hydroclimatic reconstructions.
Author Contributions
Conceptualization, F.Z.; methodology, F.Z.; formal analysis, Y.R.; investigation, Y.R., C.C. and D.Z.; writing—original draft preparation, Y.R.; writing—review and editing, F.Z., C.C. and D.Z.; visualization, Y.R. and D.Z.; supervision, D.Z.; funding acquisition, F.Z. All authors have read and agreed to the published version of the manuscript.
Funding
This research was funded by the National Natural Science Foundation of China, grant number 42571023.
Data Availability Statement
The data supporting the findings of this study are available from the corresponding author upon reasonable request. Publicly available climate datasets used in this study are described in Section 2.2 and Section 2.5.
Conflicts of Interest
The authors declare no conflicts of interest.
References
- Cai, X.; Zhang, W.; Zhang, C.; Zhang, Q.; Sun, J.; Cheng, C.; Fan, W.; Yu, Y.; Liu, X. Identification and Spatial-Temporal Variation Characteristics of Regional Drought Processes in China. Land 2022, 11, 849. [Google Scholar] [CrossRef] [Scilit]
- Ding, Y.; Chan, J.C.L. The East Asian Summer Monsoon: An Overview. Meteorol. Atmos. Phys. 2005, 89, 117–142. [Google Scholar] [CrossRef] [Scilit]
- Sun, H.; Sun, X.; Chen, J.; Deng, X.; Yang, Y.; Qin, H.; Chen, F.; Zhang, W. Different Types of Meteorological Drought and Their Impact on Agriculture in Central China. J. Hydrol. 2023, 627, 130423. [Google Scholar] [CrossRef] [Scilit]
- Wang, R.; Li, X.; Ma, H.; Li, X.; Wang, J.; Lai, A. Persistent Meteorological Drought in the Yangtze River Basin during Summer–Autumn 2022: Relay Effects of Different Atmospheric Internal Variabilities. Atmosphere 2023, 14, 1402. [Google Scholar] [CrossRef] [Scilit]
- Liu, Y.; Yuan, S.; Zhu, Y.; Ren, L.; Chen, R.; Zhu, X.; Xia, R. The Patterns, Magnitude, and Drivers of Unprecedented 2022 Mega-Drought in the Yangtze River Basin, China. Environ. Res. Lett. 2023, 18, 114006. [Google Scholar] [CrossRef] [Scilit]
- IPCC. Climate Change 2021: The Physical Science Basis. Contribution of Working Group I to the Sixth Assessment Report of the Intergovernmental Panel on Climate Change; Masson-Delmotte, V., Zhai, P., Pirani, A., Connors, S.L., Péan, C., Berger, S., Caud, N., Chen, Y., Goldfarb, L., Gomis, M.I., et al., Eds.; Cambridge University Press: Cambridge, UK; New York, NY, USA, 2021. [Google Scholar] [CrossRef] [Scilit]
- Fritts, H.C. Tree Rings and Climate; Academic Press: London, UK, 1976. [Google Scholar] [CrossRef] [Scilit]
- Cook, E.R.; Kairiukstis, L.A. (Eds.) Methods of Dendrochronology: Applications in the Environmental Sciences; Kluwer Academic Publishers: Dordrecht, The Netherlands, 1990. [Google Scholar] [CrossRef] [Scilit]
- Feng, S.; Hu, Q.; Wu, Q.; Mann, M.E. A Gridded Reconstruction of Warm Season Precipitation for Asia Spanning the Past Half Millennium. J. Clim. 2013, 26, 2192–2204. [Google Scholar] [CrossRef] [Scilit]
- Büntgen, U.; Urban, O.; Krusic, P.J.; Rybníček, M.; Kolář, T.; Kyncl, T.; Ač, A.; Koňasová, E.; Čáslavský, J.; Esper, J.; et al. Recent European Drought Extremes beyond Common Era Background Variability. Nat. Geosci. 2021, 14, 190–196. [Google Scholar] [CrossRef] [Scilit]
- Xu, C.; Ge, J.; Nakatsuka, T.; Yi, L.; Zheng, H.; Sano, M. Potential Utility of Tree-Ring δ18O Series for Reconstructing Precipitation Records from the Lower Reaches of the Yangtze River, Southeast China. J. Geophys. Res. Atmos. 2016, 121, 3954–3968. [Google Scholar] [CrossRef] [Scilit]
- Xu, C.; Shi, J.; Zhao, Y.; Nakatsuka, T.; Sano, M.; Shi, S.; Guo, Z. Early Summer Precipitation in the Lower Yangtze River Basin for AD 1845–2011 Based on Tree-Ring Cellulose Oxygen Isotopes. Clim. Dyn. 2019, 52, 1583–1594. [Google Scholar] [CrossRef] [Scilit]
- Cao, X.; Hu, H.; Kao, P.; Buckley, B.M.; Dong, Z.; Chen, X.; Zhou, F.; Fang, K. Improved Spring Temperature Reconstruction Using Earlywood Blue Intensity in Southeastern China. Int. J. Climatol. 2022, 42, 6204–6220. [Google Scholar] [CrossRef] [Scilit]
- Cao, X.; Kao, P.-K.; Li, Y.; Zhao, Z.; Hu, H.; Hu, J.; Zhang, D.; Fang, K. Tree-Ring-Based Hydroclimatic Variability in the Southeast Coastal Region of China. Forests 2024, 15, 1813. [Google Scholar] [CrossRef] [Scilit]
- Zhao, Q.; Xu, C.; An, W.; Liu, Y.; Guo, Z. Increased Extreme Drought Events in South–Central China since the Last Century: Evidence from Oxygen Isotope Signatures Preserved in Tree Ring Cellulose. Dendrochronologia 2022, 74, 125973. [Google Scholar] [CrossRef] [Scilit]
- McCarroll, D.; Loader, N.J. Stable Isotopes in Tree Rings. Quat. Sci. Rev. 2004, 23, 771–801. [Google Scholar] [CrossRef] [Scilit]
- Li, D.; Fang, K.; Li, Y.; Chen, D.; Liu, X.; Dong, Z.; Zhou, F.; Guo, G.; Shi, F.; Xu, C.; et al. Climate, Intrinsic Water-Use Efficiency and Tree Growth over the Past 150 Years in Humid Subtropical China. PLoS ONE 2017, 12, e0172045. [Google Scholar] [CrossRef] [Scilit] [PubMed]
- Li, Y.; Dong, Z.; Chen, D.; Zhao, S.; Zhou, F.; Cao, X.; Fang, K. Growth Decline of Pinus massoniana in Response to Warming-Induced Drought and Increasing Intrinsic Water-Use Efficiency in Humid Subtropical China. Dendrochronologia 2019, 57, 125609. [Google Scholar] [CrossRef] [Scilit]
- Farquhar, G.D.; O’Leary, M.H.; Berry, J.A. On the Relationship between Carbon Isotope Discrimination and the Intercellular Carbon Dioxide Concentration in Leaves. Aust. J. Plant Physiol. 1982, 9, 121–137. [Google Scholar] [CrossRef] [Scilit]
- Francey, R.J.; Farquhar, G.D. An Explanation of 13/12C Variations in Tree Rings. Nature 1982, 297, 28–31. [Google Scholar] [CrossRef] [Scilit]
- An, W.; Liu, X.; Leavitt, S.W.; Ren, J.; Sun, W.; Wang, W.; Wang, Y.; Xu, G.; Chen, T.; Qin, D. Specific Climatic Signals Recorded in Earlywood and Latewood δ18O of Tree Rings in Southwestern China. Tellus B Chem. Phys. Meteorol. 2012, 64, 18703. [Google Scholar] [CrossRef] [Scilit]
- Zheng, Z.; Fang, K.; Chen, Y.; Dong, Z.; Zhou, F.; Li, Y. Is the Pinus massoniana Lamb. Tree-Ring Latewood Formation Influenced by the Diurnal Temperature Range in Humid Subtropical China? Forests 2022, 13, 1439. [Google Scholar] [CrossRef] [Scilit]
- Miyahara, A.A.L.; Locosselli, G.M. Challenges and Advances in Intra-Annual Tree-Ring Stable Isotope Research, a Systematic Review. Dendrochronologia 2024, 85, 126218. [Google Scholar] [CrossRef] [Scilit]
- Li, Y.; Zeng, X.; Liu, X.; Evans, M.N.; Xu, G.; Szejner, P.; Ni, P. A Seasonally Varying Tree Physiological Response to Environmental Conditions: Results from Semi-Arid China. J. Geophys. Res. Biogeosci. 2023, 128, e2023JG007455. [Google Scholar] [CrossRef] [Scilit]
- Vicente-Serrano, S.M.; Beguería, S.; López-Moreno, J.I. A Multiscalar Drought Index Sensitive to Global Warming: The Standardized Precipitation Evapotranspiration Index. J. Clim. 2010, 23, 1696–1718. [Google Scholar] [CrossRef] [Scilit]
- Holmes, R.L. Computer-Assisted Quality Control in Tree-Ring Dating and Measurement. Tree-Ring Bull. 1983, 43, 69–78. [Google Scholar]
- Leavitt, S.W. Tree-Ring Isotopic Pooling without Regard to Mass: No Difference from Averaging δ13C Values of Each Tree. Chem. Geol. 2008, 252, 52–55. [Google Scholar] [CrossRef] [Scilit]
- Liu, X.H.; Shao, X.M.; Liang, E.Y.; Chen, T.; Qin, D.H.; An, W.L.; Xu, G.B.; Sun, W.Z.; Wang, Y. Climatic Significance of Tree-Ring δ18O in the Qilian Mountains, Northwestern China and Its Relationship to Atmospheric Circulation Patterns. Chem. Geol. 2009, 268, 147–154. [Google Scholar] [CrossRef] [Scilit]
- Qin, L.; Yuan, Y.; Yu, S.; Shang, H.; Zhang, H.; Zhang, T.; Zhao, R. Responses of Radial Growth and Stable Carbon Isotopes to Climate in the Northern Tianshan Mountains. Dendrochronologia 2023, 80, 126098. [Google Scholar] [CrossRef] [Scilit]
- Móricz, N.; Mészáros, I.; Kern, Z.; Illés, G.Z.; Eötvös, C.B.; Berki, I.; Németh, T.M. Stable Isotope Insights into Contrasting Drought-Response Strategies of Five Native Broadleaf Tree Species in East Central Europe. Front. For. Glob. Change 2026, 9, 1922886. [Google Scholar] [CrossRef] [Scilit]
- Rinne, K.T.; Böttger, T.; Loader, N.J.; Robertson, I.; Switsur, V.R.; Waterhouse, J.S. On the Purification of α-Cellulose from Resinous Wood for Stable Isotope (H, C and O) Analysis. Chem. Geol. 2005, 222, 75–82. [Google Scholar] [CrossRef] [Scilit]
- Loader, N.J.; Robertson, I.; Barker, A.C.; Switsur, V.R.; Waterhouse, J.S. An Improved Technique for the Batch Processing of Small Wholewood Samples to α-Cellulose. Chem. Geol. 1997, 136, 313–317. [Google Scholar] [CrossRef] [Scilit]
- Fu, P.-L.; Grießinger, J.; Gebrekirstos, A.; Fan, Z.-X.; Bräuning, A. Earlywood and Latewood Stable Carbon and Oxygen Isotope Variations in Two Pine Species in Southwestern China during the Recent Decades. Front. Plant Sci. 2017, 7, 2050, Errattum in Front. Plant Sci. 2017, 8, 923. [Google Scholar] [CrossRef] [Scilit] [PubMed]
- Coplen, T.B. Guidelines and Recommended Terms for Expression of Stable-Isotope-Ratio and Gas-Ratio Measurement Results. Rapid Commun. Mass Spectrom. 2011, 25, 2538–2560. [Google Scholar] [CrossRef] [Scilit] [PubMed]
- McCarroll, D.; Gagen, M.H.; Loader, N.J.; Robertson, I.; Anchukaitis, K.J.; Los, S.; Young, G.H.F.; Jalkanen, R.; Kirchhefer, A.; Waterhouse, J.S. Correction of Tree-Ring Stable Carbon Isotope Chronologies for Changes in the Carbon Dioxide Content of the Atmosphere. Geochim. Cosmochim. Acta 2009, 73, 1539–1547. [Google Scholar] [CrossRef] [Scilit]
- Belmecheri, S.; Lavergne, A. Compiled Records of Atmospheric CO2 Concentrations and Stable Carbon Isotopes to Reconstruct Climate and Derive Plant Ecophysiological Indices from Tree Rings. Dendrochronologia 2020, 63, 125748. [Google Scholar] [CrossRef] [Scilit]
- Meko, D.M.; Graybill, D.A. Tree-Ring Reconstruction of Upper Gila River Discharge. Water Resour. Bull. 1995, 31, 605–616. [Google Scholar] [CrossRef] [Scilit]
- Cook, E.R.; Meko, D.M.; Stahle, D.W.; Cleaveland, M.K. Drought Reconstructions for the Continental United States. J. Clim. 1999, 12, 1145–1162. [Google Scholar] [CrossRef] [Scilit]
- Trouet, V.; van Oldenborgh, G.J. KNMI Climate Explorer: A Web-Based Research Tool for High-Resolution Paleoclimatology. Tree-Ring Res. 2013, 69, 3–13. [Google Scholar] [CrossRef] [Scilit]
- KNMI Climate Explorer. De Bilt: Koninklijk Nederlands Meteorologisch Instituut (KNMI). 2022. Available online: https://climexp.knmi.nl/start.cgi (accessed on 20 June 2026).
- Rayner, N.A.; Parker, D.E.; Horton, E.B.; Folland, C.K.; Alexander, L.V.; Rowell, D.P.; Kent, E.C.; Kaplan, A. Global Analyses of Sea Surface Temperature, Sea Ice, and Night Marine Air Temperature since the Late Nineteenth Century. J. Geophys. Res. Atmos. 2003, 108, 4407. [Google Scholar] [CrossRef] [Scilit]
- Gustafsson, F. Determining the Initial States in Forward-Backward Filtering. IEEE Trans. Signal Process. 1996, 44, 988–992. [Google Scholar] [CrossRef] [Scilit] [PubMed]
- Chen, S.; Zhang, L.; Liu, X.; Guo, M.; She, D. The Use of SPEI and TVDI to Assess Temporal-Spatial Variations in Drought Conditions in the Middle and Lower Reaches of the Yangtze River Basin, China. Adv. Meteorol. 2018, 2018, 9362041. [Google Scholar] [CrossRef] [Scilit]
- Wang, B.; Wu, R.; Fu, X. Pacific–East Asian Teleconnection: How Does ENSO Affect East Asian Climate? J. Clim. 2000, 13, 1517–1536. [Google Scholar] [CrossRef] [Scilit]
- Xie, S.-P.; Kosaka, Y.; Du, Y.; Hu, K.; Chowdary, J.S.; Huang, G. Indo-Western Pacific Ocean Capacitor and Coherent Climate Anomalies in Post-ENSO Summer: A Review. Adv. Atmos. Sci. 2016, 33, 411–432. [Google Scholar] [CrossRef] [Scilit]
- Gagen, M.; McCarroll, D.; Robertson, I.; Loader, N.J.; Jalkanen, R. Do Tree Ring δ13C Series from Pinus sylvestris in Northern Fennoscandia Contain Long-Term Non-Climatic Trends? Chem. Geol. 2008, 252, 42–51. [Google Scholar] [CrossRef] [Scilit]
- Torbenson, M.C.A.; Klippel, L.; Hartl, C.; Reinig, F.; Treydte, K.; Büntgen, U.; Trnka, M.; Schöne, B.; Schneider, L.; Esper, J. Investigation of Age Trends in Tree-Ring Stable Carbon and Oxygen Isotopes from Northern Fennoscandia over the Past Millennium. Quat. Int. 2022, 631, 105–114. [Google Scholar] [CrossRef] [Scilit]
- Kern, Z.; Nagavciuc, V.; Hatvani, I.G.; Hegyi, I.N.; Loader, N.J.; Popa, I. Evaluation of the Non-Climatic (Age-Related) Trends of Stable Oxygen and Carbon Isotopes in Swiss Stone Pine (Pinus cembra L.) Tree Rings from the Eastern Carpathians, Romania. Dendrochronologia 2023, 78, 126061. [Google Scholar] [CrossRef] [Scilit]

Disclaimer/Publisher’s Note: The statements, opinions and data contained in all publications are solely those of the individual author(s) and contributor(s) and not of MDPI and/or the editor(s). MDPI and/or the editor(s) disclaim responsibility for any injury to people or property resulting from any ideas, methods, instructions or products referred to in the content. |
© 2026 by the authors. Licensee MDPI, Basel, Switzerland. This article is an open access article distributed under the terms and conditions of the Creative Commons Attribution (CC BY) license.