


Abstract
Spaceborne LiDAR provides essential observations of forest vertical structure, yet canopy height retrievals remain vulnerable to terrain-related errors in steep mountainous forests, where terrain heterogeneity complicates attribution of error to footprint geolocation and ground elevation representation. To distinguish these effects, we used 1 m airborne laser scanning (ALS)-derived digital terrain and canopy height models (DTM and CHM) as local references in Jiuzhaigou, China. A 2 × 2 diagnostic design independently varied footprint geolocation and ground reference across four slope classes. For 2102 strictly filtered footprints, geolocation refinement slightly increased RMSE from 13.36 to 13.47 m, whereas median-based ground reference replacement reduced RMSE to 9.98 m, a 25.3% reduction. The GEDI-implied ground was closest to the footprint median below 35° but shifted toward P20–P30 in the steepest terrain. Vertical reference sensitivity showed that the exact ground-diagnostic optimum shifted between P20 and P30, whereas the footprint median consistently minimized corrected-RH98 RMSE against ALS CHM P98. The ATL03 comparison likewise showed substantially improved canopy height agreement when ALS DTM replaced Copernicus DEM as the terrain support input under otherwise identical photon processing. These results identify ground elevation representation, rather than the tested horizontal geolocation refinement, as the dominant terrain-related factor shaping GEDI–ALS canopy height disagreement in steep terrain and show that ground diagnosis and RH98 correction require different terrain-reference choices.
1. Introduction
Forest canopy height is a fundamental descriptor of forest structure and is widely used in biomass estimation, carbon cycle assessment, forest structure mapping, and ecosystem monitoring [1,2]. Accurate canopy height information is especially important in mountainous forests, where complex terrain and strong environmental gradients can cause forest structure to vary sharply over short distances. Traditional field surveys and airborne laser scanning (ALS) can provide highly accurate local measurements, but their spatial coverage is often limited by cost and terrain accessibility. Spaceborne LiDAR has broadened this observational capacity, allowing forest vertical structure to be characterized from regional to global scales [3].
Among current spaceborne LiDAR missions, the Global Ecosystem Dynamics Investigation (GEDI) and the Ice, Cloud, and Land Elevation Satellite-2 (ICESat-2) provide complementary observations of forest structure [4]. GEDI is a full-waveform LiDAR instrument mounted on the International Space Station and was designed to measure forest vertical structure and terrain elevation [1]. ICESat-2 uses the Advanced Topographic Laser Altimeter System (ATLAS) to acquire along-track photon-counting observations, from which terrain and vegetation metrics can be derived [5]. These datasets have supported canopy height studies ranging from regional assessment to global mapping. High-resolution products are also increasingly generated by integrating GEDI samples with multispectral imagery [6,7]. However, the accuracy of spaceborne LiDAR canopy height estimates varies across landscapes. Steep mountainous forests remain particularly challenging because terrain relief, canopy heterogeneity, and uncertain ground signals complicate the interpretation of LiDAR returns.
GEDI canopy and terrain estimates are influenced by terrain slope, beam sensitivity, canopy cover, waveform characteristics, and filtering strategy [8,9,10]. These effects become more pronounced in steep environments. Within a single GEDI footprint, the elevation range may be large, and the waveform-derived ground elevation may not correspond to a simple central tendency of the underlying terrain surface. Recent validation studies have therefore adopted strict footprint screening and high-quality terrain references to mitigate these slope-dependent effects [9,10,11]. These findings indicate that GEDI errors in mountainous forests should not be interpreted simply as random measurement noise. They are also linked to the way a full waveform interacts with a heterogeneous terrain canopy surface.
Among these factors, geolocation uncertainty has received particular attention as a source of systematic canopy height error. Horizontal positioning uncertainty can propagate into footprint-level GEDI estimates and can be evaluated or mitigated using high-resolution ALS references [12,13,14,15]. Roy et al. [13] quantified propagation into GEDI canopy height estimates and change detection signals in tropical forests. Tang et al. [16] proposed a grid search procedure that shifted GEDI footprint positions to improve agreement with ALS canopy height references. Shannon et al. [17] developed Bayesian approaches for quantifying spaceborne LiDAR geolocation uncertainty, while Moudrý et al. [12] demonstrated the value of geolocation-related quality screening. These studies establish that horizontal positioning errors are measurable and relevant, but they do not fully isolate their contribution from terrain-related ground reference mismatches within the same GEDI sample.
Ground elevation mismatch within the footprint support represents a related but distinct source of error. GEDI relative height metrics are derived from the cumulative waveform–energy distribution. In this study, RH98 denotes the height above the detected ground at which 98% of the cumulative returned waveform energy is reached. Any inconsistency between this GEDI-implied ground and the terrain reference can therefore propagate directly into the canopy height residual. In steep terrain, the elevation range within a 25 m footprint can be substantial. The lowest waveform mode may correspond neither to the footprint mean nor to the footprint median terrain elevation [9,18]. The minimum, lower percentiles, and median may therefore represent different physical ground levels within the same footprint. This distinction raises two related questions. The first is which footprint-scale terrain statistic best approximates the effective ground level implied by the GEDI waveform and whether this relationship changes with slope. The other is whether the same terrain statistic also minimizes corrected RH98 disagreements with ALS CHM P98. Ground-level diagnosis and canopy height correction may not share a common optimal terrain reference.
These considerations arise primarily from GEDI’s full-waveform measurement geometry, but terrain-support quality may also affect photon-counting LiDAR retrieval. Unlike GEDI, ICESat-2 canopy height retrieval depends on photon denoising, signal classification, ground photon identification, window definition, and the terrain reference used during processing [5,19]. Reliable ground photon identification remains difficult in mountainous and densely forested environments with complex topography and limited canopy penetration [19,20]. Recent evaluations also show that slope, spatial scale, and processing choices can affect both GEDI and ICESat-2 retrievals in complex terrain [17,21]. The present study therefore uses a limited ICESat-2 ATL03 comparison as complementary evidence of terrain support sensitivity, rather than as a parallel validation analysis.
Building on these advances, the present study addresses three questions. First, under strict GEDI quality filtering, does the tested ground-matching geolocation refinement improve GEDI–ALS canopy height agreement when waveform-derived RH98 is held fixed? Second, how strongly does replacing the GEDI-implied ground with an ALS-derived terrain reference reduce ALS-referenced canopy height disagreement? Third, how does the choice of the footprint-scale ALS DTM statistic affect both the ground elevation residual and corrected RH98 agreement with ALS CHM P98? These questions distinguish the terrain statistic that best represents waveform-implied ground from the statistic that best supports corrected canopy height agreement.
To address these questions, we investigated terrain-related sources of GEDI canopy height disagreement in the steep mountainous forests of Jiuzhaigou. ALS-derived DTM and CHM products served as the best available local terrain and canopy references. The specific objectives were to: (1) quantify the baseline agreement between GEDI RH98 and ALS CHM P98 across four descriptive slope classes under strict quality filtering; (2) evaluate geolocation refinement and ground reference replacement separately and jointly through Raw, Geo-only, Ground-only, and Geo+Ground states; (3) compare six footprint-scale terrain references, namely the minimum, P05, P10, P20, P30, and median, for ground diagnosis and RH98 correction; and (4) test terrain-support sensitivity using a dual-terrain ATL03 comparison with the same photon-processing framework and matched evaluation windows.
Relative to existing GEDI–ALS evaluations, this work provides a targeted diagnosis of two terrain-related mechanisms that are often examined jointly. Rather than proposing an operational correction model or a new canopy height product, the analysis uses a strictly filtered GEDI sample and local ALS reference data to isolate their respective effects. It also tests whether the terrain reference that best matches the GEDI-implied ground is the same reference that minimizes ALS-referenced corrected RH98 residuals. The findings are intended to inform sample selection, reference definition, and terrain support choices when GEDI and ICESat-2 observations are used for calibration, validation, or training in steep mountainous forests.
2. Materials and Methods
2.1. Study Area
The study area is the Jiuzhaigou region in northern Sichuan Province, China (32°53′–33°20′ N, 103°46′–104°04′ E), located in the transition zone between the eastern Tibetan Plateau and the Sichuan Basin. The region’s terrain is rugged, with deeply incised valleys and strong local variation in slope and relief. Elevations range from approximately 1170 to 4871 m above sea level, and topographic conditions often change sharply over short horizontal distances. This pronounced terrain heterogeneity makes Jiuzhaigou a suitable site for evaluating spaceborne LiDAR observations and, in particular, for examining the relative effects of the tested geolocation refinement procedure and within-footprint ground reference representation. The ALS data cover 495.18 km2 of the region, as shown in Figure 1. Within the valid ALS coverage, slopes range from 0° to 88.75°, with 80.83% of the area exceeding 25° and 60.10% exceeding 35°. Therefore, the site provides a rigorous steep-terrain setting for evaluating spaceborne LiDAR canopy height retrieval.
Figure 1.
Study area and data coverage. (a) Geographic location of the study area in China; (b) elevation of the study area; (c) land cover of the study area; and (d) coverage of the ALS reference data and the spatial distribution of GEDI footprints and ICESat-2 tracks.
The forest conditions further reinforce this diagnostic setting. Jiuzhaigou is dominated by subalpine forest ecosystems, mainly coniferous forests and mixed conifer–broadleaf stands. Vegetation and stand structure vary across the study area, producing substantial differences in canopy height and vertical organization. Potential confounding by canopy structure was evaluated using ALS-derived canopy height, canopy cover, and CHM interquartile range (IQR), together with forest fraction from the China Land Cover Dataset 2021 (CLCD2021; Section 2.6). These variables characterize canopy structure and broad land-cover context, but not species composition, which was not independently mapped. Thus, the terrain-related patterns were evaluated within a complex canopy background rather than over a uniform forest surface.
2.2. Datasets
This study used ALS-derived terrain and canopy height products as local references, GEDI Level 2A observations for the primary error analysis, and ICESat-2 ATL03 observations for terrain support sensitivity analysis. The ALS survey was conducted between April and May 2020, whereas the final GEDI sample was acquired between 14 January and 3 July 2021, corresponding to an interval of approximately 8–15 months. The complementary ATL03 analysis used eight Release 007 granules acquired between 8 January 2020 and 6 December 2021. The platform or sensor, product version, acquisition period, sampling support, and analytical role of each dataset are summarized in Table 1.
Table 1.
Summary of the main datasets used in this study.
A qualitative comparison of same-season Sentinel-2 images acquired on 27 September 2019 and 21 September 2021 did not reveal obvious stand-replacing disturbance within the ALS coverage (Figure A1). This comparison was used only to screen for major changes and could not quantify normal tree growth or seasonal canopy variability. A study of 2–4 m high-elevation Smith fir reported annual shoot growth of approximately 0.069–0.167 m yr−1. These values correspond to an order-of-magnitude height change of approximately 0.05–0.21 m over the ALS–GEDI interval [22]. Because this estimate was neither site-specific nor representative of mature forests in Jiuzhaigou, no deterministic growth correction was applied.
2.2.1. ALS Reference Data
The ALS data were acquired during multiple flights between April and May 2020 using a Cessna 208 aircraft (Textron Aviation, Independence, KS, USA) equipped with a TerrainMapper airborne LiDAR system, integrated with a NovAtel SPAN navigation unit and an LCI-100c inertial measurement unit. The system operated at a pulse repetition frequency of 1042 kHz, recorded up to four returns per pulse, and was flown at a planned altitude of approximately 300–650 m above ground level. Adjacent flight strips had a nominal cross-track overlap of 35%, and the delivered point cloud had a mean density of approximately 20 points m−2. The ALS survey required at least 4 classified ground points m−2; areas below this threshold were reflown to maintain adequate bare-earth terrain coverage beneath vegetation.
The original point-cloud elevations were recorded as ellipsoidal heights. During data production, 104 ground control points were used to support conversion to the 1985 National Height Datum through the refined Sichuan quasi-geoid model. The model has a grid spacing of 2.5′ × 2.5′ and a nominal accuracy better than 0.10 m in deep-hill and western Sichuan Plateau environments. An independent set of approximately 51 checkpoints was surveyed in May 2020 and distributed across the survey area. Each checkpoint was observed at least four times using network real-time kinematic positioning, and the averaged coordinates were used for accuracy assessment. The project quality control report documented a vertical RMSE of 0.30 m for the delivered LiDAR products.
Point-cloud processing was conducted in TerraScan (Version 019.014). Noise filtering and ground-point extraction were performed using the Ground Classification routine. Representative settings included a maximum building size of 60 m, a terrain angle of 88°, an iteration angle of 6°, and an iteration distance of 1.40 m; these parameters were adjusted locally according to terrain conditions rather than applied uniformly across the survey. Automatic classification was followed by manual inspection, filtering, and correction. Triangulated Irregular Networks (TINs) were constructed separately from classified ground and surface points and rasterized at 1 m resolution using linear interpolation to generate the DTM and DSM. The CHM was then calculated as DSM minus DTM after invalid and anomalous height values were removed.
The ALS DTM, DSM, and CHM were treated as the best available local references rather than error-free ground truth. The reported 0.30 m RMSE represents the project-level checkpoint assessment; slope- and canopy-density-stratified checkpoint statistics and independent field measurements of canopy height were not available. Previous studies have shown that ALS DTM uncertainty can increase with terrain steepness and vegetation conditions, including dense understory vegetation [23]. These published error ranges are not directly transferable to the present survey, but they reinforce the need to interpret the ALS products as high-quality local references rather than absolute ground truth.
2.2.2. GEDI L2A Data
The Global Ecosystem Dynamics Investigation (GEDI) is a full-waveform spaceborne LiDAR instrument mounted on the International Space Station. Its Level 2A (L2A) Version 2 product, obtained from the NASA Land Processes Distributed Active Archive Center (LP DAAC), provides footprint-level relative height metrics and elevation variables for forest structure and terrain applications. Each GEDI footprint has a nominal diameter of approximately 25 m, with an along-track spacing of about 60 m. GEDI operates with eight laser beams, including full-power and coverage beams; full-power beams have higher pulse energy and generally provide stronger ground returns under dense canopy conditions.
The L2A variable rh98, defined as the height above the detected ground at which 98% of cumulative waveform energy is reached, was used as the principal GEDI canopy height metric. The variables elev_lowestmode and elev_highestreturn were used as the waveform-derived ground and upper-return elevations in the error diagnosis framework. Quality control and sample construction relied on quality_flag, degrade_flag, sensitivity, solar_elevation, and beam type.
All GEDI L2A observations acquired in 2021 and intersecting the study area were collected for analysis. This year was selected after inspecting GEDI data availability from 2019 to 2021. The 2020 data did not provide usable nighttime observations over the study area, and the 2019 data yielded too few valid footprints to support the slope-stratified and diagnostic analyses. The 2021 data therefore provided the best balance between proximity to the May 2020 ALS survey and the number of valid footprints available for slope-stratified analysis. Before quality screening, 91,637 GEDI footprints intersected the study area. The detailed filtering criteria and sample attrition are presented in Section 2.3.1.
2.2.3. ICESat-2 Data
The Ice, Cloud, and Land Elevation Satellite-2 (ICESat-2) carries the Advanced Topographic Laser Altimeter System (ATLAS), a 532 nm photon-counting LiDAR. Eight ATL03 Release 007 granules acquired between 8 January 2020 and 6 December 2021 were obtained from the National Snow and Ice Data Center. The retained variables included photon elevation (h_ph), geographic coordinates, along-track distance, signal confidence (signal_conf_ph), solar elevation, spacecraft orientation (sc_orient), and beam identifiers. Only observations intersecting valid ALS coverage were considered.
ATL03 was used as a complementary terrain-support sensitivity dataset rather than as a parallel canopy height validation product. The same ATL03 observations were processed using either Copernicus DEM GLO-30 or the ALS-derived DTM as terrain support. All non-terrain processing settings were held constant between the two configurations. The wider acquisition period may affect absolute differences from the May 2020 ALS CHM, whereas the paired comparison used identical ATL03 observations and processing windows.
2.3. Data Preprocessing and Sample Screening
The GEDI and ICESat-2 analyses served different roles in this study. GEDI L2A footprints formed the primary basis for the four-state error decomposition and the DTM statistic sensitivity analysis. In contrast, ICESat-2 ATL03 observations were used as cross-sensor supporting evidence to examine whether terrain-support sensitivity was also evident for photon-counting LiDAR retrievals. The ICESat-2 analysis was therefore not designed as a parallel four-state decomposition but consisted of a dual-terrain-support ATL03 comparison in which the same photon-processing workflow was applied using two alternative terrain inputs.
Because GEDI and ICESat-2 differ substantially in measurement geometry and signal formation, separate preprocessing workflows were applied before the resulting canopy height estimates were evaluated against common ALS-derived reference metrics. The overall analytical framework, from data input and preprocessing to error diagnosis and final evaluation, is summarized in Figure 2.
Figure 2.
Overall analytical workflow of data preprocessing, error diagnosis, sensitivity analysis, and cross-sensor comparison in this study.
For GEDI, L2A footprints were screened using quality, sensitivity, beam power, and nighttime acquisition criteria. The retained footprints were then matched with ALS-derived terrain and canopy metrics within the nominal footprint support, followed by vertical harmonization between GEDI elevations and the ALS height datum. These matched samples formed the basis for the four-state error decomposition and the DTM reference sensitivity analysis described in Section 2.4 and Section 2.5.
For ICESat-2, ATL03 photons were screened according to beam strength, acquisition condition, photon quality, and terrain-support overlap. A DEM-assisted photon-processing workflow was then applied to derive window-level canopy height estimates. The dual-terrain-support design described in Section 2.2.3 was used to evaluate the sensitivity of ATL03 retrievals to terrain-support quality. All evaluations were conducted against ALS CHM P98 and summarized across four slope classes.
2.3.1. GEDI Quality Filtering and Sample Attrition
We used a conservative filtering strategy for the main GEDI sample. The aim was not to maximize footprint count, but to retain observations with reliable waveform interpretation for terrain-related error diagnosis. This was important because the four-state decomposition used the original waveform-derived RH98 and ground elevation variables. Low-quality waveforms or degraded geolocation conditions could otherwise obscure the relative contributions of footprint positioning and ground elevation representation [12,24,25]. In addition to the main strictly filtered configuration, a relaxed configuration was evaluated as a robustness check.
For the main analysis, GEDI footprints were required to satisfy quality_flag = 1 and degrade_flag = 0, thereby excluding observations affected by known acquisition anomalies or degraded geolocation conditions [1,26]. Only observations with sensitivity ≥ 0.95 were retained to ensure sufficient waveform penetration under the dense canopy. A threshold of 0.95, rather than the commonly used 0.90, was adopted because the study area is characterized by dense subalpine forests, where lower sensitivity values may lead to unreliable ground detection [27]. Nighttime acquisitions (solar_elevation < 0°) were selected to reduce the influence of solar background noise, and only full-power beams were retained to reduce uncertainty in ground detection under complex terrain [8]. Finally, only footprints falling within valid ALS coverage were preserved for subsequent matching and error diagnosis.
To assess whether the main conclusions were overly dependent on the degradation filter, a relaxed configuration was additionally evaluated. In this configuration, the requirement degrade_flag = 0 was removed, whereas all other screening criteria were kept unchanged. The relaxed configuration was not treated as a second primary workflow; instead, it was used only to test the stability of the main findings under a less restrictive sample.
The cumulative effect of these screening steps is summarized in Table 2, which reports the remaining number of GEDI footprints and the percentage of the initial sample after each filtering stage. Unless otherwise stated, all subsequent GEDI-based analyses refer to the final strictly filtered main analysis sample.
Table 2.
Quality filtering and sample attrition of GEDI L2A data.
2.3.2. ATL03 Photon Processing and Window-Level Screening
Building on the data selection described in Section 2.2.3, we applied a terrain-assisted canopy-first workflow to derive window-level ATL03 canopy heights [28,29,30]. The workflow comprised photon pre-screening, terrain-assisted denoising, multi-stage ground extraction, canopy photon identification, and relative height calculations. It was run separately with Copernicus DEM GLO-30 and the ALS-derived DTM as terrain support, while all other processing settings were held constant [30,31].
Nighttime strong-beam photons were retained. Strong beams were identified from the ATL03 sc_orient metadata, with photon-count-based identification used only when orientation metadata were unavailable or transitional. Low-confidence photons and beams without valid terrain coverage were excluded. Terrain elevations were interpolated to photon locations, and small terrain data gaps were filled subject to the maximum interpolation distance in Table 3.
Table 3.
Key parameters used for ICESat-2 ATL03 photon filtering and DEM-assisted canopy height retrieval.
Photon elevations were normalized relative to the terrain surface and filtered using the DEM-relative range specified in Table 3. Signal photons were then identified using adaptive density-based denoising. Ground photons were extracted through elevation histogram screening, spatial density refinement, and iterative TIN densification [30]. A composite reference-ground surface combined the external terrain input with a local bias estimated from classified ground photons. Non-ground signal photons within the prescribed height range above this surface were retained as canopy photons.
Relative height percentiles were calculated within 30 m along-track windows using a 15 m step [29,30]. Windows containing fewer than five valid photons were excluded, and RH98 was used as the principal ATL03 canopy height metric. Only window identifiers present in both terrain-support configurations were retained for the paired comparison. Their common ALS reference matching is described in Section 2.3.3.
2.3.3. ALS-Based Reference Matching Strategy
ALS-derived DTM and CHM products were used as the common reference surfaces for evaluating GEDI and ICESat-2 canopy height estimates. Before matching, all satellite observations and ALS raster layers were transformed into the CGCS2000 3-degree Gauss–Kruger projection used by the ALS products. Pixels with no data values and samples with insufficient valid ALS coverage within the matching support were excluded. The specific matching settings are summarized in Table 4.
Table 4.
Summary of ALS-based reference matching parameters.
For GEDI, each footprint was matched using its nominal circular support with a radius of 12.5 m. ALS CHM P98 was extracted as the reference canopy height metric for comparison with GEDI RH98. Within the same footprint support, ALS DTM statistics were also extracted, including the minimum, P05, P10, P20, P30, and median elevations. The median DTM elevation was used as the main ground reference in the ground replacement analysis, while the full set of statistics was used for the sensitivity test of alternative ground reference definitions. The mean slope within each footprint was used to summarize terrain steepness. For descriptive comparisons, footprints were grouped into four topographic classes: <15°, 15–25°, 25–35°, and >35°. These intervals were used as analytical bins to distinguish gentle, moderate, steep, and very steep terrain; they were not intended to represent forestry or ecological classes, nor were the boundaries interpreted as discrete physical thresholds.
For the geolocation refinement analysis, ALS reference metrics were extracted separately at the original and shifted GEDI footprint locations. The Raw and Ground-only states used ALS metrics extracted at the original footprint centers, whereas the Geo-only and Geo+Ground states used metrics extracted at the shifted centers.
For the ATL03 comparison, only window identifiers present in both terrain-support configurations were retained. A common slope class was assigned to each matched pair using the mean ALS-DTM slope extracted within a 15 m buffer centered on the ALS-DTM-supported window location. This same slope class was then applied to both ATL03 configurations, ensuring identical sample sizes within each slope class. ALS CHM P98 was extracted at the corresponding window location for each configuration.
2.4. Vertical Harmonization and Four-State Diagnostic Framework
Throughout the four-state framework, we treated GEDI RH98, elev_lowestmode, and elev_highestreturn as fixed waveform-derived observations that were not recalculated from the waveform. The four diagnostic states differ only in two externally imposed choices: the footprint location used to extract ALS reference metrics, and the ground reference used to compute corrected RH98. This design ensures that changes in GEDI–ALS agreement can be attributed to reference location and ground reference choices rather than to differences in waveform interpretation.
Before error decomposition, GEDI ground elevations were transformed to an approximate normal-height basis to reduce vertical reference inconsistency with the ALS DTM. The ALS point cloud had already been converted from ellipsoidal heights to the 1985 National Height Datum by the data provider using 104 ground control points and the refined Sichuan quasi-geoid model. However, this model was restricted to internal use by the ALS data production organization and was unavailable for direct sampling at GEDI footprint locations. GEDI elev_lowestmode values were therefore harmonized using EGM2008 geoid undulations:
where is the GEDI ellipsoidal ground elevation and is the EGM2008 geoid undulation [32]. Across the matched footprints, the sampled geoid undulation had a mean of −34.53 m, a standard deviation of 0.41 m, and a range from −35.25 to −33.56 m. Because EGM2008 is not identical to the regional quasi-geoid associated with the ALS height datum, this procedure was treated as approximate vertical harmonization rather than an exact datum transformation. The influence of possible residual offsets was evaluated through the vertical reference sensitivity analysis described in Section 2.6.
After vertical harmonization, the GEDI error decomposition framework was constructed as a two-factor diagnostic design. The first factor was footprint location, with two levels: original and shifted. The second factor was ground reference, with two levels: the original GEDI waveform-implied ground and the ALS-derived DTM reference. The resulting four analysis states are summarized in Table 5.
Table 5.
Four-state diagnostic design for separating GEDI geolocation and ground reference effects.
The canopy height residual for each state was defined as
where denotes the GEDI RH98 estimate under a given analysis state and denotes ALS CHM P98. This definition was used consistently in the subsequent accuracy assessment.
2.4.1. Geolocation-Only Diagnostic Step
The geolocation refinement step was designed as a diagnostic experiment rather than as an operational geolocation correction algorithm. Its purpose was to determine whether horizontal footprint adjustment alone could improve GEDI–ALS canopy height agreement when the original GEDI waveform interpretation was fixed. Specifically, GEDI RH98, elev_lowestmode, and elev_highestreturn were not recalculated or modified during this step. Only the ALS reference metrics were re-extracted at the shifted footprint locations. Therefore, the Geo-only state tested whether a horizontal shift that reduced GEDI–ALS ground elevation disagreement could also reduce canopy height residuals when the waveform-derived RH98 remained unchanged. This design differs from RH-aware geolocation optimization, in which footprint positions are adjusted directly to maximize agreement with ALS canopy height references. No independent reference for the true GEDI footprint centers was available. The estimated shifts were therefore treated as diagnostic relocations optimized against the ALS terrain reference rather than as verified geolocation corrections.
The refinement was implemented in two stages [8,13,25]. First, each footprint was shifted within a 15 m search radius at 1 m increments in projected coordinates. For each candidate shift, the vertically harmonized GEDI ground elevation was compared with the ALS DTM median extracted within the 12.5 m footprint support, and the offset minimizing the absolute ground elevation difference was retained. Second, point-wise offsets were aggregated within short beam-constrained time windows of 0.05 s, with up to 12 footprints per cluster, using a weighted-median approach. A local residual search was then performed within 3 m of the cluster-adjusted position at 0.5 m steps. For footprints on slopes below 10° where the original ground elevation mismatch was already smaller than 3 m, the original position was retained to avoid unnecessary adjustment. These thresholds were selected before the final accuracy assessment based on preliminary data inspection and prior to GEDI geolocation refinement studies, and were then kept fixed for all analyses.
Because the main geolocation refinement objective used the ALS DTM median, an additional objective-function sensitivity test was performed to evaluate whether the Geo-only result depended on this terrain reference choice. The same refinement procedure was repeated using ALS DTM P20 and P30 as alternative search targets, while all other parameters, including the search radius, time window clustering, residual search radius, low-slope no-correction rule, and sample set, were kept unchanged. The resulting Geo-only states were compared with the Raw state using the same ALS CHM P98 reference. The sensitivity test served only as a robustness check on the geolocation-only conclusion, not as an additional correction workflow.
Offset diagnostics were also generated to evaluate whether the estimated shifts were physically plausible and not dominated by boundary-seeking behavior (Figure A2). These diagnostics included the distribution of final offset magnitudes, offset directions, and slope-stratified offset distances.
2.4.2. Ground Reference Replacement and RH98 Correction
The second step assessed the role of ground elevation mismatch by replacing the GEDI-implied ground reference with an ALS-derived terrain reference extracted within the footprint support. This step quantified how GEDI–ALS RH98 disagreement changed when the ground term was replaced while the waveform-derived upper-canopy information was retained.
The ground elevation residual was defined as
where is the vertically harmonized GEDI ground elevation and is the ALS-based ground reference. In the main Ground-only implementation, was represented by the ALS DTM median within the footprint support. Corrected RH98 was then calculated as
When the GEDI ground lies below the ALS reference, becomes negative and the corrected RH98 is reduced, consistent with the expectation that an underestimated ground level inflates the raw canopy height metric. Corrected values smaller than zero, as well as footprints for which geoid undulation could not be sampled, were flagged as invalid and excluded from evaluation. In the main median-based implementation, no footprints produced negative corrected RH98 values, so this constraint did not alter the analysis sample. The four GEDI states defined above were then compared to assess the relative effects of the tested geolocation refinement and ground reference replacement.
Because the effectiveness of ground reference replacement may depend on how the ALS terrain reference is defined, an additional sensitivity analysis was conducted using alternative ALS DTM statistics, including the minimum, P05, P10, P20, P30, and median. For ICESat-2, an equivalent four-state decomposition was not applied because the ATL03 workflow already incorporated external terrain support during ground fitting. Instead, the terrain-support effect for ICESat-2 was evaluated through the dual-terrain-support ATL03 comparison described in Section 2.3.2.
2.5. DTM Reference Selection for Ground Diagnosis and RH98 Correction
The ground reference replacement described in Section 2.4 used the ALS DTM median as the main terrain reference. In steep terrain, however, a single GEDI footprint may contain a wide range of terrain elevations, and the waveform-interpreted ground does not necessarily correspond to the median terrain level [33,34,35]. This section therefore evaluates how alternative footprint-scale ALS DTM statistics influence two related but distinct targets.
The first target is the ground-level diagnostic target: identifying which ALS DTM statistic best matches the effective ground elevation implied by the GEDI waveform. The second target is the canopy height correction target: identifying which DTM statistic, when used to replace the GEDI-implied ground, yields the strongest agreement between corrected GEDI RH98 and ALS CHM P98. We test whether these two targets share the same optimal DTM reference.
For each GEDI footprint, six terrain statistics were extracted from the ALS DTM within the nominal 12.5 m radius footprint support: the minimum elevation, P05, P10, P20, P30, and the median elevation. For a given terrain reference , where , the ground elevation residual was calculated as
where is the vertically harmonized GEDI ground elevation and is the ALS DTM statistic corresponding to reference . This residual was used to evaluate the ground-level diagnostic target. A smaller absolute bias or RMSE of indicates that the corresponding terrain statistic more closely approximates the GEDI waveform-implied ground level.
The corresponding corrected RH98 was calculated as
Corrected RH98 values smaller than zero were excluded from evaluation. The corrected values were then compared with ALS CHM P98 to evaluate the canopy height correction target. In this second comparison, the optimal DTM statistic was defined as the one that produced the strongest agreement with ALS CHM P98, as indicated primarily by a lower RMSE and smaller absolute bias, with regression-based used as a complementary measure of association. The same matched GEDI footprint set was used for all candidate references so that differences among terrain statistics were not confounded by sample variation.
Slope stratification was used because within-footprint terrain elevation variation generally increases with terrain steepness, enlarging the spread among candidate DTM statistics. All results were therefore summarized for the full sample and for the four slope classes defined in Section 2.3.3: <15°, 15–25°, 25–35°, and >35°. Additional footprint-scale terrain diagnostics were calculated to support the interpretation of DTM-reference divergence, including the ALS DTM P95–P05 range and the elevation differences between the footprint median and lower-percentile references, specifically median–P30 and median–P20.
2.6. Statistical Evaluation and Robustness Analyses
GEDI footprints were the observational units, and each paired comparison was restricted to a common valid sample. Residuals were defined as the spaceborne LiDAR estimate minus the ALS reference. Agreement was summarized using bias, RMSE, MAE, and regression-based from a linear model with an intercept; was interpreted as association rather than 1:1 agreement. Pearson’s was omitted because it was redundant with in this setting. The two ATL03 terrain support configurations were evaluated descriptively on the same 4624 paired windows using a common ALS-DTM-derived slope classification.
The principal GEDI state contrasts were evaluated using 2000 clustered paired-bootstrap resamples. Beam–time clusters were sampled with replacement while preserving footprint pairing among states. Planned contrasts included Geo-only–Raw, Ground-only–Raw, Geo+Ground–Raw, and Geo+Ground–Ground-only. For each contrast, RMSE was defined as the RMSE of the adjusted state minus that of the reference state (e.g., Geo-only–Raw); negative values therefore indicate improvement. Contrasts whose 95% confidence intervals excluded zero were considered statistically supported. Separately, to assess whether the unequal slope class distribution influenced the overall state ranking, slope class imbalance was assessed through 1000 repeated balanced samples, with 136 footprints drawn without replacement from each of the four slope classes in every iteration. For each balanced sample, the overall RMSE was calculated for the Raw, Geo-only, Ground-only, and Geo+Ground states, together with the corresponding paired ΔRMSE contrasts. The resulting distributions were summarized by their medians and 2.5th–97.5th percentiles. Full results are provided in Table A6. The resulting distributions were summarized descriptively by their medians and 2.5th–97.5th percentiles. Slope was also treated continuously using a cubic B-spline with five degrees of freedom fitted to
where positive values indicate a lower absolute error after ground reference replacement. Cluster-robust uncertainty was calculated at the beam–time cluster level.
Potential canopy structure confounding was examined using ALS-derived canopy cover, CHM P98, CHM interquartile range, and CLCD2021 forest fraction. Canopy cover was defined as the proportion of valid CHM pixels exceeding 2 m, and at least 80% valid raster coverage was required. The canopy metrics were divided into tertiles, and analyses were repeated for footprints with a forest fraction and for a stricter subset with both forest fraction and canopy cover . A cluster-robust linear model related to standardized slope, canopy cover, CHM IQR, and forest fraction. CHM P98 was evaluated through stratification rather than included in the model because it also formed part of the ALS canopy height reference.
Vertical reference sensitivity was tested by adding offsets from −2.0 to +2.0 m at 0.05 m intervals to the harmonized GEDI ground elevation. ALS reference dependence was examined by comparing absolute GEDI RH98 elevation with the original ALS DSM P98, comparing the highest-return elevation with DSM P100, and calculating . Data quality sensitivity was assessed by removing only the degrade_flag = 0 criterion, while temporal sensitivity was tested by adding 0–0.30 m to ALS CHM P98 at 0.05 m intervals. These analyses were treated as robustness checks rather than separate hypothesis test families. Balanced sampling used a fixed random seed of 42; software versions and the complete analysis environment are provided in the archived code repository.
3. Results
3.1. Raw Performance of GEDI Against ALS Across Slope Classes
Raw GEDI RH98 captured the broad range of ALS CHM P98 but retained a substantial positive residual. Across the 2102 strictly filtered footprints, bias and RMSE were 10.03 and 13.36 m, respectively, with a regression-based of 0.386 (Table 6). Figure 3a–c provide the spatial context for this baseline comparison: the ALS CHM shows marked variation in canopy height, while raw GEDI RH98 and the corresponding residuals are displayed at their observed footprint locations without spatial interpolation. The Ground-only residual map in Figure 3d is discussed in Section 3.3.
Table 6.
Accuracy statistics of raw and Geo-only (geolocation refinement) GEDI RH98 across slope classes.
Figure 3.
Spatial distribution of ALS canopy height and footprint-level GEDI canopy height residuals. (a) The 1 m ALS-derived canopy height model; (b) raw GEDI RH98 at the original footprint locations; (c) residuals between raw GEDI RH98 and ALS CHM P98; and (d) residuals after median-based ground reference replacement. Residuals are GEDI RH98−ALS CHM P98; positive values indicate GEDI overestimation. Panels (c,d) share a ±30 m scale; values outside this range are clipped for display only.
When stratified by slope, the agreement between raw GEDI RH98 and ALS CHM P98 varied across terrain classes. Raw GEDI–ALS agreement deteriorated with terrain steepness: the RMSE increased from 5.82 m in the <15° class to 16.24 m in the >35° class (Table 6). Thus, a clear slope-dependent residual pattern was already present before either diagnostic adjustment.
3.2. Effect of Geolocation Refinement on GEDI Canopy Height Agreement
To evaluate the effect of the tested ground-matching refinement, raw GEDI RH98 was compared with the Geo-only state using the same footprint set (Figure 4; Table 6). Offset diagnostics showed that the geolocation refinement procedure was not dominated by boundary-seeking behavior (Figure A2). Final offsets were mostly concentrated within the 15 m search radius, with a median magnitude of 5.87 m and a 95th percentile of 12.70 m.
Figure 4.
Overall comparison of Raw and Geo-only GEDI RH98 against ALS CHM P98. (a) Scatterplot of Raw GEDI RH98 against ALS CHM P98. (b) Scatterplot of Geo-only GEDI RH98 against ALS CHM P98. (c) Residual distributions of Raw GEDI RH98 across slope classes. (d) Residual distributions of Geo-only GEDI RH98 across slope classes. Residuals and bias were defined as GEDI RH98 minus ALS CHM P98. The dashed line indicates the 1:1 line, and the solid line indicates the fitted regression line.
In this diagnostic step, the original waveform-derived RH98 values were retained, whereas the spatial correspondence between GEDI footprints and ALS reference surfaces was updated according to the geolocation refinement procedure. At the full-sample level, Geo-only did not improve the full-sample comparison. The RMSE increased from 13.36 to 13.47 m, bias changed from 10.03 to 10.08 m, and decreased from 0.386 to 0.372. The paired clustered bootstrap supported this small adverse change ( m, 95% CI: +0.01 to +0.23 m; Table 6, Table A1).
The slope-stratified results further confirmed the limited effect of geolocation refinement. Geo-only produced no consistent RMSE reduction across slope classes. Even in the >35° class, RMSE increased slightly from 16.24 to 16.34 m, while decreased from 0.338 to 0.321. Thus, the slope-dependent degradation in GEDI canopy height agreement remained evident after footprint adjustment.
To evaluate whether the limited effect of geolocation refinement was caused by the use of the ALS DTM median as the search target, an objective-function sensitivity test was conducted using alternative lower-percentile terrain references. The results showed that the Geo-only state remained ineffective regardless of whether the geolocation search minimized the difference between GEDI lowest-mode elevation and the ALS DTM median, P20, or P30 (Table A2). At the full-sample level, changing the geolocation search target from the ALS DTM median to P20 or P30 did not alter this result. The overall Geo-only RMSE remained between 13.45 and 13.48 m, compared with 13.36 m for Raw, and no consistent slope-class improvement was observed. The Geo-only conclusion is therefore not an artifact of the median-based objective function.
Overall, the geolocation-only adjustment did not remove the positive, slope-dependent residual structure in GEDI RH98, even when lower-percentile terrain references were used as alternative search targets. Thus, none of the tested ground-matching objectives improved GEDI–ALS RH98 agreement in the strictly filtered sample.
3.3. Relative Effects of Geolocation Refinement and Ground Reference Replacement
Across the 2102 strictly filtered footprints, ground reference replacement changed GEDI–ALS agreement much more than the tested geolocation refinement. Relative to the Raw state, Ground-only reduced bias from 10.03 to 7.69 m and RMSE from 13.36 to 9.98 m, while the regression-based increased from 0.386 to 0.584. Geo-only slightly increased the RMSE to 13.47 m, whereas Geo+Ground, although better than Raw, remained less effective than Ground-only, with a bias of 9.62 m, an RMSE of 12.37 m, and an of 0.469 (Figure 4 and Figure 5; Table 6 and Table 7). The spatial comparison showed the same general pattern: Ground-only reduced the prevalence of large positive residuals along many GEDI tracks, although positive residuals remained in several areas (Figure 3d).
Figure 5.
Overall comparison of Ground-only and Geo+Ground GEDI RH98 against ALS CHM P98. (a) Scatterplot of Ground-only corrected RH98 against ALS CHM P98. (b) Scatterplot of Geo+Ground corrected RH98 against ALS CHM P98. (c) Residual distributions of Ground-only corrected RH98 across slope classes. (d) Residual distributions of Geo+Ground corrected RH98 across slope classes. Residuals and bias were defined as GEDI RH98 minus ALS CHM P98.
Table 7.
Accuracy statistics of Ground-only and Geo+Ground GEDI RH98 across slope classes.
The paired clustered-bootstrap contrasts supported this state ranking. Ground-only reduced the RMSE relative to Raw by 3.38 m (95% CI: −3.92 to −2.84 m), corresponding to a 25.3% reduction under the natural slope distribution of the matched sample. Geo+Ground produced a smaller reduction of 1.00 m relative to Raw (95% CI: −1.23 to −0.76 m). Adding geolocation refinement after ground reference replacement increased the RMSE by 2.39 m (95% CI: +1.88 to +2.89 m), indicating that the combined state did not provide an additional benefit beyond Ground-only at the full-sample level (Table A1).
The response to ground reference replacement varied substantially with terrain steepness. Ground-only increased the RMSE by 0.94 m in the <15° class (95% CI: +0.38 to +1.52 m) and produced no statistically supported change in the 15–25° class. It reduced the RMSE by 0.91 m in the 25–35° class (95% CI: −1.58 to −0.29 m) and by 4.97 m in the >35° class (95% CI: −5.67 to −4.25 m). The incremental effect of geolocation refinement after Ground-only showed the opposite terrain dependence. It reduced the RMSE by 0.47 m in the <15° class; however, in the >35° class, it increased the RMSE from 11.27 to 14.86 m, with a paired of +3.60 m (95% CI: +2.93 to +4.29 m; Table 6 and Table 7 and Table A1).
To formally assess sensitivity to unequal slope-class sample sizes, we evaluated 1000 balanced subsamples containing 136 footprints from each slope class. Median RMSE values were 10.52, 10.62, 8.73, and 9.95 m for Raw, Geo-only, Ground-only, and Geo+Ground, respectively (Table A6; Figure 6a). The median Ground-only−Raw ΔRMSE was −1.79 m (2.5th–97.5th percentiles: −2.32 to −1.28 m), whereas Geo-only−Raw was +0.10 m (−0.08 to +0.28 m). Thus, equalizing slope-class sample sizes preserved the four-state ranking and the relative advantage of Ground-only. Treating slope continuously led to the same interpretation: the fitted Ground-only benefit crossed zero in the low-to-mid 20° range, and its lower 95% confidence bound became positive at approximately 28° (Figure 6). Thus, the terrain-dependent response was not created by either the predominance of >35° footprints or the selected slope-class boundaries. The 0–0.30 m growth offset sensitivity analysis also produced only minor changes in absolute RMSE and did not alter the state ranking; under the maximum 0.30 m scenario, Raw and Ground-only RMSEs remained 13.14 and 9.75 m, respectively.
Figure 6.
Robustness of the GEDI diagnostic results to slope-class imbalance and slope discretization. (a) Distribution of RMSE contrasts from 1000 repeated balanced subsamples with 136 footprints per slope class. Negative ΔRMSE indicates improvement relative to the first state in each contrast. (b) Cluster-robust spline relationship between continuous slope and the absolute-error improvement produced by Ground-only. Positive values indicate lower absolute error after ground reference replacement; shading denotes the 95% confidence interval.
We next examined whether the slope-dependent Ground-only response could be explained by differences in canopy structure or broad land cover context. Slope was only weakly correlated with CHM P98, canopy cover, CHM IQR, and CLCD forest fraction (), but was more strongly related to Ground-only absolute-error improvement (). In the cluster-robust model, slope remained positively associated with improvement after controlling for canopy cover, CHM IQR, and forest fraction (2.82 m per standard deviation; 95% CI: 2.44–3.21 m; Table A3). The same slope-dependent pattern remained in the forest-dominant () and conservative forest () subsets; in the >35° class, Ground-only reduced the RMSE by 4.85 and 4.03 m, respectively. These results indicate that the measured canopy structure variables and broad land cover context did not account for the stronger Ground-only benefit in steep terrain.
Overall, within the strictly filtered sample and the tested diagnostic framework, ground reference replacement produced the largest reduction in GEDI–ALS RH98 disagreement, particularly in steep terrain. The tested geolocation refinement provided no stable full-sample benefit and weakened the Ground-only result in the steepest terrain. These findings describe the relative effects of the two tested diagnostic operations and should not be interpreted as evidence that GEDI geolocation uncertainty is generally negligible.
3.4. DTM-Reference Effects on GEDI Ground Diagnosis and RH98 Correction
Section 3.3 showed that Ground-only produced the largest reduction in GEDI–ALS RH98 disagreement among the tested states. This section first examines which footprint-scale ALS DTM statistic best matches the GEDI-implied ground and then evaluates the same statistics as references for RH98 correction. A complementary absolute elevation analysis further assesses the dependence introduced by using products from the same ALS survey for correction and evaluation.
3.4.1. Ground-Level Diagnostic Target Across DTM References
To examine which footprint-scale ALS DTM statistic best represented the effective ground level implied by GEDI, the vertically harmonized GEDI ground elevation was compared with six alternative terrain references: the minimum, P05, P10, P20, P30, and the median. Under the nominal EGM2008 harmonization, the GEDI ground residual changed systematically across the six candidate ALS DTM references. Bias decreased from +6.96 m for the footprint minimum to +0.58 m for P30 and then became negative (−2.34 m) for the footprint median. P30 yielded the lowest full-sample RMSE of 5.87 m, compared with 6.00 m for P20 and 6.93 m for the median (Figure 7; Table 8). Thus, P30 provided the closest full-sample match to the GEDI-implied ground under the nominal vertical reference treatment.
Figure 7.
Sensitivity of GEDI ground elevation residuals to alternative ALS DTM references. (a) RMSE of GEDI ground elevation residuals by slope class. (b) Bias of GEDI ground elevation residuals by slope class. Positive bias indicates that the harmonized GEDI ground elevation is higher than the corresponding ALS DTM statistic.
Table 8.
Overall comparison of GEDI ground elevation residuals and corrected RH98 under alternative ALS DTM references.
The slope-stratified results showed that this full-sample pattern did not apply uniformly across terrain conditions. The footprint median produced the lowest ground-residual RMSE in all three classes below 35°, whereas lower-percentile references provided closer agreement in the >35° class. In the steepest terrain, the RMSE decreased to 6.55 m for P20 and 6.65 m for P30, compared with 8.45 m for the median (Table A4). This transition coincided with the increasing spread of terrain elevations within the footprint: both the DTM P95–P05 range and the vertical separation between the median and lower-percentile references increased markedly with slope (Figure A3). Consequently, the GEDI-implied ground was increasingly aligned with the lower portion of the footprint-scale terrain distribution as terrain became steeper.
The vertical reference sensitivity analysis qualified the exact percentile ranking. When constant offsets from −2.0 to +2.0 m were applied to the harmonized GEDI ground elevation, the minimum-RMSE reference shifted between P20 and P30 for both the full sample and the steepest slope class (Figure A4). The robust result was therefore not that P30 represented a unique ground optimum, but that the closest agreement generally occurred within the P20–P30 range under steep-terrain conditions. Because all absolute ground elevations shared the same regional topographic gradient, candidate references were distinguished primarily by bias and RMSE rather than R2.
3.4.2. Canopy Height Correction Target Across DTM References
The canopy height results showed a different optimum from the ground-level comparison. When corrected GEDI RH98 was evaluated against ALS CHM P98, the footprint median yielded the lowest full-sample residual among the tested DTM references (Figure 8; Table 8). Median-based correction produced the lowest bias (7.69 m), the lowest RMSE (9.98 m), and the highest regression-based R2 (0.584). By comparison, the RMSE increased progressively as the DTM reference shifted toward lower percentiles, reaching 19.12 m when the minimum reference was used. The terrain statistic that most closely matched GEDI ground elevation was therefore not the same as the one that minimized the corrected RH98 residual against ALS CHM P98.
Figure 8.
Sensitivity of corrected GEDI RH98 to alternative ALS DTM references. (a) RMSE by slope class; (b) bias by slope class.
The slope-stratified results further showed that the effect of median-based ground reference replacement became more favorable with increasing terrain steepness. In the <15° class, the RMSE increased from 5.82 m in the raw state to 6.76 m after median-based ground reference replacement. In the 25–35° class, the RMSE decreased from 9.70 to 8.79 m. The largest benefit occurred in the >35° class, where median-based correction reduced the RMSE from 16.24 to 11.27 m. Thus, median-based replacement provided limited or adverse changes in gentle terrain but substantially reduced GEDI–ALS disagreement in steep terrain. These contrasts are consistent with the four-state results presented in Section 3.3.
Across all slope classes, lower terrain references consistently produced larger positive corrected RH98 residuals, whereas higher references progressively reduced the bias relative to ALS CHM P98. This pattern is consistent with the correction formula. Using a lower terrain reference increases the ground-residual term added to raw RH98, thereby raising corrected RH98 and amplifying positive canopy height residuals. Consequently, lower-percentile terrain statistics may provide a closer match to the GEDI-implied ground in steep terrain without producing the lowest corrected RH98 residual.
Taken together, the ground-level and canopy height analyses reveal an important distinction. Under the nominal vertical harmonization, P30 provided the closest full-sample match to GEDI ground elevation, while P20–P30 were particularly informative in the steepest terrain. The vertical reference sensitivity analysis further showed that the exact ground diagnostic optimum could shift between P20 and P30. In contrast, the footprint median retained the lowest corrected RH98 RMSE throughout the tested −2.0 to +2.0 m offset range (Figure A4). Ground-level consistency and canopy height correction therefore represent related but distinct optimization targets. For the Jiuzhaigou dataset, the footprint median provided the most stable empirical reference for minimizing corrected RH98 disagreement with ALS CHM P98; it should not be interpreted as the true ground level sensed by GEDI or as a universally optimal correction reference.
The increasing separation between lower-percentile terrain references and the footprint median in steep terrain (Figure A3) helps explain why the DTM statistic that best matched GEDI ground elevation differed from the statistic that minimized corrected RH98 disagreement.
3.4.3. Complementary Absolute Elevation and Reference Dependence Analysis
For the footprints with sufficient DSM coverage, absolute GEDI RH98 elevation showed closer agreement with the original ALS DSM P98, with a bias of 3.52 m and an RMSE of 6.53 m. The magnitude of the absolute-elevation residual showed little dependence on slope (; Figure A4). In contrast, the reference–construction gap, defined as , increased markedly with terrain steepness, from a mean of 0.63 m in the <15° class to 5.90 m in the >35° class (Figure A4d). These results indicate that footprint-level reference construction contributes to the slope-dependent relative height disagreement. Because the DSM, DTM, and CHM were derived from the same ALS survey, this comparison remains an ALS-referenced diagnostic rather than fully independent validation.
3.5. ICESat-2 ATL03 Comparison Under Different Terrain Supports
As a complementary cross-sensor check, the two ATL03 configurations were compared using 4624 paired windows and identical photon-processing settings. The ALS-DTM-supported configuration showed closer agreement with ALS CHM P98 than the Copernicus-supported configuration (Figure 9, Table A5). Overall, the RMSE decreased from 15.37 to 9.00 m, while R2 increased from 0.010 to 0.697. The contrast increased with slope and was greatest above 35°, where the RMSE decreased from 17.53 to 9.93 m. The residual distributions showed a corresponding reduction in dispersion under ALS DTM support. However, the ALS DTM used during processing and the ALS CHM used for evaluation were derived from the same ALS survey. The comparison is therefore interpreted as an ALS-referenced terrain support sensitivity test rather than independent validation of ATL03 canopy height.
Figure 9.
Sensitivity of ICESat-2 ATL03 canopy height estimates to terrain support. (a,b) Relationships between ATL03 RH98 and ALS CHM P98 under Copernicus DEM and ALS DTM support, respectively. The dashed lines indicate the 1:1 relationship, and the solid lines represent fitted regressions. (c,d) Residual distributions across slope classes under the two terrain support configurations. Residuals were calculated as ATL03 RH98 minus ALS CHM P98. Both configurations used identical photon-processing settings and the same 4624 paired evaluation windows.
3.6. Robustness Check and the Influence of Degraded GEDI Shots
We examined whether the main GEDI findings were sensitive to the strict degrade_flag = 0 screening criterion. After removing this filter while retaining all other quality control criteria, the number of retained footprints increased from 2102 to 5328. Under the relaxed configuration, geolocation refinement again produced no meaningful improvement, with the RMSE changing only from 13.51 to 13.46 m. In contrast, Ground-only increased the overall RMSE to 15.29 m, reversing the improvement observed under strict screening. Geo+Ground yielded an RMSE of 13.86 m (Table 9).
Table 9.
Strict and relaxed configuration comparison of GEDI data RH98.
This reduced effectiveness was traced to footprints with elevated degrade_flag values, particularly degrade_flag = 70, which constituted approximately 39.79% of the relaxed sample. These footprints exhibited substantially larger ground elevation residual variance (standard deviation of 20.54 m) compared with degrade_flag = 0 footprints (6.47 m), as shown in Table 10. For such footprints, the waveform-derived ground elevation was too unreliable for the ground reference replacement to function as intended; the large and noisy ground residuals, when propagated into RH98 through the correction formula, introduced additional dispersion rather than reducing the canopy height error. When the analysis was restricted to degrade_flag = 0 footprints within the relaxed dataset, ground reference replacement reduced the overall RMSE by approximately 3.38 m, consistent with the strict analysis. The effectiveness of ground reference replacement therefore depends on two things, not one—the quality of the external terrain reference and the reliability of the GEDI waveform-derived ground elevation itself.
Table 10.
Influence of degrade_flag values on GEDI ground reference replacement performance.
Overall, the relaxed configuration confirmed only part of the main interpretation: geolocation refinement again provided little benefit. However, ground reference replacement no longer improved the full relaxed sample, because degraded shots introduced highly unstable waveform-derived ground elevations. This indicates that the ground reference mechanism identified in the strict sample depends critically on GEDI waveform quality. These findings support the strict quality filtering used in the primary analysis and indicate that ground reference replacement should not be applied to degraded GEDI shots without additional waveform quality screening.
4. Discussion
4.1. Interpretation of Geolocation-Refinement and Ground-Reference Effects
In the strictly filtered sample, the tested ground-matching geolocation refinement did not improve GEDI–ALS canopy height agreement and slightly increased the overall RMSE, whereas ground reference replacement produced a substantially larger reduction. This contrast shows that changing the ground reference had a stronger effect than horizontal footprint adjustment under the conditions examined here. However, because no independent reference for the true GEDI footprint centers was available, this result is limited to the tested refinement procedure and the selected high-quality sample; it does not imply that GEDI geolocation uncertainty is generally negligible.
Previous studies have shown that GEDI geolocation uncertainty can affect footprint-level canopy height estimates and can be evaluated with ALS references [12]. The present study extends this work by comparing geolocation refinement and ground reference replacement within the same ALS-based diagnostic framework [13,16,17]. The added value of the four-state framework is that it quantifies this contrast within the same strictly filtered sample: Geo-only increased the RMSE by 0.11 m, whereas Ground-only reduced the RMSE by 3.38 m. This paired contrast provides direct evidence that the ground reference operation had a substantially larger influence on GEDI–ALS RH98 disagreement than the tested horizontal adjustment.
The objective-function sensitivity test showed that the lack of Geo-only improvement was not caused simply by using the ALS DTM median as the search target. Although GEDI lowest-mode elevation tended to approach lower-percentile terrain statistics in steep terrain, replacing the median search target with P20 or P30 did not produce a stable improvement in RH98 agreement with ALS CHM P98. The limited effect of Geo-only refinement was therefore not simply caused by the choice of median terrain as the search target. Matching the waveform-implied ground elevation to a footprint-scale terrain statistic does not necessarily improve canopy height agreement. In steep, heterogeneous forests, minimizing the ground-elevation residual does not necessarily preserve the strongest correspondence with the ALS CHM reference.
This behavior is physically interpretable. RH98 is measured relative to the waveform-interpreted ground; any bias or instability in that ground term is directly propagated into the canopy height metric. In steep terrain, the elevation range within a single footprint can be large, and the lowest waveform mode may not correspond to the median terrain elevation within the footprint [25,36]. Under these conditions, even moderate inconsistency between the GEDI-implied ground and the effective ALS terrain reference can produce a substantial RH98 residual.
This mechanism also explains why the Geo+Ground state did not outperform the Ground-only state. A horizontal shift can reduce the mismatch between GEDI ground elevation and an ALS DTM statistic, but it can also weaken the correspondence between the shifted footprint and the ALS CHM reference. In mountainous forests, terrain elevation and canopy structure may vary sharply over short distances, so improving ground elevation agreement does not necessarily improve canopy height agreement [20,37]. Lower-percentile references are therefore more informative for diagnosing GEDI ground behavior, whereas the median is more defensible as an empirical RH98 correction reference in this dataset.
4.2. Slope-Dependent Ground Reference and Its Implications
A key finding of this study is that the effective ground elevation implied by GEDI is slope-dependent rather than fixed. Under the nominal vertical harmonization, GEDI ground elevation was more consistent with the footprint median terrain elevation [9,32,38], whereas in the steepest slope class, it shifted toward lower-percentile terrain statistics, especially P20–P30. The four slope classes should therefore be viewed as descriptive terrain bins rather than physical or ecological thresholds. Importantly, equal-size subsampling preserved the four-state ranking, while the continuous-slope analysis showed a gradual transition in Ground-only performance, indicating that the observed terrain dependence was not created by either class imbalance or the selected cut-offs. This transition is physically plausible because slope increases the within-footprint elevation range, making the waveform-interpreted ground less likely to represent a central tendency of the terrain distribution. Instead, the lower portion of the illuminated footprint may exert a stronger influence on the apparent ground return [9,39]. Canopy structure therefore affected absolute residuals but did not explain the stronger Ground-only benefit at steeper slopes. The canopy height correction results further showed that the terrain statistic closest to the GEDI-implied ground was not necessarily the statistic that produced the most accurate corrected RH98. At the full-sample level, P30 provided the closest agreement with GEDI ground elevation, whereas the footprint median produced the lowest corrected RH98 error relative to ALS CHM P98. This distinction matters because diagnosing where the GEDI waveform places the ground and producing the smallest corrected canopy-height residual are operationally different goals: the first asks which DTM statistic the waveform ‘sees’, the second asks which DTM statistic, when subtracted, leaves the smallest gap to ALS CHM P98. The additional footprint-scale terrain diagnostics support this interpretation: as slope increased, within-footprint terrain heterogeneity expanded, and lower-percentile DTM references became increasingly separated from the footprint median. This terrain–geometric divergence helps explain why P20–P30 better represented the GEDI waveform-implied ground in steep terrain, whereas the median provided a less aggressive correction term that nonetheless yielded the smallest RH98 residual.
Mechanistically, the median reference should not be interpreted as the true ground level sensed by the GEDI waveform. Its relationship with the GEDI-implied ground varied with terrain steepness. At the full-sample level, the footprint median lay above the GEDI-implied ground on average, yielding a mean ground residual of −2.34 m, with this pattern becoming most pronounced in the steepest terrain. The resulting negative mean correction reduced the persistent positive bias of raw GEDI RH98 relative to ALS CHM P98. In contrast, lower-percentile DTM references produced increasingly positive mean ground-residual terms and tended to amplify corrected canopy-height residuals [21,40]. The optimality of the median for RH98 correction is therefore empirical and dataset-specific and does not contradict the diagnostic result that the GEDI-implied ground shifted toward lower-percentile terrain statistics in steep terrain.
Ground reference selection should therefore follow the analytical objective: lower-percentile statistics such as P20–P30 are informative for diagnosing GEDI waveform-derived ground behavior, whereas the footprint median was the most effective empirical reference for minimizing corrected RH98 error in this study area.
The common-window ATL03 comparison provided limited cross-sensor support for this interpretation. With all other photon-processing settings held constant, changing the terrain-support input substantially altered ATL03 RH98, particularly in steep terrain. Because the ALS DTM contributed to processing and the evaluation CHM came from the same ALS survey, this comparison should likewise be interpreted as evidence of terrain-support sensitivity rather than as independent validation. Together, the GEDI and ATL03 results show that terrain support and ground-reference definition can strongly shape spaceborne LiDAR canopy height retrieval in mountainous forests, although the exact effects remain dependent on sensor geometry, processing design, and reference construction.
4.3. Limitations and Future Work
This study remains a single-site diagnosis in a steep mountainous forest. Although Jiuzhaigou is well suited for examining terrain-related GEDI errors, the quantitative relationships reported here may not transfer directly to other forest or terrain conditions [15]. The natural matched sample was dominated by very steep terrain, with >35° footprints accounting for 55.9% of the strict sample. Equal-size slope subsampling preserved the ranking of the four diagnostic states, but the overall effect magnitudes remain conditioned by the terrain distribution of Jiuzhaigou. Estimates for the <15° class should also be interpreted cautiously because of its smaller sample size. Accounting for ALS-derived canopy height, canopy cover, CHM heterogeneity, and CLCD forest fraction reduced concern that the slope-dependent pattern merely reflected systematic canopy differences. However, species composition, stand age, and detailed forest type were unavailable, and residual confounding by these attributes cannot be excluded.
Neither the tested geolocation refinement nor ground reference replacement should be interpreted as a generally applicable operational correction. No independent observations of the true GEDI footprint centers were available, and the estimated shifts represent diagnostic relocations optimized against an ALS terrain reference rather than verified geolocation corrections. Other correction strategies based on waveform simulation or direct canopy–reference matching may yield different results. Ground reference replacement also depended on the reliability of the waveform-derived ground elevation. Its benefit reversed when degraded shots were included, showing that unstable ground estimates can be propagated into corrected RH98. Upper-canopy return uncertainty, waveform broadening, and mixed canopy–terrain signals remain additional sources of disagreement that were not isolated by the four-state design.
The ALS products provided the best available local references but did not constitute error-free field truth. Approximately 51 independent network-RTK checkpoints supported project-level quality assessment, yielding a reported vertical RMSE of 0.30 m for the delivered LiDAR products. This statistic does not establish uniform DTM accuracy under every slope and canopy condition, and the checkpoints did not independently validate canopy height. Footprint-level ground-return density and classification residuals could not be reassessed, and no independent field measurements of canopy height were available. Moreover, ALS information contributed both to the diagnostic adjustments and to evaluation against ALS CHM. The original DSM comparison reduced the direct reuse of the footprint-level DTM statistic, but it still relied on the same ALS survey. The reported changes should therefore be interpreted as ALS-referenced agreement rather than independent validation of absolute accuracy.
Vertical harmonization introduced further uncertainty. The ALS products were tied to the 1985 National Height Datum using the regional Sichuan quasi-geoid model, whereas GEDI elevations were approximately harmonized using EGM2008 because the regional model was unavailable for external application. The vertical-offset sensitivity analysis showed that this uncertainty could alter the exact P20–P30 ground-diagnostic ranking, although it did not change the separation between the lower-percentile diagnostic target and the median-based correction target. More precise harmonization using a common regional height anomaly model would strengthen future comparisons.
Temporal mismatch may also affect the absolute residuals. ALS was acquired in April–May 2020, while the final GEDI sample was acquired approximately 8–15 months later, and the complementary ATL03 observations spanned 2020–2021. The 0–0.30 m growth-offset analysis produced only small changes in error magnitude and did not alter the GEDI state ranking, but a uniform offset cannot represent spatial variation in growth, phenology, species, stand age, or localized disturbance. Because both ATL03 terrain-support configurations used the same observations and matched windows, temporal sampling was common to their paired comparison, although it still affected their absolute differences from the 2020 ALS CHM.
Future work should extend the framework to multiple forest types and terrain settings, incorporate independently surveyed GEDI footprint positions and field canopy-height measurements, and use repeat ALS to construct temporally matched terrain and canopy references. Where classified point clouds and local growth information are available, tree-level growth or point-cloud simulation could further separate temporal vegetation change from measurement- and reference-related effects.
5. Conclusions
Using ALS-derived DTM and CHM as local references in the steep mountainous forests of Jiuzhaigou, we evaluated terrain-related sources of GEDI RH98 error, with a limited ICESat-2 ATL03 comparison providing cross-sensor support. In the strictly filtered sample, the tested ground-matching geolocation refinement did not improve canopy height agreement and slightly increased overall RMSE, whereas median-based ground reference replacement substantially reduced the RMSE from 13.36 to 9.98 m. The relative ranking of the four diagnostic states was supported by clustered paired-bootstrap resampling and remained unchanged after equalizing slope-class sample sizes and accounting for canopy structure and broad land cover context.
GEDI ground reference behavior was strongly slope-dependent. In low- to moderate-slope terrain, GEDI ground elevation was more consistent with the footprint median, whereas in the steepest terrain, it shifted toward lower-percentile ALS DTM statistics, particularly P20–P30. However, the DTM statistic that best matched GEDI ground elevation was not the statistic that minimized corrected canopy height error. For RH98 correction, the footprint median provided the most effective empirical reference in this dataset, suggesting that ground-level diagnosis and canopy height correction require related but different terrain reference choices.
The ICESat-2 results further supported the importance of terrain support, although they were not designed as a parallel four-state decomposition. The ATL03 dual-terrain-support experiment showed that changing terrain support input also substantially affected photon-counting canopy height retrieval, particularly in steep terrain. Because ALS information contributed to both processing and evaluation, this result represents terrain support sensitivity rather than independent canopy height validation. The relaxed GEDI analysis likewise showed that ground reference replacement did not extend reliably to degraded shots with unstable waveform-derived ground elevations, emphasizing the need for strict waveform quality screening. Overall, spaceborne LiDAR canopy height analyses in steep terrain should explicitly consider terrain steepness, waveform or photon quality, terrain support input, and footprint-level reference construction. Lower-percentile DTM statistics are useful for interpreting waveform–terrain interaction, whereas the footprint median may provide a more conservative empirical reference for RH98 correction in similar steep, dense forests.
Author Contributions
Conceptualization, F.S. and X.H.; methodology, F.S.; software, F.S.; validation, F.S. and Y.G.; formal analysis, F.S., X.H., and Z.Q.; investigation, F.S.; data curation, F.S.; writing—original draft preparation, F.S.; writing—review and editing, F.S., X.H., and Y.G.; supervision, X.H. and X.W. All authors have read and agreed to the published version of the manuscript.
Funding
This research was supported by the Key Research and Development Program of the Xizang Autonomous Region, grant number XZ202601ZY0084.
Data Availability Statement
GEDI L2A data are available from NASA LP DAAC, and ICESat-2 ATL03 data are available from NSIDC. Copernicus DEM, EGM2008, CLCD2021, and Sentinel-2 data are publicly available from their official repositories. The high-resolution ALS DTM and DSM cannot be publicly shared due to data use and security restrictions. The derived CHM, non-restricted footprint-level analysis data, and analysis code are publicly available through Zenodo at doi.org/10.5281/zenodo.22297487.
Conflicts of Interest
The authors declare no conflicts of interest.
Appendix A. Supplementary Diagnostic Figures and Tables
Figure A1.
Matched-season Sentinel-2 true-color imagery of the study area. Images were acquired on (a) 27 September 2019 and (b) 21 September 2021. The white outline denotes the ALS coverage. No major stand-replacing disturbance is visually apparent within the visible ALS-covered area. The images were displayed on the same spatial grid without additional date-specific enhancement and were used only for qualitative disturbance screening, not for quantitative estimation of canopy growth.
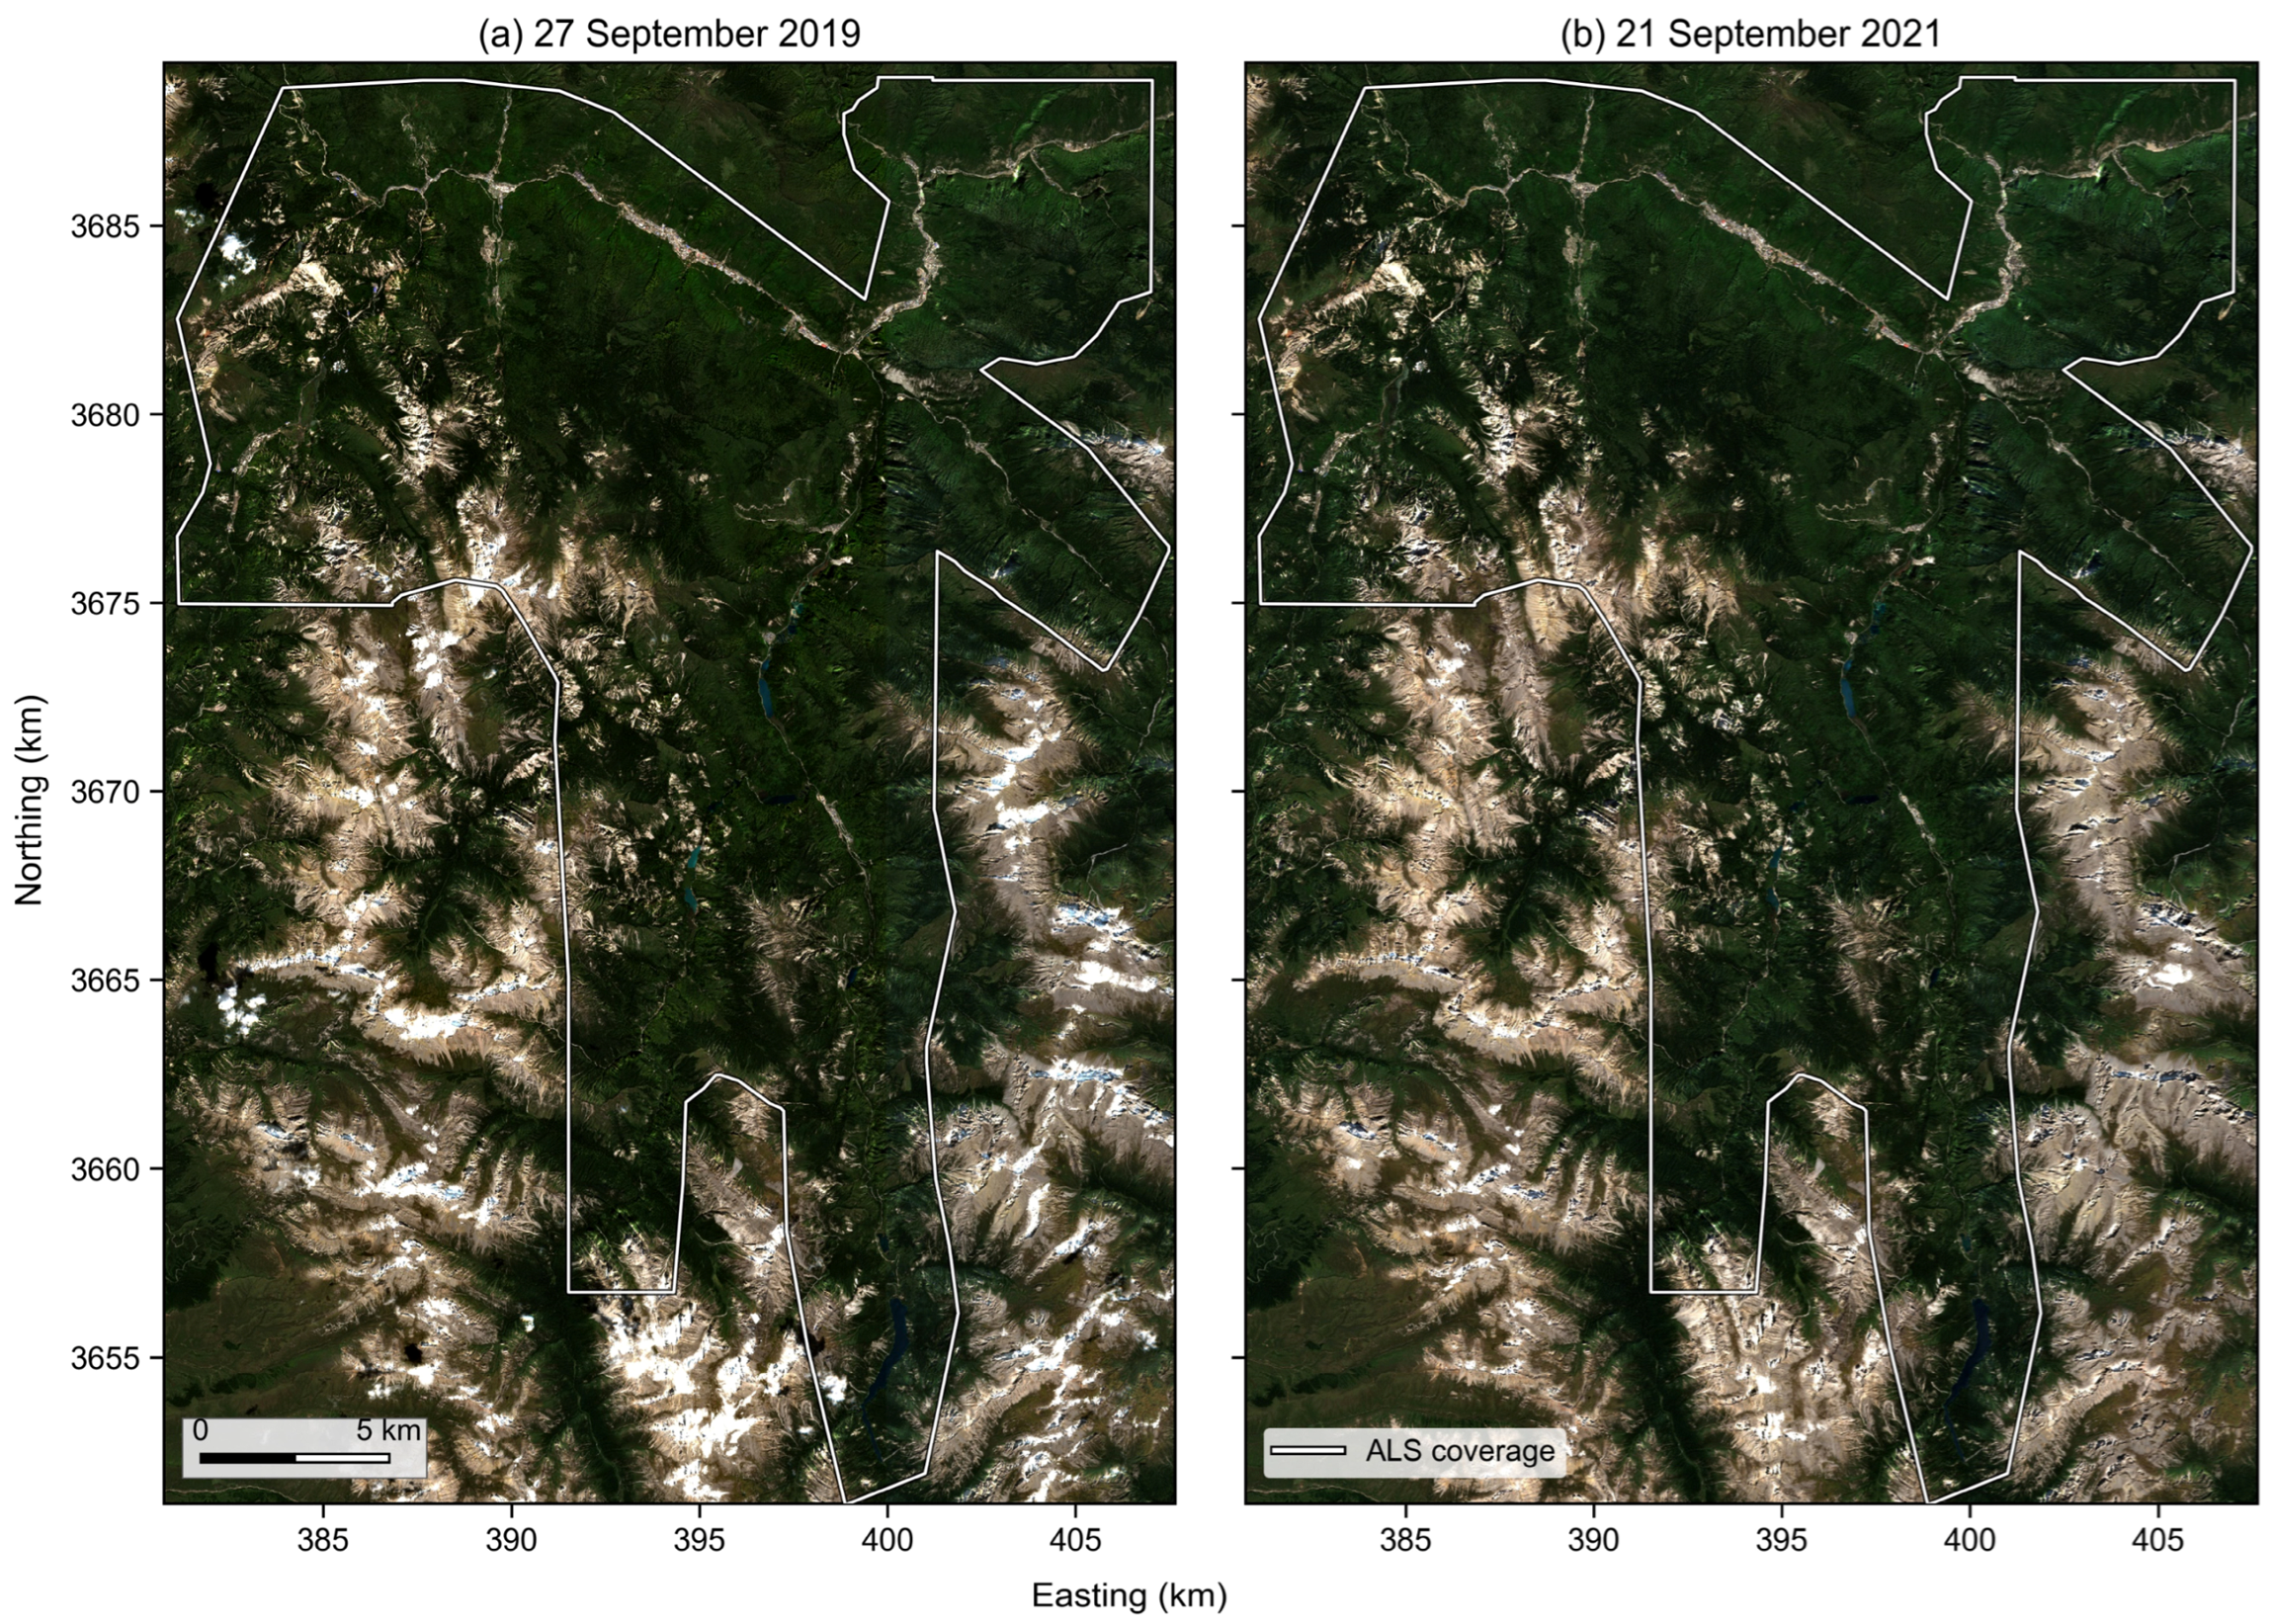
Figure A2.
Diagnostic characteristics of GEDI geolocation refinement offsets. (a) Distribution of final offset vectors in projected coordinates. The dashed circle indicates the initial 15 m search radius, and the dotted circle indicates the initial search radius plus the 3 m residual search radius. (b) Histogram of final offset magnitudes, with the median, 95th percentile, and initial search radius marked. (c) Offset magnitude stratified by slope class. (d) Offset direction distribution after excluding zero-offset footprints.
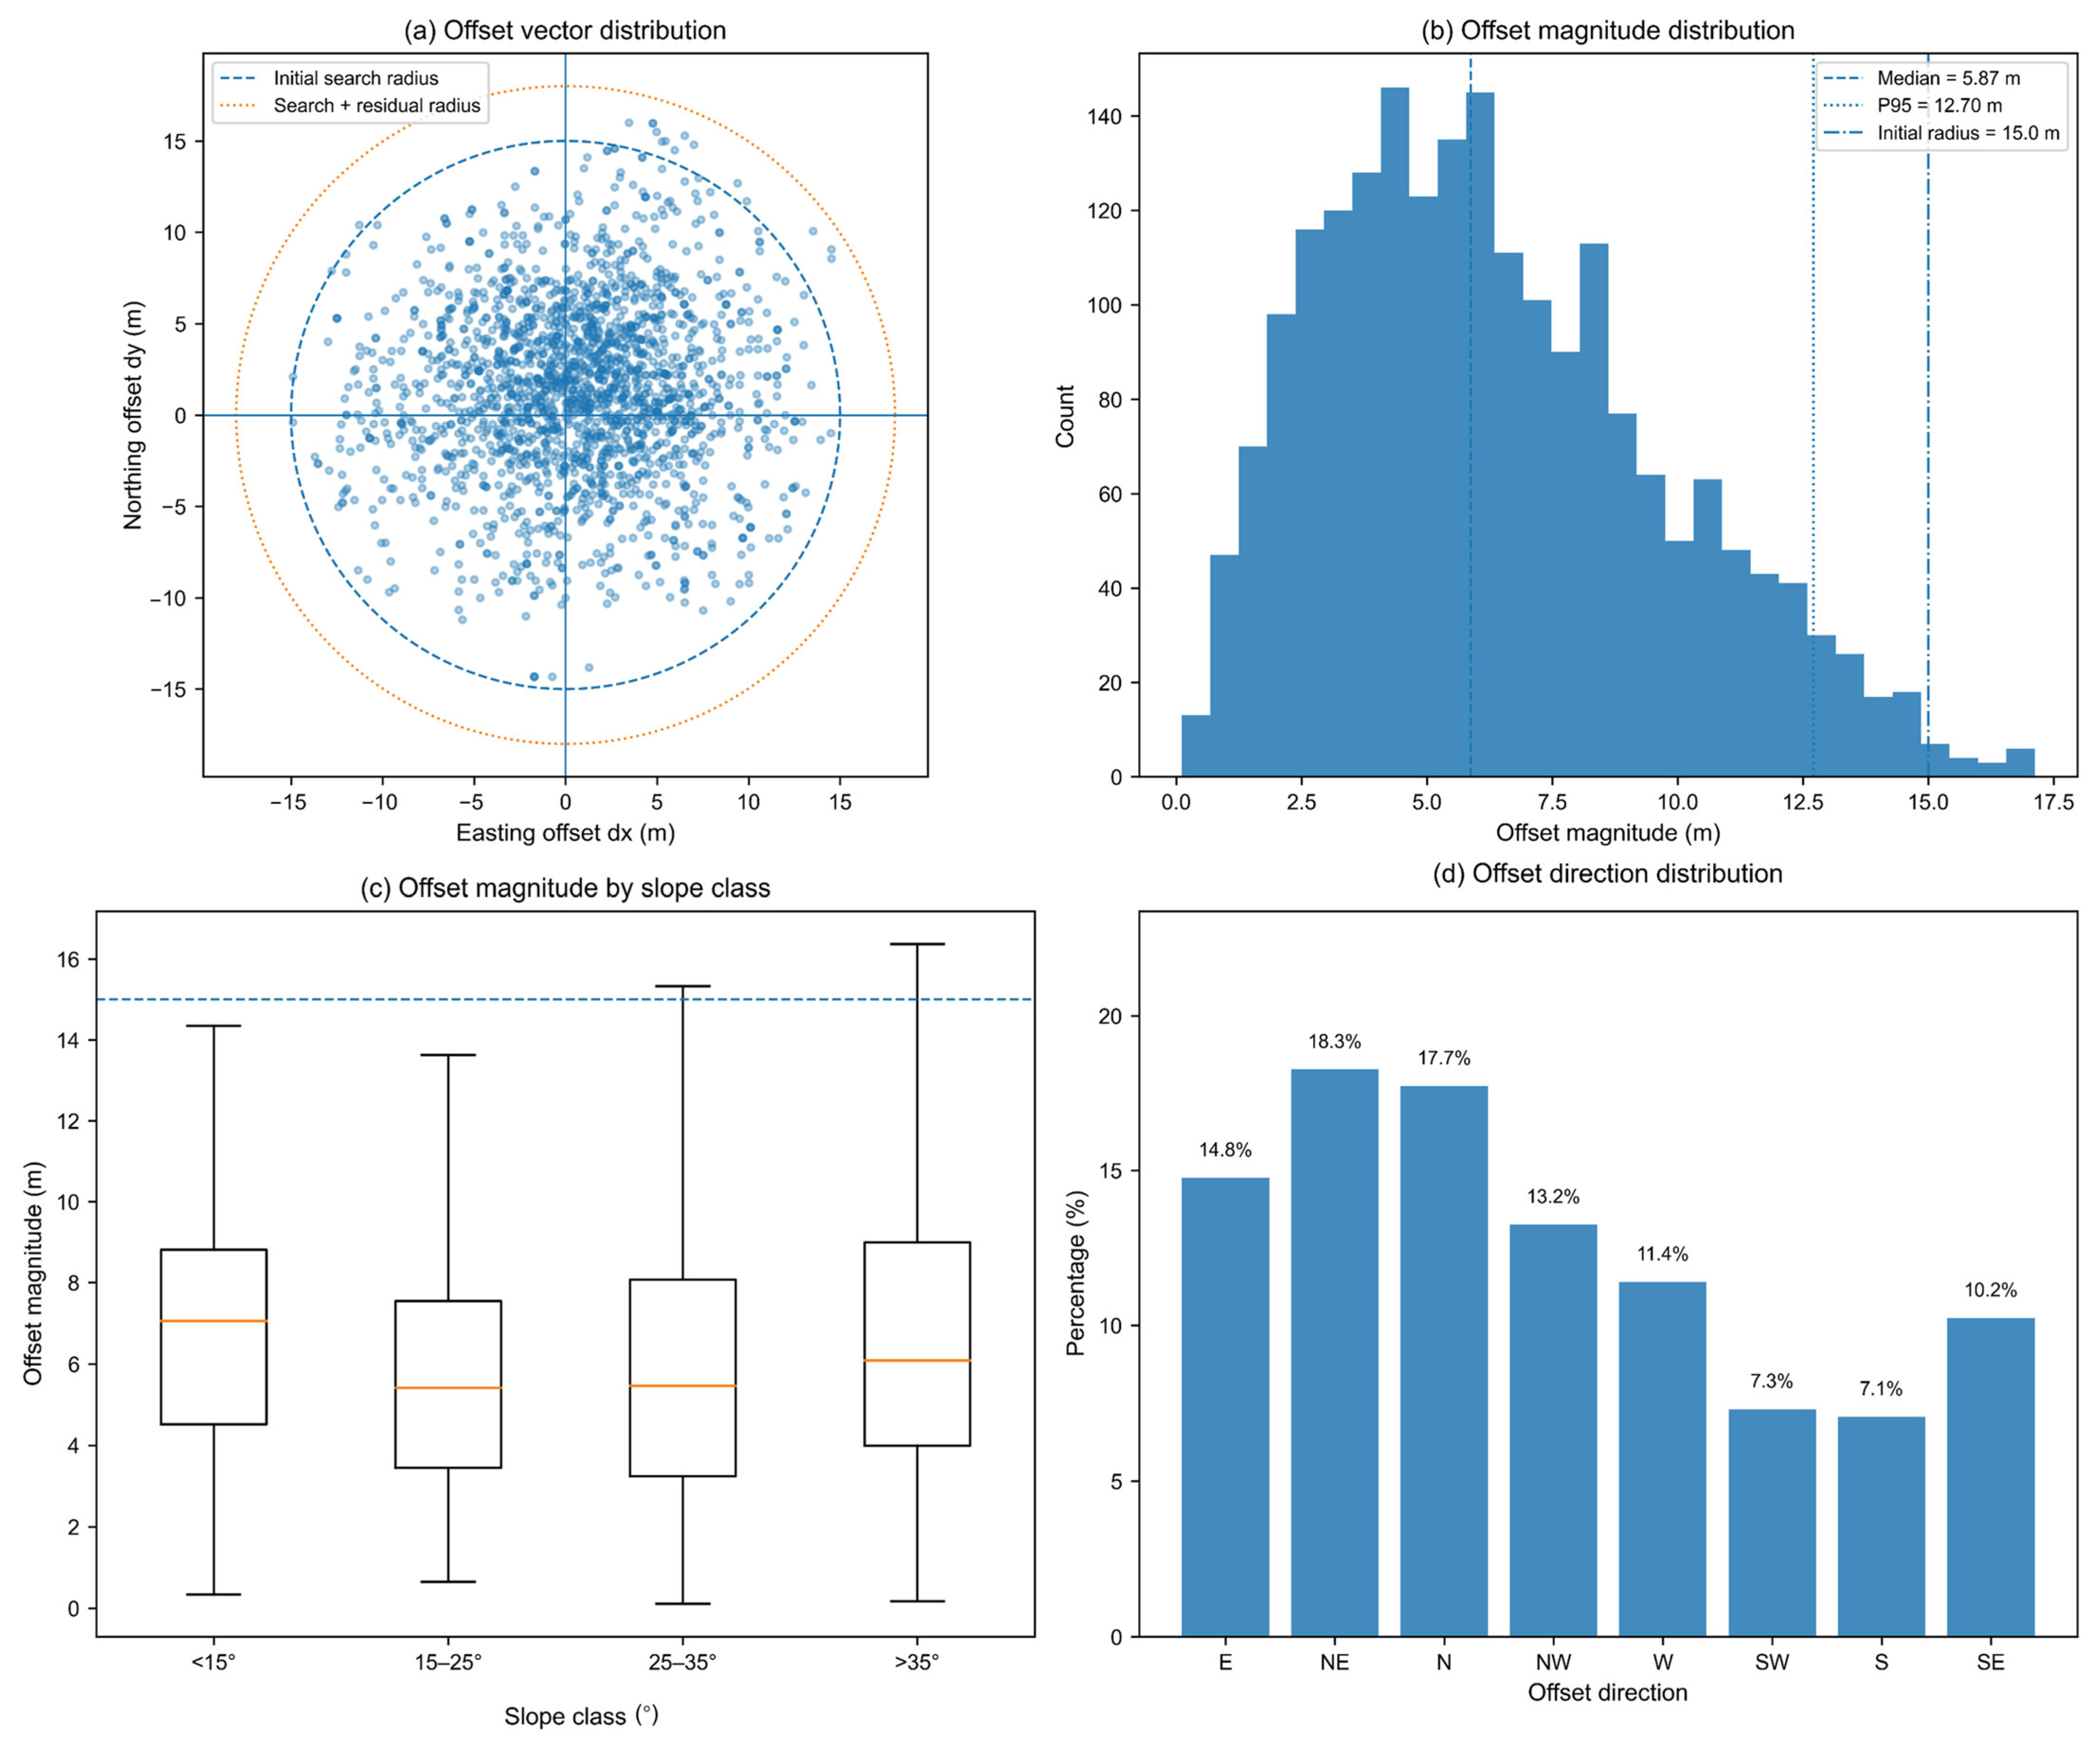
Figure A3.
Footprint-scale terrain heterogeneity and DTM-reference divergence across slope classes. (a) ALS DTM P95–P05 elevation range within GEDI footprints across slope classes. (b) Elevation difference between the ALS DTM median and P30 within GEDI footprints. (c) Corrected GEDI RH98 residuals calculated using the footprint median, P30, and P20 as alternative ALS DTM references. Residuals were defined as corrected GEDI RH98 minus ALS CHM P98.
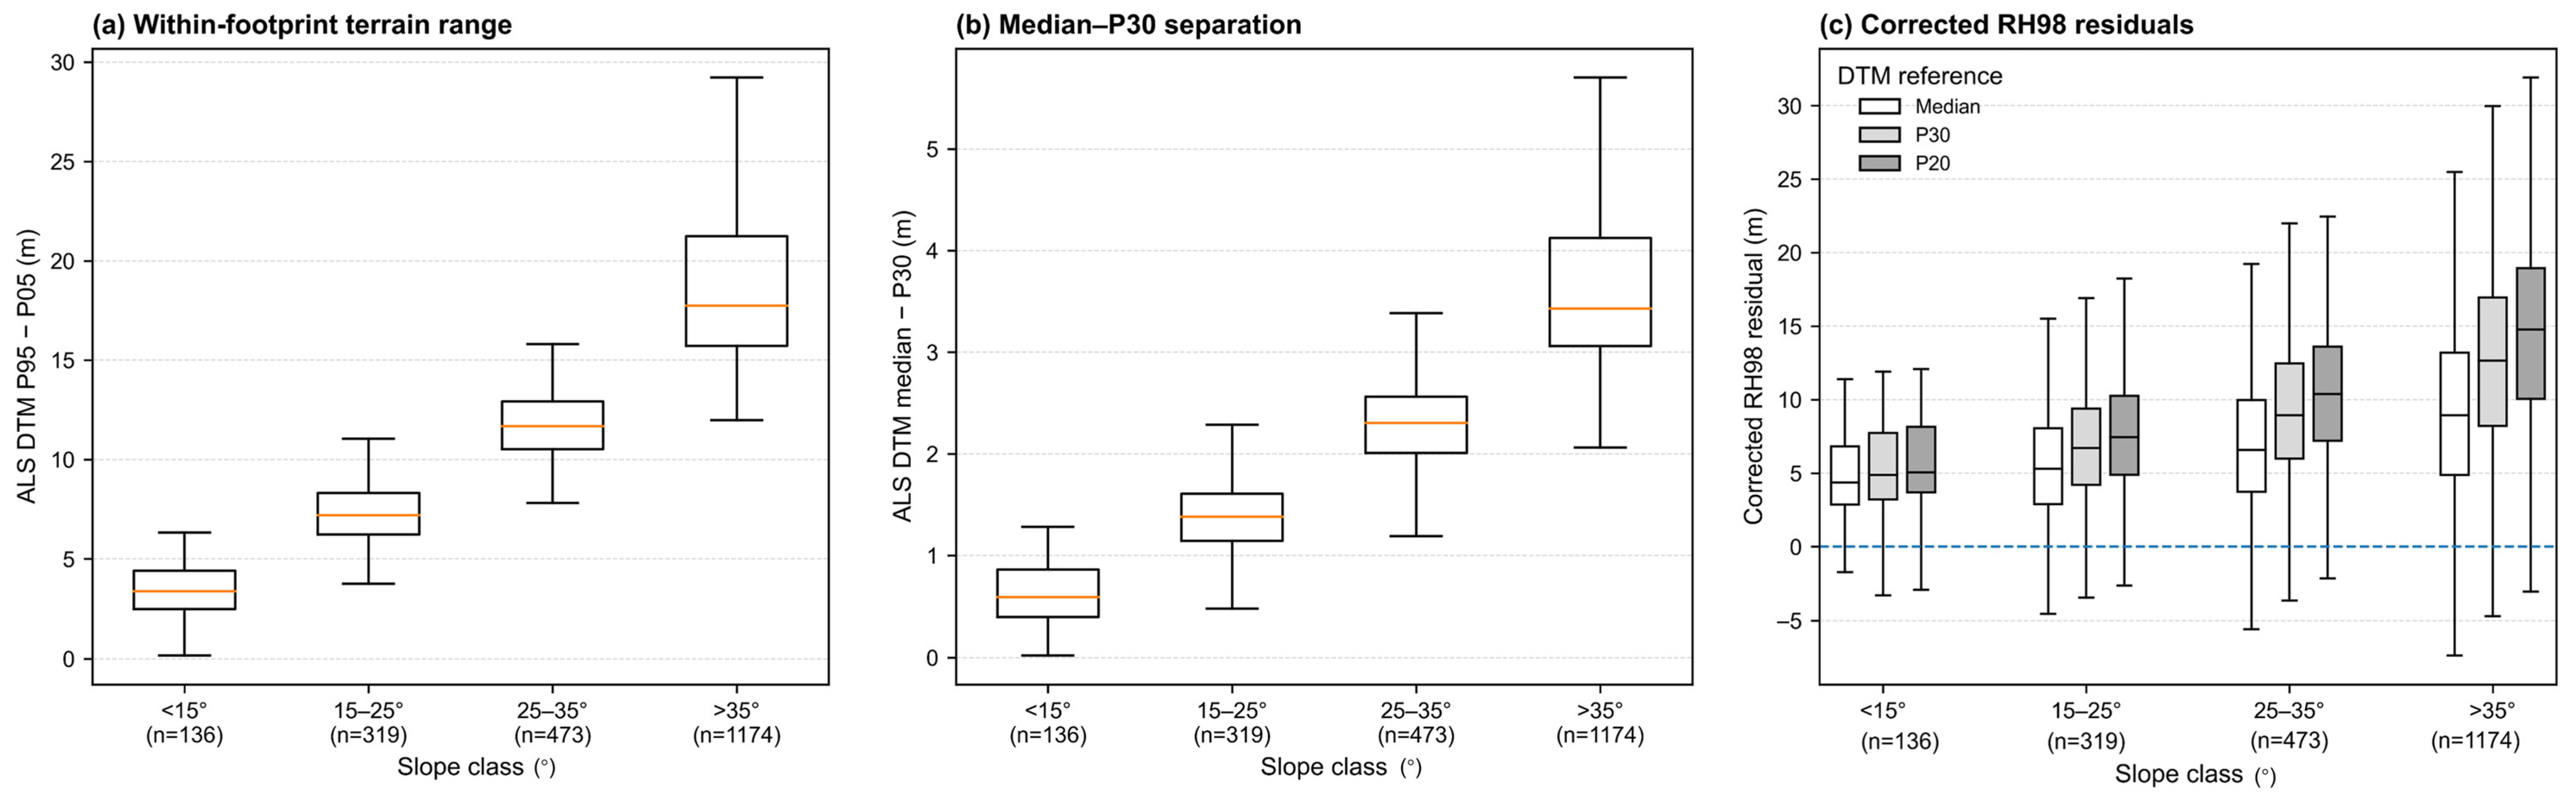
Figure A4.
Sensitivity of GEDI ground and canopy height results to vertical reference offsets and ALS reference construction. (a) Full-sample ground-residual RMSE for the P20, P30, and median ALS DTM references under additional vertical offsets of −2 to +2 m applied to the harmonized GEDI ground elevation. (b) Corresponding corrected RH98 RMSE relative to ALS CHM P98. The vertical dotted line denotes the nominal harmonization (). (c) Absolute residual magnitude between GEDI RH98 absolute elevation and ALS DSM P98 across slope classes. (d) ALS reference–construction gap, defined as , across slope classes. Boxplots show the median and interquartile range, diamonds indicate means, and whiskers represent the 5th–95th percentiles.
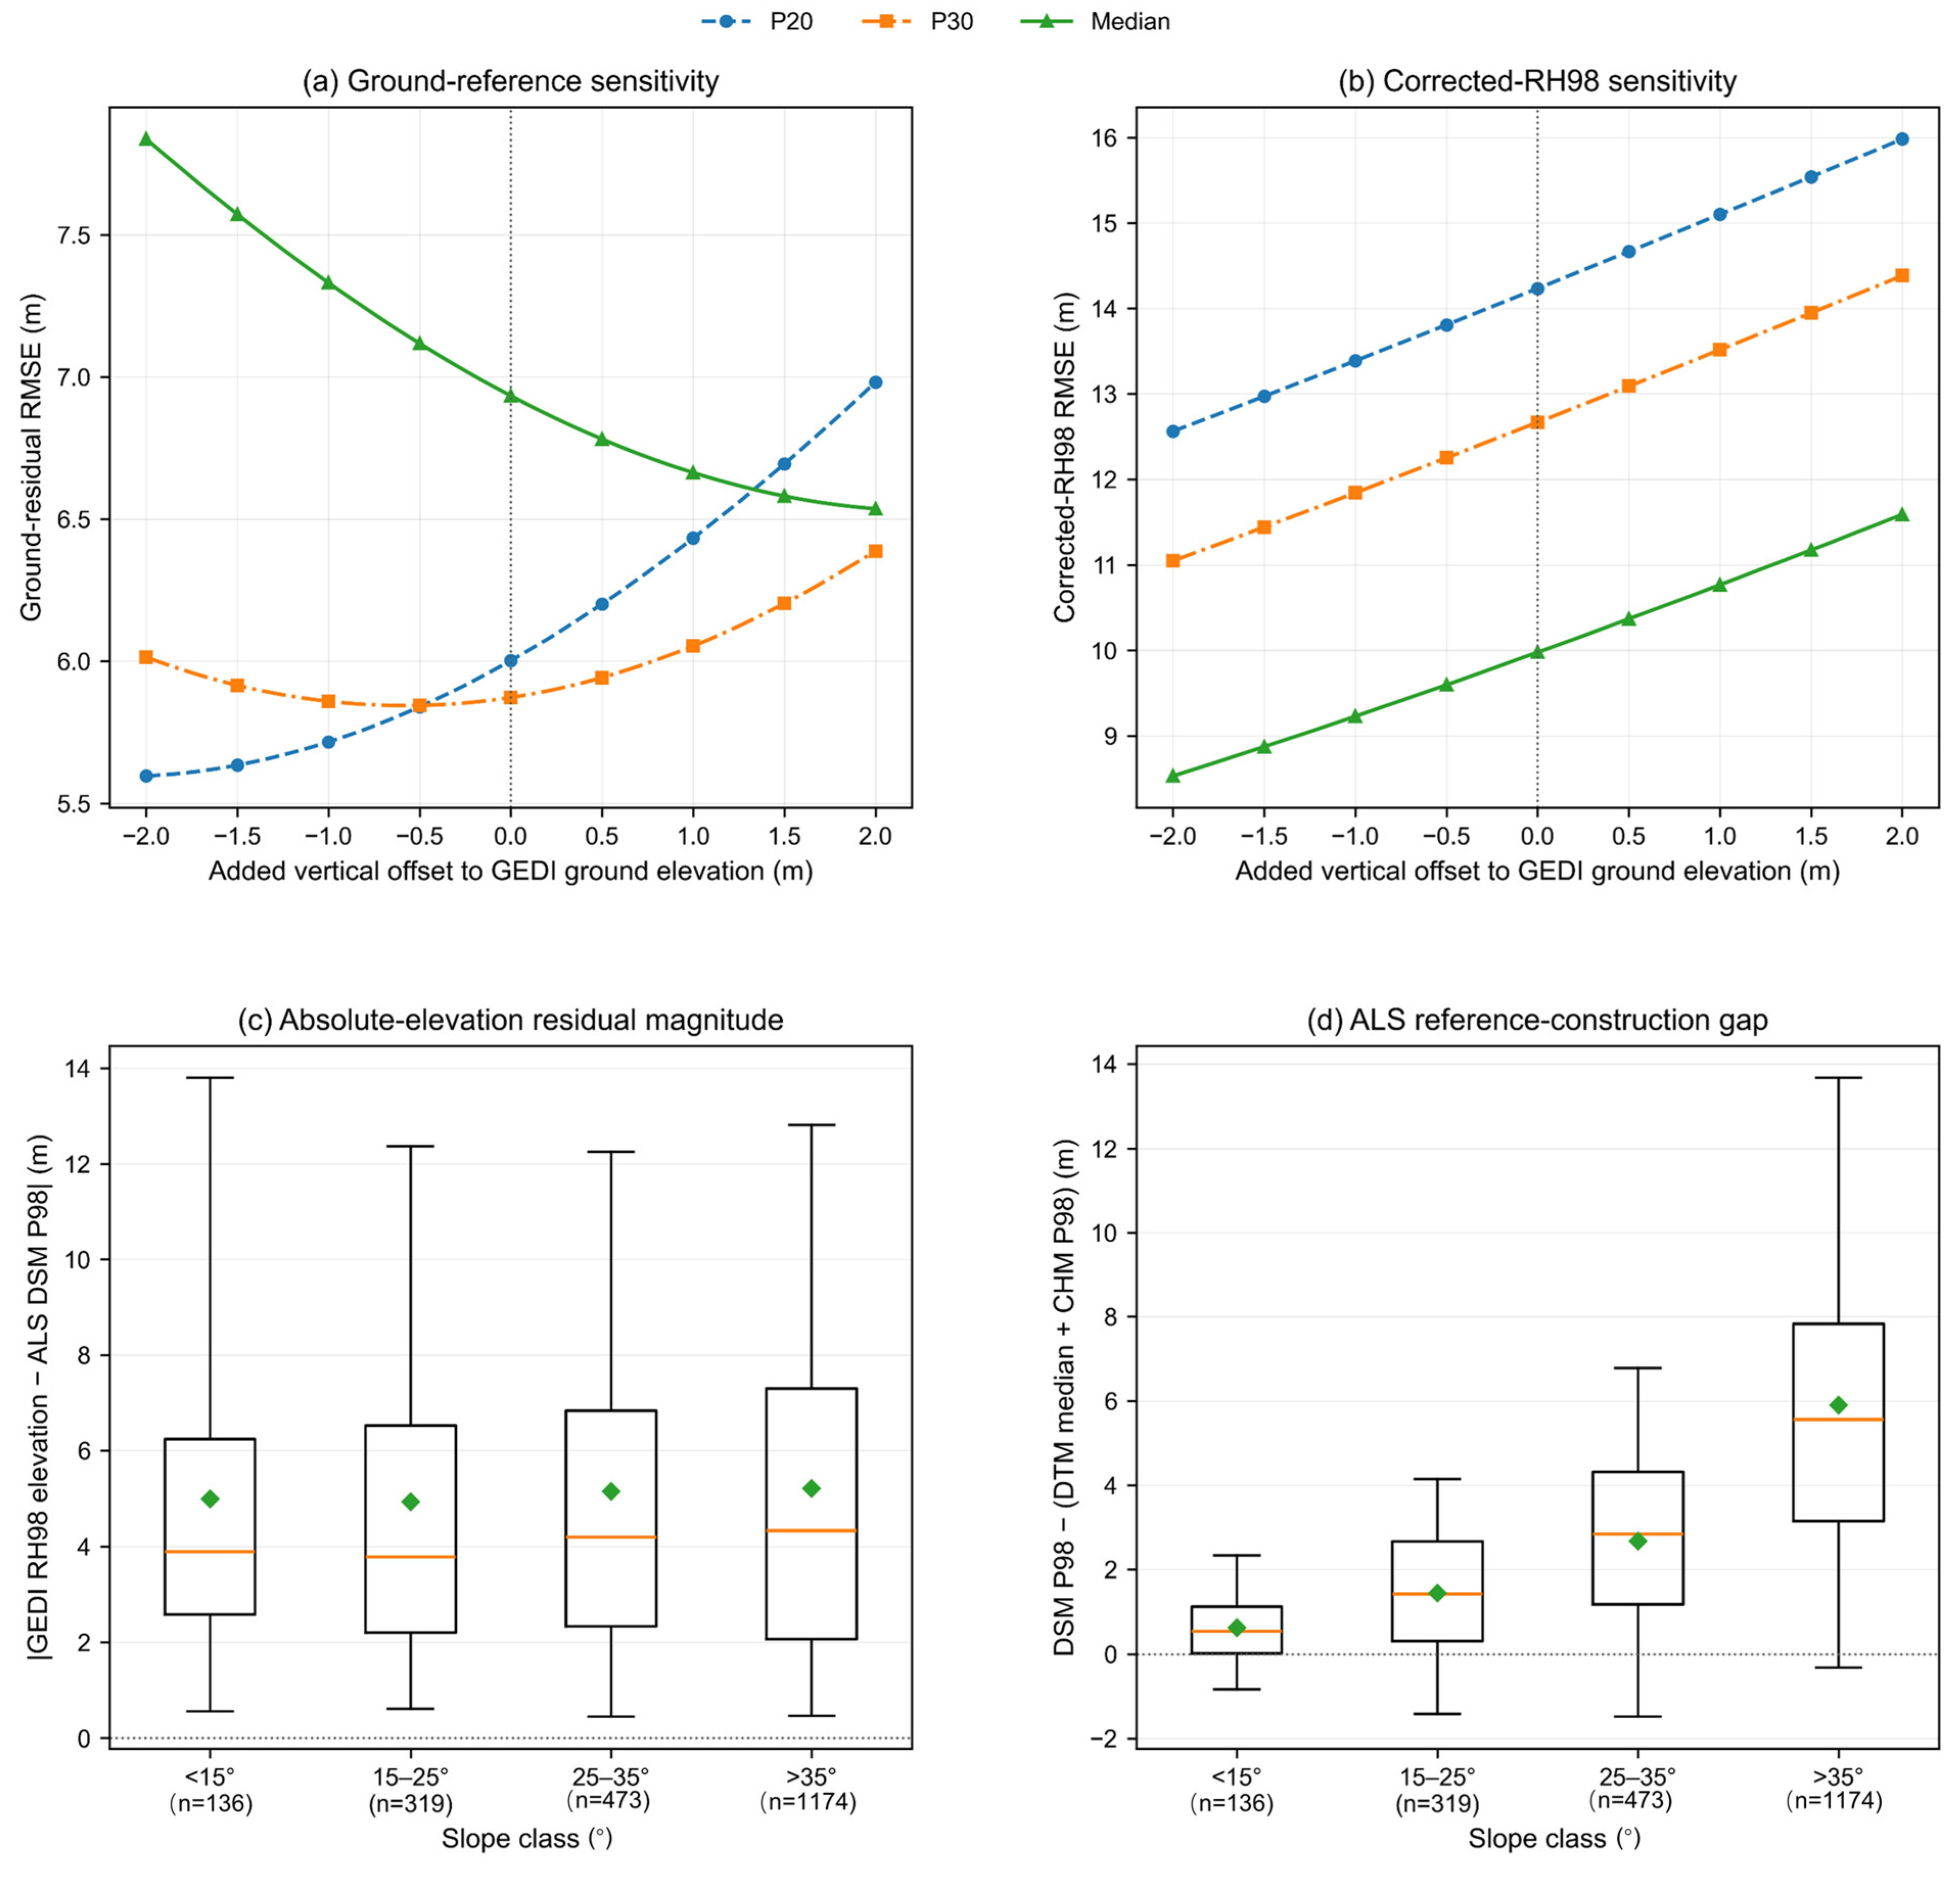
Table A1.
Clustered paired-bootstrap tests of planned GEDI state contrasts.
Table A2.
Sensitivity of Geo-only geolocation refinement results to alternative ALS DTM objective functions.
Table A3.
Cluster-robust multivariable model of Ground-only absolute-error improvement.
Table A4.
Slope-stratified ground diagnostic and RH98 correction performance across ALS DTM references.
Table A5.
Common-window comparison of ATL03 canopy height retrieval and terrain support differences.
Table A6.
Balanced-subsampling robustness analysis of the GEDI diagnostic states.
References
- Dubayah, R.; Blair, J.B.; Goetz, S.; Fatoyinbo, L.; Hansen, M.; Healey, S.; Hofton, M.; Hurtt, G.; Kellner, J.; Luthcke, S.; et al. The Global Ecosystem Dynamics Investigation: High-resolution laser ranging of the Earth’s forests and topography. Sci. Remote Sens. 2020, 1, 100002. [Google Scholar] [CrossRef] [Scilit]
- Le Toan, T.; Quegan, S.; Davidson, M.W.; Balzter, H.; Paillou, P.; Papathanassiou, K.; Plummer, S.; Rocca, F.; Saatchi, S.; Shugart, H.; et al. The BIOMASS mission: Mapping global forest biomass to better understand the terrestrial carbon cycle. Remote Sens. Environ. 2011, 115, 2850–2860. [Google Scholar] [CrossRef] [Scilit]
- Tang, H.; Armston, J.; Hancock, S.; Marselis, S.; Goetz, S.; Dubayah, R. Characterizing global forest canopy cover distribution using spaceborne LiDAR. Remote Sens. Environ. 2019, 231, 111262. [Google Scholar] [CrossRef] [Scilit]
- Zhu, X.; Nie, S.; Wang, C.; Xi, X.; Lao, J.; Li, D. Consistency analysis of forest height retrievals between GEDI and ICESat-2. Remote Sens. Environ. 2022, 281, 113244. [Google Scholar] [CrossRef] [Scilit]
- Neuenschwander, A.; Pitts, K. The ATL08 land and vegetation product for the ICESat-2 mission. Remote Sens. Environ. 2019, 221, 247–259. [Google Scholar] [CrossRef] [Scilit]
- Potapov, P.; Li, X.; Hernandez-Serna, A.; Tyukavina, A.; Hansen, M.C.; Kommareddy, A.; Pickens, A.; Turubanova, S.; Tang, H.; Silva, C.E.; et al. Mapping global forest canopy height through integration of GEDI and Landsat data. Remote Sens. Environ. 2021, 253, 112165. [Google Scholar] [CrossRef] [Scilit]
- Lang, N.; Kalischek, N.; Armston, J.; Schindler, K.; Dubayah, R.; Wegner, J.D. Global canopy height regression and uncertainty estimation from GEDI LIDAR waveforms with deep ensembles. Remote Sens. Environ. 2022, 268, 112760. [Google Scholar] [CrossRef] [Scilit]
- Adam, M.; Urbazaev, M.; Dubois, C.; Schmullius, C. Accuracy assessment of GEDI terrain elevation and canopy height estimates in European temperate forests: Influence of environmental and acquisition parameters. Remote Sens. 2020, 12, 3948. [Google Scholar] [CrossRef] [Scilit]
- Kutchartt, E.; Pedron, M.; Pirotti, F. Assessment of canopy and ground height accuracy from GEDI LiDAR over steep mountain areas. ISPRS Ann. Photogramm. Remote Sens. Spat. Inf. Sci. 2022, 3, 431–438. [Google Scholar] [CrossRef] [Scilit]
- Lang, N.; Jetz, W.; Schindler, K.; Wegner, J.D. A high-resolution canopy height model of the Earth. Nat. Ecol. Evol. 2023, 7, 1778–1789. [Google Scholar] [CrossRef] [Scilit] [PubMed]
- Duncanson, L.; Neuenschwander, A.; Hancock, S.; Thomas, N.; Fatoyinbo, T.; Simard, M.; Silva, C.A.; Armston, J.; Luthcke, S.B.; Hofton, M.; et al. Biomass estimation from simulated GEDI, ICESat-2 and NISAR across environmental gradients in Sonoma County, California. Remote Sens. Environ. 2020, 242, 111779. [Google Scholar] [CrossRef] [Scilit]
- Moudrý, V.; Prošek, J.; Marselis, S.; Marešová, J.; Šárovcová, E.; Gdulová, K.; Kozhoridze, G.; Torresani, M.; Rocchini, D.; Eltner, A.; et al. How to find accurate terrain and canopy height GEDI footprints in temperate forests and grasslands? Earth Space Sci. 2024, 11, e2024EA003709. [Google Scholar] [CrossRef] [Scilit]
- Roy, D.P.; Kashongwe, H.B.; Armston, J. The impact of geolocation uncertainty on GEDI tropical forest canopy height estimation and change monitoring. Sci. Remote Sens. 2021, 4, 100024. [Google Scholar] [CrossRef] [Scilit]
- Li, H.; Li, X.; Kato, T.; Hayashi, M.; Fu, J.; Hiroshima, T. Accuracy assessment of GEDI terrain elevation, canopy height, and aboveground biomass density estimates in Japanese artificial forests. Sci. Remote Sens. 2024, 10, 100142. [Google Scholar] [CrossRef] [Scilit]
- Lahssini, K.; Baghdadi, N.; Le Maire, G.; Fayad, I. Use of GEDI signal and environmental parameters to improve canopy height estimation over tropical forest ecosystems in Mayotte Island. Can. J. Remote Sens. 2024, 50, 2351004. [Google Scholar] [CrossRef] [Scilit]
- Tang, H.; Stoker, J.M.; Luthcke, S.; Armston, J.; Lee, K.; Blair, B.; Hofton, M. Evaluating and mitigating the impact of systematic geolocation error on canopy height measurement performance of GEDI. Remote Sens. Environ. 2023, 291, 113571. [Google Scholar] [CrossRef] [Scilit]
- Shannon, E.S.; Finley, A.O.; Hayes, D.J.; Noralez, S.N.; Weiskittel, A.R.; Cook, B.D.; Babcock, C. Quantifying and correcting geolocation error in spaceborne LiDAR forest canopy observations using high spatial accuracy data: A Bayesian model approach. Environmetrics 2024, 35, e2840. [Google Scholar] [CrossRef] [Scilit]
- Liu, A.; Cheng, X.; Chen, Z. Performance evaluation of GEDI and ICESat-2 laser altimeter data for terrain and canopy height retrievals. Remote Sens. Environ. 2021, 264, 112571. [Google Scholar] [CrossRef] [Scilit]
- Malambo, L.; Popescu, S.C.; Murray, S.C.; Putman, E.; Pugh, N.A.; Horne, D.W.; Richardson, G.; Sheridan, R.; Neuenschwander, A.; Agca, M. Assessing the agreement of ICESat-2 terrain and canopy height with airborne LiDAR in the south-eastern USA. Remote Sens. Environ. 2021, 266, 112711. [Google Scholar] [CrossRef] [Scilit]
- Chen, R.; Wang, X.; Liu, X.; Wang, S. Optimizing GEDI canopy height estimation and analyzing error impact factors under highly complex terrain and high-density vegetation conditions. Forests 2024, 15, 2024. [Google Scholar] [CrossRef] [Scilit]
- Fu, L.; Shu, Q.; Xia, C.; Li, Z.; Zhang, X.; Zhang, Y. ICESat-2 performance for terrain and canopy height retrieval in complex mountainous environments. Remote Sens. 2025, 17, 1897. [Google Scholar] [CrossRef] [Scilit]
- Wang, Y.; Čufar, K.; Eckstein, D.; Liang, E. Variation of maximum tree height and annual shoot growth of Smith fir at various elevations in the Sygera Mountains, southeastern Tibetan Plateau. PLoS ONE 2012, 7, e31725. [Google Scholar] [CrossRef] [Scilit] [PubMed][Green Version]
- Simpson, J.E.; Smith, T.E.L.; Wooster, M.J. Assessment of errors caused by forest vegetation structure in airborne LiDAR-derived DTMs. Remote Sens. 2017, 9, 1101. [Google Scholar] [CrossRef] [Scilit]
- Cho, M.S.; Roy, D.P.; Kashongwe, H.B.; Yan, L.; Shen, M. Assessment and improvement of GEDI canopy height estimation in tropical and temperate forests. Sci. Remote Sens. 2025, 11, 100221. [Google Scholar] [CrossRef] [Scilit]
- Hancock, S.; Armston, J.; Hofton, M.; Sun, X.; Tang, H.; Duncanson, L.I.; Kellner, J.R.; Dubayah, R. The GEDI simulator: A large-footprint waveform LiDAR simulator for calibration and validation of spaceborne missions. Earth Space Sci. 2019, 6, 294–310. [Google Scholar] [CrossRef] [Scilit] [PubMed]
- Myroniuk, V.; Zibtsev, S.; Bogomolov, V.; Goldammer, J.G.; Soshenskyi, O.; Levchenko, V.; Matsala, M. Combining Landsat time series and GEDI data for improved characterization of fuel types and canopy metrics in wildfire simulation. J. Environ. Manag. 2023, 345, 118736. [Google Scholar] [CrossRef] [Scilit] [PubMed]
- Li, Y.; Gao, S.; Fu, H.; Zhu, J.; Hu, Q.; Zeng, D.; Wei, Y. Error Analysis and Accuracy Improvement in Forest Canopy Height Estimation Based on GEDI L2A Product: A Case Study in the United States. Forests 2024, 15, 1536. [Google Scholar] [CrossRef] [Scilit]
- Zhao, R.; Ni, W.; Zhang, Z.; Dai, H.; Yang, C.; Li, Z.; Liang, Y.; Liu, Q.; Pang, Y.; Li, Z.; et al. Optimizing ground photons for canopy height extraction from ICESat-2 data in mountainous dense forests. Remote Sens. Environ. 2023, 299, 113851. [Google Scholar] [CrossRef] [Scilit]
- Neumann, T.A.; Martino, A.J.; Markus, T.; Bae, S.; Bock, M.R.; Brenner, A.C.; Brunt, K.M.; Cavanaugh, J.; Fernandes, S.T.; Hancock, D.W.; et al. The Ice, Cloud, and Land Elevation Satellite-2 mission: A global geolocated photon product derived from the Advanced Topographic Laser Altimeter System. Remote Sens. Environ. 2019, 233, 111325. [Google Scholar] [CrossRef] [Scilit] [PubMed]
- Zhang, Q.; Zhou, H.; Ma, Y.; Li, S.; Wang, H. An adaptive photon denoising method over mountainous forest areas. IEEE Trans. Geosci. Remote Sens. 2025, 63, 1–14. [Google Scholar] [CrossRef] [Scilit]
- He, L.; Pang, Y.; Zhang, Z.; Liang, X.; Chen, B. ICESat-2 data classification and estimation of terrain height and canopy height. Int. J. Appl. Earth Obs. Geoinf. 2023, 118, 103233. [Google Scholar] [CrossRef] [Scilit]
- Pavlis, N.K.; Holmes, S.A.; Kenyon, S.C.; Factor, J.K. The development and evaluation of the Earth Gravitational Model 2008 (EGM2008). J. Geophys. Res. Solid Earth 2012, 117, B04406. [Google Scholar] [CrossRef] [Scilit]
- Fu, L.; Shu, Q.; Yang, Z.; Xia, C.; Zhang, X.; Zhang, Y.; Li, Z.; Li, S. Accuracy assessment of topography and forest canopy height in complex terrain conditions of Southern China using ICESat-2 and GEDI data. Front. Plant Sci. 2025, 16, 1547688. [Google Scholar] [CrossRef] [Scilit] [PubMed]
- Wang, Y.; Ni, W.; Sun, G.; Chi, H.; Zhang, Z.; Guo, Z. Slope-adaptive waveform metrics of large-footprint LiDAR for estimation of forest aboveground biomass. Remote Sens. Environ. 2019, 224, 386–400. [Google Scholar] [CrossRef] [Scilit]
- Yang, X.; Wang, C.; Xi, X.; Wang, Y.; Zhang, Y.; Zhou, G. Footprint size design of large-footprint full-waveform LiDAR for forest and topography applications: A theoretical study. IEEE Trans. Geosci. Remote Sens. 2021, 59, 9745–9757. [Google Scholar] [CrossRef] [Scilit]
- Yu, Q.; Ryan, M.G.; Ji, W.; Prihodko, L.; Anchang, J.Y.; Kahiu, N.; Nazir, A.; Dai, J.; Hanan, N.P. Assessing canopy height measurements from ICESat-2 and GEDI orbiting LiDAR across six different biomes with G-LiHT LiDAR. Environ. Res. Ecol. 2024, 3, 025001. [Google Scholar] [CrossRef] [Scilit]
- Duncanson, L.; Kellner, J.R.; Armston, J.; Dubayah, R.; Minor, D.M.; Hancock, S.; Healey, S.P.; Patterson, P.L.; Saarela, S.; Marselis, S.; et al. Aboveground biomass density models for NASA’s Global Ecosystem Dynamics Investigation (GEDI) LiDAR mission. Remote Sens. Environ. 2022, 270, 112845. [Google Scholar] [CrossRef] [Scilit]
- Lefsky, M.A.; Keller, M.; Pang, Y.; de Camargo, P.B.; Hunter, M.O. Revised method for forest canopy height estimation from Geoscience Laser Altimeter System waveforms. J. Appl. Remote Sens. 2007, 1, 013537. [Google Scholar] [CrossRef] [Scilit]
- Mishra, N.B.; Singh, P.B. Mountains of error: UAV LiDAR benchmarking of GEDI and GEDI-derived global canopy height products in steep Himalayan forests. Int. J. Appl. Earth Obs. Geoinf. 2026, 147, 105203. [Google Scholar] [CrossRef] [Scilit]
- Simard, M.; Pinto, N.; Fisher, J.B.; Baccini, A. Mapping forest canopy height globally with spaceborne LiDAR. J. Geophys. Res. Biogeosci. 2011, 116, G04021. [Google Scholar] [CrossRef] [Scilit]
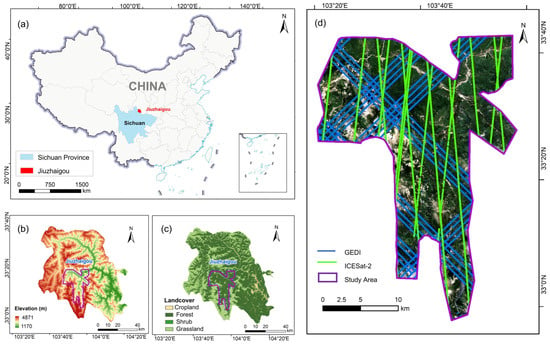
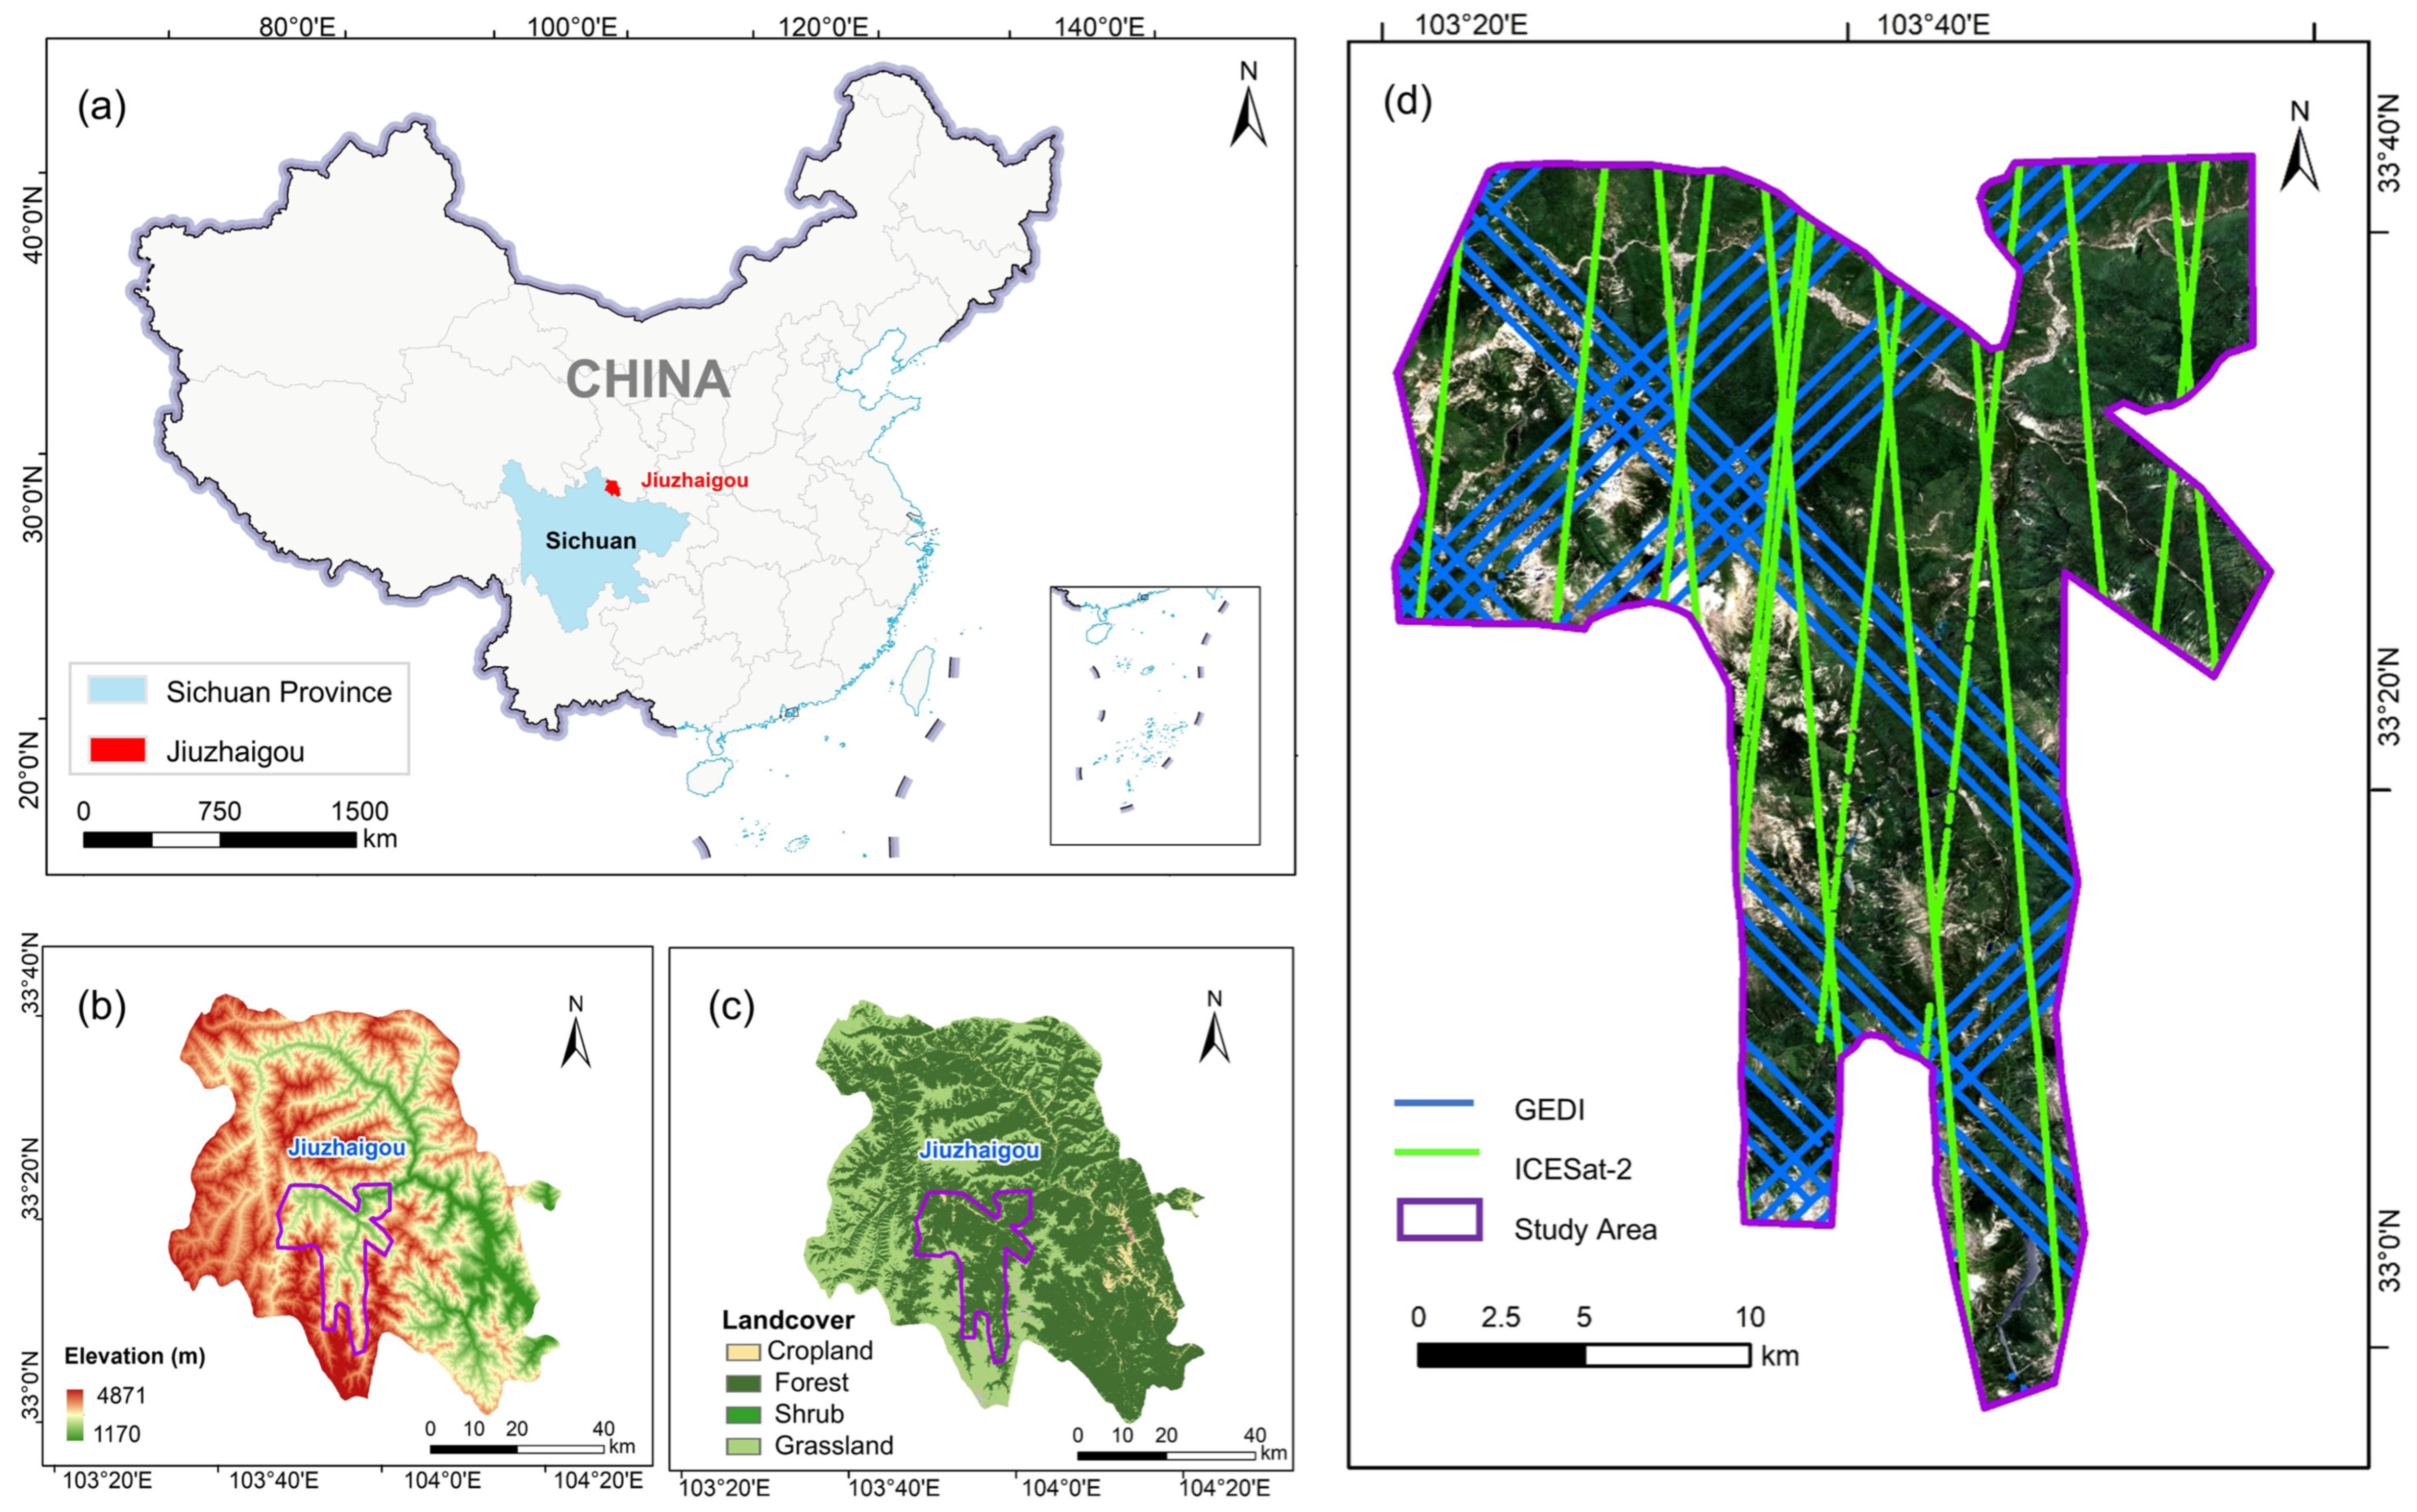
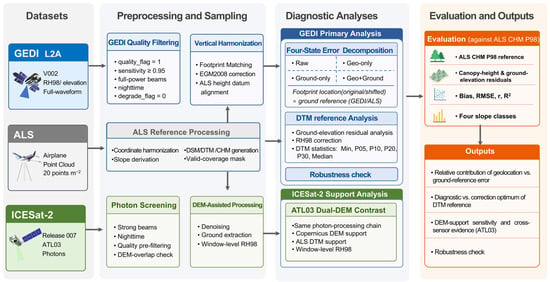
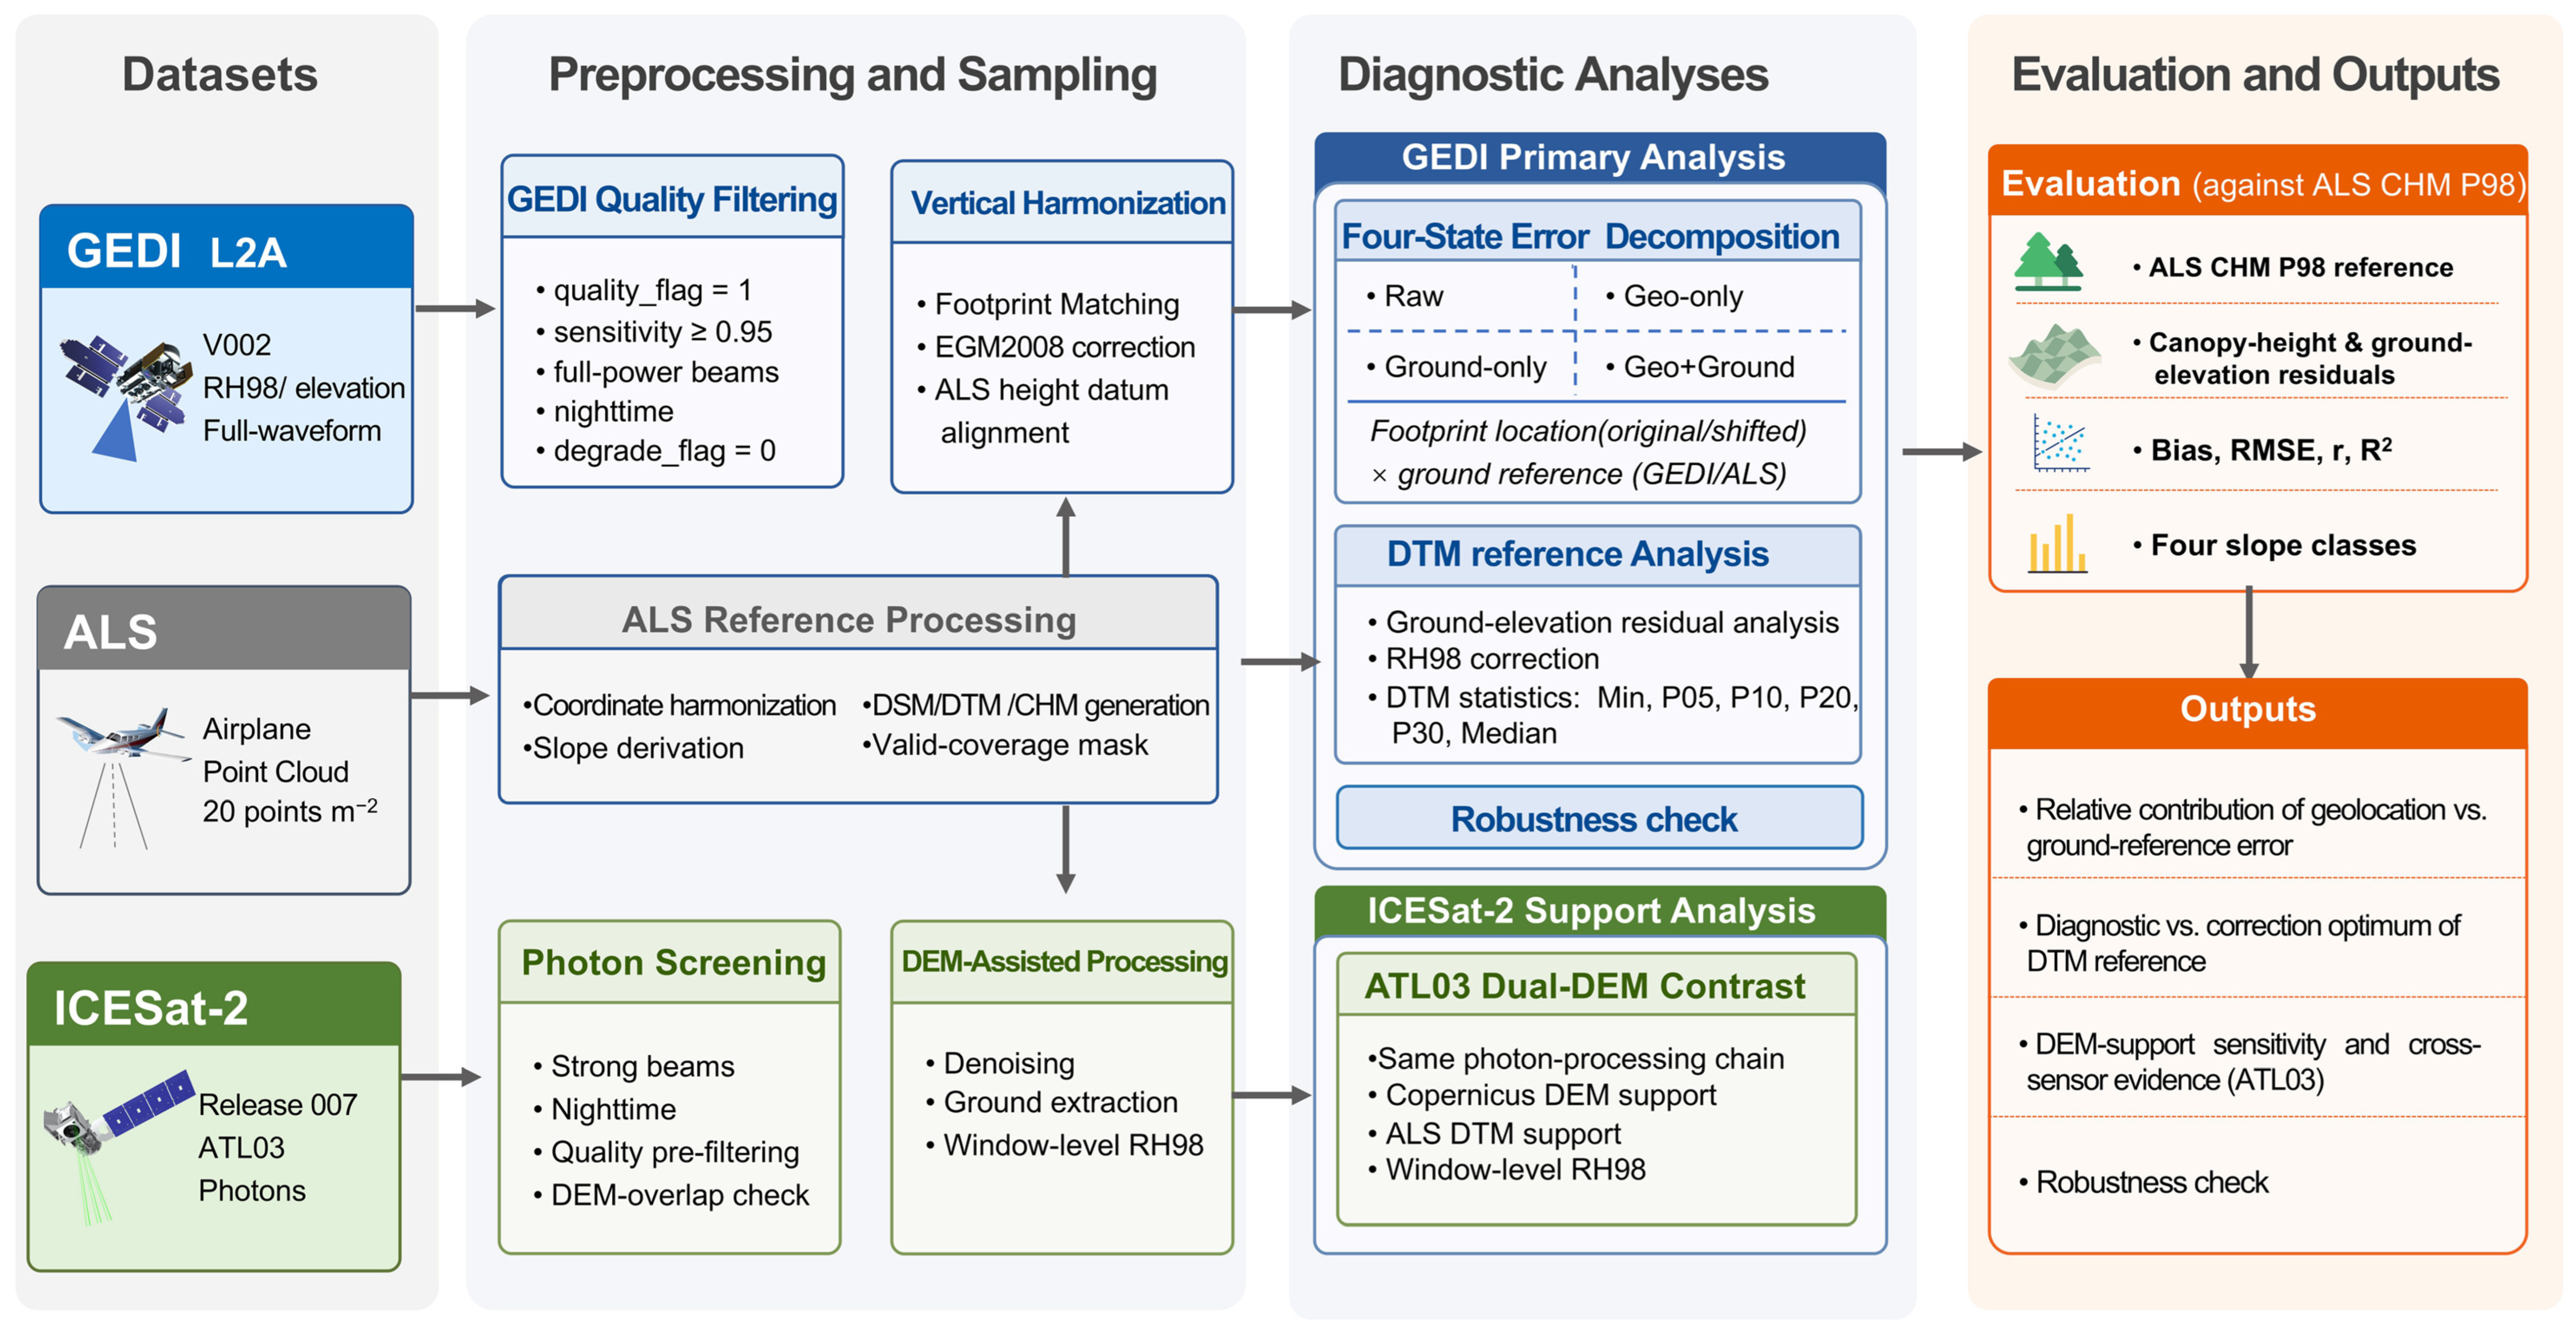
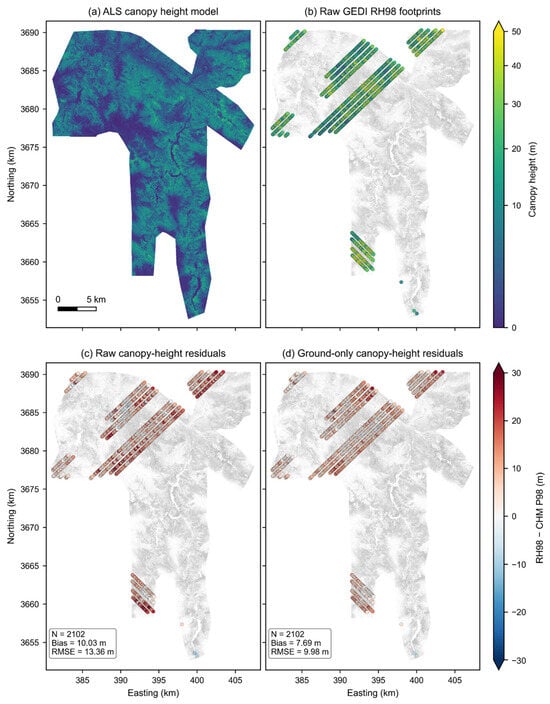
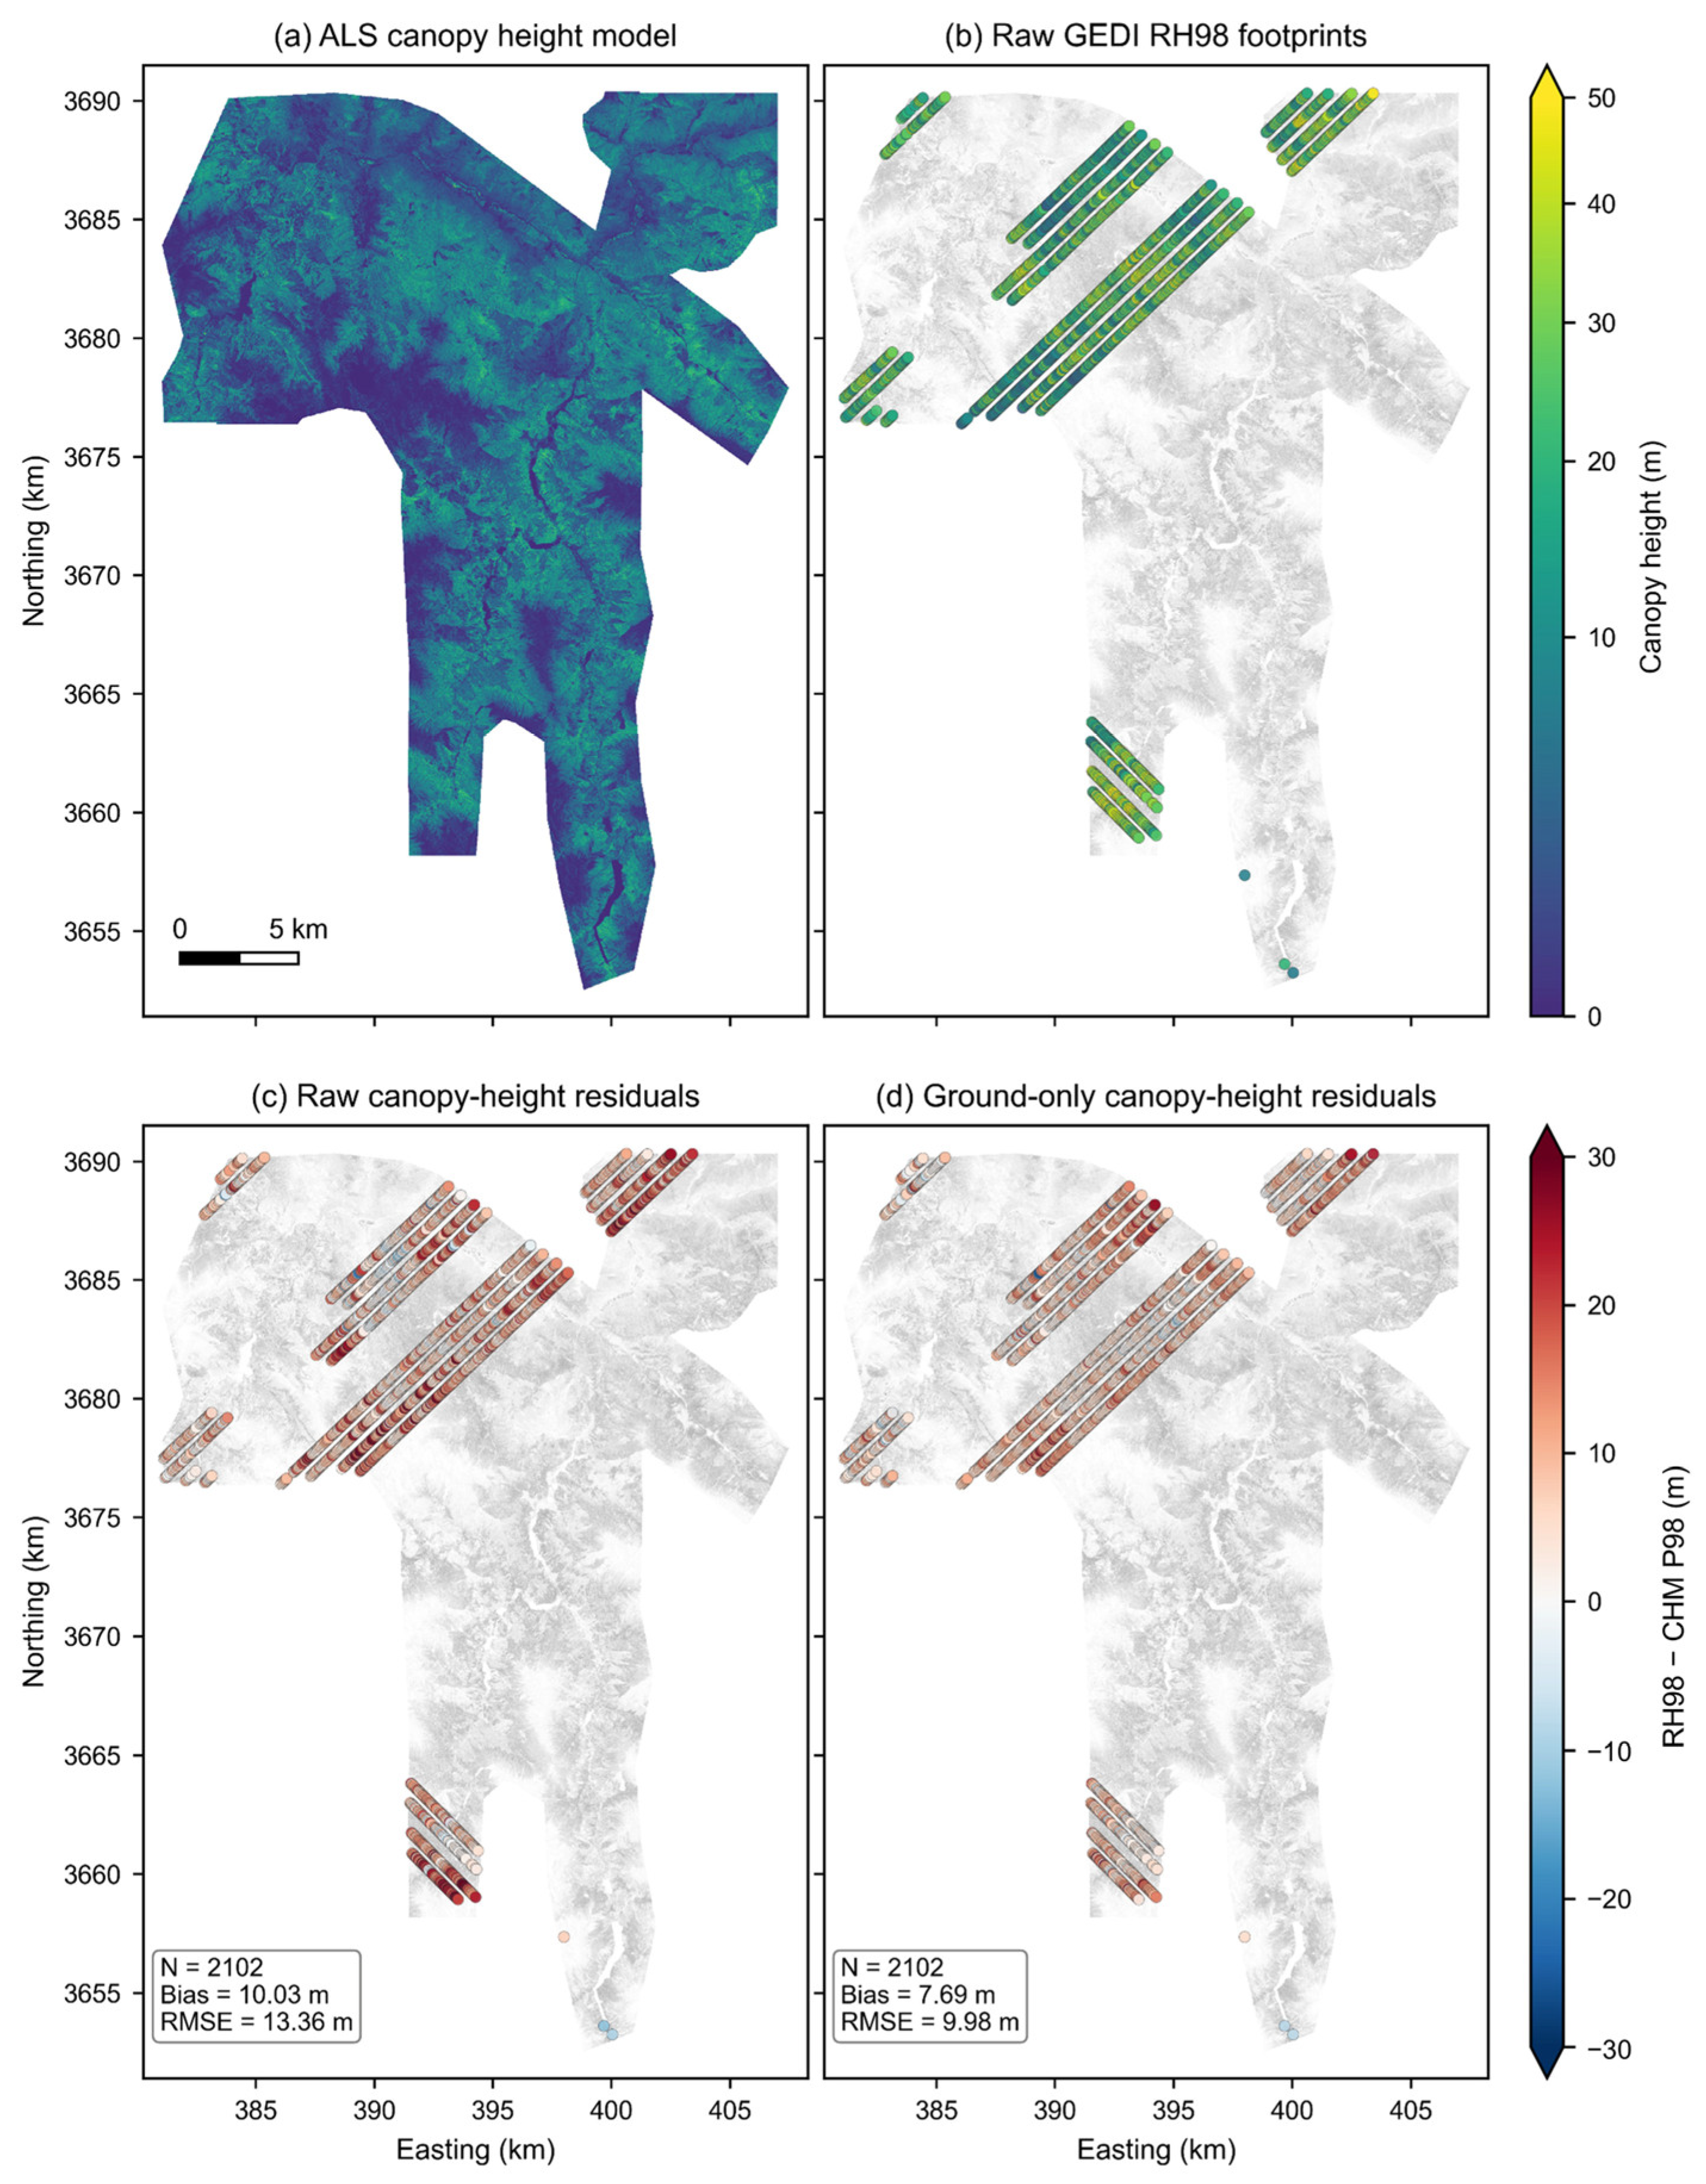
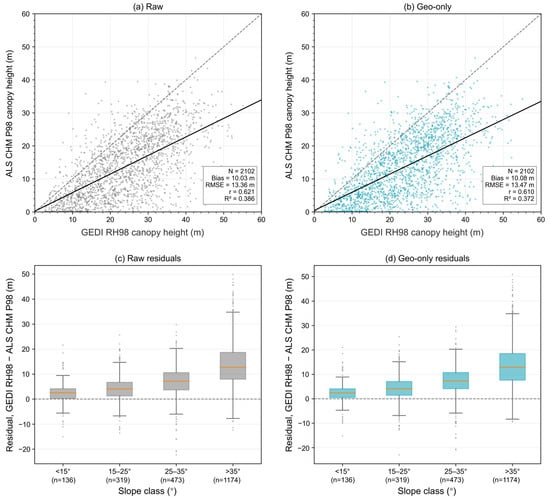
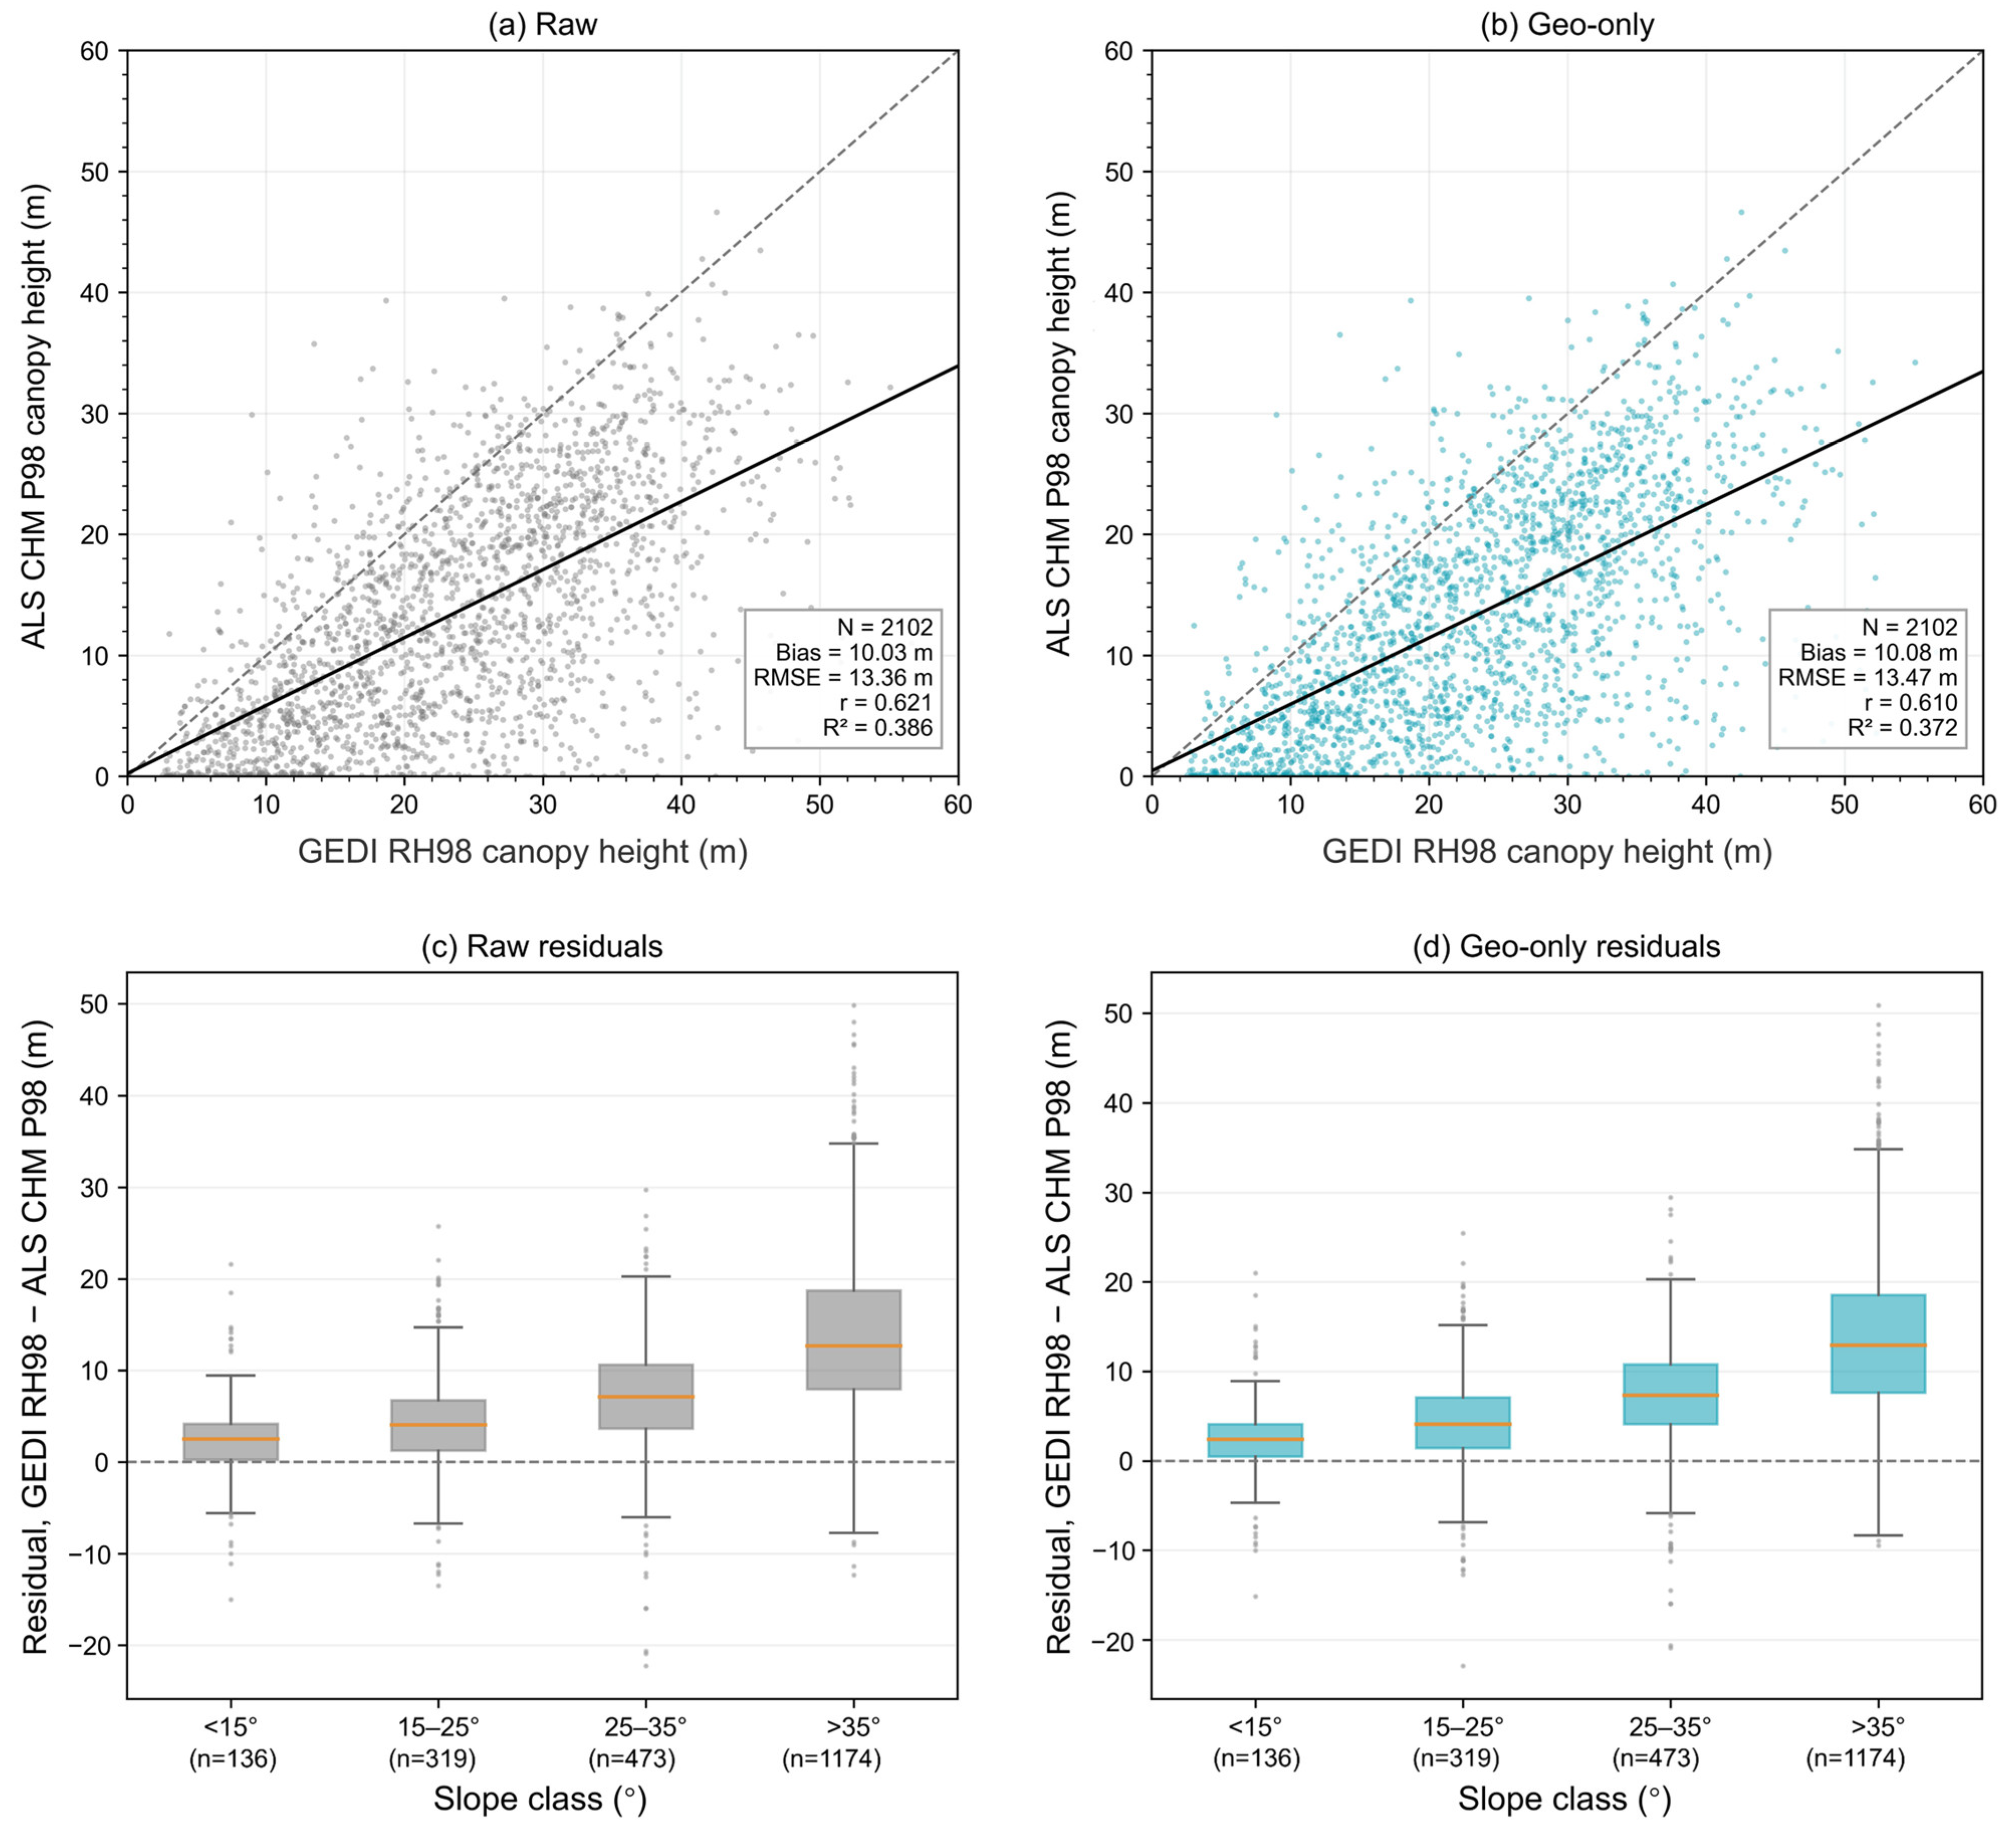
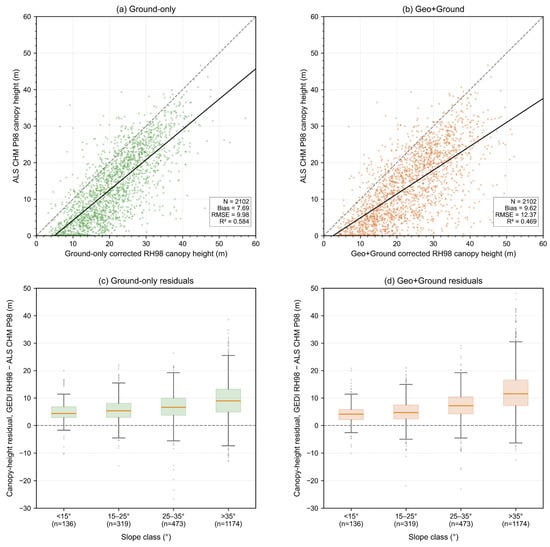
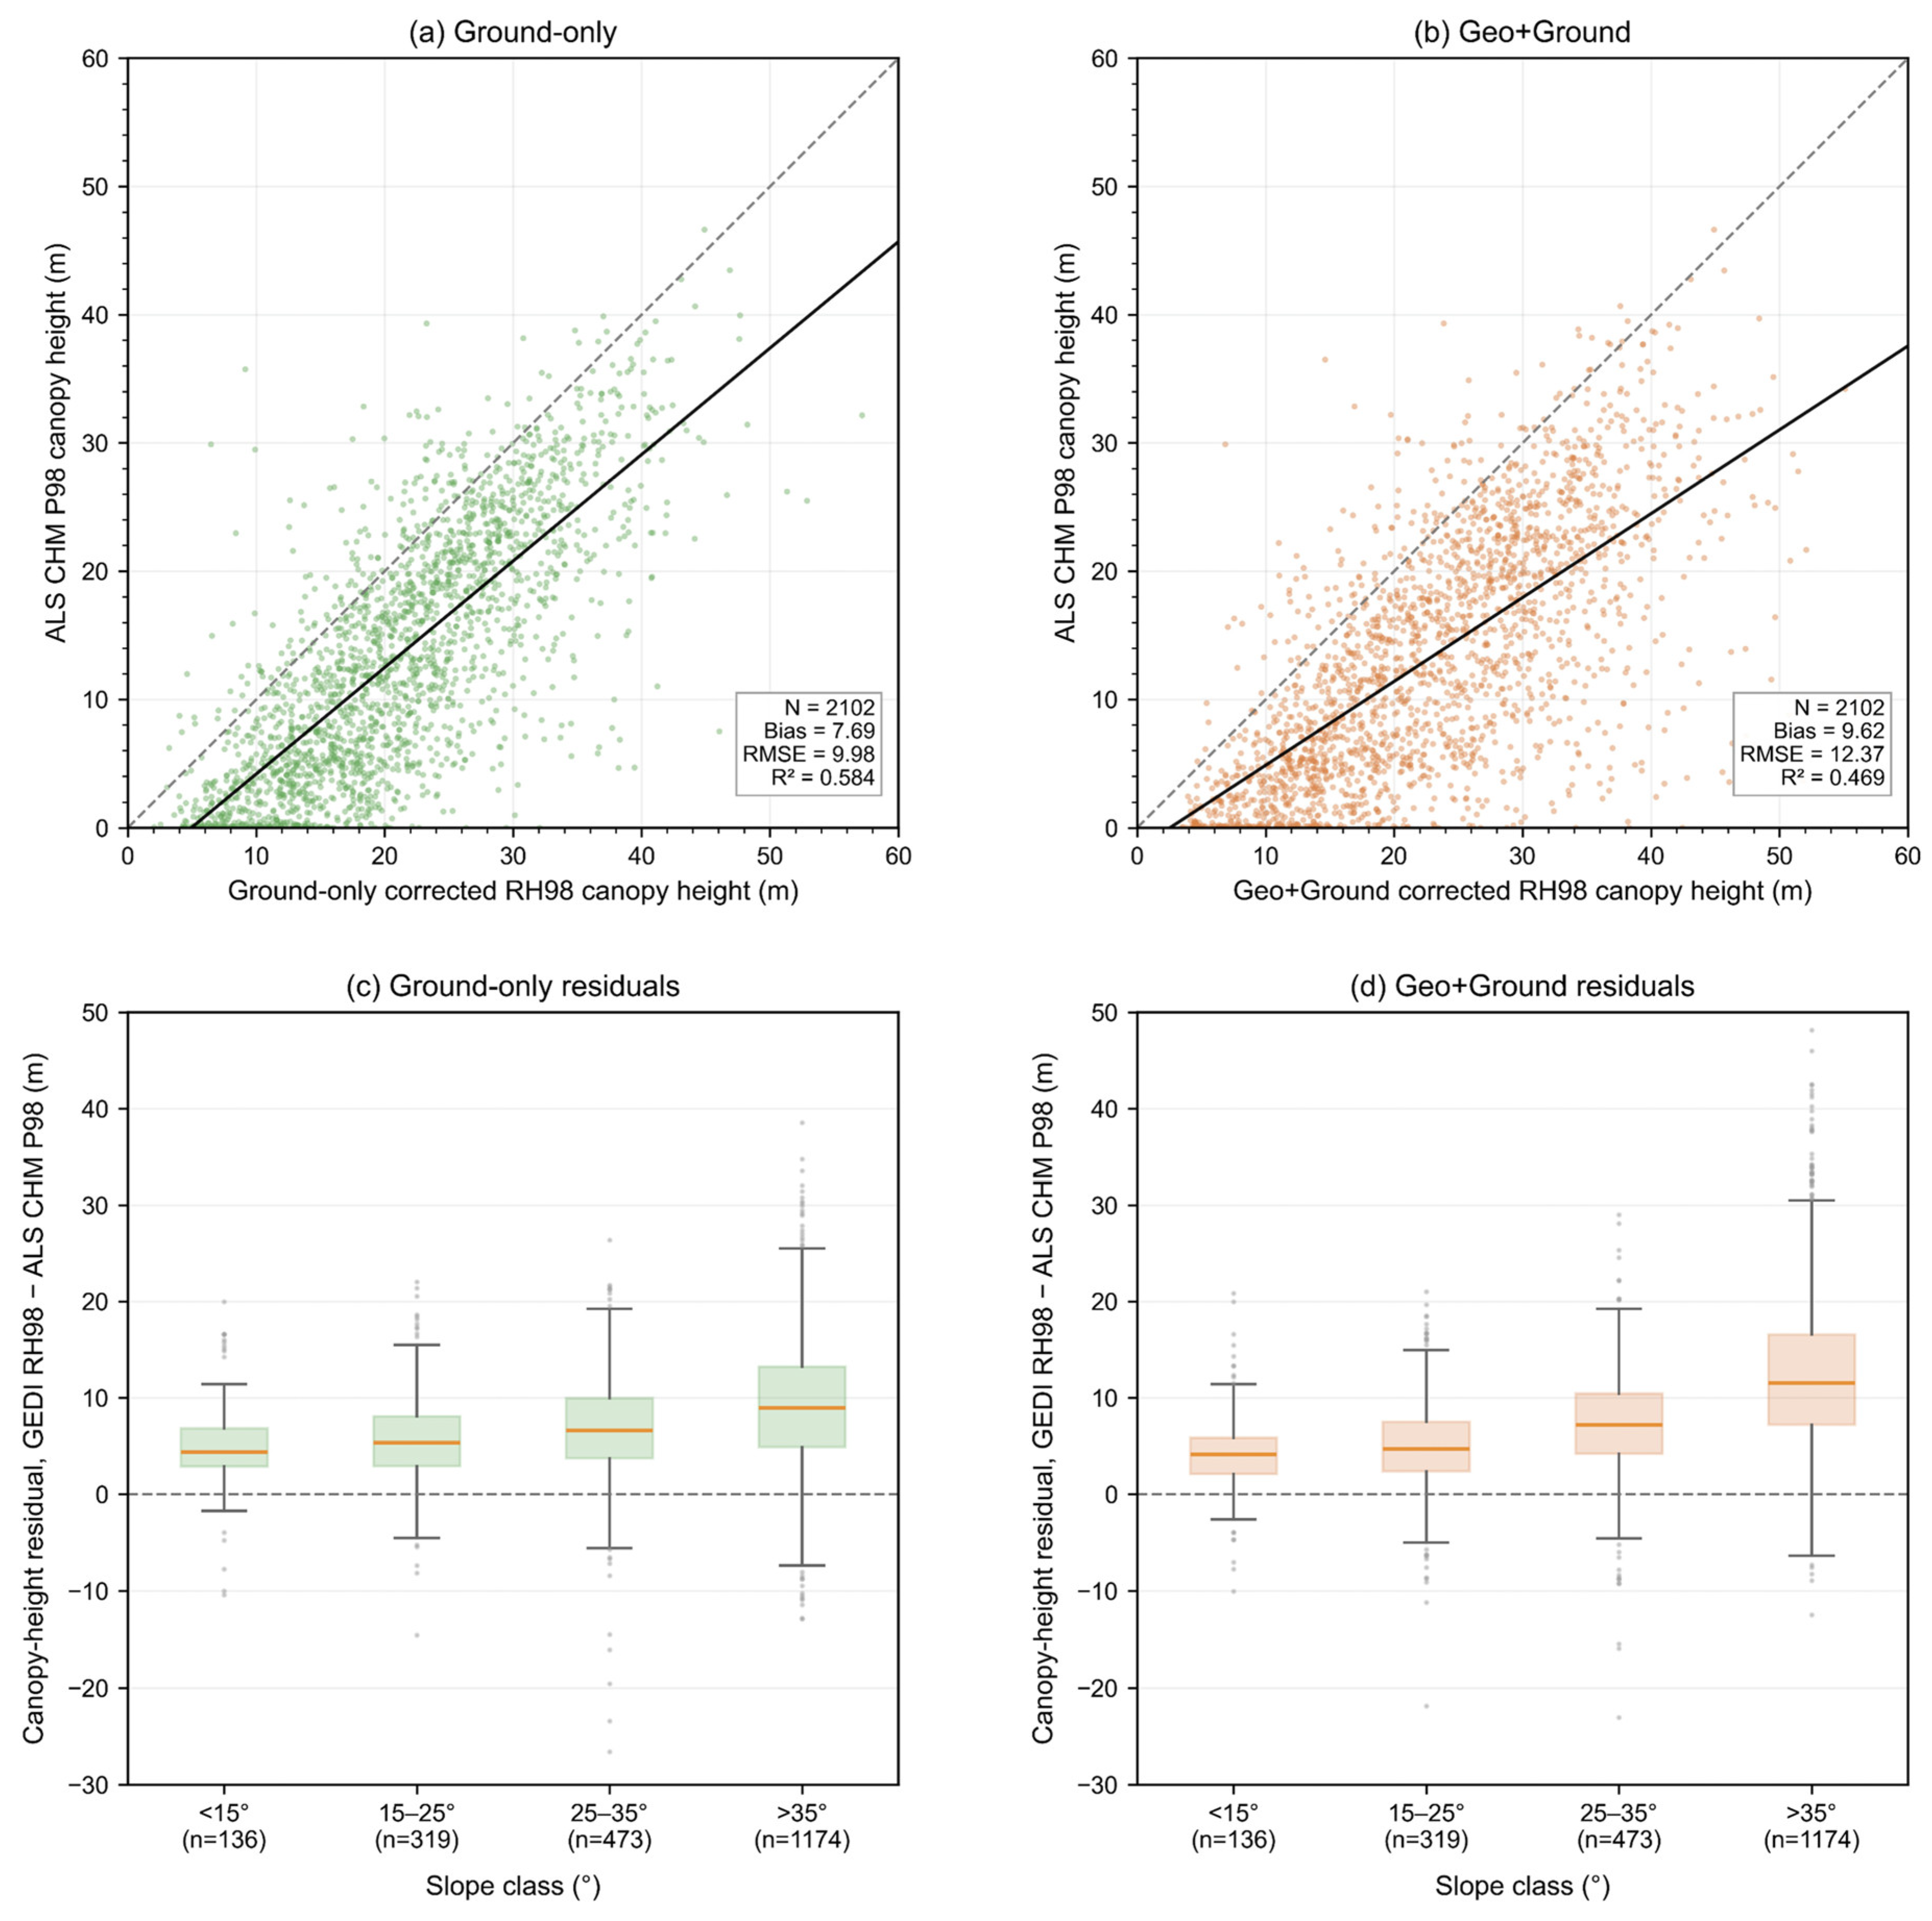
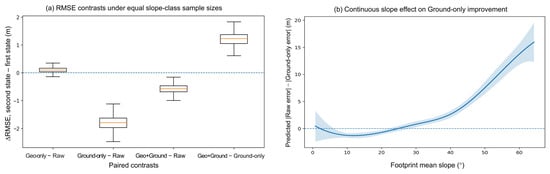
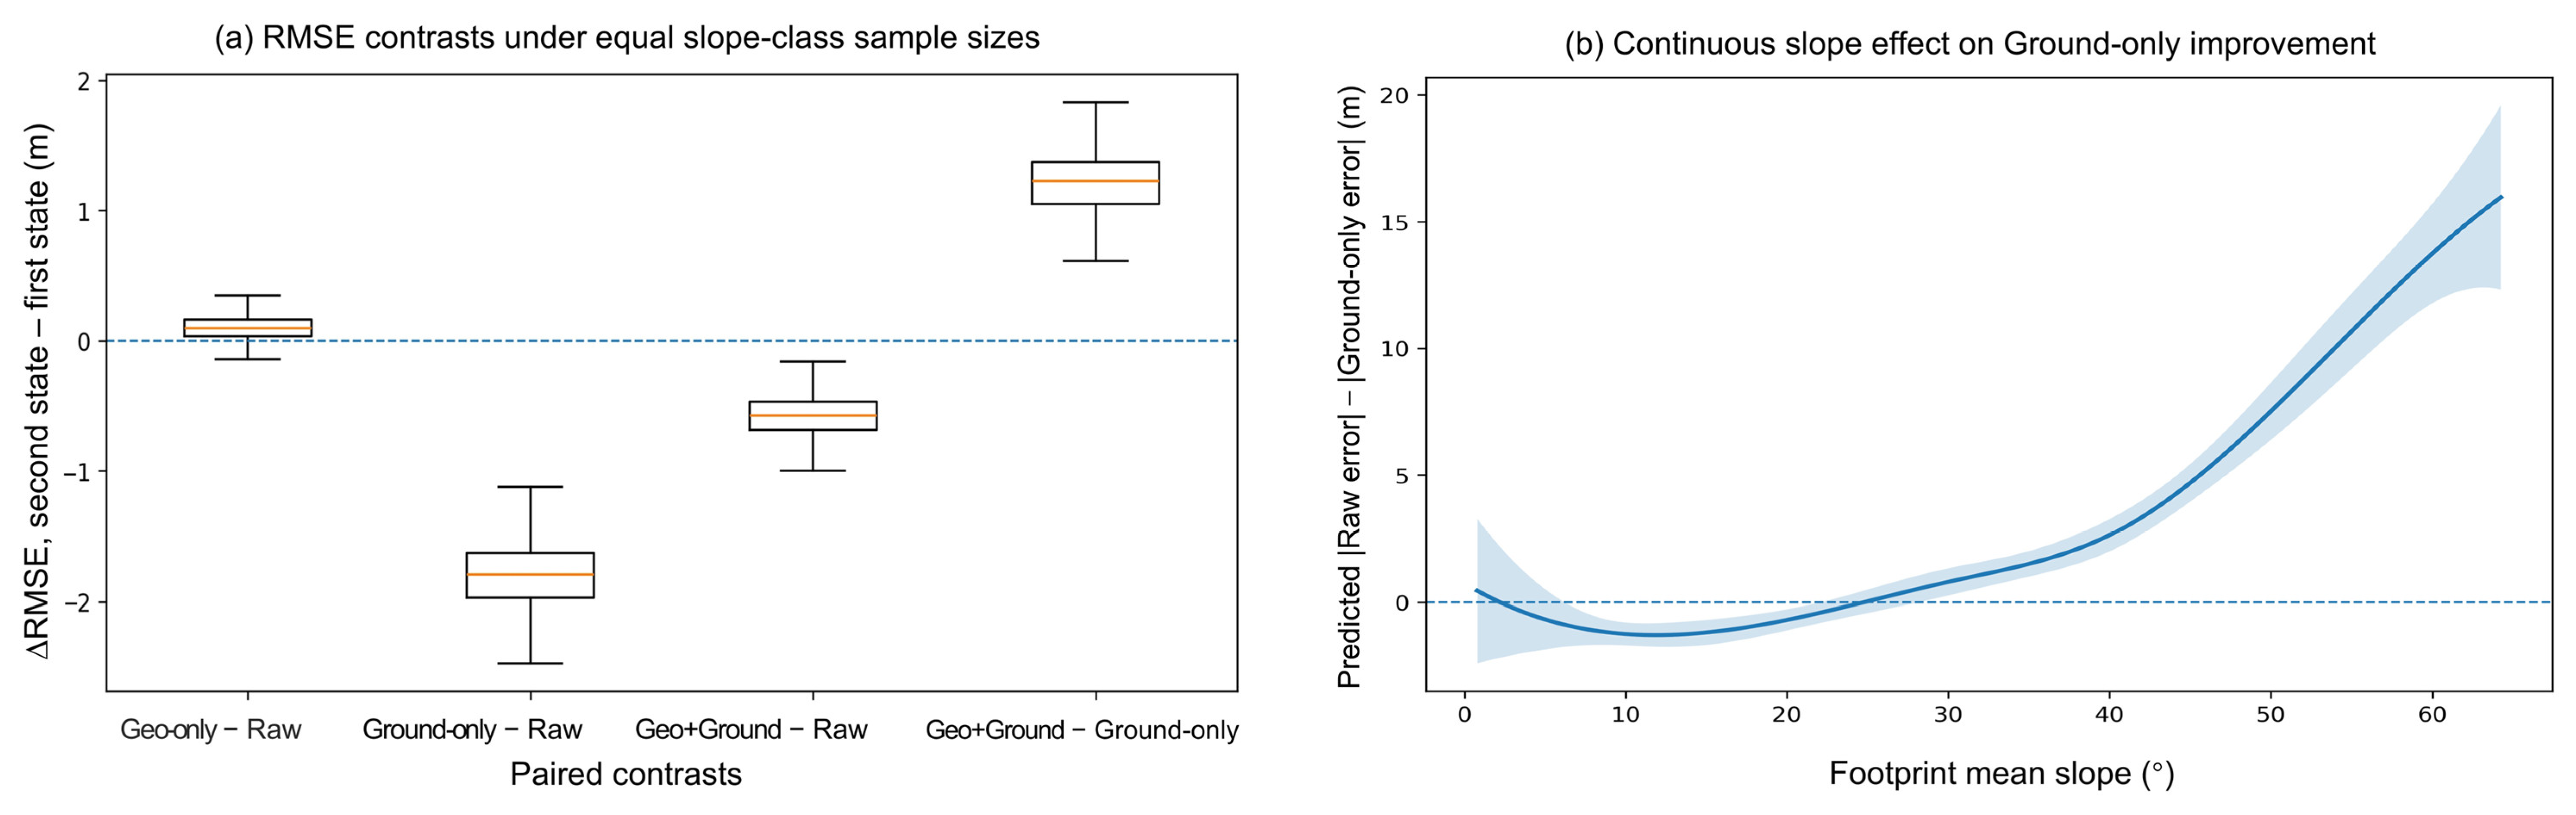
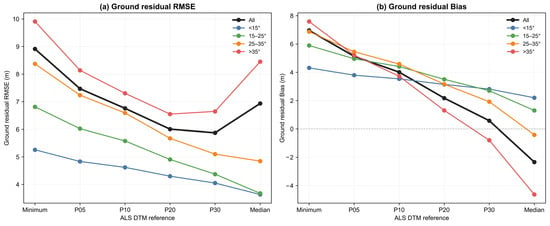
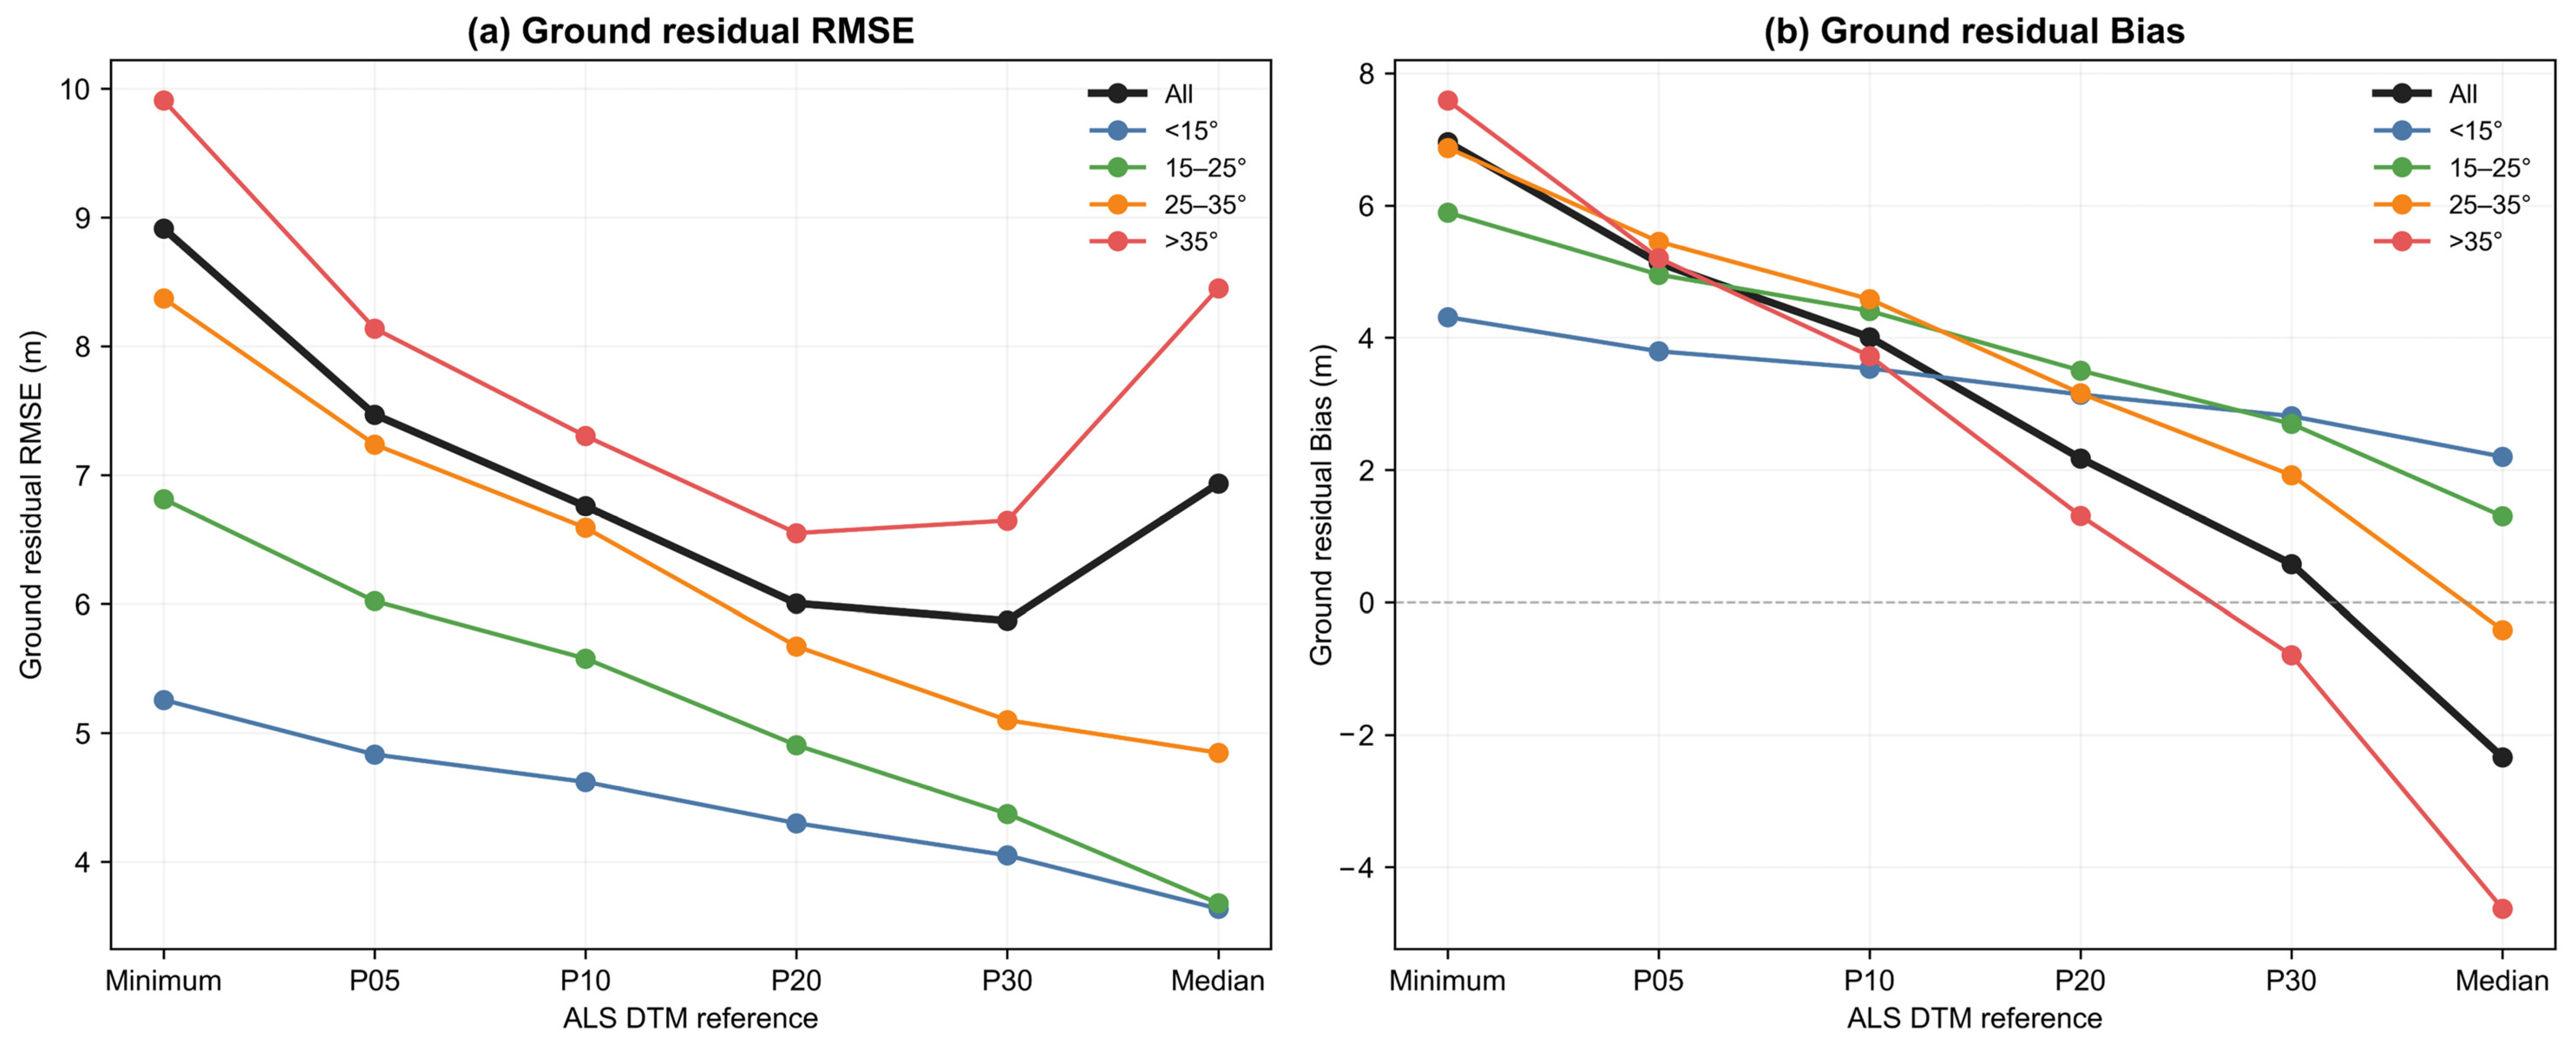
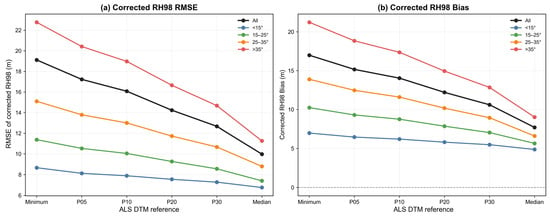
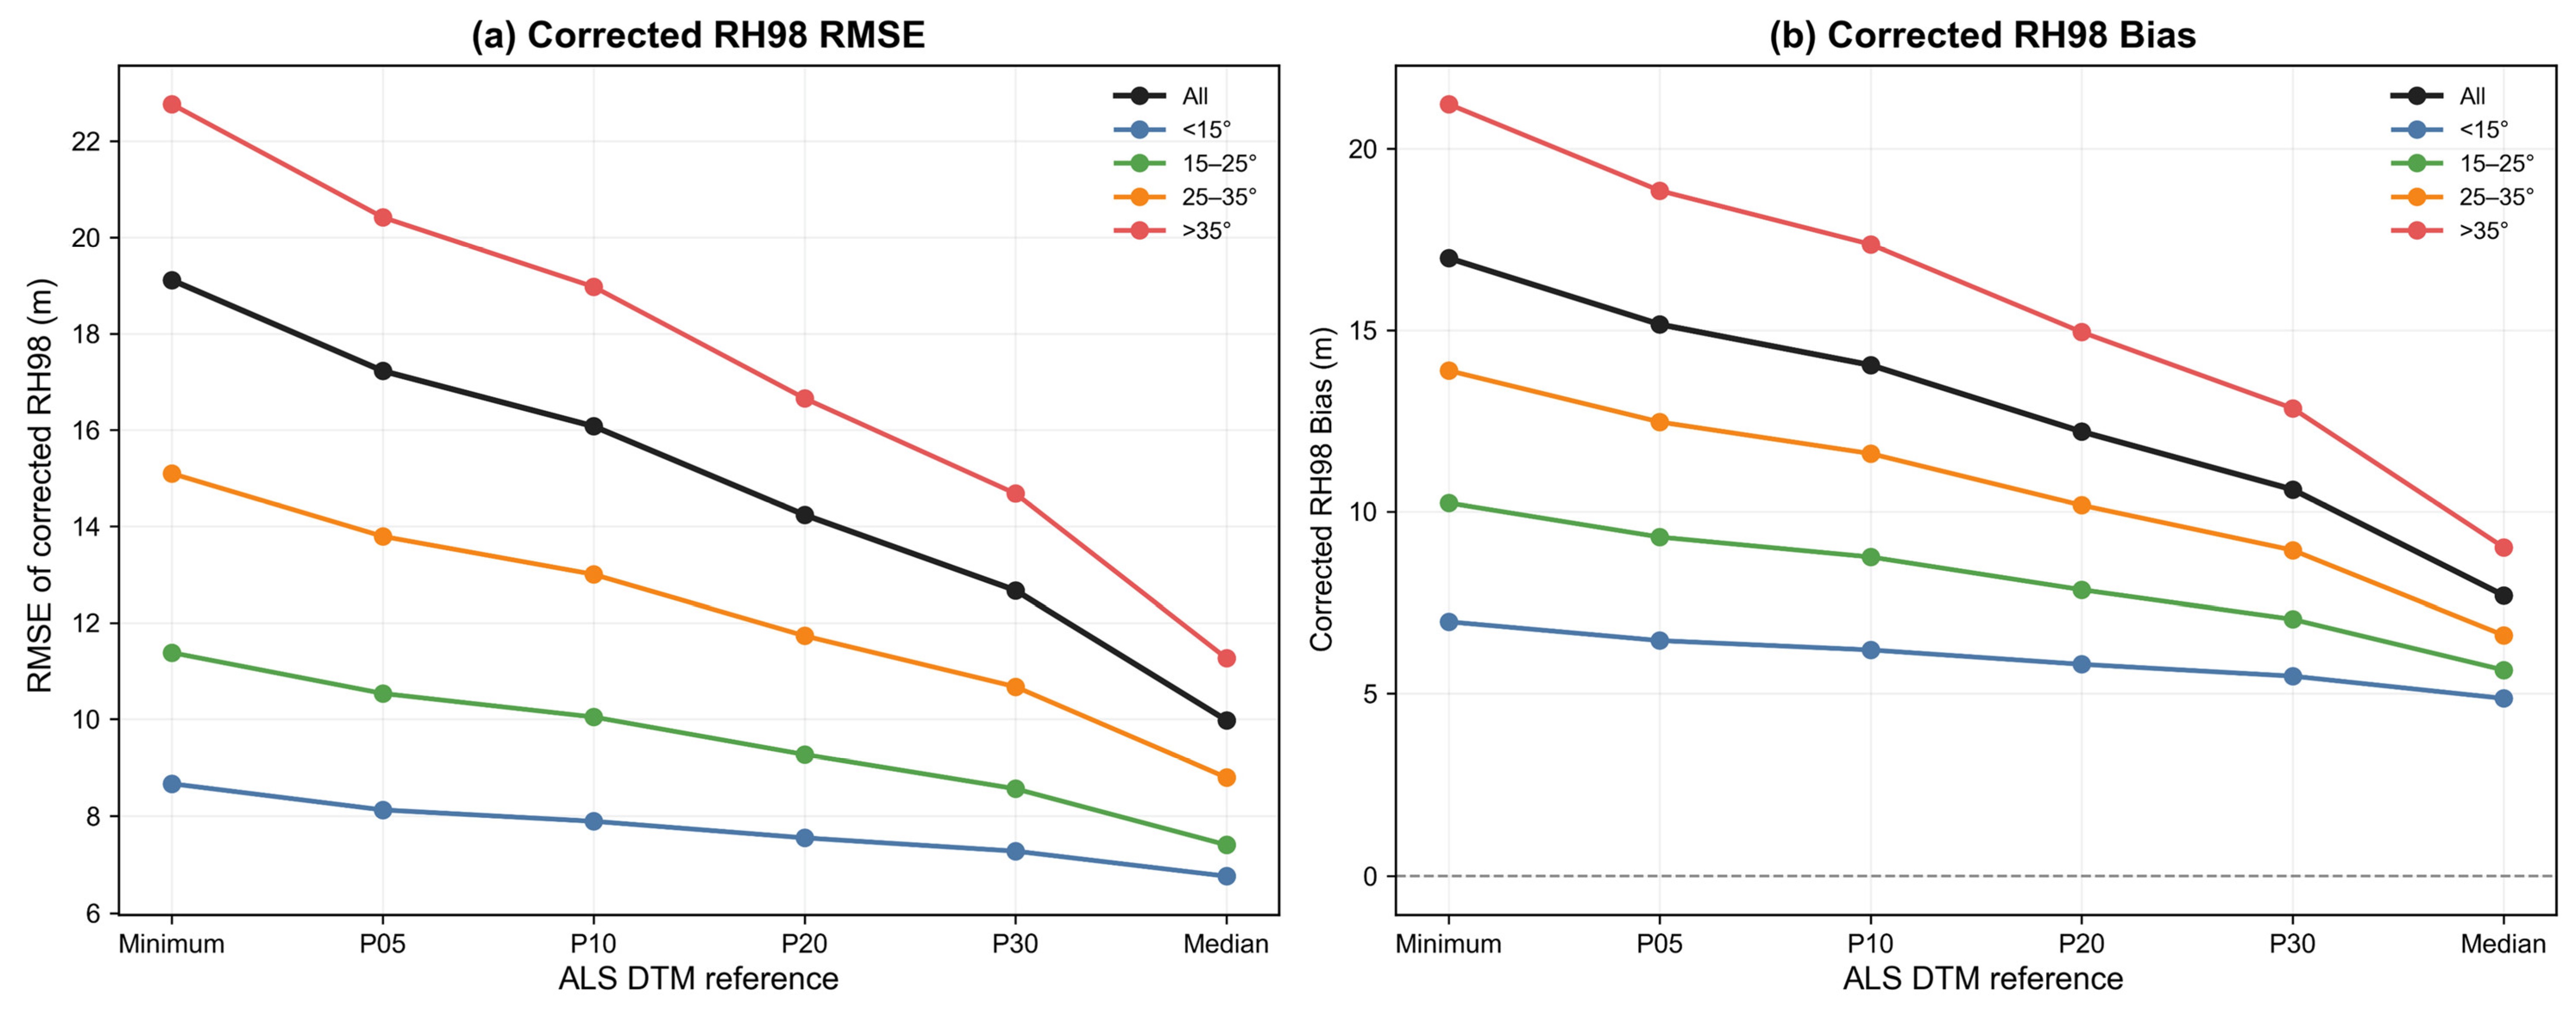
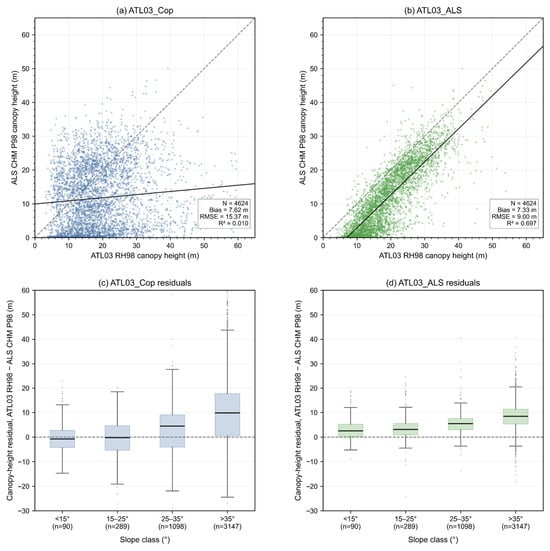
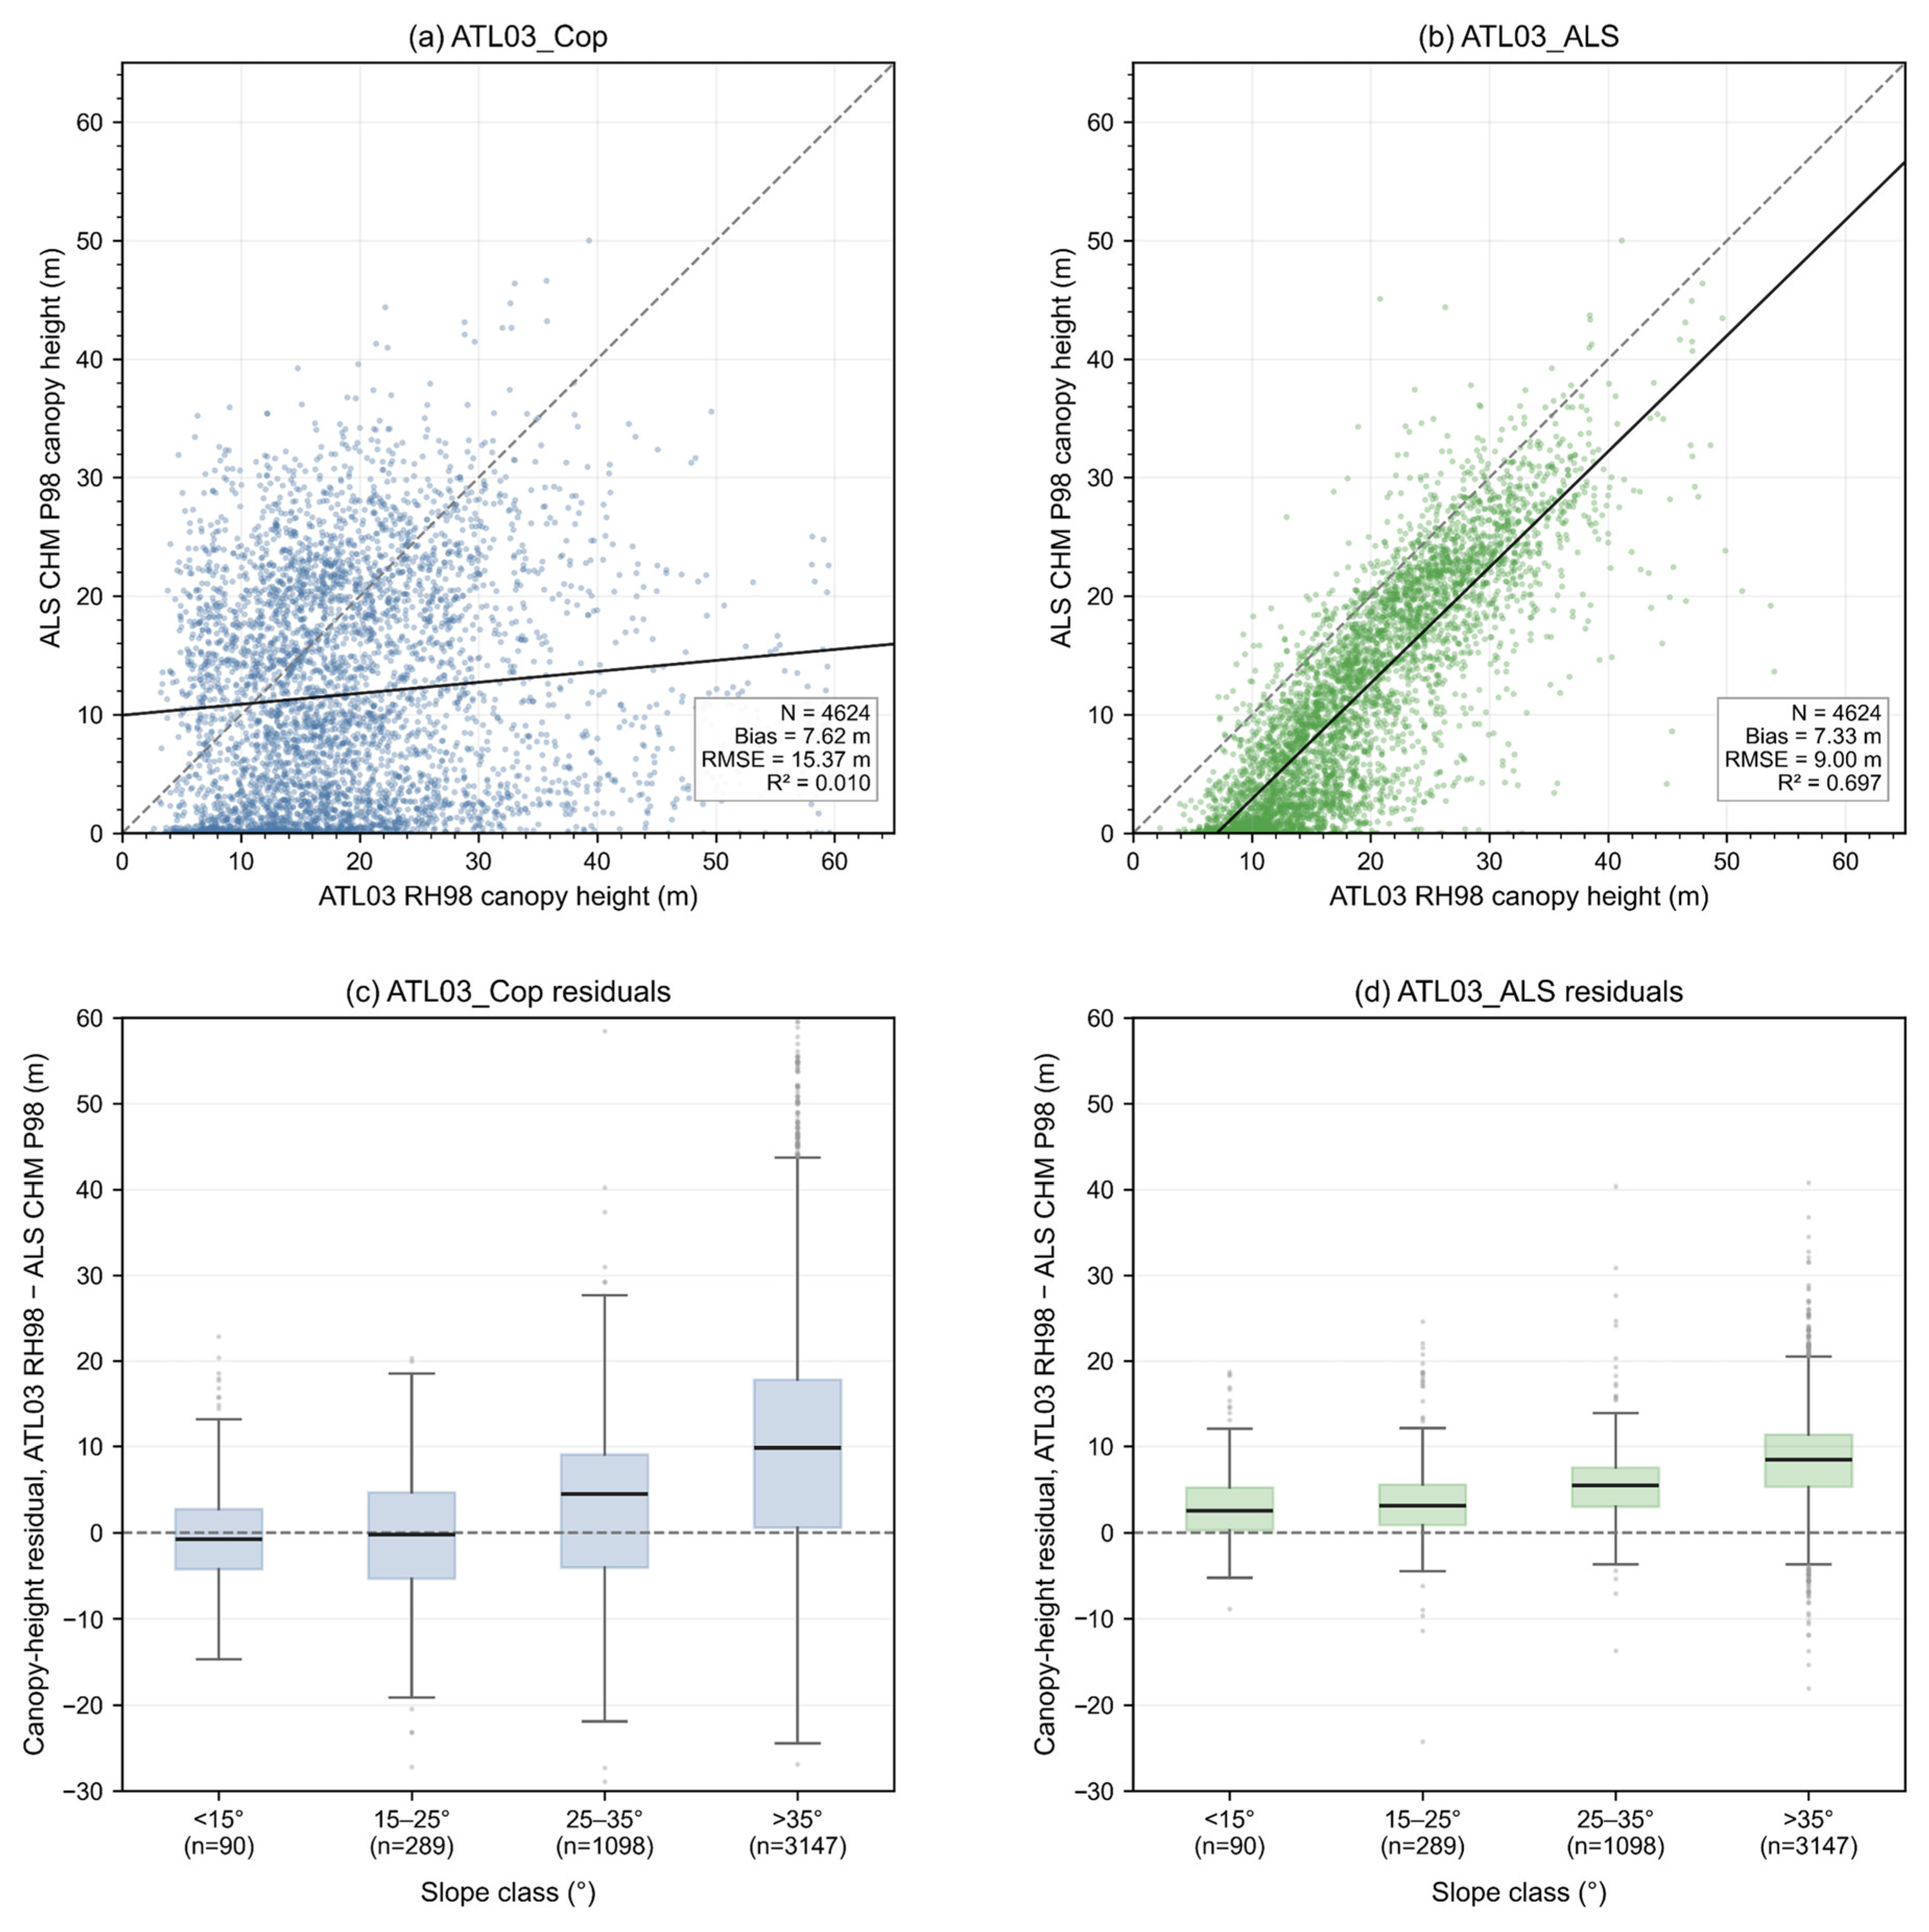

Disclaimer/Publisher’s Note: The statements, opinions and data contained in all publications are solely those of the individual author(s) and contributor(s) and not of MDPI and/or the editor(s). MDPI and/or the editor(s) disclaim responsibility for any injury to people or property resulting from any ideas, methods, instructions or products referred to in the content. |
© 2026 by the authors. Licensee MDPI, Basel, Switzerland. This article is an open access article distributed under the terms and conditions of the Creative Commons Attribution (CC BY) license.