


Abstract
Atmospheric nitrogen (N) deposition is increasing N inputs to forests, but consequences for soil carbon (C) status and respiration partitioning remain uncertain. We conducted a five-year field N-addition experiment in an alpine coniferous forest in Xizang, China. We measured post-treatment soil properties, extracellular enzyme activities, estimated microbial C use efficiency (CUE), total soil respiration (Rs), root-exclusion heterotrophic respiration (Rh), and residual autotrophic respiration (Ra = Rs − Rh). Relative to the zero-N control (N0; 0 kg N ha−1 yr−1), N1 and N2 had higher post-treatment soil organic C, whereas all N-addition treatments had >60% lower available phosphorus and 19.12%–64% lower Rs. The Rs contrast was more strongly reflected in estimated Ra (35.93%–87% lower), whereas Rh responses varied among treatments and campaigns. N addition altered enzyme allocation and was associated with 6.70%–16.60% lower estimated CUE. Exploratory random forest and partial least squares path models indicated that Rh covaried more closely with microbial biomass, whereas Rs and estimated Ra covaried with soil physicochemical conditions and phosphorus availability. Thus, higher post-treatment soil C in some N-addition treatments co-occurred with lower Rs. However, the absence of pretreatment soil data and direct root measurements limits causal interpretation.
1. Introduction
Intensified anthropogenic activities have substantially altered global atmospheric N deposition patterns [1,2], with important consequences for terrestrial C cycling [3]. Forest soils represent one of the largest C pools in terrestrial ecosystems and play a critical role in regulating atmospheric CO2 concentrations and mitigating climate change [4,5,6]. It is generally assumed that, in N-limited forest ecosystems, moderate exogenous N inputs promote soil organic carbon (SOC) accumulation by enhancing plant productivity and increasing aboveground and belowground carbon inputs [7,8,9]. However, the net balance of the soil carbon (C) pool is determined not only by carbon inputs but also by carbon losses via soil respiration (Rs) [10]. Increasing evidence indicates that the responses of Rs and its two components, autotrophic respiration (Ra) and heterotrophic respiration (Rh), to nitrogen deposition are highly variable and remain poorly resolved [11,12,13]. Therefore, distinguishing the responses of Rs, Ra, and Rh is essential for understanding how N deposition regulates forest soil C dynamics. Recent global syntheses further indicate that the effects of N enrichment on soil respiration are context-dependent rather than uniformly positive or negative. A meta-analysis of 340 simulated N-addition studies showed that the response of Rs shifted from positive to negative with increasing cumulative N input and declining soil pH [11], whereas a more recent synthesis of 175 field N-manipulation experiments revealed a widespread unimodal relationship between N-addition rate and Rs [12]. These findings highlight that the direction and magnitude of soil respiratory responses depend not only on the rate of N input but also on cumulative N exposure and ecosystem conditions. Consequently, experimental duration represents an important dimension of N-addition studies: repeated annual inputs can progressively alter soil nutrient balance and biological activity, such that responses observed after several years may differ from those occurring during the initial stages of N enrichment. Multi-year field experiments are therefore particularly valuable for distinguishing transient responses to N input from more persistent reorganization of soil C cycling.
Autotrophic and heterotrophic respiration can respond asymmetrically to N enrichment [14]. Extracellular enzyme allocation provides a complementary indicator of how microbial resource-acquisition strategies may change under altered nutrient availability. Soil microorganisms allocate metabolic investment among enzymes that acquire C, N, and P from soil organic matter, and shifts in the relative activities of these enzymes can indicate changes in microbial resource demand and nutrient-acquisition strategies [15,16,17]. Long-term N inputs can substantially modify the soil microenvironment, particularly by lowering soil pH and altering the relative availability of C, N, and P [18,19,20]. Such changes may lead to stoichiometric imbalance, which occurs when the supply of C, N, and P does not match the elemental requirements of plants and microorganisms. Under N enrichment, increased N availability may be accompanied by relatively lower P availability or increased microbial demand for available C, thereby altering microbial enzyme investment, C use efficiency, and soil respiration processes. These changes may constrain root activity and belowground C allocation, thereby affecting the autotrophic component of soil respiration. At the same time, N-induced shifts in substrate availability, microbial biomass, and extracellular enzyme production may alter Rh by regulating microbial decomposition processes [21]. Microbial carbon use efficiency (CUE), which describes the proportion of assimilated C used for microbial biomass production rather than respiration [22,23], is a key physiological indicator governing the balance between soil C retention and C loss [6]. Under stoichiometric imbalance and environmental stress, changes in microbial CUE may alter microbial C partitioning between biomass production and respiration, thereby influencing microbially mediated C fluxes. However, empirical studies that integrate enzyme allocation, ecoenzymatic stoichiometry, microbial CUE, and partitioned soil respiration to systematically elucidate these mechanisms remain limited.
Studies on the Tibetan Plateau have demonstrated context-dependent soil respiration responses to N and P addition in alpine grassland [24] and microenvironment-dependent C, N, and P release from litter in alpine fir forest [25]. Soil P forms and fractions also vary with elevation and edaphic conditions across the Plateau [26,27]. Previous evidence that N deposition can reduce forest soil respiration, together with substantial and spatially shifting atmospheric N deposition, further highlights the need to examine belowground C responses to sustained N enrichment. Under such conditions, five years of N addition may not simply increase or decrease total soil respiration; instead, it may reorganize the relative contributions of root-derived and microbially mediated CO2 efflux. Thus, the five-year duration of the present experiment provides an opportunity to assess responses to repeated N inputs after cumulative treatment exposure, rather than responses to a single or short-term fertilization event. These characteristics make alpine forests in Xizang an ideal system for examining how N enrichment regulates SOC accumulation and soil respiration partitioning.
Previous studies have shown that chronic N enrichment can increase forest-soil C storage by suppressing decomposition [28], that total, autotrophic, and heterotrophic respiration can respond differently to N addition among biomes [29], and that N-induced changes in soil glycosidase activity are associated with soil respiration [30]. A meta-analysis further demonstrated that N addition can alter microbial carbon use efficiency (CUE) [31]. Building on these complementary lines of evidence, we integrated multi-year respiration partitioning with soil nutrient status, extracellular enzyme allocation, ecoenzymatic stoichiometry, and microbial CUE within the same five-year field experiment. This integrated framework allowed us to evaluate how post-treatment soil C status covaried with measured heterotrophic respiration (Rh) and estimated autotrophic respiration (Ra) under sustained N enrichment. We hypothesized that: (1) after five years, the N-addition plots would have higher post-treatment SOC but lower Rs than N0, in association with lower soil pH and P availability; (2) the lower Rs under N addition would be more strongly reflected in estimated Ra than in measured Rh, whereas Rh would show treatment-dependent variation; and (3) measured Rh would covary more strongly with microbial biomass and extracellular enzyme activities, whereas Rs and estimated Ra would covary more strongly with soil pH and P availability. By testing these hypotheses, this study aimed to characterize treatment-associated variation in belowground CO2 efflux and its covariation with soil biochemical properties after five years of N enrichment.
2. Materials and Methods
2.1. Site Description, Experimental Design, and Soil Sampling
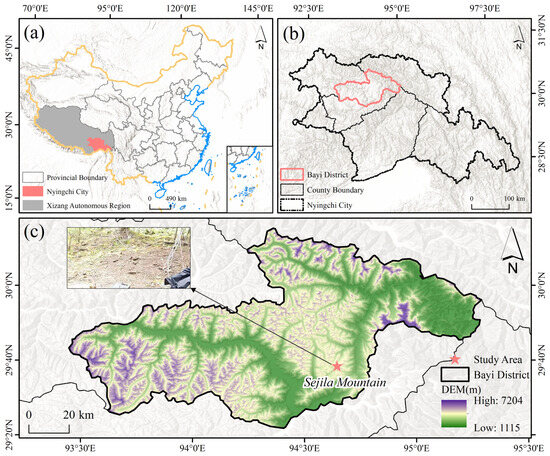
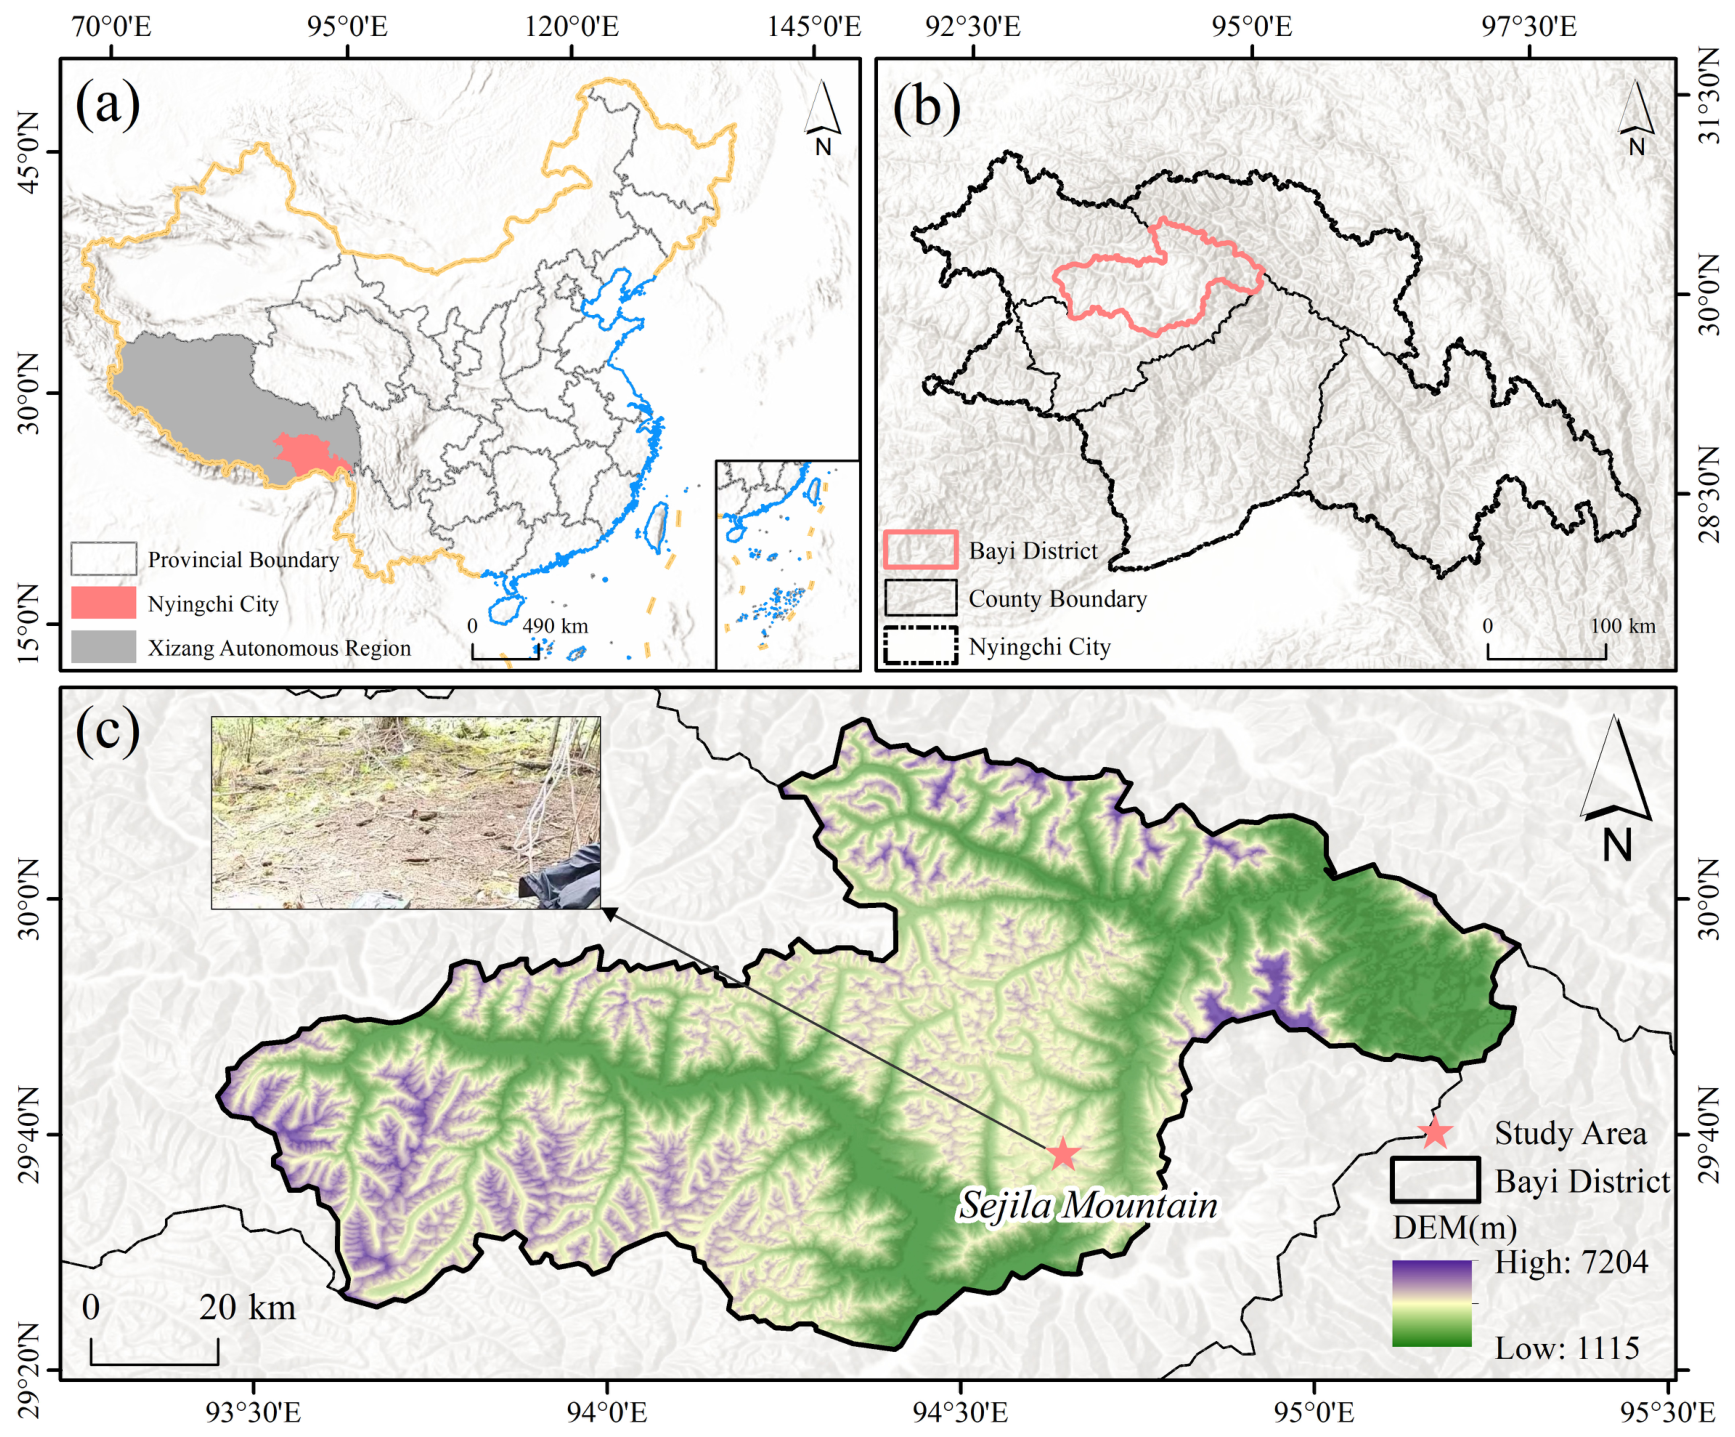
The experiment was conducted at the Sejila Mountain Forest Ecosystem National Long-Term Observation and Research Station in Nyingchi, Xizang Autonomous Region, China (29°39′ N, 94°43′ E; 3850 m a.s.l.). The study area has an alpine temperate semi-humid climate, with a long-term mean annual temperature of −0.73 °C and a long-term mean annual precipitation of 1134 mm, approximately 85% of which occurs from June to September. Annual precipitation varied among years during the treatment and observation period from 2019 to 2024, with the lowest annual precipitation occurring in 2022 and the highest in 2023 (Figure S4). The soil is classified as Fluvic Cambisol with a sandy clay loam texture comprising 69% sand, 0.40% silt, and 30.80% clay. The forest was dominated by Abies georgei var. smithii, with an average canopy height of 28.20 m and a mean diameter at breast height of 43.90 cm. The experimental plots were established within the same forest stand at comparable slope positions, and areas with obvious canopy gaps, large fallen logs, recent disturbance, or atypical ground vegetation were avoided during plot establishment. The geographic location and general topographic setting of the study area are shown in Figure 1.
Figure 1.
Geographic location and topographic characteristics of the study site. (a) Location of Nyingchi City in China; (b) location of Bayi District within Nyingchi City; and (c) digital elevation model (DEM) of the Sejila Mountain region showing the study site. The red star indicates the study site, and the inset photograph shows the field conditions at the experimental site.
The N-addition experiment was established in June 2019 using a completely randomized design. Twelve 20 m × 20 m plots were established within a relatively homogeneous alpine coniferous forest stand, and the four N-addition treatments were randomly assigned among the plots, with three independent plots per treatment (n = 3). Adjacent plots were separated by at least 25 m to reduce edge effects and treatment interference. A schematic layout of the N-addition experiment is provided in Figure S1 of the Supplementary Materials. Four N-addition levels were applied: N0, N1, N2, and N3, corresponding to 0, 10, 15, and 20 kg N ha−1 yr−1, respectively. From 2019 through 2023, nitrogen was supplied once annually in mid-August as ammonium sulfate (NH4)2SO4 (Sinopharm Chemical Reagent Co., Ltd., Shanghai, China), resulting in five applications before soil sampling. For each application, 1.89, 2.83, and 3.77 kg of (NH4)2SO4 were dissolved in 16 L of water and applied to each N1, N2, and N3 plot, respectively. N0 plots received the same amount of water.
In August 2024, approximately one year after the fifth N application and before the scheduled 2024 application, surface litter and debris were removed, and five mineral-soil cores (0–10 cm depth; 5 cm diameter) were collected from each 20 m × 20 m plot using a five-point sampling scheme. The five cores were composited into one plot-level sample, immediately placed on ice, transported to the laboratory, and sieved through a 2 mm mesh. Each sample was then divided into subsamples for soil physicochemical analyses, microbial biomass determination, enzyme activity assays, and CUE-related measurements.
2.2. Partitioning and Measurement of Soil Respiration Components
Soil respiration was partitioned using paired untrenched and trenched root-exclusion subplots (Figure S2) [32,33]. Within each 20 m × 20 m main plot, one 1 m × 1 m untrenched subplot was used to measure total soil respiration (Rs), and one 1 m × 1 m trenched subplot was used to operationally represent heterotrophic respiration under root-exclusion conditions (Rh). One PVC collar was installed in each subplot, resulting in 12 Rs collars and 12 Rh collars across the 12 independent plots. Root exclusion was established in June 2019 by inserting PVC plates to a depth of 60 cm around a 50 cm × 50 cm soil area. This depth exceeded the principal rooting zone previously reported for Abies georgei var. smithii in the Sejila Mountains [34]. Following a three-year equilibration period intended to reduce the contribution of decomposing severed roots, estimated autotrophic respiration was calculated for each paired observation as estimated Ra = Rs − Rh [35]. Autotrophic respiration was therefore not measured independently, and estimated Ra may incorporate uncertainties associated with both flux measurements and potential trenching effects. Soil respiration components were measured during the growing seasons in June, August, and October of 2022, 2023, and 2024, resulting in nine sampling campaigns in total. During each campaign, CO2 efflux was measured once from each of the 24 collars using a portable LI-8100 automated soil CO2 flux system (LI-COR Biosciences, Lincoln, NE, USA), yielding 12 paired plot-level Rs and Rh measurements per campaign. Across the full observation period, 216 collar-level CO2 efflux measurements were obtained, corresponding to 108 paired plot-level Rs–Rh observations. Measurements were conducted consistently between 9:00 and 11:30 a.m. For each measurement, the chamber was placed over the pre-installed soil collar to ensure an airtight seal. Once the CO2 concentration inside the chamber had stabilized, efflux was recorded continuously. To avoid potential interference from transient moisture effects, measurements were excluded during rainfall events and within 48 h following heavy precipitation.
2.3. Determination of Soil Physicochemical Properties and Microbial Biomass
Soil pH was measured in a 1:2.50 (w/v) soil-to-water suspension using a glass-electrode pH meter (Mettler Toledo, Greifensee, Switzerland). Soil bulk density (BD) was determined using the core method. Soil organic carbon (SOC) was determined by potassium dichromate (all general chemicals and reagents used in this study were of analytical grade and purchased fromSinopharm Chemical Reagent Co., Ltd., Shanghai, China) oxidation–titration, total N by semi-micro Kjeldahl digestion, and total P by H2SO4–HClO4 digestion followed by molybdenum–antimony colorimetry. Available phosphorus (AP) was extracted with 0.50 M NaHCO3 (pH 8.50) and determined using the molybdenum blue method.
Microbial biomass carbon (MBC), nitrogen (MBN), and phosphorus (MBP) were determined using the chloroform fumigation–extraction method. MBC and MBN were calculated from the differences between fumigated and non-fumigated 0.50 M K2SO4 extracts using extraction coefficients of 0.45 and 0.54, respectively [36,37]. MBP was determined using 0.50 M NaHCO3 extracts (pH 8.50) and an extraction coefficient of 0.40 [38]. Dissolved organic carbon (DOC) and nitrogen (DON) were determined from the non-fumigated K2SO4 extracts using a TOC/TN analyzer (Multi N/C 3100, Analytik Jena, Jena, Germany). The corresponding calculation equations are provided in the Supplementary Materials.
2.4. Determination of Soil Extracellular Enzyme Activities, Ecoenzymatic Stoichiometry, and Microbial CUE
The potential activities of seven soil extracellular enzymes were determined using a fluorometric microplate assay [39,40]. The C-acquiring enzymes included α-1,4-glucosidase (AG), β-1,4-glucosidase (BG), cellobiohydrolase (CB), and β-1,4-xylosidase (BX); the N-acquiring enzymes included leucine aminopeptidase (LAP) and β-1,4-N-acetylglucosaminidase (NAG); and the P-acquiring enzyme was acid phosphatase (ACP). Fresh soil (1.00 g) was homogenized in 100 mL of 50 mM sodium acetate buffer, with the buffer pH adjusted to match that of each soil sample. The mean buffer pH values were 5.02, 4.15, 4.60, and 4.43 for N0, N1, N2, and N3, respectively. Fluorogenic substrates linked to 4-methylumbelliferone (Sigma-Aldrich, St. Louis, MO, USA) were used, except for LAP, for which 7-amino-4-methylcoumarin (Sigma-Aldrich, St. Louis, MO, USA) was used. Fluorescence was measured at 365 nm excitation and 450 nm emission using a Synergy H4 microplate reader (BioTek Instruments, Winooski, VT, USA), and enzyme activities were expressed as nmol g−1 dry soil h−1. Ecoenzymatic C:N, C:P, and N:P ratios, vector length and angle [41], and estimated microbial CUE [42] were subsequently calculated; the corresponding equations are provided in the Supplementary Materials.
2.5. Statistical Analysis
Analyses were conducted in SPSS Statistics 26.0 (IBM Corp., Armonk, NY, USA) and R 4.2.2 (R Foundation for Statistical Computing, Vienna, Austria). Normality and variance homogeneity were assessed using Shapiro–Wilk and Levene’s tests, respectively. The plot was the experimental unit (n = 3 per treatment); because pretreatment measurements were unavailable, analyses tested post-treatment contrasts. Treatment effects on soil properties, enzyme activities, ecoenzymatic indices, and microbial CUE were examined by one-way ANOVA with Tukey’s HSD. Repeated-measures ANOVA examined the effects of N treatment, sampling time, and their interaction on Rs, root-exclusion Rh, and estimated Ra, with plot as the repeated unit. Pearson correlations assessed relationships with soil and microbial variables. Random forests were fitted separately for each respiration component, with variable importance tested using rfPermute package (version [2.5.1]) (1000 permutations; 500 trees). Separate PLS-PM analyses evaluated direct and indirect associations with N treatment and soil and microbial parameters. For correlation, random forest, and PLS-PM analyses, mean respiration across nine campaigns was matched with soil measurements from August 2024. PLS-PM performance was assessed using the goodness-of-fit index and 1000 bootstrap resamples. Statistical significance was set at p < 0.05.
3. Results
3.1. Post-Treatment Differences in Surface Mineral Soil Physicochemical Properties Among N-Addition Treatments
Post-treatment SOC and total N differed significantly among treatments. Both variables were significantly higher under N1 and N2 than under N0, whereas N3 did not differ significantly from N0 (Table 1). The highest values occurred under N1, where SOC and total N were 65% and 56% higher than under N0, respectively. Soil bulk density was significantly higher under N3 than under N0 and N2, whereas N1 showed an intermediate value (Table 1). DOC concentrations were also higher in the N-addition plots, particularly under N1 and N3, where they were 107% and 87% higher than under N0, respectively. In contrast, total P and AP were 23.40%–31.90% and 61%–64% lower, respectively, in the N-addition plots than in N0. Accordingly, the C:P and N:P ratios were higher under N addition, with the largest post-treatment differences observed under N1 (136% and 123%, respectively). These percentages describe post-treatment differences relative to N0 and do not represent within-plot changes from measured pretreatment conditions. To facilitate visual comparison among treatments, these relative post-treatment differences are presented as a heatmap in Figure S3.
Table 1.
Post-treatment soil physicochemical properties, elemental stoichiometry, and dissolved organic C and N concentrations in the 0–10 cm mineral soil under different N-addition treatments.
3.2. Temporal and Treatment-Associated Variation in Soil Respiration Components
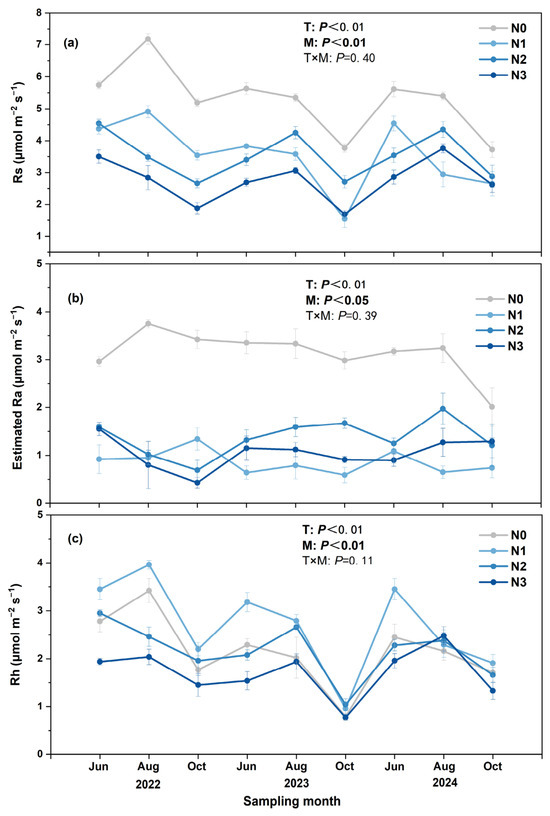
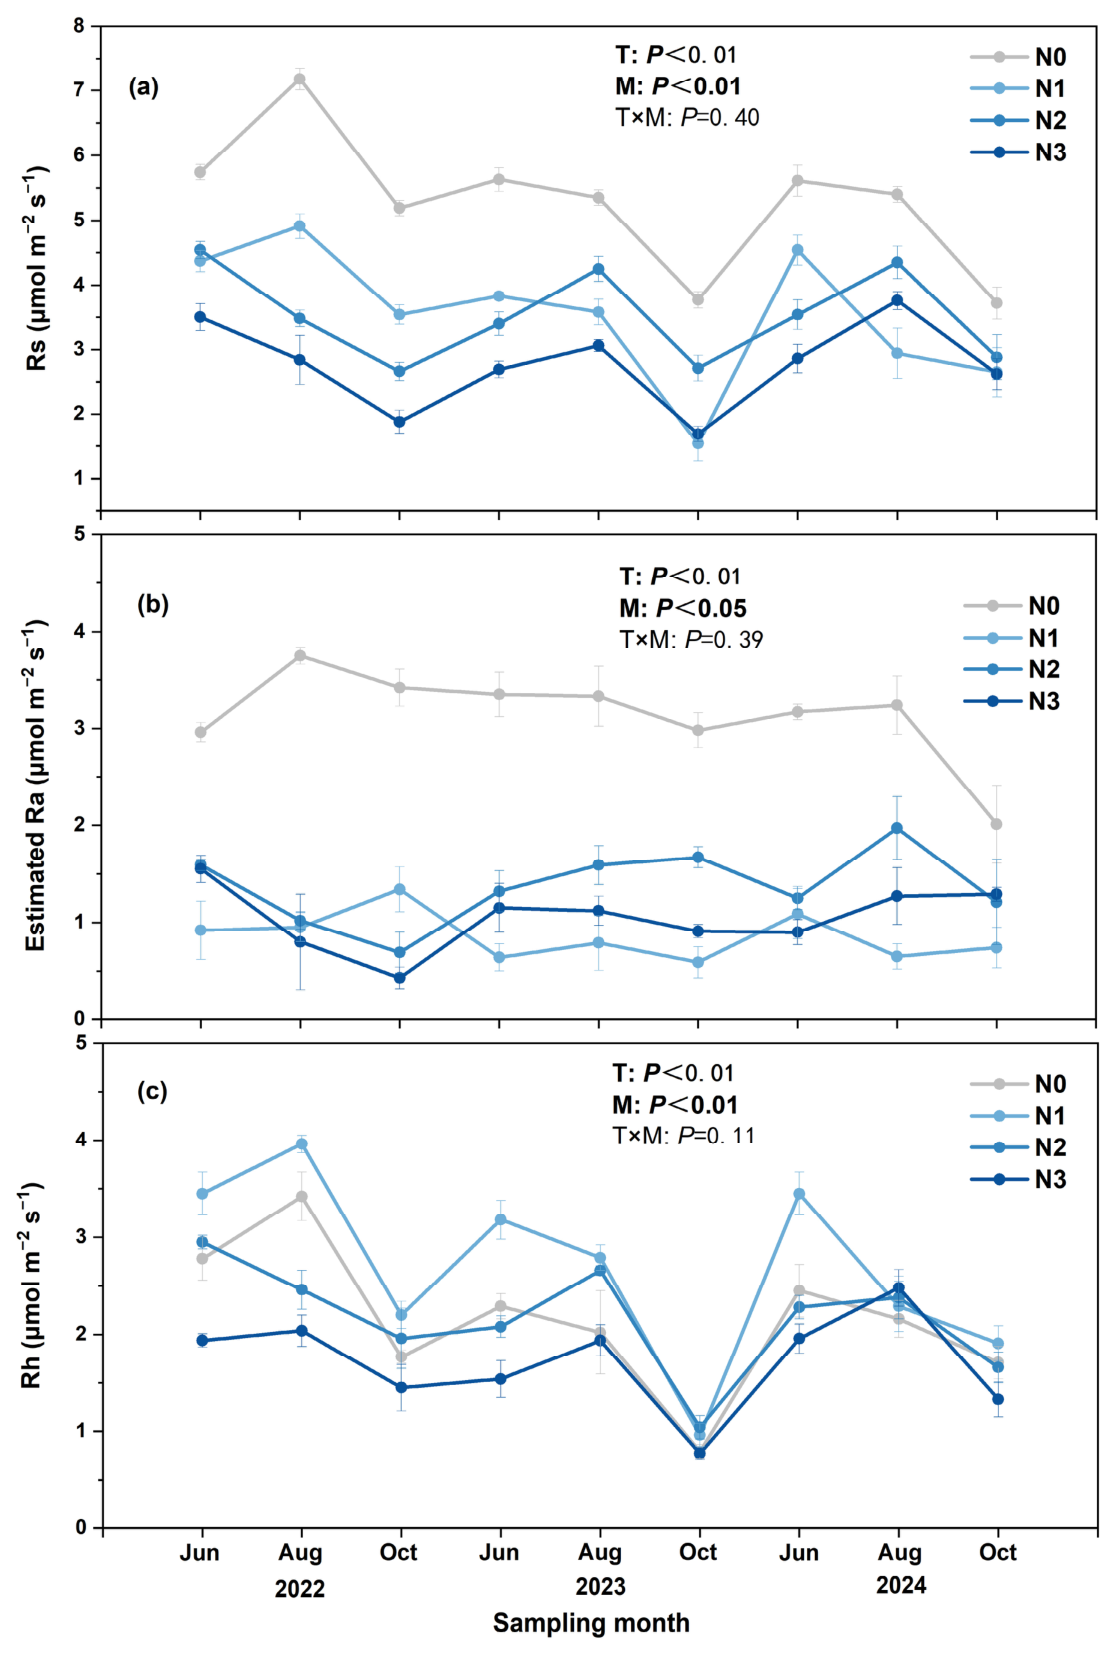
Measured Rs and Rh and estimated Ra exhibited pronounced temporal variation across the nine sampling campaigns conducted in June, August, and October of 2022, 2023, and 2024 (Figure 2). Repeated-measures ANOVA detected significant differences among N treatments on Rs, estimated Ra, and Rh (p < 0.01). Notably, both Rs and Rh were markedly lower in October 2023 than during the other sampling campaigns, and this temporal pattern occurred broadly across the N-addition treatments. Significant sampling-time effects were also detected for Rs (p < 0.01), estimated Ra (p < 0.05), and Rh (p < 0.01), whereas the sampling time × N treatment interaction was not significant for any respiration component. Across the observation period, Rs was generally lower in the N-addition treatments than in N0 (Figure 2a). Relative to N0, Rs was 19.12%–59%, 19.39%–52%, and 29.57%–64% lower under N1, N2, and N3, respectively. Estimated Ra, obtained by residual partitioning, showed a larger and more consistent negative treatment contrast than root-exclusion Rh (Figure 2b). Relative to N0, estimated Ra was 61%–81%, 39.30%–80%, and 35.93%–87% lower under N1, N2, and N3, respectively. By contrast, Rh measured under root-exclusion conditions showed more variable treatment-associated differences (Figure 2c). Rh under N1 was 6.18%–41.20% higher than that under N0, whereas the relative differences under N2 and N3 ranged from −28.24% to 32.07% and from −40.51% to 15.15%, respectively.
Figure 2.
Temporal variation in (a) total soil respiration (Rs), (b) estimated autotrophic respiration (Ra), and (c) root-exclusion heterotrophic respiration (Rh) across nine sampling campaigns under five-year nitrogen addition. Values are means ± SE (n = 3). T, nitrogen-addition treatment; M, sampling time; T × M, their interaction. p values are from repeated-measures ANOVA.
3.3. Effects of N Addition on Extracellular Enzyme Activities
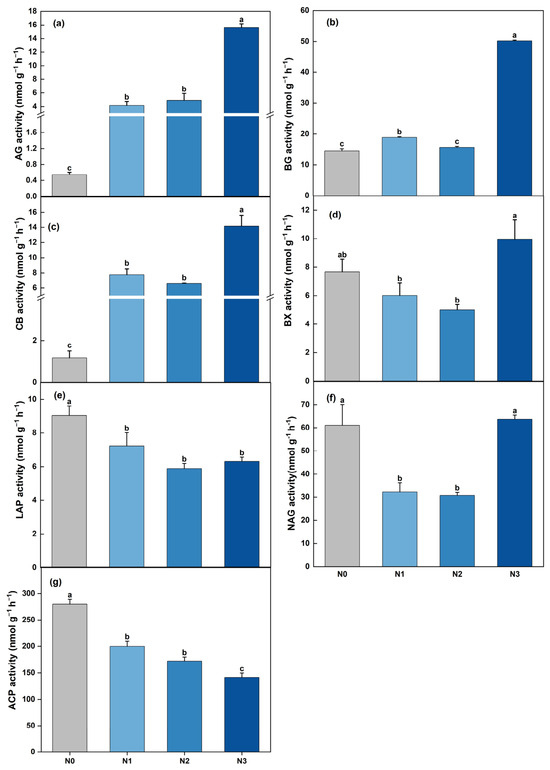
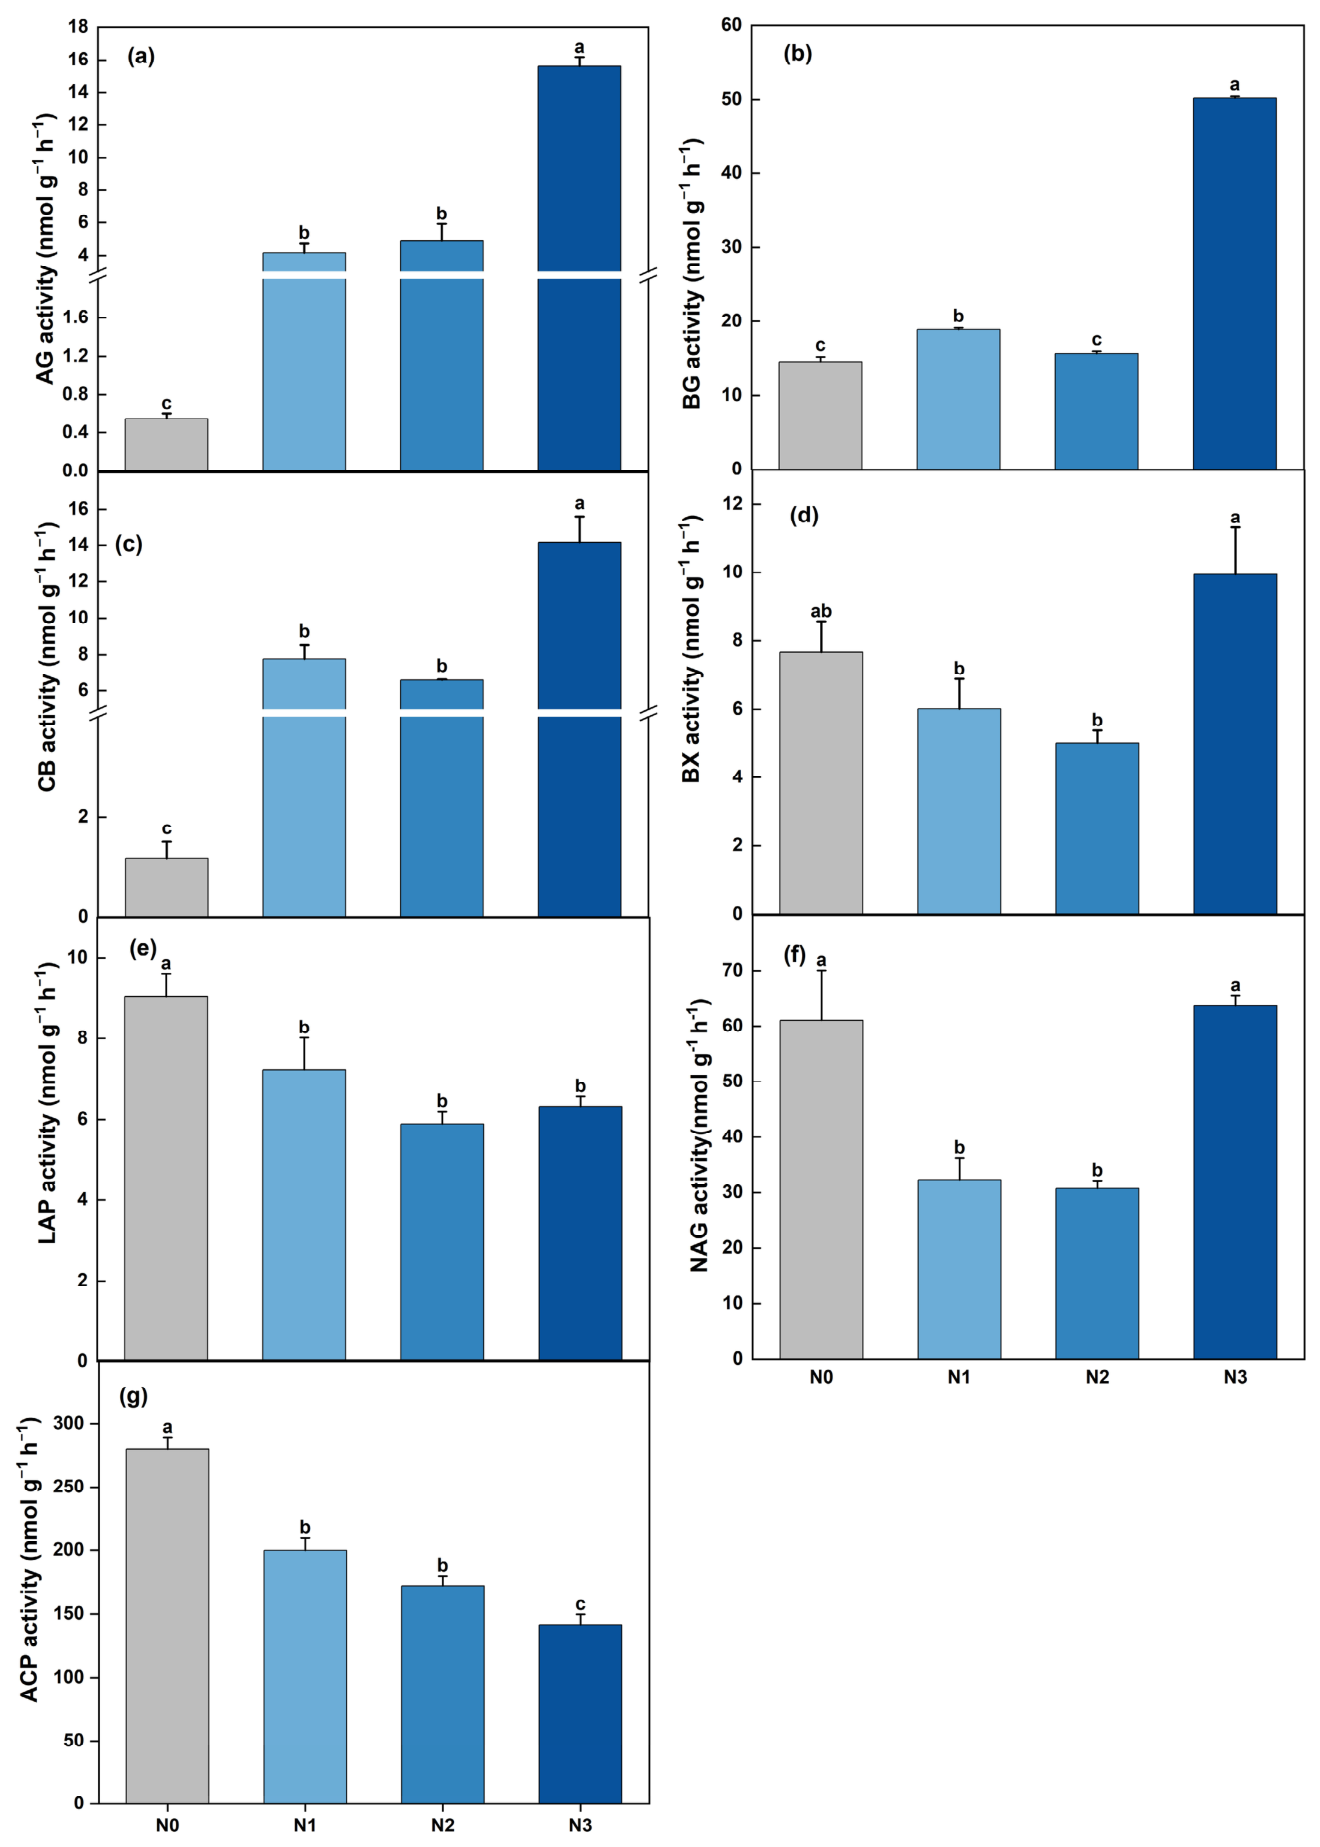
Nitrogen addition significantly affected soil extracellular enzyme activities, and the responses differed among enzyme functional groups (Figure 3). Overall, N addition increased the activities of C-acquiring enzymes, particularly AG, CB, and BG. Compared with N0, AG and CB activities increased across all N-addition treatments, with increases of 656%–2733% and 462%–1110%, respectively. Both enzymes reached their highest activities under N3. BG activity also increased significantly under N3, by 245% relative to N0. In contrast, BX activity decreased slightly under N1 and N2 but increased by 29.60% under N3. The responses of N- and P-acquiring enzymes differed from those of C-acquiring enzymes. LAP activity decreased by 20.00%–34.80% under all N-addition treatments. NAG activity decreased by 47.00%–49.70% under N1 and N2 but remained comparable to the control under N3. The P-acquiring enzyme ACP showed a consistent decline with increasing N addition, decreasing by 28.50%, 38.30%, and 49.40% under N1, N2, and N3, respectively.
Figure 3.
Soil extracellular enzyme activities under five-year nitrogen addition. Panels show (a) AG, (b) BG, (c) CB, (d) BX, (e) LAP, (f) NAG, and (g) ACP. Different lowercase letters indicate significant differences among treatments at p < 0.05. AG, α-glucosidase; BG, β-1,4-glucosidase; CB, cellobiohydrolase; BX, β-xylosidase; LAP, leucine aminopeptidase; NAG, β-1,4-N-acetylglucosaminidase; ACP, acid phosphatase. Values are means ± SE (n = 3).
3.4. Effects of N Addition on Ecoenzymatic Stoichiometry and CUE
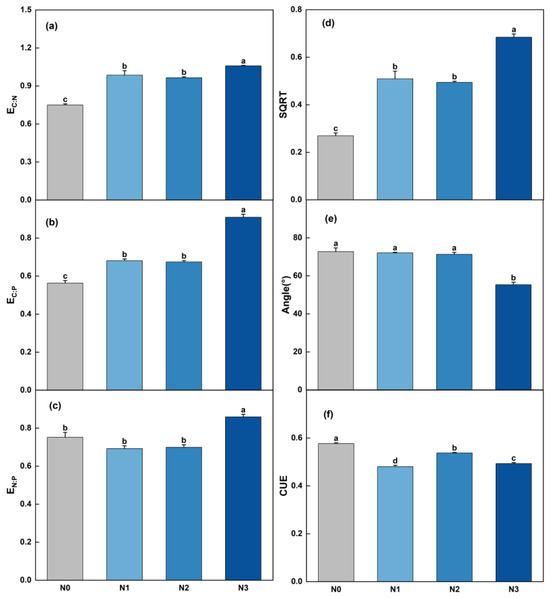
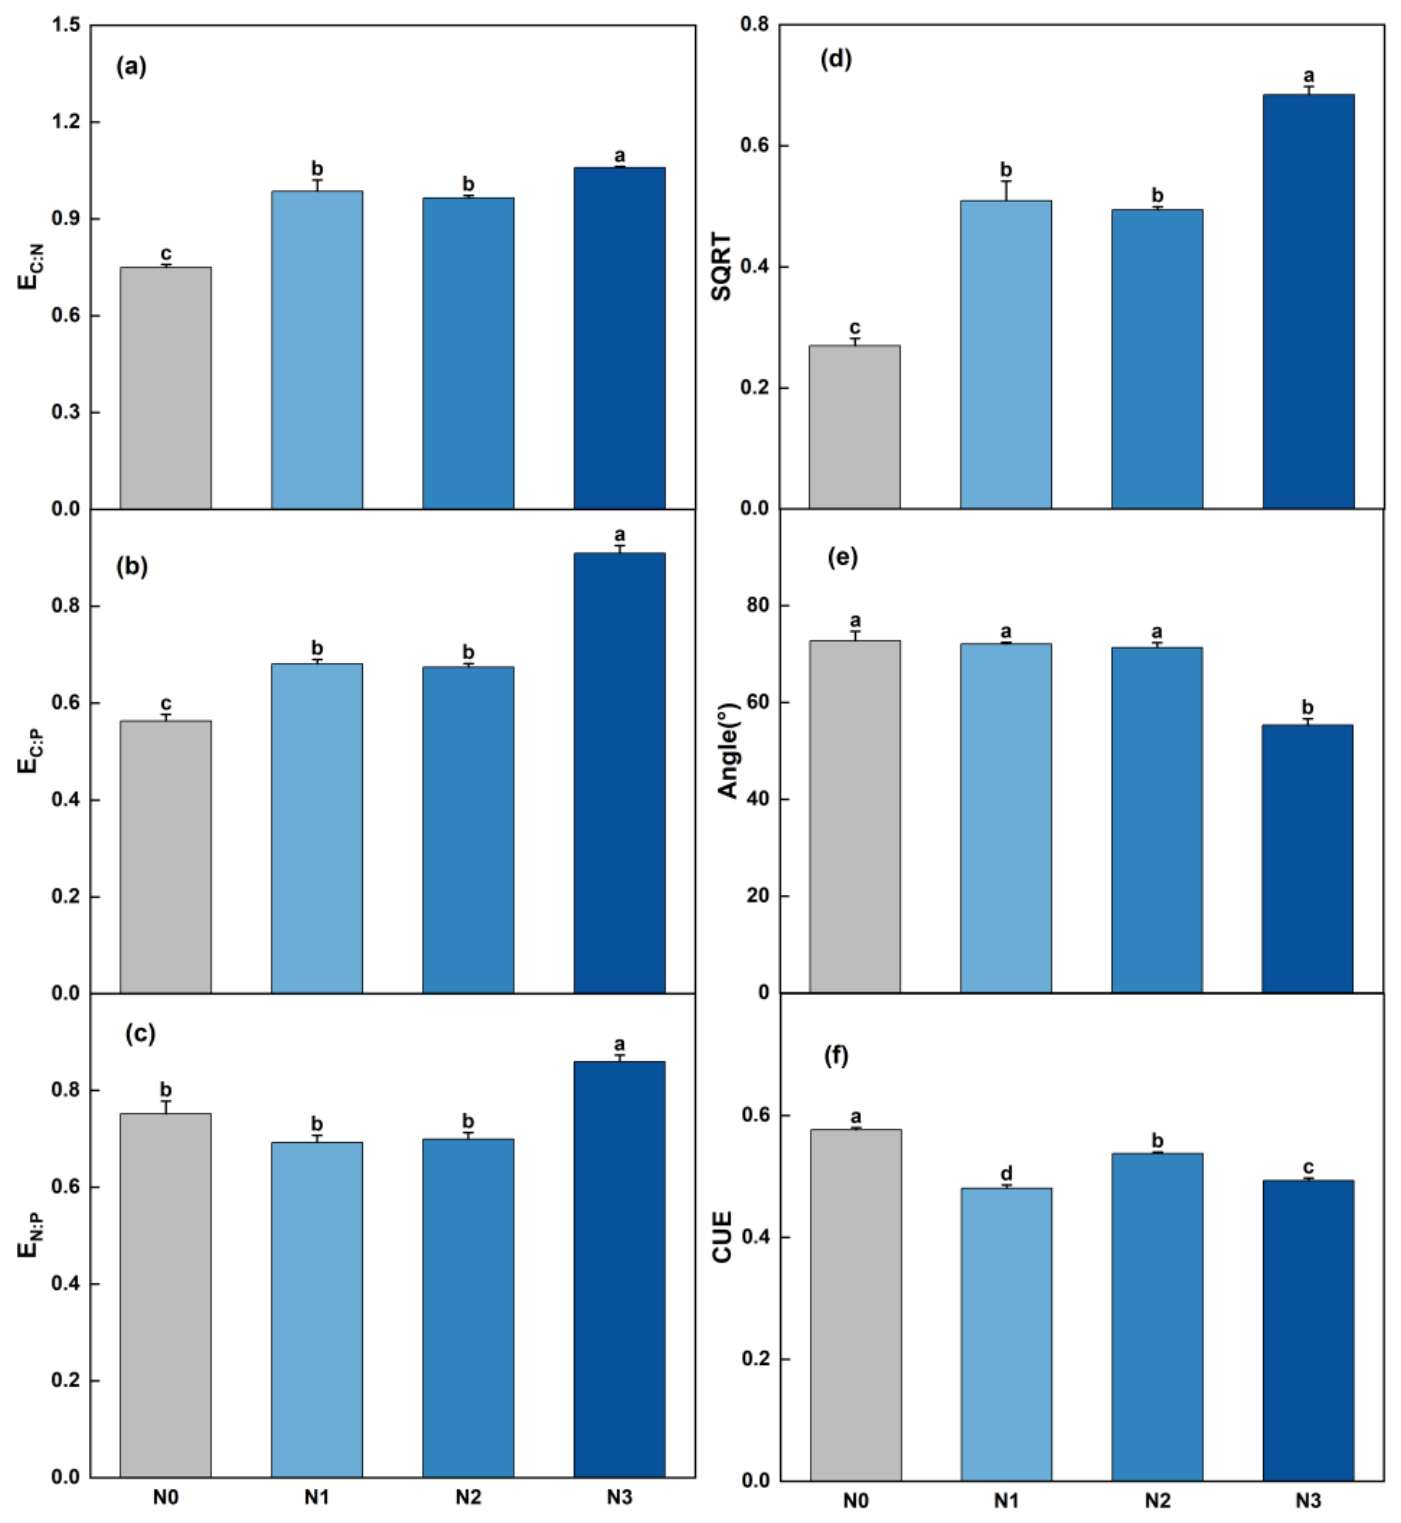
N addition significantly altered soil ecoenzymatic stoichiometry and CUE (Figure 4). Compared with the control (N0), N addition significantly increased the enzymatic C:N (EC:N) and C:P (EC:P) ratios, both of which reached their highest values under N3, with increases of 41.20% and 61%, respectively. The enzymatic N:P ratio decreased slightly under N1 and N2 by 6.90%–7.80% but increased by 14.20% under N3. Vector analysis showed that vector length increased under all N addition treatments, by 89%, 84%, and 154% under N1, N2, and N3, respectively, relative to N0. In contrast, vector angle remained relatively stable under N1 and N2 but decreased by 23.90% under N3. Microbial CUE showed a consistent negative response to N addition. Compared with N0, CUE decreased by 16.60%, 6.70%, and 14.40% under N1, N2, and N3, respectively, with the lowest value observed under N1.
Figure 4.
Soil ecoenzymatic stoichiometry, vector properties, and microbial carbon use efficiency under five-year nitrogen addition. Panels show (a) ecoenzymatic C:N ratio, (b) ecoenzymatic C:P ratio, (c) ecoenzymatic N:P ratio, (d) vector length, (e) vector angle, and (f) estimated microbial carbon use efficiency (CUE). Different lowercase letters indicate significant differences among treatments at p < 0.05. Values are means ± SE (n = 3).
3.5. Potential Factors Associated with Mean Soil Respiration Components
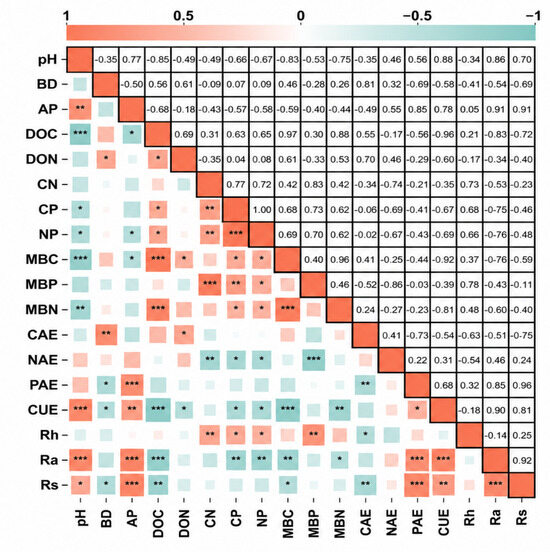
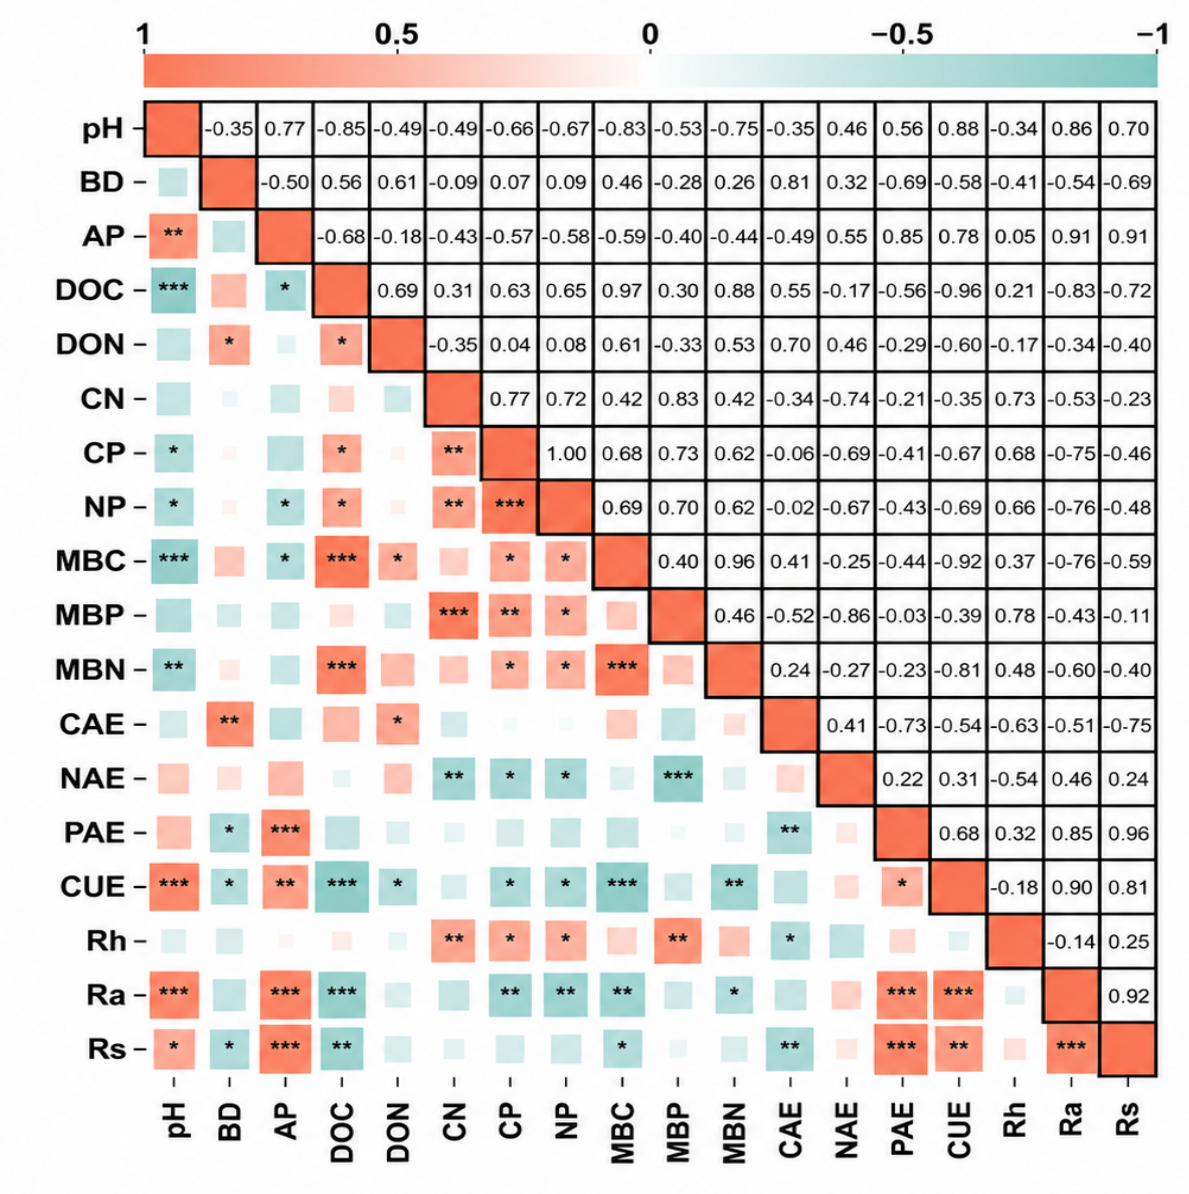
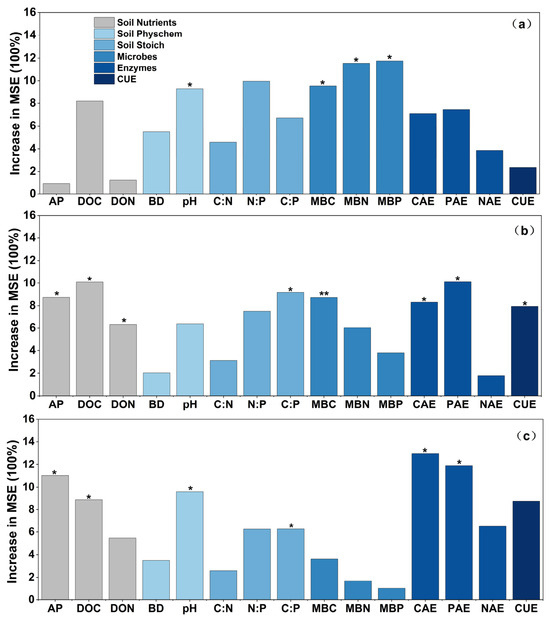
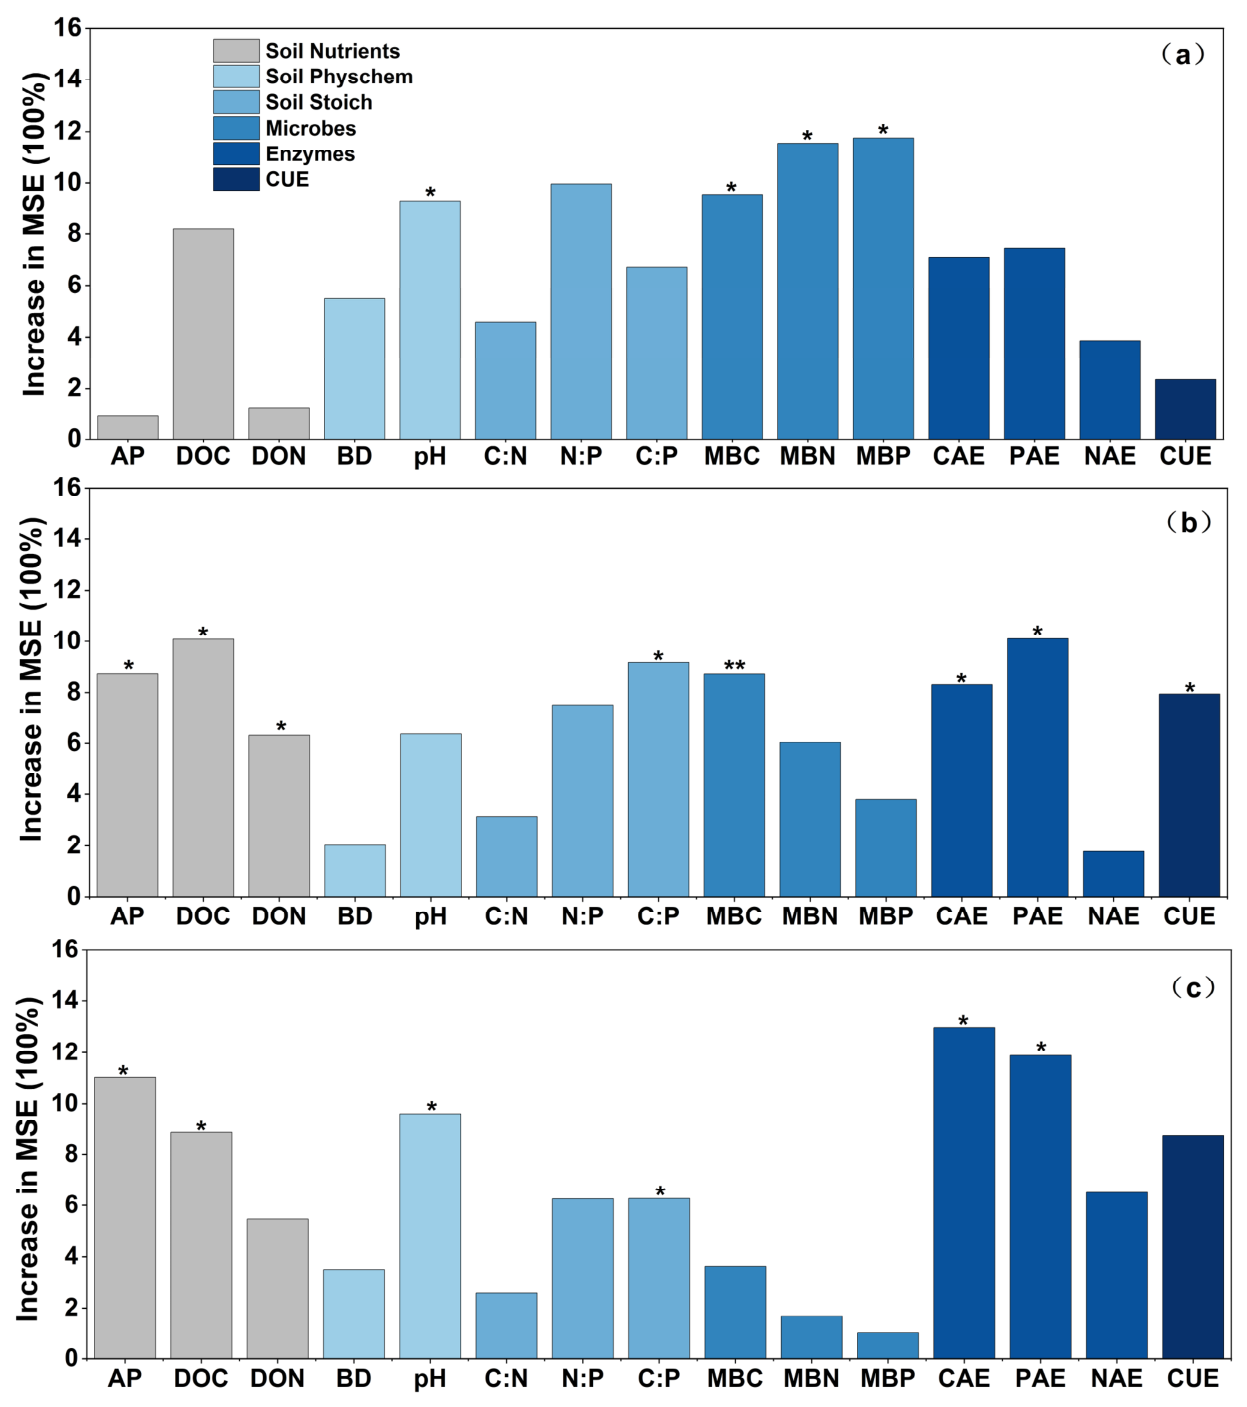
Correlation analysis revealed contrasting covariation patterns among Rs, root-exclusion Rh, and estimated Ra (Figure 5). Estimated Ra showed a close correspondence with Rs. However, because estimated Ra was calculated as Rs − Rh, this correspondence was partly mathematically expected and should not be interpreted as independent evidence that the two variables were controlled by the same biological processes. Estimated Ra and Rs were generally positively correlated with pH, AP, P-acquiring enzyme activity, and CUE but negatively correlated with DOC and several microbial biomass-related variables. By contrast, root-exclusion Rh showed a different covariation pattern and was more closely associated with soil stoichiometric and microbial variables. Random forest analysis produced different predictor-importance rankings for Rh, estimated Ra, and Rs (Figure 6). For Rh, MBP, MBN, MBC, pH, and DOC ranked among the more important predictors (Figure 6a). For estimated Ra, PAE, DOC, C:P, AP, CAE, and MBC showed relatively high predictive importance (Figure 6b). For Rs, CAE, PAE, AP, pH, DOC, and CUE ranked relatively highly (Figure 6c). Because the models were based on 12 independent plot-level mean observations, these importance rankings should be regarded as exploratory statistical patterns rather than evidence of direct biological regulation.
Figure 5.
Pearson correlation matrix for soil physicochemical properties, microbial biomass, extracellular enzyme activities, microbial carbon use efficiency, and plot-level mean soil respiration components. Asterisks denote significance at p < 0.05 (*), p < 0.01 (**), and p < 0.001 (***). The size and color intensity of the boxes represent the magnitude of the correlation coefficients.
Figure 6.
Exploratory random forest importance rankings for variables associated with (a) root-exclusion Rh, (b) estimated Ra, and (c) Rs, based on plot-level mean respiration values. Asterisks indicate significance levels: * p < 0.05, ** p < 0.01. Ra represents estimated autotrophic respiration calculated as Rs − Rh. Predictor importance indicates statistical contribution to model prediction and should not be interpreted as evidence of direct causal regulation.
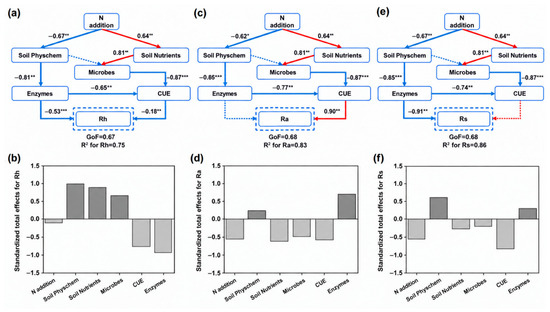
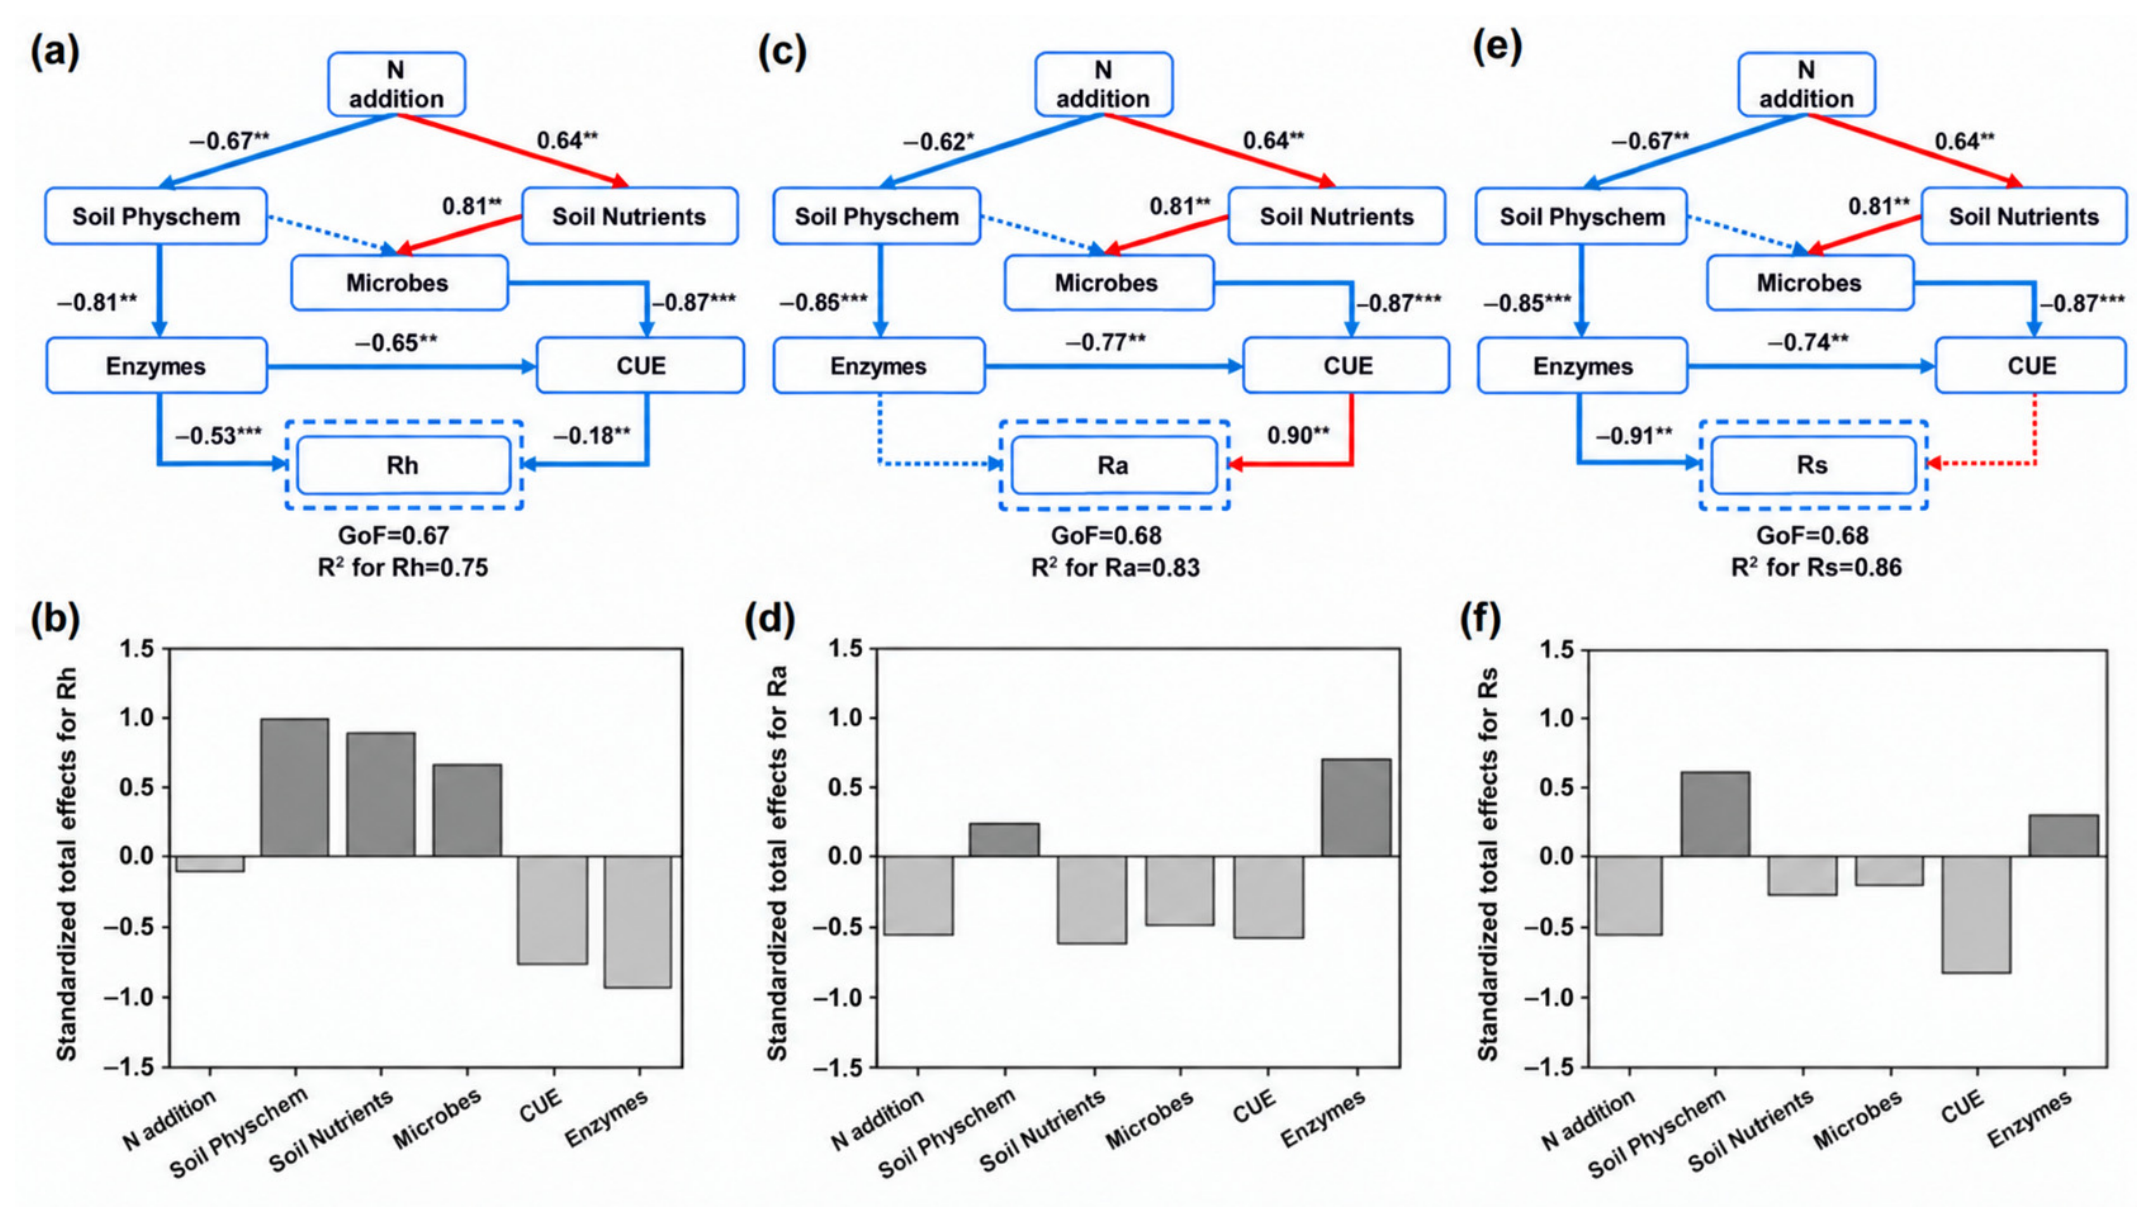
Exploratory PLS-PM analyses further identified component-specific statistical association structures among N addition, soil variables, and the mean respiration variables (Figure 7). The models returned R2 values of 0.75, 0.83, and 0.86 for Rh, estimated Ra, and Rs, respectively. In the Rh model, soil physicochemical properties, soil nutrients, and microbial variables showed positive standardized total associations, whereas enzymes and CUE showed negative standardized total associations (Figure 7a,b). In the estimated Ra model, N addition showed a negative standardized total association, whereas enzymes showed the strongest positive standardized total association (Figure 7c,d). In the Rs model, N addition and CUE showed negative standardized total associations, whereas soil physicochemical properties and enzymes showed positive standardized total associations (Figure 7e,f). Overall, the internal predictor structures differed among the three models: Rh showed stronger associations with microbial biomass-related variables, whereas estimated Ra and Rs showed stronger associations with physicochemical, nutrient, enzymatic, and CUE-related variables. However, because estimated Ra was derived mathematically from Rs and Rh, its modeled associations do not constitute independent physiological evidence concerning root processes. In the absence of direct measurements of root biomass, root production, root exudation, mycorrhizal traits, or root-specific respiration, the PLS-PM paths should be interpreted as exploratory statistical associations rather than causal mechanisms.
Figure 7.
Exploratory partial least squares path models and standardized total effects for root-exclusion Rh (a,b), estimated Ra (c,d), and Rs (e,f). Solid red and blue arrows indicate significant positive and negative associations, respectively, whereas dashed arrows indicate nonsignificant paths. Numbers beside arrows are standardized path coefficients; asterisks indicate significance levels: * p < 0.05, ** p < 0.01, and *** p < 0.001. Paths involving estimated Ra represent statistical associations rather than direct root physiological regulation. The dark grey and light grey bars represent positive and negative effects, respectively.
4. Discussion
4.1. Post-Treatment Soil C Status and Total Soil Respiration Under N Input
Five-year experimental N addition was associated with a non-linear reorganization of the post-treatment soil C–N–P environment rather than a simple dose-dependent response (Table 1; Figure S3). SOC and total N showed larger post-treatment differences under N1 than under N3, indicating that soil C and N status did not scale proportionally with N input. The higher post-treatment SOC in some N-addition plots is broadly consistent with evidence that repeated N enrichment can favor SOC accumulation in forest and terrestrial soils [9,43]. However, a nine-year warming and N-addition experiment on the Tibetan Plateau reported SOC loss [44], illustrating the context dependence of soil C responses. Because pretreatment measurements were unavailable, the present results represent post-treatment contrasts among randomly assigned plots rather than measured within-plot SOC accumulation. Unmeasured variation in slope and aspect, aggregate-size distribution, understory and moss cover, and bacterial and fungal community composition may also have contributed to residual among-plot variation. In addition, compositing five cores per plot prevented assessment of within-plot spatial heterogeneity, and exclusion of the forest-floor organic layer restricts inference to the sampled 0–10 cm mineral soil. Because plant biomass, litter input, fine-root production and turnover, and root exudation were not measured, the SOC and DOC patterns cannot be attributed directly to plant- or root-derived C inputs.
The lower post-treatment total P and AP, together with higher C:P and N:P ratios, indicated altered P status and stoichiometric balance in the N-addition plots. This pattern is consistent with evidence that sustained N loading can alter terrestrial P cycling [19], including in forests of the eastern Tibetan Plateau [45], while regional surveys demonstrate strong edaphic and elevational controls on soil P forms [26]. Without pretreatment P measurements, however, the observed differences do not demonstrate within-plot P depletion or absolute P limitation. Soil pH was also lower in all N-addition plots than in N0, consistent with acidification reported in N-enrichment experiments [46], although the lowest pH occurred under N1 rather than N3. Because (NH4)2SO4 was used, the pH differences may reflect both nitrification of added NH4+ and sulfate-associated processes and should be interpreted specifically as responses to repeated ammonium-sulfate enrichment.
Treatment duration further limits interpretation. Although repeated annual N inputs can progressively modify soil acidity, nutrient availability [18,19], microbial allocation [15,17], and soil C cycling [43], soil physicochemical and microbial variables were measured only once, in August 2024, after five annual applications. The dataset therefore cannot resolve when the observed differences developed or whether the ecosystem approached a steady state. Moreover, once-annual (NH4)2SO4 application represented a seasonal nutrient pulse rather than the continuous timing and mixed chemical composition of natural atmospheric N deposition. Continued measurements are needed to determine whether the observed patterns persist under longer treatment durations. Across the nine respiration campaigns, Rs was generally lower under N addition than under N0 (Figure 2). Accordingly, Hypothesis 1 was partially supported: lower Rs co-occurred with higher post-treatment SOC in some N-addition plots and with lower soil pH and AP. However, the non-linear SOC response and absence of pretreatment measurements preclude interpreting these contrasts as directly measured within-plot SOC accumulation.
4.2. Respiration Partitioning and Microbial Resource Acquisition Under N Input
Across the nine sampling campaigns, Rs was generally lower in the N-addition treatments than in N0, and this contrast was more strongly reflected in estimated Ra than in root-exclusion Rh (Figure 2). Because estimated Ra was calculated as Rs − Rh, this pattern represents residual respiration partitioning and does not independently demonstrate reduced root respiration or root physiological activity. Root biomass, fine-root production and turnover, root exudation, mycorrhizal traits, and root-specific respiration were not measured; therefore, the estimated Ra pattern cannot be attributed to a specific root-mediated mechanism. In addition, because Rh was operationally represented by CO2 efflux from trenched root-exclusion subplots, possible trenching-induced changes in water, nutrients, and soluble-substrate movement may have propagated into estimated Ra. Root-exclusion Rh showed more variable contrasts among N treatments than estimated Ra. Rh under N1 was higher than that under N0 during some campaigns, whereas responses under N2 and N3 varied in direction (Figure 2c). The coexistence of higher DOC or microbial biomass with higher Rh under some conditions is consistent with a potential association between substrate availability, microbial properties, and heterotrophic respiration [21], but it does not establish causation. These component-specific respiration responses occurred alongside a redistribution of microbial extracellular enzyme investment rather than uniform stimulation of enzyme activity. Consistent with microbial resource allocation theory [15,17], the contrasting responses of N- and C-acquiring enzymes suggest reduced investment in N acquisition under increased external N supply and greater investment in the acquisition of selected C substrates [16]. The heterogeneous responses among C-acquiring enzymes further indicate substrate-specific allocation.
The increase in selected C-acquiring enzymes despite higher post-treatment SOC suggests that bulk SOC did not necessarily alleviate microbial demand for accessible C. Together with higher ecoenzymatic C:N and C:P ratios, these responses indicate greater enzymatic investment in C acquisition under altered nutrient stoichiometry [47]. The decline in ACP despite lower AP further suggests that enzyme allocation was not controlled by P availability alone. The opposing responses of ACP and selected C-acquiring enzymes may instead reflect interacting effects of altered microbial resource allocation and soil pH rather than P availability alone [47,48]. Because enzyme assays used buffers adjusted to sample-specific soil pH [49], treatment differences may reflect combined effects of enzyme production, stabilization, and pH-dependent catalytic activity [50]. The ACP response should therefore not be interpreted as direct evidence of reduced microbial P demand.
Accordingly, Hypothesis 2 was supported at the level of the residual respiration-partitioning pattern: lower Rs was more strongly reflected in estimated Ra, whereas measured Rh varied among treatments and sampling campaigns. Because estimated Ra was derived as Rs − Rh and direct root variables were not measured, this result does not independently demonstrate suppression of root respiration.
4.3. Microbial CUE and Component-Specific Respiration Covariation
Estimated microbial CUE was 6.70%–16.60% lower in the N-addition treatments than in N0, with the largest difference observed under N1 (Figure 4f). This non-linear response indicates that estimated microbial C allocation efficiency did not vary proportionally with the N-addition rate. Moreover, the differences in estimated CUE were less pronounced than those in selected C-acquiring enzyme activities, suggesting that extracellular enzyme allocation was more responsive to N addition than estimated CUE. Microbial CUE responses to N enrichment are not consistent across ecosystems. For example, an N-addition experiment in a subtropical forest reported increased microbial CUE and identified particulate organic C availability as an important correlate of that response [51]. The contrast with the present results suggests that CUE responses may depend on ecosystem type, substrate accessibility, nutrient status, and environmental conditions. In the present study, the lower soil pH under N addition may have increased microbial maintenance costs associated with intracellular pH homeostasis [52], whereas the higher activities of selected C-acquiring enzymes suggest greater microbial investment in extracellular C acquisition.
The lower AP and higher soil C:P and N:P ratios in the N-addition plots further indicate altered soil nutrient stoichiometry that may have constrained microbial growth. Under resource imbalance, microorganisms may allocate a greater proportion of assimilated C to extracellular resource acquisition and cellular maintenance rather than biomass production [53,54]. This interpretation is consistent with the higher ecoenzymatic C:N and C:P ratios and vector length under N addition, which indicate altered microbial resource allocation and stronger relative C demand. However, CUE was estimated using an enzyme-stoichiometric approach rather than directly measured from microbial growth and respiration [22,23]. The CUE results should therefore be interpreted as indicators of microbial C-allocation patterns associated with post-treatment soil biochemical status, rather than as direct measurements of microbial biomass-production efficiency or direct evidence of changes in root-derived respiration.
The component-specific covariation patterns provided provisional support for Hypothesis 3. Across the correlation, random forest, and PLS-PM analyses, measured Rh was more closely associated with microbial biomass and enzyme-related variables, whereas Rs and estimated Ra showed stronger associations with soil pH, AP, and related physicochemical, enzymatic, and CUE variables (Figure 5, Figure 6 and Figure 7). Nevertheless, estimated Ra was calculated as Rs − Rh, and its associations do not constitute independent evidence of root physiological regulation. In addition, soil biochemical variables were measured only in August 2024, whereas plot-level mean respiration values were calculated across nine sampling campaigns. These analyses therefore cannot establish temporal coupling between the soil variables and respiration components. Because the exploratory models contained only 12 independent plot-level observations, with three plots per treatment, their statistical power was limited and their outputs should be interpreted as candidate associations rather than causal pathways. Future experiments should determine treatment replication through an a priori power analysis based on expected effect sizes, among-plot variance, and model complexity. Accordingly, Hypothesis 3 received provisional rather than definitive support.
4.4. Temporal Variation in Soil Respiration
Measured Rs and root-exclusion Rh and estimated Ra varied significantly among the nine sampling campaigns, indicating that sampling time was an important source of variation in all three respiration components (Figure 2). However, the sampling time × N treatment interaction was not significant for any respiration component. Thus, although respiration rates varied among sampling campaigns, the relative treatment-associated patterns did not differ significantly over time. The comparatively low Rs and Rh values observed in October 2023 occurred broadly across the N-addition treatments rather than within a single treatment (Figure 2). This pattern therefore does not provide evidence of a treatment-specific response to N addition. October represents the late growing season at this high-elevation site, and annual precipitation also varied during the treatment and observation period (Figure S4). Nevertheless, annual precipitation totals cannot explain the respiration rate recorded during an individual sampling campaign. Concurrent measurements sufficient to distinguish the respective contributions of soil temperature, soil moisture, plant activity, microbial activity, and substrate availability were unavailable for October 2023. The lower respiration values during this campaign therefore cannot be attributed conclusively to a specific environmental or biological mechanism.
In addition, respiration was measured during nine discrete campaigns conducted in June, August, and October from 2022 to 2024 rather than continuously throughout each year. These observations characterize growing-season temporal variation but cannot be used to calculate annual soil CO2 efflux or determine complete seasonal trajectories. Accordingly, the October 2023 values are interpreted as sampling-time-specific variation and are not used to explain the treatment-associated differences in soil respiration.
5. Conclusions
Following five annual N applications, the N-addition plots showed clear post-treatment differences in surface mineral soil C status, nutrient availability, microbial resource allocation, and soil respiration partitioning. Relative to N0, N1 and N2 had higher post-treatment SOC and total N, whereas all N-addition treatments had lower pH, total P, and AP, with AP values 60%–64% lower. Nitrogen addition was also associated with altered extracellular enzyme allocation and 6.70%–16.60% lower estimated microbial CUE. Across the nine measurement campaigns, Rs was 19.12%–64% lower in the N-addition plots, and this difference was more strongly reflected in estimated Ra, which was 35.93%–87% lower, whereas measured Rh showed treatment-dependent responses. Exploratory multivariate analyses indicated distinct covariation patterns for measured Rh versus Rs and estimated Ra. Thus, higher post-treatment SOC under some N-addition treatments co-occurred with lower soil CO2 efflux. However, because pretreatment soil measurements and direct root observations were unavailable, these results should not be interpreted as directly measured within-plot SOC increases or as definitive evidence of the mechanisms responsible for the estimated Ra pattern. Accordingly, the first hypothesis was partially supported, the second was supported at the level of the residual respiration-partitioning pattern, and the third received provisional support from the exploratory association analyses.
Supplementary Materials
The following supporting information can be downloaded at https://www.mdpi.com/article/10.3390/f17091080/s1. Table S1: Microbial biomass carbon (MBC), nitrogen (MBN), and phosphorus (MBP) in the 0–10 cm mineral soil under different N-addition treatments. N0, N1, N2, and N3 represent N-addition rates of 0, 10, 15, and 20 kg N ha−1 yr−1, respectively; Figure S1: Schematic layout of the completely randomized N-addition experiment. Colors indicate the four N-addition treatments. The layout is schematic and not drawn to scale; Figure S2: Schematic illustration of the soil respiration-partitioning design: (a) paired untrenched and trenched root-exclusion subplots and (b) PVC root-exclusion installation; Figure S3: Relative post-treatment differences in surface mineral soil physicochemical properties between the N-addition treatments and N0 after five years of treatment. Values represent endpoint treatment contrasts and should not be interpreted as temporal changes from pretreatment conditions. SOC, soil organic carbon; AP, available phosphorus; DOC, dissolved organic carbon; DON, dissolved organic nitrogen; Figure S4: Interannual variation in annual precipitation at the study site during the treatment and observation period from 2019 to 2024.
Author Contributions
Conceptualization, S.Z. and Y.Y.; methodology, S.Z., Y.H. and Z.C.; investigation, S.Z. and Y.H.; formal analysis, S.Z.; data curation, S.Z. and Y.H.; writing—original draft preparation, S.Z.; writing—review and editing, Y.H., Z.C. and Y.Y.; supervision, Y.Y.; project administration, Y.Y.; funding acquisition, Y.Y. All authors have read and agreed to the published version of the manuscript.
Funding
This research was funded by the National Natural Science Foundation of China (grant numbers 31860141 and 31360119); the Construction Project (Phase II) of the Forestry Doctoral Program at Xizang Agriculture and Animal Husbandry University (project number 53326002); the Graduate Education Innovation Program of Xizang Agriculture and Animal Husbandry University (project numbers YJS2024-31, YJS2024-28, and YJS2024-26); the Forestry Doctoral Program (Phase I) of Xizang Agriculture and Animal Husbandry University (project number 533325001); the Seventh Batch of Flexible Talent Program of Xizang Agriculture and Animal Husbandry University (project number 53013001804); the National College Student Innovation and Entrepreneurship Training Program (project number 2024-02); the 2024 Special Funds for Central Financial Support for the Development and Reform of Local Universities under the project “Construction of Science and Technology Courtyards for Plateau-Characteristic Agriculture and Animal Husbandry and Enhancement of Comprehensive Service Capacity” (project numbers XK2024-04 and XK2024-01); and the corresponding 2025 Special Funds (project number YJSXK2025-22).
Data Availability Statement
The data supporting the findings of this study are available from the corresponding author upon reasonable request.
Acknowledgments
The data and methodological details supporting the findings of this study are available within the article and its Supplementary Materials. We thank the Key Laboratory of Forestry Ecological Engineering on the Xizang Plateau for providing laboratory facilities and technical support.
Conflicts of Interest
The authors declare no conflicts of interest.
References
- Zhu, J.; Jia, Y.; Yu, G.; Wang, Q.; He, N.; Chen, Z.; He, H.; Zhu, X.; Li, P.; Zhang, F.; et al. Changing patterns of global nitrogen deposition driven by socio-economic development. Nat. Commun. 2025, 16, 46. [Google Scholar] [CrossRef] [Scilit] [PubMed]
- Tian, H.; Bian, Z.; Shi, H.; Qin, X.; Pan, N.; Lu, C.; Pan, S.; Tubiello, F.N.; Chang, J.; Conchedda, G.; et al. History of anthropogenic nitrogen inputs (HaNi) to the terrestrial biosphere: A 5 arcmin resolution annual dataset from 1860 to 2019. Earth Syst. Sci. Data 2022, 14, 4551–4568. [Google Scholar] [CrossRef] [Scilit]
- Gong, C.; Tian, H.; Liao, H.; Pan, N.; Pan, S.; Ito, A.; Jain, A.K.; Kou-Giesbrecht, S.; Joos, F.; Sun, Q.; et al. Global net climate effects of anthropogenic reactive nitrogen. Nature 2024, 632, 557–563. [Google Scholar] [CrossRef] [Scilit] [PubMed]
- Xu, S.; Song, X.; Zeng, H.; Wang, J. Soil microbial necromass carbon in forests: A global synthesis of patterns and controlling factors. Soil Ecol. Lett. 2024, 6, 240237. [Google Scholar] [CrossRef] [Scilit]
- Pan, Y.; Birdsey, R.A.; Fang, J.; Houghton, R.; Kauppi, P.E.; Kurz, W.A.; Phillips, O.L.; Shvidenko, A.; Lewis, S.L.; Canadell, J.G.; et al. A large and persistent carbon sink in the world’s forests. Science 2011, 333, 988–993. [Google Scholar] [CrossRef] [Scilit] [PubMed]
- Tao, F.; Huang, Y.; Hungate, B.A.; Manzoni, S.; Frey, S.D.; Schmidt, M.W.I.; Reichstein, M.; Carvalhais, N.; Ciais, P.; Jiang, L.; et al. Microbial carbon use efficiency promotes global soil carbon storage. Nature 2023, 618, 981–985. [Google Scholar] [CrossRef] [Scilit] [PubMed]
- Yue, K.; Peng, Y.; Peng, C.; Yang, W.; Peng, X.; Wu, F. Stimulation of terrestrial ecosystem carbon storage by nitrogen addition: A meta-analysis. Sci. Rep. 2016, 6, 19895. [Google Scholar] [CrossRef] [Scilit] [PubMed]
- Schulte-Uebbing, L.; de Vries, W. Global-scale impacts of nitrogen deposition on tree carbon sequestration in tropical, temperate, and boreal forests: A meta-analysis. Glob. Change Biol. 2018, 24, e416–e431. [Google Scholar] [CrossRef] [Scilit] [PubMed]
- Tang, B.; Rocci, K.S.; Lehmann, A.; Rillig, M.C. Nitrogen increases soil organic carbon accrual and alters its functionality. Glob. Change Biol. 2023, 29, 1971–1983. [Google Scholar] [CrossRef] [Scilit] [PubMed]
- Schlesinger, W.H.; Andrews, J.A. Soil respiration and the global carbon cycle. Biogeochemistry 2000, 48, 7–20. [Google Scholar] [CrossRef] [Scilit]
- Chen, C.; Chen, H.Y.H. Mapping global nitrogen deposition impacts on soil respiration. Sci. Total Environ. 2023, 871, 161986. [Google Scholar] [CrossRef] [Scilit] [PubMed]
- Zhou, L.; Peng, Y.; Wang, Y.; Liu, Y.; Peng, Z. Unimodal soil respiration–nitrogen rate relationship is ubiquitous in terrestrial ecosystems. Catena 2026, 262, 109660. [Google Scholar] [CrossRef] [Scilit]
- Wang, J.; Song, B.; Ma, F.; Tian, D.; Li, Y.; Yan, T.; Quan, Q.; Zhang, F.; Li, Z.; Wang, B. Nitrogen addition reduces soil respiration but increases the relative contribution of heterotrophic component in an alpine meadow. Funct. Ecol. 2019, 33, 2239–2253. [Google Scholar] [CrossRef] [Scilit]
- Jiang, Y.; Li, W.; Gan, X.; Ye, X.; Jiang, Y.; Zhao, C. Asymmetric responses of autotrophic and heterotrophic respiration to simulated nitrogen deposition in a subalpine grassland. Appl. Soil Ecol. 2024, 199, 105393. [Google Scholar] [CrossRef] [Scilit]
- Allison, S.D.; Weintraub, M.N.; Gartner, T.B.; Waldrop, M.P. Evolutionary-economic principles as regulators of soil enzyme production and ecosystem function. In Soil Enzymology; Shukla, G., Varma, A., Eds.; Springer: Berlin/Heidelberg, Germany, 2011; Volume 22, pp. 229–243. [Google Scholar]
- Sinsabaugh, R.L.; Hill, B.H.; Follstad Shah, J.J. Ecoenzymatic stoichiometry of microbial organic nutrient acquisition in soil and sediment. Nature 2009, 462, 795–798. [Google Scholar] [CrossRef] [Scilit] [PubMed]
- Mooshammer, M.; Wanek, W.; Zechmeister-Boltenstern, S.; Richter, A. Stoichiometric imbalances between terrestrial decomposer communities and their resources: Mechanisms and implications of microbial adaptations to their resources. Front. Microbiol. 2014, 5, 22. [Google Scholar] [CrossRef] [Scilit] [PubMed]
- Lu, X.; Mao, Q.; Gilliam, F.S.; Luo, Y.; Mo, J. Nitrogen deposition contributes to soil acidification in tropical ecosystems. Glob. Change Biol. 2014, 20, 3790–3801. [Google Scholar] [CrossRef] [Scilit] [PubMed]
- Luo, M.; Moorhead, D.L.; Ochoa-Hueso, R.; Mueller, C.W.; Ying, S.C.; Chen, J. Nitrogen loading enhances phosphorus limitation in terrestrial ecosystems with implications for soil carbon cycling. Funct. Ecol. 2022, 36, 2845–2858. [Google Scholar] [CrossRef] [Scilit]
- Marklein, A.R.; Houlton, B.Z. Nitrogen inputs accelerate phosphorus cycling rates across a wide variety of terrestrial ecosystems. New Phytol. 2012, 193, 696–704. [Google Scholar] [CrossRef] [Scilit] [PubMed]
- Wu, X.; Liu, Y.; Zhang, H.; Dong, L.; Zuo, Y.; Li, X.; Wang, W. 12-year N addition enhances soil organic carbon decomposition by mediating microbial community composition in temperate plantations. Appl. Soil Ecol. 2025, 206, 105856. [Google Scholar] [CrossRef] [Scilit]
- Manzoni, S.; Taylor, P.; Richter, A.; Porporato, A.; Ågren, G.I. Environmental and stoichiometric controls on microbial carbon-use efficiency in soils. New Phytol. 2012, 196, 79–91. [Google Scholar] [CrossRef] [Scilit] [PubMed]
- Sinsabaugh, R.L.; Manzoni, S.; Moorhead, D.L.; Richter, A. Carbon use efficiency of microbial communities: Stoichiometry, methodology and modelling. Ecol. Lett. 2013, 16, 930–939. [Google Scholar] [CrossRef] [Scilit] [PubMed]
- Ren, F.; Yang, X.; Zhou, H.; Zhu, W.; Zhang, Z.; Chen, L.; Cao, G.; He, J.-S. Contrasting effects of nitrogen and phosphorus addition on soil respiration in an alpine grassland on the Qinghai-Tibetan Plateau. Sci. Rep. 2016, 6, 34786. [Google Scholar] [CrossRef] [Scilit] [PubMed]
- He, W.; Wu, F.; Yang, W.; Zhang, D.; Xu, Z.; Tan, B.; Zhao, Y.; Justine, M.F. Gap locations influence the release of carbon, nitrogen and phosphorus in two shrub foliar litter in an alpine fir forest. Sci. Rep. 2016, 6, 22014. [Google Scholar] [CrossRef] [Scilit] [PubMed]
- Cao, Z.; Liu, Z.; Li, X.; Li, C.; Zong, N.; Zhang, J.; He, N. Distribution of phosphorus forms along the altitude gradient in the soil of the Qinghai–Tibetan Plateau and the influencing factors. Agronomy 2025, 15, 2474. [Google Scholar] [CrossRef] [Scilit]
- Li, Z.; Zhang, D.; Peng, Y.; Qin, S.; Wang, L.; Hou, E.; Yang, Y. Divergent drivers of various topsoil phosphorus fractions across Tibetan alpine grasslands. J. Geophys. Res. Biogeosci. 2022, 127, e2022JG006795. [Google Scholar] [CrossRef] [Scilit]
- Frey, S.D.; Ollinger, S.; Nadelhoffer, K.; Bowden, R.; Brzostek, E.; Burton, A.; Caldwell, B.A.; Crow, S.; Goodale, C.L.; Grandy, A.S.; et al. Chronic nitrogen additions suppress decomposition and sequester soil carbon in temperate forests. Biogeochemistry 2014, 121, 305–316. [Google Scholar] [CrossRef] [Scilit]
- Zhou, L.; Zhou, X.; Zhang, B.; Lu, M.; Luo, Y.; Liu, L.; Li, B. Different responses of soil respiration and its components to nitrogen addition among biomes: A meta-analysis. Glob. Change Biol. 2014, 20, 2332–2343. [Google Scholar] [CrossRef] [Scilit] [PubMed]
- Chen, J.; Luo, Y.; Li, J.; Zhou, X.; Cao, J.; Wang, R.W.; Wang, Y.; Shelton, S.; Jin, Z.; Walker, L.M.; et al. Costimulation of soil glycosidase activity and soil respiration by nitrogen addition. Glob. Change Biol. 2017, 23, 1328–1337. [Google Scholar] [CrossRef] [Scilit] [PubMed]
- Hu, J.; Huang, C.; Zhou, S.; Kuzyakov, Y. Nitrogen addition to soil affects microbial carbon use efficiency: Meta-analysis of similarities and differences in 13C and 18O approaches. Glob. Change Biol. 2022, 28, 4977–4988. [Google Scholar] [CrossRef] [Scilit] [PubMed]
- Comstedt, D.; Boström, B.; Ekblad, A. Autotrophic and heterotrophic soil respiration in a Norway spruce forest: Estimating the root decomposition and soil moisture effects in a trenching experiment. Biogeochemistry 2011, 104, 121–132. [Google Scholar] [CrossRef] [Scilit]
- Díaz-Pinés, E.; Schindlbacher, A.; Pfeffer, M.; Jandl, R.; Zechmeister-Boltenstern, S.; Rubio, A. Root trenching: A useful tool to estimate autotrophic soil respiration? A case study in an Austrian mountain forest. Eur. J. For. Res. 2010, 129, 101–109. [Google Scholar] [CrossRef] [Scilit]
- Fang, J.; Xiang, W. Biomass and its distribution of a primeval Abies georgei var. smithii forest in Sejila Mountain in Tibet Plateau. Sci. Silvae Sin. 2008, 44, 17–23. [Google Scholar]
- Kuzyakov, Y. Sources of CO2 efflux from soil and review of partitioning methods. Soil Biol. Biochem. 2006, 38, 425–448. [Google Scholar] [CrossRef] [Scilit]
- Vance, E.D.; Brookes, P.C.; Jenkinson, D.S. An extraction method for measuring soil microbial biomass C. Soil Biol. Biochem. 1987, 19, 703–707. [Google Scholar] [CrossRef] [Scilit]
- Brookes, P.C.; Landman, A.; Pruden, G.; Jenkinson, D.S. Chloroform fumigation and the release of soil nitrogen: A rapid direct extraction method to measure microbial biomass nitrogen in soil. Soil Biol. Biochem. 1985, 17, 837–842. [Google Scholar] [CrossRef] [Scilit]
- Brookes, P.C.; Powlson, D.S.; Jenkinson, D.S. Measurement of microbial biomass phosphorus in soil. Soil Biol. Biochem. 1982, 14, 319–329. [Google Scholar] [CrossRef] [Scilit]
- Saiya-Cork, K.R.; Sinsabaugh, R.L.; Zak, D.R. The effects of long term nitrogen deposition on extracellular enzyme activity in an Acer saccharum forest soil. Soil Biol. Biochem. 2002, 34, 1309–1315. [Google Scholar] [CrossRef] [Scilit]
- Bell, C.W.; Fricks, B.E.; Rocca, J.D.; Steinweg, J.M.; McMahon, S.K.; Wallenstein, M.D. High-throughput fluorometric measurement of potential soil extracellular enzyme activities. J. Vis. Exp. 2013, 81, e50961. [Google Scholar] [CrossRef] [Scilit] [PubMed]
- Moorhead, D.L.; Sinsabaugh, R.L.; Hill, B.H.; Weintraub, M.N. Vector analysis of ecoenzyme activities reveals constraints on coupled C, N and P dynamics. Soil Biol. Biochem. 2016, 93, 1–7. [Google Scholar] [CrossRef] [Scilit]
- Sinsabaugh, R.L.; Turner, B.L.; Talbot, J.M.; Waring, B.G.; Powers, J.S.; Kuske, C.R.; Moorhead, D.L.; Follstad Shah, J.J. Stoichiometry of microbial carbon use efficiency in soils. Ecol. Monogr. 2016, 86, 172–189. [Google Scholar] [CrossRef] [Scilit]
- Xu, C.; Xu, X.; Ju, C.; Chen, H.Y.H.; Wilsey, B.J.; Luo, Y.; Fan, W. Long-term, amplified responses of soil organic carbon to nitrogen addition worldwide. Glob. Change Biol. 2021, 27, 1170–1180. [Google Scholar] [CrossRef] [Scilit] [PubMed]
- Sun, H.; Schmidt, M.W.I.; Li, J.; Li, J.; Liu, X.; Ofiti, N.O.E.; Zhou, S.; Nie, M. Nine years of warming and nitrogen addition in the Tibetan grassland promoted loss of soil organic carbon but did not alter the bulk change in chemical structure. Biogeosciences 2024, 21, 575–589. [Google Scholar] [CrossRef] [Scilit]
- Jin, J.; Bol, R.; Bing, H.; Huang, J.; Zhang, J.; Wu, Y.; Zhu, H.; Wu, Y.; Chang, R. Nitrogen addition reduces soil phosphorus leaching in a subtropical forest of the eastern Tibetan Plateau. Appl. Soil Ecol. 2024, 202, 105616. [Google Scholar] [CrossRef] [Scilit]
- Tian, D.; Niu, S. A global analysis of soil acidification caused by nitrogen addition. Environ. Res. Lett. 2015, 10, 024019. [Google Scholar] [CrossRef] [Scilit]
- Sinsabaugh, R.L.; Moorhead, D.L. Resource allocation to extracellular enzyme production: A model for nitrogen and phosphorus control of litter decomposition. Soil Biol. Biochem. 1994, 26, 1305–1311. [Google Scholar] [CrossRef] [Scilit]
- Jian, S.; Li, J.; Chen, J.; Wang, G.; Mayes, M.A.; Dzantor, K.E.; Hui, D.; Luo, Y. Soil extracellular enzyme activities, soil carbon and nitrogen storage under nitrogen fertilization: A meta-analysis. Soil Biol. Biochem. 2016, 101, 32–43. [Google Scholar] [CrossRef] [Scilit]
- German, D.P.; Weintraub, M.N.; Grandy, A.S.; Lauber, C.L.; Rinkes, Z.L.; Allison, S.D. Optimization of hydrolytic and oxidative enzyme methods for ecosystem studies. Soil Biol. Biochem. 2011, 43, 1387–1397. [Google Scholar] [CrossRef] [Scilit]
- Burns, R.G.; DeForest, J.L.; Marxsen, J.; Sinsabaugh, R.L.; Stromberger, M.E.; Wallenstein, M.D.; Weintraub, M.N.; Zoppini, A. Soil enzymes in a changing environment: Current knowledge and future directions. Soil Biol. Biochem. 2013, 58, 216–234. [Google Scholar] [CrossRef] [Scilit]
- Sun, X.; Sun, H.; Zhang, Q.; Zhu, B.; Dai, H.; Zeng, Q.; Chen, J.; Chen, W.; Chen, Y. Soil particulate organic carbon regulates microbial carbon use efficiency in subtropical forests under nitrogen addition in different seasons. Appl. Soil Ecol. 2024, 203, 105680. [Google Scholar] [CrossRef] [Scilit]
- Guan, N.; Liu, L. Microbial response to acid stress: Mechanisms and applications. Appl. Microbiol. Biotechnol. 2020, 104, 51–65. [Google Scholar] [CrossRef] [Scilit] [PubMed]
- Franklin, O.; Hall, E.K.; Kaiser, C.; Battin, T.J.; Richter, A. Optimization of biomass composition explains microbial growth-stoichiometry relationships. Am. Nat. 2011, 177, E29–E42. [Google Scholar] [CrossRef] [Scilit] [PubMed]
- Cui, Y.; Hu, J.; Peng, S.; Delgado-Baquerizo, M.; Moorhead, D.L.; Sinsabaugh, R.L.; Xu, X.; Geyer, K.M.; Fang, L.; Smith, P.; et al. Limiting resources define the global pattern of soil microbial carbon use efficiency. Adv. Sci. 2024, 11, 2308176. [Google Scholar] [CrossRef] [Scilit] [PubMed]

Disclaimer/Publisher’s Note: The statements, opinions and data contained in all publications are solely those of the individual author(s) and contributor(s) and not of MDPI and/or the editor(s). MDPI and/or the editor(s) disclaim responsibility for any injury to people or property resulting from any ideas, methods, instructions or products referred to in the content. |
© 2026 by the authors. Licensee MDPI, Basel, Switzerland. This article is an open access article distributed under the terms and conditions of the Creative Commons Attribution (CC BY) license.