


Abstract
Korean pine (Pinus koraiensis) nut-timber plantations are important for both timber and seed production, yet optimal water and fertilizer management for mature cone-bearing stands remains poorly understood. A two-year field experiment was conducted to evaluate the effects of three fertilization levels (F1, F2, and F3, corresponding to N:P2O5:K2O application rates of 50:75:25, 100:150:50, and 150:225:75 kg ha−1, respectively) and three soil moisture regimes corresponding to 80%, 60%, and 40% of field capacity (W1, W2, and W3, respectively) on tree growth, cone yield, and soil physicochemical properties in approximately 35-year-old Korean pine plantations established on Albeluvisol at Maoer Mountain, northeastern China. Tree growth and cone yield generally followed the order F2 > F3 > F1 and W2 > W1 > W3, with F2W2 (N:P2O5:K2O = 100:150:50kg ha−1 and 60% of field capacity) consistently producing the best performance. Compared with the control (CK, no fertilizer application, rainfed under natural ambient conditions), F2W2 increased height, diameter, and crown width increments by 46.2%, 71.4%, and 65.6%, respectively, in 2023. Per-tree cone number, total cone mass, and total pine nut mass increased progressively across years, reaching increases of 88.5%, 100.6%, and 132.4%, respectively, in 2024. In contrast, thousand-seed weight showed relatively small changes and a delayed water–fertilizer interaction. Water–fertilizer coupling significantly altered soil physicochemical properties by reducing soil pH under the optimal treatment, while also regulating inorganic nitrogen availability and soil nutrient distribution. Nitrate nitrogen was highest under W2, whereas ammonium nitrogen peaked under W1. Total nitrogen was highest under F3W1, while available phosphorus and potassium accumulated under high fertilization combined with non-optimal soil moisture, but were lowest under F2W2, indicating enhanced nutrient uptake under the optimal treatment. Cluster analysis showed that nitrate nitrogen was positively associated with growth and yield variables. Overall, F2W2 provided the most favorable balance between stand productivity and soil nutrient status, representing an effective water–fertilizer management strategy for mature Korean pine nut-timber plantations on Albeluvisol. These findings provide a scientific basis for precision water and nutrient management in northeastern China.
1. Introduction
Korean pine (Pinus koraiensis) is a major timber species in the temperate coniferous forests of Northeast China, with its natural distribution concentrated in the region extending from the Lesser Khingan Mountains to the Changbai Mountains [1,2]. The species has dual economic value in timber and nut production [3,4], and its seed, commonly known as the pine nut, is rich in unsaturated fatty acids and protein, making it valuable for consumption and offering strong market potential [5,6]. Korean pine has demanding site requirements, growing best in deep, nutrient-rich, well-drained, and slightly acidic soils [7]; both its vegetative growth and reproductive processes are markedly constrained when water or nutrient supply falls short [4,8,9]. The kernel oil content of Korean pine seeds can reach approximately 65% [10], and lipid synthesis is a highly energy-intensive metabolic process that requires a continuous supply of photosynthetic products and mineral nutrient substrates [11]. Cone development in Korean pine spans approximately two growing seasons, and cone number depends not only on current-year water and nutrient supply but also on photosynthetic product accumulation during the previous growing season [12]. As management objectives for the species shift from traditional timber production toward combined nut-timber and high-efficiency production [3,13], sustaining plantation productivity places greater demands on soil water and nutrient supply, and optimizing water–fertilizer management has accordingly become an important means of enhancing the productive potential of Korean pine nut-timber forests [8].
Because Korean pine grows slowly in its early years [14], forestry practice has long assumed that plantations need no dedicated fertilization, and limited irrigation access on mountainous terrain has likewise kept irrigation regime outside routine silvicultural practice. This conventional approach is justified when timber production is the primary objective. However, the expansion of combined nut-timber management, with its sustained reproductive demands, requires greater water and nutrient inputs [4]. The resource requirements of reproduction extend across growing seasons because cone development in Korean pine spans approximately two years. Consequently, cone number depends not only on current-year water and nutrient supply but also on the accumulation of photosynthetic products during the previous growing season [12]. As an evergreen conifer, Korean pine begins transpiration relatively early in spring. It sustains it over a comparatively long period [14,15]. Hence, soil water deficits readily arise when precipitation is short in late spring and early summer, affecting growth and reproduction throughout the year [16].
Existing studies indicate that fertilization improves tree nutritional status and promotes growth and reproduction, although its effectiveness depends on the type of fertilizer, application rate, and nutrient ratio [4,17]. Nitrogen and phosphorus are essential for chlorophyll synthesis, assembly of photosynthetic enzymes, and nucleic acid synthesis, and their sufficient supply enhances photosynthetic capacity and carbon assimilation efficiency [18,19]. Potassium regulates guard cell turgor, participates in transpiration-driven mineral nutrient transport, and promotes phloem translocation of photosynthates, thereby supporting radial growth and crown expansion [17,20]. Appropriate irrigation regime alleviates water stress during critical growth periods, enhances root uptake and nutrient transport, and improves fertilizer use efficiency [21], while adequate nutrient supply, in turn, improves stomatal regulation and strengthens drought tolerance and water-use efficiency [17,20], pointing to a pronounced synergy between water and nutrient supply. In Italian stone pine (Pinus pinea), another pine valued for its edible nuts, combined water and fertilizer treatment promotes diameter growth and cone yield more effectively than fertilization alone [22,23], suggesting that well-matched water–fertilizer regimes can substantially enhance tree growth and reproductive capacity. Research on water–fertilizer management in Korean pine nonetheless remains relatively limited, as existing work concentrates mainly on young seedlings or seed-production forests [4,24], leaving the coupling effects of water and fertilizer, along with suitable regulation strategies for mature, reproductively active Korean pine nut-timber forests, without systematic investigation [12].
Building on prior work by our research group and preliminary seedling-stage screening trials, this study adopts an N:P2O5:K2O ratio of 2:3:1 for fertilization and takes a mature, reproductively active Korean pine (Pinus koraiensis) nut-timber plantation in the Mao’er Mountain forest region as its study subject. Three fertilization levels are combined with three irrigation regimes levels, together with an unfertilized, unirrigated control (CK), in a two-year (2023–2024) fixed-site field experiment that systematically examines how irrigation regime, fertilization, and their coupling affect Korean pine growth, cone and seed yield, and soil physicochemical properties. This study aims to reveal how mature Korean pine nut-timber forests respond to different water–fertilizer combinations, to identify an appropriate water–fertilizer management regime, and to provide theoretical grounding and practical reference for precise water–fertilizer management and efficient cultivation of Korean pine plantations in Northeast China.
2. Materials and Methods
2.1. Study Site
This study was conducted at the Mao’er Mountain Experimental Forest Farm, Shangzhi City, Heilongjiang Province, China (45°14′46″ N, 127°33′1″ E), in approximately 35-year-old Korean pine (Pinus koraiensis) nut-timber plantations established on Albeluvisol [25]. The site has a humid temperate monsoon climate, with a mean annual temperature of approximately 2–3 °C, a mean annual precipitation of about 725 mm, a frost-free period of approximately 130 days, and an annual sunshine duration of approximately 2000 h. The site is located at an average elevation of approximately 580 m. Soil depth varies with topography, ranging from 50 to 80 cm on gently sloping terrain and 30 to 50 cm on slopes and ridges [26,27].
The canopies are fully closed, and all trees had previously undergone topping to promote crown branching. Routine management consists only of annual manual weeding, with no chemical herbicides applied throughout the experimental period. The initial planting spacing was 3 m × 4 m. Through successive silvicultural management practices, particularly selective thinning, the stand density was gradually reduced to approximately 380 trees ha−1 before the experiment. The current stand structure represents the result of long-term stand management, including thinning and crown regulation.
2.2. Soil Classification and Rationale for the Fertilization Ratio
The soil at this site is classified as Albeluvisol under the World Reference Base for Soil Resources (WRB) [25]. This is a subtype of dark brown forest soil in the Chinese genetic soil classification system, specifically Albeluvisol, distinguished from the parent soil type by the presence of an albic horizon. The surface horizon has a silt loam texture (USDA textural class), containing 18.5% sand, 61.2% silt, and 20.3% clay (NY/T 1121.3-2006) [28]. The baseline soil pH of the 0–20 cm layer in this site averaged approximately 5.6 (pre-treatment, 2022).
Soils of this type commonly have low available phosphorus despite moderate total phosphorus reserves, because iron and aluminum oxides fix phosphate under the alternating oxidizing and reducing conditions created by impeded drainage. Phosphorus has also been reported as a potential limiting factor for the growth of Pinus koraiensi [9]. The high oil content of the kernel further implies an elevated phosphorus demand during kernel filling, as lipid biosynthesis is a phosphorus-demanding metabolic process. The clay fraction of dark brown soils and their albic-influenced subgroups in this region is reported to be dominated by hydromica-type 2:1 phyllosilicates such as illite. Recent studies show that Luvisol-group soils, which are less weathered and have higher base status than strongly weathered tropical soils, contain substantially higher total and exchangeable potassium, with illite and illite-smectite acting as the dominant potassium-bearing phase, and that clay mineralogy rather than clay content alone governs the size of the soil potassium pool [29]. Illitic clay fractions are further documented to contain a large, slowly equilibrating reserve of non-exchangeable interlayer potassium that buffers plant potassium uptake and soil test potassium levels over multiple years [30,31,32,33].
Considering the low phosphorus availability of Albeluvisols, the potential phosphorus limitation of Pinus koraiensis growth, and the relatively strong potassium buffering capacity associated with illitic clay minerals in these soils, a relatively higher phosphorus input and lower potassium input were considered appropriate for this site. This general direction is consistent with a previous field study by our research group on Pinus koraiensis nut-timber plantations growing on the same soil type at other locations in this region, in which an N:P2O5 ratio of 2:3 was associated with favorable tree nutritional status and fruiting performance [34]. Building on this established N:P2O5 ratio, preliminary nutrient-screening trials were subsequently conducted on P. koraiensis seedlings under conditions similar to those at this site, with the aim of determining an appropriate potassium input relative to nitrogen and phosphorus. These trials indicated that an N:P2O5:K2O ratio of 2:3:1 supported favorable seedling growth performance and nutrient uptake. This ratio was therefore adopted for the fertilization treatments in the present study.
2.3. Experimental Design and Treatments
The experiment employs a randomized block design with 10 treatments: a full factorial combination of three fertilization levels and three soil moisture levels (3 × 3), plus a natural control treatment without fertilization or irrigation (CK). The fertilization rates and irrigation thresholds for each treatment are presented in Table 1. Each experimental plot measured 20 m × 20 m, and each treatment consisted of three independent replicate plots. Within the central area of each plot, two healthy Korean pine trees with similar diameters at breast height and tree height, vigorous growth, no visible pest or disease damage, and intact tree structure were randomly selected as sample trees. The selected trees were permanently tagged for water–fertilizer treatments and long-term monitoring. The remaining trees served as guard trees to minimize edge effects and potential interference caused by water and fertilizer movement between adjacent plots. For each plot, measurements from the two sample trees were averaged to obtain the plot mean. All statistical analyses were performed using plot means as observation values, with independent replicate plots regarded as experimental units.
Table 1.
Fertilization rates and irrigation thresholds under different water–fertilizer coupling treatments (per hectare).
The fertilizers used include urea (46% N), diammonium phosphate (18% N and 46% P2O5), and potassium sulfate (50% K2O) were produced by Henan Jingtan Agricultural Technology Co., Ltd., Zhoukou, China. Fertilizers are applied in three equal applications annually during April, May, and June using the ring trench method. A circular trench approximately 20 cm deep and 15 cm wide is excavated along the drip line of each sample tree, at a horizontal distance of approximately 1.5–2.0 m from the trunk. This distance was not a fixed radius but was adjusted individually to match each tree’s actual drip-line projection. This position was selected because the highly active absorptive fine roots of mature P. koraiensis are concentrated predominantly beneath the canopy drip line, so that fertilizer placed here was expected to maximize root nutrient uptake efficiency and minimize leaching loss relative to trunk-base application. To protect the root system during excavation, trenches were dug entirely by hand with spades and kept intentionally shallow. Field personnel carefully worked around any structural coarse roots (diameter > 2 cm) encountered, so that only minor fine roots were occasionally severed. Such fine roots regenerate rapidly in mature pines and were not expected to compromise tree health or stability. Mixed fertilizers are evenly distributed at the trench bottom, followed by soil backfilling and compaction. Basal fertilizer is applied in mid-April in 2022 and 2023, while topdressing is applied twice, in late May and early July each year.
Field capacity was determined prior to the experiment using the cutting-ring method following NY/T 1121.22-2010 [35]. Undisturbed soil cores were collected using cutting rings, saturated with water, and then allowed to drain under standard conditions until drainage was complete. The resulting soil water content was defined as field capacity (FC). The resulting gravimetric field capacity was converted to a volumetric basis using the corresponding soil bulk density, yielding a field capacity of approximately 0.35 cm3 cm−3. Field capacity indicates the amount of water retained in soil after excess gravitational water has drained and is used as the reference value for establishing irrigation treatments. The target soil moisture levels were set as different proportions of FC.
During the baseline survey after soil thawing and before treatment implementation, natural soil water content in the 0–40 cm soil layer was measured using time-domain reflectometry (TDR) [36]. Average values at depths of 20 and 40 cm were used to match the monitoring depths of the irrigation regimes. Natural volumetric soil water content was approximately 0.28 cm3 cm−3 prior to treatment implementation, equivalent to approximately 80% of the field capacity determined above, consistent with this period corresponding to the annual peak soil moisture condition in the region.
The CK treatment received natural rainfall without a rain-exclusion film throughout the experiment. To eliminate natural precipitation as a confounding variable and allow precise control of the intended soil moisture gradient, rain-exclusion film was deployed over all irrigation treatment plots (W1, W2, and W3). Irrigation was supplied via surface drip pipes installed beneath the film, with two parallel drip lines arranged around the root zone of each sample tree and emitters spaced 30 cm apart. Two TDR probes were installed in each plot at depths of 20 and 40 cm, positioned away from emitters at the midpoint between the tree trunk and canopy projection edge. Soil moisture management continued throughout the Korean pine growing season. Every seven days, the current soil water content was determined from TDR measurements transmitted by the data logger. Supplemental water was applied through the drip irrigation system when the monitored soil water content in a plot fell below its assigned treatment threshold, with TDR measurements used to guide irrigation according to the target moisture levels of W1, W2, and W3 throughout the growing season. The required irrigation volume was calculated for each treatment and delivered through the main irrigation pipeline using flow meters and control valves, following the procedure described below.
Volumetric soil water content (θv, cm3 cm−3) was obtained from TDR-measured dielectric permittivity [36]. The volumetric field capacity (θv, FC) was calculated from the gravimetrically determined field capacity (θg, FC) using the corresponding soil bulk density (ρb, g cm−3):
θv, FC = θg, FC × ρb
For each treatment i (W1, W2, W3), the target volumetric water content was:
where Wi = 0.8, 0.6, and 0.4 for W1, W2, and W3, respectively. At each seven-day monitoring interval, the soil water deficit at each probe depth j (20 and 40 cm) was calculated as:
with irrigation applied only when Δθv, j > 0, and converted to an irrigation depth using the representative soil layer thickness assigned to each probe (Dz, j, mm). Following the midpoint rule within the managed 0 to 40 cm profile, the 20 cm probe represented the 0 to 20 cm layer and the 40 cm probe represented the 20 to 40 cm layer:
θv, target, i = Wi × θv, FC
Δθv, j = θv, target, i − θv, measured, j
dj = Δθv, j × Dz, j
The total irrigation depth per event was the sum across the two monitored depths:
and converted to an application volume per sample tree using the wetted area beneath the drip emitters (A, m2):
d = Σdj
V = d × A
This approach ensured that irrigation in all three treatments was introduced only once soil moisture had reached its intended target level.
2.4. Measurements and Methods
2.4.1. Measurement of Growth Increment
To accurately quantify treatment effects on vegetative growth, tree height, diameter at breast height (DBH), and crown width are measured at fixed marked positions on standard sample trees in each treatment plot, including CK. Measurements are conducted in early April before the 2023 growing season and in late September at the end of the season, and annual growth increments are calculated as the difference between the two measurements. Due to research period constraints, growth increments are measured only for the 2023 growing season and primarily reflect treatment effects within that season. Both measurements are conducted by the same fixed team under similar weather conditions, with instruments, procedures, and recording methods kept consistent to minimize operator variation and systematic instrument errors.
Because topping promotes forking, sample trees lack a single dominant leader, and tree height is defined as the vertical distance from the highest crown point to the ground. Measurements are performed using a Vertex IV ultrasonic hypsometer (Haglöf Sweden AB, Långsele, Sweden). The T3 transponder is fixed at the permanent paint mark 1.3 m above ground on each sample tree, and the operator holds the main unit horizontally from the trunk at a distance at least equal to tree height while aiming at the highest crown point. The instrument automatically calculates and displays height. Each tree is measured three times, and the arithmetic mean is recorded. During the initial measurement, the lateral branch with the highest crown point is recorded, and this branch is rechecked at the end of the growing season to reduce errors due to changes in lateral branch height rankings. Measurements are conducted under calm or light wind conditions to minimize the effects of branch and foliage movement on the identification of the highest point.
Using the permanent painted ring mark 1.3 m above ground as the reference point, stem girth is measured with a diameter tape to the nearest 1 mm and converted to DBH. Each tree is measured twice. If the difference exceeds 2 mm, a third measurement is taken, and the mean of the two readings within the acceptable range is recorded as the final value.
Centered on the trunk, the maximum horizontal width of the vertical crown projection is measured with a tape along the east–west and north–south axes, and the mean of the two measurements is recorded to the nearest 0.1 m. Two operators jointly conduct this measurement, each holding one end of the tape aligned with the projected crown edge on their respective sides, thereby reducing errors from single-person visual estimation.
2.4.2. Measurement of Yield
Yield-related indicators are measured on standard sample trees within each treatment plot when Korean pine cones reach natural maturity in late September of 2023 and 2024. Because Korean pine cone development spans approximately two growing seasons, the effects of water and fertilizer supply in a given year accumulate across years, and yield observations over two consecutive years provide a preliminary reflection of this process.
A complete manual harvest and counting of the whole tree determines the number of cones per tree. Before picking, waterproof sheeting is laid within the crown projection area and around the trunk of each sample tree. Using professional climbing equipment or long-handled cone harvesters, pickers systematically inspect each crown layer from top to bottom and inside to outside, removing all mature cones individually and intact, collecting them on waterproof sheeting, and counting them on site to accurately record the total number of cones per tree.
The total fresh weight of cones per tree is weighed promptly in the field on the picking day to minimize moisture loss effects. All fresh cones from a single tree are placed into a collection bag with a predetermined tare weight, and the total weight is measured with a portable electronic platform scale with a precision of 0.01 kg. The total fresh weight per tree is recorded after subtracting the bag weight.
The total mass of pine nuts is determined after threshing and cleaning. All harvested cones are air-dried naturally in a well-ventilated, dry, and shaded location, and seeds are extracted by mechanical or manual threshing after cone scales fully open. Extracted seeds are collected, and winnowing removes scale fragments, impurities, and shriveled empty seeds. The total mass of clean, plump pine nuts is measured on an electronic balance to a precision of 0.1 g and recorded.
Thousand-seed weight is determined according to the weighing method [37]. From winnowed, clean pine nuts of each sample tree, seed samples are reduced to workable quantities by the quartering method, and 100 plump, undamaged seeds are randomly counted and weighed on a high-precision electronic balance to the nearest 0.01 g. This procedure is independently repeated eight times for each sample tree, and the coefficient of variation in the eight replicate weights is calculated. When the coefficient of variation does not exceed 4.0%, the thousand-seed weight is calculated as the arithmetic mean of the eight replicate weights multiplied by 10. When it exceeds 4.0%, resampling and remeasurement are required until the precision criterion is met.
2.4.3. Measurement of Soil Nutrient Indicators
Soil samples are collected uniformly in late September 2023. Composite sampling for soil chemical indicators follows a five-point method, with the central point at the center of the experimental plot and two auxiliary points evenly spaced along each diagonal, ensuring the five points cover the plot evenly. At each point, a 3.5 cm diameter soil auger is used to collect surface soil from the 0–20 cm layer, with equal soil core volumes. The five cores are combined, and visible plant roots, gravel, and plant or animal residues are carefully removed. After thorough mixing, the composite sample is reduced to approximately 500 g by quartering, placed in a self-sealing bag, labeled on-site with the plot number, sampling date, and soil depth, and returned to the laboratory for same day processing.
Soil bulk density is determined from undisturbed soil samples collected separately using the core ring method [38]. A vertical profile is excavated within each treatment plot near the chemical sampling points, and a standard 100 cm3 ring is pressed horizontally into the undisturbed soil in the 0–20 cm layer. The two ends of the core are trimmed flush with a knife, covered with moist filter paper, and sealed in a covered container to prevent moisture loss or structural disturbance during transport. Three independent samples are collected per plot and oven-dried at 105 °C to constant weight after returning to the laboratory the same day. Bulk density is calculated from dry weight, and the mean of the three samples is used as the plot value.
Immediately upon returning to the laboratory, the composite soil sample is divided into two portions: one for fresh-soil analysis and the other for air-dried-soil analysis. Fresh soil used to determine nitrate nitrogen and ammonium nitrogen is extracted within 24 h, stored at 4 °C, and analyzed within 48 h. Approximately 5 g of fresh soil is also weighed and oven-dried at 105 °C to a constant weight to determine soil moisture content, thereby allowing conversion of the results to a dry-soil mass basis.
Soil samples were air-dried, gently ground, and passed through 2 mm and 0.25 mm sieves for subsequent analyses. The 2 mm-sieved soil was used to determine pH, available phosphorus, and available potassium, while the 0.25 mm-sieved soil was used to determine soil organic matter and total nitrogen. Soil samples for different analyses were stored separately in a cool, dry place before measurement. Soil pH was determined using a pH meter with a soil-to-water ratio of 1:2.5 (NY/T 1121.2-2006) [39]. Total nitrogen was measured using an automatic Kjeldahl analyzer (NY/T 1121.24-2012 [40]. Available phosphorus was determined using the molybdenum blue colorimetric method (NY/T 1121.7-2014) [41], while available potassium was measured by flame photometry (NY/T 889-2004) [42]. Soil organic matter was determined using the potassium dichromate oxidation method with external heating (NY/T 1121.6-2006) [43]. Nitrate nitrogen and ammonium nitrogen were extracted and quantified using an AA3 (Bran + Luebbe, Norderstedt, Germany) continuous flow analyzer (LY/T 1228-2015) [44].
2.5. Statistical Analyses
Statistical analyses were conducted using R version 4.4.3 [45]. Levene’s test for homogeneity of variance was conducted before analysis of variance, and Duncan’s multiple range test (DMRT) was used for multiple comparisons at a significance level of p = 0.05. To evaluate differences in yield traits of Korean pine nut-timber plantations between 2023 and 2024 under the same treatment, paired t-tests were performed on observations from three replicate plots for each treatment in both years, with significance set at p = 0.05. Data processing and figure generation were conducted using Microsoft Excel 2021, R version 4.4.3, and GraphPad Prism 10. All measured variables were calculated as means of three replicates and presented as mean ± standard error (Mean ± SE).
The overall growth performance of Korean pine nut-timber plantations was quantitatively evaluated using the membership function method [46]. Since tree height increment, diameter at breast height (DBH) increment, and crown width increment are positive-response indicators, min-max normalization was performed using the following membership function:
where Xij represents the mean value of indicator j (tree height, DBH, or crown width) under treatment i, and Xjmin and Xjmax represent the minimum and maximum values of the corresponding indicator among all ten treatments, including CK, at the same experimental site. The CK treatment was included only to determine the maximum and minimum values for the membership function calculation. The arithmetic mean of the membership values of the three growth indicators was used to calculate the comprehensive growth index:
μ(Xij) = (Xij − Xjmin)/(Xjmax − Xjmin)
Comprehensive growth indexi = [μ(tree heighti) + μ(DBHi) + μ(crown widthi)]/3
The comprehensive soil evaluation index reflects the relative performance of different water and fertilizer treatments within the same site. All calculations and three-dimensional response surface analyses were conducted in R 4.4.3. Data processing was performed using the dplyr and tidyr packages, and visualization was conducted using plotly package.
The relationships among growth traits, yield characteristics, and soil physicochemical properties of Korean pine nut-timber plantations were visualized using hierarchical cluster analysis [47]. Before analysis, the original data were standardized per row using Z-score transformation to eliminate the influence of differences in measurement units among variables. Euclidean distance was used as the metric for row and column clustering, and the complete-linkage method was applied [48]. Hierarchical cluster analysis and heatmap generation were performed in R 4.4.3 using the pheatmap package.
3. Results
3.1. Effects of Water and Fertilizer Coupling on the Growth of Korean Pine Nut-Timber Plantations
3.1.1. Tree Height Increment
Soil moisture, fertilization level, and their interaction significantly affected tree height increment (p < 0.01; Table 2). The F2 treatment produced a greater increment than F1 and F3 at every moisture level. Across all fertilization levels, increment showed a unimodal response to soil moisture, peaking at W2 and declining under both W1 and W3, with increment under F1 and F3 approaching or falling to the CK level at W3 (Figure 1a). This pattern suggests that moderate soil moisture best supports nutrient uptake and utilization, excess moisture under W1 may cause root hypoxia and nutrient leaching, whereas insufficient moisture under W3 likely limits nutrient dissolution and transport to the roots, both reducing the trees’ capacity to use the applied fertilizer.
Table 2.
Effects of water–fertilizer coupling on growth increments of Korean pine nut-timber forests in 2023.
Figure 1.
Effects of water–fertilizer coupling on growth characteristics of Korean pine nut-timber plantations in 2023. (a) Tree height increment. (b) Diameter at breast height (DBH) increment. (c) Crown width increment. (d) Three-dimensional response surface of the comprehensive growth evaluation score. Different uppercase letters at the same irrigation regime indicate significant differences among fertilization treatments (p < 0.05), while different lowercase letters within the same fertilization treatment indicate significant differences among irrigation regimes (p < 0.05).
At the same fertilization level, tree height increment initially increases and then declines as irrigation decreases, following the order W2 > W1 > W3. Under the F1 fertilization level, the W2 treatment is significantly greater than the W1 and W3 treatments (p < 0.05; Figure 1a). At the F2 and F3 fertilization levels, all three soil moisture treatments differ significantly (p < 0.05), following the same pattern of W2 > W1 > W3 (Figure 1a). Under the same soil moisture condition, tree height increment follows the order F2 > F3 > F1, indicating an increase at moderate fertilization followed by a decline at the highest fertilization level. Under W2, all three fertilization levels differ significantly (p < 0.05). Under W1 and W3, the F2 treatment is significantly greater than the F1 and F3 treatments (p < 0.05), whereas no significant difference is detected between the F1 and F3 treatments (p > 0.05; Figure 1a). Together, results show that the fertilization response is nonlinear and depends on moisture level, fertilization effects are fully expressed only under W2, while under water-limited or water-excess conditions, F3 fails to significantly outperform F1, suggesting that once moisture departs from the optimum, it becomes the dominant constraint on growth, limiting the trees’ ability to benefit from higher fertilizer input.
Tree height increment is also comparable between the F2W1 and F3W2 treatments and between the F1W2 and F2W3 treatments (Table 2). The highest tree height increment occurs under F2W2, which is 46.2% greater than CK, 22.0% greater than the highest value under the F1 fertilization level (F1W2), and 9.9% greater than the highest value under the F3 fertilization level (F3W2). The lowest value occurs under F1W3, which is only 3.3% greater than CK (Table 2).
3.1.2. Diameter at Breast Height Increment
Soil moisture, fertilization level, and their interaction all have highly significant effects on DBH increment (p < 0.01; Table 2). As shown in Figure 1b, F2 consistently produces a greater DBH increment than F1 and F3 across all soil moisture levels. The response curve under F1 remains relatively stable, showing slight variation among the three soil moisture levels and remaining close to CK throughout. Under F3, DBH increment declines sharply under W3, making it the only treatment with a DBH increment lower than CK (Figure 1b). This contrast suggests that when nutrient supply is low, DBH growth is nutrient limited regardless of moisture status, so moisture variation produces little additional effect, whereas at high nutrient supply the trees become more sensitive to moisture deficit: under W3, the limited soil water likely concentrates the applied fertilizer salts in the soil solution, lowering its water potential and impeding root water and nutrient uptake, so the combined drought and salt stress suppresses radial growth below CK level.
Regarding soil moisture, no significant differences are observed among the three soil moisture treatments under F1 (p > 0.05). Under F2, W2 produces significantly greater DBH increment than W1 and W3 (p < 0.05), whereas W1 and W3 do not differ significantly (p > 0.05). Under F3, all soil moisture treatments differ significantly (p < 0.05), following the order W2 > W1 > W3 (Figure 1b). Regarding fertilization level, under both W1 and W3, F2 produces significantly greater DBH increment than F1 and F3 (p < 0.05), while F1 and F3 do not differ significantly (p > 0.05). Under W2, all fertilization treatments differ significantly (p < 0.05), following the order F2 > F3 > F1 (Figure 1b). Overall, F2 produces the greatest DBH increment.
In addition, DBH increment is comparable between F2W1 and F3W2 and between F1W2 and F3W1 (Table 2). The maximum DBH increment occurs under F2W2, exceeding the maxima under F1 (F1W2) and F3 (F3W2) by 45.5% and 20.0%, respectively, and CK by 71.4%. The minimum value occurs under F3W3, which is 7.1% lower than CK (Table 2).
3.1.3. Crown Width Increment
Soil moisture regimes, fertilization level, and their interaction all significantly affected crown width increment (p < 0.01; Table 2). F2 produced greater increment than F1 and F3 across all moisture levels, and every fertilization level showed a unimodal moisture response, increasing from W1 to W2 and declining at W3 (Figure 1c). The F1 response was comparatively flat, varying only slightly among moisture levels and staying close to CK throughout, whereas under W3 both F1 and F3 fell slightly below CK.
For soil moisture regimes, under F2, crown width increment under W2 is significantly greater than under W1 and W3 (p < 0.05), whereas no significant difference is observed between W1 and W3 (p > 0.05). Under F1 and F3, only W2 is significantly greater than W3 (p < 0.05), and the overall response follows W2 > W1 > W3 (Figure 1c). For fertilization level, under W2, all three fertilization treatments differ significantly (p < 0.05), following F2 > F3 > F1 (Figure 1c). Under W1, only F2 is significantly greater than F1 (p < 0.05). Under W3, F2 is significantly greater than F1 and F3 (p < 0.05), whereas no significant difference is detected between F3 and F1 (p > 0.05). In both cases, differentiation among levels of one factor was clearest only when the other factor was simultaneously at its optimum, and weakened once moisture or fertilization departed from W2 or F2, respectively. This implies that once either water or nutrient supply becomes suboptimal, it constrains overall crown growth enough to narrow the range over which the other factor’s effect can still be distinguished, underscoring that crown expansion depends on the joint, rather than independent, availability of water and nutrients.
In addition, the crown width increment under F2W1 is comparable to that under F3W2, while that under F1W2 is comparable to that under F3W1 (Table 2). The highest crown width increment occurs under F2W2, which is 41.7% greater than the maximum under the F1 fertilization level (F1W2), 18.6% greater than the maximum under the F3 fertilization level (F3W2), and 65.6% greater than CK. The lowest value occurs under F3W3, which is 5.8% lower than CK (Table 2).
3.1.4. Comprehensive Growth Evaluation
As shown in Figure 1d, the response surface of the comprehensive growth evaluation score to soil moisture regimes and fertilization exhibits a distinct unimodal pattern. The highest scores are concentrated at the intersection of the F2 fertilization level and the W2 soil moisture level, where the comprehensive evaluation score approaches 1, representing the maximum among all treatment combinations.
At the same fertilization level, the comprehensive evaluation score decreases as soil moisture deviates from W2 toward W1 or W3, indicating a unimodal response with the overall pattern of W2 > W1 > W3. At the same soil moisture level, the comprehensive evaluation score initially increases and then decreases with fertilization level, with the highest score consistently observed under the F2 treatment across all soil moisture levels, giving the overall pattern of F2 > F3 > F1. The lowest scores occur under the F1W3 and F3W3 treatments. Overall, the response surface is characterized by a high central region surrounded by lower values. This unimodal pattern may reflect opposing physiological constraints at the two ends of each gradient. Along the fertilization axis, F1 may supply insufficient nitrogen, phosphorus, and potassium to support photosynthetic capacity and carbon assimilation fully. In contrast, the additional nutrients supplied under F3 may exceed what the trees can currently convert into growth. Along the moisture axis, W3 may exhibit stomatal limitation of photosynthesis under water deficit, whereas W1, despite having a greater water supply, may correspond to a wetter root environment with comparatively lower aeration than the balance achieved at W2. The convergence of the optimal ranges for F2W2 suggests that this treatment combination most closely matches the physiological water and nutrient requirements of Korean pine at the current growth stage.
3.2. Effects of Water and Fertilizer Coupling on the Yield of Korean Pine Nut-Timber Plantations
3.2.1. Cone Number per Tree
As shown in Figure 2a,b, the F2 treatment consistently produces more cones per tree than the F1 and F3 treatments across all soil moisture levels. Under all three fertilization levels, the response curves first increase and then decrease as soil moisture increases, reaching their maxima under W2. Compared with 2023, the number of cones per tree increases markedly across all treatments in 2024, and treatment differences become more pronounced, indicating that the promoting effect of water and fertilization coupling on cone formation becomes stronger with increasing treatment duration.
Figure 2.
Yield responses of Korean pine nut-timber plantations to water and fertilization gradients during 2023–2024. (a) Cone number per tree in 2023. (b) Cone number per tree in 2024. (c) Total cone mass per tree in 2023. (d) Total cone mass per tree in 2024. (e) Total pine seed mass per tree in 2023. (f) Total pine seed mass per tree in 2024. (g) Thousand-seed weight in 2023. (h) Thousand-seed weight in 2024. Different uppercase letters within the same column indicate significant differences among fertilization treatments (p < 0.05), while different lowercase letters within the same column indicate significant differences among moisture regimes (p < 0.05). Different uppercase letters at the same irrigation regime indicate significant differences among fertilization treatments (p < 0.05), while different lowercase letters within the same fertilization treatment indicate significant differences among irrigation regimes (p < 0.05).
Regarding soil moisture regimes, the number of cones per tree consistently follows the pattern W2 > W1 > W3 under all fertilization levels. In 2023, the W2 treatment produced significantly more cones per tree than the W1 and W3 treatments (p < 0.05), whereas no significant difference was observed between W1 and W3 (p > 0.05). In 2024, the W1 treatment also produced significantly more cones per tree than the W3 treatment (p < 0.05). For fertilization, the number of cones per tree under different soil moisture levels follows the order F2 > F3 > F1 in 2024 (p < 0.05), and the difference between the F1 and F3 treatments increases with treatment duration.
The F1W3 treatment produces fewer cones per tree than CK in both years and is the only treatment combination showing a continuous decline relative to CK over the two years. The highest number of cones per tree is consistently observed under F2W2 in both years, and this advantage increases with treatment duration. Among all treatment combinations, F2W2 shows the largest increase (p < 0.01), followed by F2W1 and F3W2 (p < 0.05) (Figure 3a). In 2023, the number of cones per tree under F2W2 is 17.1% and 5.1% higher than the maximum values under F1 (F1W2) and F3 (F3W2), respectively, and 27.7% higher than CK. In 2024, the superiority of F2W2 becomes more pronounced. The number of cones per tree exceeds that of F1W2 and F3W2 by 42.5% and 16.3%, respectively, and exceeds CK by 88.5%. The lowest values are consistently recorded under F1W3, where the number of cones per tree is 1.5% and 4.1% lower than CK in the corresponding years.
Figure 3.
Interannual variation in yield traits of Korean pine nut-timber plantations during 2023–2024. (a) Cone number per tree. (b) Total cone mass per tree. (c) Total pine nut mass per tree. (d) Thousand-seed weight. * indicates significant differences (p < 0.05), and ** indicates highly significant differences (p < 0.01).
3.2.2. Total Cone Mass per Tree
As shown in Figure 2c,d, the F2 treatment consistently produces greater total cone mass per tree than the F1 and F3 treatments across all soil moisture levels. The response curves show an overall unimodal pattern, increasing initially and then declining, with all treatments reaching the maximum value under W2 conditions. Compared with 2023, total cone mass per tree increases markedly across all treatments in 2024, with greater separation among treatments.
Regarding soil moisture regimes, all fertilization levels show the same pattern of W2 > W1 > W3, with significant differences among water treatments in both years (p < 0.05). Regarding fertilization levels, the response pattern under W1 and W2 conditions in 2023 is F2 > F1 = F3, whereas significant differences occur among fertilization treatments under W3 conditions (p < 0.05). In 2024, fertilization treatments were ordered as F2 > F3 > F1 (p < 0.05).
Except for F1W3, total cone mass per tree under all water–fertilizer treatments is higher in 2024 than in 2023. The increase under F2W2 is the most pronounced (Figure 3b; p < 0.05), followed by F3W2 and F2W1 (Figure 3b; p < 0.05). In 2023, the total cone mass per tree under F2W2 is 24.0% and 11.2% higher than the maximum values under F1 and F3 treatments, respectively, and 47.4% higher than CK. In 2024, F2W2 shows an increase of 27.5%, with values 34.3% and 12.7% higher than those under F1W2 and F3W2, respectively, and 100.6% higher than CK. The lowest value occurs under F1W3 in both years, with values 5.1% and 13.4% lower than CK in 2023 and 2024, respectively.
3.2.3. Total Pine Nut Mass per Tree
As shown in Figure 2e,f, the F2 treatment consistently produces greater total seed mass per tree than the F1 and F3 treatments across all soil moisture levels. Under each fertilization level, total seed mass per tree follows the pattern W2 > W1 > W3, reaching its maximum under F2W2. The response curves show a unimodal pattern, increasing initially and then declining. Compared with 2023, all treatments show higher values and greater separation among treatments in 2024, indicating that the water–fertilization coupling effect becomes more pronounced in the second year.
Regarding soil moisture regimes, total seed mass per tree consistently follows the order W2 > W1 > W3 under all fertilization levels, and differences among soil moisture treatments are significant (p < 0.05). Regarding the fertilization effect, under W1 and W2 in 2023, the treatments were ranked as F2 > F1 = F3, whereas all fertilization treatments differ significantly under W3 (p < 0.05). In 2024, the treatments were ranked as F2 > F3 > F1 across all soil moisture levels (p < 0.05).
Except for F1W3, all treatments produce higher total seed mass per tree in 2024 than in 2023. The greatest interannual increase occurs under F2W2 (Figure 3c; p < 0.01), while significant increases are also observed under F2W1, F3W1, and F3W2 (Figure 3c; p < 0.05). In both years, the maximum total seed mass per tree is observed under F2W2. In 2023, the value under F2W2 is 27.7% and 14.4% higher than the highest values under F1 and F3, which occur at F1W2 and F3W2, respectively, and is 61.4% higher than CK. In 2024, the value under F2W2 increases by 34.7% relative to 2023 and is 45.7% and 19.2% higher than those under F1W2 and F3W2, respectively, while exceeding CK by 132.4%. The minimum value is consistently observed under F1W3, which is 2.1% and 10.7% lower than CK in 2023 and 2024, respectively.
3.2.4. Thousand-Seed Weight
The thousand-seed weight varies only slightly, with low data dispersion. As shown in Figure 2g,h, across all fertilization levels, thousand-seed weight consistently follows W2 > W1 > W3, and differences among soil moisture treatments are significant in both years (p < 0.05). Regarding fertilization, under W1 in 2023, F2 is significantly higher than F1 (p < 0.05). Under W2, F2, and F3 produce comparable thousand-seed weights, both significantly higher than F1 (p < 0.05). Under W3, F2 is significantly higher than both F3 and F1 (p < 0.05). In 2024, under W1, F3 increases to F2 levels, and both are significantly higher than F1 (p < 0.05). Under W2, F3 ranks between F2 and F1. Under W3, F1 recovers to the level of F3, and both remain significantly lower than F2 (p < 0.05).
The highest thousand-seed weight is consistently observed under F2W2, with significantly higher values in 2024 than in 2023 (Figure 3d; p < 0.05). In 2023, the maximum value under F2W2 was higher than those under F1W2, F3W2, and CK, with absolute differences accounting for 4.0%, 1.7%, and 6.5% of the F2W2 value, respectively. In 2024, the thousand-seed weight further increases, exceeding F1W2 and F3W2 by 6.6% and 2.7%, respectively, and CK by 12.9%. The lowest thousand-seed weight is consistently observed under F1W3, remaining 1.8% below CK in 2023 and 1.3% below CK in 2024. It is the only treatment that remains below CK throughout the study period.
3.3. Effects of Water and Fertilizer Coupling on Soil Nutrient Characteristics of Korean Pine Nut-Timber Plantations
As shown in Table 3 and Table 4, soil moisture, fertilization, and their interaction all have highly significant effects on soil pH (p < 0.01). Under the same fertilization level, soil pH first decreases and then increases as soil moisture declines, with the lowest pH consistently observed under W2 (Figure 4a). At each soil moisture level, soil pH generally decreases as fertilization rate increases (Figure 4a). At W2, all fertilization treatments differ significantly (p < 0.05), and pH decreases significantly as fertilization increases. At W1 and W3, pH under F3 is significantly lower than under F1 and F2, whereas no significant difference is found between F1 and F2 (p > 0.05). Soil pH is lower than that of CK in all treatments, with the lowest value under F3W2, which is 6.1% lower than CK.
Table 3.
Effects of water–fertilizer coupling on soil pH, total nitrogen, available phosphorus, and available potassium in Korean pine nut-timber forests in 2023.
Table 4.
Effects of water–fertilizer coupling on soil organic matter, nitrate nitrogen, ammonium nitrogen, and bulk density in Korean pine nut-timber forests in 2023.
Figure 4.
Variation in soil nutrient characteristics of Albeluvisol under different water and fertilization treatments in 2023. (a) Soil pH. (b) Total nitrogen content. (c) Available phosphorus content. (d) Available potassium content. (e) Soil organic matter content. (f) Nitrate nitrogen content. (g) Ammonium nitrogen content. (h) Soil bulk density. Different uppercase letters at the same irrigation regime indicate significant differences among fertilization treatments (p < 0.05), while different lowercase letters within the same fertilization treatment indicate significant differences among irrigation regimes (p < 0.05).
As shown in Table 3, soil moisture has a significant effect on total nitrogen (TN) content in the soil (p < 0.05), and fertilization has a highly significant effect (p < 0.01). In contrast, their interaction is not significant (p > 0.05). At the same fertilization level, no significant differences in TN are detected among soil moisture treatments under F1 or F2 (p > 0.05). Under F3, TN reaches its lowest value at W2, and only the difference between W2 and W1 is significant (p < 0.05), whereas all other comparisons are not significant (p > 0.05). At each soil moisture level, TN generally increases with increasing fertilization rate (Figure 4b). At W1 and W3, TN is highest under F3 and lowest under F1, with a significant difference between F1 and F3 (p < 0.05), whereas F2 does not differ significantly from F1 or F3 (p > 0.05). No significant difference is observed among fertilization treatments at W2 (p > 0.05). The highest TN content occurs under F3W1, which is 13.1% higher than CK, whereas the lowest occurs under F1W2, which is 0.7% lower than CK.
As shown in Table 3, soil moisture, fertilization, and their interaction all have highly significant effects on the available phosphorus (AP) content in the soil (p < 0.01). Under the same fertilization level, AP under F2 and F3 first decreases and then increases as soil moisture declines, following the order W1 > W3 > W2 (Figure 4c; p < 0.05). Under F1, AP is significantly higher at W1 than at W2 and W3 (p < 0.05), whereas no significant difference is observed between W2 and W3 (p > 0.05). At each soil moisture level, AP under W1 is significantly higher in F3 than in F1 and F2, whereas F1 and F2 do not differ significantly (p > 0.05). At W2, AP follows the order F3 > F1 > F2 (Figure 4c; p < 0.05), with the lowest value under F2. At W3, AP follows the order F3 > F2 > F1 (Figure 4c; p < 0.05). The highest AP content occurs under F3W1, which is 110.3% higher than CK, whereas the lowest occurs under F2W2, which is 15.9% lower than CK.
As shown in Table 3, soil moisture, fertilization, and their interaction all have highly significant effects on the available potassium (AK) content in the soil (p < 0.01). As soil moisture declines, AK under all fertilization treatments first decreases and then increases. Treatment differences narrow at W2 but widen at W3, indicating a stronger fertilization effect. Under the same fertilization level, AK under F2 and F3 follows the order W3 > W1 > W2 (Figure 4d; p < 0.05). Under F1, AK is also lowest at W2, although only W3 is significantly higher than W2 (p < 0.05). At each soil moisture level, AK under W1 and W3 increases with increasing fertilization rate, following the order F3 > F2 > F1 (Figure 4d; p < 0.05). At W2, AK follows the order F3 > F1 > F2 (Figure 4d; p < 0.05), with the lowest value under F2. The highest AK content occurs under F3W3, which is 26.2% higher than CK, whereas the lowest occurs under F2W2, which is 5.0% lower than CK.
As shown in Table 4, soil moisture and fertilization both have significant effects on soil organic matter (SOM) content (p < 0.05), whereas their interaction is not significant (p > 0.05). As irrigation decreases, SOM response curves remain relatively close, and treatment differences are much smaller than those for other soil nutrients. Under F1, no significant difference is detected among soil moisture treatments (p > 0.05). Under F2, SOM is highest at W1 and lowest at W2, whereas W3 does not differ significantly between treatments (p > 0.05). Under F3, SOM follows the order W1 > W3 > W2 (Figure 4e; p < 0.05), with the greatest reduction at W2, where the difference between F3 and the other fertilization treatments is most evident. At each soil moisture level, no significant difference is observed among fertilization treatments at W1 or W3 (p > 0.05). At W2, only F1 has a significantly higher SOM content than F3 (p < 0.05), whereas F2 does not differ significantly from F1 or F3 (p > 0.05). The highest SOM content occurs under F3W1, which is 4.8% higher than CK, whereas the lowest occurs under F3W2, which is 7.8% lower than CK.
As shown in Table 4, soil moisture, fertilization, and their interaction all have highly significant effects on soil nitrate nitrogen (NO3−-N) content (p < 0.01). Under the same fertilization level, NO3−-N first increases and then decreases as soil moisture declines, with the highest value at W2 and the lowest at W1 (Figure 4f). Significant differences are observed among all soil moisture treatments (p < 0.05). At each soil moisture level, NO3−-N increases steadily with increasing fertilization rate, following the order F3 > F2 > F1 (Figure 4f; p < 0.05). The highest NO3−-N content occurs under F3W2, which is 241.1% higher than CK, whereas the lowest occurs under F1W1, which is still 10.5% higher than CK.
As shown in Table 4, soil moisture, fertilization, and their interaction all have highly significant effects on soil ammonium nitrogen (NH4+-N) content (p < 0.01). Under the same fertilization level, NH4+-N shows an opposite trend to NO3−-N, first decreasing and then increasing as soil moisture declines (Figure 4g). The highest NH4+-N content occurs at W1 and the lowest at W2, with significant differences among all soil moisture treatments (p < 0.05). The greatest difference is observed at W1. At each soil moisture level, NH4+-N increases progressively with increasing fertilization rate, following the order F3 > F2 > F1 (Figure 4g; p < 0.05). The highest NH4+-N content occurs under F3W1, which is 160.0% higher than CK, whereas the lowest occurs under F1W2, which is 10.4% lower than CK.
3.4. Cluster Analysis of Growth, Yield, and Soil Nutrient Characteristics in Korean Pine Nut-Timber Plantations
The comprehensive relationships among growth, yield, and soil nutrient indicators under different water and fertilizer treatments are shown in Figure 5. Rows represent Korean pine growth, yield, and soil physicochemical indicators, while columns represent different water–fertilizer treatment combinations. The color gradient from blue to red indicates standardized values from low to high.
Figure 5.
Cluster analysis of the relationships between growth and yield and soil nutrient characteristics of Korean pine nut-timber plantations on Albeluvisol in 2023.
In the row-based clustering analysis, tree height increment, DBH increment, crown width increment, thousand-seed weight, cone number per tree, total cone mass per tree, and total seed mass per tree cluster with nitrate nitrogen. These indicators show high values under F2W2 and F3W2, but remain relatively low under F1 and CK. Nitrate nitrogen is the only soil nutrient indicator in this cluster, and its variation among treatments is generally consistent with that of the growth and yield indicators. The high-value regions of available potassium, available phosphorus, total nitrogen, and ammonium nitrogen are mainly concentrated under F3W1 and F3W3, showing an overall opposite color pattern to F2W2 in the corresponding treatment columns. Soil pH, organic matter, and bulk density show distinct variation among treatments. Bulk density has the lowest color value under F2W2, whereas organic matter and pH show the lowest color values under F3W2. The pH color value under CK is the highest among all treatments (Figure 5).
In the column-based clustering analysis, growth and yield indicators for F2W2 and F3W2 are generally located in the high color value region. F2W2 shows the lowest color value for bulk density, while available phosphorus and available potassium also show relatively low color values, indicating a relationship between plant growth performance and soil nutrient distribution patterns. Under F3W2, organic matter and pH both show the lowest color values. The indicators under F1W2, F1W1, F1W3, and CK generally show low color values, with similar growth and yield performances. F2W1 maintains medium to high levels of growth and yield indicators, whereas F2W3 approaches zero for color values. F3W1 and F3W3 show high color values for soil nutrient indicators but relatively low values for growth and yield indicators, indicating a mismatch between soil nutrient status and Korean pine growth and yield performance (Figure 5).
4. Discussion
4.1. Effects of Water and Fertilizer Regulation on the Growth Performance of Korean Pine Nut-Timber Plantations
The optimal growth and yield response under F2W2 is likely associated with the soil moisture conditions maintained at approximately 60% of field capacity (W2). Sufficient soil water favors the dissolution, diffusion, and mass-flow transport of mineral nutrients such as nitrogen, phosphorus, and potassium toward the root surface [49]. In contrast, active root uptake of these nutrients, together with rhizosphere microbial activity, depends on aerobic conditions maintained by adequate soil aeration and appropriate soil moisture. Within the sub-field-capacity range spanned by the three moisture regimes examined here, soil water content remains below the level at which free drainage occurs, so none of the treatments, including W1, represent a saturated or waterlogged condition. Nonetheless, the fraction of air-filled soil pore space still declines progressively as moisture content rises from W3 toward W1 [50], so increasing soil moisture across this range creates a trade-off between improved water availability and reduced soil aeration, with the overall effect on root-zone conditions depending on the balance between these processes. The nutrient supply under F2 may further enhance leaf photosynthetic capacity and maintain a high net photosynthetic rate, providing sufficient photosynthates and energy for tree growth [18]. Water and nutrient availability may act synergistically by improving nutrient transport efficiency and promoting photosynthate accumulation, thereby supporting the coordinated development of different growth organs [18,21]. These findings are consistent with previous studies showing that moderate water and fertilizer management promote the growth of other conifer species in China.
Although previous studies have mainly focused on conifer seedlings in northeastern and southwestern China, the reported water-nitrogen interaction patterns are highly consistent with the responses observed in the present study [51,52]. Earlier studies indicate that continuous increases in nitrogen application promote seedling growth and biomass accumulation when soil moisture remains above 60% of field capacity [51]. Once soil moisture falls below this threshold, water availability becomes the primary factor limiting fertilizer effectiveness, and additional nitrogen fails to enhance growth and may even have inhibitory effects [51]. Studies on Korean pine and Manchurian ash seedlings in the Changbai Mountains also show that excessive nitrogen application combined with water deficit suppresses root growth [53]. In contrast, moderate nitrogen application achieves higher biomass allocation efficiency. These findings are consistent with substantially poorer growth under F3W3, suggesting that high fertilizer inputs at 40% of field capacity not only fail to yield additional growth benefits but may also exert adverse effects, such as osmotic impairment of root water uptake from elevated ion concentration in the root-zone soil solution and disruption of the uptake balance among competing nutrient ions, both of which are examined further below.
In terms of growth performance, all growth variables under F3W2 remain lower than those under F2W2 (Figure 1), indicating that increasing the fertilizer level from F2 to F3 at 60% of field capacity does not produce proportional growth gains and that the marginal benefit of additional fertilizer input begins to decline. This pattern cannot be fully explained by moisture alone, because F3 remains lower than F2 even under W1 and W2, where soil water is not limiting (Table 2). A plausible moisture-independent contributor is that Korean pine, like most Pinaceae, depends on ectomycorrhizal (ECM) fungi to extend its effective absorptive surface. ECM development in pines is known to be suppressed by high nitrogen and phosphorus availability [54,55], including in P. koraiensis itself under long-term nitrogen addition [56]. If the larger nutrient input under F3 similarly constrains the fungal partner, the resulting loss of absorptive surface could offset the benefit of the extra nutrients supplied. In addition, because the three fertilization levels scale the same N:P2O5:K2O ratio, F3 supplies roughly 50% more of every nutrient than F2, a level likely to exceed what the trees can currently convert into growth. Part of this extra uptake may therefore represent luxury consumption, incurring a metabolic cost without a matching growth benefit and potentially disrupting the uptake balance among competing ions [17].
At 40% of field capacity, water availability becomes the primary factor limiting tree growth. The decline in soil matric potential weakens the driving force for root water uptake, reduces cell turgor, and directly restricts cell division and elongation in the shoot apical meristem, thereby suppressing height increment [57,58]. Water deficit may also reduce stomatal conductance through abscisic acid-mediated stomatal regulation [59], leading to lower intercellular CO2 concentration, reduced net photosynthetic rate [60], decreased photosynthate supply, and consequently reduced radial stem growth and crown expansion [61]. When high fertilizer input is combined with low soil moisture, ion concentration in the soil solution surrounding the roots may further increase, allowing osmotic stress and water deficit to act simultaneously and causing greater impairment of root function [62,63]. This explanation is supported by the significantly smaller increments in height, diameter, and crown width under F3W3 than under F2W3 (Figure 1). F3W3 is the only treatment combination in which DBH and crown width increments fall below those of CK, by 7.1% and 5.8%, respectively (Table 2), indicating that at 40% of field capacity, the additional fertilizer applied at F3 becomes actively detrimental to growth.
Under W1, which corresponds to 80% of field capacity, overall growth remains well above that of CK (Figure 1), confirming that this moisture level represents a substantial improvement in water availability relative to CK. Using the field capacity and soil bulk density values reported for this site (Table 4), air-filled porosity is estimated at approximately 37% under W1 and 45% under W2. It would remain at approximately 30% even at 100% of field capacity. All three values lie far above the approximately 10% air-filled porosity commonly identified as the threshold below which oxygen supply to roots and microorganisms becomes acutely limiting [50]. Because porosity declines progressively across this same range, from W2 toward W1 and toward field capacity, without approaching this threshold at any point examined or extrapolated here, there is no basis in these estimates for expecting field capacity to outperform W2 at this site; any comparatively minor aeration-related cost associated with W1 relative to W2 would be expected to persist or increase as moisture rises further toward field capacity. Gas diffusion through soil pores continues to increase with air-filled porosity even above the threshold for bulk soil oxygen limitation. Thus, a moderate but non-critical reduction in the efficiency of strictly aerobic microbial processes may still occur under W1, particularly within soil aggregates and the immediate root and rhizosphere microsites, while its influence on the bulk soil matrix is likely to remain limited. This interpretation is directly supported by our own nitrate nitrogen data (Figure 4f), where NO3−-N, an aerobic nitrification product positively associated with growth and yield (Figure 5), was highest under W2 and lowest under W1, a graded pattern consistent with a continuous efficiency effect and inconsistent with the sharp decline expected under genuine oxygen stress.
The F2 fertilizer level consistently produces the strongest growth promotion under most soil moisture conditions at this site (Table 2 and Figure 1), indicating that its nutrient supply adequately meets the nutritional requirements of Korean pine nut timber plantations at the current growth stage. In contrast, insufficient nutrient supply under F1 may limit photosynthesis and carbon assimilation [18,19], resulting in no significant differences between most F1 treatments and CK (Figure 1). These findings suggest that the nutrient supply under F1 is insufficient to satisfy the nutritional requirements of Korean pine nut timber plantations during the current developmental stage.
The growth-promoting effect of the high fertilizer level under F3 is strongly regulated by soil moisture, further indicating that adequate water availability is essential for maximizing fertilizer effectiveness. Under W2, overall growth follows the order F2 > F3 > F1 (Figure 1). Although F3 does not achieve the same growth as F2, adequate soil moisture helps reduce ion concentration in the soil solution. In contrast, adsorption by soil colloids provides additional buffering capacity, thereby limiting the adverse effects of high fertilizer application rates [64,65]. At 40% of field capacity, low soil water potential reduces nutrient diffusion toward the root surface, whereas high fertilizer input under F3 further increases ion concentration in the root zone [49]. These conditions may intensify the combined effects of osmotic stress and water deficit, resulting in greater impairment of root function [62]. Consequently, no significant differences are observed between F1 and F3 under this soil moisture condition. The measured soil data indicate that this site contains relatively high organic matter. Previous studies also report relatively high cation exchange capacity in similar soils in the region [66]. Together, these characteristics may enhance the adsorption and buffering of excess fertilizer ions, slow their accumulation in the soil solution, and partially alleviate the detrimental effects of excessive fertilizer application on root function [65,67].
A methodological consideration is that all experimental trees have undergone topping to induce multiple leaders, and therefore, no continuous main shoot is present. Consequently, the measured annual height increment represents extension growth of the tallest lateral branch within the crown rather than the conventional elongation of a single terminal shoot. Because the competitive hierarchy among lateral branches may change between years, the highest point identified in consecutive measurements may not reflect the continuous extension of the same branch, leading to some overestimation of the annual height increment. Therefore, the height increment reported in this study should be interpreted as an integrated indicator of vertical crown expansion, and differences in measurement methodology should be considered when comparing these results with conventional height growth data from untopped trees.
4.2. Regulation of Yield Formation and Interannual Dynamics by Water and Fertilizer Coupling
Beyond growth-related traits, the F2W2 treatment also represents the optimal water-and-fertilizer combination for two-year yield performance at this site. In 2024, the increase in total pine nut mass under F2W2 compared with CK was approximately 44% greater than the increase in cone number (Figure 2), indicating an amplification effect of water–fertilizer coupling on yield formation. The substantial increase in cone number is the primary contributor to yield improvement. At the same time, the enhanced thousand-seed weight produces a synergistic effect with cone production, further increasing total pine nut mass.
Kernel filling represents a physiologically costly process and is highly sensitive to nutrient availability [68,69]. Previous studies using carbon isotope pulse-labeling experiments have suggested that cone development depends strongly on continuous carbon input from adjacent vegetative branches rather than solely on photosynthates produced within cones [70]. This indicates that kernel filling may rely more heavily on sustained and coordinated supplies of carbon assimilation products and mineral nutrients than cone initiation. When water and nutrient availability become insufficient, Korean pine may preferentially reduce cone number to maintain relatively stable kernel filling. The optimal water–fertilizer conditions maintained by F2W2 provide sufficient support for this highly metabolic process, which may explain the increased thousand-seed weight and its synergistic contribution with cone number to total pine nut mass enhancement.
Previous research on Pinus pinea plantations has shown that fertilization can increase cone yield to approximately three times that of CK [22]. The 132.4% increase in total pine nut mass achieved by F2W2 in this study similarly indicates the strong yield-promoting effect of fertilization in nut-producing Pinus species. A subsequent study by the same research group reported that fertilization increased the total mass of seeds and kernels per cone by 20.9% and 18.6%, respectively, while reducing the proportion of aborted seeds [71]. These findings suggest that fertilization enhances yield formation in Pinus species by improving both cone production and seed developmental quality. This mechanism is consistent with the present study, in which F2W2 increased total pine nut mass through the combined enhancement of cone number and thousand-seed weight (Figure 3). Together, these results suggest that adequate nutrient supply is an important factor contributing to yield improvement in nut-producing Pinus species. However, the optimal treatment in this study was F2 rather than the highest fertilization level, F3 (Figure 2), indicating that Korean pine nut yield may exhibit a fertilization saturation threshold and that the benefits of excessive fertilization may be limited under current site conditions.
The importance of thousand-seed weight as an indicator lies in its ability to reflect whether root stress exceeds the physiological buffering capacity [72,73]. Under the most unfavorable treatment—F1W3—thousand-seed weight was 1.8% lower than CK in 2023 and 1.3% lower in 2024 (Figure 3). Both reductions remained within the buffering range, indicating that even under simultaneous water and nutrient limitations, the kernel filling capacity of Korean pine at this site did not exceed its physiological regulation capacity. Therefore, the decline in total cone yield was primarily due to a reduction in cone number.
Yield formation is regulated not only by current-year water and nutrient conditions but also by cumulative interannual effects [68]. At this site, the cone number was consistently highest under the 60% field capacity treatment across all fertilization levels. Water availability influences cone production mainly through resource acquisition and metabolic regulation [61]. Adequate soil moisture promotes nutrient dissolution and transport toward roots while maintaining carbon assimilation rates through stomatal regulation [61]. These processes jointly provide sufficient carbon and nitrogen substrates for early cone initiation and development [68]. Fertilization further enhances nutritional support for cone development by increasing chlorophyll content, improving photosynthetic enzyme activity, and increasing mineral nutrient availability [18].
Across the two-year observation period, cone number in all treatments at this site was generally higher in 2024 than in 2023, with greater separation among treatments (Figure 2a), indicating that enhanced carbon accumulation from first-year water–fertilizer treatments was further reflected in second-year cone development. This pattern represents a cross-season positive accumulation effect and agrees with the biological characteristics of the two-year cone development cycle of Korean pine. Such interannual yield regulation based on carbohydrate reserves is also observed in other nut-producing tree species [74]. Long-term studies have shown that higher concentrations of non-structural carbohydrates in overwintering branches are associated with greater fruit production in the following year [74,75]. The continuous decline in cone number under the CK over two years suggests that, without external water and nutrient inputs, gradual soil nutrient depletion may reduce Korean pine reproductive capacity.
The yield advantage of F2W2 over the two suboptimal combinations, F1W2 and F3W2 (Figure 2), showed a clear asymmetric expansion trend with increasing treatment duration. At this site, the advantage of F2W2 in cone number over F1W2 increased from 17.1% in 2023 to 42.5% in 2024, whereas its advantage over F3W2 increased only from 5.1% to 16.3% (Figure 3a). This pattern suggests that nutrient deficiency and excessive fertilization may suppress cone production through different mechanisms. Nutrient deficiency is more likely to cause progressively accumulated stress by consuming tree reserves, whereas excessive fertilization may induce current-season physiological constraints, resulting in weaker interannual amplification [76]. This interpretation agrees with field observations from middle-aged and young Korean pine plantations in this region. Previous studies have shown that needle and branch carbon, nitrogen, and phosphorus stoichiometry in regional Korean pine plantations generally indicates long-term nitrogen limitation [77]. Under persistent nitrogen limitation, insufficient fertilization reduces trees’ capacity to maintain additional nutrient reserves, allowing stress effects to accumulate across years [76]. In contrast, the negative effects of F3 are more likely associated with current-season impairment of root nutrient uptake, resulting in slower expansion of yield differences [17].
It should be noted that Korean pine exhibits typical masting behavior, with population-level cycles between high and low seed production occurring approximately every 3 to 5 years [4,78]. This interval exceeds the two-year observation period of this study. Therefore, the increasing divergence among treatments may also be partially influenced by differences in masting phases between 2023 and 2024. In addition, F1W3 was the only treatment that remained consistently lower than CK over both years (Figure 2). The combined limitations of low fertilization and low water availability reduced nutrient transport efficiency and carbon assimilation, resulting in persistently lower cone production than in CK [61]. This finding agrees with previous studies suggesting that combined drought and nitrogen limitation can continuously suppress carbon assimilation in Korean pine.
A further limitation concerns the quantification of irrigation water applied under each treatment. As described in Section 2.3, soil moisture was checked at fixed seven-day intervals throughout each growing season. Irrigation depths were calculated and delivered based on the TDR-measured deficit relative to each treatment’s target at that time point, with event-specific application depths (Equations (1)–(6)). However, the itemized and cumulative records of volumes actually delivered at each irrigation event across the two growing seasons could not be recovered, precluding calculation of absolute irrigation depths (mm per event or per season) or seasonal water-use efficiency (yield gain per unit of water applied). Consequently, although the present results clearly demonstrate that F2W2 produced the greatest growth and yield response among all treatments, we are unable to quantify the water cost associated with achieving this response, which would be valuable for assessing the practical, field-level efficiency of this water–fertilizer regime. This limitation does not affect the validity of the relative treatment comparisons reported here, since the intended soil moisture gradient among W1, W2, and W3 was independently verified and maintained via TDR monitoring at fixed intervals throughout both growing seasons. Future studies should maintain continuous, itemized irrigation logs alongside soil moisture monitoring to enable direct calculation of water-use efficiency and support cost–benefit assessment of water–fertilizer management strategies for Korean pine nut-timber plantations.
4.3. Responses of Soil pH to Water and Fertilizer Coupling
The physiological mechanisms underlying growth and yield responses are ultimately rooted in changes in soil water and nutrient environments. Responses in soil physicochemical properties and nutrient availability provide environmental explanations for the effects of water–fertilizer coupling.
At the same fertilization level exhibit a decreasing-then-increasing trend along the water gradient, with the lowest pH at W2 (Figure 4a). This pattern is mainly attributed to the critical regulation of soil moisture on nitrification processes [79]; 60% field capacity provides a favorable environment for nitrification, promoting the highest activity of ammonia-oxidizing microorganisms (AOB and AOA) and maximizing the oxidation of NH4+-N to NO3−-N [80,81]. Each mole of NO3−-N produced during nitrification results in the net release of approximately 2 mol H+ [81]. Meanwhile, under W2 conditions, active NH4+-N uptake by plant roots requires the release of H+ into the rhizosphere to maintain cellular charge balance [82]. Continuous H+ accumulation from these two pathways intensifies soil acidification, consistent with large-scale observations in agricultural and forest ecosystems across China, which identify increased nitrogen inputs as important drivers of regional soil acidification [83].
At 80% field capacity, air-filled porosity is estimated to remain well above the range at which oxygen supply becomes acutely limiting, suggesting that this pattern is unlikely to reflect severe aeration stress. Instead, the higher soil moisture under W1 may have caused a moderate, non-critical reduction in nitrification activity, potentially occurring at the scale of soil aggregates or the immediate rhizosphere, with limited effects on the bulk soil matrix. Consequently, H+ production associated with nitrification may have been lower under W1 than under W2, contributing to the relatively higher soil pH observed under W1. This pattern further supports reduced nitrification efficiency under W1. At field capacities below 40%, overall microbial activity and substrate diffusion are restricted by low soil water availability, thereby reducing nitrification intensity and maintaining relatively higher pH values [84]. The F3W2 treatment exhibits the greatest pH reduction (Figure 4a), likely because high fertilization provides abundant NH4+-N substrates for nitrifying microorganisms. Combined with the favorable moisture condition of 60% field capacity, this promotes the highest H+ production rate through nitrification.
Because nitrifying microorganisms are sensitive to soil pH, with nitrification generally favored under less acidic conditions, the slightly higher pH observed under W1 and W3 may have contributed to variation in nitrification rates. However, the pH differences among treatments were relatively small, and the observed nitrification pattern did not correspond to the pH gradient. If pH were a major factor controlling nitrification in this study, higher nitrification rates might be expected under W1 and W3, where soil pH was relatively higher than under W2. Therefore, the observed pattern may be more closely associated with differences in soil moisture and aeration, while the accompanying changes in pH may have partly resulted from these soil environmental conditions.
To assess whether the observed pH differences were associated with water–fertilizer treatments beyond background temporal variation, we compared the 2023 measurements with baseline soil pH determined before treatment implementation in 2022. Relative to the baseline, CK and most low-to-moderate fertilization treatments showed a broadly similar, modest increase in pH over the two-year period, suggesting a general temporal trend affecting most plots. Against this background trend, soil pH declined below the baseline under higher fertilizer inputs, particularly at W2, where soil moisture conditions were most favorable for nitrification, with a smaller decline also observed under F3W1. At each moisture level, the deviation from baseline became progressively more negative as fertilization increased from F1 to F3. This fertilizer-associated decline was greatest at W2, intermediate at W1, and minimal at W3, consistent with the proposed ranking of nitrification activity across moisture levels. Because the irrigation water source, delivery system, and rain-exclusion film were identical among F1, F2, and F3 at each moisture level, the fertilizer-dose-dependent pattern is unlikely to be explained by differences in irrigation water chemistry or ambient conditions shared among treatments. Instead, the pattern supports a contribution of fertilizer- and moisture-dependent nitrification to the observed pH decline. This interpretation is further supported by the correspondence within our dataset between the treatment showing the greatest pH decline and that showing the greatest NO3−-N accumulation.
4.4. Nitrogen Transformation Characteristics Under Water and Fertilizer Coupling
Ammonium nitrogen (NH4+-N) and nitrate nitrogen (NO3−-N) are the two inorganic nitrogen forms with the fastest turnover rates and largest seasonal fluctuations in soils. Previous monitoring of soil nitrogen dynamics during the growing season in broadleaved Korean pine mixed forests in northeastern China showed that soil NO3−-N content was highest in the early growing season and gradually declined until the end of the season, whereas NH4+-N exhibited an opposite pattern with higher concentrations during the late growing season [85]. These findings indicate that the peak responses of the two forms to fertilization are temporally asynchronous, and neither maintains fertilization-induced elevated levels at the end of the growing season. In situ observations from agricultural systems similarly demonstrated that soil NH4+-N generally reaches its maximum within 5 to 10 days after a single fertilization event, whereas NO3−-N peaks approximately 10 to 20 days later, followed by gradual declines toward a new dynamic equilibrium [86]. Incubation experiments further revealed that 55% to 95% of the cumulative soil mineralization following fertilization occurs within the first 14 days, after which the mineralization rate stabilizes [87].
In the present study, soil samples were collected approximately three months after topdressing and more than five months after basal fertilization. Moreover, identical basal and topdressing fertilization schedules were applied for two consecutive years (2022 and 2023), suggesting that residual effects from the previous fertilization season may also contribute to the measured values. Previous reviews have shown that residual effects of nitrogen fertilization in agricultural soils can remain detectable for at least three subsequent growing seasons [88]. Therefore, the measured NO3−-N and NH4+-N concentrations are unlikely to represent transient peak responses following basal or topdressing fertilization. Instead, they should be interpreted as the seasonal net accumulation or depletion status at the end of the growing season, following two consecutive years of repeated fertilization inputs, resulting from the combined effects of nitrification, denitrification, microbial immobilization, root uptake, and leaching [89]. These values reflect the cumulative effects of nitrogen inputs, soil transformations, nitrogen losses, and plant uptake throughout the fertilization period [88]. This interpretation does not affect the comparability of relative differences among water–fertilizer treatments at the same sampling time. The variation patterns among water regimes, therefore, reflect the cumulative regulation of soil moisture conditions on nitrification and denitrification processes throughout the growing season.
In this study, NO3−-N and NH4+-N exhibited opposite responses to water and fertilization treatments, with the two forms following inverse patterns across the water gradient (Figure 4f,g). NO3−-N reached the highest concentration under W2 and the lowest under W1, whereas NH4+-N showed the opposite trend, with the highest concentration under W1 and the lowest under W2. Both nitrogen forms reached their maximum absolute values under F3 fertilization. This complementary pattern was mainly associated with the regulation of soil moisture conditions on nitrification processes [79]. Maintaining soil moisture at 60% of field capacity provides an optimal balance between soil aeration and substrate diffusion, thereby maximizing NH4+ oxidation to NO3− and promoting nitrate accumulation [80,81]. As discussed in Section 4.1, air-filled porosity under W1 is estimated to remain well above the range at which bulk soil oxygen supply becomes acutely limiting, so the comparatively greater NH4+ accumulation observed under W1 is likely consistent with a moderate, non-critical reduction in nitrification efficiency, as locally oxygen-limited microsites can persist when the surrounding bulk soil remains well aerated and below saturation. The correspondingly reduced NO3− pool under W1 may additionally reflect a modest contribution from denitrification occurring within these same oxygen-limited microsites [80,84]. Under W3, soil aeration is comparatively unrestricted, but limited water availability instead restricts the diffusion of NH4+ to nitrifying microorganisms, resulting in an intermediate level of NO3− accumulation. Therefore, the overall pattern follows W2 > W3 > W1 (Figure 4f,g).
The F3W2 treatment resulted in the highest NO3−-N accumulation at this site (Figure 4f,g), indicating that abundant nitrogen substrates combined with favorable nitrification conditions promoted nitrate accumulation. Because F3 supplies substantially more NH4+ substrate than F1 or F2, even a moderate, non-critical reduction in nitrification efficiency described above for W1 is sufficient to leave a large absolute pool of unconverted NH4+ under F3W1, without requiring severe or acute suppression of the nitrifying community. Consistent with this graded, non-acute interpretation, significant differences in NO3−-N among fertilization treatments were still observed under W1 (Figure 4f), indicating that nitrification remained active even under the highest soil moisture level examined.
Unlike rapidly cycling inorganic nitrogen forms such as NO3−-N and NH4+-N, total nitrogen (TN) represents a larger and slower-turnover nitrogen pool. Its end-of-season concentration is therefore less affected by specific sampling timing and provides a more stable indicator of nitrogen balance at the growing-season scale [87]. At this site, soil TN under F3 fertilization was highest under W1 and lowest under W2, consistent with NH4+-N dynamics (Figure 4b). This indicates that TN accumulation under high nitrogen input conditions was largely influenced by NH4+-N retention. Under W2, although nitrogen input under F3 was substantially higher than that under F1 and F2, no significant differences in TN were observed among fertilization treatments (Table 3; p > 0.05). The low sensitivity of TN to fertilization levels at 60% field capacity suggests that nitrogen was efficiently cycled within the soil system under these moisture conditions. Exogenous nitrogen inputs may have been rapidly redistributed through coupled processes involving mineralization, nitrification, and plant uptake [90,91], resulting in similar soil TN equilibrium levels among fertilization treatments. The enhanced nitrogen assimilation capacity at 60% of field capacity may have offset differences in nitrogen accumulation resulting from fertilizer inputs. However, under W1 and W3 conditions, TN under F3 was significantly higher than that under F1 (Figure 4b), indicating that plant and microbial nitrogen assimilation may have been restricted under non-optimal moisture conditions, leading to greater retention of externally supplied nitrogen in soil TN pools [81,84]. These comparisons suggest that maintaining soil moisture at 60% of field capacity may promote more efficient nitrogen utilization. This pattern is consistent with previous nitrogen addition experiments in Korean pine plantations, where soil TN did not consistently differ significantly among nitrogen-addition gradients under continuous nitrogen inputs. This phenomenon was attributed to enhanced activities of key nitrogen-cycle hydrolytic enzymes with increasing nitrogen addition, which simultaneously accelerated nitrogen input, biological assimilation, and mineralization losses, thereby masking differences among fertilization treatments at the TN level [92].
In this study, soil sampling was conducted only once at the end of the growing season. Although this approach reflects the net effects of nitrogen accumulation and depletion under different water–fertilizer coupling treatments, it cannot capture the short-term peak dynamics and transformation rates of NO3−-N and NH4+-N following the July topdressing. It also limits the ability to distinguish between current-year fertilization effects and residual nitrogen from previous fertilization seasons. Future studies should establish continuous sampling schedules after basal fertilization and each topdressing event, combined with techniques such as 15N isotope tracing [88], to clarify the effects of water–fertilizer coupling on peak nitrogen responses and nitrogen use efficiency in Korean pine plantation soils. Such approaches will provide a more comprehensive understanding of the temporal mechanisms underlying the transformation of soil nitrogen regulated by interactions between water and fertilizer.
4.5. Effects of Water and Fertilizer Coupling on Available Phosphorus, Available Potassium, and Soil Organic Matter Dynamics
The highest available phosphorus (AP) content is observed under the F3W1 treatment (Figure 4c), primarily attributable to restricted plant phosphorus uptake relative to the high phosphorus input supplied under F3. This is consistent with a moderate, non-critical reduction in root metabolic efficiency, which may primarily affect the active, respiration-dependent component of nutrient uptake while soil p availability may remain relatively unaffected. This reduction may modestly limit the capacity of roots to absorb the high phosphorus input under F3 [93]. This comparatively limited plant uptake, combined with continued high phosphorus fertilizer input under F3, results in AP accumulation in the soil [93].
The lowest AP content is observed under the F2W2 treatment. At 60% field capacity, AP content follows the order F3 > F1 > F2, with significant differences among all treatments (Figure 4c; p < 0.05). The AP content under F2W2 further decreases relative to CK, indicating an extremely high biological phosphorus uptake efficiency. Under these conditions, the optimal water–fertilizer combination strongly promotes Korean pine root and ectomycorrhizal fungal growth [94]. The developed fungal hyphal network may expand the nutrient acquisition area and enhance synergistic phosphorus uptake by plants and fungi [95]. Consequently, phosphorus consumption under F2W2 exceeds that under F1W2 despite the lower fertilizer input in F1W2. Under F1W2, nitrogen deficiency restricts plant growth and fungal activity [91], resulting in lower phosphorus consumption and higher residual AP content. Although F3W2 has high phosphorus uptake efficiency, excessive initial phosphorus input still leaves substantial residual phosphorus in the soil. Therefore, AP reduction under F2W2, below CK level (Figure 4c), indicates the highest nutrient transfer efficiency for this treatment combination.
The highest available potassium (AK) content is observed under the F3W3 treatment (Figure 4d). Under this condition, high potassium fertilizer inputs provide sufficient potassium, while 40% field capacity may reduce potassium loss through downward leaching with soil water [96]. Meanwhile, water deficit induces stomatal closure and reduces transpiration, thereby restricting potassium transport to the roots via water flow [90,97]. The root potassium uptake capacity may decrease, contributing to substantial potassium accumulation in the rhizosphere [98,99]. The lowest AK content is also observed under F2W2 (Figure 4d). At 60% field capacity, AK shows a depletion pattern similar to AP, with residual potassium under F2 lower than under F1. The biological mechanism underlying this pattern is largely consistent with the phosphorus depletion mechanism described above. F2W2 provides optimal water and nutrient conditions, greatly enhancing transpiration-driven nutrient transport and root potassium uptake capacity [100,101], resulting in greater potassium consumption than under F1W2. In contrast, nitrogen deficiency under F1W2 limits plant growth and reduces potassium consumption. The F3W2 treatment maintains relatively high residual potassium due to excessive initial fertilizer input. Overall, F2W2 induces the strongest depletion of AK and AP, with both values lower than in CK (Figure 4c,d). The intensive consumption of soil phosphorus and potassium, two major mineral nutrients, demonstrates that F2W2 represents an optimal regulation strategy for improving soil nutrient utilization efficiency.
Water and fertilization effects on soil organic matter (SOM) at this site operate additively, since the water–fertilizer interaction term is not statistically significant. The treatment-combination patterns described below therefore reflect the joint effects of two independent main effects, with no statistical evidence of a combination-specific synergistic response. Soil organic matter (SOM) at this site shows the greatest decline under F3W2 and a slight increase under F3W1 (Figure 4e), 60% of field capacity independently favors a soil water–air balance suited to aerobic decomposition by heterotrophic microorganisms, and high fertilizer input under F3 independently increases available nitrogen and microbial metabolic activity [102]. The combination of these two main effects corresponds to the most pronounced SOM decline, observed under F3W2. The higher soil moisture under W1 may have caused a moderate reduction in aerobic heterotrophic decomposition relative to W2, without inducing critical oxygen limitation, thereby reducing SOM loss and contributing to the greater SOM retention observed under F3W1.
Nitrogen addition may stimulate microbial activity and accelerate SOM decomposition, a phenomenon known as the priming effect [102,103]. In this study, fertilization has a significant main effect on SOM, with SOM content generally decreasing as fertilizer input increases. This pattern agrees with the expected direction of the priming effect and provides preliminary evidence supporting this mechanism. However, the non-significant water–fertilizer interaction indicates that fertilization effects on SOM do not vary among water gradients at a statistically detectable level. This result does not exclude the priming effect, as it is primarily reflected in the main effect of fertilization and does not require a significant water–fertilizer interaction. The extent to which this effect drives observed SOM changes requires further verification through direct measurements of microbial biomass carbon or the application of 13C or 14C stable isotope tracing techniques [70,104].
4.6. Associations Between Growth, Yield, and Soil Nutrient Characteristics
The clustering analysis reveals patterns of association among growth, yield, and soil nutrient characteristics (Figure 5), providing an integrated perspective on the mechanisms underlying water–fertilizer coupling effects and supporting the previous discussion that growth and yield traits jointly respond to water and nutrient environments. The seven growth and yield indicators of Korean pine are grouped with nitrate nitrogen in the same cluster, with their high-value ranges occurring under the F2W2 and F3W2 treatments. Ammonium nitrogen, total nitrogen, available phosphorus, and available potassium form another cluster, with high values mainly concentrated under F3W1 and F3W3, showing a clear negative association with growth and yield indicators. Within this cluster, total nitrogen variation at high fertilization levels is mainly driven by ammonium nitrogen, as their trends are highly consistent, which explains the classification of total nitrogen into this group. As discussed previously, the simultaneous high values of NO3−-N and growth and yield traits result from their common response to the optimal soil water–air balance under 60% field capacity. Therefore, NO3−-N concentration can serve as a practical indicator for monitoring favorable water–fertilizer coupling conditions. However, it should not be interpreted as a direct representation of the nitrogen acquisition strategy of Korean pine.
The accumulation of high values in this nutrient cluster reflects two contrasting sets of constraints on plant nutrient uptake operating at opposite ends of the soil moisture gradient. Under the F3W1, the reduced root activity, combined with the high NH4+ substrate supply under F3, results in substantial NH4+ accumulation and limited plant nitrogen uptake [105]. The same comparatively reduced root metabolic activity likely also limits phosphorus uptake, allowing the high phosphorus input under F3 to accumulate as available phosphorus in the soil [106], while total nitrogen simultaneously reaches its maximum under F3W1 for the same reason (Figure 4b). Available potassium differs from these nutrients, with its highest values occurring under F3W3 (Figure 4d), resulting from reduced leaching loss, weakened transpiration-driven nutrient transport, and decreased root absorption capacity [90,97]. Because water conditions that deviate from the optimal W2 range reduce the active assimilation capacity of Korean pine roots, excessive nutrients accumulate in forms that plants cannot efficiently utilize, ultimately leading to high soil nutrient availability and low yield performance [84,106]. Consistent with the observation that available phosphorus and available potassium under F2W2 are lower than in CK, while remaining higher than CK under F3W2, and for phosphorus, under F1W2 as well (Figure 4c,d), rapid soil nutrient depletion due to intensive plant uptake indicates that nutrient transfer efficiency between soil and plants increases specifically where water and fertilization are simultaneously at their optimal levels. This process is a key criterion for evaluating the effectiveness of water–fertilizer management.
Regarding potassium management, although the fertilizer formulation used in this study follows an N:P2O5:K2O ratio of 2:3:1, with potassium inputs generally lower than nitrogen and phosphorus inputs, available potassium still show clear and statistically robust differences among treatments at this site. This pattern provides valuable information for potassium management in Korean pine nut-timber plantations. The site’s illitic clay fraction is associated with a large, slowly equilibrating reserve of non-exchangeable interlayer potassium that can buffer the exchangeable, plant-available potassium pool over time.
For this site, the low-potassium fertilization strategy is generally feasible in the short term, but long-term potassium balance requires continuous attention. Previous studies indicate that even soils not traditionally classified as potassium-deficient can gradually develop potassium depletion when nitrogen and phosphorus inputs dominate, and potassium supplementation remains limited over extended periods, with this trend becoming more pronounced under high-yield conditions [107,108]. In this study, the F2W2 treatment achieves the highest growth and yield performance (Figure 5). In contrast, the available phosphorus and available potassium under this treatment are lower than in CK (Figure 4c,d), indicating that plants have begun to consume soil nutrient reserves under high-productivity conditions. If the F2W2 water–fertilizer combination is continuously applied, together with nutrient removal from cone and seed harvesting, the site’s current potassium reserves may gradually decline under long-term intensive management. Therefore, available potassium should be incorporated into regular monitoring programs and reassessed periodically rather than concluding that potassium supplementation is unnecessary based solely on short-term experimental results. Studies on continuous plantation management also demonstrate that phosphorus and potassium contents generally decline with increasing cultivation duration, although the magnitude of decline varies with site conditions and management practices [109]. These findings further indicate that potassium fertilization strategies for Korean pine nut-timber plantations should be dynamically adjusted according to soil type and management intensity.
This study has several limitations that should be considered when interpreting the results. First, soil characterization was confined to the upper 0–40 cm soil profile. Both TDR monitoring and soil chemical sampling were restricted to this depth, so differences in soil moisture and aeration dynamics at greater depths cannot be entirely ruled out. The 0–40 cm layer corresponds to the zone where fine, actively absorbing roots of Korean pine are concentrated, and was also the depth used for soil chemical measurements in this study. This depth range, therefore, provides the most relevant basis for interpreting the observed responses in tree growth, yield, and soil nutrient status. Second, the soil moisture treatments (W1, W2, and W3) were defined as fixed percentages of field capacity. Although this framework allowed the experimental water regimes to be consistently imposed and compared, the absence of a direct measurement of the soil wilting point limits the characterization of the dry end of the soil-water gradient in terms of depletion-based water stress or plant-available water. This limitation should be considered when interpreting the water-stress responses observed under W3 (40% of field capacity). Future studies incorporating direct measurements of the soil wilting point could further characterize the soil-water gradient in terms of plant-available water and complement the FC-based framework used in the present study.
5. Conclusions
This study demonstrated that water–fertilizer coupling strongly regulated growth, yield, and soil nutrient characteristics in mature Korean pine (Pinus koraiensis) nut-timber plantations established on Albeluvisol in northeastern China. Among the tested treatments, F2W2 (100 kg N, 150 kg P2O5, and 50 kg K2O per hectare per year, with an N:P2O5:K2O ratio of 2:3:1, combined with irrigation maintaining 60% of field capacity) consistently produced the most favorable responses in tree growth, cone yield, and soil conditions. These results indicate that balanced water and fertilizer management is more effective than excessive resource inputs for improving plantation productivity and maintaining soil nutrient sustainability. Because prior water–fertilizer research on this species has focused mainly on seedlings or seed orchards, leaving mature nut-timber stands largely unexamined, these results extend the coupling framework to the stage where growth and reproduction jointly drive nutrient demand.
For plantation management, water regime should be considered a primary component of water–fertilizer management in Korean pine nut-timber plantations, with fertilizer inputs adjusted according to soil moisture conditions rather than maximized. At 60% of field capacity, F2 outperformed F3 (50% more fertilizer) in nearly every growth and yield indicator. F2W2 combination also left lower residual soil phosphorus and potassium than CK, indicating more efficient nutrient uptake rather than accumulation. This mirrors the broader shift toward coordinated, site-specific water–fertilizer management in precision agriculture and forestry. On similar-type soils, growers may therefore achieve higher wood and nut productivity at lower fertilizer costs by prioritizing irrigation scheduling over higher fertilization rates, while monitoring available potassium and diameter growth over time to detect early signs of nutrient depletion under intensive management. These recommendations are drawn from a two-year dataset, however, and because Korean pine masts over multiple years, longer-term observations across complete masting cycles are needed to confirm the stability of these yield responses under different management regimes, ideally combined with isotopic tracing to clarify the nutrient-cycling mechanisms underlying the F2W2 advantage.
Author Contributions
X.L. designed and conducted the experiments, performed field investigations and laboratory analyses, processed and analyzed the data, and prepared the original manuscript draft. X.C. supervised the research, provided guidance on experimental design and data interpretation, and revised the manuscript. All authors have read and agreed to the published version of the manuscript.
Funding
We thank the Key Research and Development Program of Heilongjiang Province for supporting this work (GA21B005).
Data Availability Statement
Available from the corresponding author on request.
Conflicts of Interest
The authors declare no conflicts of interest. The funders had no role in the design of the study; in the collection, analyses, or interpretation of data; in the writing of the manuscript; or in the decision to publish the results.
References
- Chen, X.; Xiao, K.; Deng, R.; Wu, L.; Cui, L.; Ning, H.; Ai, X.; Chen, H. Projecting the Future Redistribution of Pinus koraiensis (Pinaceae: Pinoideae: Pinus) in China Using Machine Learning. Front. For. Glob. Change 2024, 7, 1326319. [Google Scholar] [CrossRef] [Scilit]
- Petrenko, T.Y.; Korznikov, K.A.; Kislov, D.E.; Belyaeva, N.G.; Krestov, P.V. Modeling of Cold-Temperate Tree Pinus koraiensis (Pinaceae) Distribution in the Asia-Pacific Region: Climate Change Impact. For. Ecosyst. 2022, 9, 100015. [Google Scholar] [CrossRef] [Scilit]
- Jia, Y.; Zhang, L.; Tan, X.; Wang, W.; Zhang, H. Studies on Technique for Suitable Density Control of Pinus koraiensis Stand Used for Fruit and Wood. Sci. Silvae Sin. 2006, 42, 51–56. [Google Scholar]
- Wu, H.; Zhang, J.; Rodríguez-Calcerrada, J.; Salomón, R.L.; Yin, D.; Zhang, P.; Shen, H. Large Investment of Stored Nitrogen and Phosphorus in Female Cones Is Consistent with Infrequent Reproduction Events of Pinus koraiensis, a High Value Woody Oil Crop in Northeast Asia. Front. Plant Sci. 2023, 13, 1084043. [Google Scholar] [CrossRef] [Scilit]
- Baker, E.J.; Miles, E.A.; Calder, P.C. A Review of the Functional Effects of Pine Nut Oil, Pinolenic Acid and Its Derivative Eicosatrienoic Acid and Their Potential Health Benefits. Prog. Lipid Res. 2021, 82, 101097. [Google Scholar] [CrossRef] [Scilit]
- Hao, J.; Hou, D.; Yu, W.; Zhang, H.; Guo, Q.; Zhang, H.; Xiong, H.; Li, Y. Metabolomic and Transcriptomic Analysis of the Synthesis Process of Unsaturated Fatty Acids in Korean Pine Seed Kernels. Food Chem. 2025, 481, 143895. [Google Scholar] [CrossRef] [Scilit] [PubMed]
- Zhang, W.; Li, C.; Li, Z.; Hu, N.; Cao, G.; Huang, J.; Yang, P.; Liu, H.; Bai, H.; Zhang, H. Effects of Different Plant Growth Regulators on Growth Physiology and Photosynthetic Characteristics of Pinus koraiensis Seedlings. Plants 2025, 14, 3671. [Google Scholar] [CrossRef] [Scilit]
- Wang, L.; Liu, X.; Xu, D.; Chen, C.; Nie, G.; Xiang, B. Advances in Regulation Techniques for Vegetative and Reproductive Growth of Tress Species. World For. Res. 2019, 32, 6–12. [Google Scholar]
- Guo, Q.; Duan, W.; Chen, L.; Liu, Y.; Li, C.; Yu, Y.; Li, S.; Li, Y. Effects of Simulated Litter Addition, and Nitrogen and Phosphorus Deposition on Ecological Stoichiometry of Pinus koraiensis Litter. J. Plant Nutr. Fertil. 2021, 27, 1222–1233. [Google Scholar]
- Wolff, R.L.; Bayard, C.C. Fatty Acid Composition of Some Pine Seed Oils. J. Am. Oil Chem. Soc. 1995, 72, 1043–1046. [Google Scholar] [CrossRef] [Scilit]
- Baud, S.; Lepiniec, L. Physiological and Developmental Regulation of Seed Oil Production. Prog. Lipid Res. 2010, 49, 235–249. [Google Scholar] [CrossRef] [Scilit]
- Zhao, M.; Zhang, Q.; Li, Y.; Gu, W.; Wang, Z.; Zhang, Y.; Lu, Q.; Bao, Y.; Gong, Z.; You, X.; et al. Unraveling Biological Characteristics of Flower Bud Differentiation and Reproductive Organ Development, Advancing Genetic Improvement and Ameliorating Cone Yield in Pinus koraiensis. Ind. Crops Prod. 2025, 227, 120815. [Google Scholar] [CrossRef] [Scilit]
- Rizheng, C.; Yan, H.; Hongying, Y.; Jili, Z.; Xiaohong, W. Thoughts on the Transformation and Development of the Great Xing’an Mountains and the Xiaoxing’an Mountains under the Background of “Double Carbon”. J. Temp. For. Res. 2022, 5, 70–75. [Google Scholar]
- Richardson, D.M. Ecology and Biogeography of Pinus; Cambridge University Press: Cambridge, UK, 1998. [Google Scholar]
- Larcher, W. Physiological Plant Ecology: Ecophysiology and Stress Physiology of Functional Groups; Springer: Berlin/Heidelberg, Germany, 2003; ISBN 3-540-43516-6. [Google Scholar]
- Kim, Y.Y.; Ku, J.J.; Kim, J.H.; Lim, H.I.; Han, J. Determination of Climate Predictor Variables Effecting on Annual Cone Harvest and Seed Yield of Korean Pine (Pinus koraiensis Siebold & Zucc.) Seed Orchards. Fores Res. 2020, 9, 239. [Google Scholar]
- Marschner, H. Marschner’s Mineral Nutrition of Higher Plants; Academic Press: Cambridge, MA, USA, 2011. [Google Scholar]
- Evans, J.R. Photosynthesis and Nitrogen Relationships in Leaves of C3 Plants. Oecologia 1989, 78, 9–19. [Google Scholar] [CrossRef] [Scilit]
- Reich, P.B.; Oleksyn, J.; Wright, I.J. Leaf Phosphorus Influences the Photosynthesis–Nitrogen Relation: A Cross-Biome Analysis of 314 Species. Oecologia 2009, 160, 207–212. [Google Scholar] [CrossRef] [Scilit]
- Cakmak, I. The Role of Potassium in Alleviating Detrimental Effects of Abiotic Stresses in Plants. J. Plant Nutr. Soil Sci. 2005, 168, 521–530. [Google Scholar] [CrossRef] [Scilit]
- Kramer, P.J.; Boyer, J.S. Water Relations of Plants and Soils; Academic Press: Cambridge, MA, USA, 1995. [Google Scholar]
- Loewe-Muñoz, V.; Bonomelli, C.; Delard, C.; Del Río, R.; Balzarini, M. Effect of Fertilization on the Performance of Adult Pinus pinea Trees. Biology 2025, 14, 216. [Google Scholar] [CrossRef] [Scilit]
- Loewe-Muñoz, V.; Delard, C.; Del Río, R.; Balzarini, M. Long-Term Effect of Fertilization on Stone Pine Growth and Cone Production. Ann. For. Sci. 2020, 77, 69. [Google Scholar] [CrossRef] [Scilit]
- Kim, J.-H.; Kim, D.-H.; Lee, D.-H. Effects of Fertilizer Treatment on the Growth Characteristics of 2-Years Old Pinus koraiensis Siebold & Zucc Container Seedlings. J. Agric. Life Sci. 2015, 49, 63–70. [Google Scholar] [CrossRef] [Scilit]
- Land and Water Division. World Reference Base for Soil Resources 2006; Technical Report; FAO: Rome, Italy, 2007. [Google Scholar]
- Yang, J.; Wang, C. Soil carbon storage and carbon fluxes in forest ecosystems in eastern Northeast China. Acta Ecol. Sin. 2005, 25, 2875–2882. [Google Scholar]
- Wang, C.; Yang, J.; Zhang, Q. Soil Respiration in Six Temperate Forests in China. Glob. Change Biol. 2006, 12, 2103–2114. [Google Scholar] [CrossRef] [Scilit]
- NY/T 1121.3-2006; Soil Testing—Part 3: Method for Determination of Soil Mechanical Composition. Ministry of Agriculture of the People’s Republic of China: Beijing, China, 2006.
- Wisawapipat, W.; Saentho, A.; Boontong, I.; Sricharoenvech, P.; Mahakot, S.; Klysubun, W. Dominance of 2: 1 Clay Minerals in Soil Potassium across a Weathering Gradient: Insights from XANES Speciation and Sequential Extraction. Soil Environ. Health 2026, 4, 100194. [Google Scholar] [CrossRef] [Scilit]
- Ahlersmeyer, A.; Clay, D.; Kovács, P.; Osterloh, K.; Rekabdarkolaee, H.M.; Clark, J. Relationships among Soil Test Potassium Forms Influenced by Clay Mineralogy. Soil Sci. Soc. Am. J. 2025, 89, e70015. [Google Scholar] [CrossRef] [Scilit]
- Aman, H.; Ghosh, A.K.; Panda, D.; Pradhan, C.; Mahapatra, P.; Paul, R.; Tiwari, G. Changes in Clay Mineral Composition and Soil Potassium Pools under 50 Years of Soybean–Wheat Cropping in an Alfisol. J. Plant Nutr. Soil Sci. 2025, 188, 712–722. [Google Scholar] [CrossRef] [Scilit]
- Ando, K.; Nakao, A.; Nakamura, Y.; Kasuya, M.; Hioki, M.; Yanai, J. Plant Use of Nonexchangeable Potassium in Coarse and Fine Fractions of Granitic Soils in a Temperate Region. Eur. J. Soil Sci. 2025, 76, e70219. [Google Scholar] [CrossRef] [Scilit]
- Yanai, J.; Inoue, N.; Nakao, A.; Kasuya, M.; Ando, K.; Oga, T.; Takayama, T.; Hasukawa, H.; Takehisa, K.; Takamoto, A. Use of Soil Nonexchangeable Potassium by Paddy Rice with Clay Structural Changes under Long-Term Fertilizer Management. Soil Use Manag. 2023, 39, 785–793. [Google Scholar] [CrossRef] [Scilit]
- Gu, J.; Wang, H.; Wei, H.; Cui, X. Effects of fertilization on nutrition and seed production of Korean pine (Pinus koraiensis) stands managed for both timber and seed production. J. Temp. For. Res. 2018, 1, 15–19. [Google Scholar]
- NY/T 1121.22-2010; Soil Testing—Part 22: Determination of Available Potassium. Ministry of Agriculture of the People’s Republic of China: Beijing, China, 2010.
- Topp, G.C.; Davis, J.L.; Annan, A.P. Electromagnetic Determination of Soil Water Content: Measurements in Coaxial Transmission Lines. Water Resour. Res. 1980, 16, 574–582. [Google Scholar] [CrossRef] [Scilit]
- GB/T 2772-1999; Rules for Forest Tree Seed Testing. State Bureau of Quality and Technical Supervision: Beijing, China, 1999.
- NY/T 1121.4-2006; Soil Testing—Part 4: Method for Determination of Soil Bulk Density. Ministry of Agriculture of the People’s Republic of China: Beijing, China, 2006.
- NY/T 1121.2-2006; Soil Testing—Part 2: Method for Determination of Soil pH. Ministry of Agriculture of the People’s Republic of China: Beijing, China, 2006.
- NY/T 1121.24-2012; Soil Testing—Part 24: Determination of Total Nitrogen in Soil-Automatic Kjeldahl Apparatus Method. Ministry of Agriculture of the People’s Republic of China: Beijing, China, 2012.
- NY/T 1121.7-2014; Soil Testing—Part 7: Method for Determination of Available Phosphorus in Soil. Ministry of Agriculture of the People’s Republic of China: Beijing, China, 2014.
- NY/T 889-2004; Determination of Available and Slowly Available Potassium in Soil. Ministry of Agriculture of the People’s Republic of China: Beijing, China, 2004.
- NY/T 1121.6-2006; Soil Testing—Part 6: Method for Determination of Soil Organic Matter. Ministry of Agriculture of the People’s Republic of China: Beijing, China, 2006.
- LY/T 1228-2015; Determination of Nitrogen in Forest Soil. State Forestry Administration of the People’s Republic of China: Beijing, China, 2015.
- Wickham, H.; Bryan, J.; Chang, W.; McGowan, L.; François, R.; Grolemund, G.; Lemon, J.; Kassambara, A.; Mundt, F.; Revelle, W. R: A Language and Environment for Statistical Computing. J. Open Source Softw. 2020, 8, 1–20. [Google Scholar]
- Zadeh, L.A. Information and Control. Fuzzy Sets 1965, 8, 338–353. [Google Scholar]
- Ward, J.H., Jr. Hierarchical Grouping to Optimize an Objective Function. J. Am. Stat. Assoc. 1963, 58, 236–244. [Google Scholar] [CrossRef]
- Legendre, P.; Legendre, L. Numerical Ecology; Elsevier: Amsterdam, The Netherlands, 2012; Volume 24, ISBN 0-444-53869-0. [Google Scholar]
- Barber, S.A. Soil Nutrient Bioavailability: A Mechanistic Approach; John Wiley & Sons: Hoboken, NJ, USA, 1995; ISBN 0-471-58747-8. [Google Scholar]
- Da Silva, A.P.; Kay, B.D.; Perfect, E. Characterization of the Least Limiting Water Range of Soils. Soil Sci. Soc. Am. J. 1994, 58, 1775–1781. [Google Scholar] [CrossRef] [Scilit]
- Yin, C.; Palmroth, S.; Pang, X.; Tang, B.; Liu, Q.; Oren, R. Differential Responses of Picea asperata and Betula albosinensis to Nitrogen Supply Imposed by Water Availability. Tree Physiol. 2018, 38, 1694–1705. [Google Scholar] [CrossRef] [Scilit]
- Wang, M.; Shi, S.; Lin, F.; Hao, Z.; Jiang, P.; Dai, G. Effects of Soil Water and Nitrogen on Growth and Photosynthetic Response of Manchurian Ash (Fraxinus mandshurica) Seedlings in Northeastern China. PLoS ONE 2012, 7, e30754. [Google Scholar] [CrossRef] [Scilit]
- Cui, W.; Liu, S.; Wei, Y.; Yin, Y.; Zhou, L.; Zhou, W.; Yu, D. Effects of nitrogen addition and water stress on biomass allocation of Pinus koraiensis and Fraxinus mandshurica seedlings. Chin. J. Appl. Ecol. 2019, 30, 1453–1463. [Google Scholar]
- Wallander, H. A New Hypothesis to Explain Allocation of Dry Matter between Mycorrhizal Fungi and Pine Seedlings in Relation to Nutrient Supply. Plant Soil 1995, 168, 243–248. [Google Scholar] [CrossRef] [Scilit]
- Wallander, H.; Nylund, J.-E. Effects of Excess Nitrogen and Phosphorus Starvation on the Extramatrical Mycelium of Ectomycorrhizas of Pinus sylvestris L. New Phytol. 1992, 120, 495–503. [Google Scholar] [CrossRef] [Scilit]
- Wang, J.; Han, S.; Wang, C.; Li, M.-H. Long-Term Nitrogen-Addition-Induced Shifts in the Ectomycorrhizal Fungal Community Are Associated with Changes in Fine Root Traits and Soil Properties in a Mixed Pinus koraiensis Forest. Eur. J. Soil Biol. 2022, 112, 103431. [Google Scholar] [CrossRef] [Scilit]
- Hsiao, T.C. Plant Responses to Water Stress. Annu. Rev. Plant Physiol. 1973, 24, 519–570. [Google Scholar] [CrossRef] [Scilit]
- McDowell, N.; Pockman, W.T.; Allen, C.D.; Breshears, D.D.; Cobb, N.; Kolb, T.; Plaut, J.; Sperry, J.; West, A.; Williams, D.G.; et al. Mechanisms of Plant Survival and Mortality during Drought: Why Do Some Plants Survive While Others Succumb to Drought? New Phytol. 2008, 178, 719–739. [Google Scholar] [CrossRef] [Scilit] [PubMed]
- Wilkinson, S.; Davies, W.J. ABA-Based Chemical Signalling: The Co-Ordination of Responses to Stress in Plants. Plant Cell Environ. 2002, 25, 195–210. [Google Scholar] [CrossRef] [Scilit]
- Flexas, J.; Bota, J.; Loreto, F.; Cornic, G.; Sharkey, T.D. Diffusive and Metabolic Limitations to Photosynthesis under Drought and Salinity in C3 Plants. Plant Biol. 2004, 6, 269–279. [Google Scholar] [CrossRef] [Scilit] [PubMed]
- Chaves, M.M.; Maroco, J.P.; Pereira, J.S. Understanding Plant Responses to Drought—From Genes to the Whole Plant. Funct. Plant Biol. 2003, 30, 239–264. [Google Scholar] [CrossRef] [Scilit] [PubMed]
- Munns, R.; Tester, M. Mechanisms of Salinity Tolerance. Annu. Rev. Plant Biol. 2008, 59, 651–681. [Google Scholar] [CrossRef] [Scilit] [PubMed]
- Sardans, J.; Peñuelas, J. The Role of Plants in the Effects of Global Change on Nutrient Availability and Stoichiometry in the Plant-Soil System. Plant Physiol. 2012, 160, 1741–1761. [Google Scholar] [CrossRef] [Scilit]
- McBride, M.B. Environmental Chemistry of Soils; Oxford Press: Oxford, UK, 1994. [Google Scholar]
- Sparks, D.L.; Singh, B.; Siebecker, M.G. Environmental Soil Chemistry; Elsevier: Amsterdam, The Netherlands, 2022; ISBN 0-443-14035-9. [Google Scholar]
- Zarif, N.; Khan, A.; Wang, Q. Linking Soil Acidity to P Fractions and Exchangeable Base Cations under Increased N and P Fertilization of Mono and Mixed Plantations in Northeast China. Forests 2020, 11, 1274. [Google Scholar] [CrossRef] [Scilit]
- Weil, R.R.; Brady, N.C. The Nature and Properties of Soils, 15th ed.; Pearson: London, UK, 2016; 912p. [Google Scholar]
- Obeso, J.R. The Costs of Reproduction in Plants. New Phytol. 2002, 155, 321–348. [Google Scholar] [CrossRef] [Scilit]
- Turgeon, R.; Wolf, S. Phloem Transport: Cellular Pathways and Molecular Trafficking. Annu. Rev. Plant Biol. 2009, 60, 207–221. [Google Scholar] [CrossRef] [Scilit]
- Wu, H.; Yin, D.; Salomón, R.L.; Rodríguez-Calcerrada, J.; Zhang, J.; Zhang, P.; Shen, H. Cone-Bearing Branches of Pinus Koraiensis Are Not Carbon Autonomous during Cone Development. Forests 2021, 12, 1257. [Google Scholar] [CrossRef] [Scilit]
- Loewe-Munoz, V.; Del Río, R.; Delard, C.; Balzarini, M. Effect of Fertilization on Pinus pinea Cone to Seed and Kernel Yields. For. Ecol. Manag. 2023, 545, 121249. [Google Scholar] [CrossRef] [Scilit]
- Sadras, V.O. Evolutionary Aspects of the Trade-off between Seed Size and Number in Crops. Field Crops Res. 2007, 100, 125–138. [Google Scholar] [CrossRef] [Scilit]
- Zhang, X.; Ma, L.; Zheng, J. Key genes selected during crop domestication and variety improvement and their characteristics. Acta Agron. Sin. 2017, 43, 157–170. [Google Scholar]
- Zwieniecki, M.A.; Davidson, A.M.; Orozco, J.; Cooper, K.B.; Guzman-Delgado, P. The Impact of Non-Structural Carbohydrates (NSC) Concentration on Yield in Prunus dulcis, Pistacia vera, and Juglans regia. Sci. Rep. 2022, 12, 4360. [Google Scholar] [CrossRef] [Scilit]
- Dietze, M.C.; Sala, A.; Carbone, M.S.; Czimczik, C.I.; Mantooth, J.A.; Richardson, A.D.; Vargas, R. Nonstructural Carbon in Woody Plants. Annu. Rev. Plant Biol. 2014, 65, 667–687. [Google Scholar] [CrossRef] [Scilit]
- Vitousek, P.M.; Howarth, R.W. Nitrogen Limitation on Land and in the Sea: How Can It Occur? Biogeochemistry 1991, 13, 87–115. [Google Scholar] [CrossRef] [Scilit]
- Li, H.; Yang, H.; Sun, J.; Liu, Q.; Li, L.; Li, H. Seasonal dynamics of non-structural carbohydrates and carbon–nitrogen–phosphorus ecological stoichiometry in young and middle-aged Pinus koraiensis plantations during the growing season. J. Zhejiang A&F Univ. 2025, 42, 495–502. [Google Scholar]
- Kelly, D.; Sork, V.L. Mast Seeding in Perennial Plants: Why, How, Where? Annu. Rev. Ecol. Syst. 2002, 33, 427–447. [Google Scholar] [CrossRef] [Scilit]
- Manik, S.N.; Pengilley, G.; Dean, G.; Field, B.; Shabala, S.; Zhou, M. Soil and Crop Management Practices to Minimize the Impact of Waterlogging on Crop Productivity. Front. Plant Sci. 2019, 10, 140. [Google Scholar] [CrossRef] [Scilit]
- Bateman, E.; Baggs, E. Contributions of Nitrification and Denitrification to N2O Emissions from Soils at Different Water-Filled Pore Space. Biol. Fertil. Soils 2005, 41, 379–388. [Google Scholar] [CrossRef] [Scilit]
- Tian, D.; Niu, S. A Global Analysis of Soil Acidification Caused by Nitrogen Addition. Environ. Res. Lett. 2015, 10, 024019. [Google Scholar] [CrossRef] [Scilit]
- Hinsinger, P.; Plassard, C.; Tang, C.; Jaillard, B. Origins of Root-Mediated pH Changes in the Rhizosphere and Their Responses to Environmental Constraints: A Review. Plant Soil 2003, 248, 43–59. [Google Scholar] [CrossRef] [Scilit]
- Guo, J.H.; Liu, X.J.; Zhang, Y.; Shen, J.; Han, W.; Zhang, W.; Christie, P.; Goulding, K.; Vitousek, P.; Zhang, F. Significant Acidification in Major Chinese Croplands. Science 2010, 327, 1008–1010. [Google Scholar] [CrossRef] [Scilit] [PubMed]
- Ayiti, O.E.; Babalola, O.O. Factors Influencing Soil Nitrification Process and the Effect on Environment and Health. Front. Sustain. Food Syst. 2022, 6, 821994. [Google Scholar] [CrossRef] [Scilit]
- Wang, C.; Han, S.; Zhou, Y.; Yan, C.; Cheng, X.; Zheng, X.; Li, M.-H. Responses of Fine Roots and Soil N Availability to Short-Term Nitrogen Fertilization in a Broad-Leaved Korean Pine Mixed Forest in Northeastern China. PLoS ONE 2012, 7, e31042. [Google Scholar] [CrossRef] [Scilit]
- Guo, G.; Li, X.; Du, Z.; Zhang, J.; Wang, M. Effects of different nitrogen application methods on nitrogen use efficiency of sunflower. J. Irrig. Drain. 2018, 37, 20. [Google Scholar]
- Tian, F.; Ji, H.; Wang, L.; Zheng, X.; Xin, J.; Neng, H. Effects of fertilizer type and hydrothermal variation on soil nitrogen mineralization and dissolved organic nitrogen dynamics in croplands. Environ. Sci. 2018, 39, 4717–4726. [Google Scholar]
- Ma, R.; Li, Q.; Zhou, D. Residual effects of nitrogen fertilizer in croplands and their influencing factors. Soils Crops 2024, 13, 201–214. [Google Scholar]
- Song, L.; Tian, P.; Zhang, J.; Jin, G. Effects of Three Years of Simulated Nitrogen Deposition on Soil Nitrogen Dynamics and Greenhouse Gas Emissions in a Korean Pine Plantation of Northeast China. Sci. Total Environ. 2017, 609, 1303–1311. [Google Scholar] [CrossRef] [Scilit]
- Plett, D.C.; Ranathunge, K.; Melino, V.J.; Kuya, N.; Uga, Y.; Kronzucker, H.J. The Intersection of Nitrogen Nutrition and Water Use in Plants: New Paths toward Improved Crop Productivity. J. Exp. Bot. 2020, 71, 4452–4468. [Google Scholar] [CrossRef] [Scilit]
- Kuzyakov, Y.; Xu, X. Competition between Roots and Microorganisms for Nitrogen: Mechanisms and Ecological Relevance. New Phytol. 2013, 198, 656–669. [Google Scholar] [CrossRef] [Scilit]
- Lü, L.; Song, L.; Liu, Z.; Zhang, J.; Jin, G. Responses of soil enzyme activities and chemical properties to nitrogen addition in Pinus koraiensis plantations. Environ. Sci. 2020, 41, 1960–1967. [Google Scholar]
- Kreuzwieser, J.; Rennenberg, H. Molecular and Physiological Responses of Trees to Waterlogging Stress. Plant Cell Environ. 2014, 37, 2245–2259. [Google Scholar] [CrossRef] [Scilit]
- Smith, S.E.; Read, D. Mycorrhizal Symbiosis; Elsevier: Amsterdam, The Netherlands, 2008. [Google Scholar]
- Duan, S.; Yan, W.; Feng, G.; Zhang, L. Carbon–phosphorus mutualistic mechanisms of nutrient acquisition by plants through root and mycorrhizal pathways. J. Plant Nutr. Fertil. 2023, 29, 1160–1167. [Google Scholar]
- Roeva, T.; Leonicheva, E.; Leonteva, L.; Vetrova, O.; Makarkina, M. The Features of Potassium Dynamics in ‘Soil–Plant’System of Sour Cherry Orchard. Plants 2023, 12, 3131. [Google Scholar] [CrossRef] [Scilit]
- Hu, Y.; Schmidhalter, U. Drought and Salinity: A Comparison of Their Effects on Mineral Nutrition of Plants. J. Plant Nutr. Soil Sci. 2005, 168, 541–549. [Google Scholar] [CrossRef] [Scilit]
- Li, Y.; Zeng, H.; Xu, F.; Yan, F.; Xu, W. H+-ATPases in Plant Growth and Stress Responses. Annu. Rev. Plant Biol. 2022, 73, 495–521. [Google Scholar] [CrossRef] [Scilit]
- Gao, J.; Su, Y.; Yu, M.; Huang, Y.; Wang, F.; Shen, A. Potassium Alleviates Post-Anthesis Photosynthetic Reductions in Winter Wheat Caused by Waterlogging at the Stem Elongation Stage. Front. Plant Sci. 2021, 11, 607475. [Google Scholar] [CrossRef] [Scilit]
- Ashley, M.K.; Grant, M.; Grabov, A. Plant Responses to Potassium Deficiencies: A Role for Potassium Transport Proteins. J. Exp. Bot. 2006, 57, 425–436. [Google Scholar] [CrossRef] [Scilit]
- Sardans, J.; Peñuelas, J. Potassium Control of Plant Functions: Ecological and Agricultural Implications. Plants 2021, 10, 419. [Google Scholar] [CrossRef] [Scilit]
- Wang, C.; Kuzyakov, Y. Soil Organic Matter Priming: The pH Effects. Glob. Change Biol. 2024, 30, e17349. [Google Scholar] [CrossRef] [Scilit] [PubMed]
- Chen, R.; Senbayram, M.; Blagodatsky, S.; Myachina, O.; Dittert, K.; Lin, X.; Blagodatskaya, E.; Kuzyakov, Y. Soil C and N Availability Determine the Priming Effect: Microbial N Mining and Stoichiometric Decomposition Theories. Glob. Change Biol. 2014, 20, 2356–2367. [Google Scholar] [CrossRef] [Scilit]
- Blagodatskaya, E.; Kuzyakov, Y. Active Microorganisms in Soil: Critical Review of Estimation Criteria and Approaches. Soil Biol. Biochem. 2013, 67, 192–211. [Google Scholar] [CrossRef] [Scilit]
- Norton, J.; Ouyang, Y. Controls and Adaptive Management of Nitrification in Agricultural Soils. Front. Microbiol. 2019, 10, 1931. [Google Scholar] [CrossRef] [Scilit]
- Smith, G.J.; McDowell, R.W.; Condron, L.M.; Daly, K.; Ó hUallacháin, D.; Fenton, O. Reductive Dissolution of Phosphorus Associated with Iron-Oxides during Saturation in Agricultural Soil Profiles; Wiley Online Library: Hoboken, NJ, USA, 2021. [Google Scholar]
- Xie, J.; Zhou, J. Progress in Study on Soil Potassium and Application of Potassium Fertilizers in China. Soils 1999, 31, 244–254. [Google Scholar]
- Wang, F.; Lin, C.; Li, Q.; He, C.; Liu, Y. Effects of different fertilization practices on improving potassium supply capacity and potassium balance in yellow paddy soils in southern China. J. Plant Nutr. Fertil. 2017, 23, 669–677. [Google Scholar]
- Guo, J.; Sun, J.; Feng, H.; Cao, P.; Yu, Y. Research progress on the evolution of soil fertility quality and maintenance measures in Chinese fir plantations. J. Zhejiang A&F Univ. 2020, 37, 801–809. [Google Scholar]
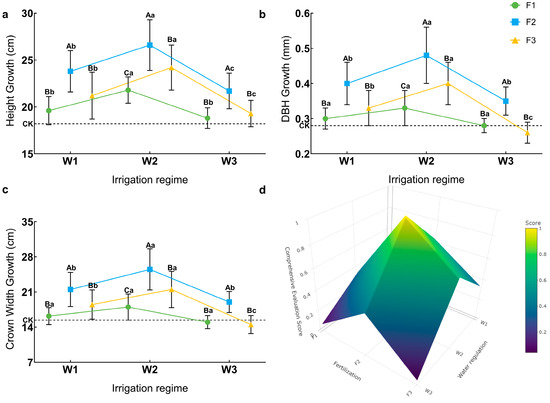
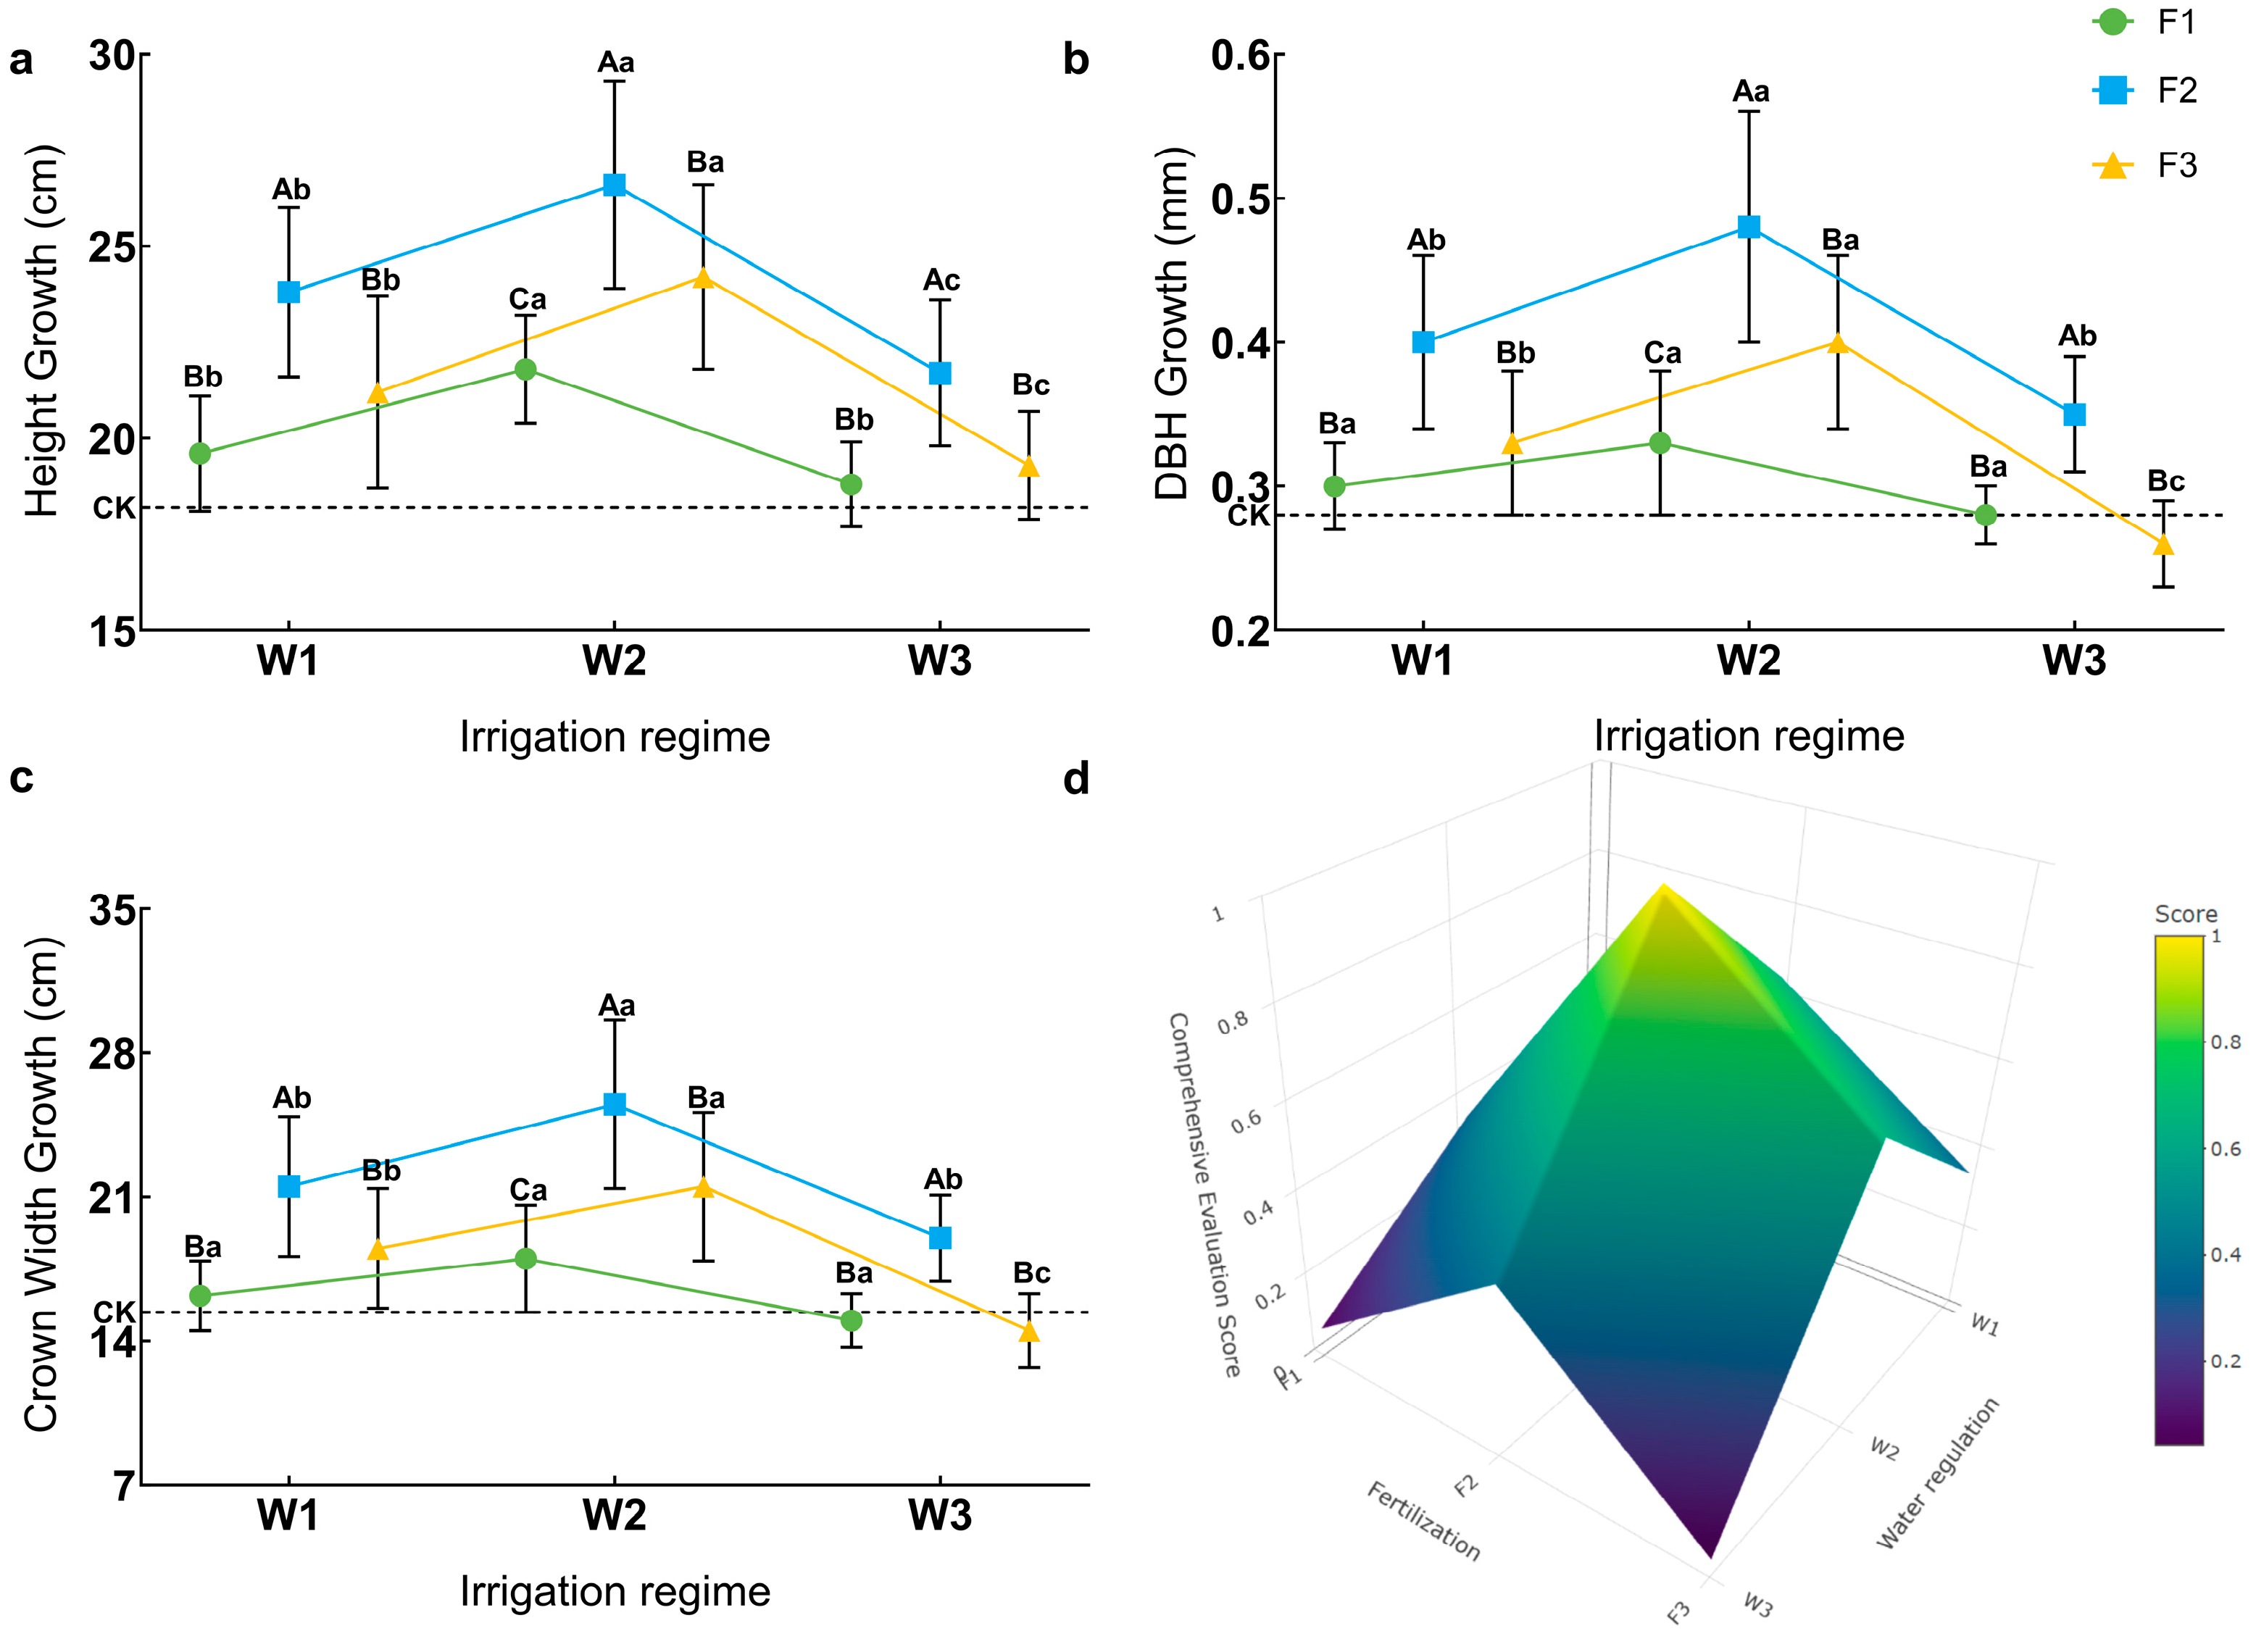
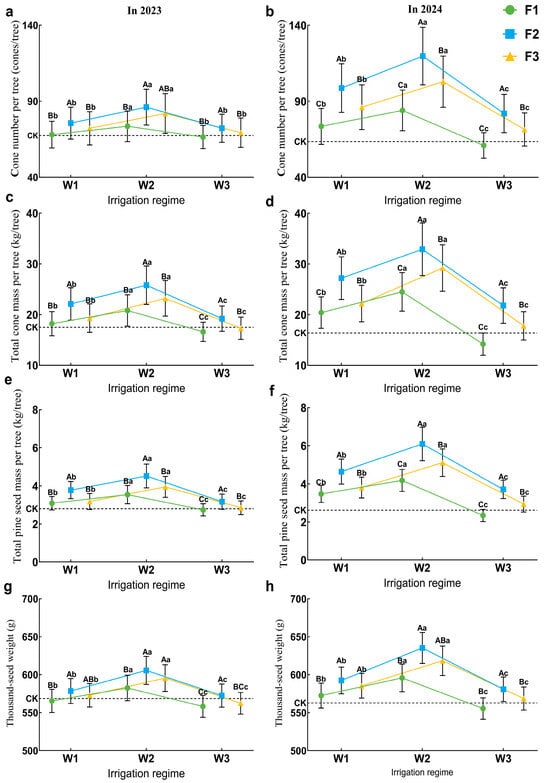
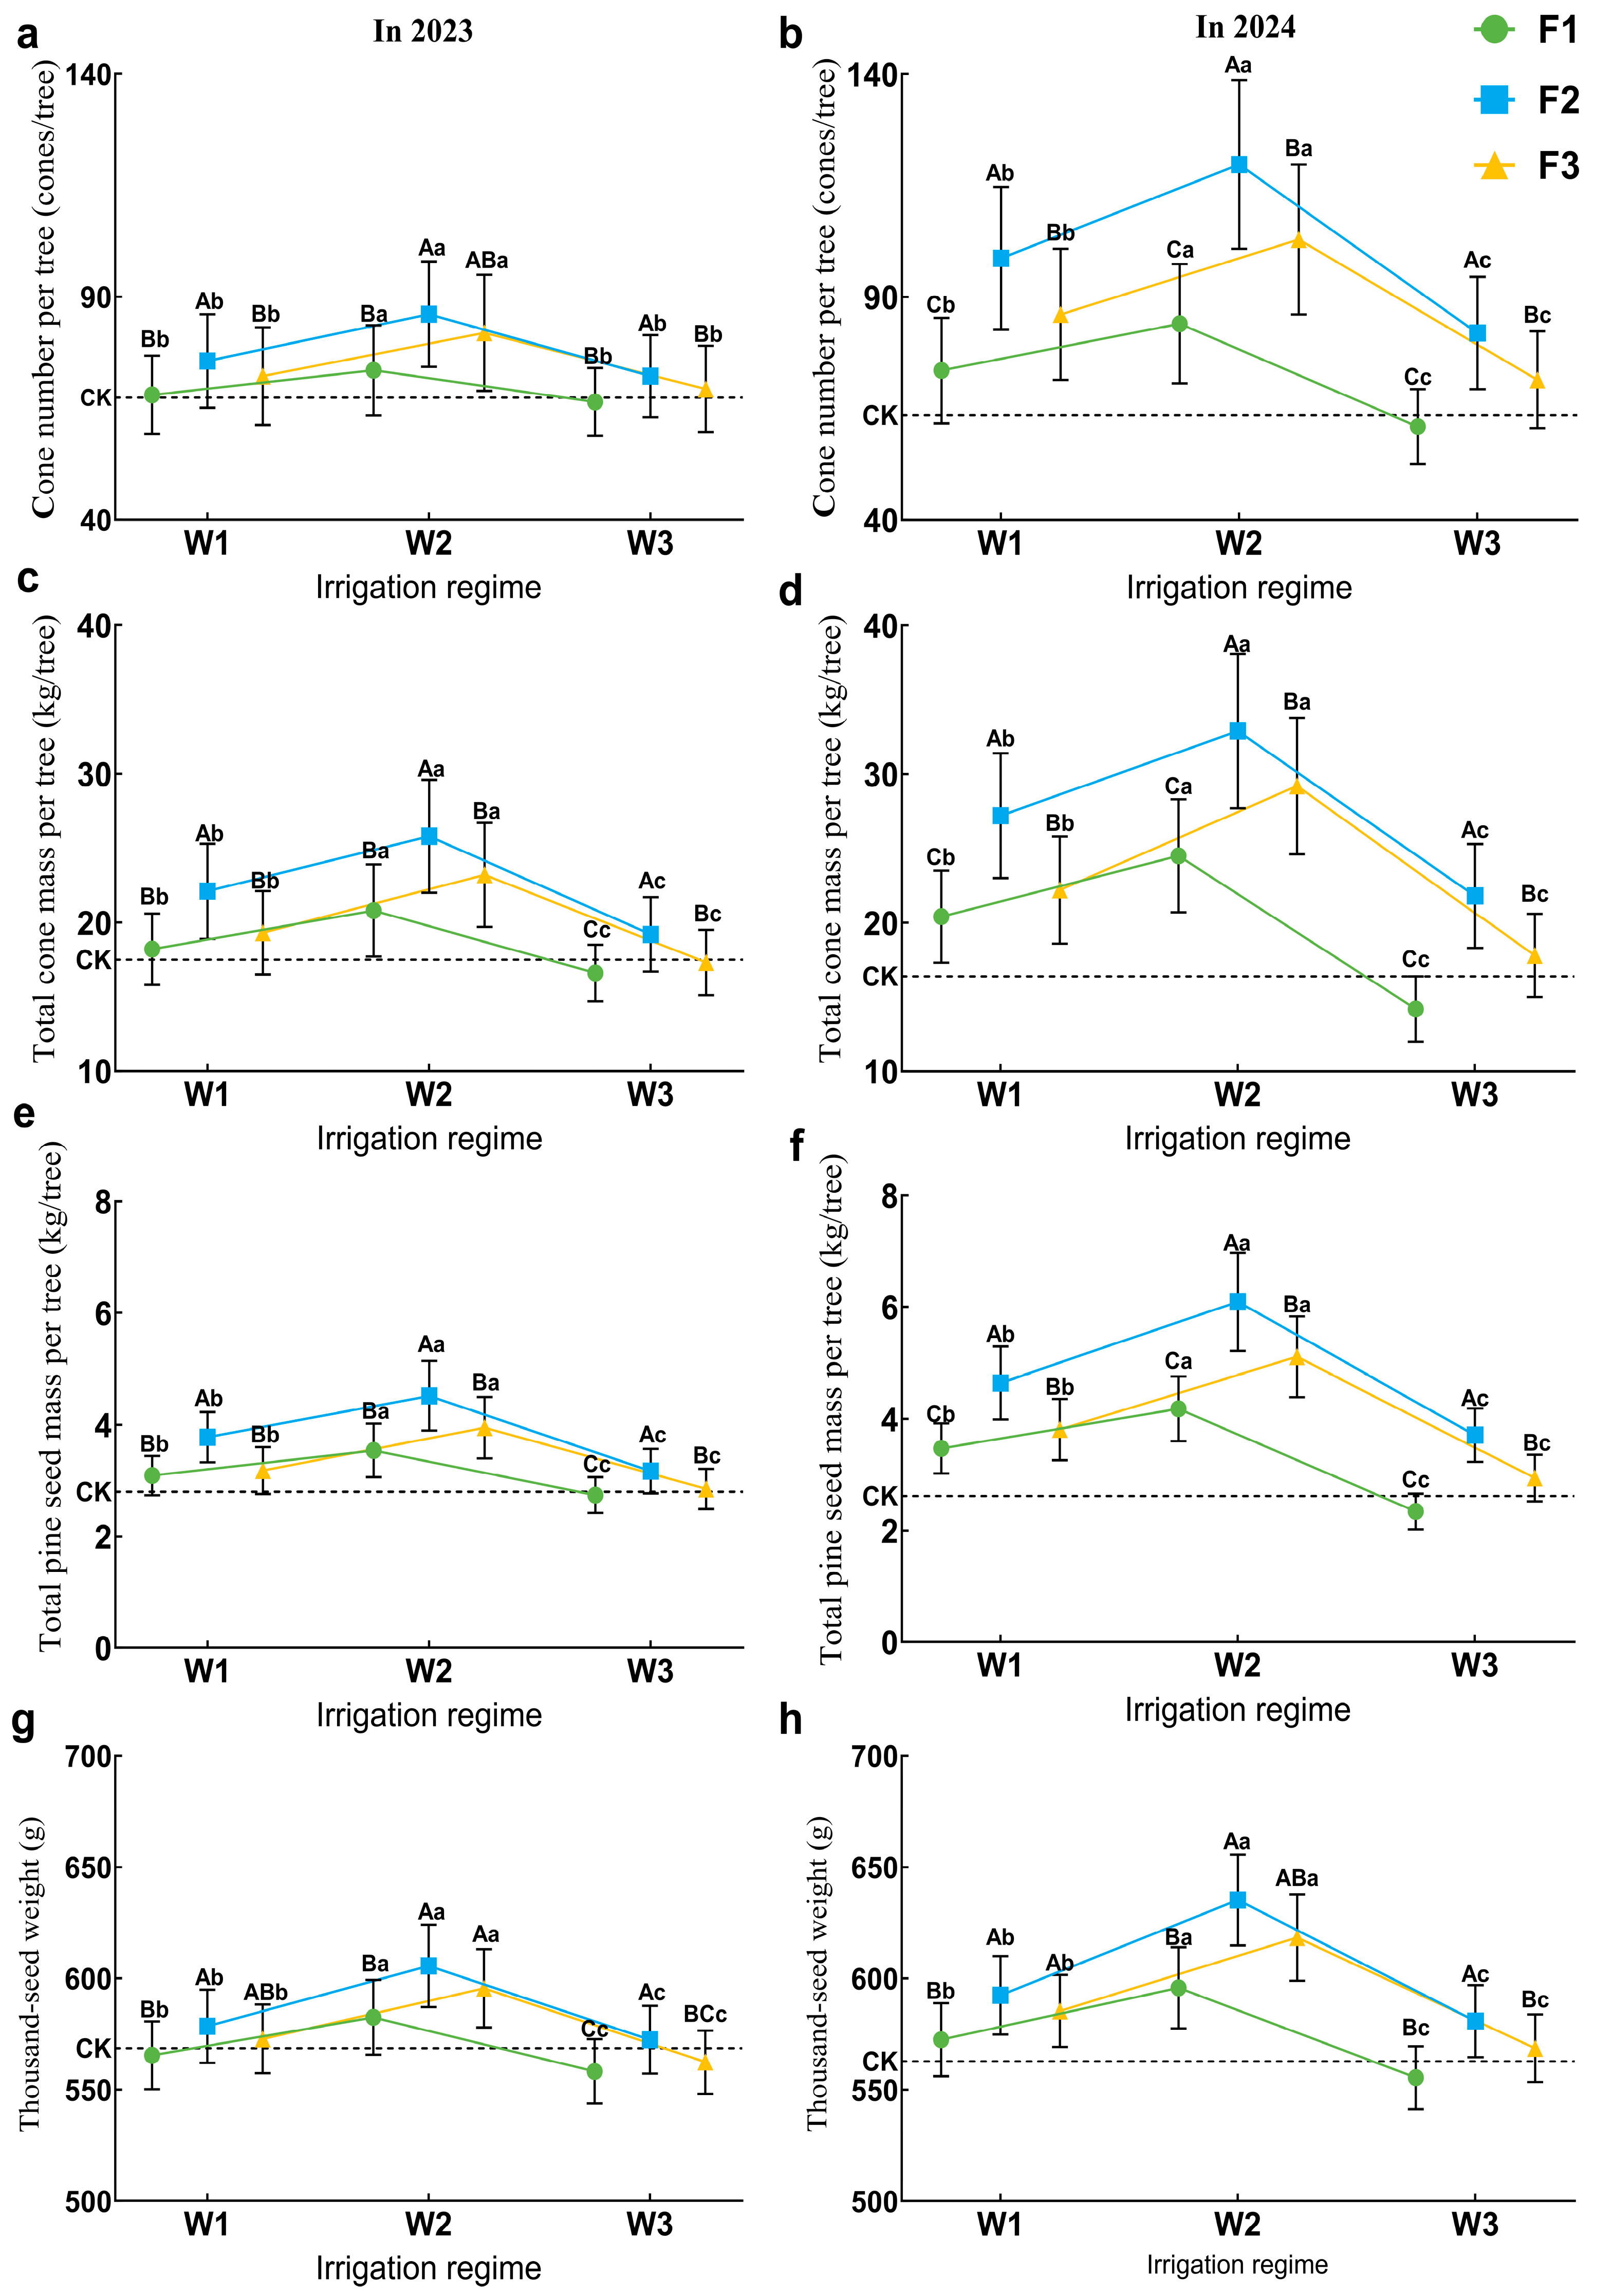
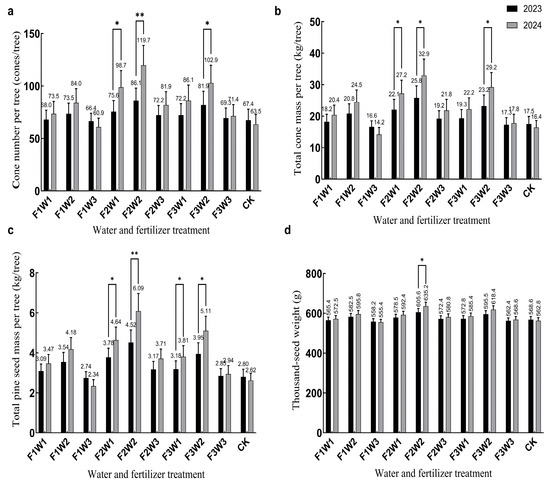
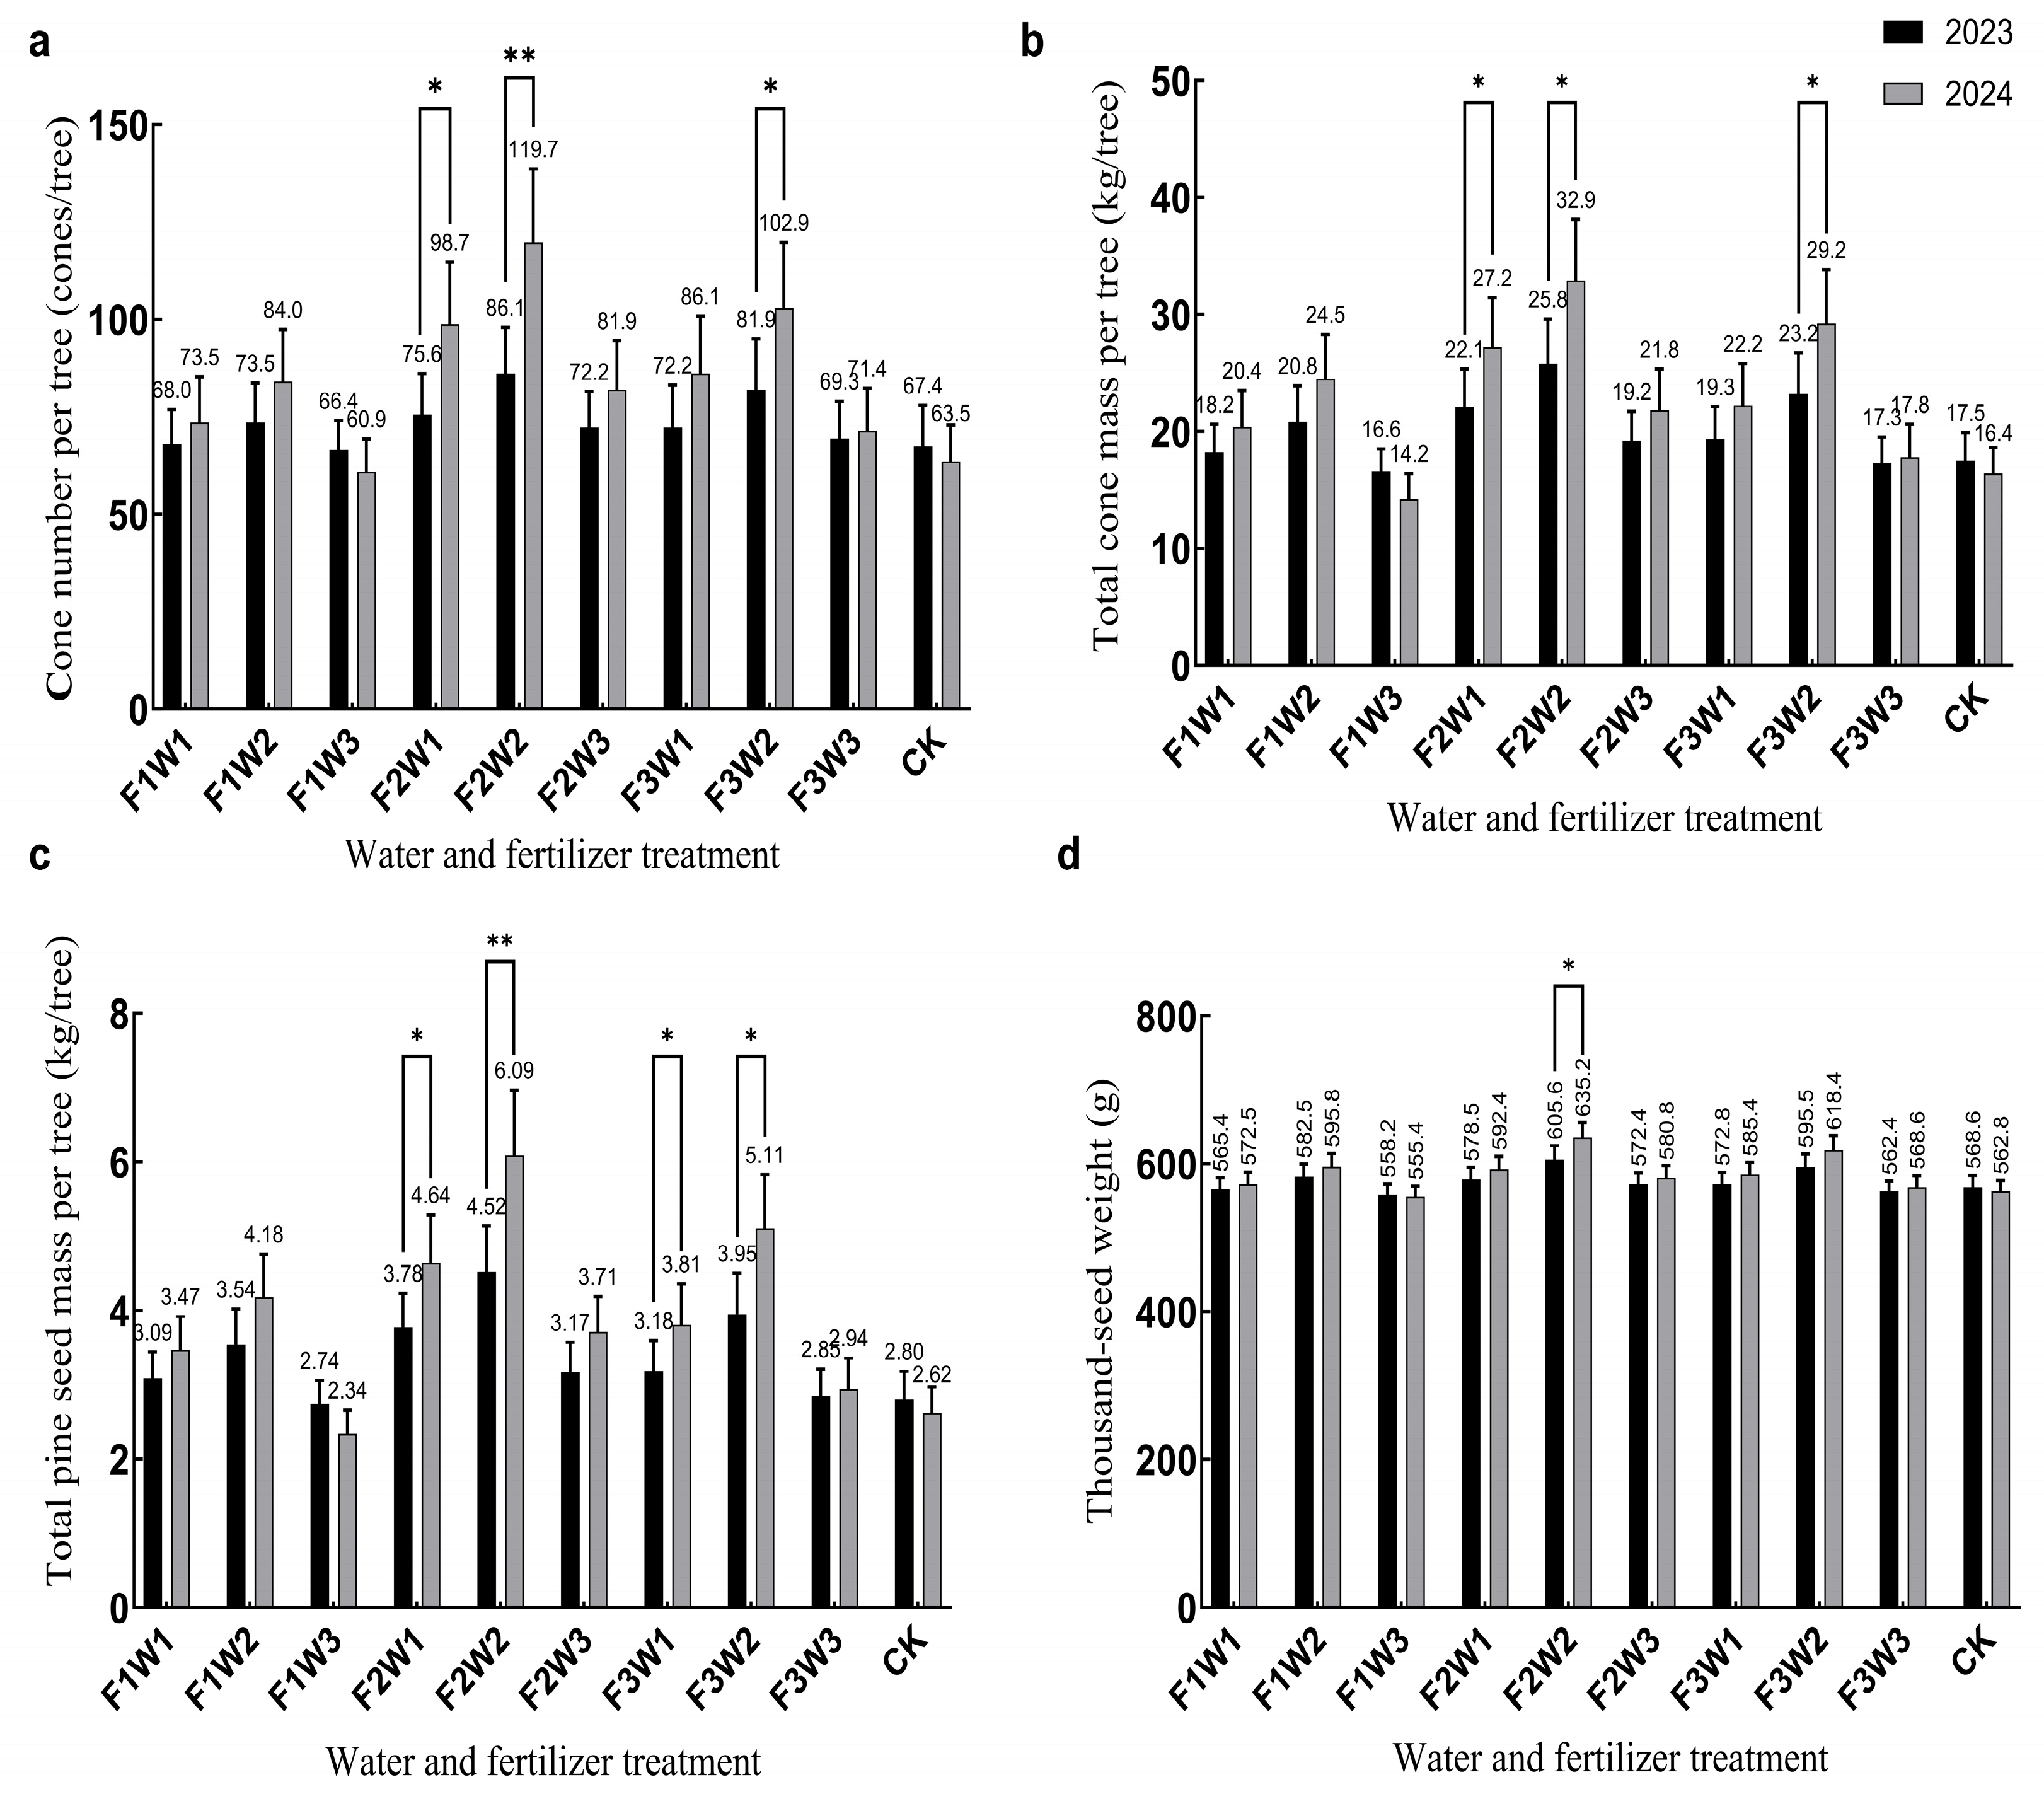
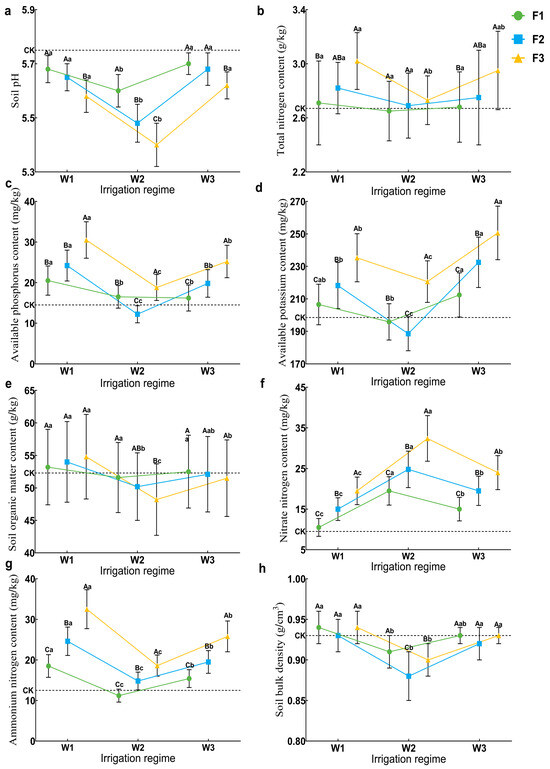
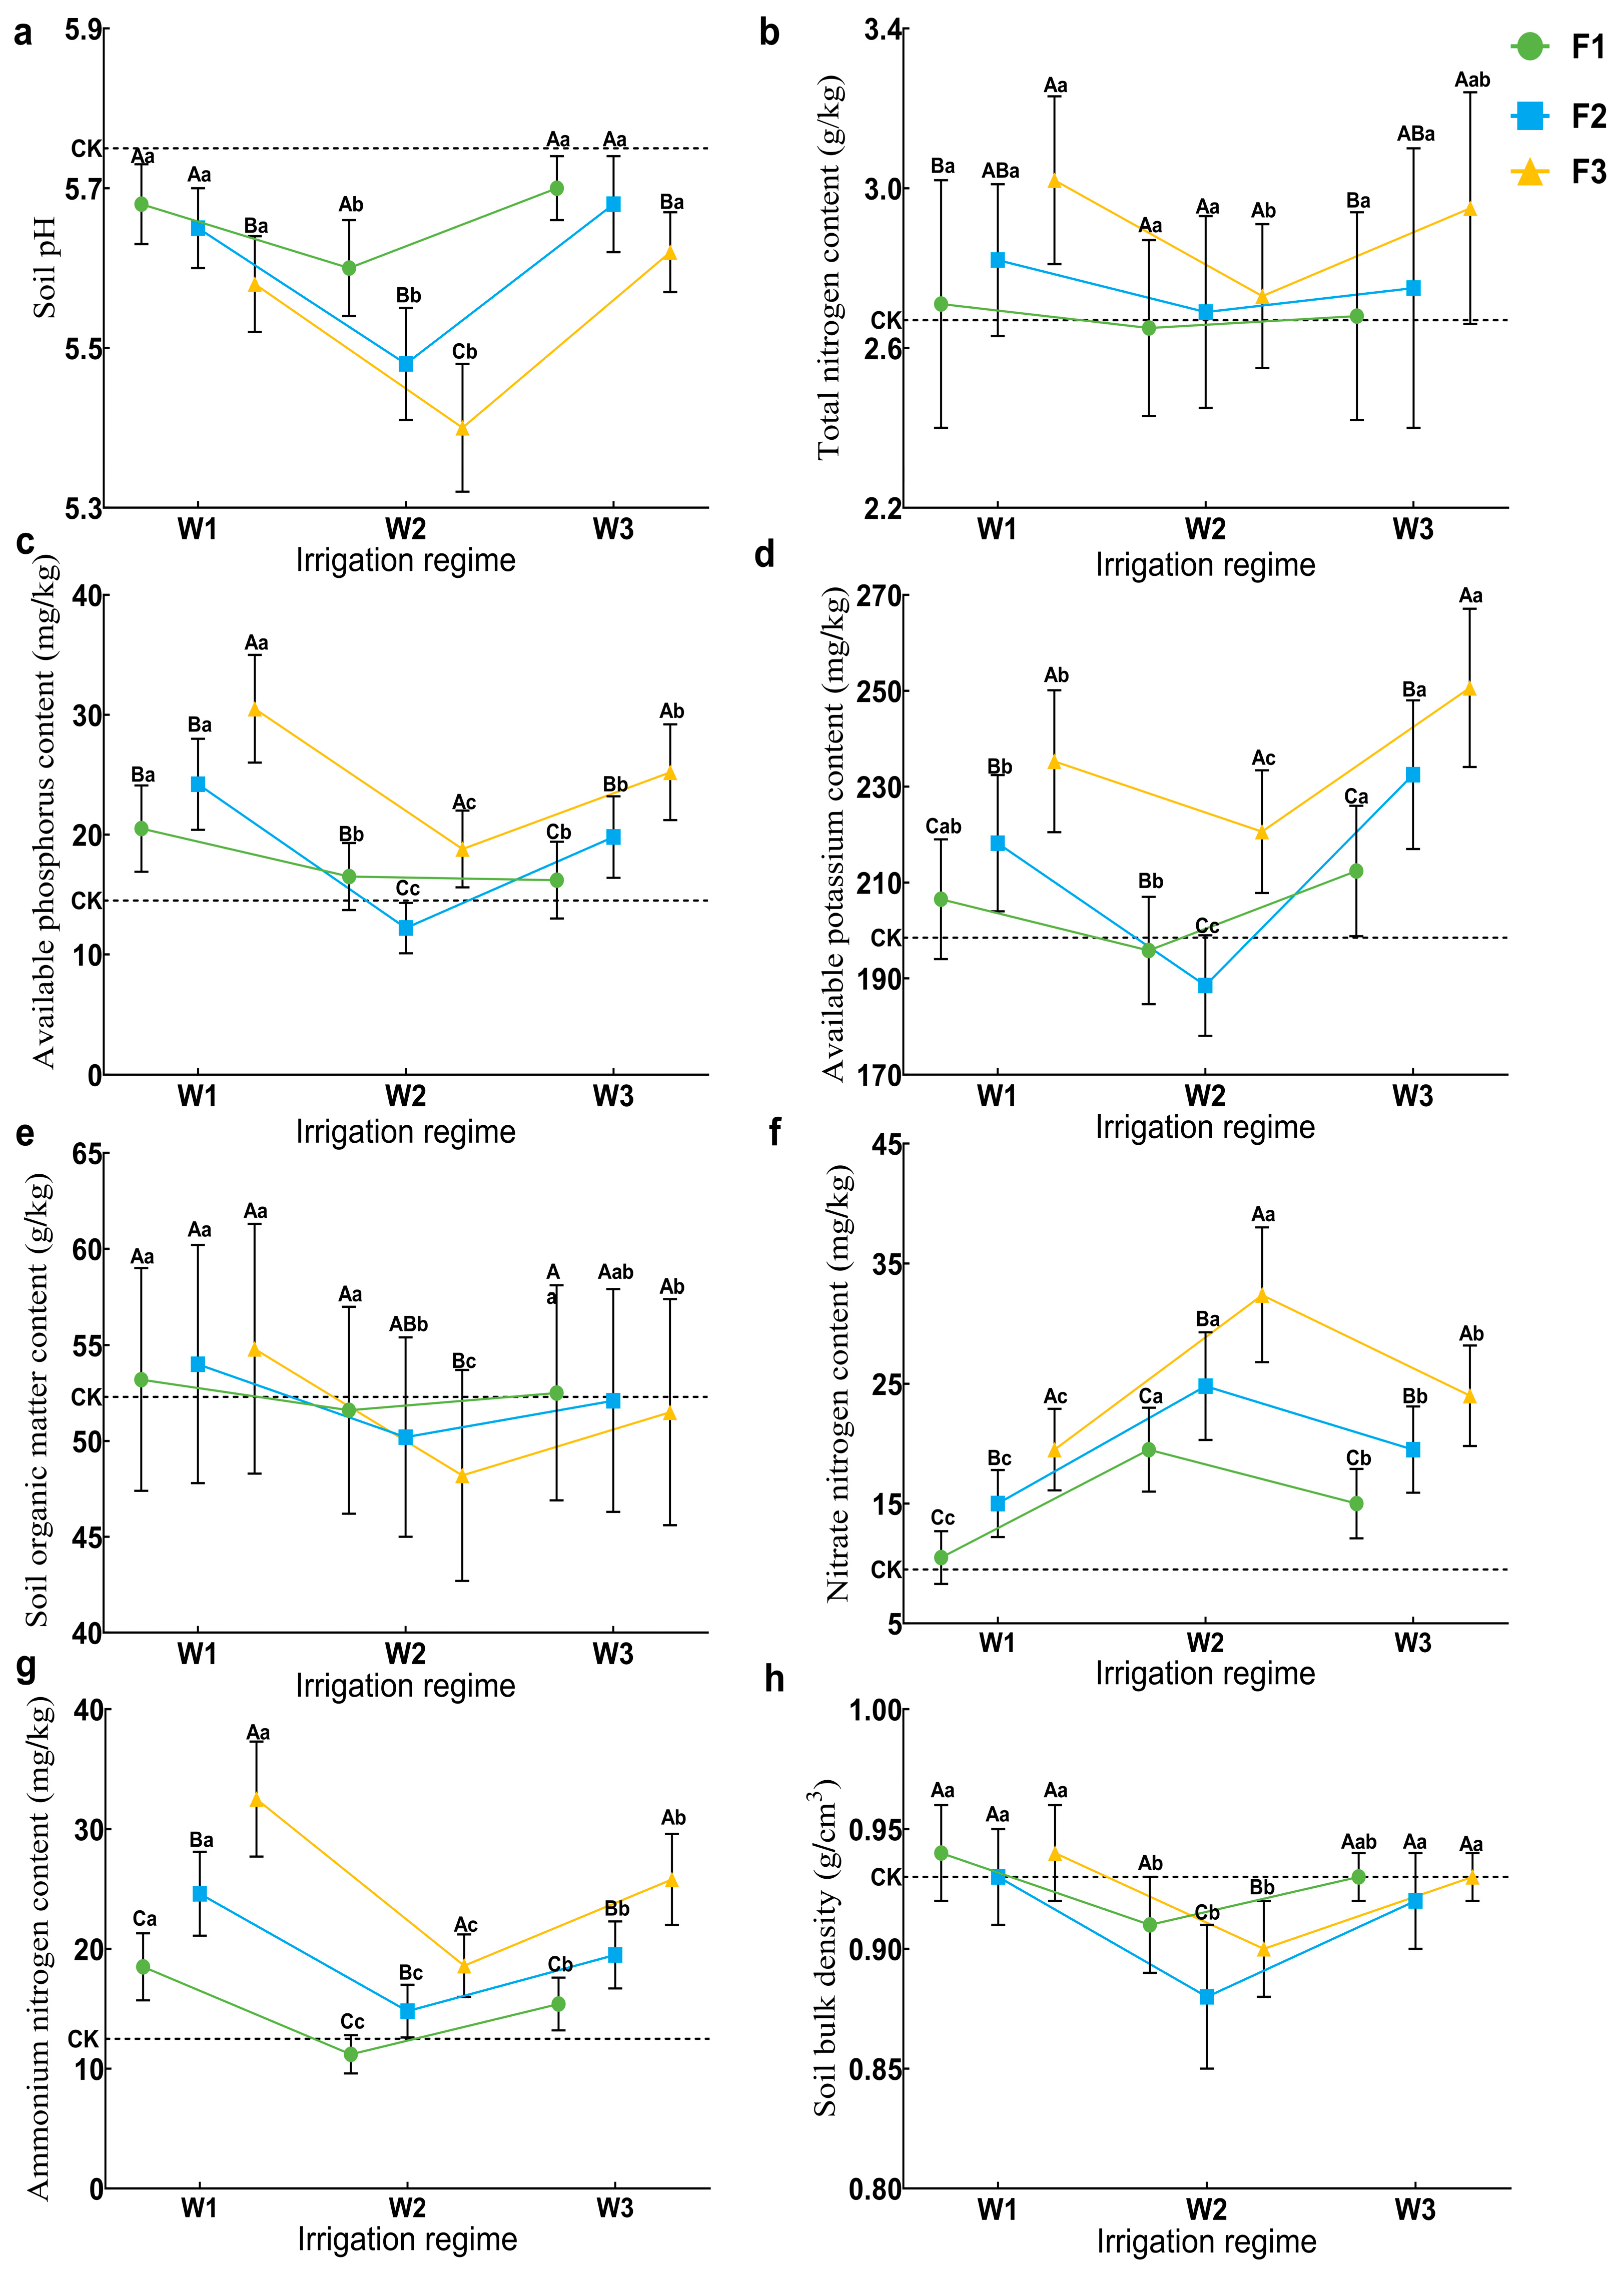
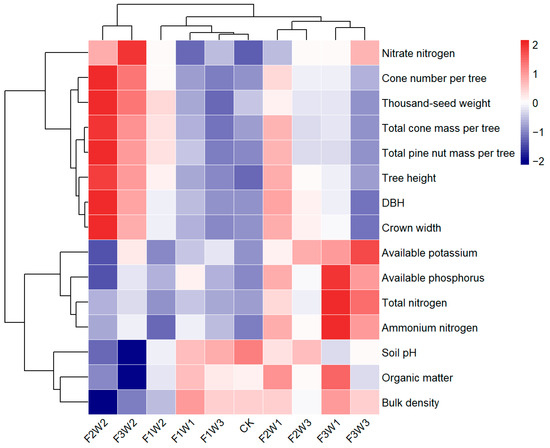
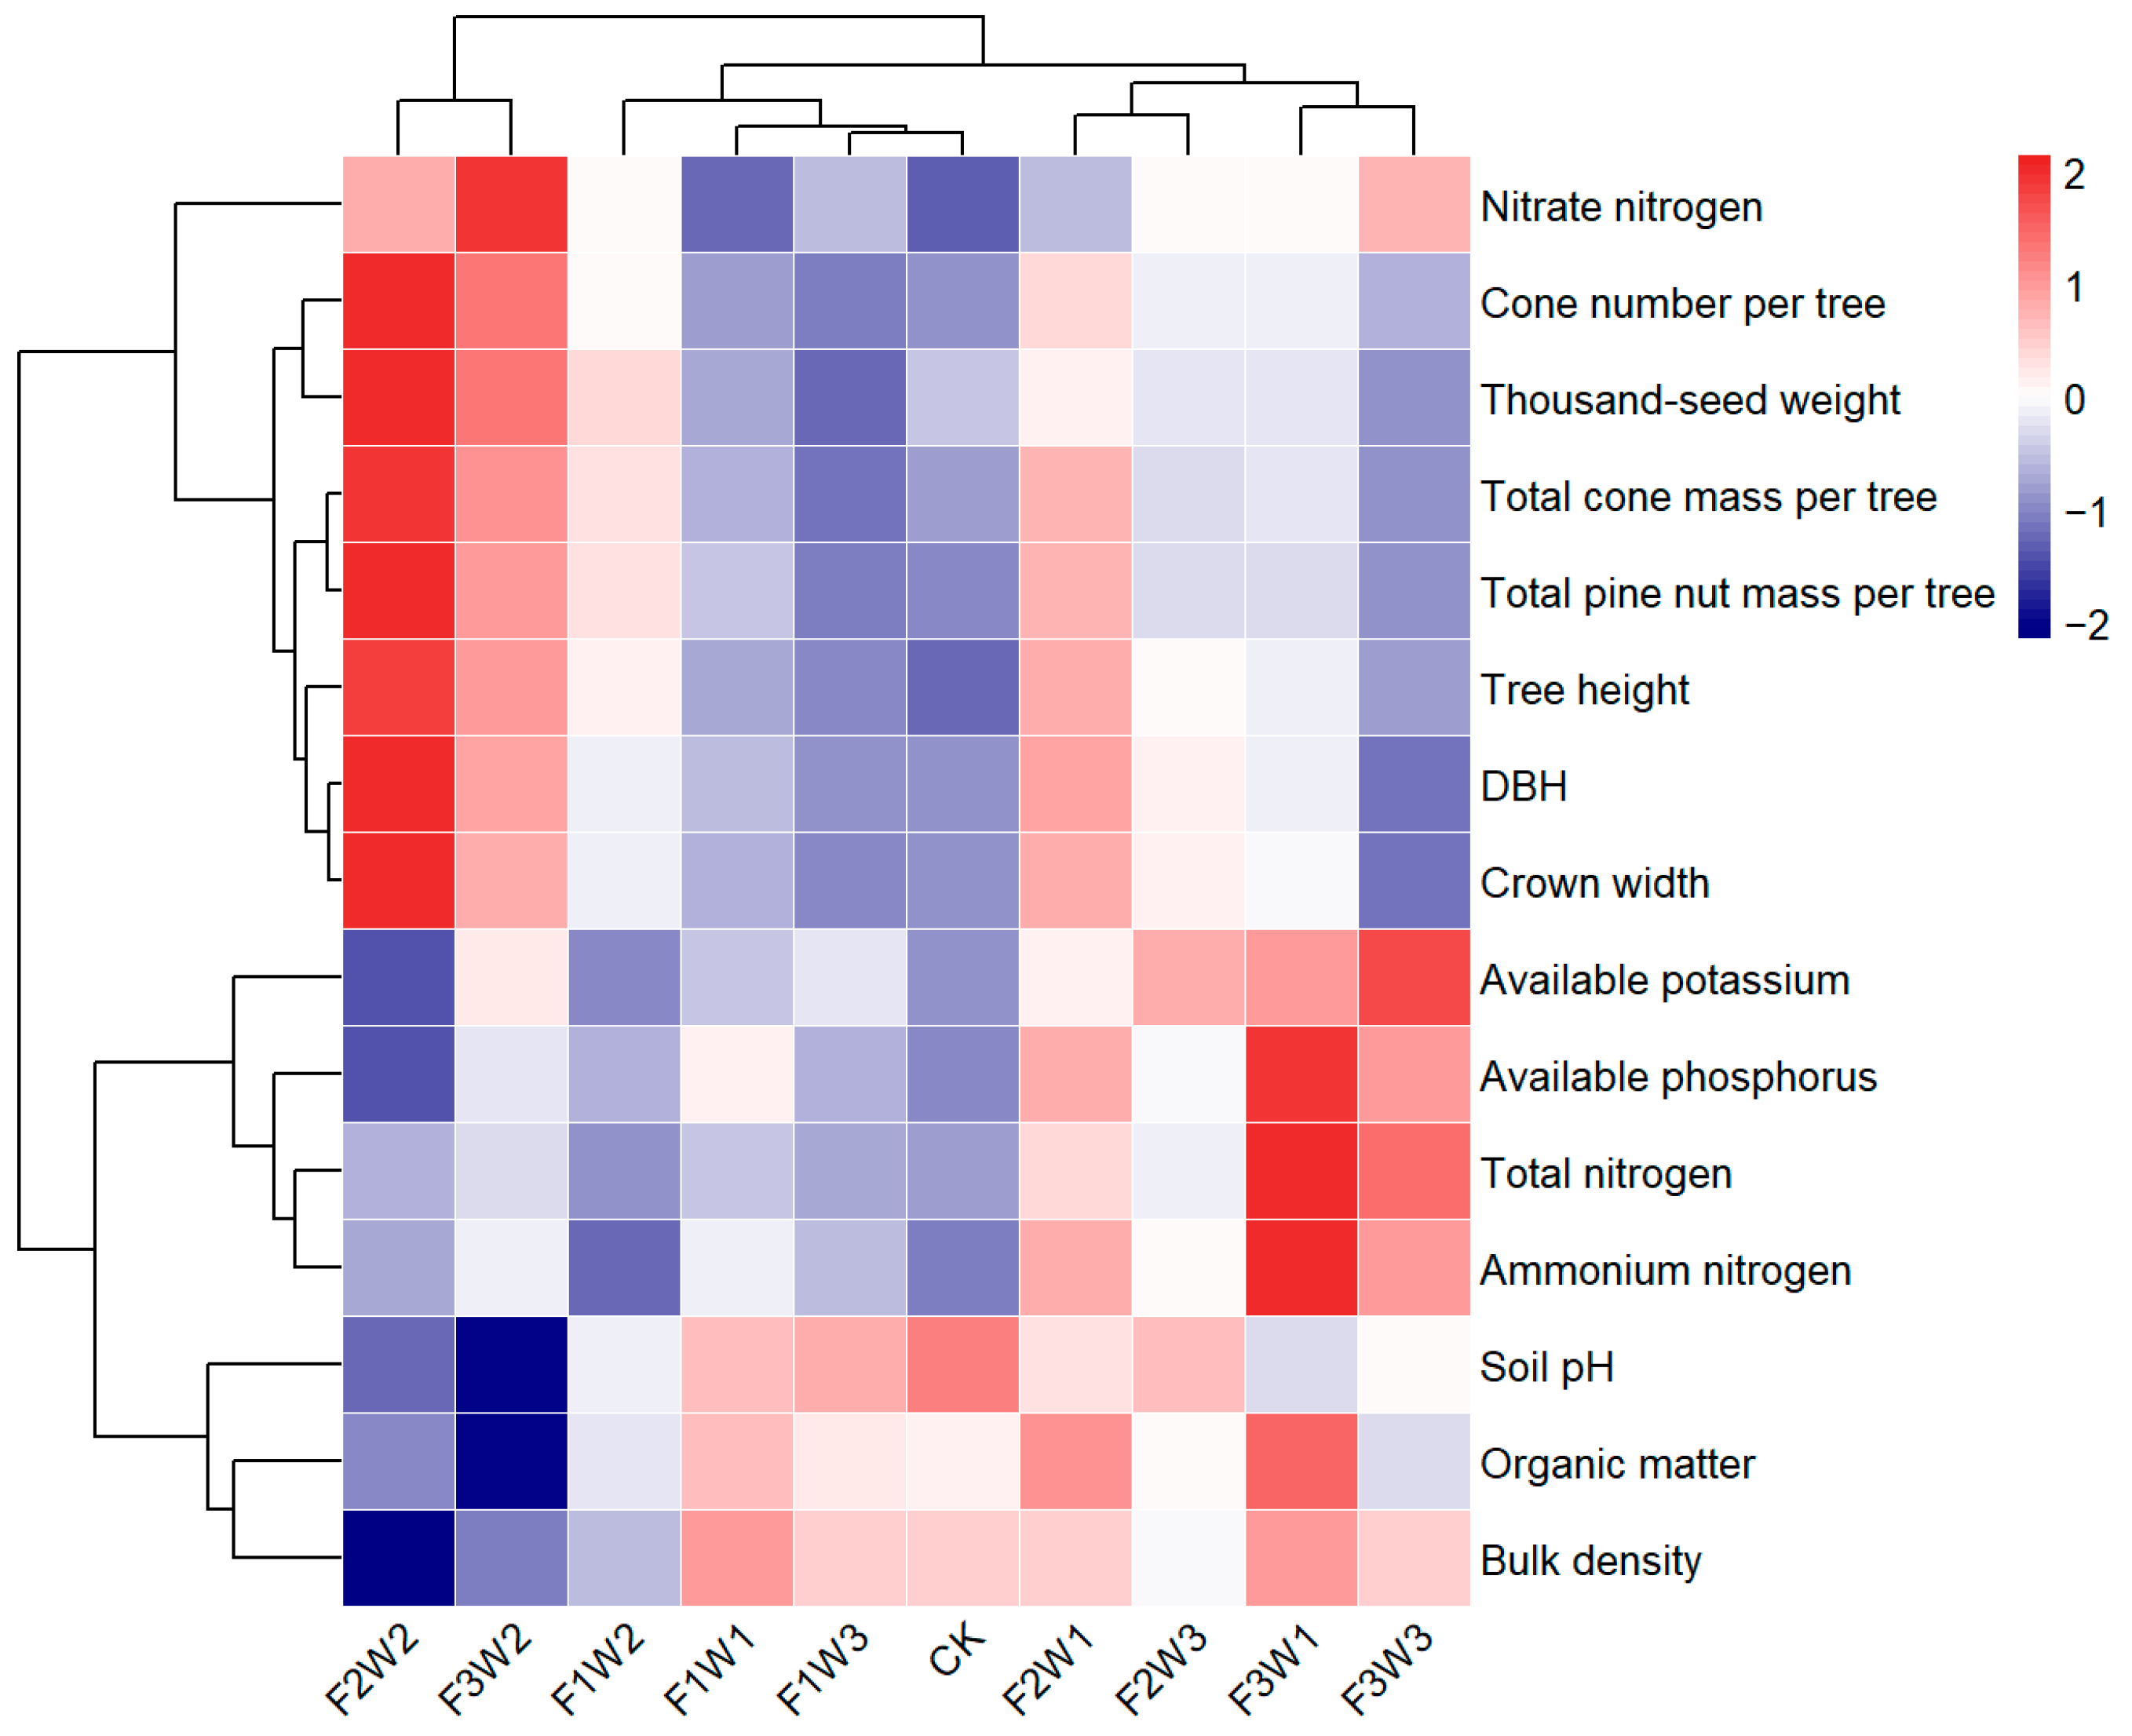

Disclaimer/Publisher’s Note: The statements, opinions and data contained in all publications are solely those of the individual author(s) and contributor(s) and not of MDPI and/or the editor(s). MDPI and/or the editor(s) disclaim responsibility for any injury to people or property resulting from any ideas, methods, instructions or products referred to in the content. |
© 2026 by the authors. Licensee MDPI, Basel, Switzerland. This article is an open access article distributed under the terms and conditions of the Creative Commons Attribution (CC BY) license.