


Abstract
Road networks providing access to forest stands, including integral parts such as timber yards, are subjected to significant loads from timber-transporting vehicles. These loads act on the road surfaces, causing them to deform. This study measured and compared the extent of deformation at two timber yards in the mountain forests of southern Poland in the Western Carpathians. These surfaces were constructed as: crushed stone (timber yard in the Ustroń Forest District) and earth (Forest Experimental Station of the University of Agriculture in Kraków). The measurements were carried out using photogrammetric techniques based on aerial surveys by an unmanned aerial vehicle. The measurements were based on networks of reference points with coordinates in local coordinate systems. During the period between the flights, timber was being stored, handled and transported at both sites. The forest administration provided data on the volume of timber delivered to and removed from the storage yard, as well as basic information on the transport vehicles. Soil samples were taken from the surface of both storage yards for laboratory analysis to illustrate working conditions—the soil type, current moisture content, organic matter content and filtration coefficient (from the soil particle size distribution curve) were determined. Digital terrestrial model (DTM) rasters obtained from both aerial surveys at each storage yard were used to calculate differential rasters, which were analysed by plotting cross-sections at selected locations and directions and by calculating the volume of changes in surface geometry between the survey dates. The observed depths of ruts reach 0.4 m at the Ustroń storage yard and 0.5 m at the LZD storage yard, whilst changes involving the displacement of soil from the ruts above the previous surface level are 0.3 m at the Ustroń storage yard and 0.4 m at the LZD storage yard. Greater deformation was observed on the earth surface (with a high organic content and poorer drainage) than on the crushed stone surface, even though the latter was covered by an uncleared layer of mud and waste left over from timber handling. Given the two-site, single-cycle design of this study, this pattern is consistent with—but cannot on its own confirm—a stabilising effect of surface reinforcement; differences in soil moisture, organic content and observation period between the two sites may also have contributed and could not be separated from the effect of surface type alone.
1. Introduction
Mountain forests play a vital role in the environment by protecting the soil from erosion [1,2,3], safeguarding areas against avalanches, regulating water flows [1,2], stabilising stream beds, contributing to increased biodiversity, and acting as a climate-regulating factor. They also fulfil social, tourist, educational and economic functions. Globally, they cover an area of approximately 305 million hectares, and in Poland approximately 0.8 million hectares (almost 9% of the forested area).
In the Polish context, the non-productive functions of mountain forests are valued and respected, which does not preclude the prudent use of these forests and the provision of valuable raw materials sought after on the market. The condition for the sustainability of the forest in these areas—a very important principle of modern forestry—is achieved through the use of complex felling methods aimed at maintaining a multi-layered and multi-aged stand structure [4]. Similar principles are also applied in other European countries that manage forests under similar climatic conditions. The thinning and regeneration felling used in these operations, aimed at maintaining and strengthening the aforementioned structure, provide timber that is traded commercially.
In commercial forests, as well as in protective forests where limited forest management is practised, timber yards are essential components linked to the road network of each transport area [5,6]. Harvested timber is transported to these locations [7]; this is where timber sorting often takes place [8] and from where it is dispatched to customers. These facilities are located near points with established access to public roads with appropriate weight limits, directly adjacent to forest haulage roads with a paved or hard surface. However, the surfaces of the storage areas themselves are often unpaved. On storage area surfaces (including paved ones), a large amount of fine wood waste, bark, sawdust and loose soil accumulates after a certain period of use, which can form layers of debris of varying thickness. On unpaved and poorly drained surfaces, as well as on skid trails, we observe much more difficult working conditions (poor load-bearing capacity, rutting, large amounts of debris and mud). Such conditions on uncleared surfaces lower standards of productivity and work safety.
The loads on skidding vehicles, skidding conditions and the associated changes in the physical properties of natural ground along skid trails and within stands have been and continue to be the subject of numerous scientific studies and observations [8,9,10,11,12,13,14,15,16,17,18,19]. The cited works describe measurements and studies of skidding conditions using classical methods. These primarily involve physical parameters of the topsoil (ground) measured at designated points [14,20,21,22], as well as penetrometer measurements and soil density measurements in and adjacent to skid tracks [12,23,24], as well as rut depths [25].
Advances in and the availability of photogrammetric technology [26] now make it possible to observe changes in the spatial position not only of individual points (classical geodetic measurements) but of entire surfaces at high resolution [27,28,29,30,31,32], whilst measurements taken several times over a selected time sequence allow for the comparison of the shape of the measured surfaces throughout the entire period under consideration. Using this digital technology, it is possible to numerically determine the elevations of selected points at a specific time and changes in their position, create and compare cross-sections in any direction and over any period, and calculate the volumes of changes in specified areas and over time [33,34,35]. These measurements yield a high density of information about the study area, which stems directly from the resolution of the images obtained [36,37,38,39,40]. The use of this technology can support the management of these facilities, and the results of this work may be useful in the design of surfaces for similar facilities.
The subject of this study is the stability of the geometry of timber storage yards used in Polish forests during their operation.
The aim of this study is to demonstrate the use of UAV-based photogrammetry for quantifying surface deformation at timber yards caused by forestry operations, illustrated by two contrasting case-study sites; given the exploratory, non-replicated design, the comparison between sites is treated as illustrative rather than as a controlled test of surface type.
2. Materials and Methods
2.1. Description of the Site, Research Facilities and Technologies Used
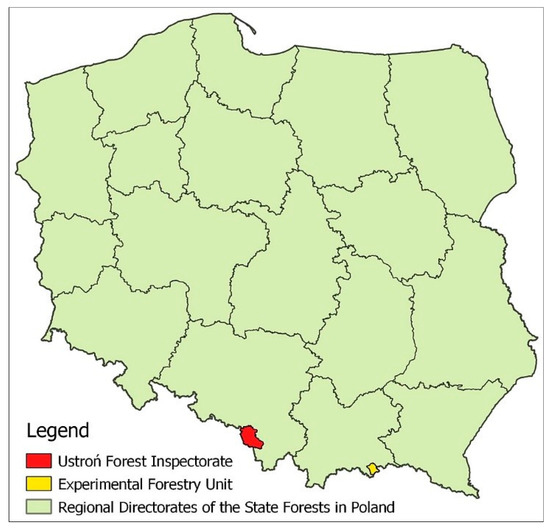
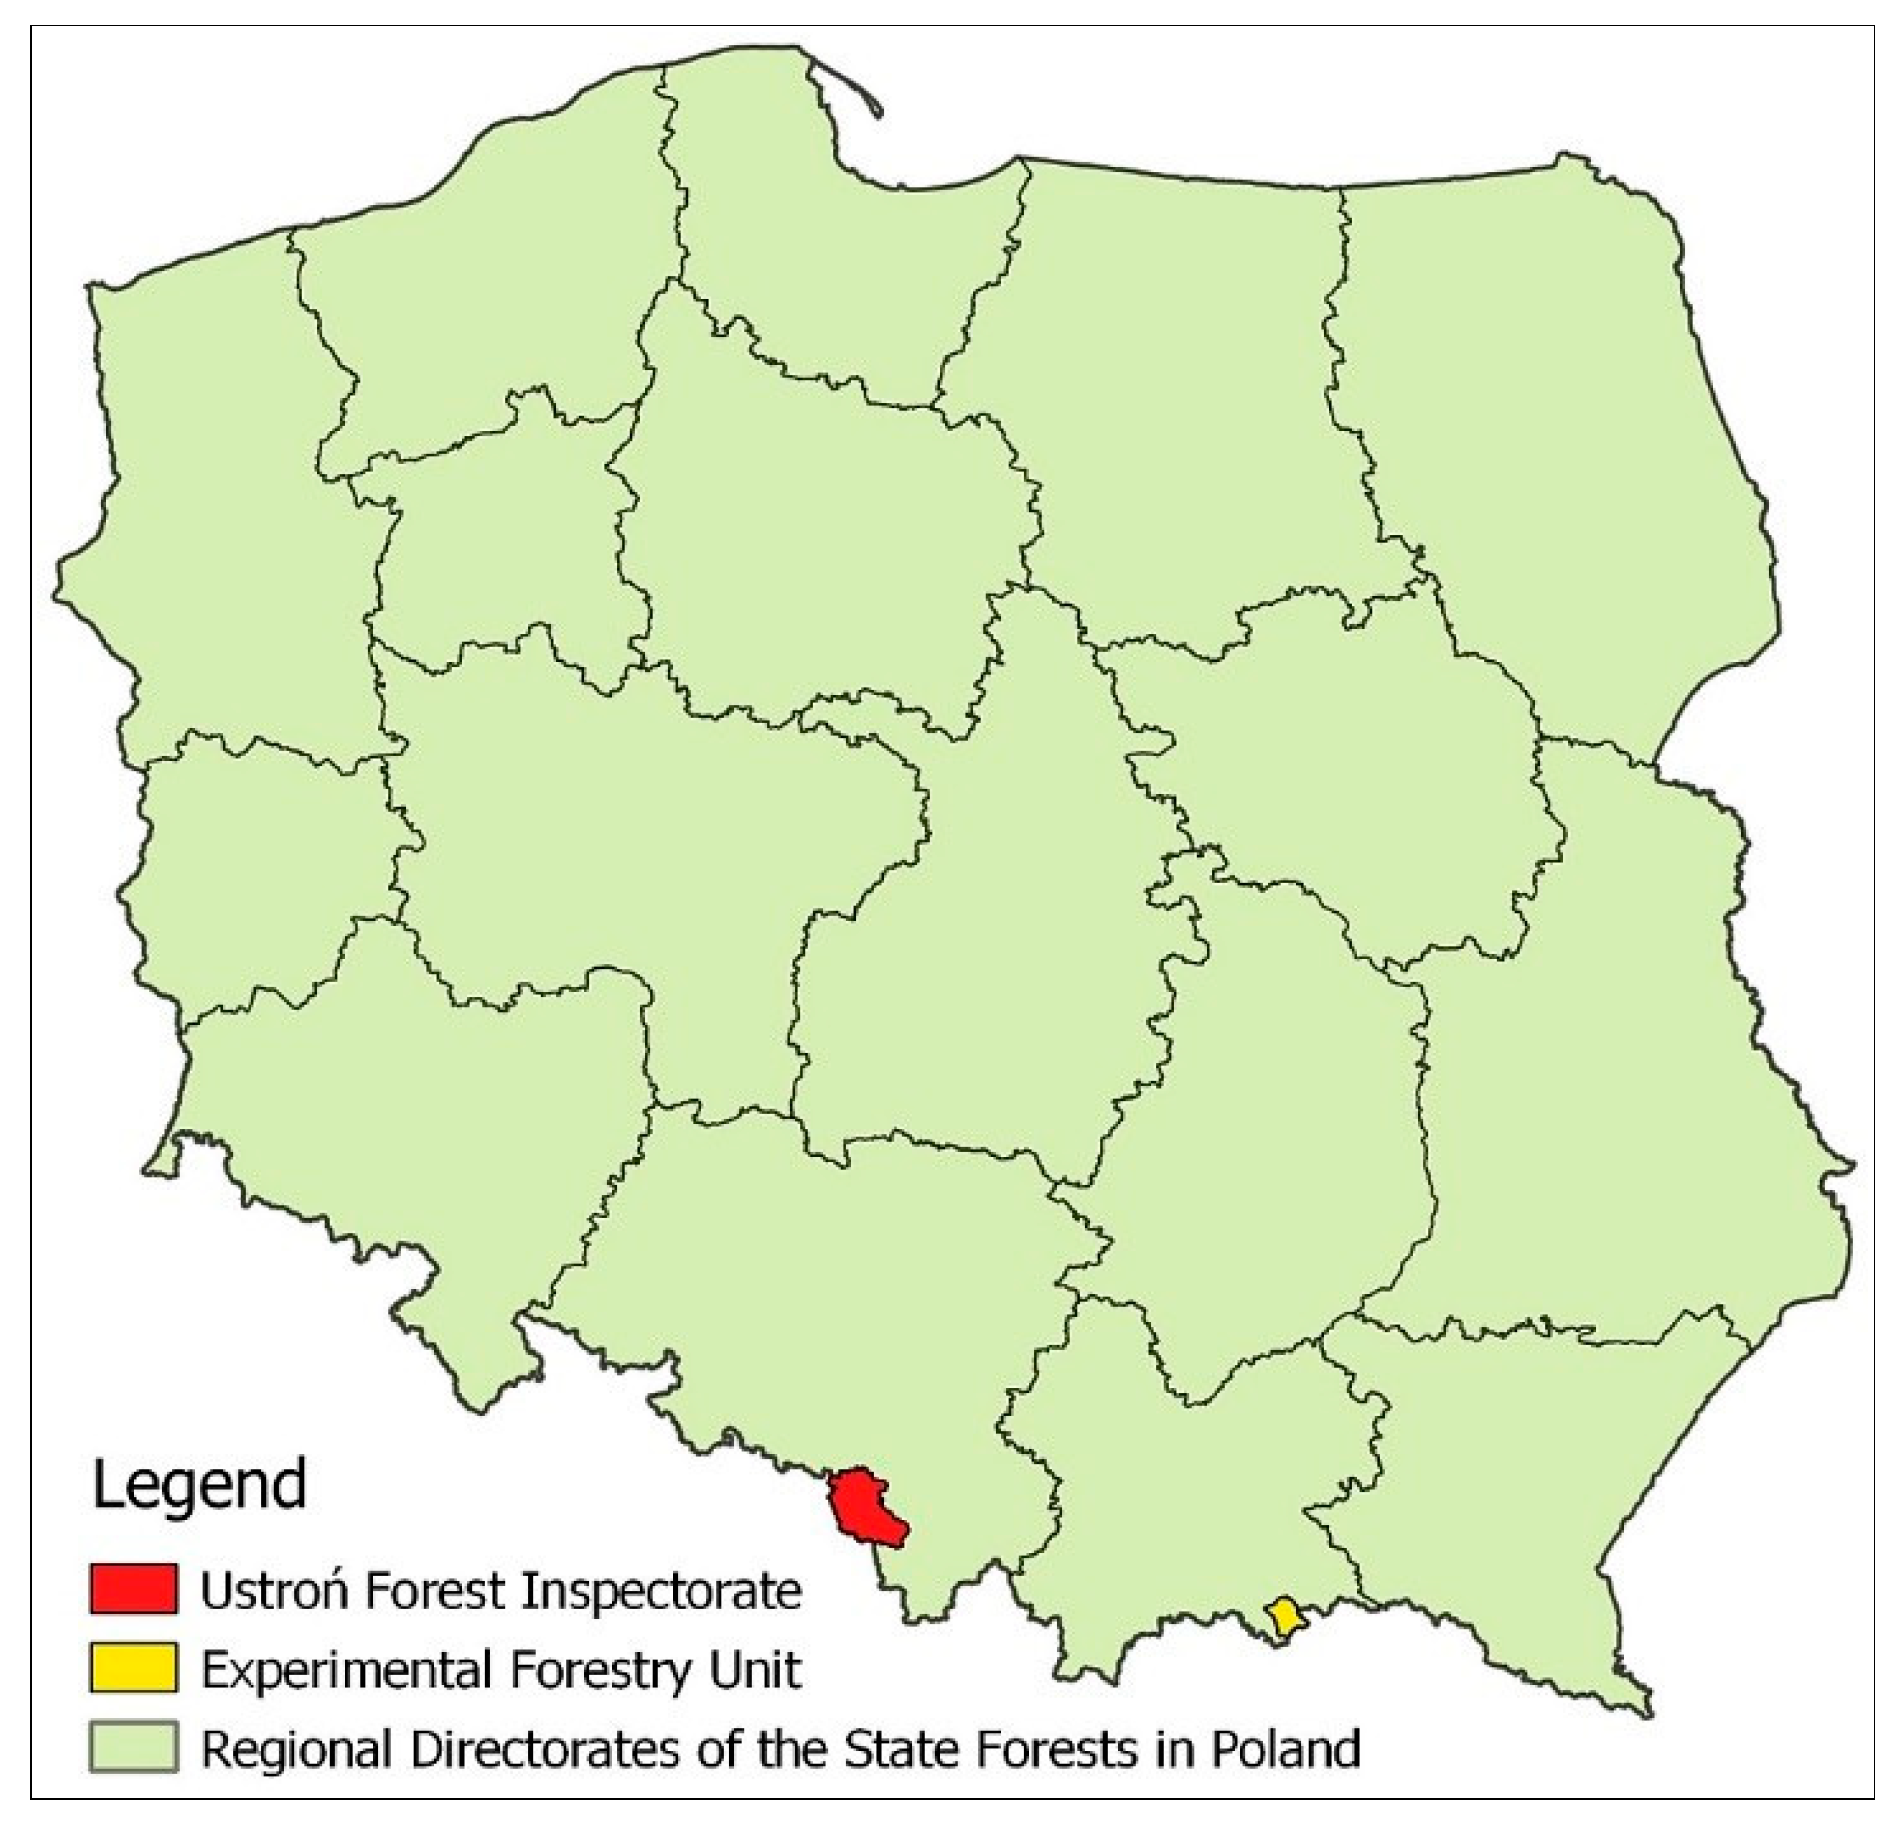
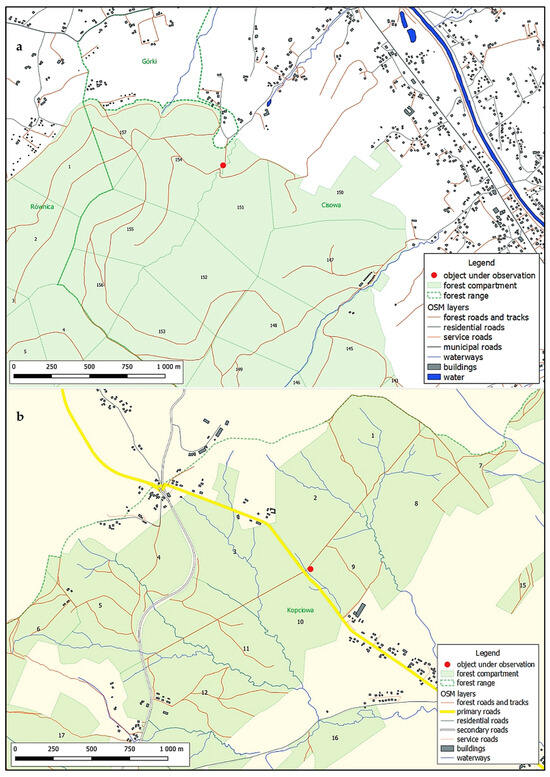
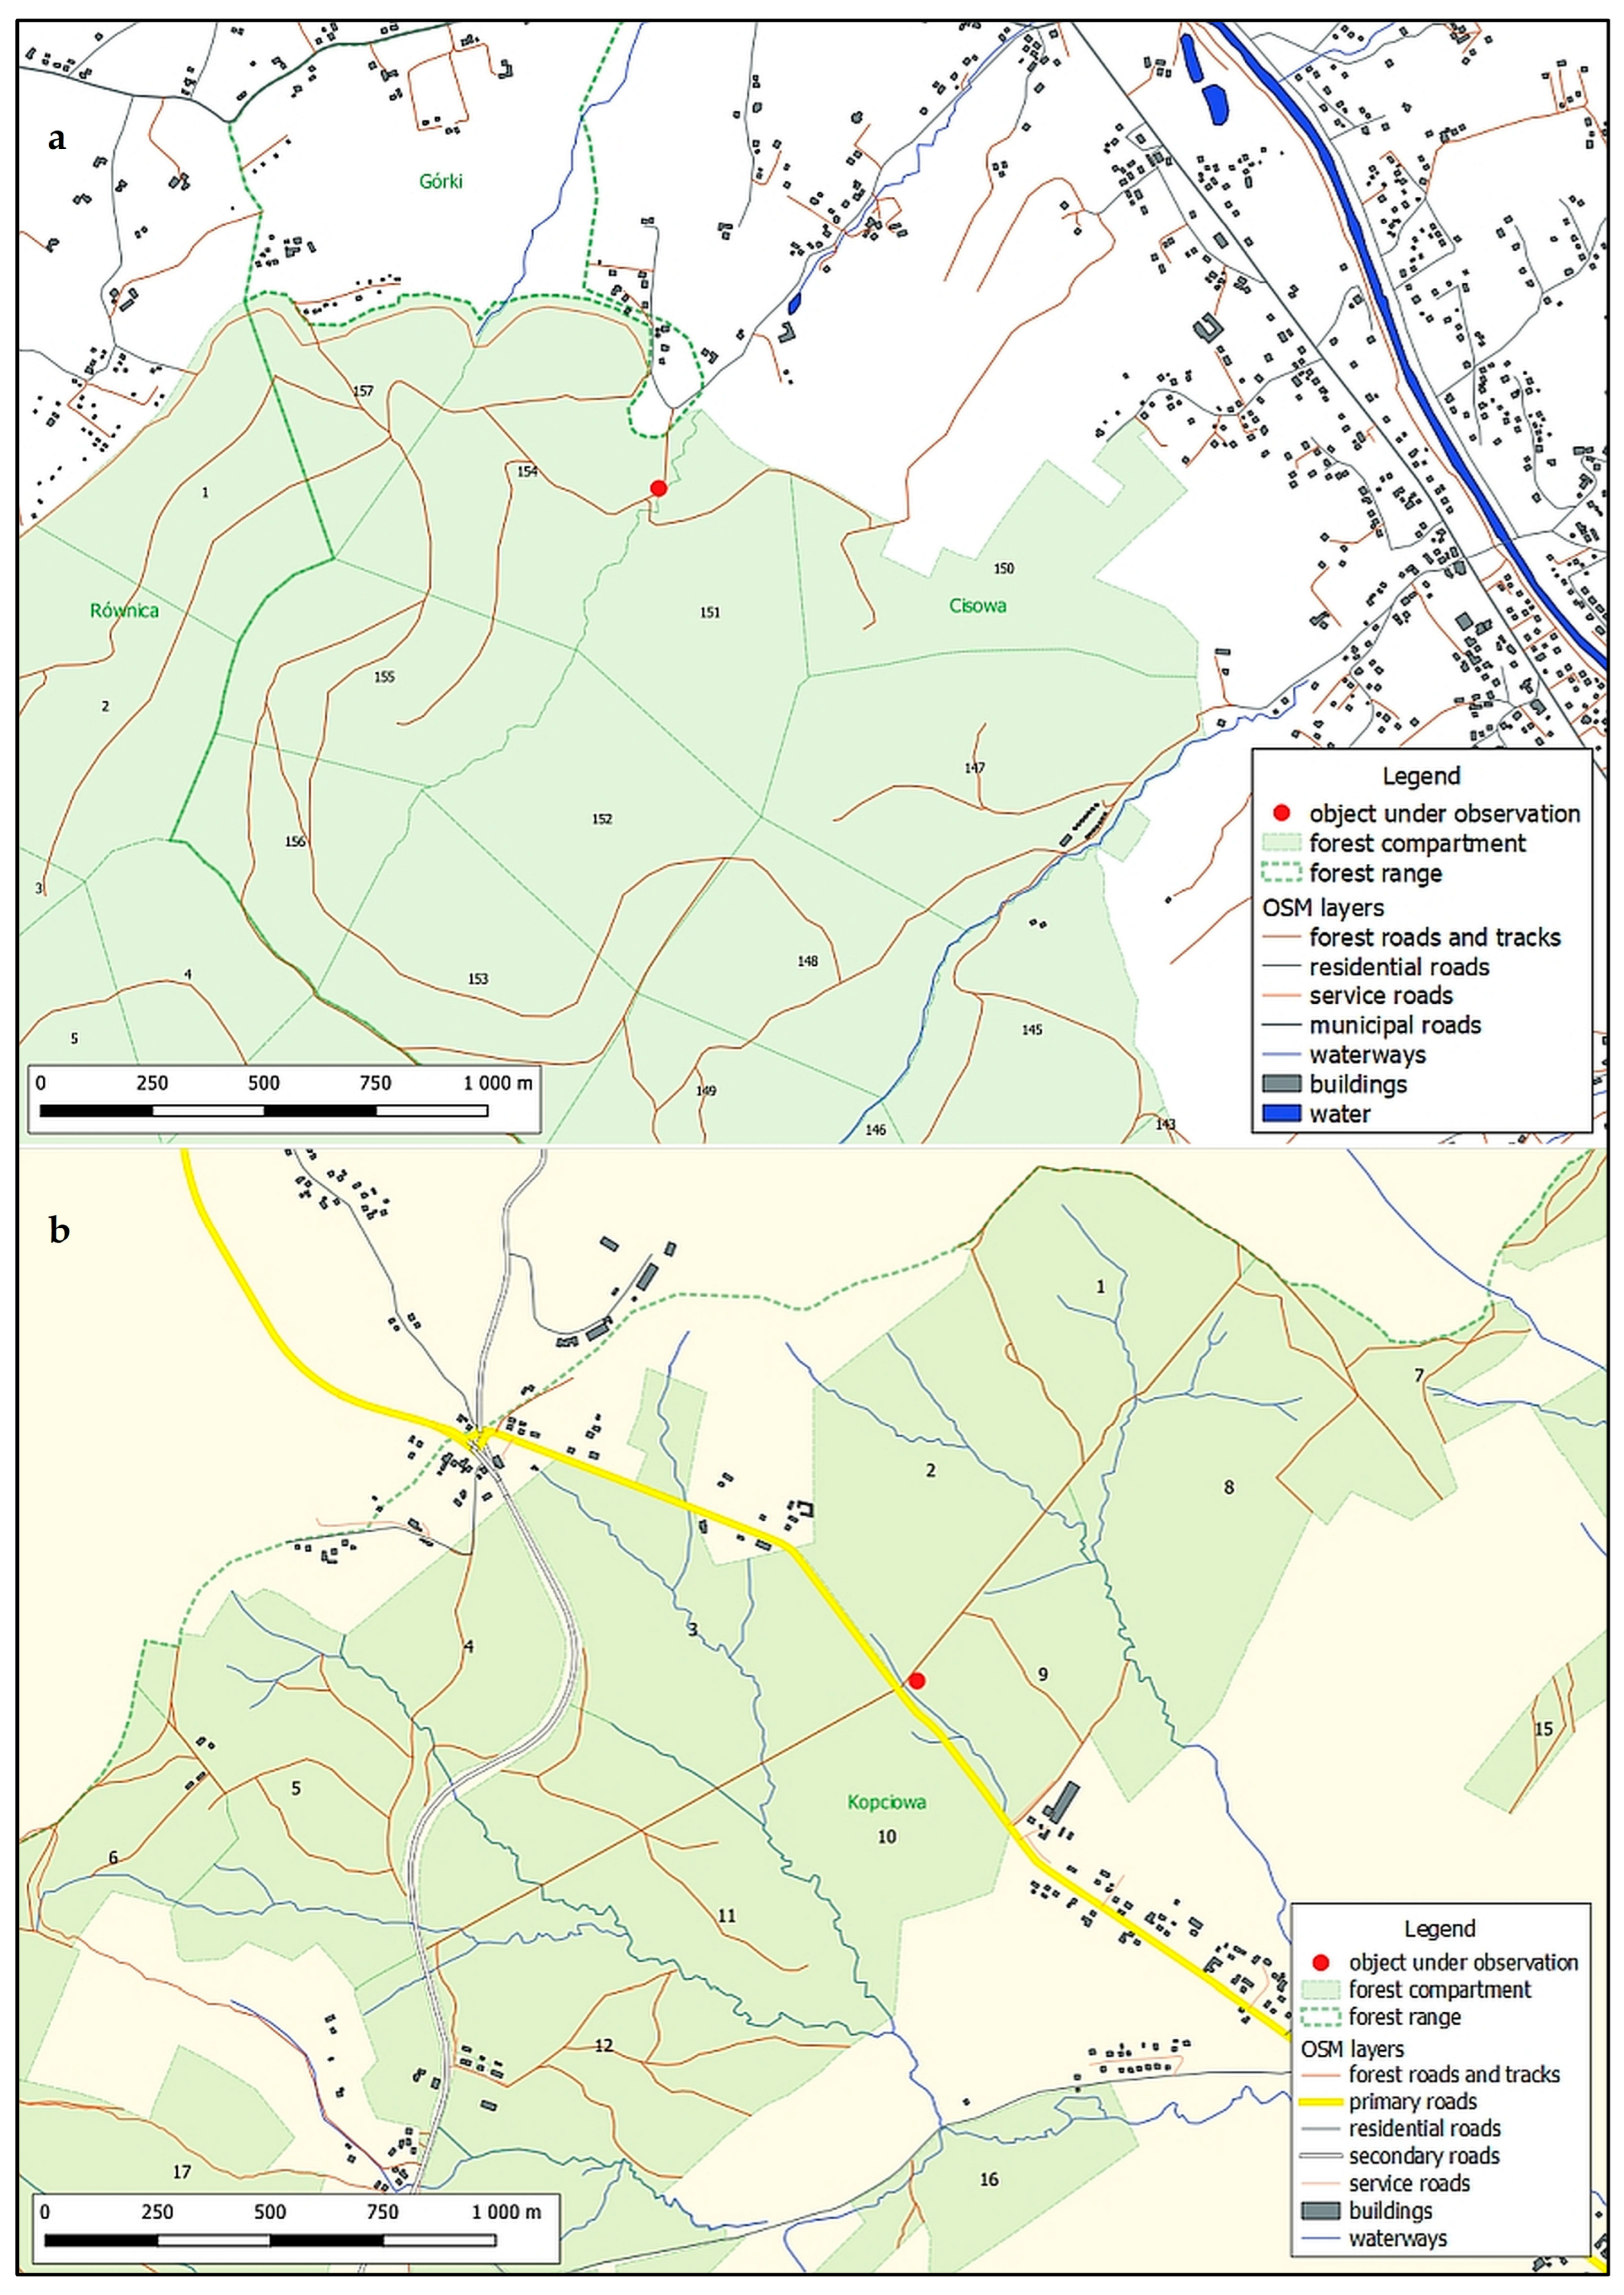
Photogrammetric surveys (unmanned aerial vehicle flights) were carried out in 2021 and 2022 on sections of two timber yards that form an integral part of the road network of the Ustroń Forest District (Silesian Beskid; GPS: 49.742826, 18.858073, hereinafter referred to as the “Ustroń timber yard”) and the Forest Research Station (Sądecki Beskid; GPS: 49.458784, 20.967687, hereinafter referred to as the “LZD timber yard”). The location of both study areas is shown in Figure 1. In both cases, the timber yard sites are situated alongside crushed-stone-surfaced haulage roads—the relevant map fragments are shown in Figure 2 and Figure 3.
Figure 1.
Location of the study areas.
Figure 2.
Overview maps of the study areas showing the location of the storage sites: (a)—Ustroń Forest District, (b)—LZD.
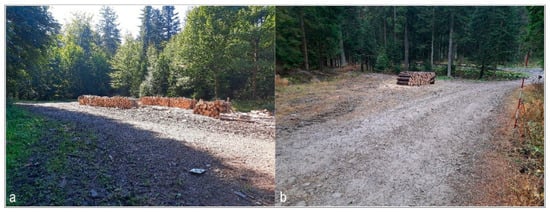
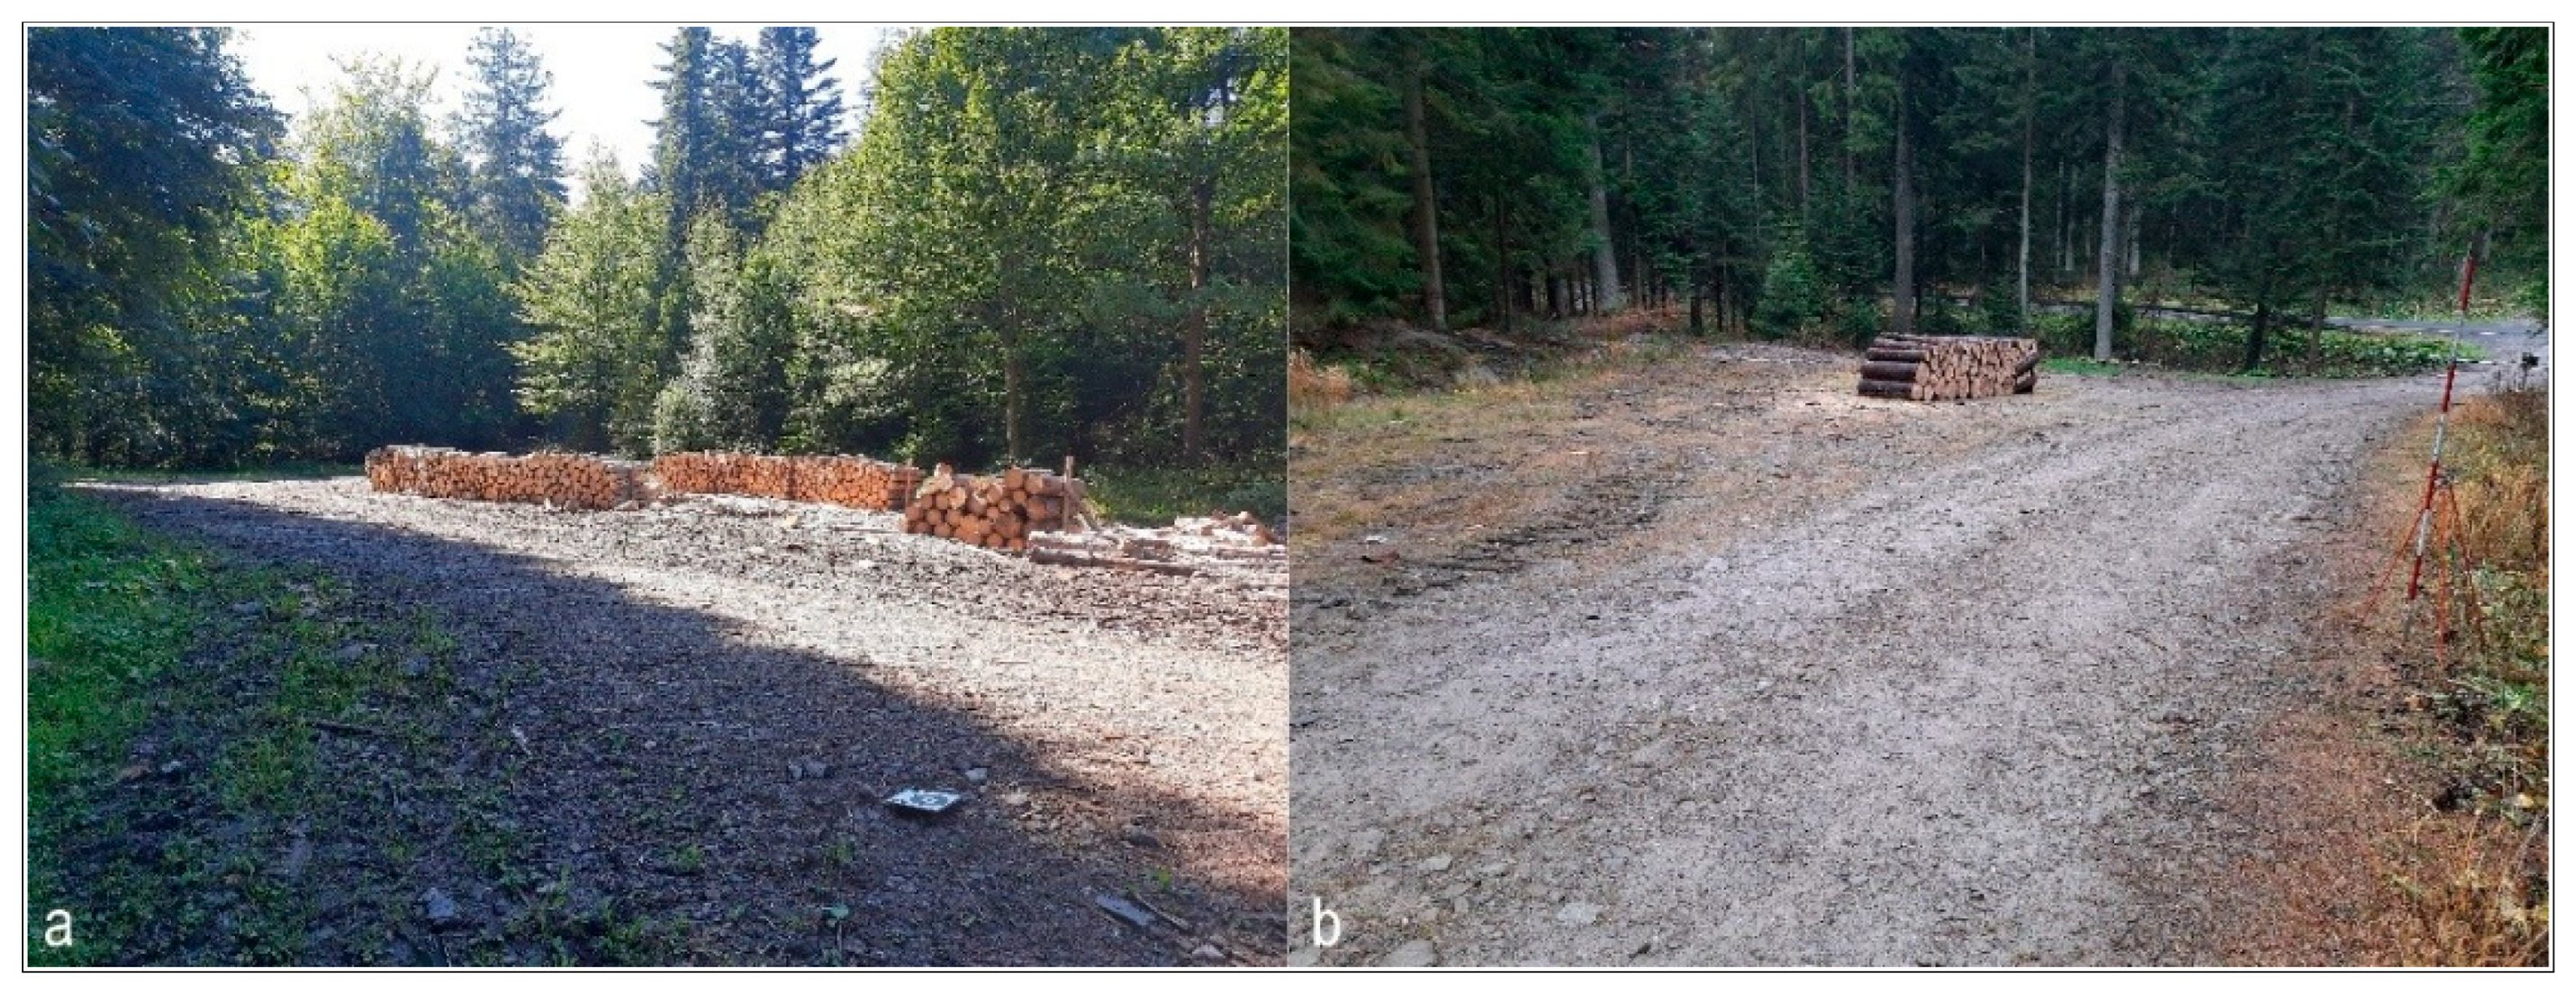
Figure 3.
The storage facilities under investigation: (a)—the Ustroń storage facility, (b)—the LZD storage facility. Photo: J. Gołąb.
The presented studies were conducted as separate measurements at two landfills during normal maintenance operations, without interfering with their progress—only observing selected effects. The same methodology was used, with some details adapted to the measured object (e.g., the number of reference points was adjusted to the shape of the landfill and the stabilization capabilities of these points).
2.2. Methodology
2.2.1. Reference System
Closed polygons with coordinates in local coordinate systems were defined at both storage sites. The points were located in areas characterised by high ground stability and not exposed to the direct impact of machinery operating at the storage sites. The selection of the number of points ensured uniform coverage of the study area and allowed for their reconstruction in the event of damage. The coordinates of the points were calculated using the linear intersection method with the aid of optical instruments. Using the geoportal.gov.pl website, the approximate location of both sites was determined in the World Geodetic System 1984 (WGS 84) coordinate system.
2.2.2. Photogrammetric Flight Parameters
Due to the type of objects being surveyed and their partial obscuration by the crowns of neighbouring trees, flights were conducted in a gap in the tree stand at a height below the tree crowns: 3–5 m above ground level (AGL). Difficult terrain conditions and the nature of the flight necessitated a manually piloted flight at an estimated speed of approx. 0.5 m·s−1. A longitudinal and transverse overlap of approximately 70% was assumed. Under the conditions described, instead of individual images, an FHD 24 frames per second (FPS) video was recorded, with subsequent automatic and manual separation approximately every 20 frames. Number of photos used in the analyses: at the Ustroń depot—1st flight: 1646, 2nd flight: 1886, LZD depot—1st flight: 1457, 2nd flight: 2550.
2.2.3. Camera Characteristics
The unmanned aerial vehicle used is a DJI Mavic Pro (Shenzhen DJI Sciences and Technologies Ltd., Shenzhen, China). Brief characteristics of the installed camera: 1/2.3” CMOS sensor; effective pixel number: 12.35 MP; maximum photo resolution: 4000 × 3000 px; single pixel size: approx. 1.55 µm; photo format: JPEG and DNG RAW; equivalent focal length: approx. 26–28 mm (FF); lens brightness: f/2.2; field of view: 78.8°.
2.2.4. Timing of Photogrammetric Flights
Two flights were carried out at each storage site at intervals that allowed for the observation of changes in surface geometry resulting from operational activities. At the Ustroń storage site, the first flight took place on 6 September, the second on 11 October 2021; at the LZD storage site, the first flight was carried out on 9 November 2021, the second on 12 May 2022. The flight times were determined by the work schedule at individual depots and organizational possibilities. The periods between flights at the yards are different (Ustroń 5 weeks, LZD 26.5 weeks), but the traffic at the LZD yard was slightly lower judging by the amount of timber transported.
2.2.5. Processing of Photogrammetric Data
Selected images were processed in Agisoft PhotoScan Professional ver. 1.4.3, producing key outputs in the form of digital terrain models (DTMs) and an orthomosaic. At the stage of combining images, using the “medium” accuracy parameter, point clouds were obtained with deviations of several centimeters in the X and Y coordinates and deviations of several millimetres in the Z coordinate. Despite the low speed of the flights, some photos are not the most sharp, which forced slightly lower parameters for combining photos. The resulting DTM rasters were initially processed in SAGA GIS 7.8.2, and their differences were subsequently calculated in QGIS 3.16.0 Hannover. The differential rasters generated in the QGIS environment constitute the main objective of the study.
2.2.6. Soil Testing from the Surface of the Storage Areas
Samples were taken randomly: along a diagonal line, one near the center of the yard and two from locations near the edges. The collected samples with disturbed structure were placed in tight containers. In the laboratory, the following were determined on the basis of these samples: current moisture content by weight, soil type, filtration coefficient using the Hazen formula, and organic matter content. The current moisture content of the collected soil was determined using the oven-drying and weighing method [41], particle size of coarser fractions (≥1 mm) using the sieving method [42] and that of the finer fractions by the laser diffraction method [43]. Organic matter content by high-temperature combustion [44], filtration coefficient k, was determined on the basis of particle size distribution using the simplified Hazen formula [45,46]. All test procedures performed are described in the cited standards. The results of laboratory soil analyses are presented in Table 1.
Table 1.
Characteristics of soil samples from the surface of timber yards.
2.2.7. Accuracy Assessment and Uncertainty Analysis
Independent ground control points (GCPs) could not be established at either storage site. The working surface of a timber yard is covered by stacks of round wood and by processing waste that is moved, added to or removed during normal operations, so it does not offer stable, uniquely identifiable features that can be preserved undisturbed between two survey epochs. In place of an independent, GCP-based accuracy assessment, the reliability of the reported surface changes was instead evaluated from the internal precision of the point clouds themselves, following the quasi-stable-area approach used in DEM-of-difference (DoD) studies where independent control is unavailable [44,47].
For each site, the two DTMs were co-registered in the common local coordinate system and differenced on a regular grid. Because most of the photographed footprint at each site lies outside the zone of vehicle traffic and did not undergo real elevation change between surveys, the distribution of pixel-wise elevation differences over the whole footprint was used to characterise the noise level of the measurement, following robust statistical practice for DEM accuracy assessment [48,49]. The median and the normalised median absolute deviation (NMAD) of the difference raster were computed, and a 95% level of detection (LoD95 = 1.96 × NMAD) was derived for each site; pixels with an absolute deviation from the median below this threshold were treated as not distinguishable from measurement noise. Because deformation patterns are spatially contiguous (visible as coherent rutting features rather than isolated pixels), neighbouring pixels in the difference raster cannot be treated as statistically independent samples; formal hypothesis testing at the pixel level was therefore not attempted, and the LoD95 threshold above is used descriptively, as a detectability criterion rather than a significance test.
Gross outliers in the difference rasters were identified using a fixed physical-implausibility threshold (an absolute deviation from the median greater than 2 m, well above any plausible single-cycle change at these sites) and excluded from the descriptive statistics and volume calculations; such values were traced to isolated, single-pixel reconstruction errors confined to one of the two flights rather than to genuine terrain change and are discussed further in Section 4.
3. Results
3.1. Results of the Reference Network Measurements and Ground Investigations
The coordinates of the reference points were determined using standard surveying techniques, and their values in local coordinate systems are given below (Table 2). The accuracy of the coordinates results directly from the measurement methods used and the averaging of results from multiple measurements.
Table 2.
Coordinates of reference points [m] in local coordinate systems for both observed objects.
3.2. Description of the Work Carried out at the Storage Sites During the Observation Periods
Data on work and traffic at the timber yards during the specified periods was obtained from those directly responsible for forest management in both areas. At the Ustroń storage yard: volume of timber delivered to or harvested at the storage yard: 83.07 m3, volume of timber transported to customers: 99.12 m3; at the LZD storage yard: 63.36 m3 and 53.25 m3 respectively. Detailed data are provided in Table 3.
Table 3.
Quantitative summary of timber at storage yards during the study period and a brief description of the vehicles.
To supplement the general description of the research, the types and names of the transport vehicles used were provided, but the scope of the field work did not include measurements related to these vehicles in specific situations.
3.3. Results of the Study and Their Analysis
For the photogrammetric analysis, 1646 photographs (flight 1) and 1886 (flight 2) were compiled from the Ustroń archive, and 1457 and 2550 photographs respectively from the LZD archive. The large number of photographs used for the analysis is a direct result of the very low flight altitude and the technical parameters of the installed camera. The following DTM resolutions were obtained: Ustroń collection: 4.51 mm/pix (flight 1) and 4.11 mm/pix (flight 2); LZD collection: 3.91 mm/pix and 4.01 mm/pix respectively.
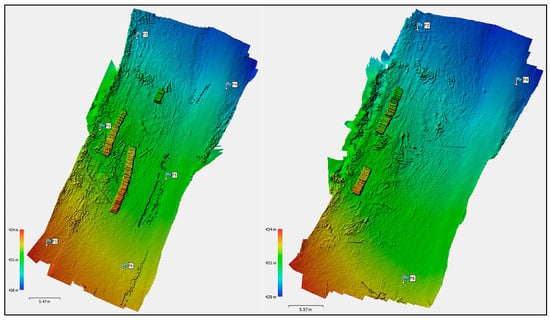
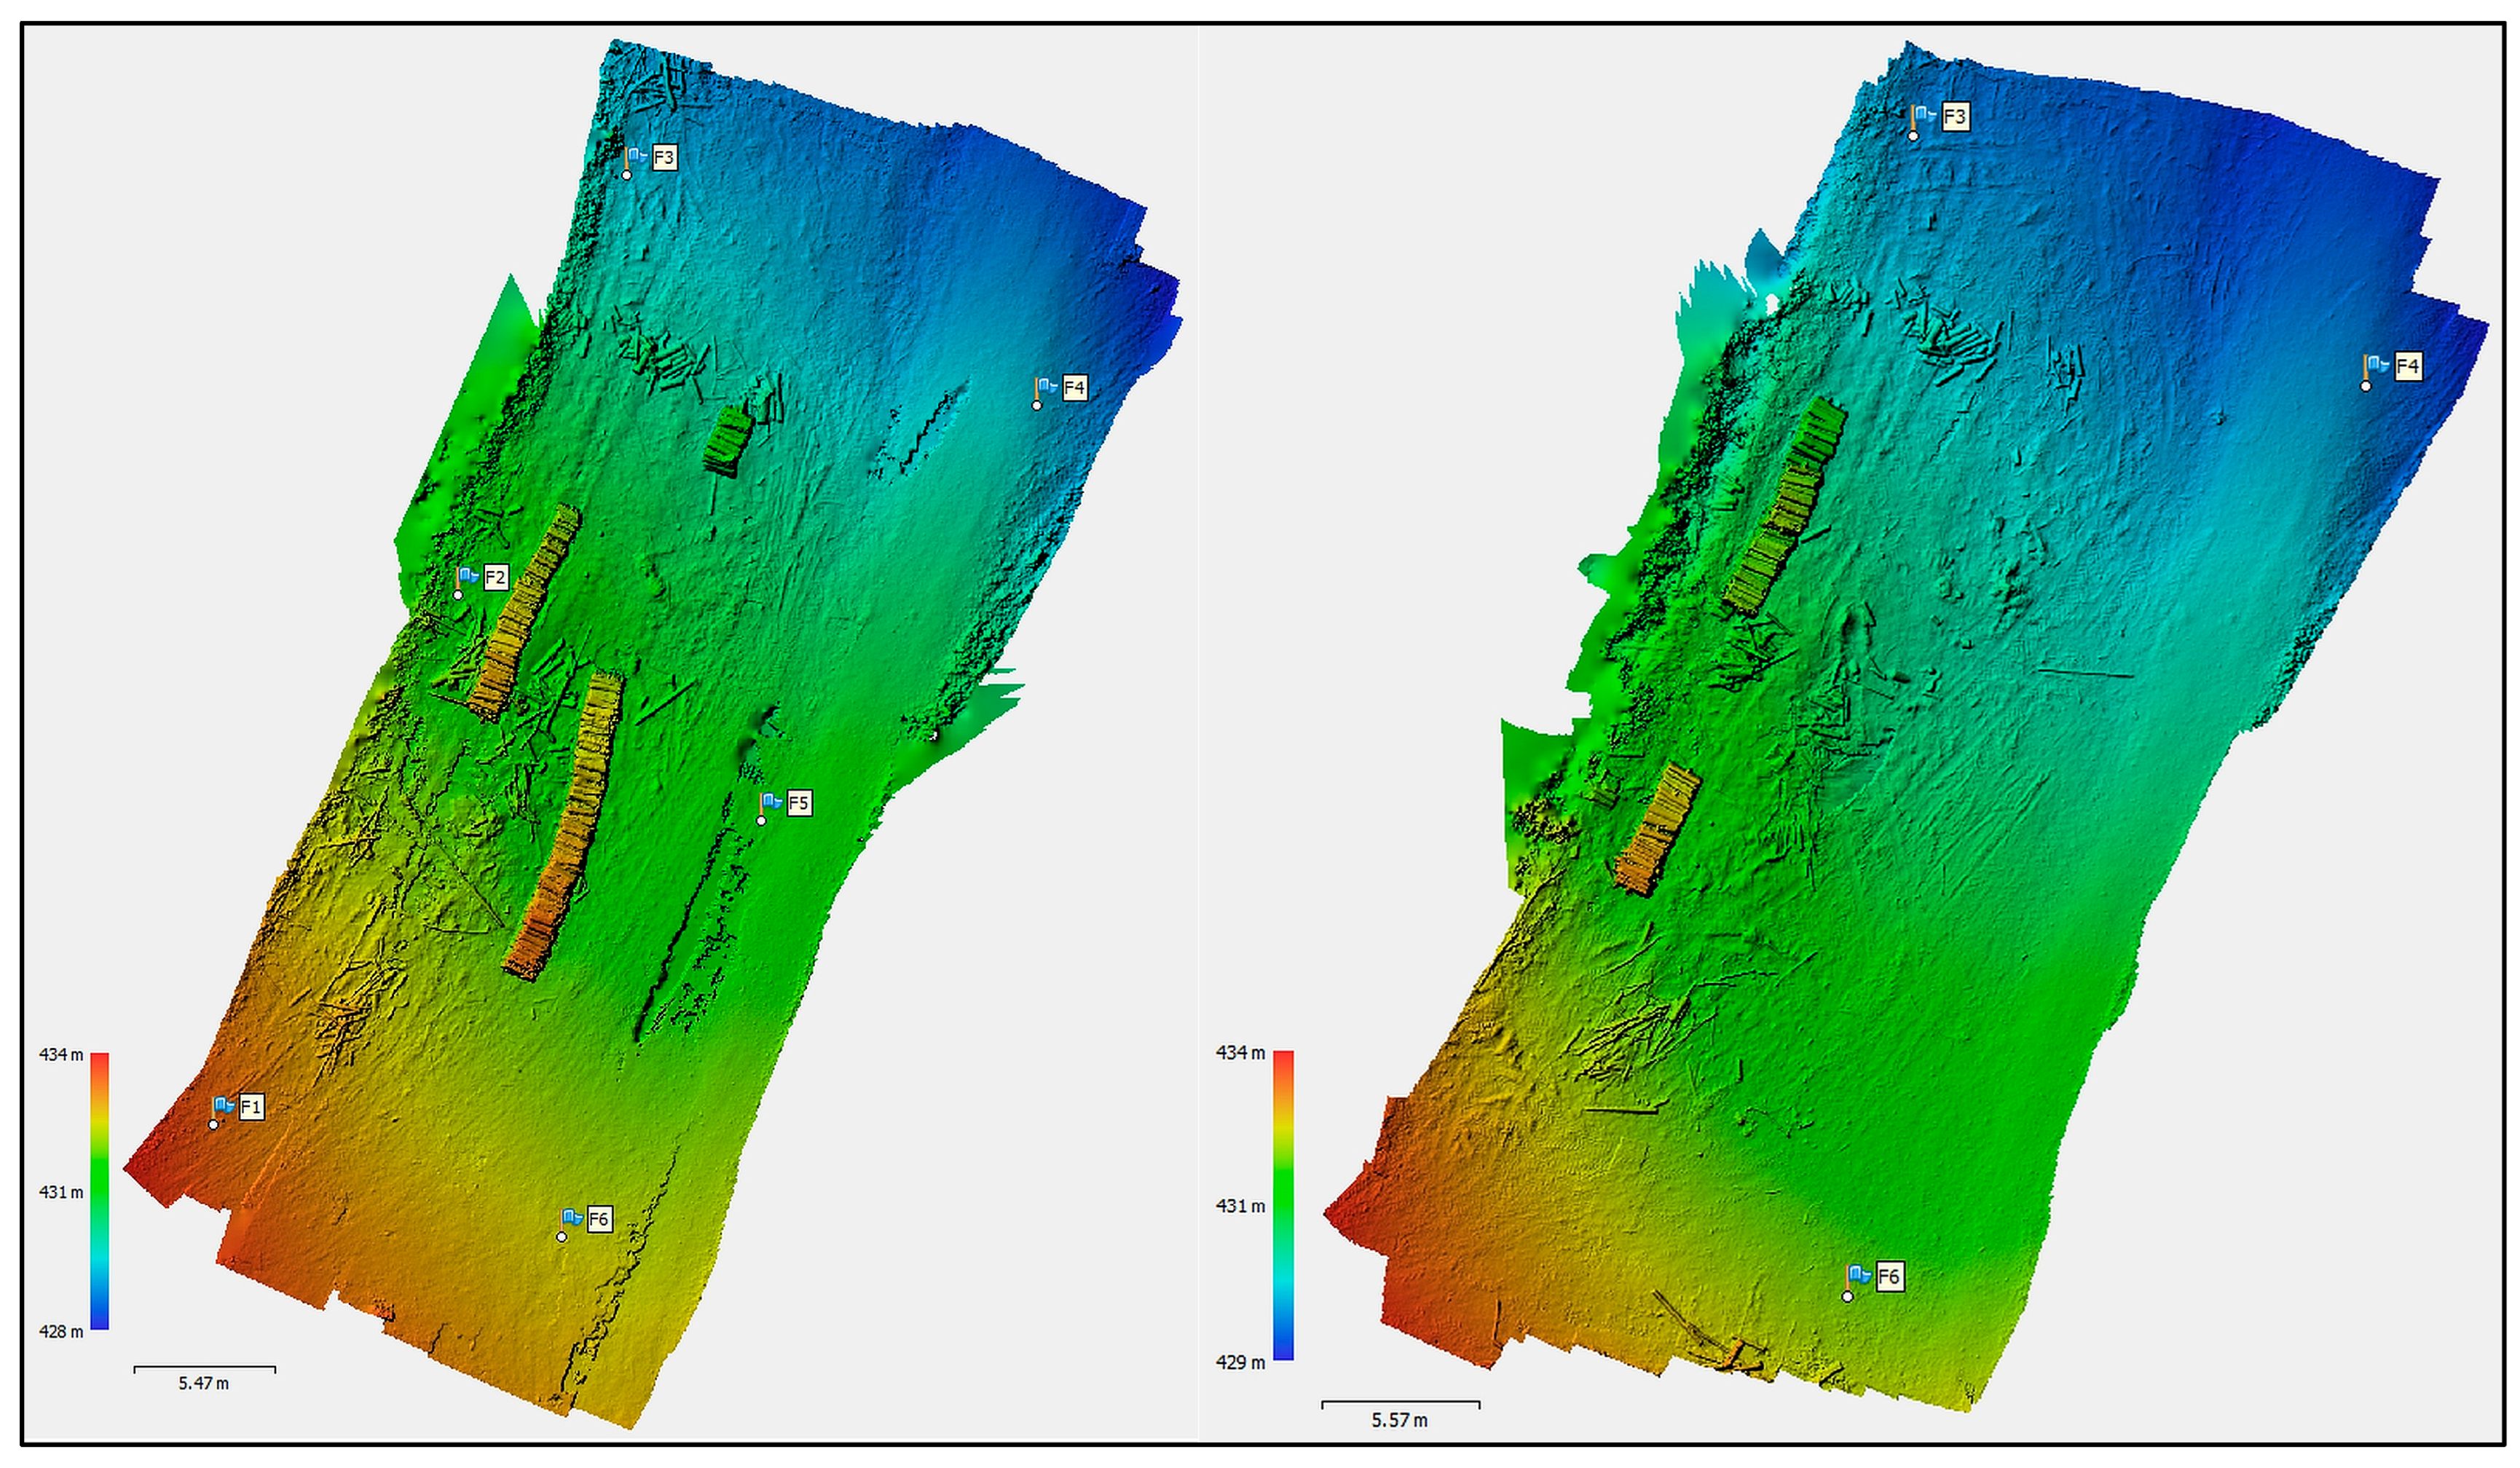
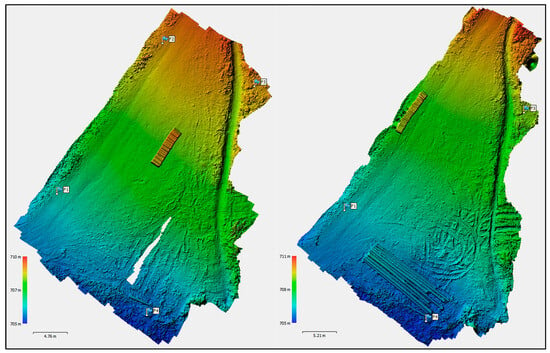
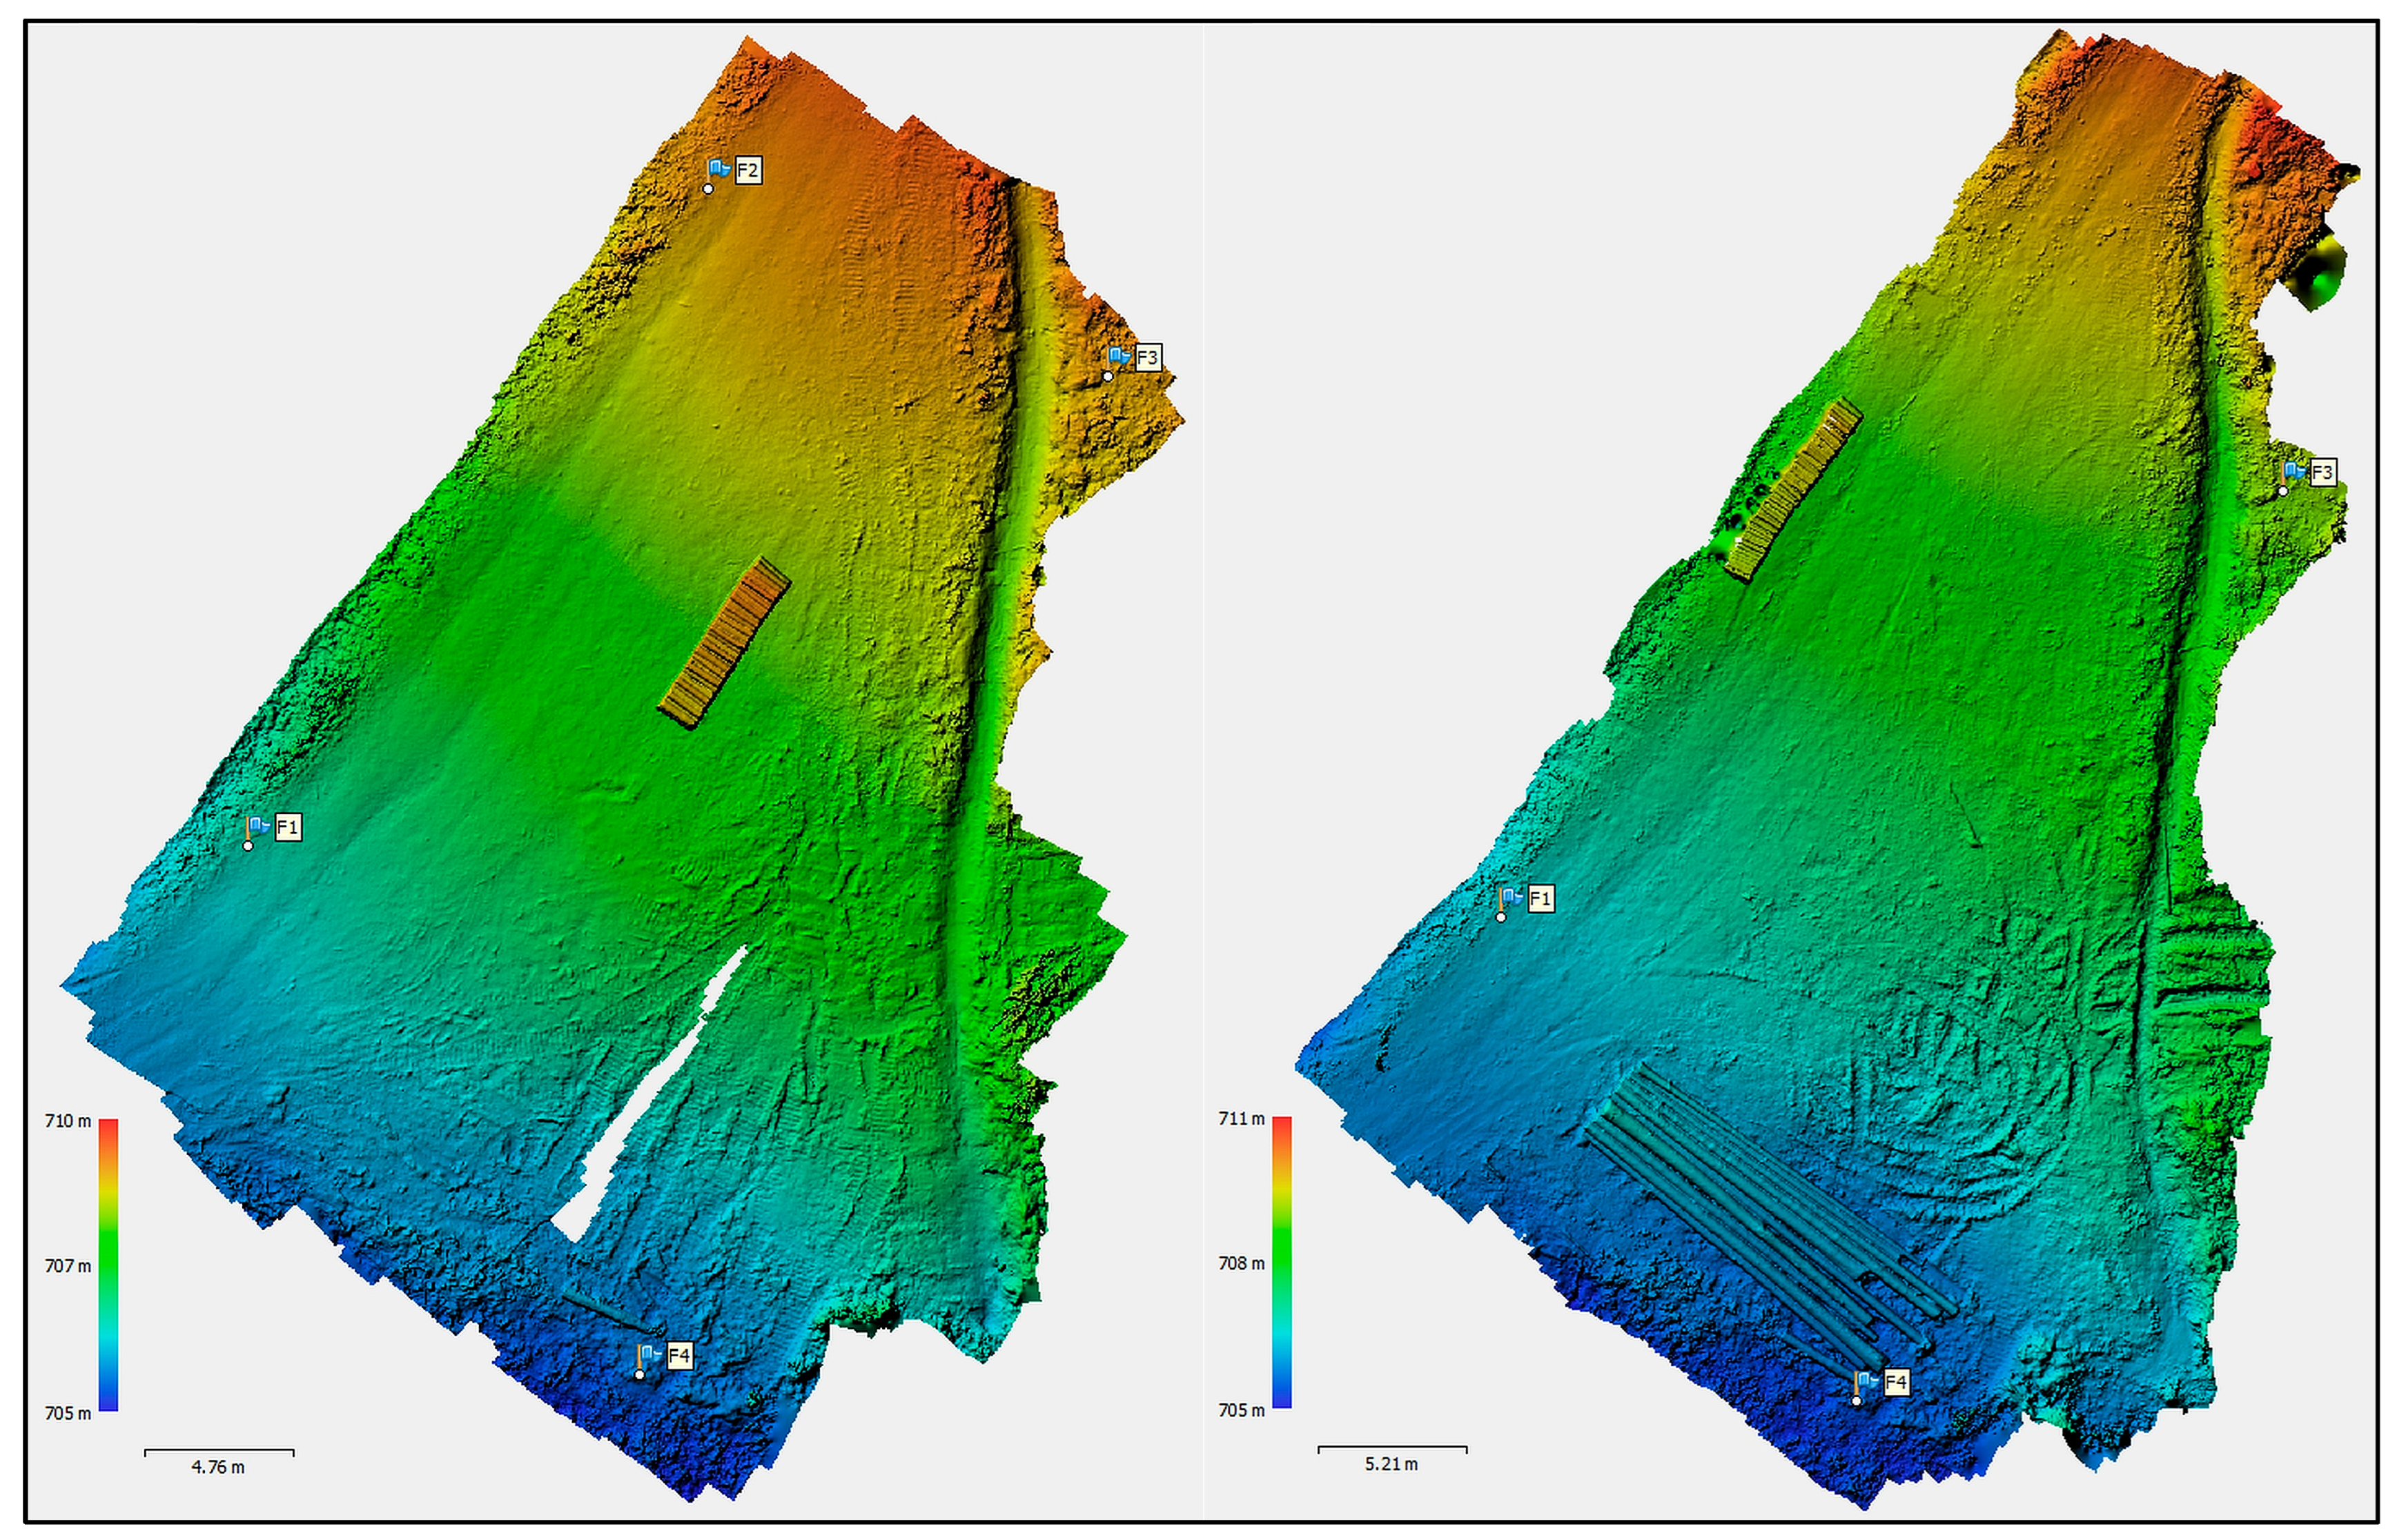
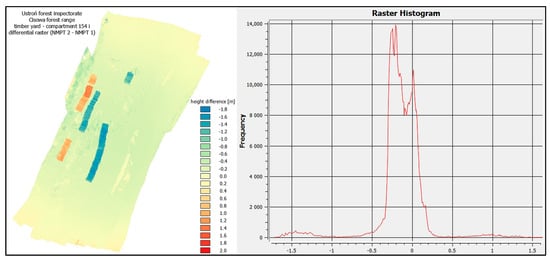
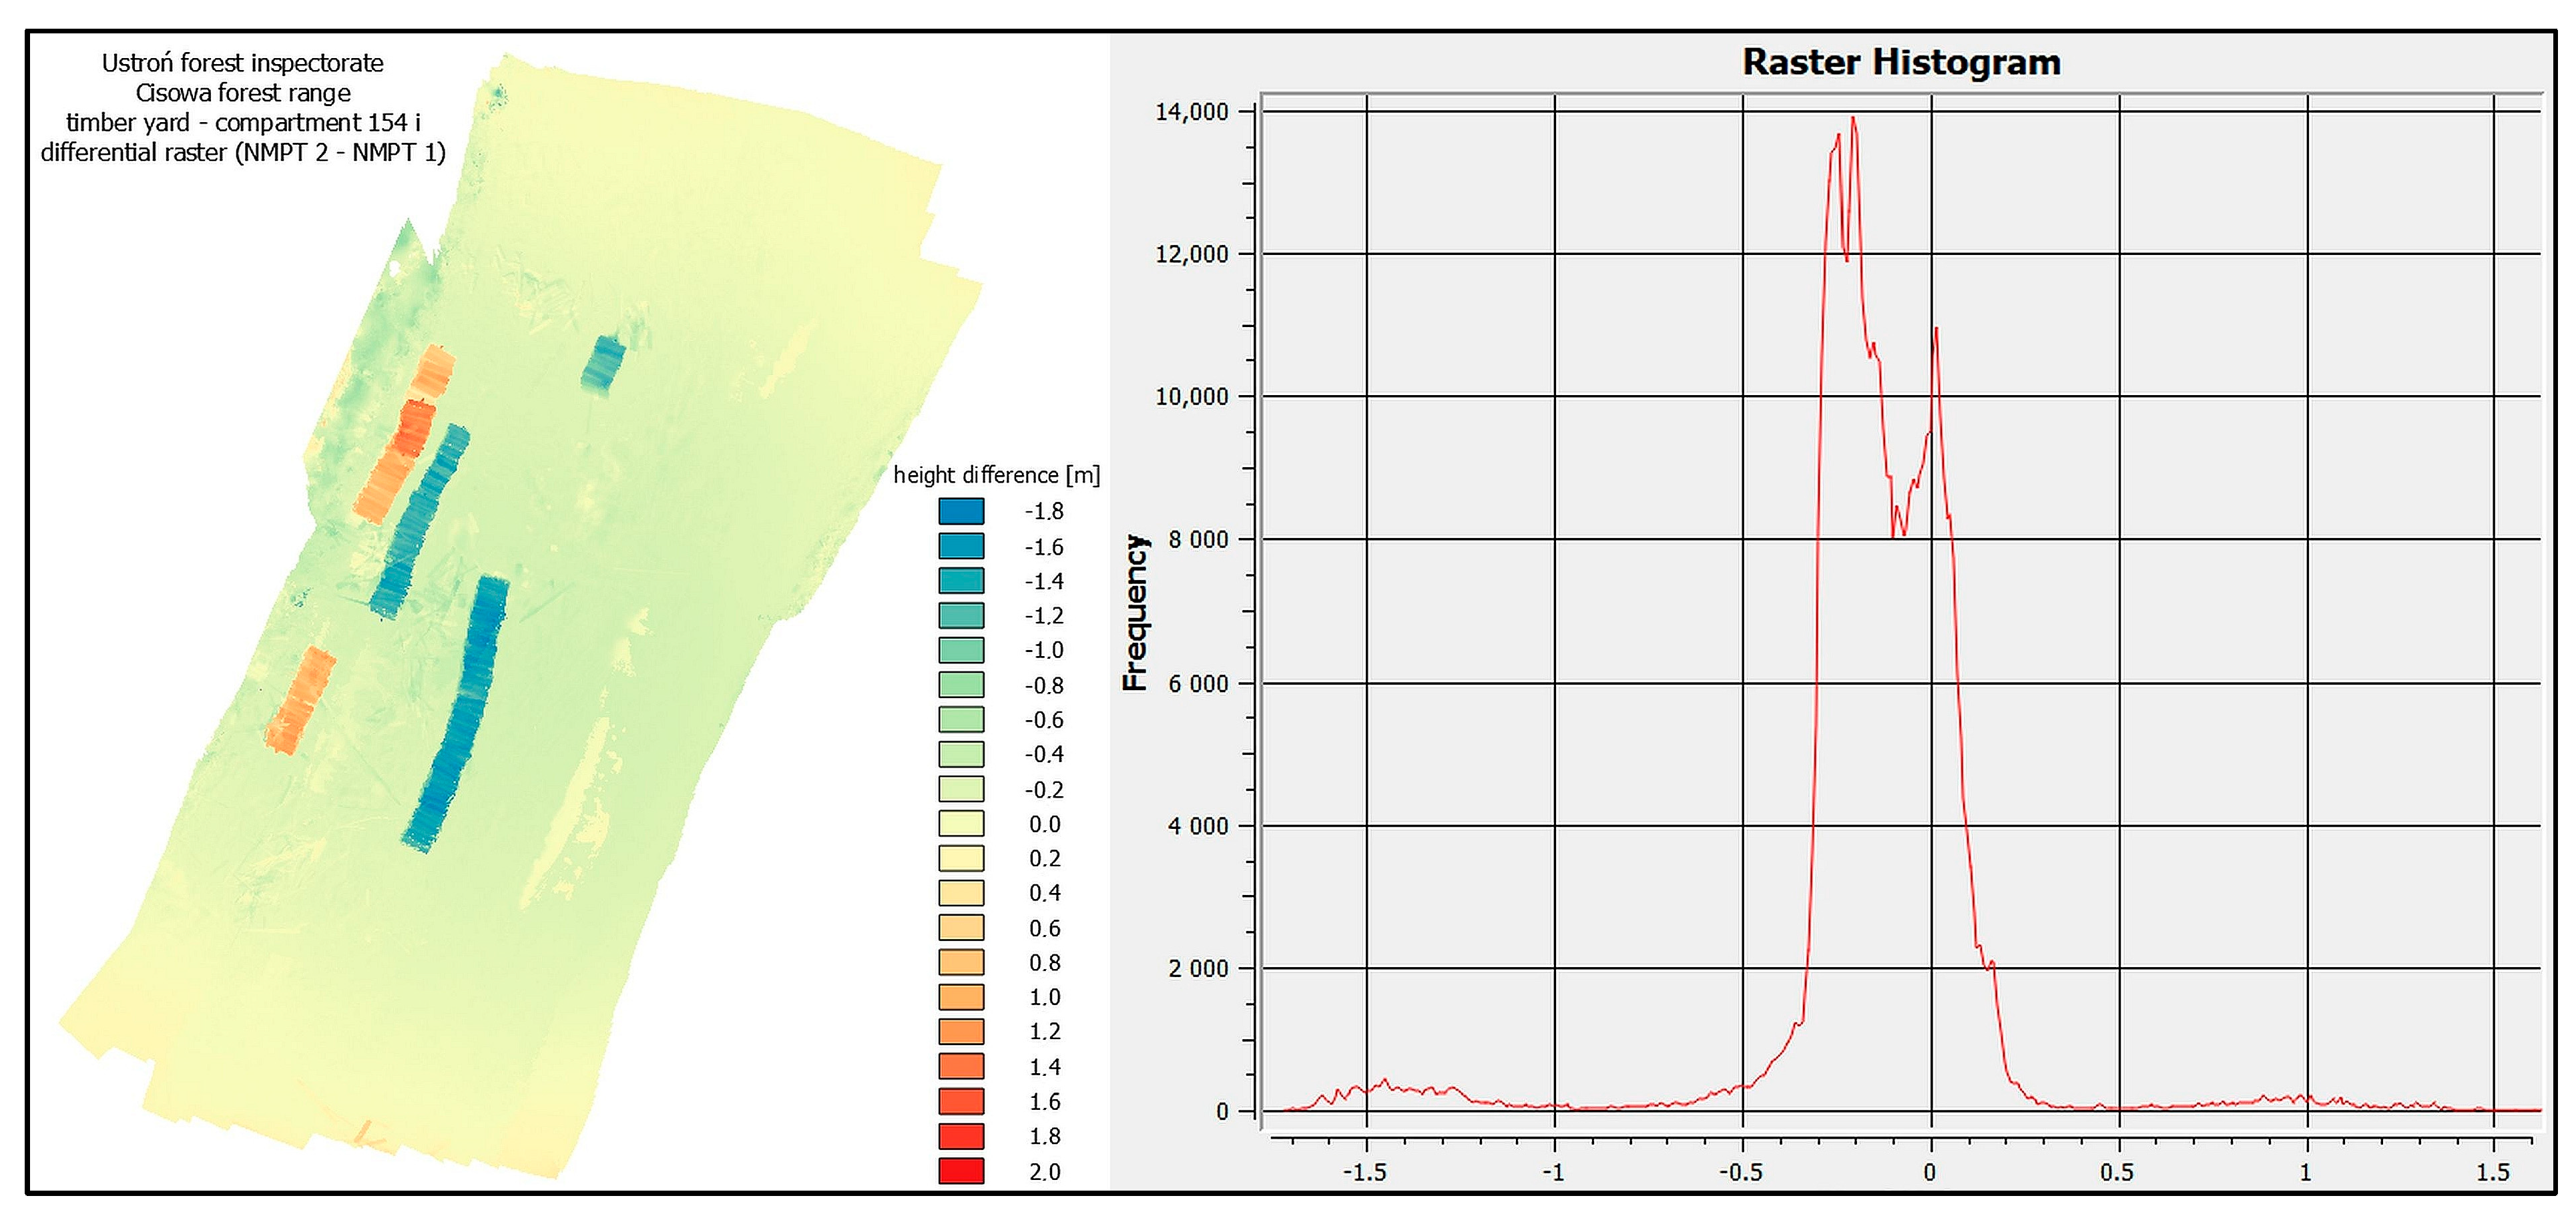
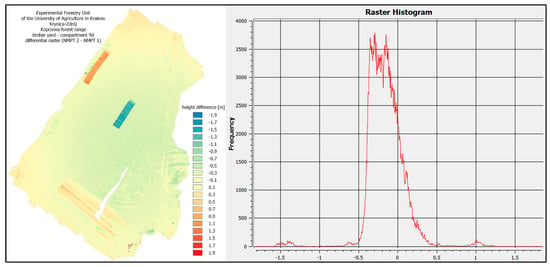
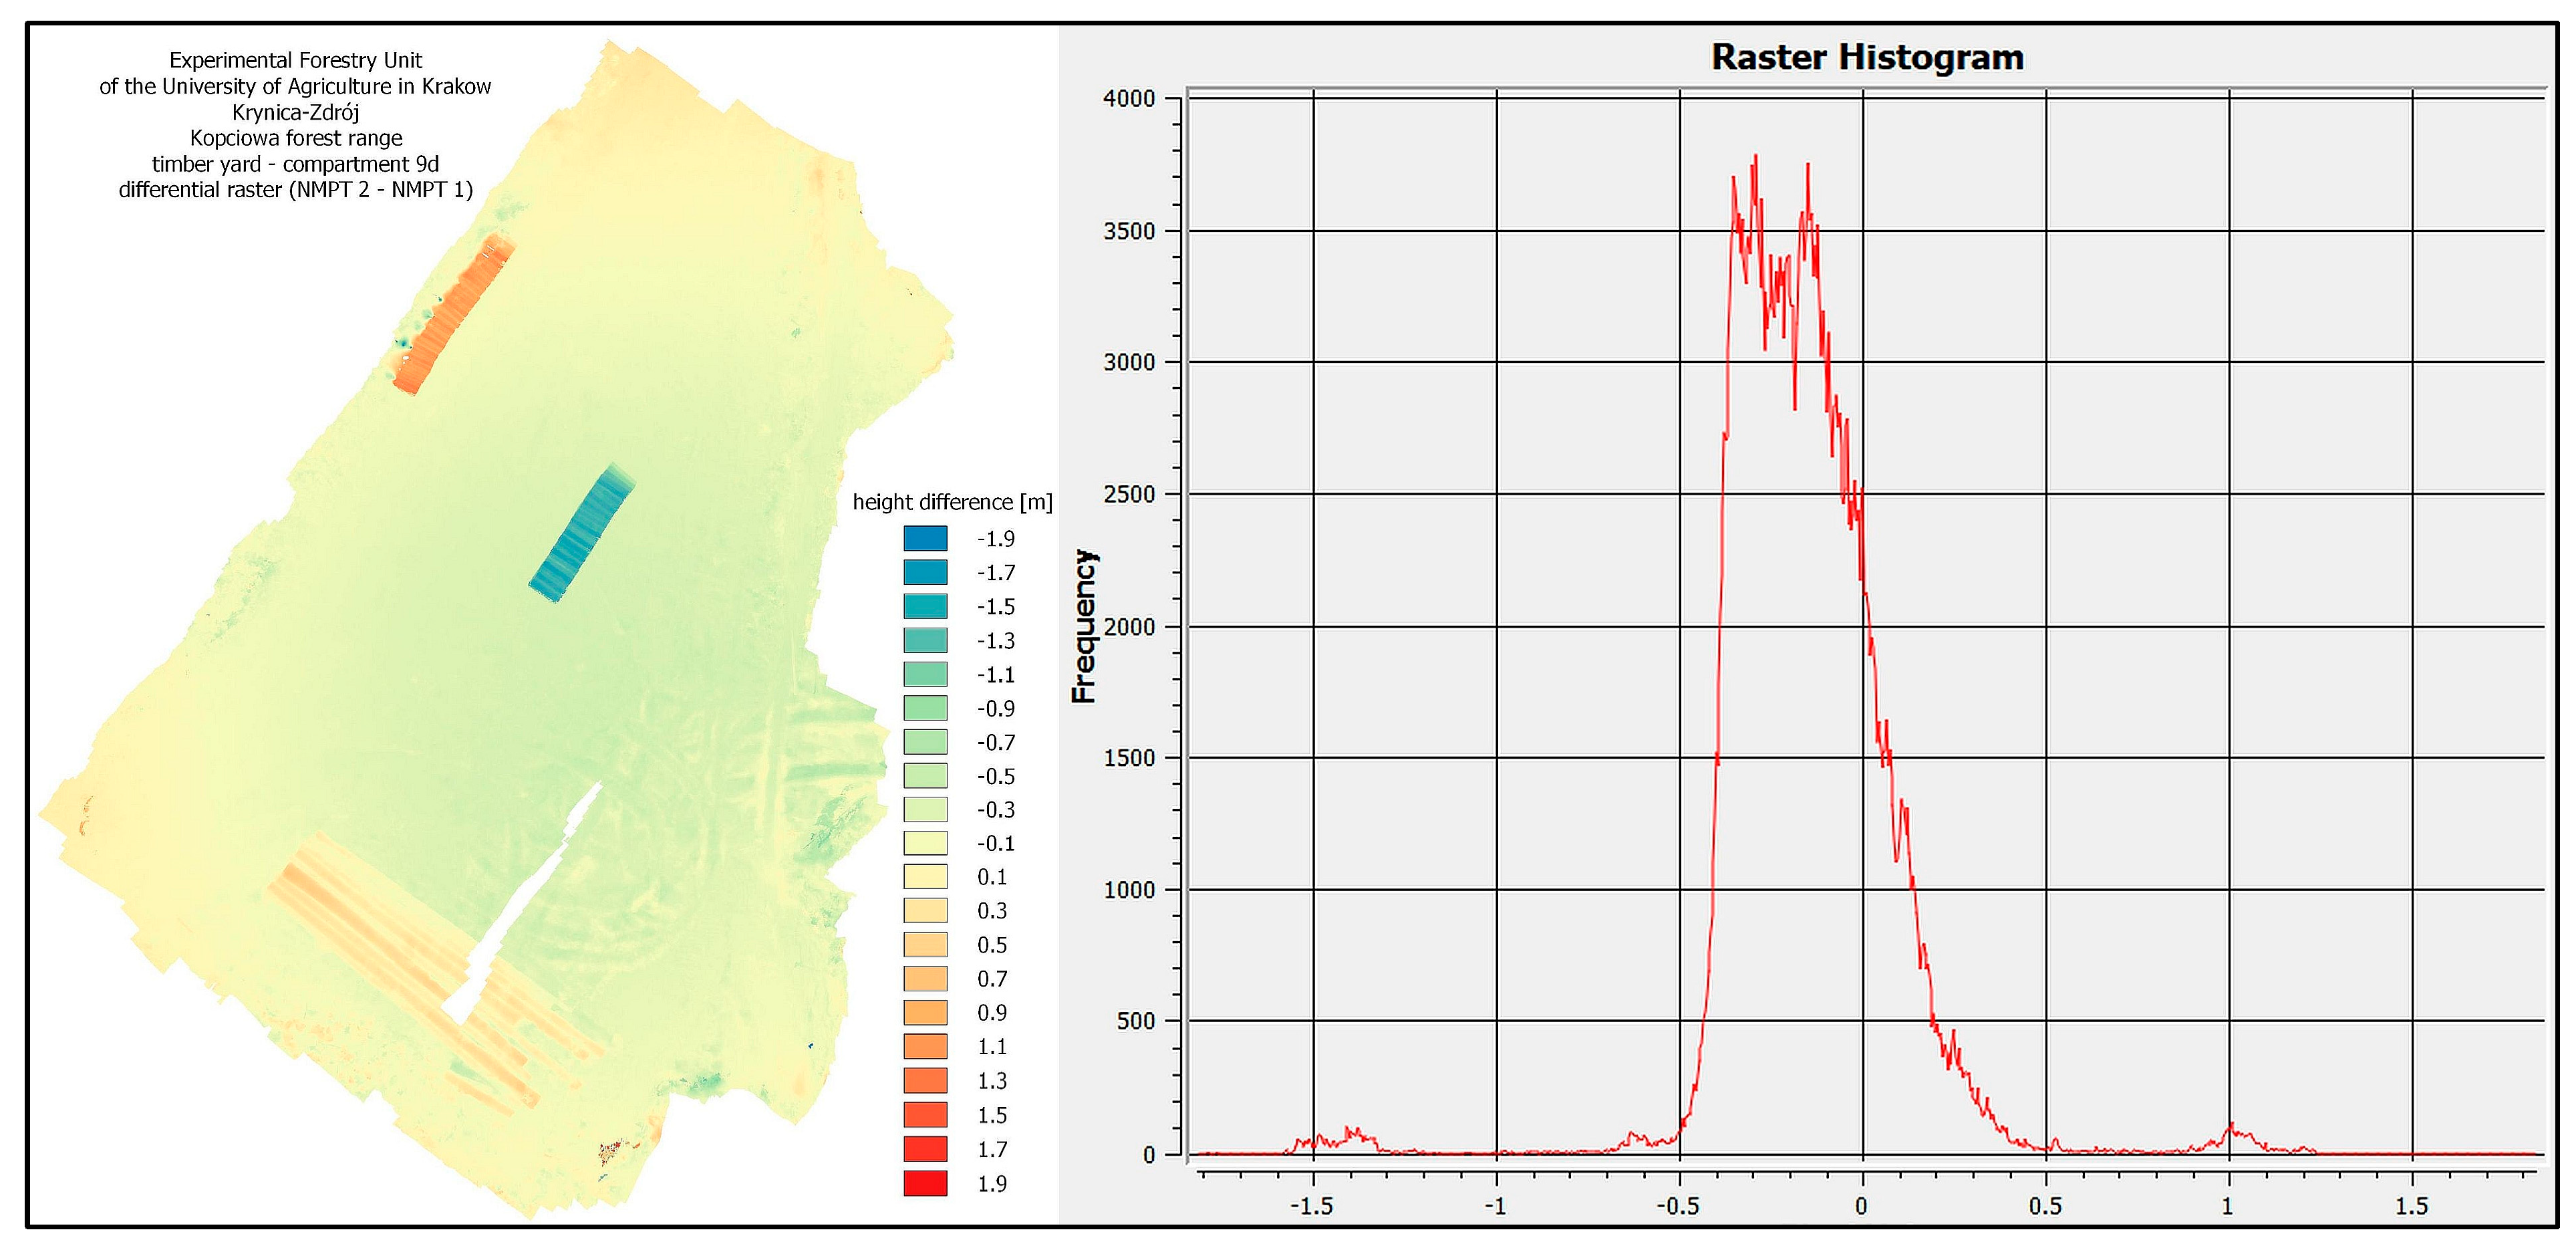
Figure 4 and Figure 5 show the resulting DTMs and the corresponding difference rasters (Figure 6 and Figure 7; the DTM from the first flight was subtracted from the DTM from the second flight).
Figure 4.
DTM—Ustroń timber yard—as at the start of the study period (left) and at the end (right).
Figure 5.
DTM—LZD timber yard—as at the start of the study period (left) and at the end (right).
Figure 6.
Difference raster with histogram—Ustroń timber yard.
Figure 7.
Difference raster with histogram—LZD timber yard.
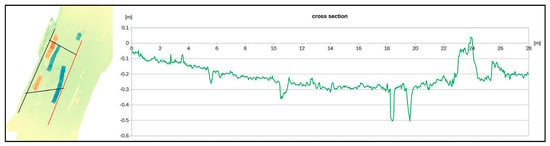
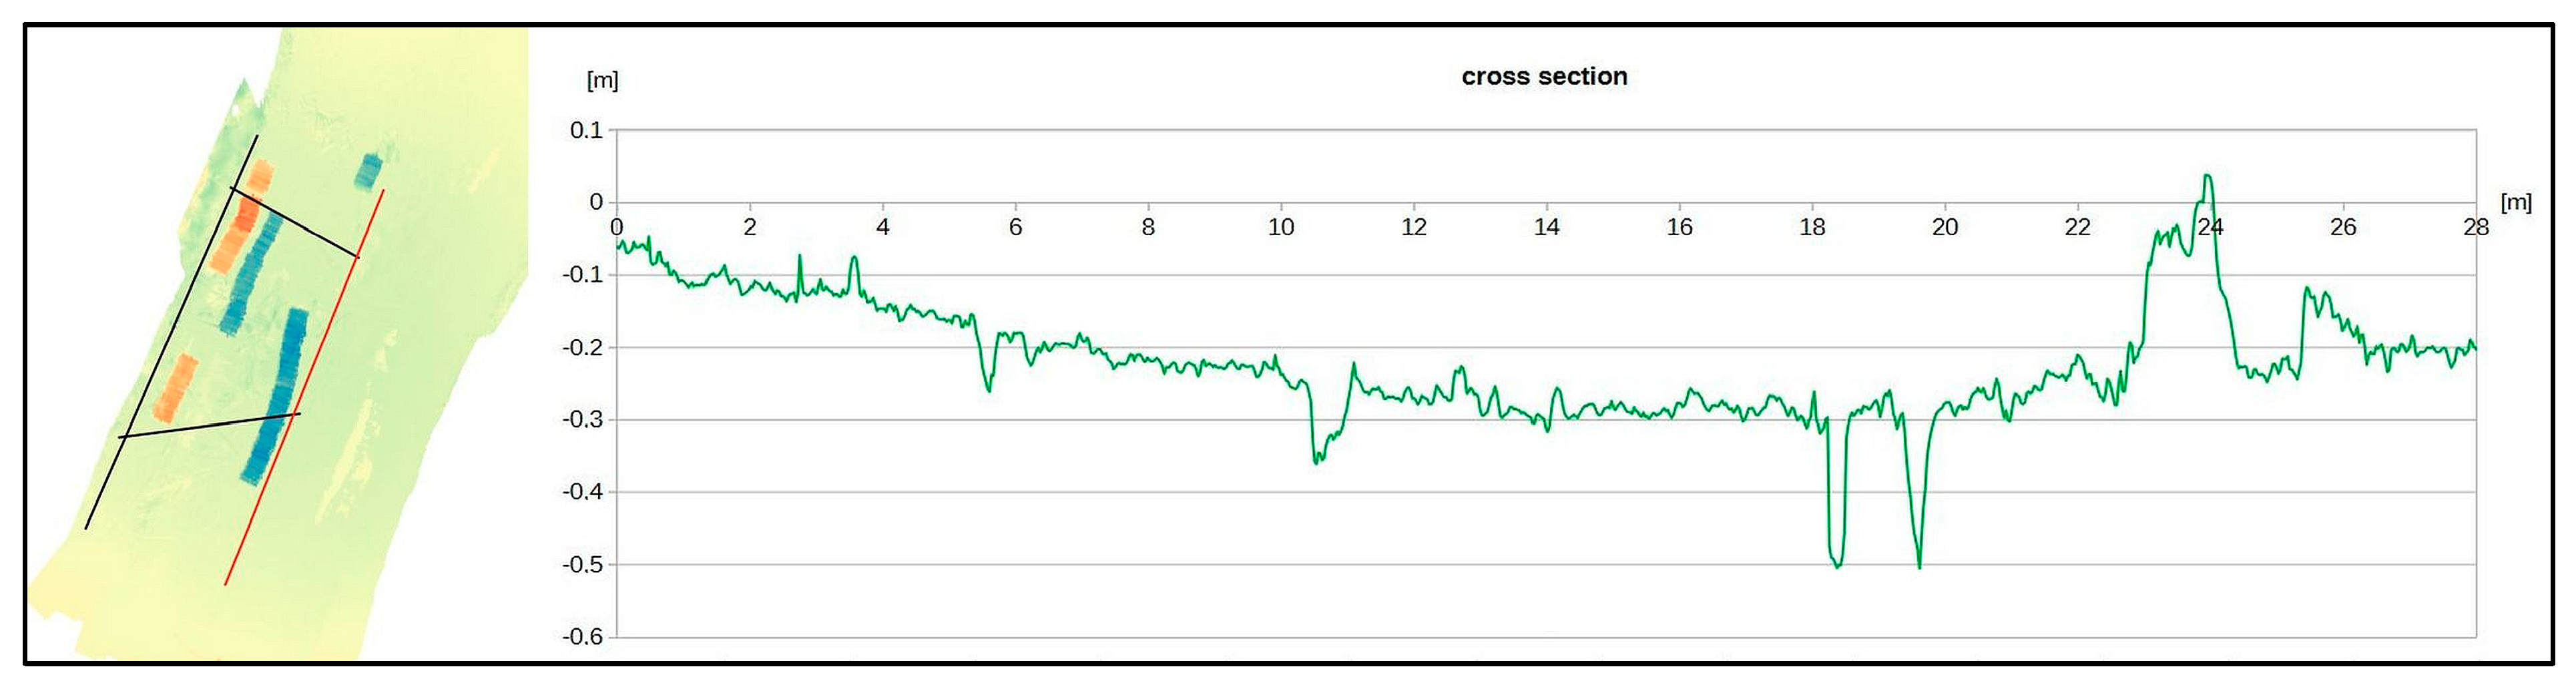
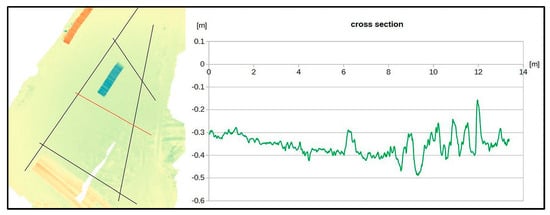
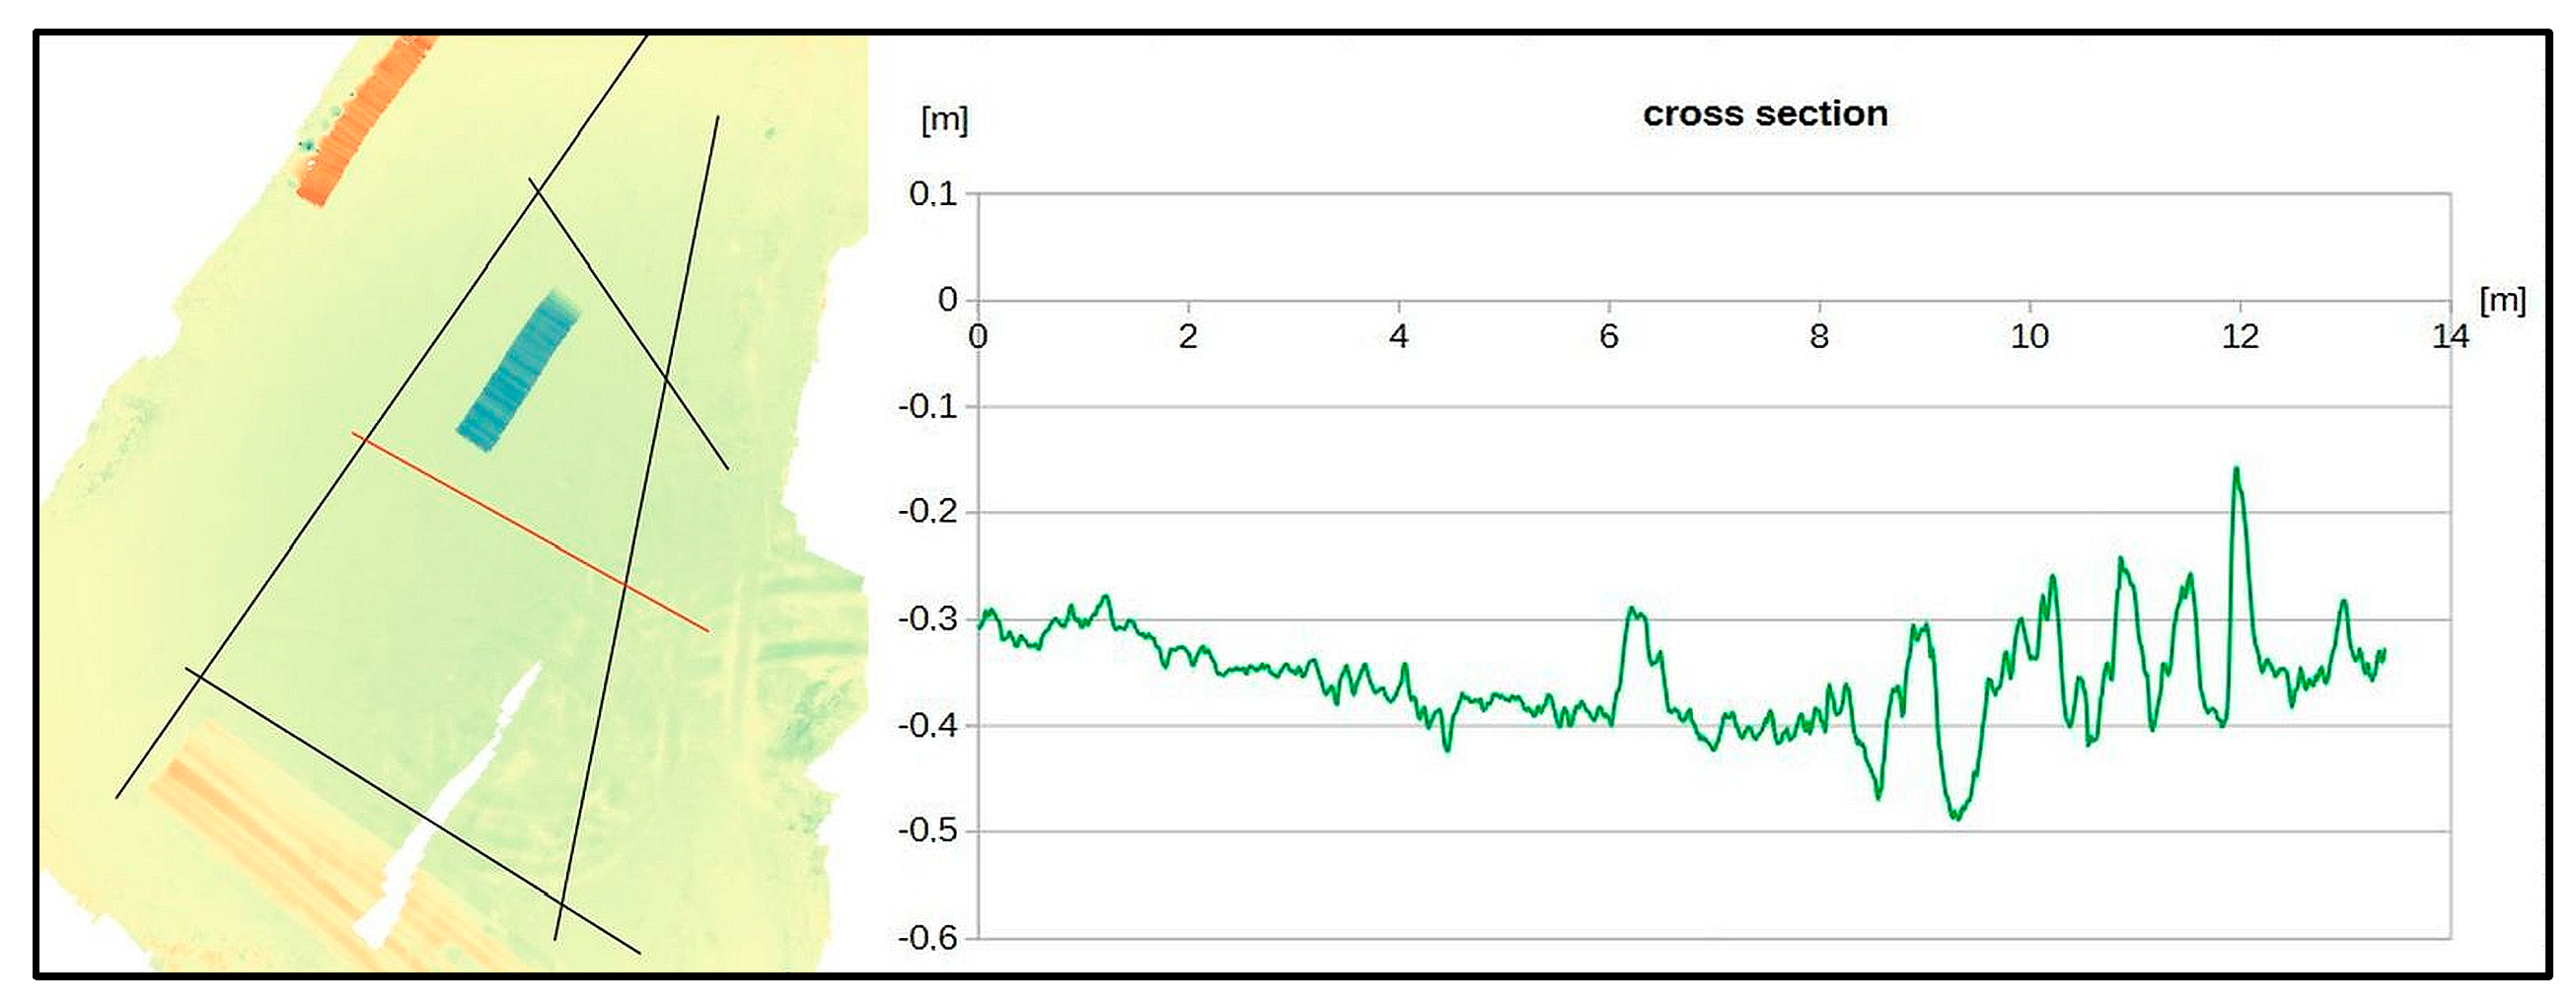
In the QGIS analysis, vertical cross-sections were created for each of the storage facilities in several directions—selected examples are shown below (Figure 8 and Figure 9) to illustrate the changes observed. Table 4 presents the statistics of the differential rasters.
Figure 8.
Selected vertical cross-section through the differential grid—Ustroń timber yard.
Figure 9.
Selected vertical cross-section through the differential grid—LZD timber yard.
Table 4.
Summary of differential raster statistics.
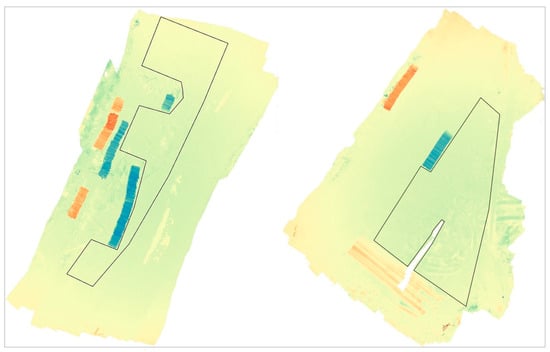
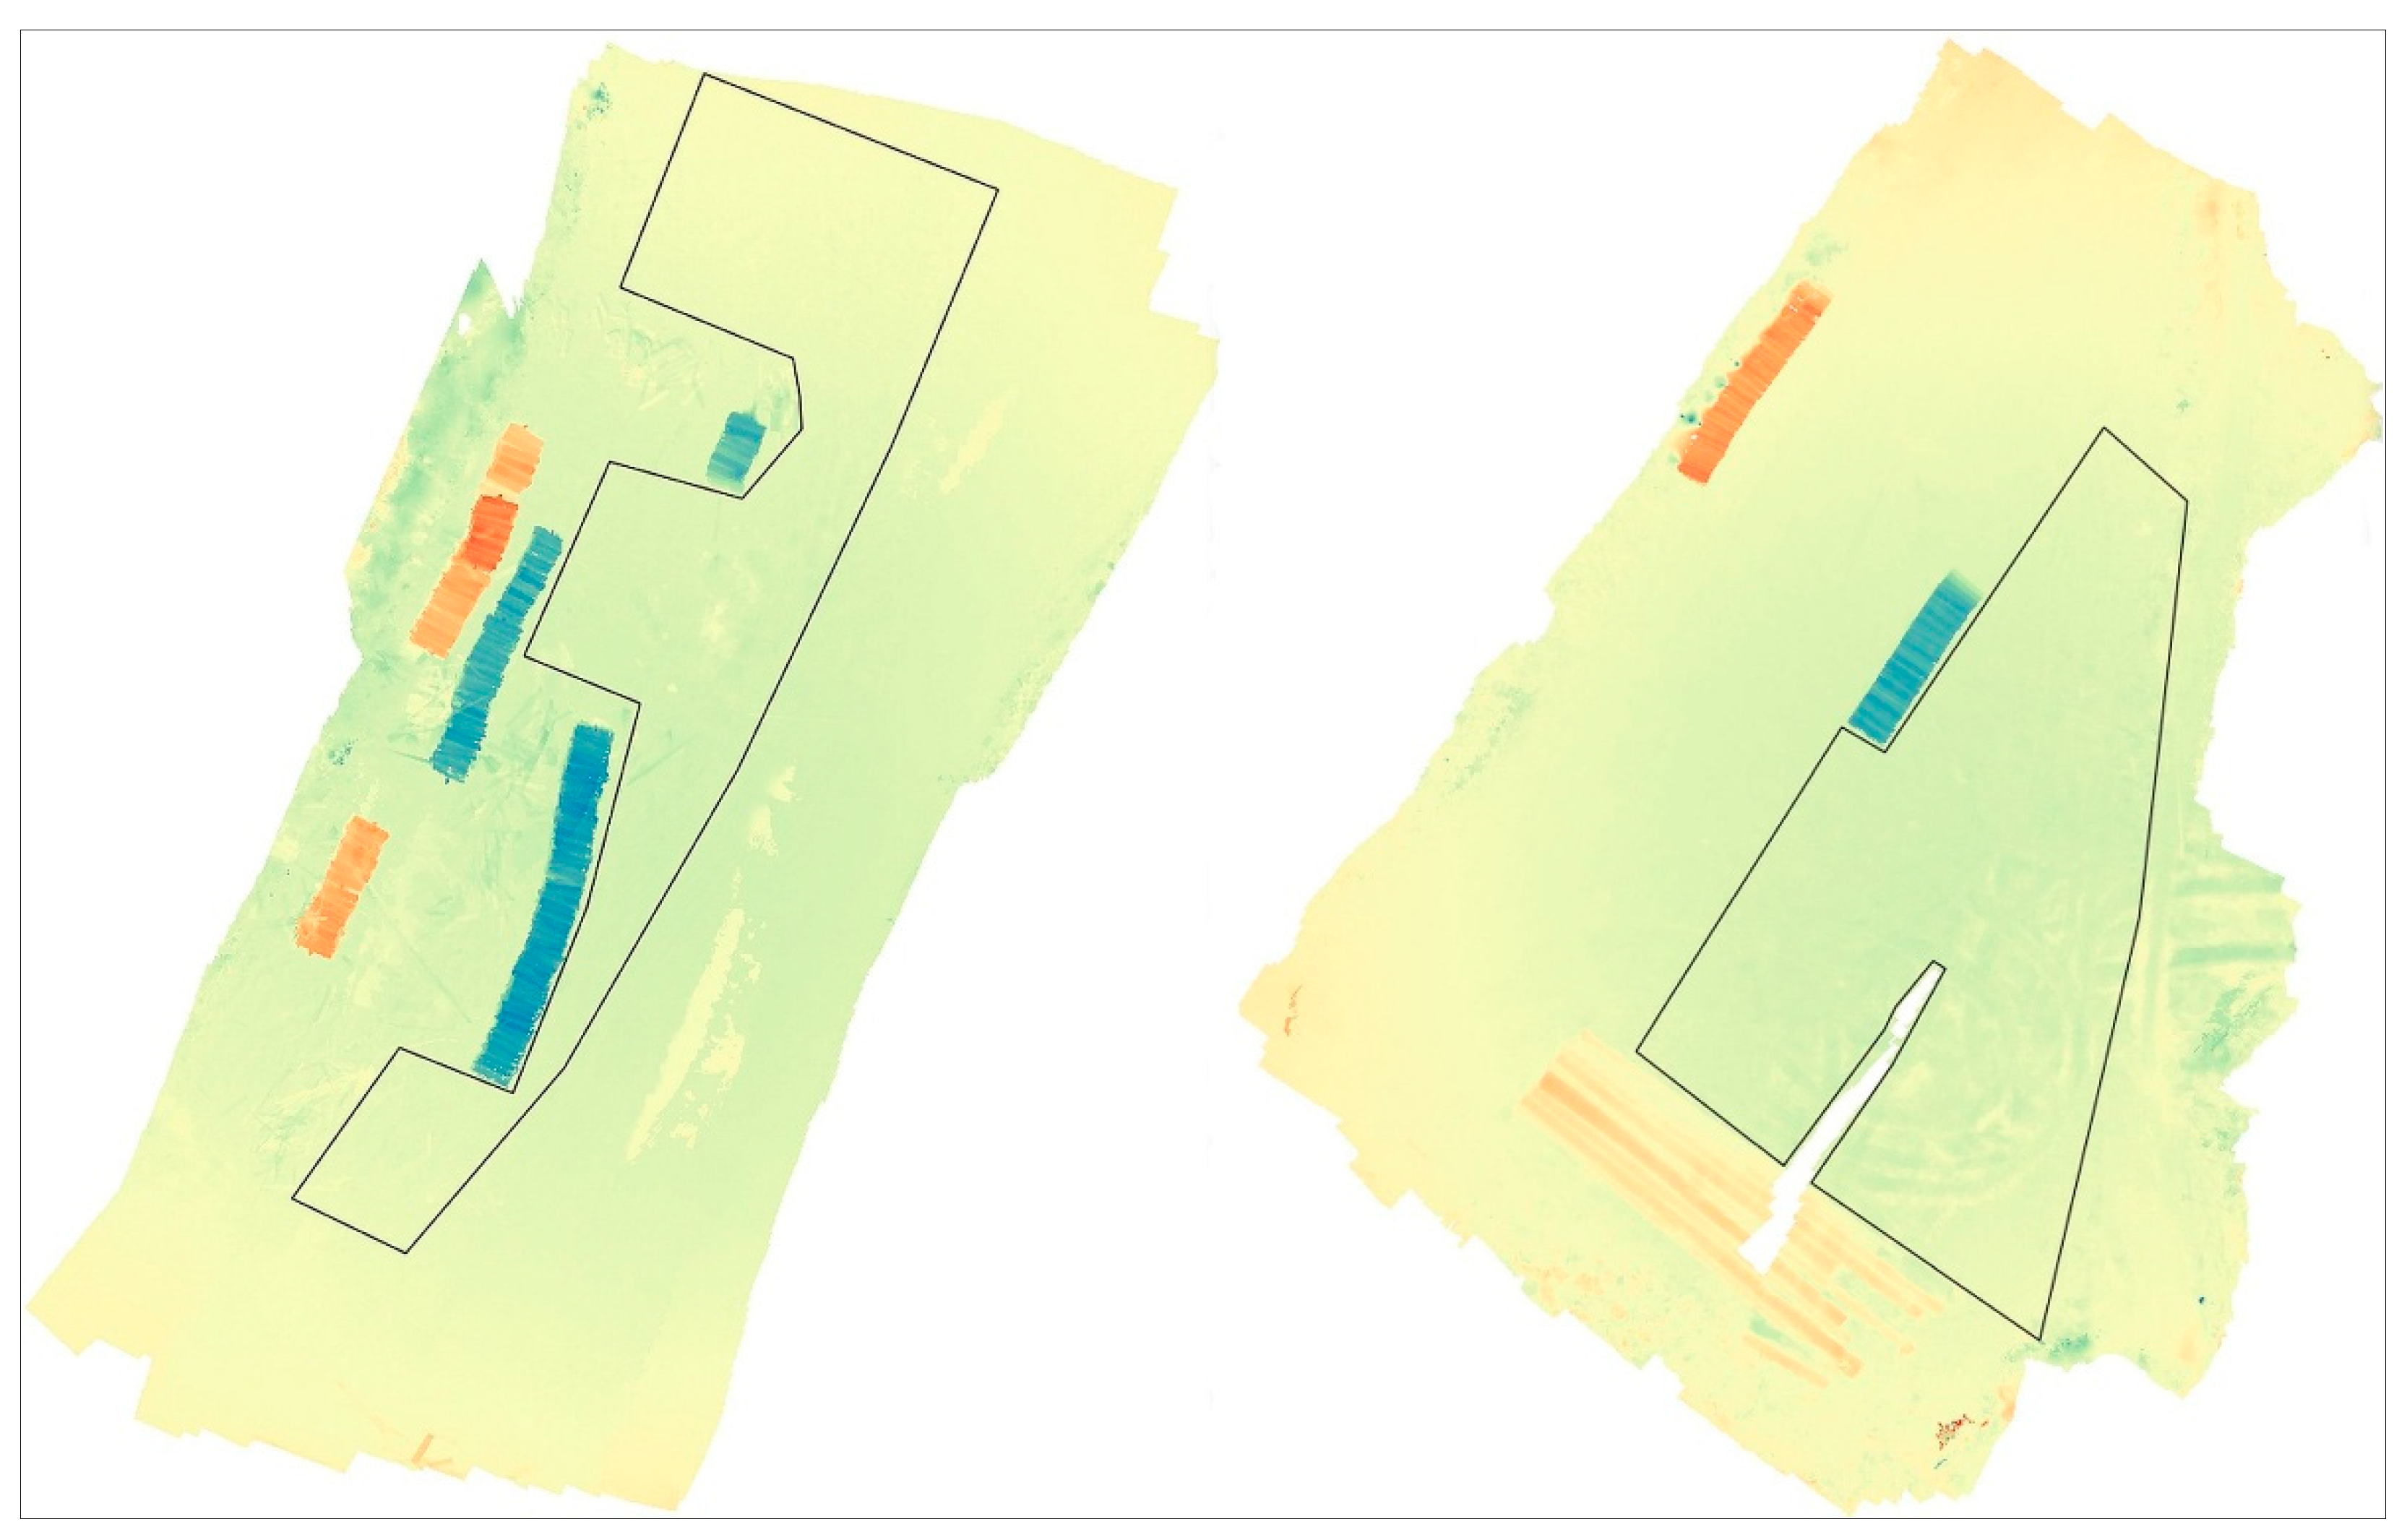
At the storage sites, based on observations of the DTM and orthomosaic, areas were identified for which the volumes of ground changes observed in the final DTMs relative to the initial DTMs were calculated. Parts of the storage yards were excluded from the analysis: those covered with large amounts of wood waste, those containing piles of stacked timber, and those for which DTM continuity could not be achieved (Figure 10).
Figure 10.
Timber yard areas designated for calculating the soil volume between DTM planes (left: Ustroń yard, right: LZD yard).
The areas of the designated zones and the numerical values of the changes in volume, also expressed per unit area, are shown in Table 5.
Table 5.
Summary of the areas of the marked zones and changes in soil volume.
4. Discussion
Tomaštík et al. [36] and Duka et al. [50] wrote about the selection of locations for photopoints and the impact of their number on DTM resolution and the accuracy of the studies. According to these authors, the redundancy of points has its justification in terms of accuracy, but it also has its limits. In the studies presented here, another factor is the high probability of point destruction during work at the storage facilities. When analysing the reference systems established at both storage sites, it must be noted that, given the high risk of the stabilised photopoints shifting position during work at the site (displacement in all planes, dislodgement), it is very important to use systems comprising multiple points. The initial, apparent surplus of photopoints at the Ustroń site turned out, upon a repeat survey, to be the absolute minimum. After a month of using the storage site, as many as three points could not be located (Figure 4), even though a metal detector was used (the points were stabilised with 18 cm long nails with wide washers painted in bright colours). However, the arrangement of the remaining points allowed for a second survey to be carried out and the measurements to be completed. It is good practice to verify the coordinates of the found points in a repeat geodetic survey. At the LZD site, three of the four planned photopoints were found (also the minimum required to correctly complete the measurements). The loss of some reference points may weaken the reliability of the model—hence, determining these points in excess at the beginning of the measurements is a good practice. A key element in designing the measurement grid is the selection of locations for stabilising the photopoints. An interesting alternative could be the use of a UAV with RTK positioning, as this solution eliminates the need to locate photopoints on the ground. Such a study is presented by Pourreza et al. [51], but the research concerns stands, not the ground, and the accuracy could be unsatisfactory. The use of classical surveying methods and the performance of measurements twice enables the determination of point coordinates with sufficient accuracy to conduct analyses. This also translates into the quality of the generated terrain models and orthomosaics, which provide a more accurate representation of the actual surface [31].
The resulting DTM raster data are highly detailed, allowing for the precise determination of changes in the topography of the observed surface. A prerequisite for achieving this level of accuracy is the use of an appropriate reference for the photographs taken, as well as a sufficient number of photographs and a high degree of overlap between them [32,40]. In the present study, during the initial flights over both storage sites, certain areas of the terrain were found to be insufficiently covered by photographs, which resulted in discontinuities in the subsequent processing. The reason for this was that the subsequent drone flight was too far removed from the previous one, leading to insufficient overlap of the photographs of that area. In this study, during the initial flights over both storage sites, sections of the terrain with insufficient photographic coverage were observed. This resulted in visible discontinuities in the structure of the models. The cause was a reduction in the overlap between the image series. At the LZD storage yard, this occurred during a battery change; additional contributing factors may have included manual flight control and gusts of wind.
The generated rasters contain information about the surface of the timber yard—a large area of it is exposed, but significant sections are covered by waste from handling operations, stacked timber awaiting processing, piles of sorted timber that have already been arranged, or vegetation (at the edges). In these areas, the surface of the yard is obscured by the aforementioned elements, and it is impossible to analyse changes in its topography. Under such conditions, the interpretation of the observed changes should be carried out in conjunction with the analysis of another photogrammetric product—the orthomosaic [39]. These additional elements also extend the elevation range on the observed rasters (particularly the difference rasters—Figure 6 and Figure 7) and, as a result, obscure the detail of changes in the surface itself. For example, surface changes at the Ustroń timber yard are mainly within the range of −0.4 to +0.3 m and, at the LZD timber yard, −0.5 to +0.4 m (Figure 4 and Figure 5). Higher values may also result from the movement of waste to another location following the handling of assortments, but changes of +1.0 m and −1.5 m are also observed, and these are clearly stacked or removed piles of timber. Histograms of the difference rasters (particularly that of the LZD timber yard) show a large number of pixels with a negative change, indicating the compaction of the ground beneath the wheels of skidding and transport vehicles and the formation of deep ruts (up to 40 or 50 cm). The displaced soil forms positive changes of 20 and 30 cm on either side of the ruts. The difference observed at both storage sites is due to the fact that the surface at the Ustroń site is hardened with a thin layer of crushed stone, whereas the LZD site has a soil surface, and also because the work at the sites was carried out under different soil moisture conditions (at the LZD site shortly after the spring thaw).
The statistics for the pixels in the differential rasters, calculated by QGIS and shown in Table 4, illustrate, amongst other things, the range of elevation changes and the average values. The minimum and average values are similar, whereas the maximum value of pixel elevation change at the Ustroń deposit (approx. +7.22 m) is a gross outlier rather than a real elevation change: inspection of the underlying point clouds shows it corresponds to an isolated, single-pixel reconstruction error confined to one of the two flights, occurring on an otherwise locally smooth and internally consistent surface in the other flight, and was excluded from the descriptive statistics and volume calculations using the fixed physical-implausibility threshold described in Section 2.2.7. Such isolated artefacts can occur at native image resolution and will be revealed in the set of descriptive statistics if not filtered out. Applying the procedure described in Section 2.2.7, the normalised median absolute deviation (NMAD) of the difference raster was 0.197 m at Ustroń and 0.208 m at LZD, giving a 95% level of detection of LoD95 = 0.39 m at Ustroń and 0.41 m at LZD. Gross outliers (|deviation from the median| > 2 m) accounted for 0.035% of pixels at Ustroń and 0.001% at LZD. Within the whole photographed footprint at each site (1000 m2 at Ustroń, 908 m2 at LZD, i.e., including areas outside the working polygons used for the volume calculations in Table 5), 5.9% of the Ustroń footprint and 3.5% of the LZD footprint showed a change exceeding LoD95; the remainder was not statistically distinguishable from measurement noise. Therefore, to facilitate comparisons of data from both datasets, the ranges of the changes shown in the histograms of the difference rasters (Figure 6 and Figure 7) have been limited.
The “terrain profile” plugin available in QGIS 3.16.0 Hannover was used to analyse and visualise the results. The results of this work, in the form of vertical cross-sections through the difference rasters, are shown in Figure 8 and Figure 9. It should be noted that the cross-sections vary in length (and may also have different elevation differences) and the software displays the cross-section line stretched in the direction of length and elevation (elevation changes) to fit the dimensions of the cross-section display window. For these very obvious reasons, any comparison of different cross-sections must be preceded by an examination of the axes of length and height (changes in height). In both Figure 8 and Figure 9, we observe general soil compaction and subsidence of the entire surface by as much as 30–40 cm in places, but also the displacement of soil to the sides and the lifting of the surface plane, although the latter to a much lesser extent. The greatest changes are observed in the central parts of the depot, where traffic was most intense, and the key factors determining the magnitude of these changes are the size of the loads being moved, vehicle characteristics (number of wheels, tyre width, pressure), the type of surface and its moisture content during the works. Similar conclusions were reached in the studies by Kulak et al., Allman et al. and Ilintsev et al. [22,23,52].
The observed changes in soil volume in the designated areas (Figure 10 and Table 5; calculated at 0.05 × 0.05 m grid points) are correlated with changes in the depth of deformation (Figure 8 and Figure 9). Given the similar surface areas of the zones where volumes were calculated (Table 5), a clear difference can be observed between the structures under investigation. At the Ustroń depot, where a crushed stone reinforcement layer is used in the pavement, the deformations are more than twice as small as those observed at the LZD depot, and positive changes are also observed here. This pattern is consistent with the reinforcement layer limiting surface deformation, although the two-site, non-replicated design of this study does not allow this effect to be isolated from other differences between the sites (organic matter content, moisture and the length of the observation period; see the limitations discussed below). These changes (Ustroń storage yard) are essentially observed in the layer of uncleared debris rather than in the crushed stone surface itself. It can be assumed that, without the presence of contaminants, the crushed stone layer would exhibit even smaller deformations—but this could not be measured at the observed site. The results obtained for the LZD storage yard suggest poor compaction of the subgrade, which additionally contains a high percentage of organic matter (Table 1). Carrying out the work during a period of high soil moisture (Table 1) significantly increased the magnitude of the observed deformations—they reached a value (on average, per 1 m2 of surface area) of as much as −0.316 m3 (Table 5). Allman et al. [52] make similar observations regarding the influence of soil moisture, one of the most important factors affecting deformation and rut depth.
Under the conditions observed, maintenance work is required to remove waste resulting from timber handling and mud, and to level, grade and compact the ground surfaces. Efforts should also be made to install and maintain, even if they are simple in design, drainage systems for the storage areas, whilst directing the collected water to soil profiles outside the storage areas. Minimising interference with the hydrological conditions of the land surrounding the storage area has significant environmental implications here.
A crushed stone surface is better at withstanding traffic loads than a natural soil surface; however, it may be perceived as an alien element in the environment, even though local materials are usually used in order to reduce construction costs. In the context of mountain forests with protective functions, an alternative may be considered—improved earth surfaces. This requires the removal of organic layers and the adjustment of the local soil to a particle size distribution similar to that of optimal mixtures (widely used in road construction), as well as achieving adequate compaction of the subbase and surface layers of these structures.
These works (the construction of a properly improved earth surface and the installation of a well-designed drainage system for these small structures) will not have an excessive impact on the environment, whilst enabling the responsible management of natural resources and the environment.
Given that the volumes of timber delivered to and removed from the storage yards are similar (though slightly lower at the LZD yard; Table 3), the greater deformation observed at the LZD yard can be explained by the absence of a reinforcing layer in its structure. This undoubtedly has a significant impact on the working conditions, safety and efficiency of the work carried out there.
The authors are aware of several important limitations of this study. First, the small number of observations (two storage sites, one measurement cycle each) means the results should be treated as an illustrative case study rather than a statistically generalisable comparison of surface types, and the findings cannot be extrapolated to timber yards in general without further replication. Second, the two sites were surveyed over different intervals (5 weeks at Ustroń versus 26.5 weeks at LZD, the latter spanning the spring thaw) and differ in soil moisture, organic matter content and drainage; these factors are confounded with surface type, and their individual contributions to the observed deformation cannot be separated with the present data. Third, the scope of the field work did not include quantitative measurements of vehicle loads (axle loads, tyre pressure, number of passes), so a possible influence of differences in traffic intensity between the two sites cannot be excluded. Fourth, as explained in Section 2.2.7, independent ground control points could not be established at either site, and reliability was instead assessed from the internal precision of the point clouds; this establishes the level of detectable change but does not provide an absolute accuracy comparable to a GCP-based check. The experience gathered here will help the authors conduct further measurements on a larger number of objects, replicated across seasons and surface types and selected and instrumented (including traffic monitoring and, where feasible, control points on adjoining stable infrastructure) to directly address these limitations.
5. Conclusions
Based on the studies carried out, it is considered that the changes in the surface profile of the timber yards, as observed in vertical cross-sections and volume calculations, are significant; however, the positive effect of the crushed stone stabilisation layer at the Ustroń storage site is clearly evident. The surface of the LZD depot, in addition to the absence of a stabilising layer, was also characterised by a high organic content and high soil moisture, which are factors that increase susceptibility to deformation. The durability of the surface can be significantly improved by using appropriate types of soil in the subbase and surface, applying appropriate thicknesses of the laid layers, compacting them, and also implementing drainage systems for the storage yard sites. One of these factors—pavement strengthening—modified the results of the research presented here.
It should also be recognised that maintenance work is a good practice that improves the quality of work and safety conditions at the storage yard and will involve the periodic clearing of the storage yard surface of wood waste and mud.
The survey method used requires the establishment of reference points with calculated spatial coordinates at each site. It is advisable to initially establish a surplus number of reference points, given the real possibility of them being damaged whilst machinery is in operation at the storage yard. A key consideration when preparing for the measurements is to establish reference points (photopoints) in locations that will not be at risk of damage.
Flying conditions are difficult because the surface of the storage areas is partially obscured by tree canopies, which means the flight must be conducted at a very low altitude (a few metres above ground level). This necessitates very slow flight and precise manual control, but as a result, it is possible to obtain comprehensive coverage of the area with sharp photographs. Due to the UAV flying below the treetops, often very close to them, the use of RTK positioning can be very difficult, and automatic implementation of the flight route is not possible. Low-altitude flights allow for a small pixel size and a high density of information about the surveyed area.
Forestry and other sectors of the economy, using photogrammetry as a tool, can also benefit from measurements taken from very low altitudes (like those presented in the submitted article). These measurements will, of course, only be used on small objects, but their undeniable advantage is the high density of information about the shape of the studied surface. It remains to be considered whether such a resolution is necessary in a particular situation. The methodology presented here can be treated as a baseline and developed in future targeted studies, conducted on a larger number of objects for comparative purposes.
Author Contributions
Conceptualization, J.G.; methodology, J.G.; software, J.G.; formal analysis, J.G.; investigation, J.G. and M.K.; resources, J.G.; writing—original draft preparation, J.G.; writing—review and editing, M.K. and M.P. All authors have read and agreed to the published version of the manuscript.
Funding
The research was funded by the Ministry of Science and Higher Education in the frame of the subvention of the Department of Ecological Engineering and Forest Hydrology.
Data Availability Statement
Measurement data, field observations, input data for photogrammetric processing, and analysis results are available via email (contact the corresponding author). The Department does not maintain an online database.
Acknowledgments
The authors would like to thank URK students Inga Madzia and Dariusz Maślanka for their help in collecting field data.
Conflicts of Interest
The authors declare no conflicts of interest.
References
- Nowakowska, J.; Orzechowski, M. Lasy ochronne w Polsce—Zarys historii na tle Europy. (Protective forests in Poland—An outline of history against the backdrop of Europe). Sylwan 2018, 162, 600–608. [Google Scholar]
- Huz, M.M.; Ivaniuk, A.P. Features of Forest Use in Mountain Protective Forests of the Carpathians. Sci. Bull. UNFU 2025, 35, 18–24. [Google Scholar]
- Korinets, Y.; Snitynskyi, V.; Khirivskyi, P.; Panas, N.; Sapeliuk, S. Impact of erosion on mountain forest soils in the zone of mixed spruce forests of the Ukrainian Carpathians and anti-erosion measures on logging sites. Bull. Lviv Natl. Environ. Univ. Ser. Agron. 2025, 29. [Google Scholar]
- Linser, S.; Wolfslehner, B.; Asmar, F.; Bridge, S.R.J.; Gritten, D.; Guadalupe, V.; Jafari, M.; Johnson, S.; Laclau, P.; Robertson, G. 25 Years of Criteria and Indicators for Sustainable Forest Management: Why Some Intergovernmental C&I Processes Flourished While Others Faded. Forests 2018, 9, 515. [Google Scholar] [CrossRef] [Scilit]
- Picchio, R.; Pignatti, G.; Marchi, E.; Latterini, F.; Benanchi, M.; Foderi, C.; Venanzi, R.; Verani, S. The Application of Two Approaches Using GIS Technology Implementation in Forest Road Network Planning in an Italian Mountain Setting. Forests 2018, 9, 277. [Google Scholar] [CrossRef] [Scilit]
- Simões, D.; Cavalcante, F.S.; Lima, R.C.A.; Rocha, Q.S.; Pereira, G.; Miyajima, R.H. Optimal Forest Road Density as Decision-Making Factor in Wood Extraction. Forests 2022, 13, 1703. [Google Scholar] [CrossRef] [Scilit]
- Affek, A.N.; Gerlée, A.; Sosnowska, A.; Zachwatowicz, M. Estimating the impact of logging on selected elements of the environment in the eastern part of the Polish Carpathians. Prz. Geogr. 2019, 91, 83–106. [Google Scholar] [CrossRef] [Scilit]
- Kulak, D.; Stańczykiewicz, A.; Szewczyk, G.; Kobiałka, P. Wpływ zrywki drewna z użyciem ciągników typu skider na uszkodzenia gleby w górskich drzewostanach jodłowo-bukowych. For. Lett. 2013, 105, 35–46. [Google Scholar]
- Williamson, J.R.; Neilsen, W.A. The influence of forest site on rate and extent of soil compaction and profile disturbance of skid trails during ground-based harvesting. Can. J. For. Res. 2000, 30, 1196–1205. [Google Scholar] [CrossRef]
- Croke, J.; Hairsine, P.; Fogarty, P. Soil recovery from track construction and harvesting changes in surface infiltration, erosion and deliveryrates with time. For. Ecol. Manag. 2001, 143, 3–12. [Google Scholar] [CrossRef] [Scilit]
- Rab, M.A. Recovery of soil physical properties from compaction and soil profile disturbance caused by logging of native forest in Victorian Central Highlands, Australia. For. Ecol. Manag. 2004, 191, 329–340. [Google Scholar] [CrossRef] [Scilit]
- Han, H.-S.; Page-Dumroese, D.; Han, S.-K.; Tirocke, J. Effects of Slash, Machine Passes, and Soil Moisture on Penetration Resistance in a Cut-to-length Harvesting. Int. J. For. Eng. 2006, 17, 11–24. [Google Scholar] [CrossRef] [Scilit]
- Košir, B.; Marenče, J. Assessing maximum loads when skidding wood uphill with tractors. Zbor. Goz. Les. 2008, 86, 21–31. [Google Scholar]
- Najafi, A.; Solgi, A.; Sadeghi, S.H. Effects of skid trail slope and ground skidding on soil disturbance. Casp. J. Environ. Sci. 2010, 8, 13–23. [Google Scholar]
- Lotfalian, M.; Fallah, A.; Moafi, M.; Nobakht, A. Determining the maximum allowable cross slope of skid trails for rubber-tired skidderTimberjack 450C. Ann. Biol. Res. 2012, 3, 3805–3810. [Google Scholar]
- Kremers, J.; Boosten, M. Soil compaction and deformation in forest exploatation. Am. J. Altern. Agric. 2018, 7, 25–31. [Google Scholar]
- Rudov, S.E.; Voronova, A.M.; Chemshikova, J.M.; Teterevleva, E.V.; Kruchinin, I.N.; Dondokov, Y.Z.; Khaldeeva, M.N.; Burtseva, I.A.; Danilov, V.V.; Grigorev, I.V. Theoretical Approaches to Logging Trail Network Planning: Increasing Efficiency of Forest Machines and Reducing Their Negative Impact on Soil and Terrain. Asian J. Water Environ. Pollut. 2019, 16, 61–75. [Google Scholar] [CrossRef] [Scilit]
- Prameswari, D.; Supriyanto; Saharjo, B.H.; Wasis, B.; Pamoengkas, P. Effects of biopore infiltration holes and cross drain on soil properties on skidding roads and natural production forest. IOP Conf. Ser. Earth Environ. Sci. 2020, 533, 012011. [Google Scholar] [CrossRef] [Scilit]
- Kormanek, M.; Dvořák, J. Ground Pressure Changes Caused by MHT 8002HV Crawler Harvester Chassis. Croat. J. For. Eng. 2021, 42, 201–211. [Google Scholar] [CrossRef] [Scilit]
- Sakai, H.; Nordfjell, T.; Saudicani, K.; Talbot, B.; Bollehuus, E. Soil compaction on forest soils from different kinds of tires and tracks and possibility of accurate estimate. Croat. J. For. Eng. 2008, 29, 15–27. [Google Scholar]
- Solgi, A.; Naghdi, R.; Tsioras, P.A.; Ilstedt, U.; Salehi, A.; Nikooy, M. Combined effects of skidding direction, skid trail slope and traffic frequency on soil disturbance in North Mountainous Forest of Iran. Croat. J. For. Eng. 2017, 38, 97–106. [Google Scholar]
- Ilintsev, A.; Nakvasina, E.; Aleynikov, A.; Tretyakov, S.; Koptev, S.; Bogdanov, A. Middle-term changes in top soils properties on skidding trails and cutting strips after long-gradual cutting: A casestudy in the boreal forest of the north-east of Russia. Croat. J. For. Eng. 2018, 39, 71–83. [Google Scholar]
- Kulak, D.; Stańczykiewicz, A.; Szewczyk, G.; Lubera, A.; Strojny, T. Factors affecting the changes in penetration resistance of forest soils during timber harvesting. Sylwan 2015, 159, 318–325. [Google Scholar]
- Kormanek, M.; Gołąb, J. Analysis of Surface deformation and physical and mechanical parameters of soils on selected skid trails in the Gorce National Park. Forests 2021, 12, 797. [Google Scholar] [CrossRef] [Scilit]
- Ozturk, T.; Sevgi, O.; Akay, A. Impact assessment of log skidding on soil condition of skid roads during ground-based logging in a plantation forest in Istanbul, Turkey. Bosque 2017, 38, 41–46. [Google Scholar] [CrossRef] [Scilit][Green Version]
- Kurczyński, Z.; Preuss, R. Podstawy Fotogrametrii; Oficyna Wydawnicza Politechniki Warszawskiej: Warszawa, Poland, 2011. [Google Scholar]
- Gawin, A. Zastosowanie naziemnej fotogrametrii cyfrowej do aktualizacji mapy numerycznej w odkrywkowych zakładach górniczych. Górn. Geoinż. 2009, 33, 127–135. [Google Scholar]
- Clapuyt, F.; Vanacker, V.; Van Oost, K. Reproducibility of UAV-based Earth Topography Reconstructions Based on Structure-from-Motion Algorithms. Geomorphology 2016, 260, 4–15. [Google Scholar] [CrossRef] [Scilit]
- Agüera-Vega, F.; Carvajal-Ramírez, F.; Martinez-Carricondo, P. Assessment of Photogrammetric Mapping Accuracy Based on Variation Ground Control Points Number Using Unmanned Aerial Vehicle. Measurement 2017, 98, 221–227. [Google Scholar] [CrossRef] [Scilit]
- Agüera-Vega, F.; Carvajal-Ramírez, F.; Martinez-Carricondo, P.; Sánchez-Hermosilla López, J.; Mesas-Carrascosa, F.J.; García-Ferrer, A.; Pérez-Porras, F.J. Reconstruction of Extreme Topography from UAV Structure from Motion Photogrammetry. Measurement 2018, 121, 127–138. [Google Scholar] [CrossRef] [Scilit]
- Pierzchała, M.; Talbot, B.; Astrup, R. Estimating Soil Displacement from Timber Extraction Trails in Steep Terrain: Application of an Unmanned Aircraft for 3D Modelling. Forests 2014, 5, 1212–1223. [Google Scholar] [CrossRef] [Scilit]
- Talbot, B.; Rahlf, J.; Astrup, R. An operational UAV-based approach for stand-level assessment of soil disturbance after forest harvesting. Scand. J. For. Res. 2018, 33, 387–396. [Google Scholar] [CrossRef] [Scilit]
- Murator. Available online: https://www.muratorplus.pl/biznes/wiesci-z-rynku/co-potrafia-drony-na-placu-budowy-aa-nGzF-4GkT-jhmg.html (accessed on 1 November 2019).
- Karwacki, K. Wykorzystanie fotogrametrii niskiego pułapu w badaniach osuwisk. In Proceedings of the IV Konferencji “Środowisko Informacji”, Centrum Nauki Kopernik, Warszawa, Poland, 22 November 2018. [Google Scholar]
- Gołąb, J.; Sołtysik, G.; Zbieg, G. Fotogrametryczna Inwentaryzacja Powykonawcza Odcinka Drogi Leśnej z Zastosowaniem Bezzałogowego Statku Powietrznego (BSP); Nowoczesne Technologie i Inżynieria w Zrównoważonym Użytkowaniu Lasu; Klamerus-Iwan, A., Ed.; Wydawnictwo UR w Krakowie: Kraków, Poland, 2020; pp. 185–207. [Google Scholar]
- Tomaštík, J.; Mokroš, M.; Saloň, Š.; Chudý, F.; Tunák, D. Accuracy of Photogrammetric UAV Based Point Clouds Under Conditions of Partially-open Forest Canopy. Forests 2017, 8, 151. [Google Scholar] [CrossRef] [Scilit]
- Ochałek, A.; Niewiem, W.; Puniach, E.; Ćwiąkała, P. Accuracy Evaluation of Real-Time GNSS Precision Positioning with RTX Trimble Technology. Civ. Environ. Eng. Rep. 2018, 28, 49–61. [Google Scholar] [CrossRef] [Scilit]
- Brach, M.; Chan, J.C.-W.; Szymanski, P. Accuracy Assessment of Different Photogrammetric Software for Processing Data from Low-cost UAV Platforms in Forest Conditions. iForest-Biogeosci. For. 2019, 12, 435–441. [Google Scholar] [CrossRef] [Scilit]
- Szostak, M.; Wężyk, P.; Tompalski, P. Aerial Orthophoto and Airborne Laser Scanning as Monitoring Tools for Land Cover Dynamics: A Case Study from the Milicz Forest District (Poland). Pure Appl. Geophys. 2014, 171, 857–866. [Google Scholar] [CrossRef] [Scilit]
- Młynarczyk, A.; Królewicz, S.; Rutkowski, P. Examining the possibility of using dynamic imaging (video) from low-alive aircraft (uav) for photogrammetric processes. Physiogr. Res. Ser. A-Phys. Geogr. 2019, 10, 53–64. [Google Scholar] [CrossRef] [Scilit]
- PN-ISO 11465; Jakość Gleby—Oznaczanie Zawartości Suchej Masy Gleby i Wody w Glebie w Przeliczeniu na Suchą Masę Gleby—Metoda Wagowa. (Soil Quality—Determination of Soil Dry Weight and Soil Water Based on Soil Dry Weight—Weight Method). Polish Committee for Standardization: Warsaw, Poland, 1999; pp. 1–4.
- PN-88/B-04481; “Grunty Budowlane. Badania Próbek Gruntu”. (“Construction Soils. Testing of Soil Samples”). Polish Committee for Standardization: Warsaw, Poland, 1988.
- PN-EN ISO 14688; Badania Geotechniczne—Oznaczanie i Klasyfikowanie Gruntów—Część 2: Zasady Klasyfikowania (Geotechnical Research Soil Identification and Classification—Part 2: Classification Rules). Polish Committee for Standardization: Warsaw, Poland, 2018; pp. 1–12.
- Brasington, J.; Rumsby, B.T.; McVey, R.A. Monitoring and modelling morphological change in a braided gravel-bed river using high resolution GPS-based survey. Earth Surf. Process. Landf. 2000, 25, 973–990. [Google Scholar] [CrossRef]
- BN-76/8950-03; Obliczanie Współczynnika Filtracji Gruntów Niespoistych na Podstawie Uziarnienia i Porowatości. (Calculation of the Filtration Coefficient of Non-Cohesive Soils Based on Grain Size and Porosity). Wydawnictwa Normalizacyjne: Warsaw, Poland, 1988.
- Kozerski, B. Wytyczne Określania Współczynnika Filtracji Metodami Pośrednimi i Laboratoryjnymi; Wydawnictwa Geologiczne: Warszawa, Poland, 1977. [Google Scholar]
- Lane, S.N.; Westaway, R.M.; Hicks, D.M. Estimation of erosion and deposition volumes in a large, gravel-bed, braided river using synoptic remote sensing. Earth Surf. Process. Landf. 2003, 28, 249–271. [Google Scholar] [CrossRef] [Scilit]
- Wheaton, J.M.; Brasington, J.; Darby, S.E.; Sear, D.A. Accounting for uncertainty in DEMs from repeat topographic surveys: Improved sediment budgets. Earth Surf. Process. Landf. 2010, 35, 136–156. [Google Scholar] [CrossRef] [Scilit]
- Höhle, J.; Höhle, M. Accuracy assessment of digital elevation models by means of robust statistical methods. ISPRS J. Photogramm. Remote Sens. 2009, 64, 398–406. [Google Scholar] [CrossRef] [Scilit]
- Đuka, A.; Tomljanović, K.; Franjević, M.; Janeš, D.; Žarković, I.; Papa, I. Application and Accuracy of Unmanned Aerial Survey Imagery after Salvage Logging in Different Terrain Conditions. Forests 2022, 13, 2054. [Google Scholar] [CrossRef] [Scilit]
- Pourreza, M.; Moradi, F.; Khosravi, M.; Deljouei, A.; Vanderhoof, M.K. GCPs-Free Photogrammetry for Estimating Tree Height and Crown Diameter in Arizona Cypress Plantation Using UAV-Mounted GNSS RTK. Forests 2022, 13, 1905. [Google Scholar] [CrossRef] [Scilit]
- Allman, M.; Jankovský, M.; Messingerová, V.; Allmanová, Z. Soil moisture content as a predictor of soil disturbance caused by wheeled forest harvesting machines on soils of the Western Carpathians. J. For. Res. 2017, 28, 283–289. [Google Scholar] [CrossRef] [Scilit]

Disclaimer/Publisher’s Note: The statements, opinions and data contained in all publications are solely those of the individual author(s) and contributor(s) and not of MDPI and/or the editor(s). MDPI and/or the editor(s) disclaim responsibility for any injury to people or property resulting from any ideas, methods, instructions or products referred to in the content. |
© 2026 by the authors. Licensee MDPI, Basel, Switzerland. This article is an open access article distributed under the terms and conditions of the Creative Commons Attribution (CC BY) license.