


Abstract
Understanding how urban park landscape features are associated with service population and service radius can inform park planning and management. In Changsha, China, this study measured both indicators for 29 parks on one weekday and one weekend day in spring 2025 using mobile signaling data, quantified landscape features from multisource data, and examined their associations. Service population and service radius were not highly correlated. The adjusted R2 values for the two indicators were 71.8% and 84.5%, respectively. Park area and the number of parking lots within the park were significantly associated with both indicators in the same direction. Percent vegetation cover and the number of stores within the park were significantly associated with the two indicators in opposite directions. Elevation, presence of large-scale flower landscapes, distance to the nearest subway station, number of surrounding bus stops, distance to the city center, slope, percent water body, edge density of vegetation patches, number of public restrooms, and number of surrounding residential quarters were significantly associated with only one indicator. These findings reveal synergistic, trade-off, and indicator-specific association patterns between landscape features and urban park recreational services, and may inform differentiated urban park planning and management.
1. Introduction
Urban parks provide substantial recreational services such as relaxing in contact with nature, enjoying pleasing landscapes, and meeting people for social activities [1,2], which significantly improve urban residents’ physical and mental well-being [3,4]. Enhancing urban park recreational services has received increasing attention from both scholars and decision makers. Urban park recreation services are realized by engaging in recreational activities once visitors enter the park along roads from their residential areas [5,6]. Therefore, urban park recreational services are influenced by both citizens’ recreational needs and the attractiveness (or recreational service supply) of urban parks. In an era of increasing demand for daily leisure and recreation, improving the attractiveness of urban parks for leisure and recreation is of great significance [7]. Urban parks are public spaces comprising natural or semi-natural ecosystems primarily composed of blue-green spaces, along with recreational facilities [8,9]. Landscape features of urban parks significantly influence the visitors’ visitation patterns and urban park recreational services [10,11,12]. A thorough understanding of the associations between urban park landscape features and recreational services is important for effective urban park planning and management.
Urban park recreational services are usually measured by a series of indicators such as visitor numbers, visit duration, visit frequency, and service radius. They are significantly linked to four groups of variables characterizing urban park landscape features. First, park size and shape are the most widely investigated influence factors. Compared to smaller parks, larger parks can attract more visitors [13], increase visitors’ travel distance [14], increase visit frequency [15,16,17], and extend visit durations [18,19]. Urban parks with more complex shapes usually increase park visitation [20,21], extend service radius [14], and boost visit frequency [15]. Secondly, land cover within urban parks significantly influences the recreational services. Tree cover showed both positive [14,20] and negative [15,22] relationships with urban park recreational services. Some studies reported positive associations of water bodies with service radius [22,23], visitor numbers [24], and visit frequency [24,25], whereas others reported negative relationships [19]. Third, service facilities within the park significantly influence recreational services. Stores, restrooms, and resting seats typically increase visitor numbers [12,26], prolong visit duration [19], elevate visit frequency [15], and extend service radius [10,22]. Finally, the surrounding environments of urban parks also play a crucial role in providing urban park recreational services. The number of bus stations, subway stations, and road networks shows significant positive correlations with both visitor numbers [21,27] and service radius [10,28,29]. Population density surrounding urban parks was positively correlated with visitor numbers [27,30,31], but negatively correlated with park visit duration [31] and travel distance [32].
As multiple indicators are used to characterize urban park recreational services (e.g., visitor numbers, visit duration, visitation frequency, and service radius), higher visitor numbers, longer visit duration, more frequent visits, and a broader service radius generally reflect higher levels of recreational services. In this study, service population represents the number of visitors served by a park, whereas service radius represents the spatial reach of park services. It remains unclear whether service population and service radius are highly correlated. A strong correlation would suggest that they reflect similar patterns of urban park recreational services, whereas a weak correlation would support examining their associations with landscape features separately. Landscape features may show different association patterns across recreational service indicators. For example, urban park shape index was positively associated with visitor numbers [17,20,21] but negatively associated with visit duration [33]. Tree cover was positively associated with visitor numbers [14,20,34] but negatively associated with service radius [22]. Higher surrounding population density was associated with greater park visitor volume [21,27] but shorter visit duration [31]. These examples suggest that landscape features may show synergistic patterns, with associations in the same direction across indicators, or trade-off patterns, with associations in opposite directions. Previous studies have mainly focused on a single recreational service indicator (primarily visitor numbers), and only a limited number of studies have examined urban park recreational services using multiple indicators simultaneously [22,28,31,35,36,37]. These studies generally analyzed the associations between landscape features and each indicator separately. Few studies have directly compared whether the same landscape features show synergistic or trade-off patterns in their associations with service population and service radius.
Taking Changsha (China) as an example, this study aims to investigate the relationship between service population and service radius and compare their associations with urban park landscape features. Specifically, we try to answer two questions: (1) Are service population and service radius highly correlated across urban parks? (2) Do urban park landscape features show synergistic or trade-off patterns in their associations with service population and service radius? We quantified urban park recreational services (i.e., service population and service radius) based on mobile signaling data, and measured urban park landscape features by four groups of variables (i.e., spatial form and location of urban park, land cover within the park, recreational facilities within the park, and environments surrounding the park). Pearson correlation analysis was conducted to examine the relationship between the two service indicators. Multiple linear regression models were developed to investigate the associations between landscape features and recreational services, and the relative importance of the four groups of variables in explaining the variance of recreational services was quantified by variance partitioning analysis.
2. Methods
2.1. Study Area
Changsha (27°51′–28°40′ N, 111°54′–114°15′ E) is the capital of Hunan province and a major central city in the middle reaches of the Yangtze River, China. It has a humid subtropical climate with hot summers and mild winters. Changsha is characterized by its complex topography, with alluvial plains formed on both banks of the Xiang River, while low mountains and hills dominate the eastern, western, and southeastern areas. Changsha has an administrative area of 11,819 km2 with a resident population of approximately 10.62 million in 2024. According to the Changsha Urban Green Space System Plan (2021–2035), the per capita park green space reached 8.42 m2 by 2020, with 1.37 comprehensive parks per 100,000 people, and a green space coverage rate of 31.27% in the built-up area. Changsha has developed a comprehensive park system that includes general parks, community parks, and specialized parks.
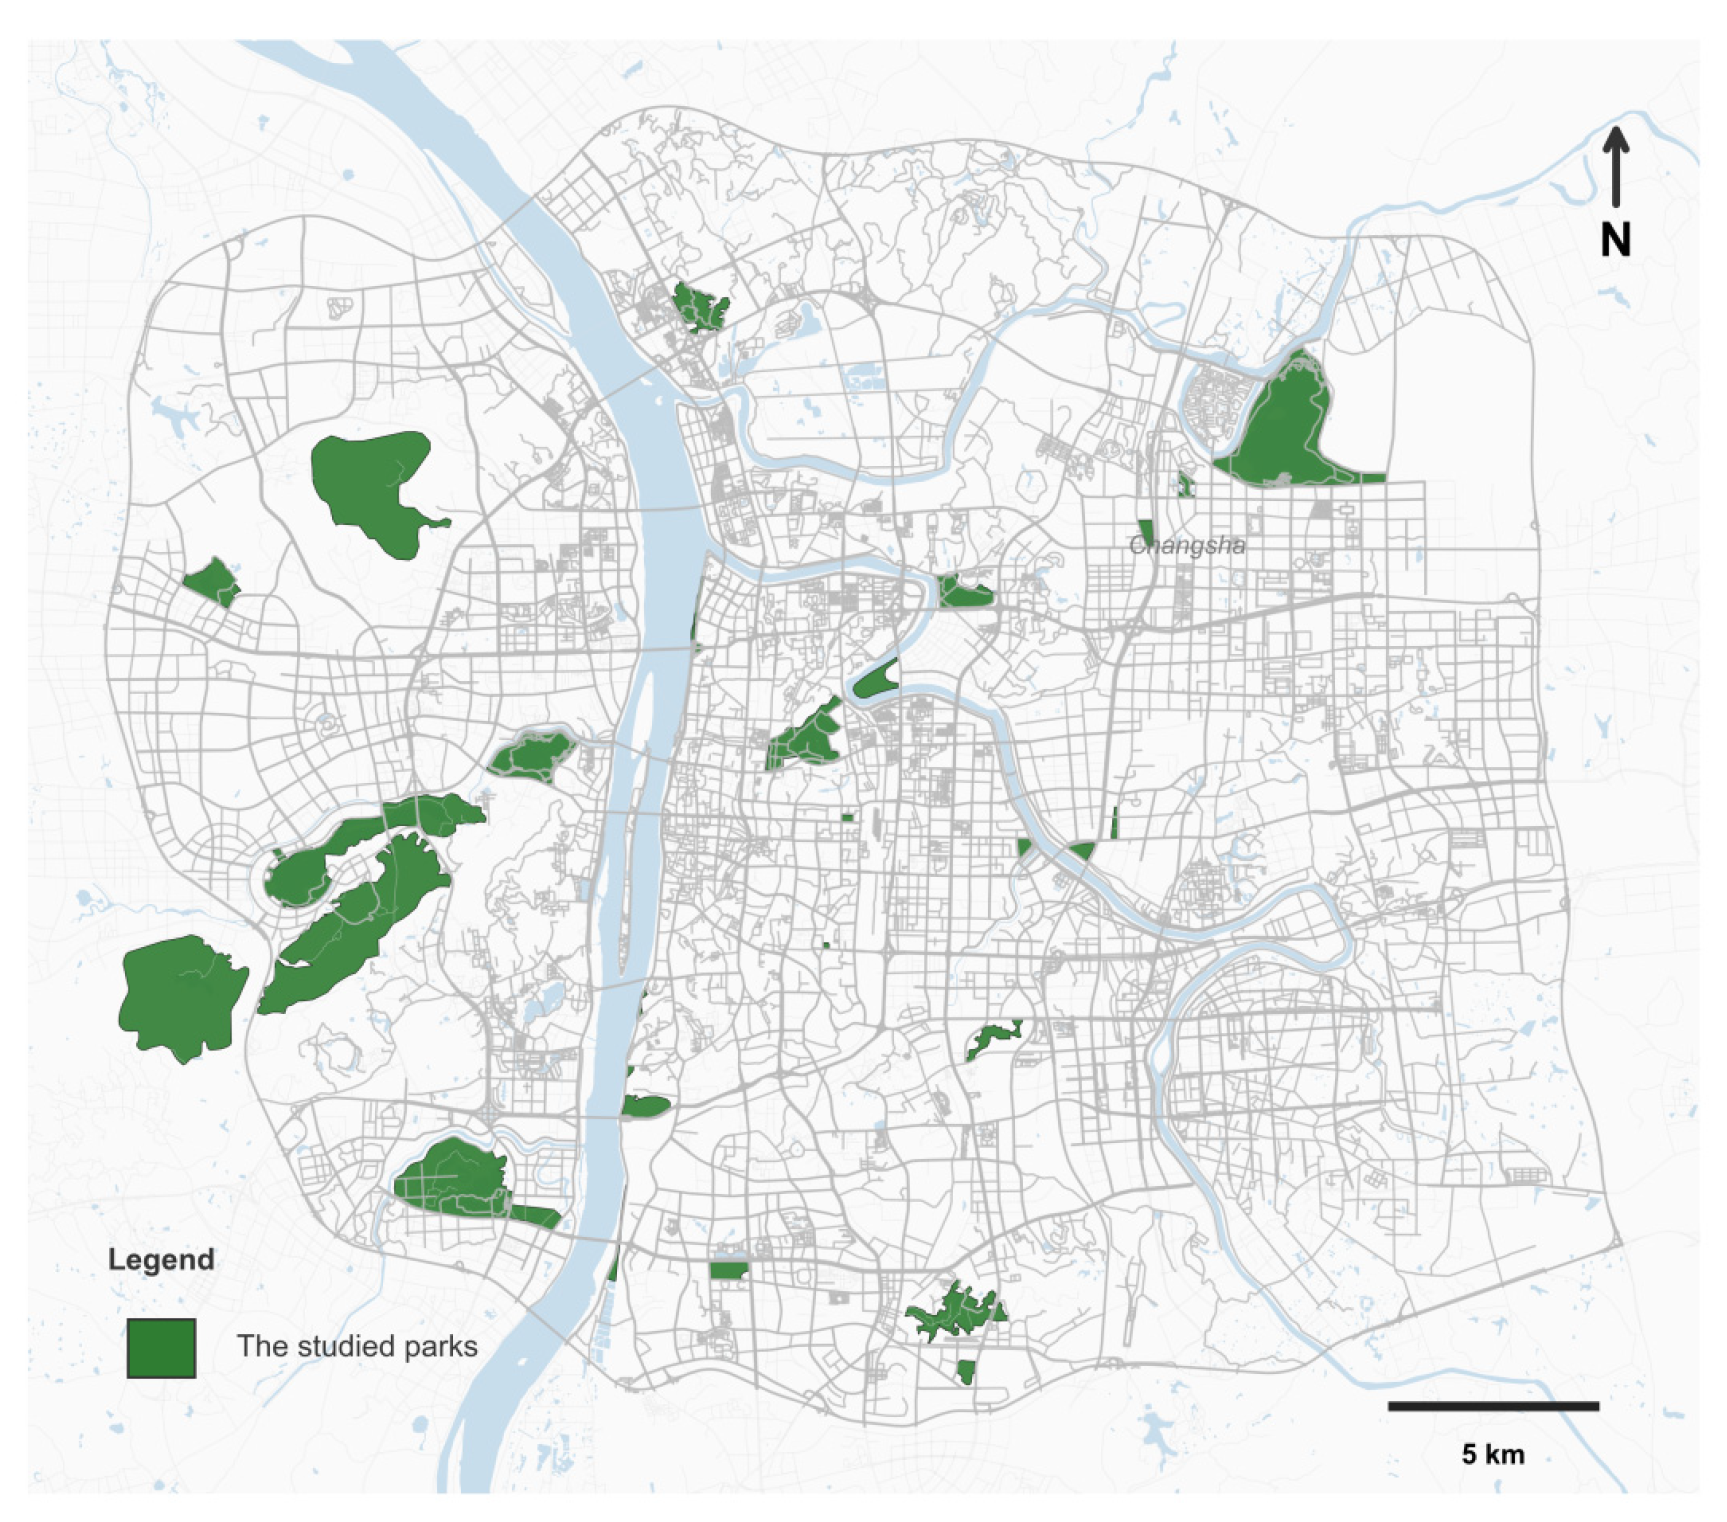
A total of 29 parks within Changsha’s Third Ring Road were selected to cover variation in park type, size, and location. Parks with relatively high public attention were given priority, while random selection was applied among parks with comparable characteristics within the same park type. The sample included municipal comprehensive parks, community parks, specialized parks, and wilderness parks located along the Xiangjiang River and Liuyang River and across commercial and residential areas, encompassing natural and historical/cultural landscape types. Figure 1 depicts the spatial distribution of the studied urban parks.
Figure 1.
Spatial distribution of the 29 studied urban parks.
2.2. Quantifying Urban Park Recreational Service
We quantified recreational services using service population and service radius based on mobile phone signaling data following previous studies [14,36,38]. Service population is defined as the number of visitors, and service radius is defined as the median of the travel distances of visitors. These two indicators were quantified by all-day mobile phone signaling data on May 11 (Sunday) and May 12 (Monday), 2025, representing one weekend and one weekday observation. Both days were sunny and had favorable conditions (daily average temperature of 22 °C) for outdoor recreation. The mobile phone signaling data were obtained from China Mobile Communication Corporation, and it has been demonstrated to be effective in quantifying park visitation and service radius [36,39]. The de-identified data included anonymous user IDs, timestamps, and activity locations. Signaling records were matched to the boundaries of the 29 selected parks. Within each day, repeated visits by the same user to the same park were deduplicated, and users who stayed within a park for more than 15 min were counted as park visitors. Service population was measured as the number of unique China Mobile users identified as park visitors each day. Service radius was calculated as the median travel distance from visitors’ usual residences to the park. Usual residences were inferred from six months of historical signaling records using the location with the longest cumulative residence time. Travel distances were calculated using the AutoNavi Maps API provided by AutoNavi (Beijing, China; https://lbs.amap.com/, accessed on 15 May 2025). The results are reported at the aggregate level.
2.3. Measuring Urban Park Spatial Characteristics and Surrounding Environments
Twenty indicators were selected to quantify urban park landscape features based on the principles of theoretical importance and data availability. These indicators belong to four categories: (1) spatial form and location of the park, including park area [20,27], park shape index [14,20,21], distance to city center [14,31], elevation [29], and slope [28]; (2) land cover within the park, including percent vegetation cover [40], percent water body [40], edge density of vegetation patch [41], percent road [22,42], presence of large-scale flower landscape [35]; (3) recreational facilities within the park, including number of stores [12], number of supermarkets [26,32], number of public restrooms [32], and number of parking lots [21,27]; (4) environments surrounding the park, including distance to the nearest subway station [12], number of bus stops within 1 km buffer [27,43], number of tourism attractions within 1 km buffer [27], number of residential quarters within 1 km buffer [32], number of shopping centers within 1 km buffer [36], and number of parking lots within 1 km buffer [44]. Table 1 shows a description of these indicators.
Table 1.
Descriptive statistics of independent variables in the models.
2.4. Statistical Analysis
2.4.1. Pearson Correlation and Paired Wilcoxon Signed-Rank Tests
Pearson correlations between service population and service radius were calculated separately for weekday and weekend observations to examine whether the two service indicators were highly correlated. Paired Wilcoxon signed-rank tests were used to compare weekday and weekend values for service population and service radius, respectively, because the observations were paired within parks.
2.4.2. Multiple Linear Regression
We applied multiple linear regression (MLR) to explore the associations of the 20 variables with service population and service radius, respectively. The MLR model is specified as follows:
where represents the service population or service radius, represents the kth independent variable, represents the intercept, represents the regression coefficient of the kth independent variable, and is the randomly distributed error.
The service population is right-skew distributed, and the values showed significant differences between weekdays and weekends. Therefore, service population in the MLR model is log-transformed, and a binary variable coded 1 for weekdays and 0 for weekends was included as a control variable. Service radius was approximately normally distributed and also differed significantly between weekdays and weekends, so service radius was not transformed, and the same binary variable was initially included as a control variable in the MLR model. The analytical dataset comprised 58 park-day observations from 29 parks, with one weekday and one weekend observation per park.
Twenty landscape variables were entered as candidate explanatory variables. Bidirectional stepwise regression based on the Akaike information criterion (AIC) was used to select the final model. Variance inflation factors (VIFs) were assessed after variable selection; if a VIF was ≥10, the variable with the highest VIF was removed and the selection procedure was repeated. All retained variables had VIFs below 10, although some relatively high values indicated that residual multicollinearity could still affect individual coefficient estimates, which were therefore interpreted cautiously. Because weekday and weekend observations from the same park may be correlated, cluster-robust standard errors were used for statistical inference, with individual parks treated as clusters. This approach accounts for potential within-park dependence without altering the estimated regression coefficients. Model assumptions were assessed using normal Q-Q, residuals-versus-fitted, scale-location, and residuals-versus-leverage plots.
We calculated standardized regression coefficients to reveal the relative associations of each explanatory variable with recreational services. A higher absolute value of the standardized regression coefficient indicates a stronger association. Statistical significance was evaluated using park-clustered robust standard errors. The MLR was performed using the stats package in R version 4.4.1.
2.4.3. Variance Partitioning Analysis
We applied variance partitioning analysis to investigate the relative importance of the four groups of variables (i.e., spatial form and location of the park, land cover within the park, recreational facilities within the park, and surrounding environments) in explaining the variance of urban park recreational services (i.e., service population and service radius). By building a series of MLR models with the four groups of variables as well as their combinations, variance partitioning analysis decomposed the variance of the dependent variable (i.e., service population or service radius) into unique contributions of four groups, their shared contributions, and unexplained variance. The unique contribution refers to the proportion of variance explained solely by a specific group of variables after controlling for the effects of the other three groups of variables. Variance partitioning analysis was performed using the vegan package in R version 4.4.1. [47].
3. Results
3.1. Urban Park Recreational Services
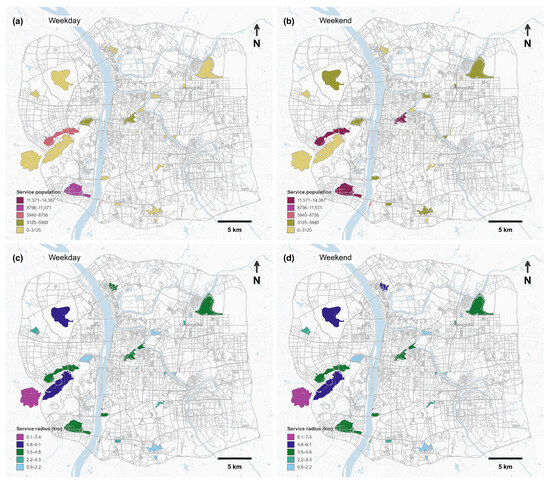
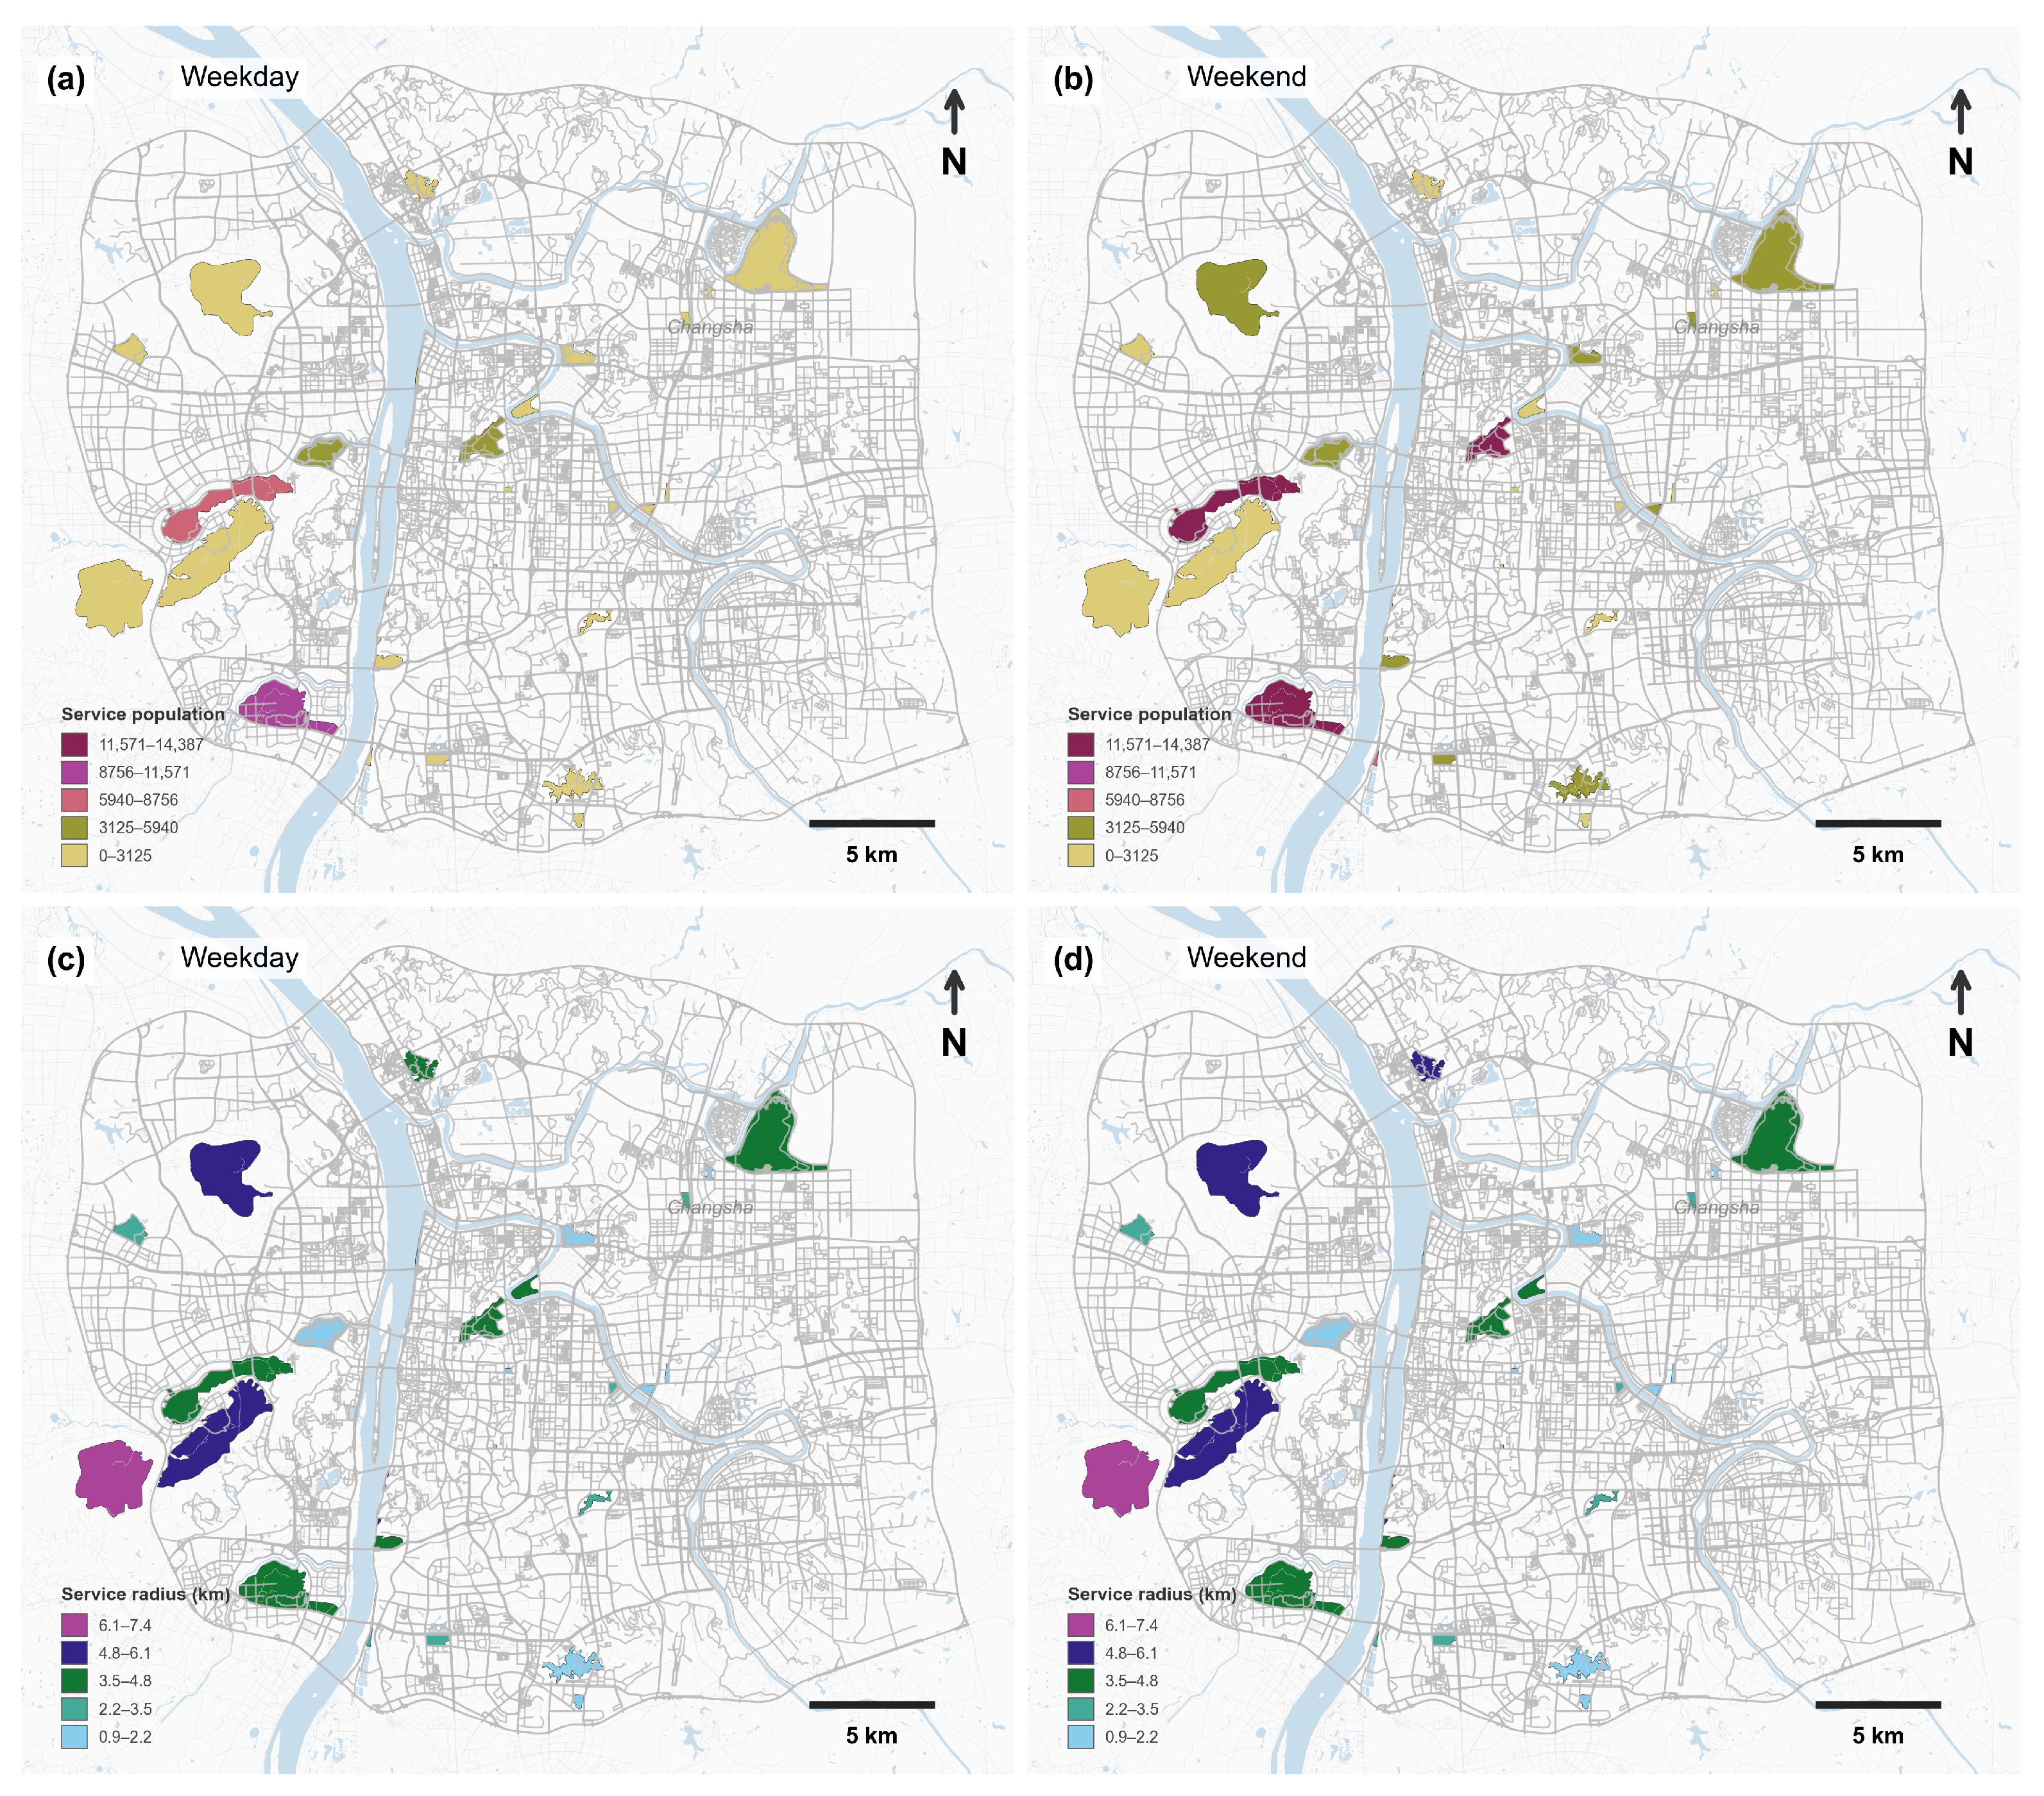
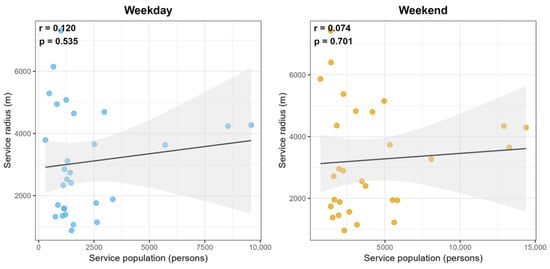
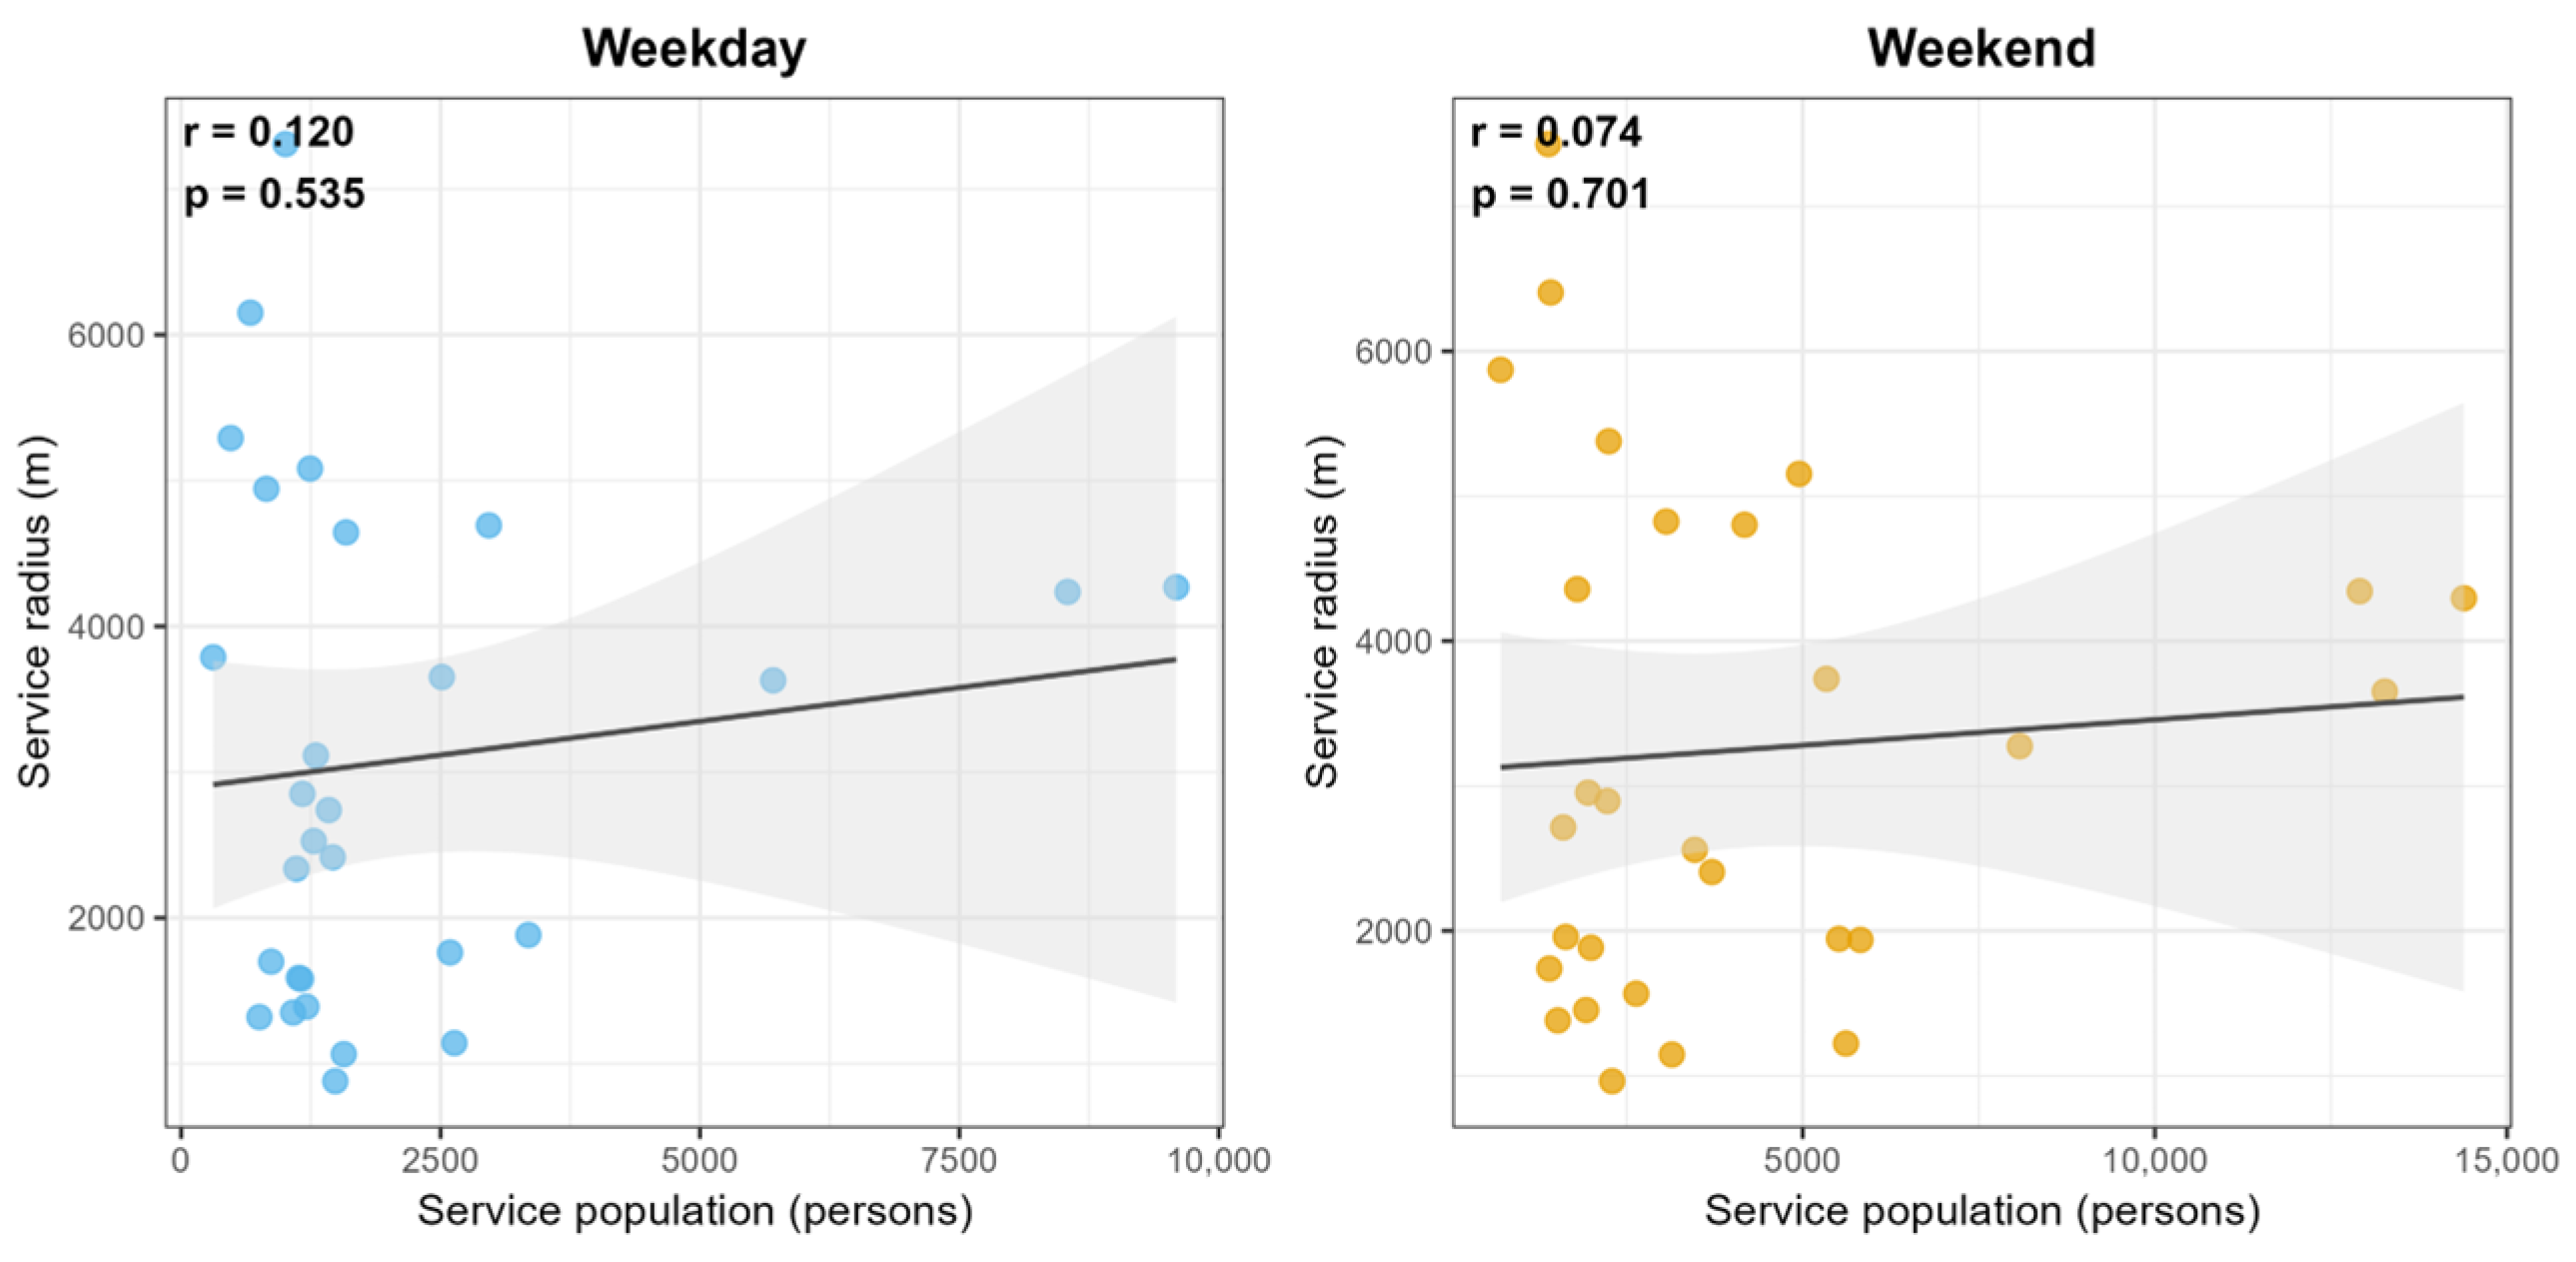
Urban park service population ranged from 309 to 9591 visitors on weekdays and from 711 to 14,387 visitors on weekends. Service radius ranged from 0.88 km to 7.31 km on weekdays and from 0.96 km to 7.43 km on weekends (Figure 2). Pearson correlation analyses showed that service population and service radius were not highly correlated across the sampled parks on either weekdays (r = 0.120, p > 0.05) or weekends (r = 0.074, p > 0.05) (Figure 3).
Figure 2.
Spatial distribution of service population (a,b) and service radius (c,d) on weekday (a,c) and weekend (b,d).
Figure 3.
Pearson correlations between service population and service radius on weekdays and weekends.
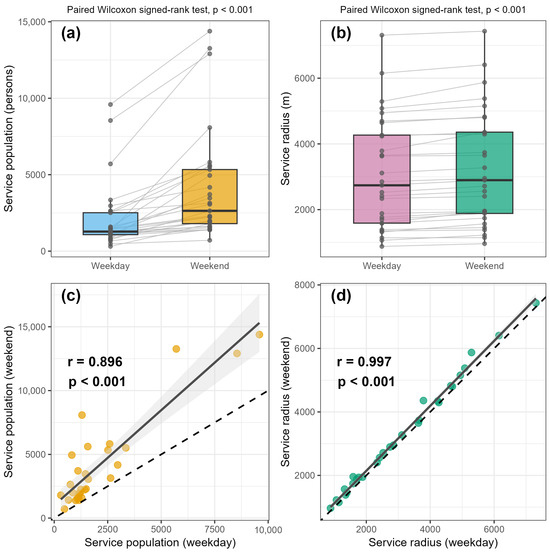
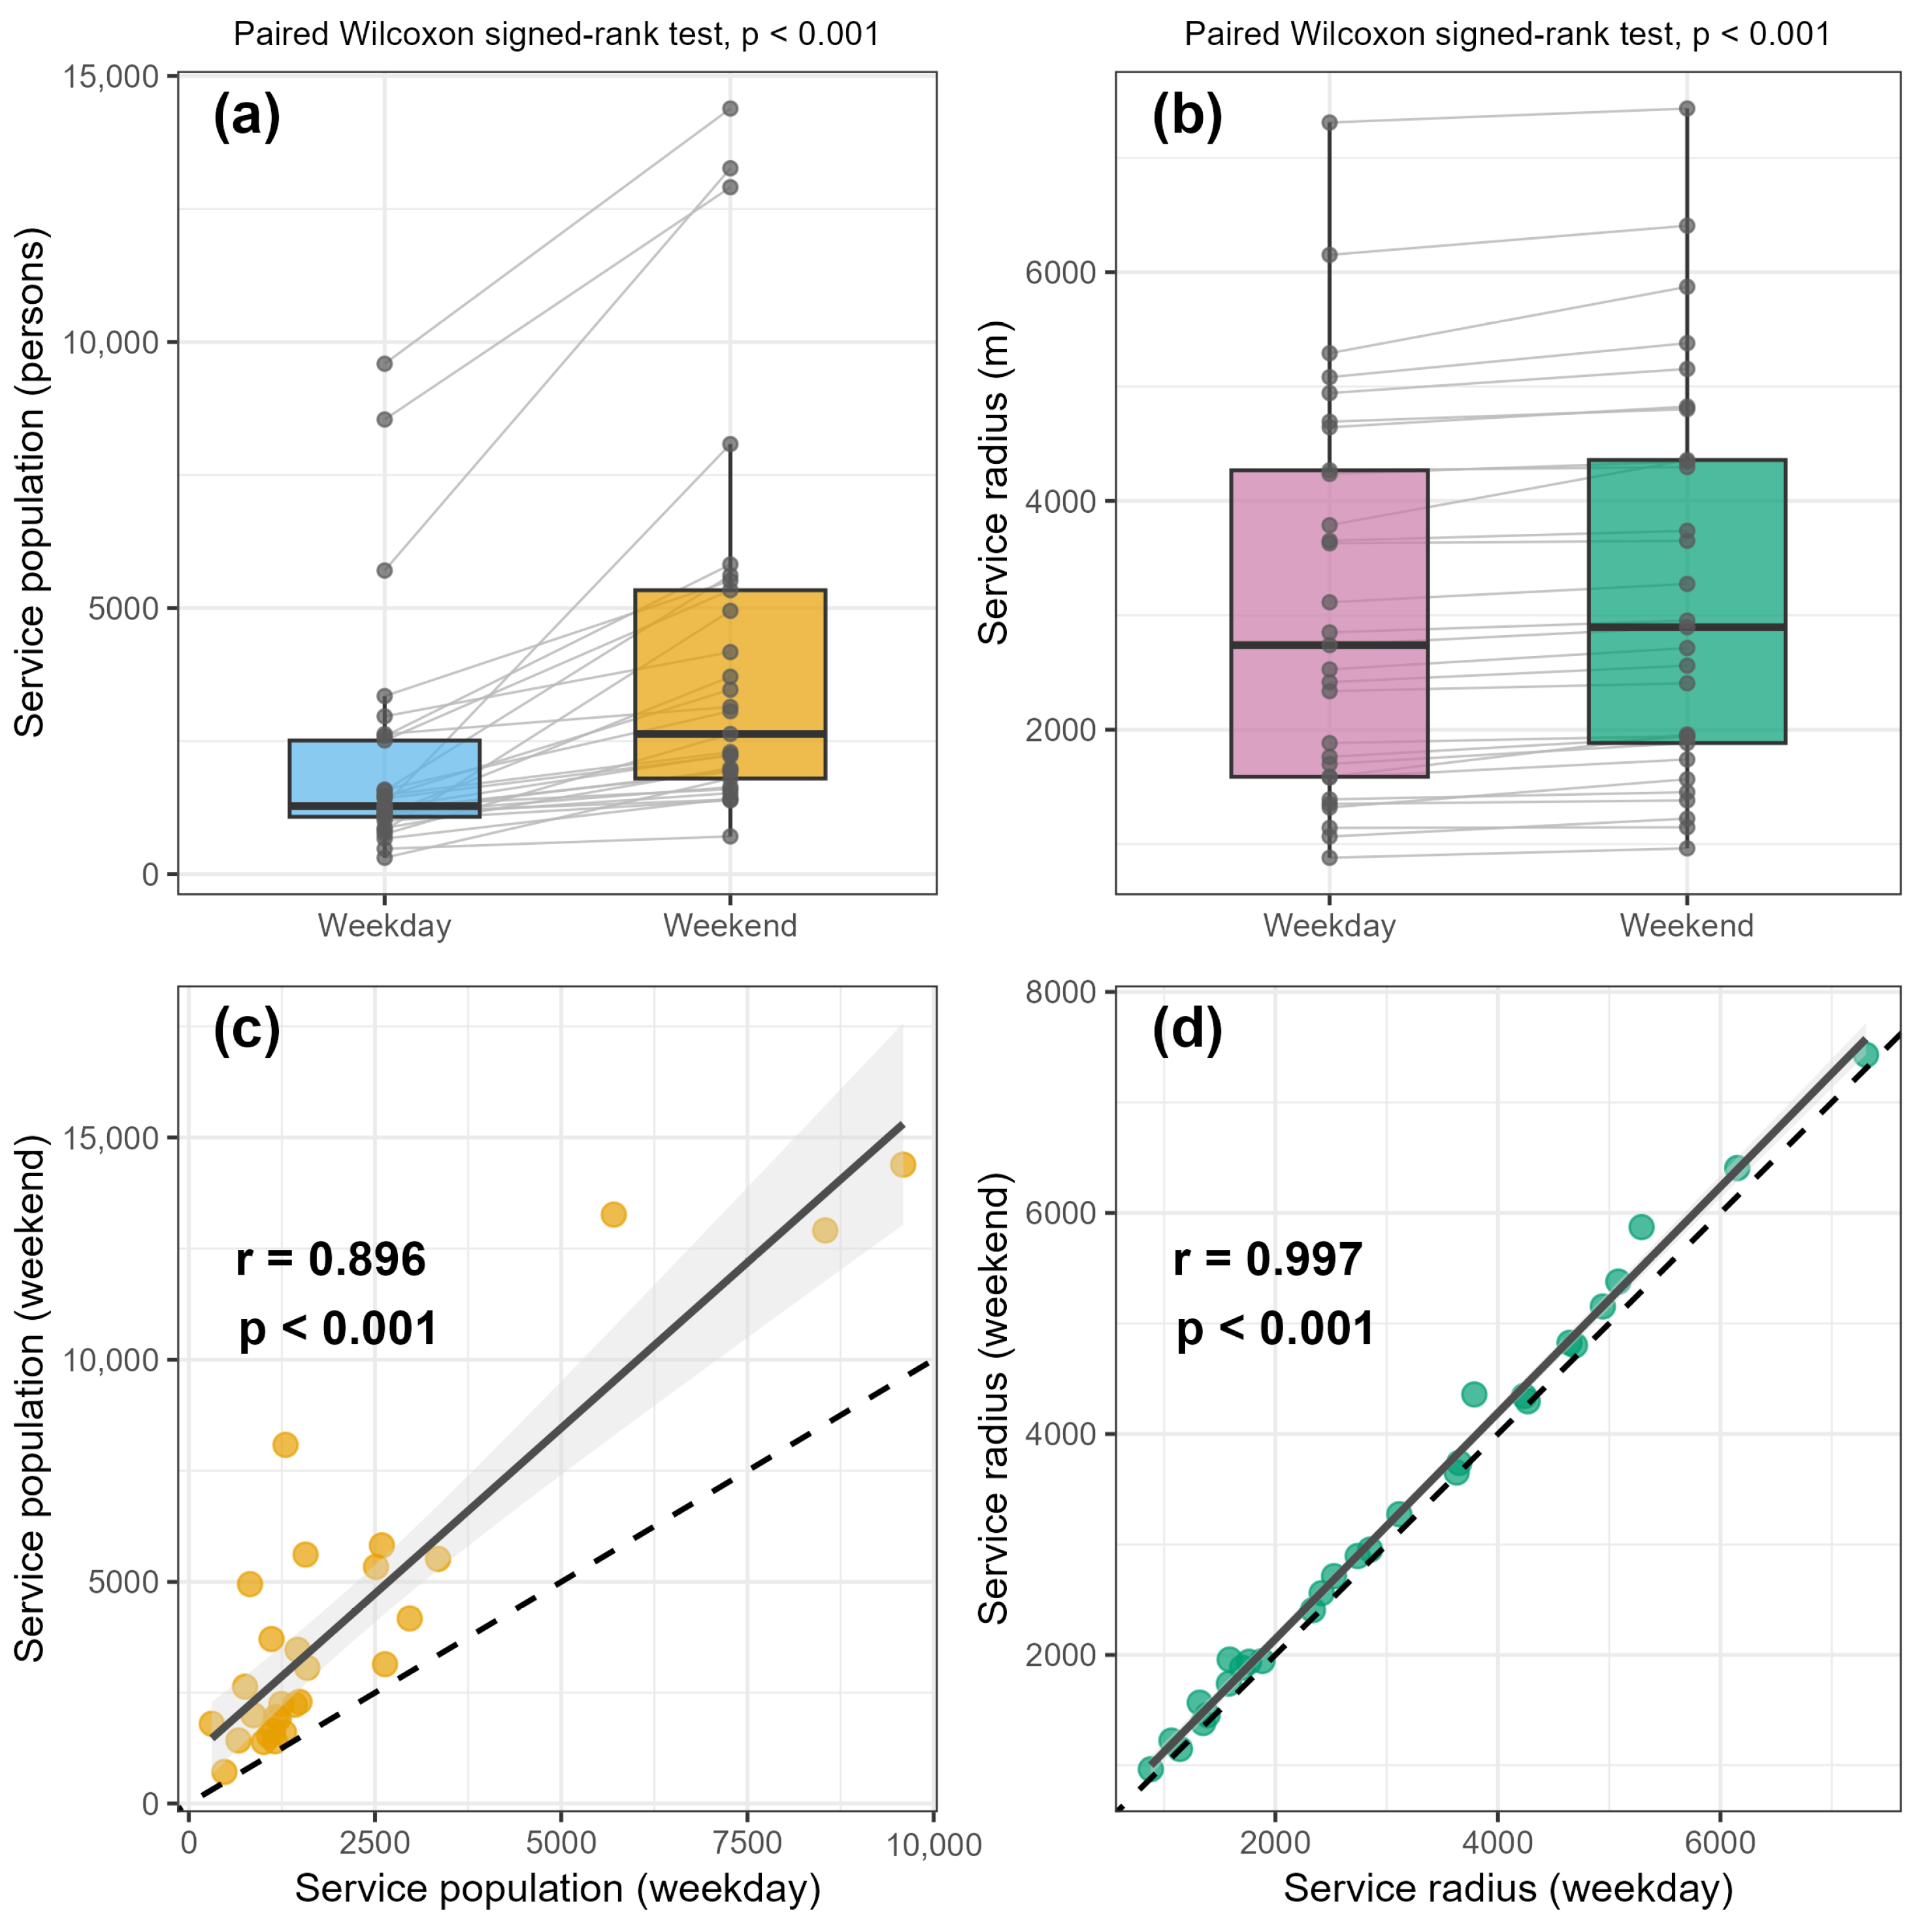
Paired Wilcoxon signed-rank tests showed that service population was significantly higher on weekends (median = 2636) than on weekdays (median = 1279; p < 0.001; Figure 4a). Service population on weekdays and weekends was strongly correlated (Pearson’s r = 0.896, p < 0.001; Figure 4c). Service radius was also significantly higher on weekends (median = 2.896 km) than on weekdays (median = 2.740 km; p < 0.001; Figure 4b). Service radius on weekdays and weekends was nearly perfectly correlated (Pearson’s r = 0.997, p < 0.001; Figure 4d).
Figure 4.
Comparison and scatter plots of service population (a,c) and service radius (b,d) between weekday and weekend.
3.2. Urban Park Spatial Characteristics and Surrounding Environments
Table 1 displays the descriptive statistics of the 20 indicators of urban park landscape features. Urban park areas ranged from 1.33 ha to 520.19 ha (mean = 113.84, SD = 166.94). The average percent vegetation cover was 50.43%, ranging from 10.83% to 98.05%. Approximately 45% of the urban parks had large-scale flower landscapes. Regarding recreational facilities within the park, the maximum number of parking lots was 19, with a standard deviation of 4.66. For surrounding environments, the average number of residential quarters was 62.97 with a maximum of 168, the average number of bus stops reached 34.07, and the mean distance to subway stations was 0.61 km (Table 1).
3.3. Results of Multiple Linear Regression Analysis
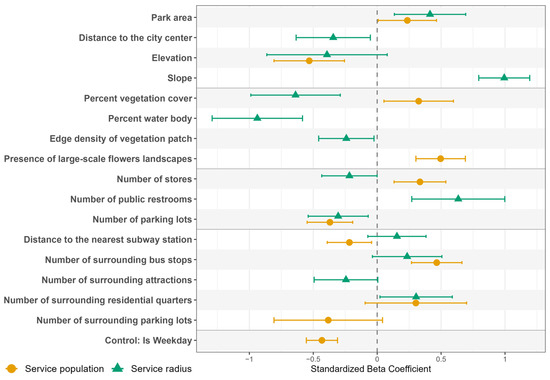
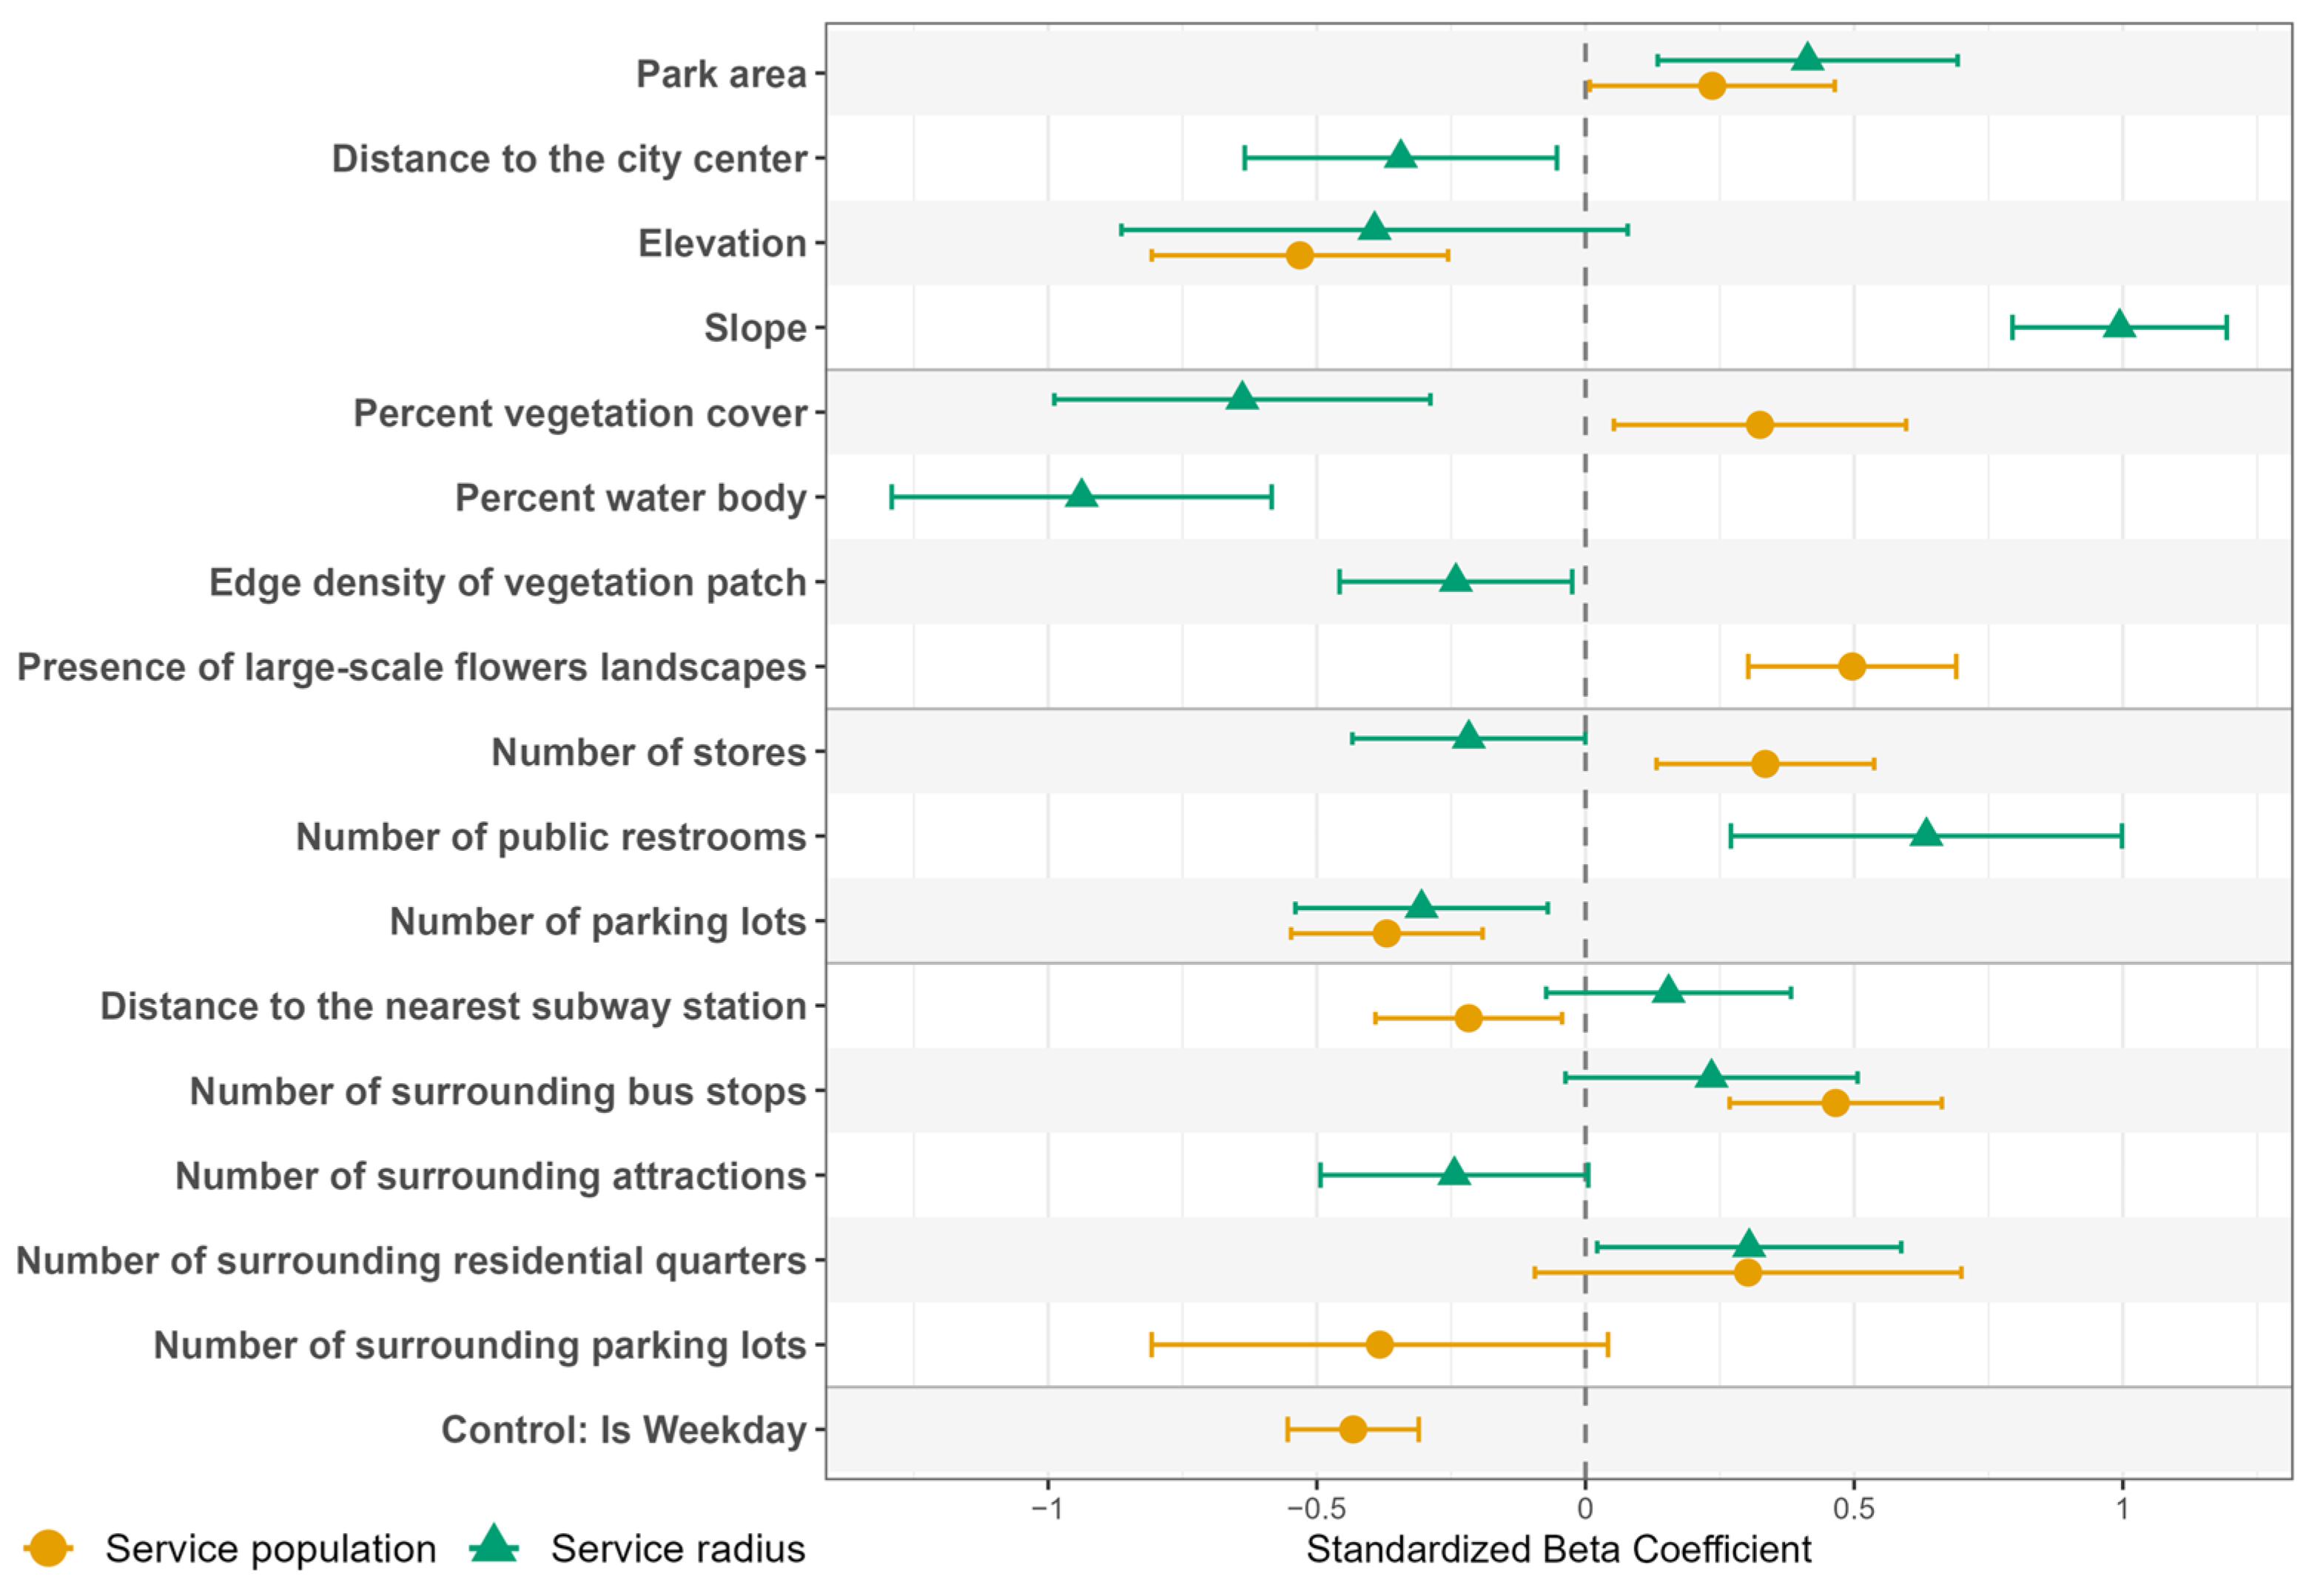
Residual diagnostic plots indicated no severe departures from normality, linearity, or homoscedasticity and no unduly influential observations (Supplementary Figures S1 and S2). The stepwise MLR model for service population (log-transformed) included 11 variables, explaining 71.8% of the variance based on the adjusted R2. Park area (β = 0.24, p < 0.05), percent vegetation cover (β = 0.32, p < 0.05), presence of large-scale flower landscapes (β = 0.50, p < 0.001), number of stores within the park (β = 0.33, p < 0.01), and number of surrounding bus stops (β = 0.47, p < 0.001) showed significant positive regression coefficients, while elevation (β = −0.53, p < 0.001), number of parking lots within the park (β = −0.37, p < 0.001), and distance to the nearest subway station (β = −0.22, p < 0.05) displayed significant negative regression coefficients (Model 1, Table 2). The absolute values of the standardized regression coefficients from high to low were elevation (0.53), presence of large-scale flower landscapes (0.50), number of surrounding bus stops (0.47), number of parking lots within the park (0.37), number of stores within the park (0.33), percent vegetation cover (0.32), park area (0.24), and distance to the nearest subway station (0.22) (Figure 5).
Table 2.
Summary of the multiple linear regression for service population and service radius.
Figure 5.
Standardized regression coefficients of the MLR.
The stepwise MLR model for service radius included 14 variables, explaining 84.5% of the variance in service radius based on the adjusted R2. Park area (β = 0.41, p < 0.01), slope (β = 0.99, p < 0.001), number of public restrooms within the park (β = 0.63, p < 0.01), and number of surrounding residential quarters (β = 0.30, p < 0.05) showed significant positive regression coefficients, while distance to the city center (β = −0.34, p < 0.05), percent vegetation cover (β = −0.64, p < 0.001), percent water body (β = −0.94, p < 0.001), edge density of vegetation patch (β = −0.24, p < 0.05), number of stores within the park (β = −0.22, p < 0.05), and number of parking lots within the park (β = −0.31, p < 0.05) demonstrated significant negative regression coefficients (Model 2, Table 2). The absolute values of standardized regression coefficients from high to low were: slope (0.99), percent water body (0.94), percent vegetation cover (0.64), number of public restrooms within the park (0.63), park area (0.41), distance to the city center (0.34), number of parking lots within the park (0.31), number of surrounding residential quarters (0.30), edge density of vegetation patch (0.24), and number of stores within the park (0.22) (Figure 5).
3.4. Variance Partitioning by Four Groups of Variables
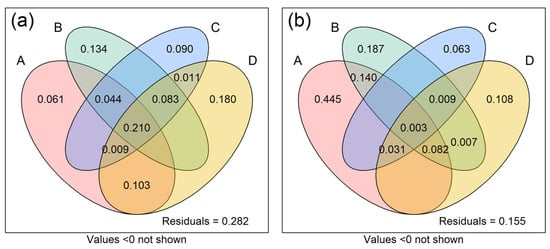
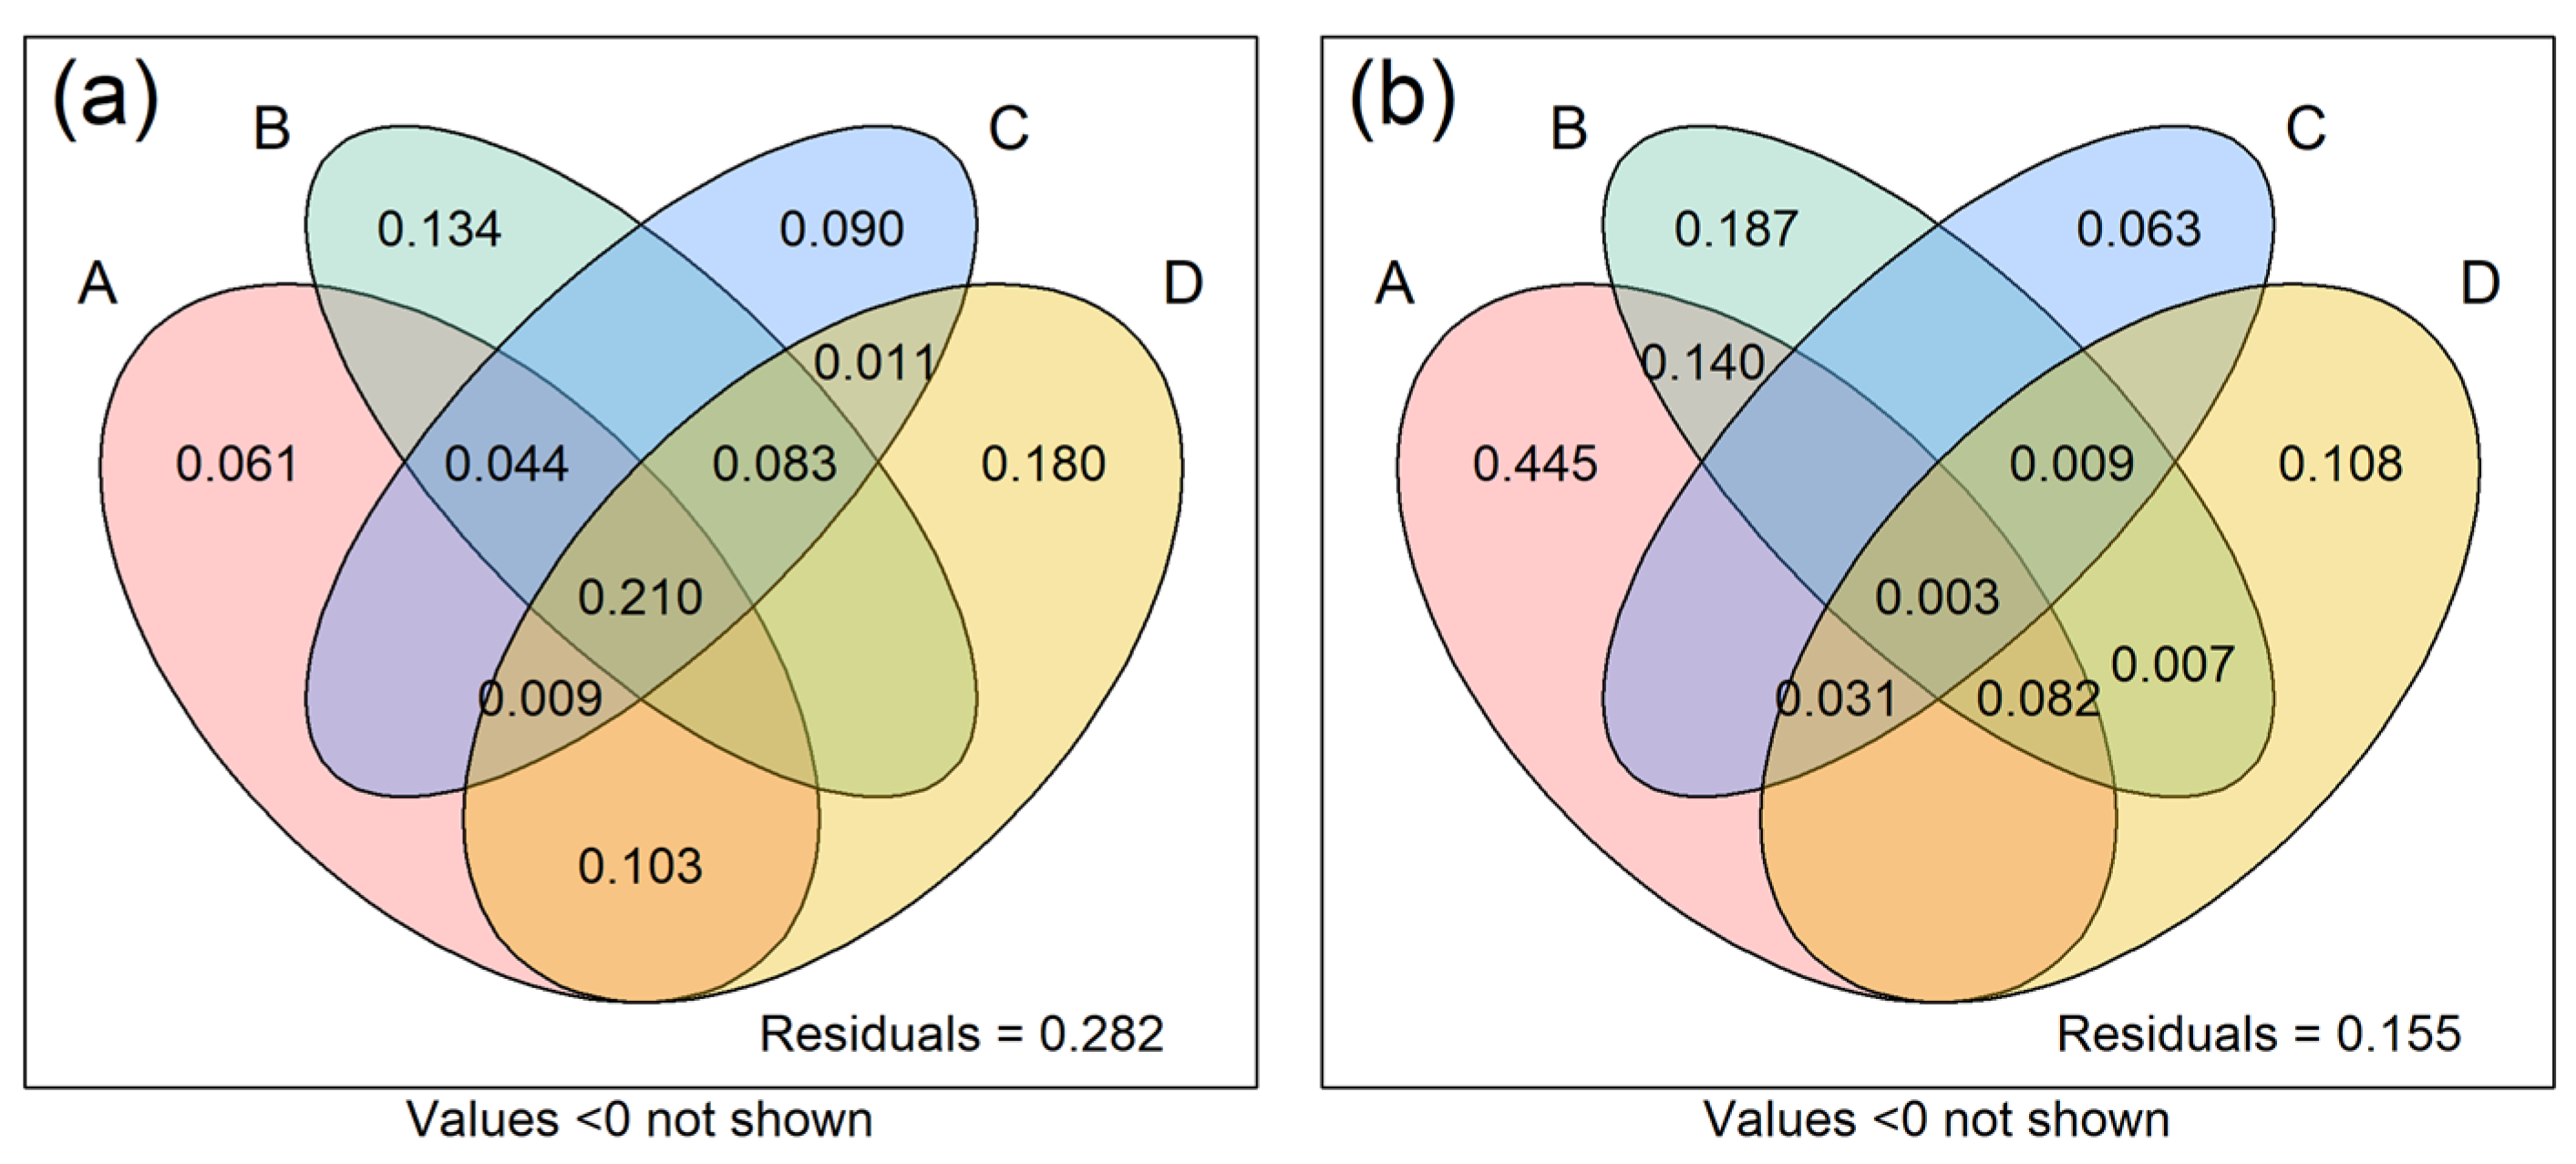
Environments surrounding the urban park independently explained 18% of the variance of service population, followed by land cover within the park (13.4%), recreational facilities within the park (9%), and urban park spatial form and location (6.1%) (Figure 6a). Urban park spatial form and location explained 44.5% of the variance in service radius, followed by land cover within the park (18.7%), environments surrounding the urban park (10.8%), and recreational facilities within the park (6.3%) (Figure 6b).
Figure 6.
Variance partitioning for service population (a) and service radius (b) (A. spatial form and location of the park; B. land cover within the park; C. recreational facilities within the park; D. environments surrounding the park).
4. Discussion
4.1. Factors Associated with Service Population and Service Radius in Opposite Directions
We revealed that urban parks with higher vegetation coverage can be associated with more visitors (Figure 5). This is consistent with the previously reported positive relationships between percent vegetation coverage and service population (measured either directly by visitation numbers [48] or indirectly by check-in of social media data [49]). Vegetation can generate numerous ecosystem services, such as decreasing temperature and mitigating air pollution, and these benefits may be associated with a larger service population [50,51]. However, some studies reported a negative relationship between percent vegetation cover and service population [22,27]. The positive association mentioned above was mainly observed in China, for instance, in Nanjing [20] and Beijing [49], while the negative relationship was frequently reported in Western contexts, particularly in the United States (e.g., the Twin Cities Metropolitan Area [16], New York City [30] and Atlanta [22]). These differences may be caused by the significant differences in urban form, land use, and recreational activities between these two types of countries [52]. Chinese cities are usually highly developed with high population density, and urban parks are the primary natural components with high vegetation coverage. Because of land limitations, urban parks are designed for both conserving vegetation and enhancing visitors’ physical activities. For example, big trees are planted, under which the field is paved for types of physical activities. However, urban parks in Western countries suffer less land competition from urban development, and the vegetation and physical activity spaces are usually spatially exclusive. Therefore, percent vegetation coverage and service population display negative relationships.
A significant negative relationship between percent vegetation cover and service radius was observed in this study, indicating that increasing vegetation cover predominantly is associated with short-distance visitors. This is consistent with the study by Li et al. [14]. One possible reason is that the short-distance visitors rely heavily on high-quality green spaces for daily leisure (e.g., walking, jogging) in highly developed areas, but the long-distance visitors (for example, those for hiking) usually seek parks’ uniqueness rather than mere vegetation coverage [12,53].
Previous studies reported a positive relationship between the number of stores within the park and service population [12,33]. Our findings supported these findings. Stores within the park provide necessities such as food and beverages, which may be associated with more visitors. However, we found a negative relationship between the number of stores within the park and service radius. This indicates that urban parks with more stores are mainly associated with more short-distance visitors, supporting the finding by Zhang et al. [32]. The long-distance visitors usually prepared sufficient food, and the existence of a store within the park has a limited role in the visitors’ decision to visit or not.
4.2. Factors Synergically Associated with Service Population and Service Radius
We found that park area was positively associated with both service population and service radius (Figure 5), suggesting that larger urban parks tended to serve more visitors, especially long-distance visitors. A similar finding was reported by Yang et al. [28]. This is probably because larger urban parks often provide more landscape diversity and recreational opportunities [54], which may appeal to a wider range of visitors [10]. However, park area alone may not be enough to attract visitors from longer distances. Sun et al. [22] reported that the park area was positively associated with service population but negatively associated with service radius. This suggests that distinctive landscape features, such as water bodies and dense vegetation, may also play an important role in attracting long-distance visitors [53].
Consistent with a previous study [55], we found that the number of parking lots within the park was negatively associated with both service population and service radius. A possible reason is that parking lots take up space that could support green space or water features. This may reduce the park’s natural appeal, especially for visitors seeking nature-based recreation [56]. Moreover, Chinese cities have a high population density, with urban park visitors mainly traveling short distances (e.g., walking, biking) [57], and relatively few visitors traveling by car or relying on parking lots. However, studies from Western countries reported a positive association between park parking lots and service population, including in Austin, Texas, USA [58], and in England [59]. This suggests that parking lots may matter more in low-density Western cities than in high-density Chinese cities.
4.3. Factors Associated with Either Service Population or Service Radius
We identified several factors associated with either service population or service radius (Figure 5). Slope was positively associated with service radius. A possible reason is that parks with greater topographic variation are often located in suburban or mountainous areas. They may provide distinctive hiking and sightseeing experiences, which can attract visitors from farther away [60,61]. This finding contrasts with that of Yang et al. [28], possibly because they focused on older adults. Due to mobility limitations, older visitors may prefer parks with gentler terrain [62,63].
The percent of the water body was negatively associated with service radius. This suggests that a large water area reduces the space available for visitor activities, which limits the park’s appeal to visitors from farther away [64]. However, this finding differs from previous studies, which reported a positive relationship between water bodies and service radius, particularly in Western contexts such as Atlanta, Georgia, USA [22], and Ireland [65]. A possible reason is that Chinese cities are usually densely built, and large water bodies may compete with the space required for recreational activities such as group exercise and plaza dancing. In this case, parks may function more as spaces for viewing than for active use [66]. However, Western cities are less constrained by land scarcity and may support interactive water-based activities (e.g., fishing, rowing). Their longer service radius also reflects the mental health benefits and aesthetic value of blue spaces [67,68].
Large-scale flower landscapes were positively associated with service population. Guan et al. [35] reported a similar result in two flower-themed parks in Japan, where visitation increased markedly during rose and cherry blossom festivals. This suggests that seasonal floral landscapes and related cultural events may be associated with temporarily higher park visitation [69]. Plants in a natural style have a positive impact on attractiveness [70].
Elevation was negatively associated with service population, suggesting that parks at higher elevations tended to serve fewer visitors. This finding is consistent with Cui et al. [71]. Higher elevation may increase access difficulty and physical effort, thereby discouraging park visits. However, some studies have reported a positive association between elevation and service population [72]. This difference may reflect variations in recreational context and spatial scale, as higher-elevation areas may offer broader views and greater scenic appeal [73].
The number of public restrooms within the park was positively associated with service radius. This suggests that basic sanitary amenities may enhance park attractiveness and encourage visitors to travel longer distances to access recreational services. This is consistent with Kleeman et al. [74], who found that residents were willing to travel farther to parks equipped with public toilets, highlighting the role of sanitary amenities in increasing visitors’ willingness to choose more distant recreational destinations.
We showed that distance to the nearest subway station was negatively associated with service population. In other words, parks located closer to the subway stations tended to serve more visitors, consistent with Hamstead et al. [30], who found that greater distance to the nearest subway stop was associated with lower park visitation. Better subway accessibility may facilitate park access and increase park use, as also suggested by Lee et al. [75].
The number of bus stops surrounding the park was positively associated with service population. This is consistent with a previous study that reported that the number of bus stops near urban parks was positively associated with park visits [27]. A possible explanation is that greater public transport accessibility reduces travel barriers and facilitates park access for a larger population [29,57].
The negative association between distance to city center and service radius indicates that parks located closer to urban centers tended to serve visitors from farther origins. This finding is consistent with a Shanghai-based study [76], which found that park service radius decreased with increasing distance from the city center. One possible explanation is that central parks usually have better accessibility and higher surrounding population density, which may contribute to a larger service radius [39].
4.4. Planning and Management Implications
Urban parks may be planned near residential quarters, as the number of residential quarters surrounding a park was positively associated with service radius. For the newly developed areas, residential quarters and urban parks can be concurrently planned. In highly developed city center where land is very scarce for building new urban parks, urban parks can be developed after demolishing some underused industrial buildings, as was carried out in Shanghai, China [77].
Larger urban parks may be preferred where feasible, as park size was positively associated with both service population and service radius. We suggest the following three approaches: (1) Increasing park size where feasible during urban park planning. (2) Strictly protecting existing urban parks to avoid being developed for gray infrastructure. (3) Developing park clusters that are composed of several small parks nearby to enhance the recreational service, especially in highly developed areas.
Planting more trees in the park may be considered because vegetation cover was positively associated with service population. This may increase the competition for land between planting more trees and planning more paved land for recreational activities. We suggest conserving big trees with a large canopy, and the surface under the canopy can be paved for recreational activities. It should be noted that this strategy may only be effective in Changsha, China, and cities with a similar humid climate where water is not a restricting factor for trees.
Careful management of recreational facilities within the park may help enhance recreational services. Small stores selling basic recreational materials such as drinking water and snacks may be considered at appropriate sites.
Public transportation surrounding urban parks may also be improved to facilitate park access. The positive association between surrounding bus stops and service population suggests that additional bus routes and bus stops may be considered. The last-mile connection between transit stops and park entrances should also be strengthened. Bus stops can be added or relocated near major park entrances. Short feeder bus routes or shared-bike connections can link subway stations with large parks. Direct pedestrian access could be improved through shaded sidewalks, barrier-free facilities, and clear signage.
4.5. Limitations and Future Research Recommendations
This study has several limitations. Firstly, additional indicators of recreational services, such as visit duration and visitation frequency, could be considered to better understand the associations between landscape features and different dimensions of urban park recreational services. Secondly, the analysis was based on 29 parks in Changsha and observations from one weekend day and one weekday in spring. Both days had similar and favorable weather conditions, but observations from only two days may not fully represent typical weekday and weekend visitation patterns, seasonal variation, or longer-term patterns of park visitation. The sample was also limited to parks in one city, which may constrain the generalizability of the findings to other urban contexts. Given the relatively large number of predictors retained in the final models compared with the number of studied parks, the stability of individual coefficient estimates should be interpreted cautiously and confirmed using larger datasets. Future research could include more parks from different cities and observations from multiple seasons and time periods to examine the robustness and temporal variation of these associations. Thirdly, this study identified statistical relationships between recreational services and urban park landscape features, but the pathways underlying these associations, such as visitors’ visitation intentions and behaviors, were not examined. Some associations may also reflect unmeasured park or surrounding environmental characteristics. Future research could further examine these pathways. Fourthly, mobile signaling data may not fully represent older adults. Further studies on the associations between urban park landscape features and recreational services among older adults are recommended, especially in an aging society.
5. Conclusions
This study examined the associations between landscape features and urban park recreational services measured by service population and service radius. The results suggest that they were not highly correlated, supporting separate analyses of their landscape associations. Landscape features exhibited synergistic, trade-off, or indicator-specific association patterns across the two indicators. Park area was positively associated with both indicators, whereas percent vegetation cover and the number of stores within parks showed trade-off patterns between service population and service radius. These results may inform the planning and management of urban parks to enhance recreational services across multiple dimensions.
Supplementary Materials
The following supporting information can be downloaded at https://www.mdpi.com/article/10.3390/f17091002/s1, Figure S1: Regression diagnostic plots for the service population model; Figure S2: Regression diagnostic plots for the service radius model.
Author Contributions
Conceptualization, X.L.; Methodology, X.L.; Software, L.H.; Validation, L.H.; Formal Analysis, J.Z.; Investigation, L.H. and P.L.; Resources, P.L.; Data Curation, L.H. and L.W.; Writing—Original Draft Preparation, J.Z. and D.S.; Writing—Review and Editing, X.L., D.S. and D.G.; Visualization, J.Z.; Supervision, D.S.; Project Administration, D.S.; Funding Acquisition, D.S. All authors have read and agreed to the published version of the manuscript.
Funding
This research was funded by the Scientific Research Fund of Hunan Provincial Education Department, grant number 25c0159; the Postgraduate Scientific Research Innovation Project of Hunan Province, grant number CX20251079; the Open Topic of Hunan Key Laboratory of Land Resources Evaluation and Utilization, grant number SYS-ZX-202405; and the Postgraduate Scientific Research Innovation Project of Hunan Agricultural University, grant number 2025xkc108.
Data Availability Statement
The mobile signaling data used in this study are not publicly available because they are subject to privacy protection and data provider licensing restrictions.
Acknowledgments
We would like to thank the students who participated in the field observation. We sincerely thank the editors and anonymous reviewers for their constructive comments and suggestions.
Conflicts of Interest
The authors declare no conflicts of interest.
References
- Peters, K.; Elands, B.; Buijs, A. Social interactions in urban parks: Stimulating social cohesion? Urban For. Urban Green. 2010, 9, 93–100. [Google Scholar] [CrossRef] [Scilit]
- Yan, J.; Wu, Y.; Shao, G.; Qiu, Q.; Tang, L. Effective recreational activities in urban green spaces for mental health of scientific researchers. Ecosyst. Health Sustain. 2024, 10, 0199. [Google Scholar] [CrossRef] [Scilit]
- Kondo, M.C.; Fluehr, J.M.; McKeon, T.; Branas, C.C. Urban green space and its impact on human health. Int. J. Environ. Res. Public Health 2018, 15, 445. [Google Scholar] [CrossRef] [Scilit] [PubMed]
- Liu, H.; Li, F.; Li, J.; Zhang, Y. The relationships between urban parks, residents’ physical activity, and mental health benefits: A case study from Beijing, China. J. Environ. Manag. 2017, 190, 223–230. [Google Scholar] [CrossRef] [Scilit] [PubMed]
- Shuib, K.B.; Hashim, H.; Nasir, N.A.M. Community Participation Strategies in Planning for Urban Parks. Procedia-Soc. Behav. Sci. 2015, 168, 311–320. [Google Scholar] [CrossRef] [Scilit]
- Ma, B.; Zhou, T.; Lei, S.; Wen, Y.; Htun, T.T. Effects of urban green spaces on residents’ well-being. Environ. Dev. Sustain. 2018, 21, 2793–2809. [Google Scholar] [CrossRef] [Scilit]
- Ge, Y.; Chen, S.; Ma, Y.; Wang, Y.; Guo, Y.; Gan, Q. Ecosystem services and public perception of green infrastructure from the perspective of urban parks: A case study of Luoyang City, China. Sustainability 2024, 16, 7657. [Google Scholar] [CrossRef] [Scilit]
- Tan, P.Y.; Zhang, J.; Masoudi, M.; Alemu, J.B.; Edwards, P.J.; Grêt-Regamey, A.; Richards, D.R.; Saunders, J.; Song, X.P.; Wong, L.W. A conceptual framework to untangle the concept of urban ecosystem services. Landsc. Urban Plan. 2020, 200, 103837. [Google Scholar] [CrossRef] [Scilit] [PubMed]
- Dushkova, D.; Taherkhani, M.; Konstantinova, A.; Vasenev, V.I.; Dovletyarova, E.A. Understanding Factors Affecting the Use of Urban Parks Through the Lens of Ecosystem Services and Blue–Green Infrastructure: The Case of Gorky Park, Moscow, Russia. Land 2025, 14, 237. [Google Scholar] [CrossRef] [Scilit]
- Liu, W.; Chen, W.; Dong, C. Spatial decay of recreational services of urban parks: Characteristics and influencing factors. Urban For. Urban Green. 2017, 25, 130–138. [Google Scholar] [CrossRef] [Scilit]
- Liu, H.; Li, F.; Xu, L.; Han, B. The impact of socio-demographic, environmental, and individual factors on urban park visitation in Beijing, China. J. Clean. Prod. 2017, 163, S181–S188. [Google Scholar] [CrossRef] [Scilit]
- Chuang, I.T.; Benita, F.; Tuncer, B. Effects of urban park spatial characteristics on visitor density and diversity: A geolocated social media approach. Landsc. Urban Plan. 2022, 226, 104514. [Google Scholar] [CrossRef] [Scilit]
- Chen, S.; Feng, Y.; Guan, C.; Xu, Y.; Tan, Q.; Li, Y.; Yang, X. Machine learning approaches to predicting urban park attractiveness: Insights from Shanghai and Tokyo. Urban For. Urban Green. 2025, 112, 128921. [Google Scholar] [CrossRef] [Scilit]
- Li, F.; Yao, N.; Liu, D.; Liu, W.; Sun, Y.; Cheng, W.; Li, X.; Wang, X.; Zhao, Y. Explore the recreational service of large urban parks and its influential factors in city clusters—Experiments from 11 cities in the Beijing-Tianjin-Hebei region. J. Clean. Prod. 2021, 314, 128261. [Google Scholar] [CrossRef] [Scilit]
- Dade, M.C.; Mitchell, M.G.E.; Brown, G.; Rhodes, J.R. The effects of urban greenspace characteristics and socio-demographics vary among cultural ecosystem services. Urban For. Urban Green. 2020, 49, 126641. [Google Scholar] [CrossRef] [Scilit]
- Donahue, M.L.; Keeler, B.L.; Wood, S.A.; Fisher, D.M.; Hamstead, Z.A.; McPhearson, T. Using social media to understand drivers of urban park visitation in the Twin Cities, MN. Landsc. Urban Plan. 2018, 175, 1–10. [Google Scholar] [CrossRef] [Scilit]
- Li, L.; Du, Q.; Ren, F.; Huang, L.; Voda, M.; Ning, P. Geolocated social media data for measuring park visitation in Shenzhen, China. Urban For. Urban Green. 2023, 88, 128069. [Google Scholar] [CrossRef] [Scilit]
- Gu, X.; Li, Q.; Chand, S. Factors influencing residents’ access to and use of country parks in Shanghai, China. Cities 2020, 97, 102501. [Google Scholar] [CrossRef] [Scilit]
- Zhao, R.; Song, Y.; Guo, S.; Guo, Z.; Shen, X. Unraveling the relationships between urban park characteristics and visit durations: A longitudinal smartphone behavior survey in Austin. Urban For. Urban Green. 2025, 105, 128706. [Google Scholar] [CrossRef] [Scilit]
- Fan, Z.; Duan, J.; Lu, Y.; Zou, W.; Lan, W. A geographical detector study on factors influencing urban park use in Nanjing, China. Urban For. Urban Green. 2021, 59, 126996. [Google Scholar] [CrossRef] [Scilit]
- Li, F.; Li, F.; Li, S.; Long, Y. Deciphering the recreational use of urban parks: Experiments using multi-source big data for all Chinese cities. Sci. Total Environ. 2020, 701, 134896. [Google Scholar] [CrossRef] [Scilit] [PubMed]
- Sun, P.; Liu, P.; Song, Y. Seasonal variations in urban park characteristics and visitation patterns in Atlanta: A big data study using smartphone user mobility. Urban For. Urban Green. 2024, 91, 128166. [Google Scholar] [CrossRef] [Scilit]
- Guo, S.H.; Yang, G.G.; Pei, T.; Ma, T.; Song, C.; Shu, H.; Du, Y.Y.; Zhou, C.H. Analysis of factors affecting urban park service area in Beijing: Perspectives from multi-source geographic data. Landsc. Urban Plan. 2019, 181, 103–117. [Google Scholar] [CrossRef] [Scilit]
- Nelson, J.R.; Won, Y.; Kim, J.; Stuhlmacher, M.; Kim, Y. Is the grass greener or the water bluer? Drivers of local park visitation patterns in Phoenix, Arizona. Urban For. Urban Green. 2024, 95, 128325. [Google Scholar] [CrossRef] [Scilit]
- Yang, Q.; Gao, X.; Lindquist, M.; Song, Y.; Shen, X. Temporal and spatial dynamics of peak-time urban park visitation: Investigating influencing factors across scales in post-pandemic detroit. Urban For. Urban Green. 2025, 112, 128871. [Google Scholar] [CrossRef] [Scilit]
- Geng, C.D.; Harshaw, H.W.W.; Wu, W.; Wang, G. Impacts of COVID-19 on tourism and management response from Banff National Park, Canada. J. For. Res. 2023, 34, 1229–1244. [Google Scholar] [CrossRef] [Scilit] [PubMed]
- Zhang, S.; Zhou, W. Recreational visits to urban parks and factors affecting park visits: Evidence from geotagged social media data. Landsc. Urban Plan. 2018, 180, 27–35. [Google Scholar] [CrossRef] [Scilit]
- Yang, X.; Lin, X.; Shi, H. Exploring associations between the elders’ seasonal park visitation and the built environment through the lens of urban location’s irreplaceability. Appl. Geogr. 2026, 186, 103826. [Google Scholar] [CrossRef] [Scilit]
- Wang, Y.; Pan, Y.X.; Meng, X.D.; Zhu, M.L.; Lin, L.S.; Ding, Z.Q. Exploring recreational ecosystem services and influencing factors in megaparks using mobile phone data—Evidence from the Yangtze River Delta region. Ecol. Indic. 2024, 165, 112195. [Google Scholar] [CrossRef] [Scilit]
- Hamstead, Z.A.; Fisher, D.; Ilieva, R.T.; Wood, S.A.; McPhearson, T.; Kremer, P. Geolocated social media as a rapid indicator of park visitation and equitable park access. Comput. Environ. Urban Syst. 2018, 72, 38–50. [Google Scholar] [CrossRef] [Scilit]
- Liu, Y.; Lu, A.; Yang, W.; Tian, Z. Investigating factors influencing park visit flows and duration using mobile phone signaling data. Urban For. Urban Green. 2023, 85, 127952. [Google Scholar] [CrossRef] [Scilit]
- Zhang, W.; Gao, Y.; Li, S.; Liu, W.; Zeng, C.; Gao, L.; Li, M.; Peng, C. Accessibility measurements for urban parks considering age-grouped walkers’ sectorial travel behavior and built environment. Urban For. Urban Green. 2022, 76, 127715. [Google Scholar] [CrossRef] [Scilit]
- Liao, J.; Kang, J.; Hsu, C.-H.; Shoji, Y.; Kubo, T. Day-night visitor usage of urban parks: Exploring temporal dynamics and driving factors through mobile phone big data. Urban For. Urban Green. 2025, 107, 128818. [Google Scholar] [CrossRef] [Scilit]
- Shanahan, D.F.; Lin, B.B.; Gaston, K.J.; Bush, R.; Fuller, R.A. What is the role of trees and remnant vegetation in attracting people to urban parks? Landsc. Ecol. 2015, 30, 153–165. [Google Scholar] [CrossRef] [Scilit]
- Guan, C.; Song, J.; Keith, M.; Zhang, B.; Akiyama, Y.; Da, L.J.; Shibasaki, R.; Sato, T. Seasonal variations of park visitor volume and park service area in Tokyo: A mixed-method approach combining big data and field observations. Urban For. Urban Green. 2021, 58, 126973. [Google Scholar] [CrossRef] [Scilit]
- He, B.; Hu, J.; Liu, K.; Xue, J.; Ning, L.; Fan, J. Exploring Park Visit Variability Using Cell Phone Data in Shenzhen, China. Remote Sens. 2022, 14, 499. [Google Scholar] [CrossRef] [Scilit]
- Dopico, J.; Wunderli, J.M.; Kawai, C.; Roosli, M.; Vienneau, D.; Brink, M.; Tobias, S.; Schaffer, B. Determinants of green space visits in urban areas: The role of personal, situational and physical characteristics. A cross-sectional study in Zurich, Switzerland. Urban For. Urban Green. 2025, 111, 128872. [Google Scholar] [CrossRef] [Scilit]
- Feng, Y.; Huang, S.; Chen, S.; Guan, C.; Li, Y.; Tan, Q.; Jin, Y.; Yang, X.; Xu, Y. Dataset for visitations of public green spaces in Shanghai, China. Sci. Data 2025, 12, 1260. [Google Scholar] [CrossRef] [Scilit] [PubMed]
- Zhai, Y.; Wu, H.; Fan, H.; Wang, D. Using mobile signaling data to exam urban park service radius in Shanghai: Methods and limitations. Comput. Environ. Urban Syst. 2018, 71, 27–40. [Google Scholar] [CrossRef] [Scilit]
- Peng, H.; Li, X.; Yang, T.; Tan, S. Research on the Relationship between the Environmental Characteristics of Pocket Parks and Young People’s Perception of the Restorative Effects—A Case Study Based on Chongqing City, China. Sustainability 2023, 15, 3943. [Google Scholar] [CrossRef] [Scilit]
- Fry, G.; Tveit, M.S.; Ode, Å.; Velarde, M.D. The ecology of visual landscapes: Exploring the conceptual common ground of visual and ecological landscape indicators. Ecol. Indic. 2009, 9, 933–947. [Google Scholar] [CrossRef] [Scilit]
- Ye, Y.; Qiu, H. Exploring Affecting Factors of Park Use Based on Multisource Big Data: Case Study in Wuhan, China. J. Urban Plan. Dev. 2021, 147, 05020037. [Google Scholar] [CrossRef] [Scilit]
- Huai, S.; Liu, S.; Zheng, T.; Van de Voorde, T. Are social media data and survey data consistent in measuring park visitation, park satisfaction, and their influencing factors? A case study in Shanghai. Urban For. Urban Green. 2023, 81, 127869. [Google Scholar] [CrossRef] [Scilit]
- Wei, D.; Liu, M.; Grekousis, G.; Wang, Y.; Lu, Y. User-generated content affects urban park use: Analysis of direct and moderating effects. Urban For. Urban Green. 2023, 90, 128158. [Google Scholar] [CrossRef] [Scilit]
- NASA JPL. NASA Shuttle Radar Topography Mission Global 1 Arc Second; NASA: Washington, DC, USA, 2013.
- Zhang, E.; Huang, X.; Li, J.; Zhou, J. EcoVision: Submeter Land Cover Map over China’s 42 Major Cities Derived by an Innovative Artificial Data Annotation Engine. J. Remote Sens. 2025, 5, 0811. [Google Scholar] [CrossRef] [Scilit]
- Oksanen, J.; Simpson, G.L.; Blanchet, F.G.; Kindt, R.; Legendre, P.; Minchin, P.R.; O’Hara, R.B.; Solymos, P.; Stevens, M.H.H.; Szoecs, E.; et al. Vegan: Community Ecology Package; The R Foundation: Vienna, Austria, 2025. [Google Scholar]
- Gao, F.; Deng, X.D.; Liao, S.Y.; Liu, Y.; Chen, W.Y.; Li, G.Y. Comparing visitation patterns in distinct types of parks using geospatial data and interpretable machine learning. Urban For. Urban Green. 2025, 112, 128986. [Google Scholar] [CrossRef] [Scilit]
- Zhu, J.; Lu, H.; Zheng, T.; Rong, Y.; Wang, C.; Zhang, W.; Yan, Y.; Tang, L. Vitality of Urban Parks and Its Influencing Factors from the Perspective of Recreational Service Supply, Demand, and Spatial Links. Int. J. Environ. Res. Public Health 2020, 17, 1615. [Google Scholar] [CrossRef] [Scilit] [PubMed]
- Chen, K.; Zhang, T.; Liu, F.; Zhang, Y.; Song, Y. How Does Urban Green Space Impact Residents’ Mental Health: A Literature Review of Mediators. Int. J. Environ. Res. Public Health 2021, 18, 11746. [Google Scholar] [CrossRef] [Scilit] [PubMed]
- Yao, W.; Luo, Q.; Zhang, X.; Zhuo, C.; Mi, L. Exploring the effect of different typical plant community on human stress reduction: A field experiment. Sci. Rep. 2024, 14, 5600. [Google Scholar] [CrossRef] [Scilit] [PubMed]
- Hu, L.; Fan, C.; Cai, Z.; Liao, W.; Li, X. Greening residential quarters in China: What are the roles of urban form, socioeconomic factors, and biophysical context? Urban For. Urban Green. 2023, 86, 128020. [Google Scholar] [CrossRef] [Scilit]
- Tu, X.; Huang, G.; Wu, J.; Guo, X. How do travel distance and park size influence urban park visits? Urban For. Urban Green. 2020, 52, 126689. [Google Scholar] [CrossRef] [Scilit]
- Sari, E.N.; Bayraktar, S. The role of park size on ecosystem services in urban environment: A review. Environ. Monit. Assess. 2023, 195, 1072. [Google Scholar] [CrossRef] [Scilit] [PubMed]
- Chen, Y.; Liu, X.; Gao, W.; Wang, R.Y.; Li, Y.; Tu, W. Emerging social media data on measuring urban park use. Urban For. Urban Green. 2018, 31, 130–141. [Google Scholar] [CrossRef] [Scilit]
- Cobbinah, P.B.; Korah, P.I.; Bardoe, J.B.; Darkwah, R.M.; Nunbogu, A.M. Contested urban spaces in unplanned urbanization: Wetlands under siege. Cities 2022, 121, 103489. [Google Scholar] [CrossRef] [Scilit]
- Shu, D.; Peng, Y.; Zhang, Z.; Shi, R.; Wu, C.; Gan, D.; Li, X. Distance Decay of Urban Park Visitation: Roles of Personal Characteristics and Visitation Patterns. Forests 2024, 15, 1589. [Google Scholar] [CrossRef] [Scilit]
- Lu, H.; Song, Y. Informing inclusive park planning: Neighborhood park visitation modeling based on smartphone big data in Austin, Texas. Land Use Policy 2024, 144, 107234. [Google Scholar] [CrossRef] [Scilit]
- Weitowitz, D.C.; Panter, C.; Hoskin, R.; Liley, D. Parking provision at nature conservation sites and its implications for visitor use. Landsc. Urban Plan. 2019, 190, 103597. [Google Scholar] [CrossRef] [Scilit]
- Shen, X.-J.; Huang, R.-H.; Zhang, J.-S. US national parks accessibility and visitation. J. Mt. Sci. 2019, 16, 2894–2906. [Google Scholar] [CrossRef] [Scilit]
- Spernbauer, B.S.; Monz, C.; D’Antonio, A.; Smith, J.W. Factors influencing informal trail conditions: Implications for management and research in Urban-Proximate parks and protected areas. Landsc. Urban Plan. 2023, 231, 104661. [Google Scholar] [CrossRef] [Scilit]
- Matikainen-Tervola, E.; Cronin, N.; Aartolahti, E.; Sansgiri, S.; Mattila, O.-P.; Finni, T.; Rantakokko, M. Walking Parameters of Older Adults on Hilly and Level Terrain Outdoors. J. Aging Phys. Act. 2025, 33, 574–582. [Google Scholar] [CrossRef] [Scilit] [PubMed]
- Paudel, C.; Timperio, A.; Loh, V.; Deforche, B.; Salmon, J.; Veitch, J. Understanding the relative importance of micro-level design characteristics of walking paths in parks to promote walking among older adults. Urban For. Urban Green. 2023, 89, 128129. [Google Scholar] [CrossRef] [Scilit]
- Hu, H.; Ding, Z.; Wang, H.; Wang, H. Suitable Water Surface Ratio of the Urban Park from the Perspective of Optimizing Eco-Social Benefit: A Case Study of Dashenguan Park in Nanjing, China. Pol. J. Environ. Stud. 2024, 34, 7149–7163. [Google Scholar] [CrossRef] [Scilit]
- Grilli, G.; Mohan, G.; Curtis, J. Public park attributes, park visits, and associated health status. Landsc. Urban Plan. 2020, 199, 103814. [Google Scholar] [CrossRef] [Scilit]
- Zhou, S.; Chen, F.; Xu, Z. Evaluating the accessibility of urban parks and waterfronts through online map services: A case study of Shaoxing, China. Urban For. Urban Green. 2022, 77, 127731. [Google Scholar] [CrossRef] [Scilit]
- McDougall, C.W.; Hanley, N.; Quilliam, R.S.; Oliver, D.M. Blue space exposure, health and well-being: Does freshwater type matter? Landsc. Urban Plan. 2022, 224, 104446. [Google Scholar] [CrossRef] [Scilit]
- Poulsen, M.N.; Nordberg, C.M.; Fiedler, A.; DeWalle, J.; Mercer, D.; Schwartz, B.S. Factors associated with visiting freshwater blue space: The role of restoration and relations with mental health and well-being. Landsc. Urban Plan. 2022, 217, 104282. [Google Scholar] [CrossRef] [Scilit]
- Mou, N.; Wang, J.; Zheng, Y.; Zhang, L.; Makkonen, T.; Yang, T.; Niu, J. Flowers as attractions in urban parks: Evidence from social media data. Urban For. Urban Green. 2023, 82, 127874. [Google Scholar] [CrossRef] [Scilit]
- Chien, M.C. An empirical study on the effect of attractiveness of ecotourism destination on experiential value and revisit intention. Appl. Ecol. Environ. Res. 2017, 15, 43–53. [Google Scholar] [CrossRef] [Scilit]
- Cui, T.; Ye, Y.; Zhuang, Y.; Lin, Q.; Yan, M.; Zhang, L.; Zhu, L. A study of the changing characteristics and influencing factors of holiday visitor vitality in Urban parks: The case of Fuzhou, China. PLoS ONE 2024, 19, e0311546. [Google Scholar] [CrossRef]
- Rice, W.L.; Pan, B. Understanding changes in park visitation during the COVID-19 pandemic: A spatial application of big data. Wellbeing Space Soc. 2021, 2, 100037. [Google Scholar] [CrossRef] [Scilit] [PubMed]
- Lehto, C.; Hedblom, M.; Filyushkina, A.; Ranius, T. Seeing through their eyes: Revealing recreationists’ landscape preferences through viewshed analysis and machine learning. Landsc. Urban Plan. 2024, 248, 105097. [Google Scholar] [CrossRef] [Scilit]
- Kleeman, A.; Jafari, A.; Edwards, N.; Foster, S. Nature calls: Discrete choice analysis of apartment residents’ park attributes and preferences in Australian cities. npj Urban Sustain. 2026. [Google Scholar] [CrossRef] [Scilit]
- Lee, J.Y.; Hwang, H.-S.; Kang, J.E.; Choi, H.-S. Factors affecting urban park utilization in Seoul: Insights from telecommunication data. Cities 2025, 156, 105452. [Google Scholar] [CrossRef] [Scilit]
- Li, Z.; Chen, H.; Yan, W. Exploring Spatial Distribution of Urban Park Service Areas in Shanghai Based on Travel Time Estimation: A Method Combining Multi-Source Data. ISPRS Int. J. Geo-Inf. 2021, 10, 608. [Google Scholar] [CrossRef] [Scilit]
- Zhu, J. Public space and its publicness in people-oriented urban regeneration: A case study of Shanghai. J. Urban Aff. 2025, 47, 2319–2338. [Google Scholar] [CrossRef] [Scilit]

Disclaimer/Publisher’s Note: The statements, opinions and data contained in all publications are solely those of the individual author(s) and contributor(s) and not of MDPI and/or the editor(s). MDPI and/or the editor(s) disclaim responsibility for any injury to people or property resulting from any ideas, methods, instructions or products referred to in the content. |
© 2026 by the authors. Licensee MDPI, Basel, Switzerland. This article is an open access article distributed under the terms and conditions of the Creative Commons Attribution (CC BY) license.