


Abstract
Soil fungi play a key role in nutrient cycling and soil organic matter turnover, yet the influence of pedological context on fungal communities across forest types remains insufficiently understood. Here, we combined soil chemical analyses, Fourier-transform infrared spectroscopy (FTIR), and ITS2 metabarcoding to investigate soil properties and fungal communities in temperate mountain beech (Fagus sylvatica L.) and Norway spruce (Picea abies (L.) H. Karst) forests in Italy developed on contrasting geological substrates. Soil horizons were sampled across seasons to characterize the main associations between fungal community structure, inferred functional diversity, and environmental context. Soil chemistry revealed site- and horizon-dependent patterns, particularly in pH, Ca, and P availability, whereas differences related to dominant tree species were comparatively limited. FTIR spectra showed clear variation in organic matter composition among sites, consistent with site- and stand-associated differences in organic matter composition. Fungal community composition was primarily associated with site and soil horizon. Functional guild patterns suggested ectomycorrhizal dominance in Ca-rich soils and greater prevalence of saprotrophs in more acidic soils. Overall, this multi-proxy approach suggests that pedological context was more closely associated with fungal community structure and ecological strategies than with vegetation type or season within the studied stands. These patterns should be interpreted as site-specific and hypothesis-generating because substrate types were not replicated across independent locations.
1. Introduction
Forests cover approximately 30% of the Earth’s land surface [1] and represent major carbon sinks while supporting exceptional biodiversity [2,3]. Among soil biota, fungi play a central role in nutrient cycling, organic matter decomposition, and plant symbioses, thereby influencing soil properties and forest productivity [3]. Soil fungal communities are shaped by multiple environmental factors, including temperature, precipitation, and soil pH [4], which also influence vegetation patterns and generate feedbacks among trees, fungi, and soil properties [3]. Litter decomposition is an example of this interaction: coniferous litter, which is rich in lignin and phenolic compounds, generally decomposes more slowly and selects for fungi adapted to recalcitrant substrates [5], whereas deciduous litter typically decomposes more rapidly and supports more diverse fungal communities [6]. Through decomposition and mycorrhizal associations, fungi mobilize nutrients and influence soil aggregation and carbon storage [7].
Fungal community structure reflects the interplay between vegetation (root exudates and litter inputs) and soil properties (pH, texture, and nutrient availability), with pH frequently emerging as a major environmental driver [8,9]. Vertical gradients further structure fungal assemblages along soil profiles [10,11], whereas seasonal fluctuations can induce temporal shifts in community composition [12]. Anthropogenic pressures, including land-use change and climate change, add further layers of complexity [13,14].
From a functional perspective, forest soil fungi can be assigned to several ecological guilds, among which mycorrhizal and saprotrophic fungi are particularly important [15]. Mycorrhizal fungi enhance plant nutrient acquisition, particularly in nutrient-poor environments [9,16], whereas saprotrophic fungi decompose complex organic substrates and regulate carbon turnover [17]. Through their hyphal networks and the production of extracellular compounds, fungal communities also contribute to soil aggregation and carbon stabilization [18,19], underscoring the functional complexity of forest soils.
In Italy, the Alps and the Apennines are two major mountain systems encompassing extensive forest ecosystems [20,21]. Common tree species in Alpine forests include Norway spruce (Picea abies), silver fir (Abies alba), European beech (Fagus sylvatica), and European larch (Larix decidua) [22,23,24], whereas European beech (Fagus sylvatica) and silver fir (Abies alba) are widespread in Apennine forests [25,26]. These contrasting environmental settings provide an opportunity to investigate how variation in vegetation and soil conditions is associated with soil fungal communities across Italian mountain ecosystems [27]. Characterizing fungal diversity is essential for understanding fungal ecological roles and responses to environmental change. High-throughput sequencing of the internal transcribed spacer 2 (ITS2) region of ribosomal DNA has become a widely used method for fungal community analysis [28]. ITS2, a non-coding region located between the 5.8S and large subunit (28S/LSU) ribosomal RNA genes, exhibits high variability among fungal species, making it a suitable target for fungal DNA metabarcoding.
Soil physicochemical properties are now widely recognized as key regulators of fungal diversity and community assembly, acting both directly, through pH and nutrient availability, and indirectly, via their interplay with vegetation. Regional-scale surveys have consistently identified soil pH and host plant identity as two of the strongest predictors of fungal community structure [29], with additional evidence that nutrient status and soil depth further modulate these patterns [30,31]. Tree species may also influence fungal communities indirectly, through litter quality, root inputs, and mycorrhizal associations, which modify the soil chemical environment to which fungal taxa respond [32]. Fungal communities also display marked temporal variability, with seasonal shifts in composition and diversity occurring even within the same site and vegetation type [33,34]. Taken together, studies spanning biogeographical [35] and successional [36] contexts consistently point to pedological and environmental conditions as central to fungal community structure, yet rarely disentangle this influence from that of tree species identity within directly comparable stands.
Despite the recognized importance of soil properties in shaping fungal communities, relatively few studies have explicitly compared fungal assemblages associated with contrasting geological substrates under comparable vegetation and across soil horizons. Although differences associated with tree species have been investigated under a common substrate [32], patterns associated with contrasting parent materials under comparable vegetation remain less well characterized. Many studies have also focused on surface soils and vegetation effects using sequencing-based profiling combined with basic soil chemistry [29,35], often without spectroscopic characterization of organic matter or integrating multiple analytical proxies. Consequently, the respective associations of parent material and tree species identity with fungal community structure remain incompletely resolved, particularly in mountain forest ecosystems where pronounced environmental gradients occur over short distances [37].
Here, we hypothesized that contrasting geological substrates would be associated with distinct soil biogeochemical regimes and corresponding differences in fungal community composition and functional guild structure across soil profiles. We further examined substrate-associated patterns in relation to vegetation type and sampling season using a multi-proxy approach integrating soil geochemistry, Fourier transform infrared (FTIR) spectroscopy, and ITS2 metabarcoding. By comparing two mountain forest sites developed on contrasting parent materials—a siliciclastic substrate in the Apennines and a dolomitic-calcareous substrate in the Alps—we sought to identify associations between pedological context and belowground fungal communities and to generate testable hypotheses for future studies. Because each substrate type was represented by a single site, substrate effects could not be formally separated from other site-level differences. Accordingly, this comparative framework should be regarded as exploratory and as a basis for identifying substrate-associated patterns requiring validation through broader, replicated studies.
2. Materials and Methods
2.1. Study Area
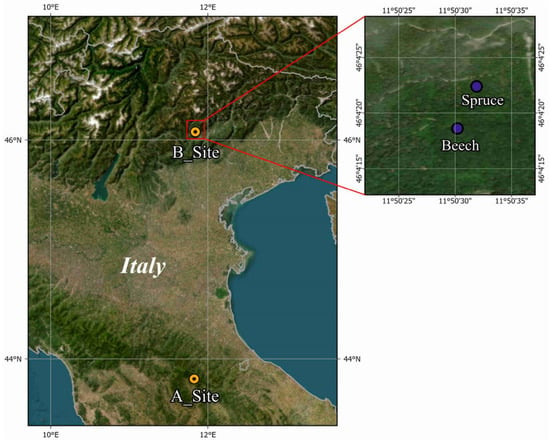
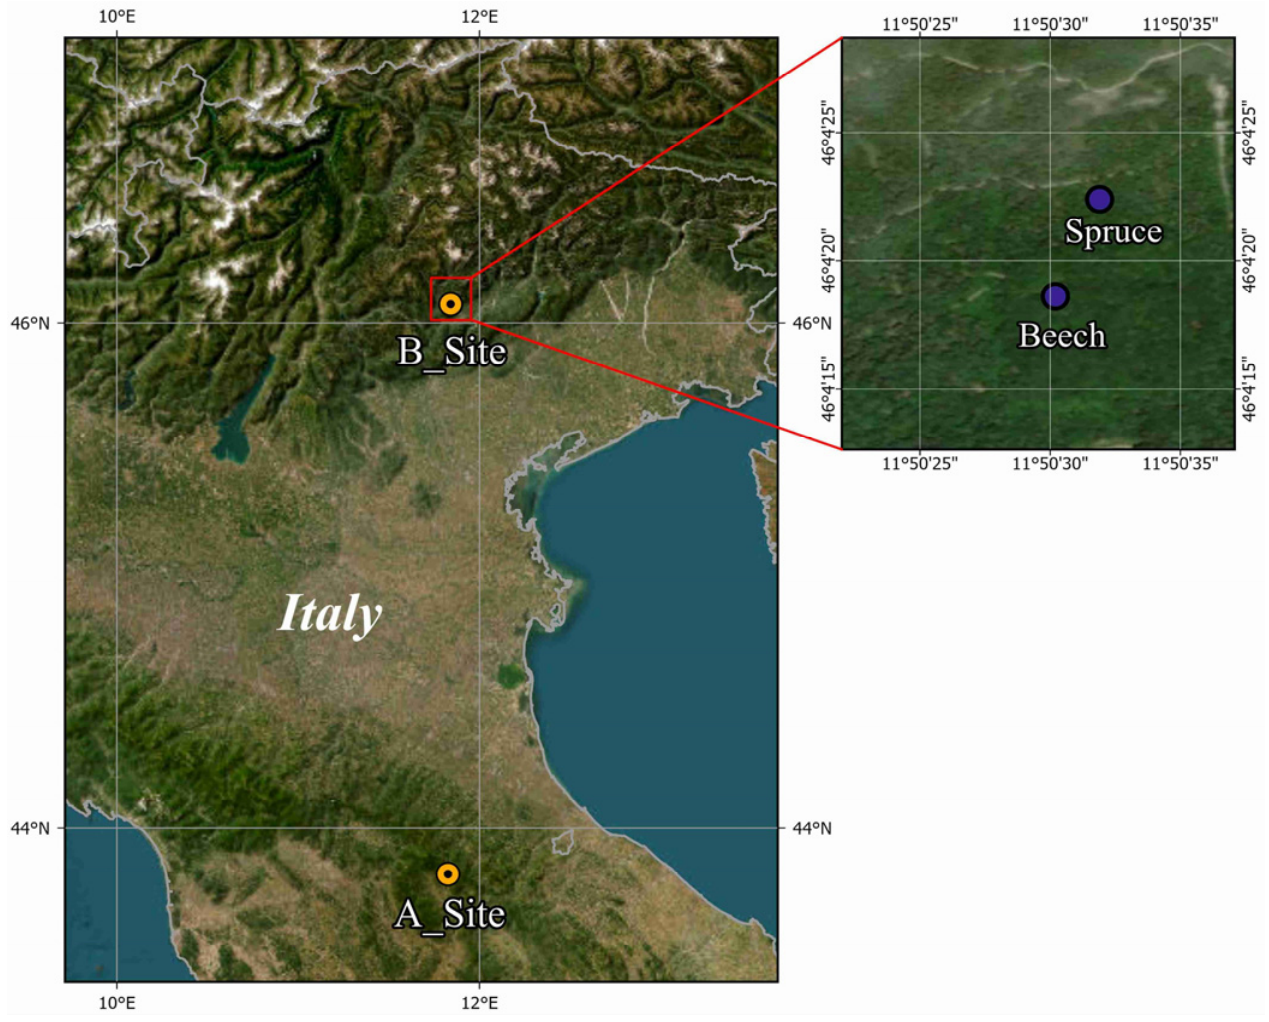
Two experimental sites were selected in two Italian mountain regions: the Apennines and the Dolomites (Figure 1). Given the difficulty of matching topographic and vegetation gradients across these distinct macro-regions, we adopted an observational comparative design based on extensively characterized, representative forest stands. As a co-occurring spruce stand was not available at the Apennine site, sampling there was limited to beech, whereas both beech and spruce were sampled at the site in the Dolomites. Although not fully balanced, this configuration allowed two complementary contrasts: beech stands on contrasting substrates (between-site contrast) and beech and spruce stands on the same substrate (within-site vegetation contrast).
Figure 1.
Geographical location of the two study sites. The map shows site_A in the Apennines and site_B in the Dolomites, including the beech and spruce sampling stands at site_B.
The Apennine site (site_A) is located in Camaldoli (AR), within the National Park of Casentino Forests, Monte Falterona and Campigna (est. 1993). The soils in this area are classified as Ultic Hapludalfs (Soil Taxonomy) or Umbric Acrisols (WRB). The texture is silty medium loam (sand 35%, silt 50%, clay 15%). The climate (1991–2021 average) is characterized by a mean annual temperature of 10.9 °C, with monthly mean temperatures ranging from −0.9 °C (February) to 25.7 °C (July and August), and a total annual precipitation of 1028 mm (monthly average: 85.7 mm; min: 52 mm, max: 137 mm) (climate-data.org, accessed on 25 March 2026). Sampling was conducted in a beech-dominated stand (43°48′45.1″ N, 11°49′34.6″ E; 1240 m a.s.l.; slope 25%; aspect southwest). Historically shaped by centuries of traditional monastic silviculture, this forest is currently classified as a biogenetic reserve and has largely been left unmanaged in recent decades.
The Dolomites site (site_B) is located in Croce d’Aune (BL), within the Dolomiti Bellunesi National Park (est. 1990). Its soils are Typic Hapludalfs or Albic Cutanic Luvisols, featuring a clay loam texture (sand 21%, silt 44%, clay 35%). The local climate (1991–2021 average) features a mean annual temperature of 9.6 °C, with monthly mean temperatures ranging from −0.4 °C (January) to 19 °C (July) and a total annual precipitation of 1743 mm (monthly average: 145.2 mm; min: 74 mm, max: 184 mm) (climate-data.org, accessed on 25 March 2026). Two sublocations were selected: a spruce-dominant stand (46°04′22.4″ N, 11°50′31.9″ E; 1370 m a.s.l.; slope 57%; aspect south) and a beech-dominant stand (46°04′18.6″ N, 11°50′30.2″ E; 1287 m a.s.l.; slope 55%; aspect south). Both stands are located within the protected area of the National Park, where active forestry management has been discontinued.
Soil samples were collected in 2023 at site_A and both site_B stands (spruce and beech) during spring (T1), summer (T2), and fall (T3) (Figure S1). At T1, ten samples were collected at least 3 m apart within a 50 m2 plot, whose exact shape varied depending on local terrain and vegetation density, which was selected for homogeneity in vegetation and management; all ten samples were used for soil chemical analyses, while five of these were also used for ITS metabarcoding. At T2 and T3, five samples per stand were collected under the same plot criteria and used exclusively for ITS metabarcoding. While this localized sampling strategy (five samples per stand) does not allow for broad spatial replication across multiple geographic sites, it was designed to robustly capture the intra-stand microenvironmental variability required to profile fungal communities under these specific edaphic and vegetative conditions.
Soil samples were collected after removal of the surface litter layer, corresponding to fresh, non-decomposed litter (OL horizon sensu the European humus form classification, approximately equivalent to the Oi horizon in USDA Soil Taxonomy). The soil profile was exposed using a spade, and the organic horizon (OF, approximate thickness 5 cm) and the uppermost mineral horizon (A, approximate thickness 15 cm) were sampled separately, with horizon boundaries and thickness varying locally depending on microtopography. The organic horizon sampled corresponds to the fragmented/fermentation layer (OF, partially decomposed organic material; approximately equivalent to Oe in USDA Soil Taxonomy); a distinct, separable humified layer (OH, approximately equivalent to Oa) was not consistently present or was too thin to be sampled as a discrete subhorizon at the study sites, and was therefore not sampled separately. Approximately 300 g of soil was collected per horizon using a spoon. All sampling tools were cleaned and disinfected before each sampling event, and soil samples were transported in sterile bags to minimize contamination. Sampling points were randomly distributed to reflect site averages, excluding accumulation or erosion zones and ecotonal transitions, and maintaining a minimum distance of 1 m from trees. Two subsamples (OF and A) were collected per point.
2.2. Soil Characterization and FTIR Analysis
Soil chemical analyses were performed only on T1 (spring) samples since bulk soil physicochemical properties are expected to remain relatively stable over a few months, allowing us to characterize the baseline edaphic context of each stand and horizon rather than short-term seasonal fluctuations. Samples were air-dried, ground and homogenized, and passed through a 0.5-mm sieve. Total nitrogen was determined using a vario MACRO CNS elemental analyzer (Elementar Analysensysteme GmbH, Langenselbold, Germany). Soil organic carbon was determined using the Walkley–Black method (1934), and Olsen-extractable phosphorus was determined using the Olsen method. Soil pH was measured in water and 1 M KCl (1:2.5 w/v). Exchangeable bases (Ca2+, Mg2+, K+, Na+) were extracted with 1 M ammonium acetate (pH 7.0). Soil samples were subjected to microwave-assisted acid digestion using a mixture of hydrochloric acid (HCl), nitric acid (HNO3), and hydrogen peroxide (H2O2) (3:1:1) at 200 °C. Acid-extractable elemental concentrations were then determined by ICP–OES.
FTIR spectra of organic-horizon soil samples were recorded using a Bruker Tensor 27 Spectrophotometer (4000–400 cm−1, 4 cm−1 resolution, 64 scans, Bruker Optics, Ettlingen, Germany) with an ATR diamond crystal (Specac Quest ATR, Specac Ltd., Orpington, Kent, UK). Following background and baseline correction, spectral analysis specifically targeted the 1800–1240 cm−1 region. This diagnostic window was chosen because it encompasses the primary structural vibrations of ecologically relevant soil organic matter constituents, particularly structural carbohydrates, amides, and aromatic compounds derived from lignin. The region was analyzed via Gaussian curve-fitting using Grams/386 software (version 6.00, Galactic Industries Corporation, Salem, NH, USA). Initial peak positions were guided by established literature assignments for functional groups. Peak parameters (height and width) were iteratively optimized to minimize the reduced Chi-square (χ2). Peak areas were integrated after curve fitting, providing semi-quantitative, indicative insights into functional group distribution across sites.
2.3. Total Soil DNA Extraction, ITS2 Metabarcoding, and Data Analysis
Amplicon sequencing targeting the fungal ITS2 region was performed on 90 samples (five per experimental condition). Soil DNA was extracted using the DNeasy PowerSoil Pro Kit (Qiagen, Hilden, Germany) according to the manufacturer’s instructions from 250 mg of each dried soil sample. Amplification of the ITS2 region and subsequent Illumina sequencing were performed by Novogene Co., Ltd. (Cambridge, UK). The ITS2 region was amplified using the primers ITS3-2024F (5′ GCATCGATGAAGAACGCAGC 3′) and ITS4-2409R (5′ TCCTCCGCTTATTGATATGC 3′). Sequencing was performed on an Illumina NovaSeq 6000 platform (Illumina, Inc., San Diego, CA, USA), and primer-trimmed reads were provided.
Trimmed reads were processed using QIIME2-2022.2 [38], where they were imported and processed using qiime “dada2 denoise-paired” [39] for denoising, chimera removal, and dereplication, generating an ASV table and representative sequences. No quality trimming was performed in DADA2, considering the overall good sequencing quality after primer removal. Taxonomic assignment of ASVs was performed with the “classify–consensus–blast” plugin against the UNITE v9 database [40] (Script and parameters provided in Table S2).
Downstream analyses were conducted in MicrobiomeAnalyst 2.0 using Cumulative Sum Scaling (CSS) normalization [41] and a prevalence-based low-count filter, retaining only ASVs present in at least 10% of samples. Fungal diversity was assessed via alpha (Chao1, Shannon, Simpson) and beta (PCoA on Bray–Curtis distances) metrics (Section 2.5). Biomarkers at the genus level were identified by LEfSe (LDA score > 2.5) [42], and data were visualized using SRplot (accessed between January and July 2026) [43]. Finally, fungal functional groups were assigned to ASVs using FUNGuild v1.1 with default parameters.
2.4. Vegetation Index (NDVI) Analysis
To characterize vegetation dynamics, the Normalized Difference Vegetation Index (NDVI) was derived from Sentinel-2 imagery (10 m resolution, 5-day revisit time). NDVI was calculated as (B8 − B4)/(B8 + B4), using the near-infrared and red bands, with all processing conducted on the Google Earth Engine platform (https://earthengine.google.com/, accessed on 10 January 2026). To account for cloud cover and variable conditions in mountain regions, a ±30-day temporal window centered on each sampling date was applied. Values were extracted using a 50 m buffer around each point (Figure S2). After filtering for cloud-free observations, we calculated the mean, maximum, standard deviation, and coefficient of variation. The window-averaged mean NDVI (NDVIwin_mean) was selected as the primary metric for its robustness. Because NDVI reflects canopy-level vegetation conditions at a spatial resolution (10 m) substantially coarser than point-based soil sampling, direct relationships between remotely sensed vegetation metrics and belowground microbial communities should be interpreted cautiously. The spatial mismatch between canopy-scale observations and localized soil measurements may limit the detection of fine-scale vegetation–microbiome associations. NDVI metrics were therefore included primarily as descriptors of canopy phenology and environmental background conditions rather than as direct predictors of fungal community composition. Integrated with soil and fungal data, they provide contextual information for site and seasonal comparisons.
2.5. Statistical Analysis
Statistical analyses were conducted within an exploratory comparative framework. Unless otherwise specified, all statistical analyses described in this section were performed in R (version 4.6.0; R Core Team, 2026). Given the limited number of study sites and the absence of replicated substrate-level locations, the results should be interpreted as site-specific patterns rather than formal tests of substrate effects at a broader geographical scale. Accordingly, all explanatory variables were treated as fixed effects, and statistical inference was restricted to the sampled stands.
Differences among stands were tested separately within each soil horizon using Kruskal–Wallis tests followed by Dunn’s post hoc comparisons with Bonferroni correction. Differences between paired organic and mineral samples collected at the same sampling point were tested using paired Wilcoxon signed-rank tests. Given the non-parametric nature of this approach, normality was not assumed.
Fungal samples were collected as paired organic and mineral subsamples from the same physical sampling point, with points nested within stand and season. To account for this paired, nested structure, all subsequent analyses of fungal community data followed two complementary strategies: (i) effects of stand identity and sampling season were tested on values averaged across the organic and mineral horizons within each point, so that each point contributed a single independent observation; and (ii) horizon effects were tested directly on points with a complete organic–mineral pair, using paired non-parametric tests that preserve this dependency. Taxon-level abundance comparisons were performed on the 20 most abundant fungal genera, selected to ensure visual and statistical interpretability, while functional guild distributions, assigned via FUNGuild, aggregate all genera into each guild category rather than being restricted to a fixed number of taxa. Following this approach, differences in fungal genus abundances and functional guild distributions associated with stand identity and season were assessed on horizon-averaged, point-level data using Kruskal–Wallis tests followed by Dunn’s post hoc comparisons with Bonferroni correction (p < 0.05), while horizon effects were assessed using paired Wilcoxon signed-rank tests (p < 0.05) on points with a complete organic–mineral pair.
Alpha diversity (Chao1, Shannon, and Simpson indices) was calculated at the ASV level. Following the same logic, stand identity and season effects were tested on horizon-averaged, point-level values using Kruskal–Wallis tests followed by Dunn’s post hoc comparisons with Bonferroni correction, while horizon effects were tested using paired Wilcoxon signed-rank tests on points with a complete organic–mineral pair (significance levels: ns, * p < 0.05, ** p < 0.01, and *** p < 0.001).
Fungal community composition was evaluated using Bray–Curtis dissimilarities, visualized through Principal Coordinates Analysis (PCoA), and tested using PERMANOVA with 999 permutations, using the adonis2() function in the vegan package in R (vegan 2.7-2) using the 30 most abundant genera. The model included soil horizon, sampling season, and stand identity as explanatory factors. PERMANOVA results should be interpreted as a descriptive multivariate approach rather than as evidence of causal relationships among environmental drivers. Homogeneity of multivariate dispersion was assessed using betadisper, followed by permutation tests, to support this interpretation. To further account for the paired, nested sampling structure described above, PERMANOVA significance was additionally assessed using a restricted, split-plot permutation scheme (permute package in R, version 0.9-10), in which sampling points were freely permuted with each other while organic/mineral subsamples were permuted only within their own point.
Relationships between fungal community composition and soil properties were further explored by redundancy analysis (RDA) based on the 30 most abundant fungal genera. Genus abundance data were Hellinger-transformed prior to analysis. Because soil chemical variables were measured only on spring samples, they were used to represent baseline edaphic conditions for each stand x horizon combination rather than contemporaneous measurements for each fungal sample. Accordingly, soil variables were averaged by stand and soil horizon and linked to the corresponding fungal community matrix as contextual descriptors of pedological setting. Candidate explanatory variables were selected based on ecological relevance and reduced collinearity, assessed using variance inflation factors (VIFs). Exchangeable Ca was excluded from the final model due to a VIF exceeding 30, reflecting strong collinearity with soil pH at the aggregated stand-by-horizon level used in this analysis; the final set of variables retained in the RDA (pH, Corg, and P) showed low collinearity (VIF < 2.6). Soil horizon was retained only as a graphical grouping factor in ordination plots, but was excluded from the final constrained model because of strong collinearity with measured edaphic variables. The significance of the global model, canonical axes, and explanatory terms was tested using permutation tests with 999 permutations implemented in anova.cca(). Because the environmental matrix represented average stand-by-horizon baseline conditions rather than sample-specific measurements, the RDA was interpreted as an exploratory analysis of associations between fungal composition and pedological context, and not as a sample-level environmental fit or a basis for causal inference.
Because samples within each stand were collected within a limited spatial area (50 m2), they represent within-stand biological replicates rather than independent site replicates. Consequently, statistical results describe variability within the sampled stands and should not be interpreted as independent replication of the geological substrate treatments.
3. Results
3.1. Soil Characterization
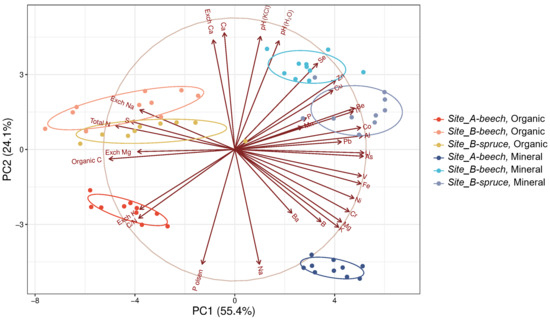
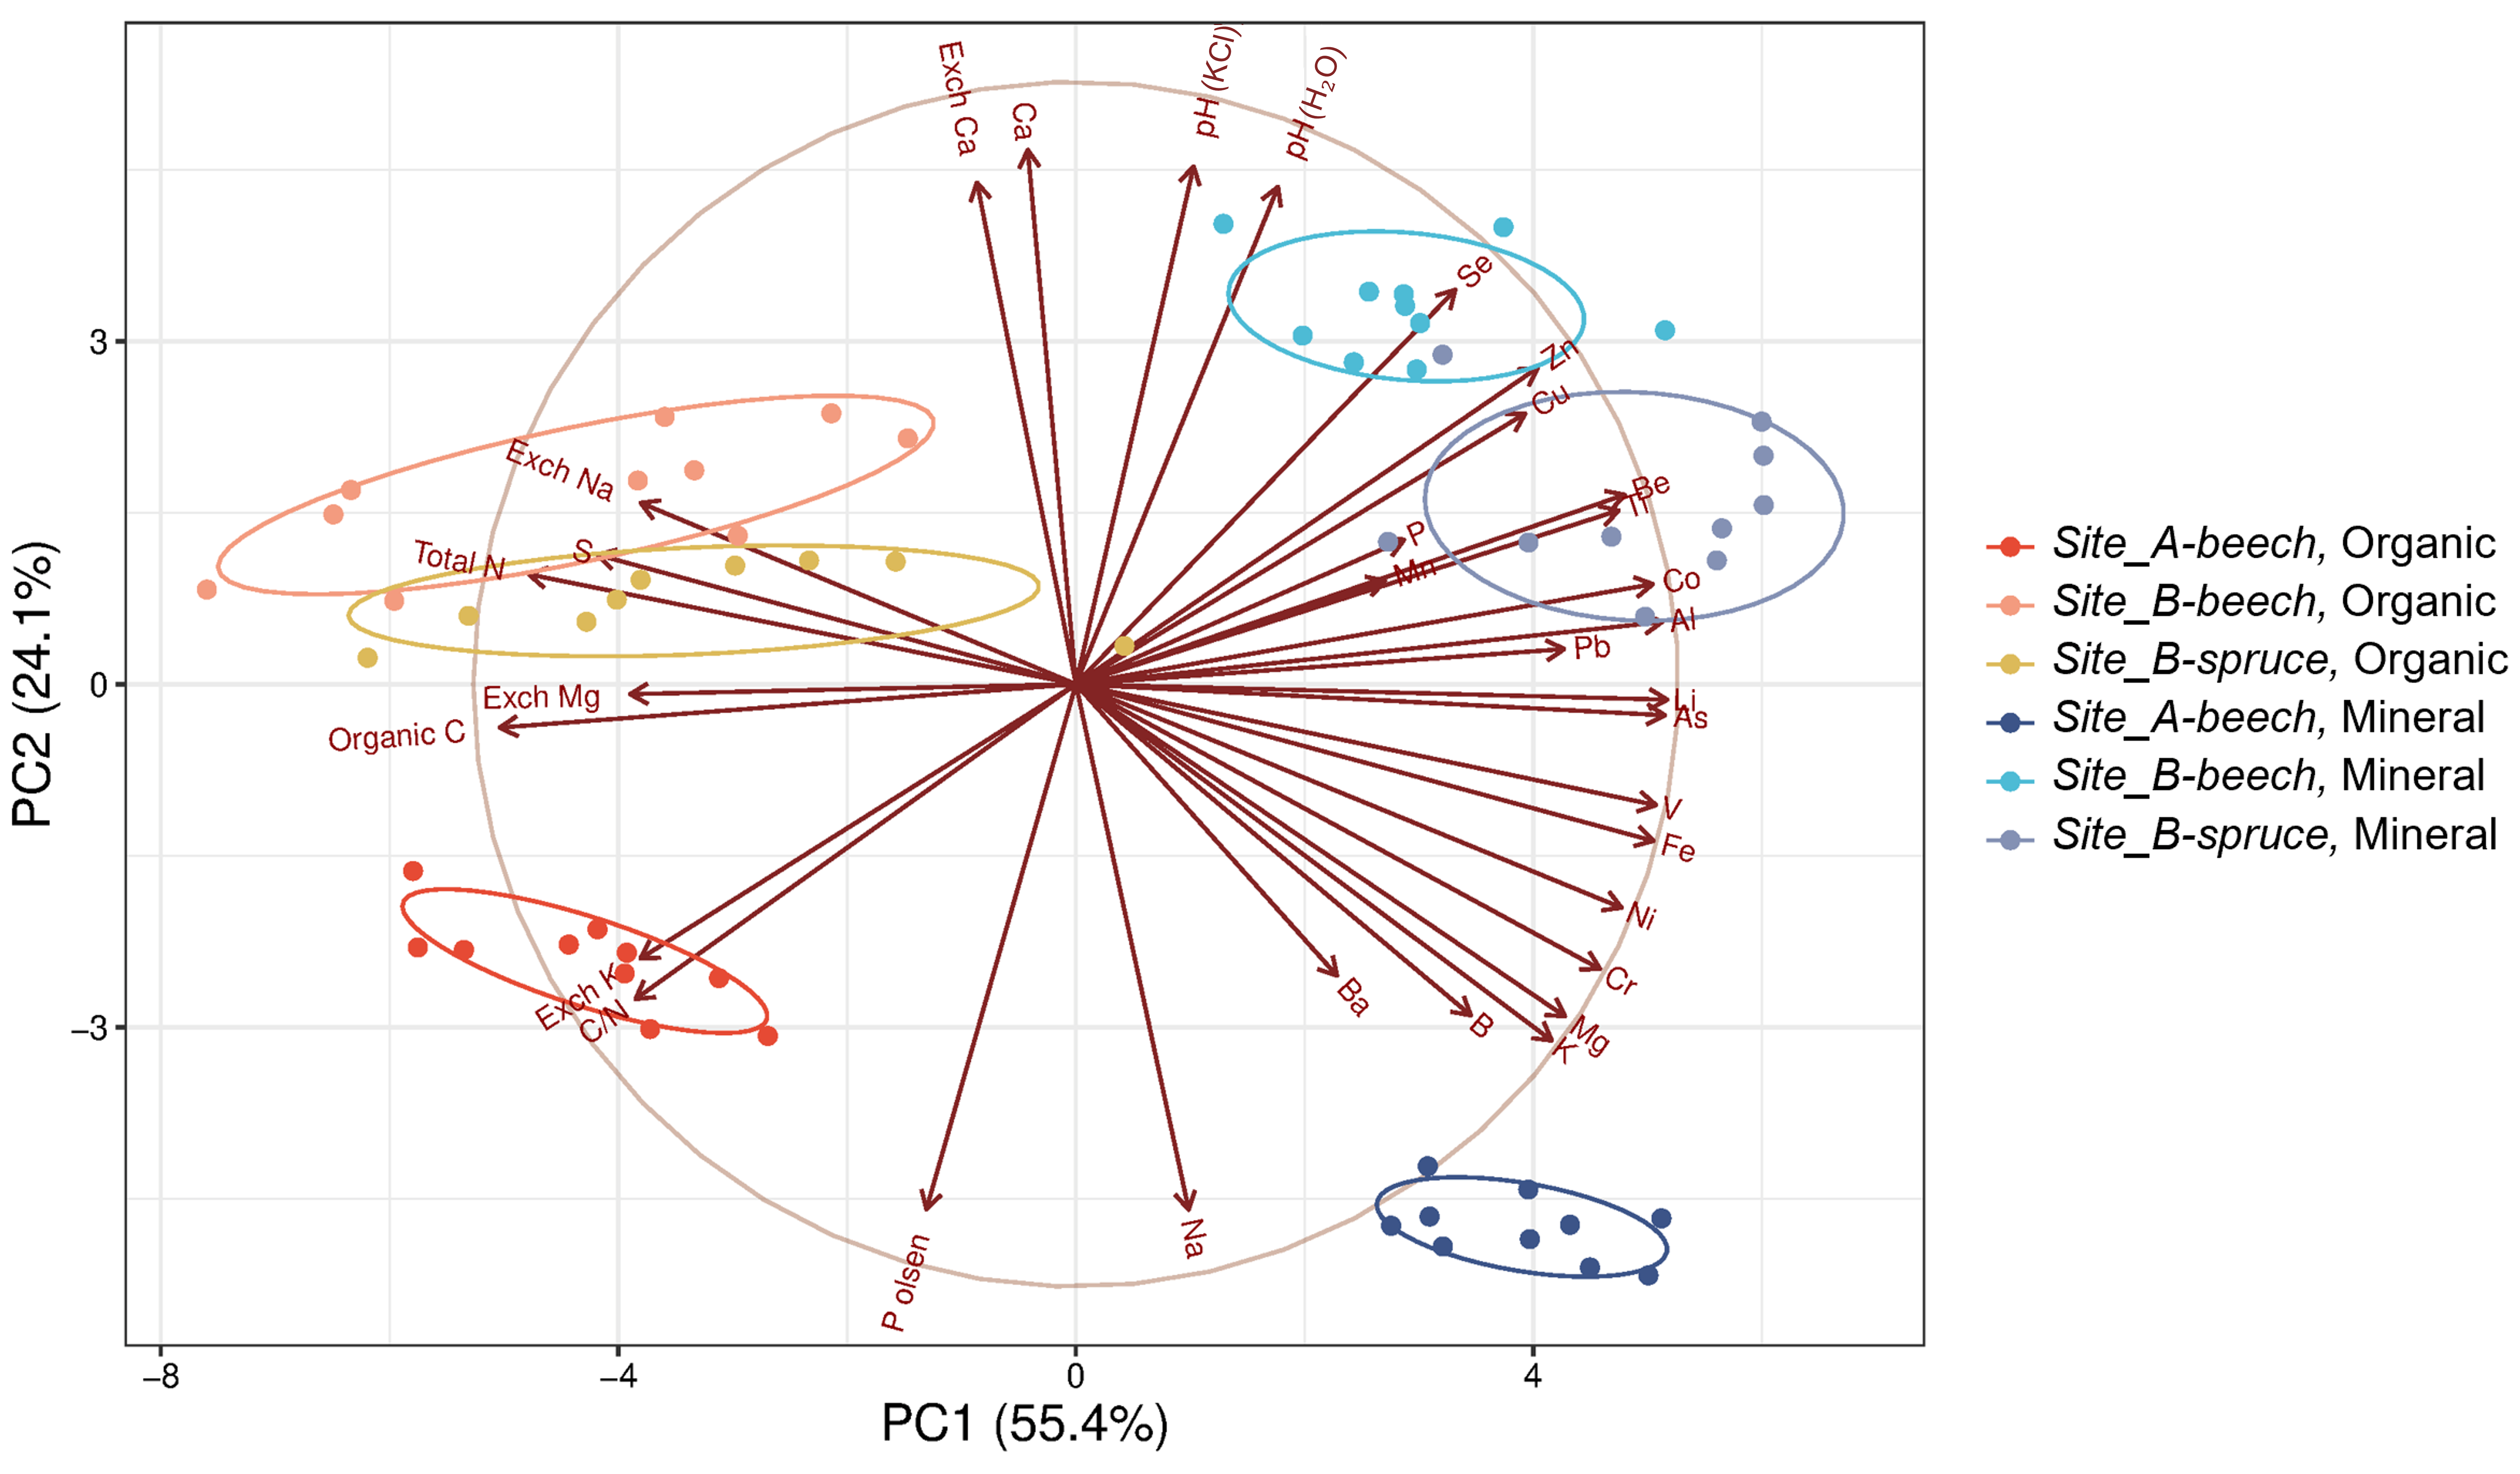
Soil chemical properties varied primarily among sites and soil horizons, while differences between the beech and spruce stands at site_B were comparatively limited. In particular, Olsen-extractable phosphorus and Na generally tended to be lower at site_B than at site_A, although not all pairwise comparisons were statistically significant. Conversely, site_B soils generally showed higher pH and higher total and exchangeable Ca than site_A soils (Table 1). These factors distinguished the two sites along PC2, which explained 24.1% of the variability (Figure 2).
Table 1.
Soil properties and ionomic profiling of soils across different conditions. Values are expressed as mean ± standard error (n = 10). Different letters indicate statistically significant differences in the post hoc test (p < 0.05); overall Kruskal–Wallis tests were significant (p < 0.001) for all variables. DW = dry weight.
Figure 2.
Principal components analysis (PCA) of soil characteristics based on chemical and ionomic data. Axes show the percentage of variance explained by each principal component. Ellipses indicate 68% confidence intervals per condition, shown here to illustrate within-group dispersion rather than to test statistical separation between groups.
More pronounced differences were observed between soil horizons. In the PCA, horizon-related variation was expressed mainly along PC1, which accounted for 55.4% of the total variance (Figure 2). Compared with the organic horizon, the mineral horizon had 61.1% lower C_org, 47.3% lower N_tot, 35.8% lower S, and a 24.9% lower C_org/N_tot ratio. Conversely, concentrations of Al, As, Fe, K, and Mg in the mineral horizon were more than twice those measured in the organic horizon, whereas Zn was also higher but by a smaller amount (Table 1). PCA scores also showed an ordered arrangement in the ordination space from site_A-beech to site_B-beech and site_B-spruce, with site_B-beech occupying an intermediate position (Figure 2). At site_B, soils from the spruce-dominated stand had concentrations of K, Se, V, Li, and Cr that were more than 30% higher than those from the beech-dominated stand. Conversely, total Ca concentration was 21% higher in soils from the beech stand than in those from the spruce stand (Figure 2; Table 1).
3.2. FTIR Characterization
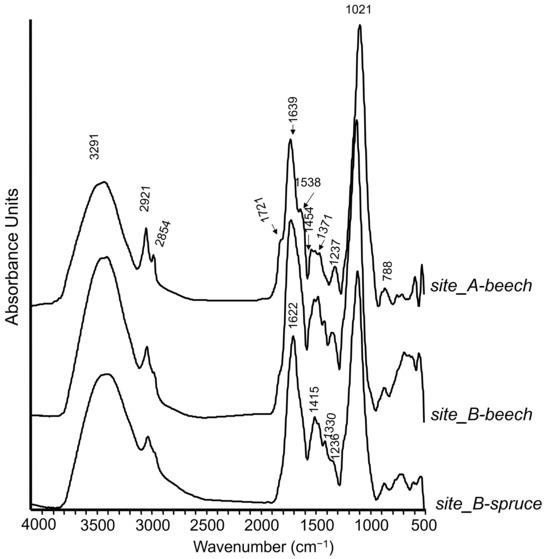
The FTIR spectra (Figure 3) suggested variations associated with organic matter constituents [44,45,46,47,48].
Figure 3.
FTIR spectra of organic horizon soils. FTIR spectra of three organic horizon soils, showing the main absorption bands associated with functional groups of soil organic matter.
The FTIR spectrum of site_A-beech showed stronger C-H absorption than that of site_B-beech and displayed two additional shoulders at 1721 cm−1 and 1538 cm−1. The 1721 cm−1 shoulder is attributable to C=O stretching in acids and unconjugated carbonyl groups in xylans, whereas the 1538 cm−1 band is consistent with aromatic skeletal vibrations in lignin and/or Amide II [44,48]. The peak at 1721 cm−1 was very weak in the site_B-beech and was absent in the site_B-spruce. Similarly, the peak at 1538 cm−1 was absent (Figure 3). Spectral curve fitting from 1800 to 1240 cm−1 quantified carbohydrates, amides, and aromatics (Figure S3). The ~1730 cm−1 band, reflecting overlapping C=O stretching from carboxylic, ester, and carbonyl groups mainly associated with hemicellulose-derived compounds, peaked in site_A-beech (7%) vs. site_B-beech (5.6%) and site_B-spruce (5%). Amide I dominated site_A-beech and site_B-beech (42%) over site_B-spruce (38%), but Amide II was highest in site_B-spruce (16%). Aromatics (lignin) were highest in site_A-beech at 1580 cm−1 (16%), 1512 cm−1 (6.5%), and 1268 cm−1 (4%) vs. site_B-beech (13%, 2.9%, 3.6%) and site_B-spruce (15%, 1.2%, 2.4%), suggesting site-specific differences in organic matter composition.
3.3. Fungal Community Dynamics in Relation to Location, Tree Type, Horizon, and Sampling Season
PERMANOVA analysis indicated significant effects of soil horizon (R2 = 0.05, p = 0.001), stand identity (R2 = 0.25, p = 0.001), and sampling season (R2 = 0.03, p = 0.005) on fungal community composition. A full factorial model additionally revealed significant interactions between soil horizon and stand identity (R2 = 0.08, p = 0.001), and between sampling season and stand identity (R2 = 0.06, p = 0.002) (Table S1). However, tests for homogeneity of multivariate dispersion were also significant for stand identity (p = 0.029) and soil horizon (p = 0.007), whereas no significant dispersion differences were detected among sampling seasons (p = 0.318) (Table S1). Therefore, the multivariate differentiation associated with stand identity and soil horizon should be interpreted cautiously, as it may reflect both differences in community centroids and unequal within-group dispersion. When PERMANOVA significance was reassessed using restricted, split-plot permutations that respect the paired organic–mineral sampling structure, the effects of soil horizon and stand identity remained highly significant (both p = 0.001), whereas the effect of sampling season was no longer significant (p = 0.241), indicating that the seasonal effect was not supported under the restricted permutation scheme.
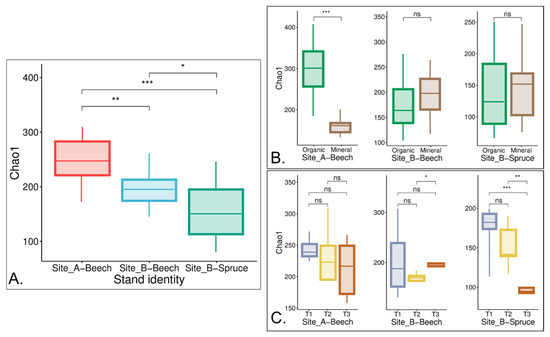
Alpha diversity indices (Chao1, Shannon, Simpson) reached their highest values in site_A-beech and were lowest in site_B-spruce (Figure 4A and Figures S4 and S5). Within-site comparisons showed significantly higher diversity in the organic horizon than in the mineral horizon at site_A-beech, whereas site_B-spruce exhibited a marked decline in diversity at T3 (Figure 4B,C).
Figure 4.
Fungal alpha diversity, assessed via the Chao1 index, across sampling conditions. Panels show fungal diversity in the different stand identities (A); in the different soil horizons (organic and mineral) (B); and at the different sampling times (T1, T2, T3) (C). Significance levels: ns (not significant), * p < 0.05, ** p < 0.01, *** p < 0.001 (Kruskal–Wallis test with Dunn’s post hoc comparisons, Bonferroni-corrected). Boxplots represent median and interquartile ranges. Shannon and Simpson indices are available in the Supplementary Materials.
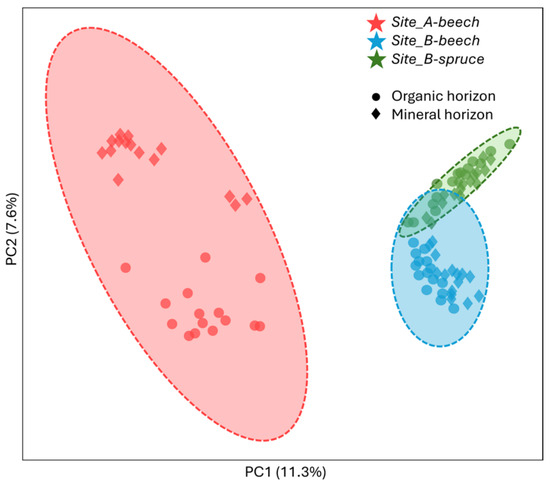
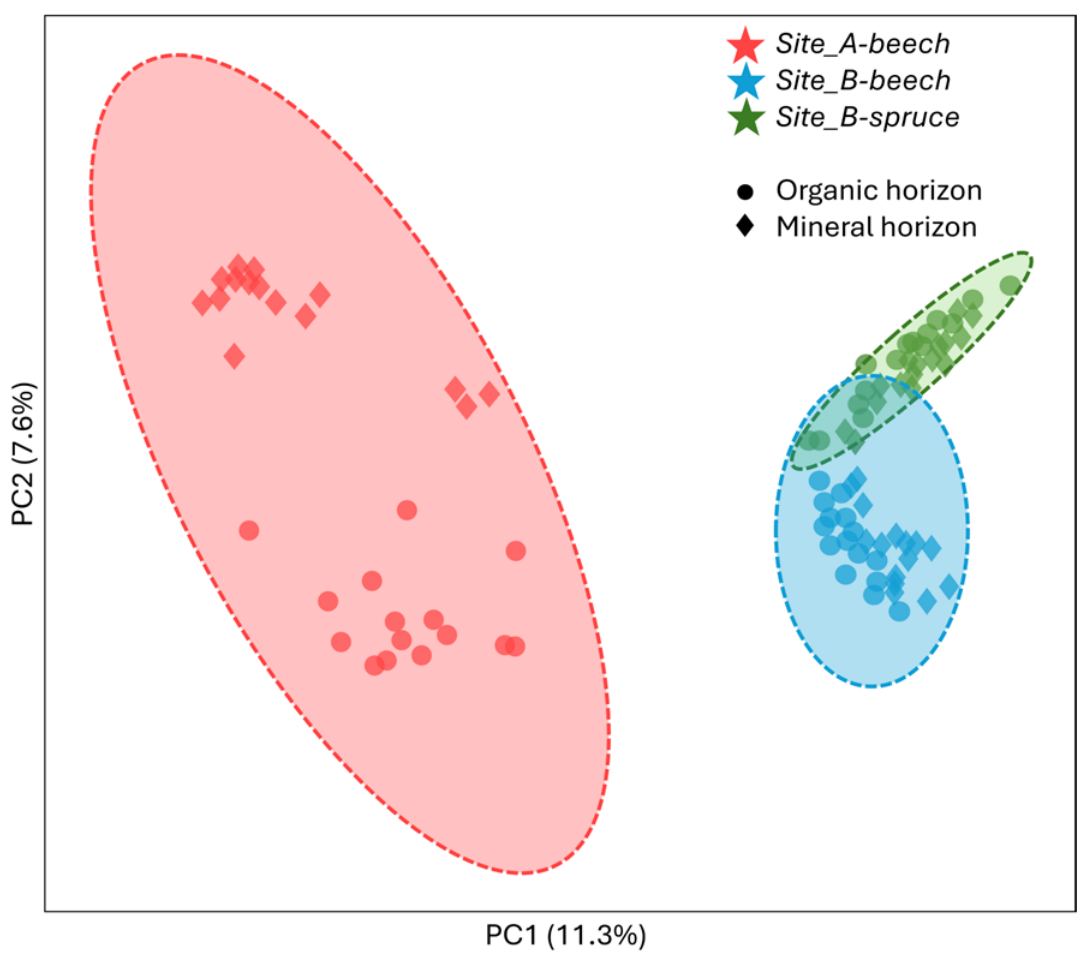
Principal Coordinates Analysis (PCoA) showed a separation trend between site_A and site_B samples along PC1 (11.3% of variance), while PC2 (7.6%) differentiated tree types and soil horizons within and across sites (Figure 5).
Figure 5.
Principal Coordinates Analysis (PCoA) and fungal community composition in different sites, in the two soil horizons: organic (●), and mineral (♦). Points represent samples; axes show the percentage of variance explained by each principal coordinate; ellipses (if present) indicate 95% confidence intervals per condition.
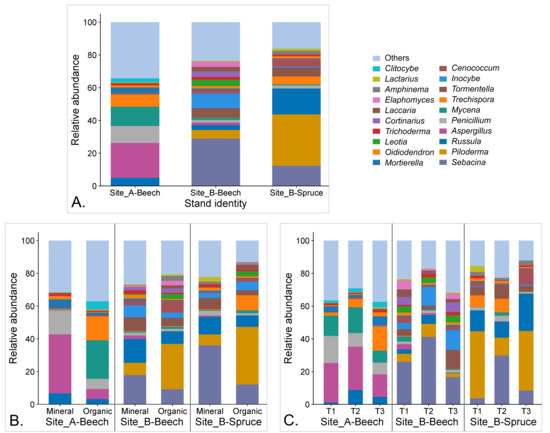
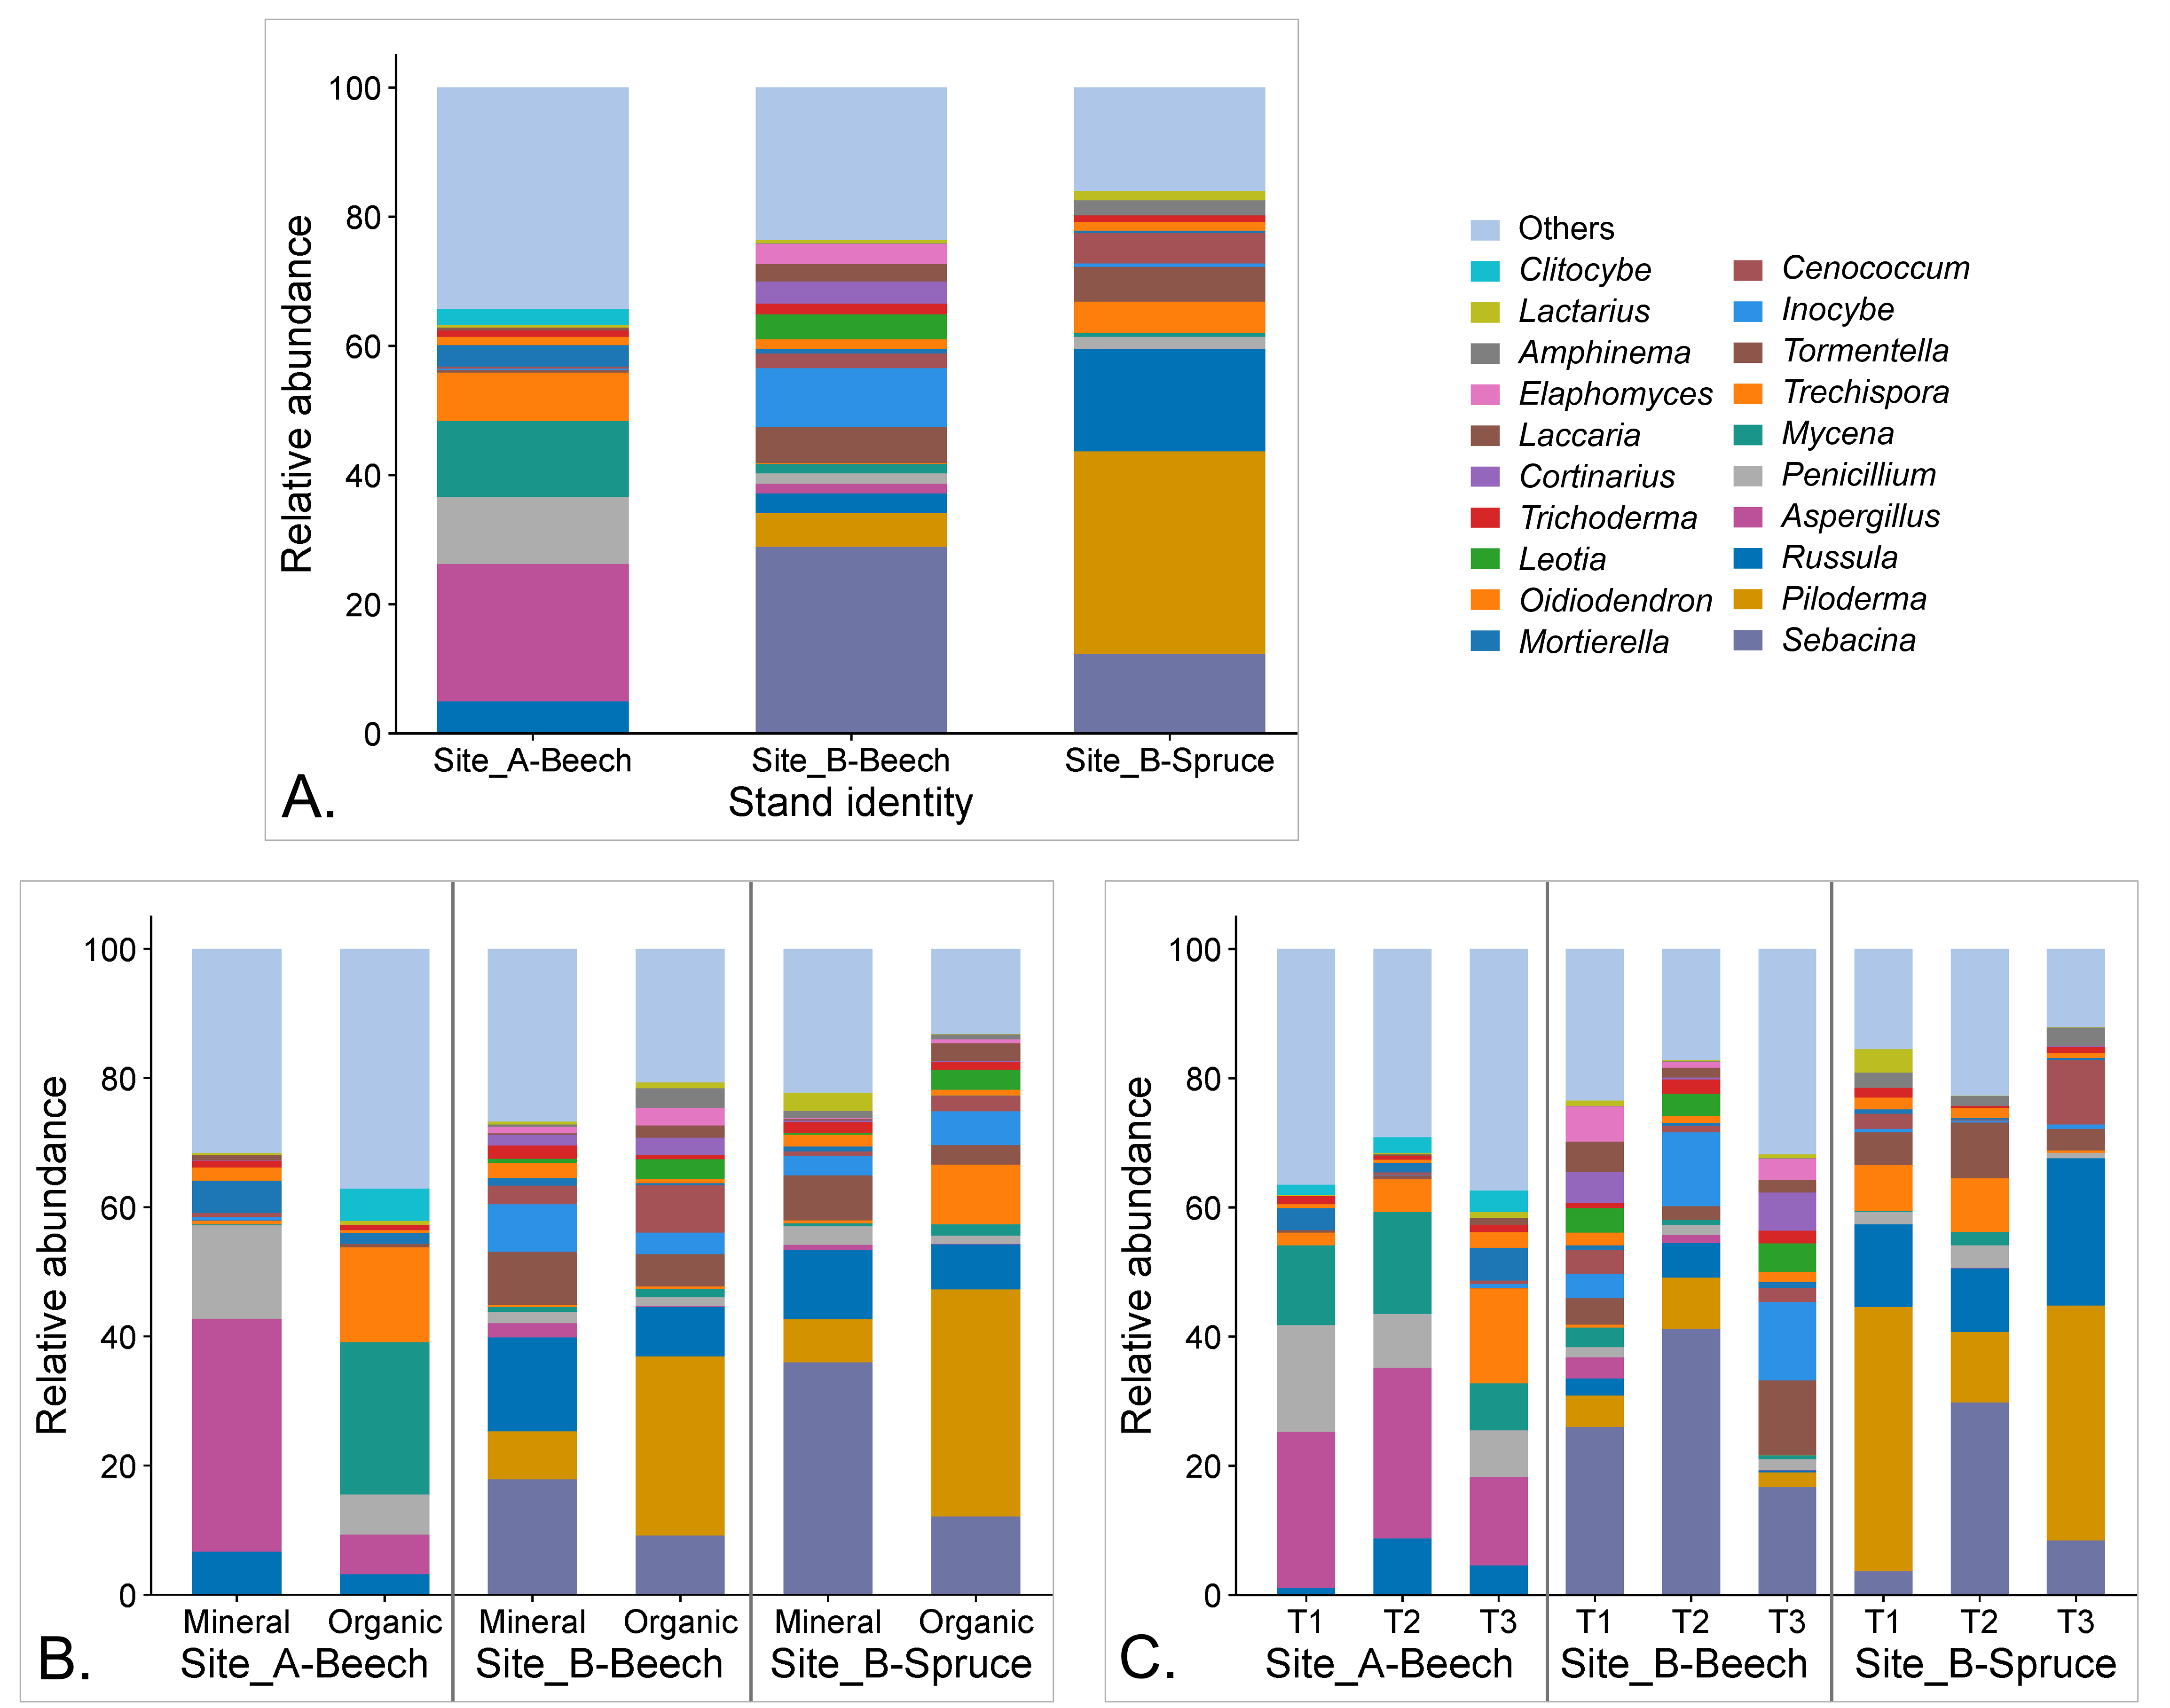
Fungal taxonomic profiles varied significantly across site, tree species, and soil horizon combinations (Figure 6). In site_A-beech, the fungal community was dominated by Aspergillus (23.5%), Mycena (13.1%), and Penicillium (11.6%). In contrast, site_B soils were characterized by the predominance of Sebacina (28%), Inocybe (10%), and Tomentella (5.5%) under beech, and by Piloderma (31.8%), Russula (15.5%), and Sebacina (12.2%) under spruce (Figure 6A, Table S3). Among the genera showing significant differences across stand identities (p < 0.05), Trechispora was less abundant in site_B-beech than in the other stands, whereas Cenococcum was more prevalent at both site_B stands compared to site_A-beech. Other examples include Amphinema and Leotia, which reached their highest abundances in site_B-spruce and site_B-beech, respectively (Table S3). Several genera showed abundance patterns that varied depending on both stand identity and horizon (Figure 6B; Table S3). For example, at site_A-beech, the mineral horizon showed significantly higher abundances of Aspergillus and Penicillium than the organic horizon (35% vs. 6%, and 14% vs. 6%, respectively), while the organic horizon showed a significantly higher abundance of Mycena than the mineral horizon (23% vs. >1%) (Table S3). At both site_B stands, the mineral horizon had a significantly higher relative abundance of Mortierella than the organic horizon (1% vs. 0.1%, on average), while Piloderma showed the opposite pattern only at site_B-spruce, where it was significantly more abundant in the organic than in the mineral horizon (27% vs. 7%, on average). Also, while Sebacina showed similar abundances in the organic and mineral horizons of site_B-beech, it was significantly more abundant in the mineral horizon of site_B-spruce (24% vs. 2%, Table S3). Finally, the stand identity-sampling season combination had little influence on fungal abundances overall, with significant seasonal differences restricted to a few genera (Figure 6C; Table S3).
Figure 6.
Relative abundance of the 20 most dominant fungal genera. The analysis compares fungal communities across stand identities (A), soil horizon (B), and sampling time (C).
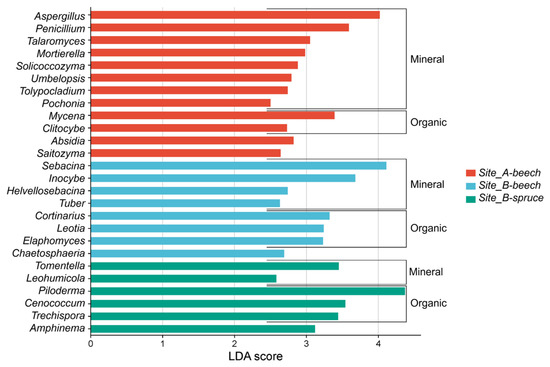
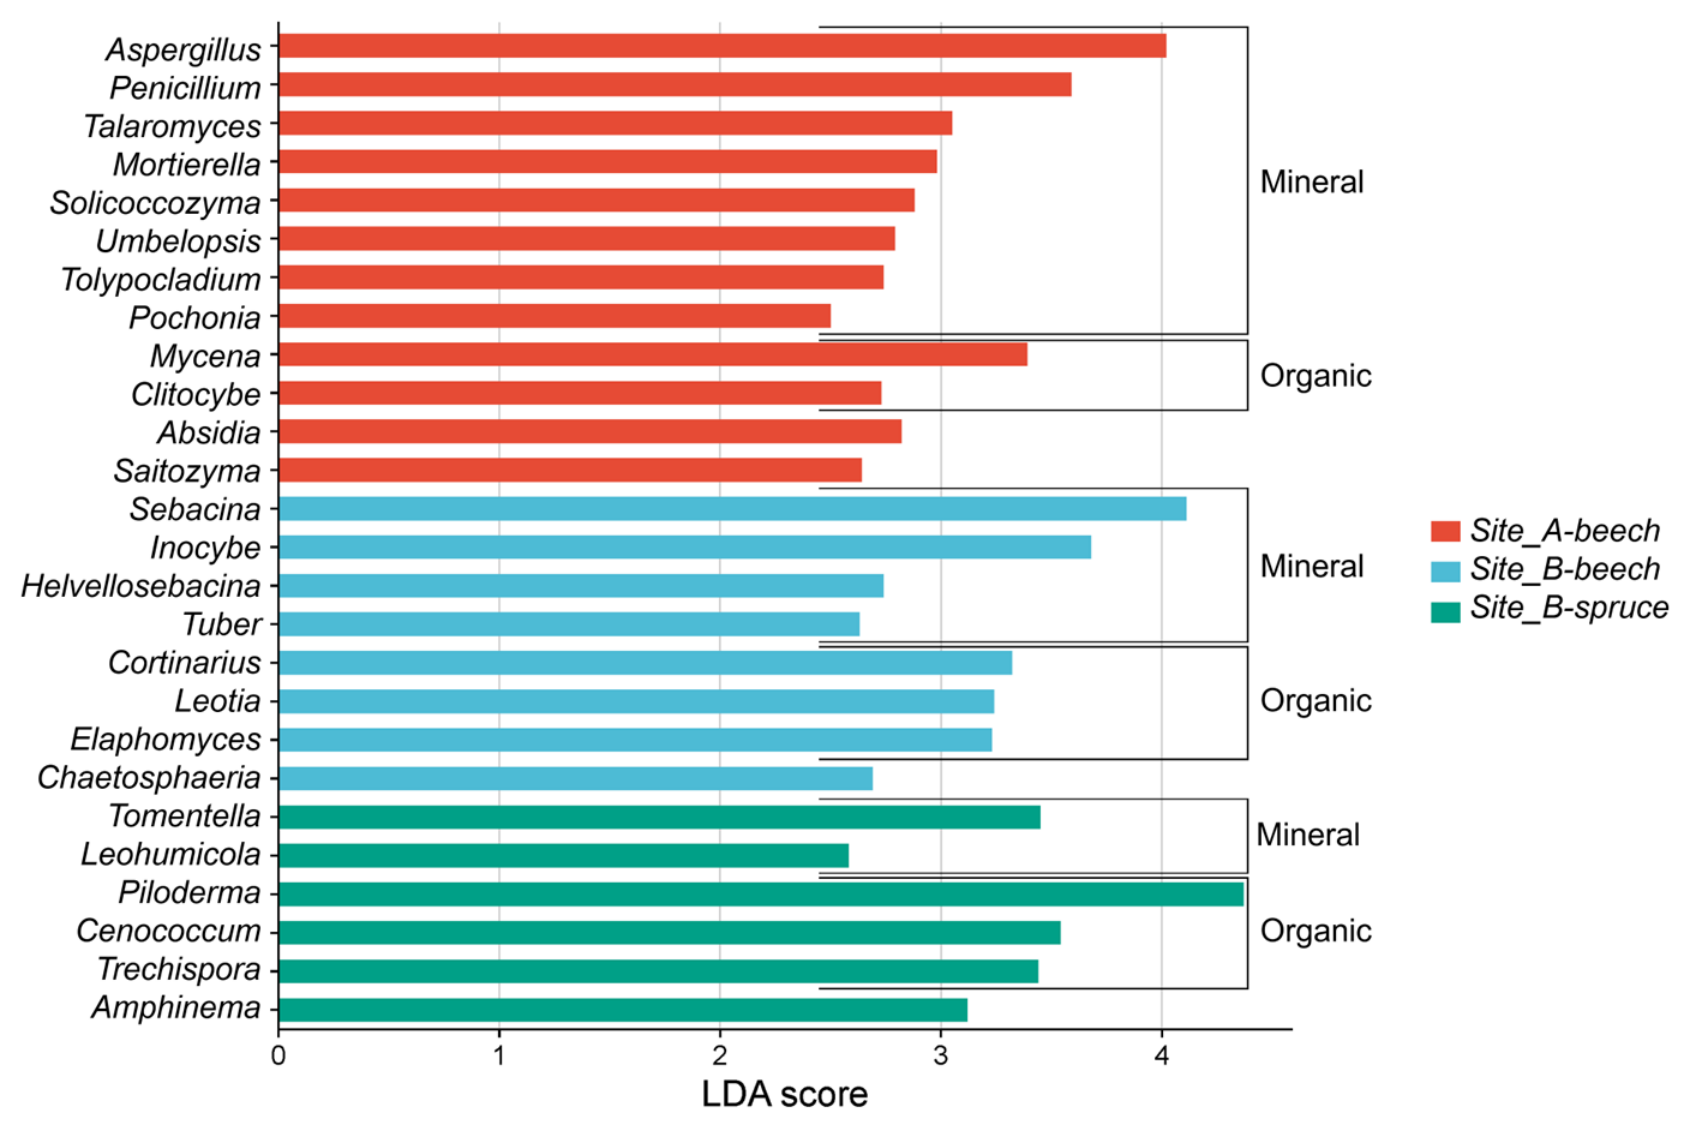
LEfSe analysis identified biomarker genera for the different stand identities. Furthermore, the analysis was conducted within each stand identity to identify biomarkers attributable to the organic or mineral horizons (Figure 7). In site_A-beech, Aspergillus and Penicillium were indicative of the mineral horizon, whereas Mycena and Clitocybe were more abundant in the organic layer; Absidia and Saitozyma emerged as site-specific biomarkers regardless of horizon. For site_B-beech, Sebacina and Inocybe were mineral biomarkers, whereas Cortinarius and Leotia dominated the organic layer. In site_B-spruce, Tomentella and Leohumicola were associated with the mineral horizon, while Cenococcum and Trechispora characterized the organic one.
Figure 7.
Linear discriminant analysis effect size (LEfSe) showing fungal genera significantly enriched across conditions (LDA > 2.5; p < 0.01). Enriched genera are further indicated as attributable to the mineral or organic horizon.
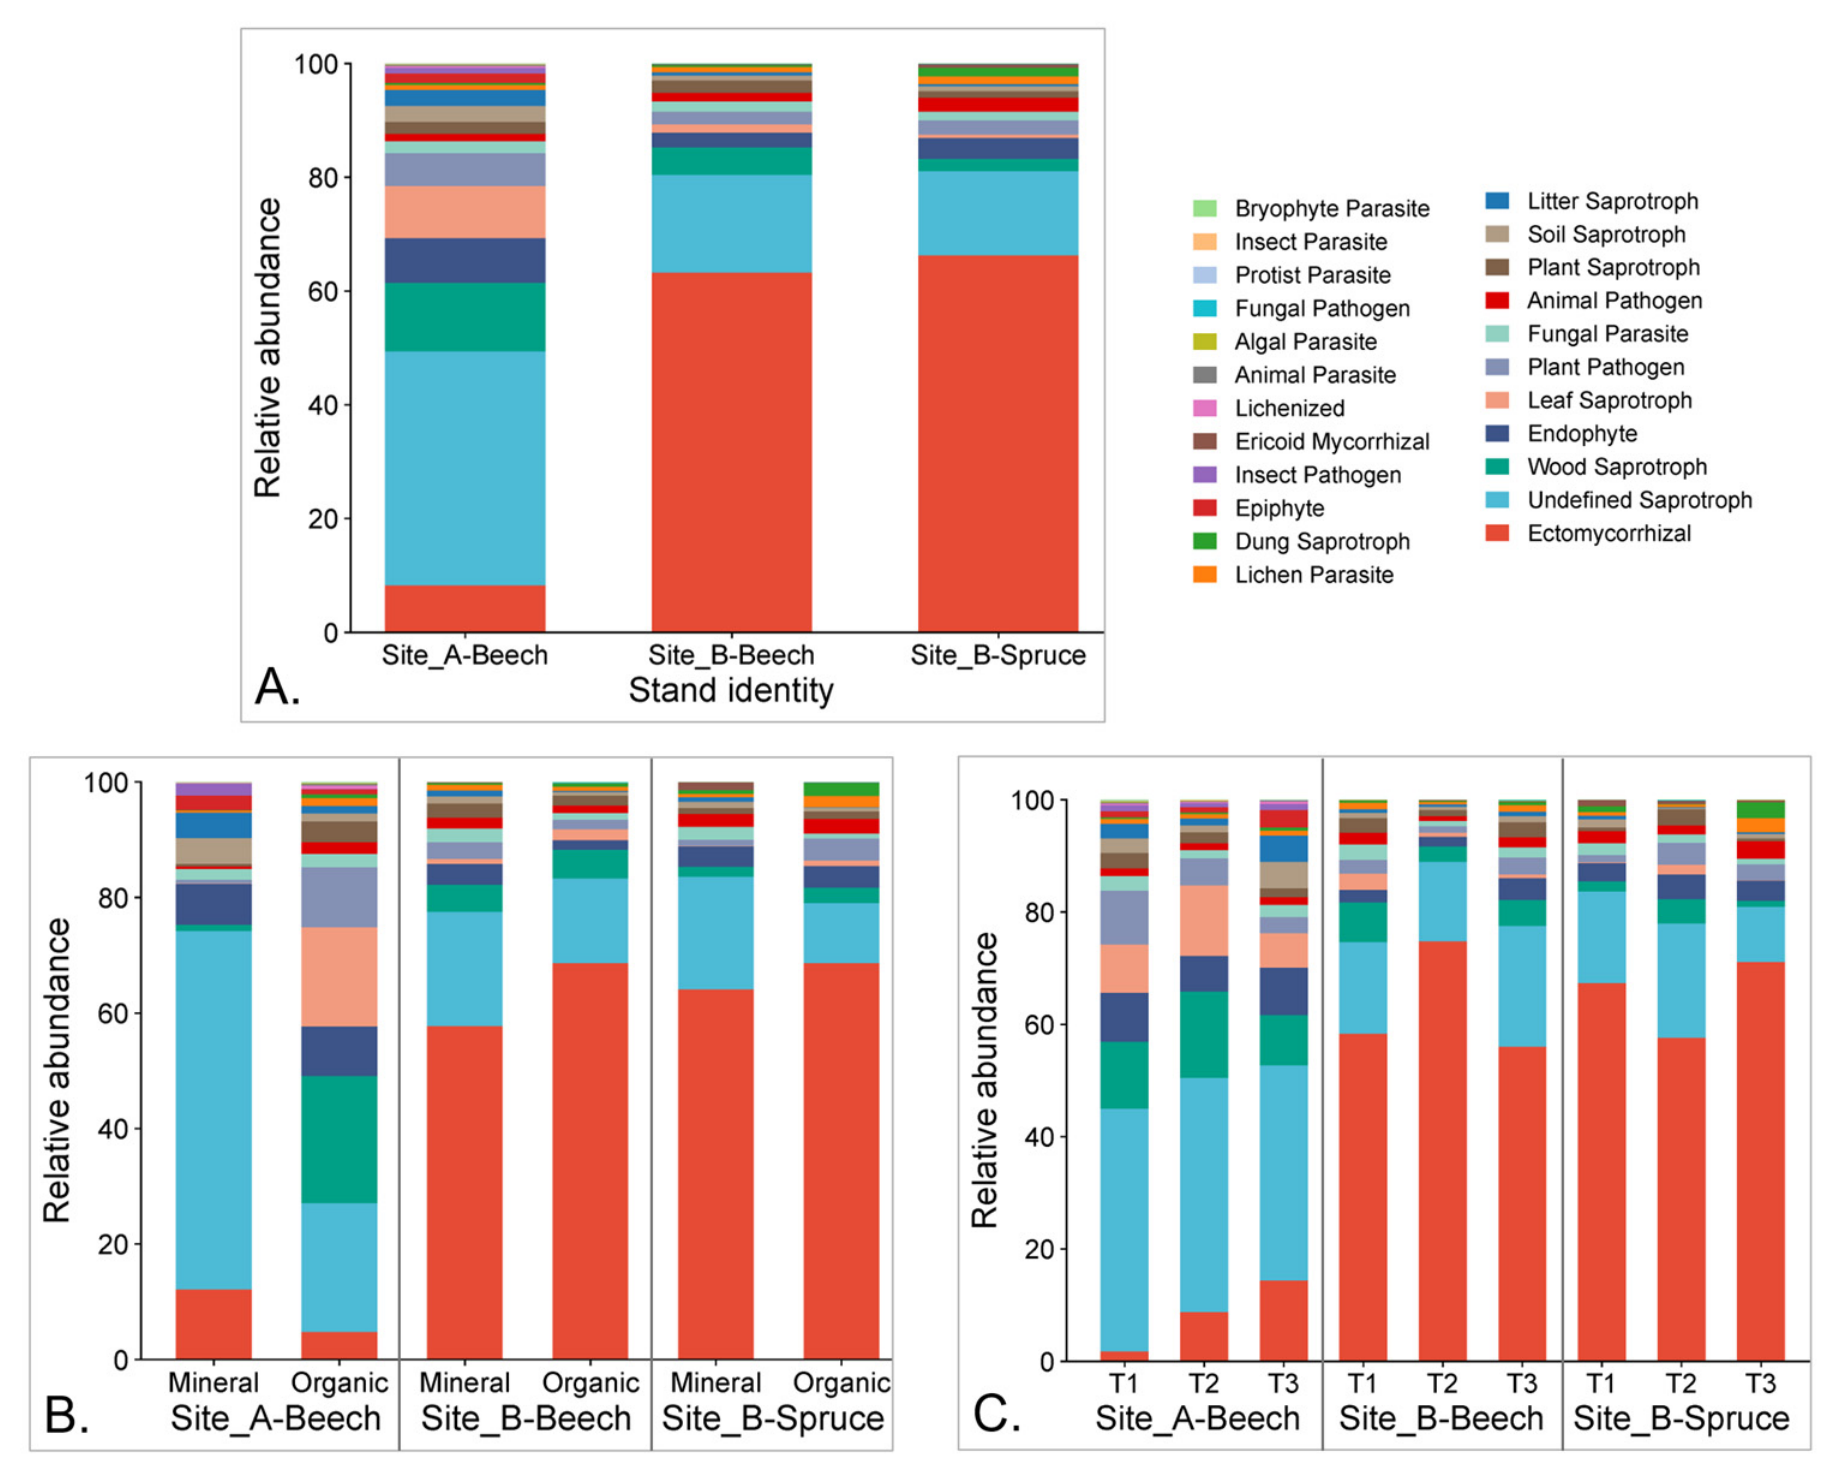
Functional guild assignment via FUNGuild suggested differences in fungal community structure across sites and vegetation types (Figure 8A). Both site_B stands were dominated by ectomycorrhizal fungi, accounting for 63% and 67% of the total community in the beech and spruce stands, respectively, whereas site_A-beech was enriched in saprotrophs (~70% of the community), compared with only 21%–27% in the site_B stands. Across horizons, ectomycorrhizal fungi were similarly distributed in the site_B stands. In contrast, site_A-beech showed a vertical niche separation: undefined saprotrophs favored the mineral horizon (+150%), whereas wood, leaf, and dung saprotrophs dominated the organic layer (Figure 8B). Seasonal variations were generally limited. However, in site_A-beech, ectomycorrhizal fungi increased threefold at T3 (Figure 8C; Table S4).
Figure 8.
Relative abundance of the fungal guilds. The analysis compares fungal communities across stand identities (A), soil horizon (B), and sampling time (C).
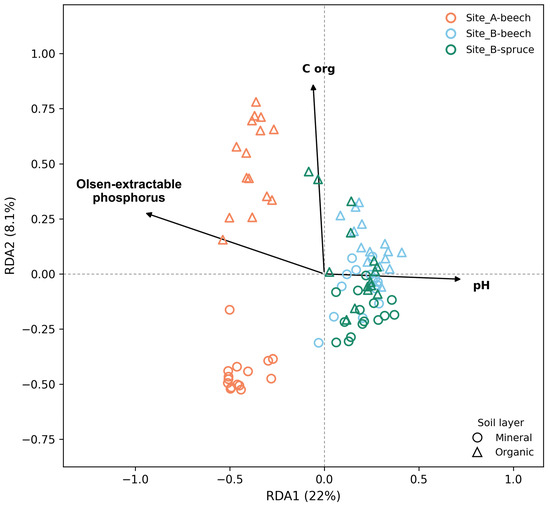
3.4. Relationships Between Fungal Community Composition and Soil Properties
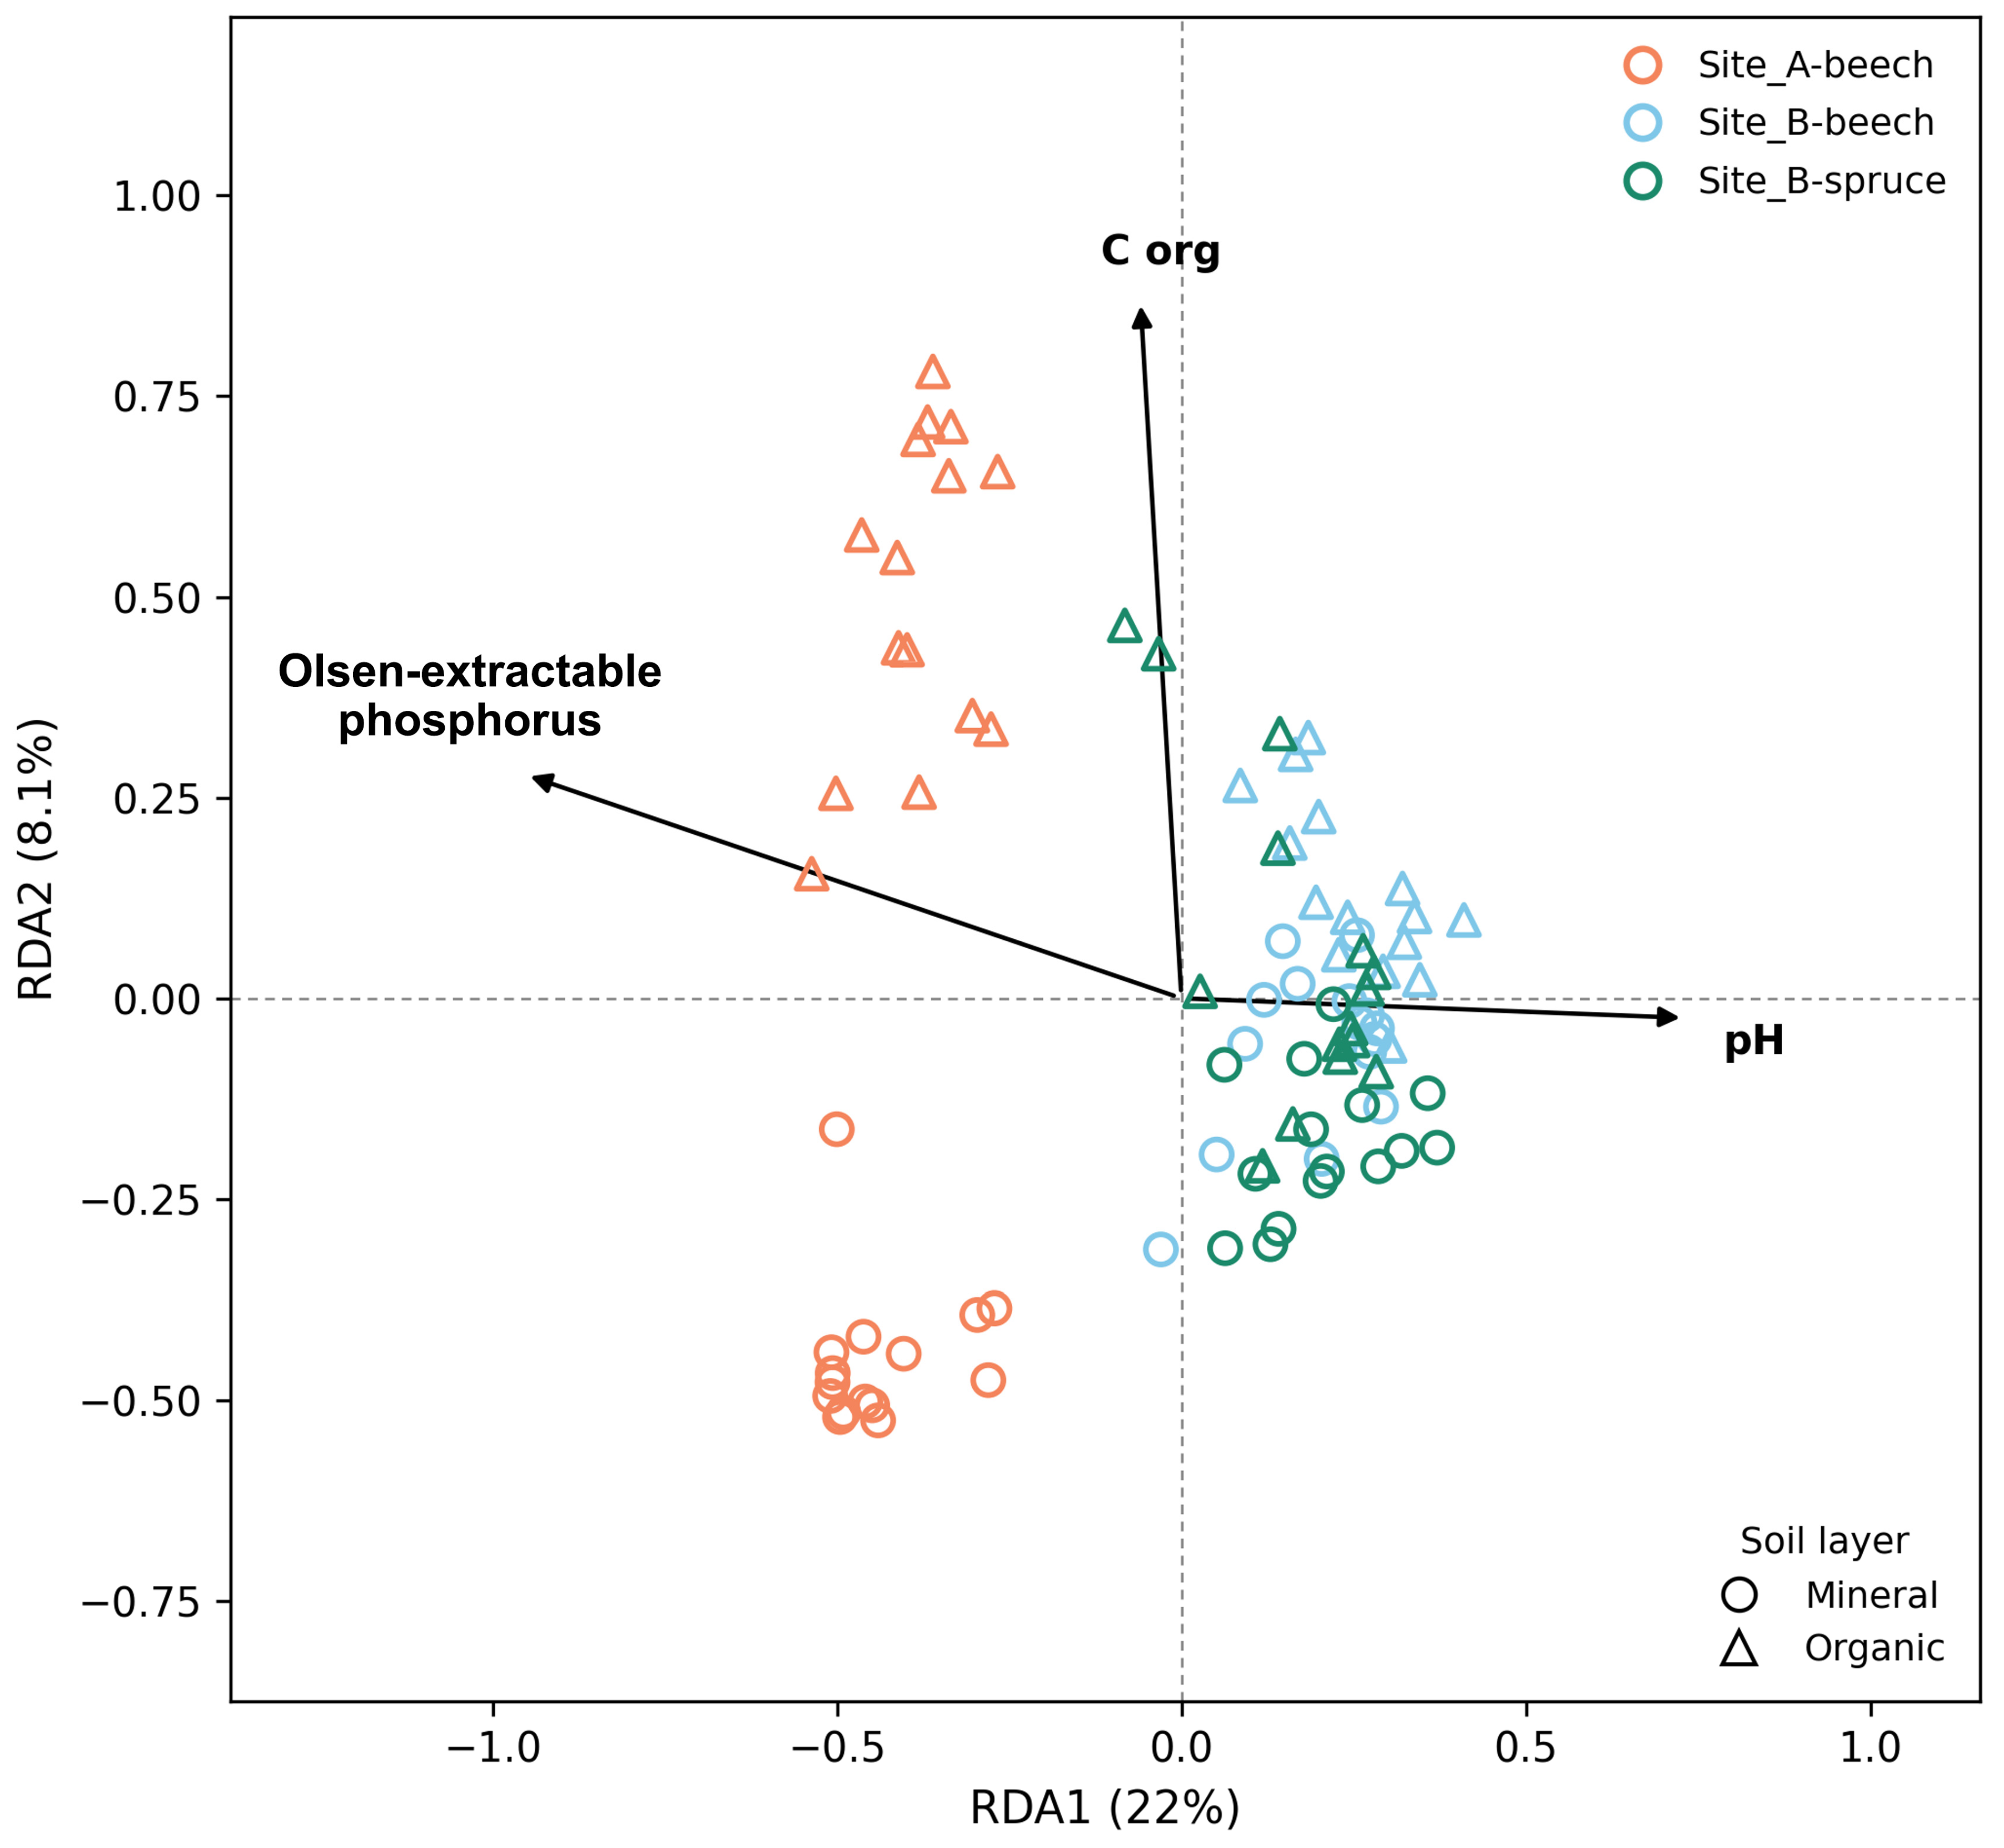
The RDA model including soil pH, Corg, and Olsen-extractable phosphorus as explanatory predictors was highly significant (Permutation test: F3,86 = 15.01, p = 0.001) and accounted for 34.36% of the total variation in fungal community composition (R2adj = 32.07%). All three selected soil properties exerted a highly significant marginal effect on the community structure (p = 0.001 for all terms Table S5), each with low collinearity (VIF < 2.6). Olsen-extractable phosphorus explained the largest fraction of variance (F = 15.39), followed by organic carbon (F = 11.72), and pH (F = 6.92).
The first two axes (RDA1 and RDA2) were statistically significant (p = 0.001) and together captured 30.1% of the total community inertia (corresponding to 87.5% of the constrained, explainable variance), with RDA1 alone accounting for 22.0% of total variance (64.0% of the constrained variance) and RDA2 for 8.1% (23.5% of the constrained variance). The RDA biplot (Figure 9) revealed separation of samples primarily aligned with the site-by-stand contrast along the first axis (RDA1), and with the soil horizon distribution (organic vs. mineral layers) along the second axis (RDA2). Specifically, samples from site_A-beech clustered distinctly on the left side of the plot, showing an association with Olsen-extractable phosphorus levels. Conversely, samples from the beech and spruce stands at site_B clustered on the right side and were aligned with higher pH values. Along the vertical gradient (RDA2), a differentiation emerged between the soil layers: organic horizons (triangles) shifted toward the upper-left quadrant in association with higher organic C concentrations, whereas mineral layers (circles) positioned toward the lower quadrants.
Figure 9.
Redundancy analysis (RDA) biplot showing the relationship between soil chemical properties (arrows) and fungal community composition (sites). Points are colored by forest site/substrate and shaped by soil layer. Permutation tests confirmed the global model significance (p = 0.001, R2adj = 32.07%).
3.5. Vegetation Condition
NDVI metrics provided background context on canopy phenology, showing limited differentiation across site–forest combinations (ranging from 0.31 to 0.55; Table S6). While site_A-beech maintained slightly higher and more stable values than both site_B stands across seasons, Spearman correlation analyses (Table S6) revealed no significant relationships between canopy greenness and the relative abundance of underlying fungal functional guilds (ectomycorrhizal fungi: ρ = −0.300, p = 0.433; total saprotrophs: ρ = 0.083, p = 0.831). This lack of correlation indicates that no significant association was detected between broader canopy dynamics and localized belowground fungal assemblages.
4. Discussion
Soil analyses revealed clear differences related to site, soil horizon, and, to a lesser extent, tree species composition. Taken together, these patterns are consistent with parent material being a prominent factor associated with contrasting soil biogeochemical regimes across the studied forests within the constraints of our two-site, observational design. The dolomitic–calcareous parent material at site_B was associated with higher soil pH than the acidic Apennine soils at site_A, where the low pH aligns with the acidic nature of the parent material. pH was consistently higher in mineral than in organic horizons at site_B, but not at site_A. This vertical pattern suggests that carbonate-rich substrates at site_B may buffer acidification and promote relative alkalinity in the mineral layer, whereas organic matter decomposition alone is unlikely to fully account for the stronger acidification of the organic horizon at site_A. In line with higher pH, site_B soils showed lower C and N depletion from organic to mineral horizons. From the organic to the mineral horizon, organic C decreased by approximately 66% at site_A-beech (from 47.7% to 16.1% DW), compared with decreases of approximately 60% at site_B-beech (from 41.2% to 16.6% DW) and 56% at site_B-spruce (from 40.0% to 17.4% DW). Over the same horizon transition, total N decreased by approximately 57% at site_A-beech (from 2.1% to 0.9% DW), 45% at site_B-beech (from 2.2% to 1.2% DW), and 38% at site_B-spruce (from 2.1% to 1.3% DW).
These values indicate a smaller proportional decline in C and N at site_B; however, retention, mineralization, and stabilization rates were not measured directly.
As with pH, the C/N ratio varied across sites and horizons, with values in the organic layers generally approaching or exceeding 20. The C/N ratio serves as a proxy for organic matter quality and decomposability, expressing the stoichiometric balance between organic carbon and total nitrogen. Values around 20 indicate relatively slow decomposition and partial N retention by microorganisms, consistent with lignin- and phenolic-rich forest litter [49]. Between the two beech stands, C/N ratios differed significantly only in the mineral horizon, whereas no significant difference was detected in the organic horizon. The higher mineral-horizon C/N ratio at site_A, despite both stands being dominated by beech, is consistent with its more acidic conditions, which are generally associated with slower decomposition and may offset litter-quality effects. Contrary to typical conifer–broadleaf contrasts, no significant C/N differences emerged between beech and spruce at site_B [50]; this could reflect the steep slope at site_B-spruce, where more oxidizing conditions and limited litter accumulation may favor organic matter transformation, mitigating vegetation-driven contrasts. However, decomposition rates, slope-related oxidation status, and litter accumulation were not directly quantified in this study, and since tree identity was not fully crossed across sites, vegetation effects could only be partially disentangled from site-level pedological differences; both explanations above should therefore be regarded as speculative.
Site-specific differences also emerged for phosphorus. Soils at site_A-beech exhibited higher Olsen-extractable phosphorus than those at both site_B stands. Accordingly, the ratio of Olsen-extractable P to acid-extractable P was markedly higher at site_A-beech in both the organic (28.2%) and mineral (21.4%) horizons than at the site_B stands. At site_B, the corresponding ratios were 7.4% and 3.0% in the beech stand and 7.8% and 2.8% in the spruce stand, for the organic and mineral horizons, respectively (Table 1). These measured contrasts are compatible with several non-mutually exclusive mechanisms, none of which were directly tested in this study and which should therefore be regarded as hypotheses rather than demonstrated processes. Biological processes such as microbial turnover, enzymatic mineralization, and organic matter–P associations at site_A may contribute to this pattern [51]. Enhanced P losses via runoff and erosion on the steep slopes (55%–57%) at site_B [52], together with precipitation of Ca–P complexes under the calcareous parent material and moderately higher mineral-soil pH, which would limit the exchangeable fraction [53], offer plausible alternative explanations. Consistent with the latter interpretation, Apennine soils formed from siliciclastic rocks or marls are reported to typically maintain higher extractable P [54], in line with the lower pH observed in the mineral horizon at site_A. Differences in litter recalcitrance between coniferous (site_B) and beech (site_A) inputs may additionally contribute to contrasting organic matter turnover and P release rates [55], though this was not directly measured.
At site_B, both total and exchangeable Ca were markedly higher, consistent with the calcareous parent material (Dolomia) [56]. Conversely, Na was more abundant in site_A soils, indicating that lithology and climate jointly shape the availability of exchangeable cations. For the remaining elements, nearly all ions showed quantitative variations attributable solely to the soil horizon.
Overall, our results indicate that nutrient availability patterns were most closely linked to the soil matrix (site-level pedological context), with site-specific pedological conditions more strongly associated with soil physicochemical properties than tree species composition. Soil horizon was consistently related to variation in both C/N ratios and elemental profiles, while parent material and pH appear to modulate nutrient retention and mineralization processes. We note that slope, microclimate, and other unmeasured environmental gradients may also contribute to the observed patterns; broader replication across multiple sites per substrate type will be necessary to generalize these findings.
In this study, spectroscopic patterns revealed site-specific differences in the composition of soil organic matter. In site_A-beech soils, deconvolution of bands attributed to carbohydrates, Amide I, and lignin aromatic rings suggested relatively higher contributions, consistent with a larger input of plant-derived and moderately processed organic material [57]. By contrast, in site_B-beech soils, Amide I remained dominant, whereas aromatic-associated bands were less pronounced, which may reflect differences in litter inputs and decomposition pathways. The extent to which these aromatic signatures track decomposer community structure (e.g., saprotroph prevalence) remains uncertain and would require targeted functional assays. In site_B-spruce, the relative contributions of these bands appeared further reduced, while Amide II accounted for a larger share of the fitted region, consistent with a relatively higher proportion of N-containing/proteinaceous components in SOM (soil organic matter) rather than changes in protein secondary structure per se [58]. Given the spectral overlap of functional groups and the semi-quantitative nature of ATR-FTIR, these inferences are indicative rather than definitive. Even so, the qualitative agreement between FTIR features and soil chemistry provides convergent, independent lines of evidence linking parent material with organic matter composition. This coherence supports but does not mechanistically prove the ecological interpretation of fungal community patterns beyond single dataset correlations.
Analyses of fungal alpha and beta diversity showed partial agreement with soil chemical patterns: the strongest effects were associated with the interaction between local pedological conditions and tree cover, with horizon exerting a secondary influence. When seasonality was included as a factor, its impact on community diversity was limited. Alpha diversity (Chao1, Shannon, Simpson) was highest in site_A-beech and lowest in site_B-spruce; a pattern consistent with acidic, organic-rich site_A soils supporting more diverse fungal communities, whereas the near-neutral pH and conifer litter of site_B were associated with lower diversity. Within site_B, tree cover still played a role, with spruce consistently showing lower diversity than beech. A horizon effect emerged only in the site_A-beech soils, where the organic horizon hosted greater diversity than the mineral one, in line with reports of higher richness in organic horizons. Indeed, FTIR indicated a relatively higher contribution of carbohydrate-related groups in the organic horizon, which may broaden the pool of labile C substrates and support a wider spectrum of taxa [59]. Seasonal differences were negligible at both beech stands. In contrast, the site_B-spruce soils showed a marked diversity decline at T3. This seasonal decline might be related to changes in litter quality and inputs (e.g., accumulation of lignin- and phenolic-rich needles), which are known in the literature to inhibit some fungal groups [60]. Given the observational design and the fact that litter chemistry and input rates were not directly measured in this study, these seasonal associations should be interpreted cautiously and validated with direct functional measurements.
Metabarcoding analysis revealed strong differences in fungal community composition and functional guilds among the three sampled stands: geological substrate contrasts appeared more closely aligned with community differences than dominant tree species within this dataset. It should be noted, however, that stand identity and soil horizon accounted for only a modest fraction of total compositional variance (R2 = 0.25 and 0.05, respectively), consistent with the high dimensionality and inherent biological variability typical of fungal metabarcoding datasets; a substantial portion of variance likely reflects additional unmeasured environmental or stochastic factors. Nonetheless, the statistical significance of these effects (p = 0.001) supported site-specific associations, although differences in multivariate dispersion and the absence of independent site replication limit their interpretation. The Norway spruce stand offered an ecological contrast that helped contextualize vegetation effects from substrate-driven patterns.
At site_A-beech, saprotrophic fungi dominated the community, with Aspergillus, Mycena, and Penicillium as the most abundant genera. FUNGuild assignments indicated a higher relative abundance of taxa assigned to saprotrophic guilds. The prevalence of saprotrophs at site_A is consistent with acidic conditions that can favor enzymatic activity and nutrient solubilization [61]. Soil pH strongly regulates P availability; acidic conditions may promote the dissolution of some mineral phases, although P may also be immobilized through interactions with Fe and Al compounds [62]. As a hypothesis-generating interpretation, this context could be compatible with a positive feedback in which phosphate-solubilizing fungi (PSF), such as Aspergillus and Penicillium, mobilize P via organic-acid production [63]. In support of this hypothesis, though not as direct evidence of PSF activity, FTIR showed a higher relative contribution of carboxylic and other acidic functional groups in site_A-beech soils, consistent with reactive organic acids and humic components in organic horizons [50]. These spectral features are not taxon-specific, were not linked to any functional or enzymatic assay, and should be interpreted strictly as indicative, correlative context rather than confirmation of phosphate-solubilizing activity. Increased P accessibility could create additional niches and resource heterogeneity, which may help explain the higher fungal diversity observed at this site. Within this framework, the ecological roles of dominant taxa align with horizon stratification: Mycena, a typical wood saprotroph, was more abundant in the organic horizon, consistent with decomposition of lignin- and cellulose-rich litter [64], whereas Aspergillus and Penicillium, classified as undefined saprotrophs, were enriched in the mineral horizon and identified as statistically significant biomarkers of this layer (Table S3, Figure 7). Given their broad substrate use and reported P-solubilizing abilities [63], their enrichment in the mineral horizon is consistent with a potential, but not directly tested, contribution to nutrient cycling in deeper strata. This interpretation is compatible with the higher Olsen-extractable phosphorus-to-total-P ratio measured at site_A relative to both B sites, though the relative contribution of these taxa versus acidic conditions and SOM turnover to this pattern cannot be disentangled with the present data and should be regarded as a hypothesis for future functional validation.
Additional soil properties may further contribute to these dynamics. Site_A soils exhibited higher acid-extractable Na concentrations than the site_B stands. However, the exchangeable fraction was low, and the strongly acidic conditions (pH KCl around 4) make it unlikely that Na substantially alters osmotic potential or nutrient availability. Thus, Na differences likely represent a lithological background signal rather than an active driver of fungal community shifts. Instead, pH, P availability, and organic matter turnover emerge as the dominant factors shaping the observed fungal assemblages.
Conversely, both site_B stands were dominated by ectomycorrhizal taxa. Based on the ecology of these guilds, this taxonomic pattern is consistent with a shift towards symbiosis-driven nutrient acquisition under calcareous conditions, even though functional nutrient acquisition activity was not directly measured. This convergence across tree species is consistent with the calcareous context exerting a stronger imprint than vegetation identity. At site_B-beech, Sebacina, Inocybe, and Tomentella were the most abundant genera, while Piloderma, Russula, and Sebacina dominated site_B-spruce, all of which are genera predominantly comprising ectomycorrhizal symbionts [65,66,67,68,69]. The elevated Ca levels in dolomitic soils may contribute to ectomycorrhizal dominance. High Ca and near-neutral pH can promote P precipitation and immobilization, potentially favoring mycorrhizal nutrient acquisition strategies [70]. This Ca/pH-driven immobilization argument was not directly tested and should therefore be regarded as a plausible, hypothesis-generating interpretation rather than a demonstrated mechanism.
While metabarcoding alone cannot provide direct functional measurements, its integration with soil chemistry and FTIR features allows us to treat guild distributions as convergent indicators of prevailing biogeochemical regimes rather than direct measures of ecosystem processes. NDVI, a canopy “greenness” index [71], showed weak, non-significant correlations with fungal guilds, supporting its role here as contextual information on canopy phenology rather than a primary driver of belowground composition. Taken together, soil chemistry, organic matter signatures, and fungal guild patterns show a coherent, convergent picture consistent with a pedology-centered interpretation of these forest soil microbiomes, in which geological substrate emerges as a plausible ecological filter of belowground organization, while, as noted throughout this section, none of these lines of evidence individually or jointly establishes causal mechanisms within the limits of our site-contrasted design.
5. Conclusions
This study provides a multi-proxy description of the associations between site-level pedological context and fungal communities in temperate mountain forests. By integrating soil geochemistry, FTIR spectroscopy, and ITS metabarcoding, we identified distinct biogeochemical regimes across the sampled stands and soil horizons that coincided with differences in fungal community composition and inferred guild distribution. Within this dataset, fungal patterns were more closely aligned with site-level pedological context than with vegetation identity or seasonal variability. However, because each substrate type was represented by a single site, substrate-associated patterns could not be separated from other between-site differences, including slope, elevation, aspect, microclimate, and management history. The comparison between the two beech stands showed that similar vegetation can coexist with contrasting belowground fungal assemblages under different pedological conditions, ranging from communities enriched in taxa assigned to saprotrophic guilds in the acidic Apennine soil to communities enriched in taxa assigned to ectomycorrhizal guilds in the calcareous Alpine soil. The spruce stand provided an additional within-site contrast, showing that ectomycorrhizal prevalence also occurred under a different dominant tree species within the same site-level pedological context. Because FTIR features are semi-quantitative and FUNGuild assignments are inference-based, our results should be viewed as convergent indicators rather than direct measurements of ecosystem processes. Given the observational, two-site design and possible confounding by slope, elevation, aspect, microclimate, and differing management histories between sites, these findings are site-specific and hypothesis-generating. More broadly, the geological and pedological context appears to be an important dimension to consider in forest microbiome research. A logical next step is replicated studies across multiple sites per substrate type with explicit variance partitioning and direct functional assays. Such work will help bridge descriptive community patterns and ecosystem-level function, refining our understanding of biogeochemical processes in forest soils.
Supplementary Materials
The following supporting information can be downloaded at https://www.mdpi.com/article/10.3390/f17080973/s1, Figure S1: Experimental design; Figure S2: Window-averaged NDVI within buffers surrounding the sampling sites; Figure S3: FT-IR spectra details; Figure S4: Fungal alpha diversity, assessed via the Shannon index, across sampling conditions; Figure S5: Fungal alpha diversity, assessed via the Simpson index, across sampling conditions; Table S1: Results of three-way PERMANOVA based on Bray–Curtis dissimilarities for fungal community structure; Table S2: ITS sequencing data analysis pipeline details and results; Table S3: Average total abundance of the most abundant fungal genera; Table S4: Average total abundance of the fungal guilds; Table S5: RDA additional information; Table S6: NDVI additional information.
Author Contributions
Conceptualization: M.C.D.L., S.N. and P.S.; data curation: C.C. and S.D.; formal analysis: C.C.; funding acquisition: P.S.; investigation: M.C.D.L., S.C., O.F. and G.B.; supervision: F.P., S.N., G.C., A.S. and P.S.; visualization: C.C.; writing—original draft: C.C.; writing—review and editing: C.C., M.C.D.L. and P.S. All authors have read and agreed to the published version of the manuscript.
Funding
This study was funded by SID (DAFNAE, University of Padova), and the European Union Next-Generation EU—Piano Nazionale di Ripresa e Resilienza (PNRR)—Missione 4 Componente 2, Investimento 1.4 (D.D. 1032 17 June 2022).
Data Availability Statement
The datasets generated and/or analyzed during the current study are available in the Sequence Read Archive (SRA), NCBI repository, under the SubmissionID SUB16136548, BioProject ID PRJNA1456400. Metadata, soil chemistry data, ASV table, taxonomy, FTIR data, and scripts used for the analysis are available at 10.5281/zenodo.21790998.
Conflicts of Interest
The authors declare no conflicts of interest.
References
- Food and Agriculture Organization of the United Nations. Global Forest Resources Assessment 2020; Main Report; FAO: Rome, Italy, 2020; Available online: https://www.fao.org/forest-resources-assessment/past-assessments/fra-2020/en/ (accessed on 28 July 2026).
- Pan, Y.; Birdsey, R.A.; Fang, J.; Houghton, R.; Kauppi, P.E.; Kurz, W.A.; Phillips, O.L.; Shvidenko, A.; Lewis, S.L.; Canadell, J.G.; et al. A large and persistent carbon sink in the world’s forests. Science 2011, 333, 988–993. [Google Scholar] [CrossRef] [Scilit] [PubMed]
- Baldrian, P. Forest microbiome: Diversity, complexity and dynamics. FEMS Microbiol. Rev. 2017, 41, 109–130. [Google Scholar] [CrossRef] [Scilit] [PubMed]
- Tedersoo, L.; Bahram, M.; Põlme, S.; Kõljalg, U.; Yorou, N.S.; Wijesundera, R.; Ruiz, L.V.; Vasco-Palacios, A.M.; Thu, P.Q.; Suija, A.; et al. Global diversity and geography of soil fungi. Science 2014, 346, 1256688. [Google Scholar] [CrossRef] [Scilit] [PubMed]
- Purahong, W.; Wubet, T.; Lentendu, G.; Schloter, M.; Pecyna, M.J.; Kapturska, D.; Hofrichter, M.; Krüger, D.; Buscot, F. Life in leaf litter: Novel insights into community dynamics of bacteria and fungi during litter decomposition. Mol. Ecol. 2016, 25, 4059–4074. [Google Scholar] [CrossRef] [Scilit] [PubMed]
- Štursová, M.; Žifčáková, L.; Leigh, M.B.; Burgess, R.; Baldrian, P. Cellulose utilization in forest litter and soil: Identification of bacterial and fungal decomposers. FEMS Microbiol. Ecol. 2012, 80, 735–746. [Google Scholar] [CrossRef] [Scilit] [PubMed]
- Averill, C.; Turner, B.L.; Finzi, A.C. Mycorrhiza-mediated competition between plants and decomposers drives soil carbon storage. Nature 2014, 505, 543–545. [Google Scholar] [CrossRef] [Scilit] [PubMed]
- Glassman, S.I.; Wang, I.J.; Bruns, T.D. Environmental filtering by pH and soil nutrients drives community assembly in fungi at fine spatial scales. Mol. Ecol. 2017, 26, 6960–6973. [Google Scholar] [CrossRef] [Scilit] [PubMed]
- Tedersoo, L.; Bahram, M.; Zobel, M. How mycorrhizal associations drive plant population and community biology. Science 2020, 367, eaba1223. [Google Scholar] [CrossRef] [Scilit] [PubMed]
- Du, C.; Geng, Z.; Wang, Q.; Zhang, T.; He, W.; Hou, L.; Wang, Y. Variations in bacterial and fungal communities through soil depth profiles in a Betula albosinensis forest. J. Microbiol. 2017, 55, 684–693. [Google Scholar] [CrossRef] [Scilit] [PubMed]
- Li, X.; Wang, H.; Li, X.; Li, X.; Zhang, H. Distribution characteristics of fungal communities with depth in paddy fields of three soil types in China. J. Microbiol. 2020, 58, 279–287. [Google Scholar] [CrossRef] [Scilit] [PubMed]
- Xie, L.; Yin, C. Seasonal variations of soil fungal diversity and communities in subalpine coniferous and broadleaved forests. Sci. Total Environ. 2022, 846, 157409. [Google Scholar] [CrossRef] [Scilit] [PubMed]
- Brinkmann, N.; Schneider, D.; Sahner, J.; Ballauff, J.; Edy, N.; Barus, H.; Irawan, B.; Budi, S.W.; Qaim, M.; Daniel, R.; et al. Intensive tropical land use massively shifts soil fungal communities. Sci. Rep. 2019, 9, 3403. [Google Scholar] [CrossRef] [Scilit] [PubMed]
- Balami, S.; Vašutová, M.; Godbold, D.; Kotas, P.; Cudlín, P. Soil fungal communities across land use types. iForest-Biogeosci. For. 2020, 13, 548. [Google Scholar] [CrossRef] [Scilit]
- Baldrian, P. The known and the unknown in soil microbial ecology. FEMS Microbiol. Ecol. 2019, 95, fiz005. [Google Scholar] [CrossRef] [Scilit] [PubMed]
- Steidinger, B.S.; Crowther, T.W.; Liang, J.; Van Nuland, M.E.; Werner, G.D.A.; Reich, P.B.; Nabuurs, G.J.; De-Miguel, S.; Zhou, M.; Picard, N.; et al. Climatic controls of decomposition drive the global biogeography of forest-tree symbioses. Nature 2019, 569, 404–408. [Google Scholar] [CrossRef] [Scilit] [PubMed]
- Lustenhouwer, N.; Maynard, D.S.; Bradford, M.A.; Lindner, D.L.; Oberle, B.; Zanne, A.E.; Crowther, T.W. A trait-based understanding of wood decomposition by fungi. Proc. Natl. Acad. Sci. USA 2020, 117, 11551–11558. [Google Scholar] [CrossRef] [Scilit] [PubMed]
- Lehmann, A.; Zheng, W.; Rillig, M.C. Soil biota contributions to soil aggregation. Nat. Ecol. Evol. 2017, 1, 1828–1835. [Google Scholar] [CrossRef] [Scilit] [PubMed]
- de Goede, S.P.C.; Hannula, S.E.; Jansen, B.; Morriën, E. Fungal-mediated soil aggregation as a mechanism for carbon stabilization. ISME J. 2025, 19, wraf074. [Google Scholar] [CrossRef] [Scilit] [PubMed]
- Vacchiano, G.; Garbarino, M.; Lingua, E.; Motta, R. Forest dynamics and disturbance regimes in the Italian Apennines. For. Ecol. Manag. 2017, 388, 57–66. [Google Scholar] [CrossRef] [Scilit]
- Garbarino, M.; Morresi, D.; Urbinati, C.; Malandra, F.; Motta, R.; Sibona, E.M.; Vitali, A.; Weisberg, P.J. Contrasting land use legacy effects on forest landscape dynamics in the Italian Alps and the Apennines. Landsc. Ecol. 2020, 35, 2679–2694. [Google Scholar] [CrossRef] [Scilit]
- Del Favero, R. I Boschi delle Regioni Alpine Italiane: Tipologia, Funzionamento, Selvicoltura; CLEUP: Padova, Italy, 2004. (In Italian) [Google Scholar]
- Blasi, C.; Capotorti, G.; Copiz, R.; Guida, D.; Mollo, B.; Smiraglia, D.; Zavattero, L. Classification and mapping of the ecoregions of Italy. Plant Biosyst.—Int. J. Deal. Asp. Plant Biosyst. 2014, 148, 1255–1345. [Google Scholar] [CrossRef] [Scilit]
- Moris, J.V.; Vacchiano, G.; Ascoli, D.; Motta, R. Alternative stable states in mountain forest ecosystems: The case of European larch (Larix decidua) forests in the western Alps. J. Mt. Sci. 2017, 14, 811–822. [Google Scholar] [CrossRef] [Scilit]
- Morales-Molino, C.; Steffen, M.; Samartin, S.; van Leeuwen, J.F.N.; Hürlimann, D.; Vescovi, E.; Tinner, W. Long-term responses of Mediterranean mountain forests to climate change, fire and human activities in the Northern Apennines (Italy). Ecosystems 2021, 24, 1361–1377. [Google Scholar] [CrossRef] [Scilit] [PubMed]
- Motta, R.; Garbarino, M.; Berretti, R.; Bono, A.; Curovic, M.; Dukić, V.; Nola, P. Monastic silviculture legacies and current old-growthness of silver fir (Abies alba) forests in the northern Apennines (Italy). Front. For. Glob. Change 2023, 6, 1252462. [Google Scholar] [CrossRef] [Scilit]
- Persiani, A.M.; Maggi, O.; Montalvo, J.; Casado, M.A.; Pineda, F.D. Mediterranean grassland soil fungi: Patterns of biodiversity, functional redundancy and soil carbon storage. Plant Soil 2016, 392, 197–214. [Google Scholar]
- Hibbett, D.; Abarenkov, K.; Koljalg, U.; Öpik, M.; Chai, B.; Cole, J.R.; Wang, Q.; Crous, P.; Robert, V.A.R.G.; Helgason, T.; et al. Sequence-based classification and identification of Fungi. Mycologia 2016, 108, 1049–1068. [Google Scholar] [CrossRef] [Scilit] [PubMed]
- Tedersoo, L.; Anslan, S.; Bahram, M.; Drenkhan, R.; Pritsch, K.; Buegger, F.; Padari, A.; Hagh-Doust, N.; Mikryukov, V.; Gohar, D.; et al. Regional-scale in-depth analysis of soil fungal diversity reveals strong pH and plant species effects in Northern Europe. Front. Microbiol. 2020, 11, 1953. [Google Scholar] [CrossRef] [Scilit] [PubMed]
- Muneer, M.; Huang, X.; Hou, W.; Zhang, Y.; Cai, Y.; Munir, M.Z.; Wu, L.; Zheng, C. Response of fungal diversity, community composition, and functions to nutrients management in red soil. J. Fungi 2021, 7, 554. [Google Scholar] [CrossRef] [Scilit] [PubMed]
- Guo, Y.; Guigue, J.; Bauke, S.L.; Hempel, S.; Rillig, M. Soil depth and fertilizer shape fungal community composition in a long-term fertilizer agricultural field. Appl. Soil Ecol. 2025, 207, 105943. [Google Scholar] [CrossRef] [Scilit]
- Heděnec, P.; Zheng, H.; Siqueira, D.P.; Lin, Q.; Peng, Y.; Schmidt, I.K.; Frøslev, T.G.; Kjøller, R.; Rousk, J.; Vesterdal, L. Tree species traits and mycorrhizal association shape soil microbial communities via litter quality and species mediated soil properties. For. Ecol. Manag. 2023, 527, 120608. [Google Scholar] [CrossRef] [Scilit]
- Voříšková, J.; Brabcová, V.; Cajthaml, T.; Baldrian, P. Seasonal dynamics of fungal communities in a temperate oak forest soil. New Phytol. 2013, 201, 269–278. [Google Scholar] [CrossRef] [Scilit] [PubMed]
- Shigyo, N.; Umeki, K.; Hirao, T. Seasonal dynamics of soil fungal and bacterial communities in cool-temperate montane forests. Front. Microbiol. 2019, 10, 1944. [Google Scholar] [CrossRef] [Scilit] [PubMed]
- Djemiel, C.; Dequiedt, S.; Horrigue, W.; Bailly, A.; Lelièvre, M.; Tripied, J.; Guilland, C.; Perrin, S.; Comment, G.; Saby, N.P.A.; et al. Unraveling biogeographical patterns and environmental drivers of soil fungal diversity at the French national scale. SOIL 2024, 10, 251–273. [Google Scholar] [CrossRef] [Scilit]
- Castillo-Figueroa, D.; Corrales, A.; Posada, J.M. Ecological Determinants of soil fungal communities along a successional gradient in upper andean tropical forests and their influence on decomposition. Biotropica 2026, 58, e70215. [Google Scholar] [CrossRef] [Scilit]
- Yang, B.; Yang, Z.; He, K.; Zhou, W.; Feng, W. Soil fungal community diversity, co-occurrence networks, and assembly processes under diverse forest ecosystems. Microorganisms 2024, 12, 1915. [Google Scholar] [CrossRef] [Scilit] [PubMed]
- Bolyen, E.; Rideout, J.R.; Dillon, M.R.; Bokulich, N.A.; Abnet, C.C.; Al-Ghalith, G.A.; Alexander, H.; Alm, E.J.; Arumugam, M.; Asnicar, F.; et al. Reproducible, interactive, scalable and extensible microbiome data science using QIIME 2. Nat. Biotechnol. 2019, 37, 852–857. [Google Scholar] [CrossRef] [Scilit] [PubMed]
- Callahan, B.J.; Mcmurdie, P.J.; Rosen, M.J.; Han, A.W.; Johnson, A.J.A.; Holmes, S.P. DADA2: High-resolution sample inference from Illumina amplicon data. Nat. Methods 2016, 13, 581–583. [Google Scholar] [CrossRef] [Scilit] [PubMed]
- Nilsson, R.H.; Larsson, K.-H.; Taylor, A.F.S.; Bengtsson-Palme, J.; Jeppesen, T.S.; Schigel, D.; Kennedy, P.; Picard, K.; Glöckner, F.O.; Tedersoo, L.; et al. The UNITE database for molecular identification of fungi: Handling dark taxa and parallel taxonomic classifications. Nucleic Acids Res. 2019, 47, D259–D264. [Google Scholar] [CrossRef] [Scilit] [PubMed]
- Chong, J.; Liu, P.; Zhou, G.; Xia, J. Using MicrobiomeAnalyst for comprehensive statistical, functional, and meta-analysis of microbiome data. Nat. Protoc. 2020, 15, 799–821. [Google Scholar] [CrossRef] [Scilit] [PubMed]
- Segata, N.; Izard, J.; Waldron, L.; Gevers, D.; Miropolsky, L.; Garrett, W.S.; Huttenhower, C. Metagenomic biomarker discovery and explanation. Genome Biol. 2011, 12, R60. [Google Scholar] [CrossRef] [Scilit] [PubMed]
- Tang, D.; Chen, M.; Huang, X.; Zhang, G.; Zeng, L.; Zhang, G.; Wu, S.; Wang, Y. SRplot: A free online platform for data visualization and graphing. PLoS ONE 2023, 18, e0294236. [Google Scholar] [CrossRef] [Scilit] [PubMed]
- Rao, C.N.R. Chemical Applications of Infrared Spectroscopy; Academic Press: New York, NY, USA, 1963. [Google Scholar]
- Pandey, K.K.; Pitman, A.J. FTIR studies of the changes in wood chemistry following decay by brown-rot and white-rot fungi. Int. Biodeterior. Biodegrad. 2003, 52, 151–160. [Google Scholar] [CrossRef] [Scilit]
- Calderón, F.J.; Mikha, M.M.; Vigil, M.F.; Nielsen, D.C.; Benjamin, J.G.; Reeves, J.B. Diffuse-reflectance mid-infrared spectral properties of soils under alternative crop rotations in a semi-arid climate. Commun. Soil Sci. Plant Anal. 2011, 42, 2143–2159. [Google Scholar] [CrossRef] [Scilit]
- Chavez-Vergara, B.; Merino, A.; Vázquez-Marrufo, G.; García-Oliva, F. Organic matter dynamics and microbial activity during decomposition of forest floor under two native neotropical oak species in a temperate deciduous forest in Mexico. Geoderma 2014, 235–236, 133–145. [Google Scholar] [CrossRef] [Scilit]
- Tinti, A.; Tugnoli, V.; Bonora, S.; Francioso, O. Recent applications of vibrational mid-Infrared (IR) spectroscopy for studying soil components: A review. J. Cent. Eur. Agric. 2015, 16, 1–22. [Google Scholar] [CrossRef] [Scilit]
- Theuerl, S.; Dörr, N.; Guggenberger, G.; Langer, U.; Kaiser, K.; Lamersdorf, N.; Buscot, F. Response of recalcitrant soil substances to reduced N deposition in a spruce forest soil: Integrating laccase-encoding genes and lignin decomposition. FEMS Microbiol. Ecol. 2010, 73, 166–177. [Google Scholar] [CrossRef] [Scilit] [PubMed][Green Version]
- Albers, D.; Migge, S.; Schaefer, M.; Scheu, S. Decomposition of beech leaves (Fagus sylvatica) and spruce needles (Picea abies) in pure and mixed stands of beech and spruce. Soil Biol. Biochem. 2004, 36, 155–164. [Google Scholar] [CrossRef] [Scilit]
- Bueis, T.; Bravo, F.; Pando, V.; Kissi, Y.A.; Turrión, M.B. Phosphorus availability in relation to soil properties and forest productivity in Pinus sylvestris L. plantations. Ann. For. Sci. 2019, 76, 97. [Google Scholar] [CrossRef] [Scilit]
- Wu, L.; Qiao, S.; Peng, M.; Ma, X. Coupling loss characteristics of runoff-sediment-adsorbed and dissolved nitrogen and phosphorus on bare loess slope. Environ. Sci. Pollut. Res. 2018, 25, 14018–14031. [Google Scholar] [CrossRef] [Scilit] [PubMed]
- Naeem, A.; Akhtar, M.; Ahmad, W. Optimizing available phosphorus in calcareous soils fertilized with diammonium phosphate and phosphoric acid using Freundlich adsorption isotherm. Sci. World J. 2013, 2013, 680257. [Google Scholar] [CrossRef] [Scilit] [PubMed]
- Cosentino, D.; Cipollari, P.; Marsili, P.; Scrocca, D. Geology of the central Apennines: A regional review. J. Virtual Explor. 2010, 36, 1–37. [Google Scholar] [CrossRef] [Scilit]
- Zhao, W.; Gu, C.; Zhu, M.; Yan, Y.; Liu, Z.; Feng, X.; Wang, X. Chemical speciation of phosphorus in farmland soils and soil aggregates around mining areas. Geoderma 2023, 433, 116465. [Google Scholar] [CrossRef] [Scilit]
- Berra, F.; Jadoul, F.; Anelli, A. Environmental control on the end of the Dolomia Principale/Hauptdolomit depositional system in the central Alps: Coupling sea-level and climate changes. Palaeogeogr. Palaeoclimatol. Palaeoecol. 2010, 290, 138–150. [Google Scholar] [CrossRef] [Scilit]
- Jiménez-González, M.A.; Álvarez, A.M.; Carral, P.; Almendros, G. Chemometric assessment of soil organic matter storage and quality from humic acid infrared spectra. Sci. Total Environ. 2019, 685, 1160–1168. [Google Scholar] [CrossRef] [Scilit] [PubMed]
- Tintor, Đ.; Ninković, K.; Milošević, J.; Polović, N.Đ. Gaining insight into protein structure via ATR-FTIR spectroscopy. Vib. Spectrosc. 2024, 134, 103726. [Google Scholar] [CrossRef] [Scilit]
- Nuzzo, A.; Buurman, P.; Cozzolino, V.; Spaccini, R.; Piccolo, A. Infrared spectra of soil organic matter under a primary vegetation sequence. Chem. Biol. Technol. Agric. 2020, 7, 6. [Google Scholar] [CrossRef] [Scilit]
- Arnstadt, T.; Hoppe, B.; Kahl, T.; Kellner, H.; Krüger, D.; Bauhus, J.; Hofrichter, M. Dynamics of fungal community composition, decomposition and resulting deadwood properties in logs of Fagus sylvatica, Picea abies and Pinus sylvestris. For. Ecol. Manag. 2016, 382, 129–142. [Google Scholar] [CrossRef] [Scilit]
- Rousk, J.; Brookes, P.C.; Bååth, E. Contrasting soil pH effects on fungal and bacterial growth suggest functional redundancy in carbon mineralization. Appl. Environ. Microbiol. 2009, 75, 1589–1596. [Google Scholar] [CrossRef] [Scilit] [PubMed]
- Zhang, S.; Yang, X.; Hsu, L.-C.; Liu, Y.-T.; Wang, S.-L.; White, J.R.; Shaheen, S.M.; Chen, Q.; Rinklebe, J. Soil acidification enhances the mobilization of phosphorus under anoxic conditions in an agricultural soil: Investigating the potential for loss of phosphorus to water and the associated environmental risk. Sci. Total Environ. 2021, 793, 148531. [Google Scholar] [CrossRef] [Scilit] [PubMed]
- Ma, Y.; Chen, S.; Liu, S.; Guo, L.; Zhang, C.; Ye, X.; Tian, D. Phosphate solubilizing fungi enhance insoluble phosphate dissolution via organic acid production: Mechanisms and applications. Front. Microbiol. 2025, 16, 1600231. [Google Scholar] [CrossRef] [Scilit] [PubMed]
- Boberg, J.; Finlay, R.D.; Stenlid, J.; Näsholm, T.; Lindahl, B.D. Glucose and ammonium additions affect needle decomposition and carbon allocation by the litter degrading fungus Mycena epipterygia. Soil Biol. Biochem. 2008, 40, 995–999. [Google Scholar] [CrossRef] [Scilit]
- Weiß, M.; Waller, F.; Zuccaro, A.; Selosse, M.A. Sebacinales–one thousand and one interactions with land plants. New Phytol. 2016, 211, 20–40. [Google Scholar] [CrossRef] [Scilit]
- Bahram, M.; Vanderpool, D.; Pent, M.; Hiltunen, M.; Ryberg, M. The genome and microbiome of a dikaryotic fungus (Inocybe terrigena, Inocybaceae) revealed by metagenomics. Environ. Microbiol. Rep. 2018, 10, 155–166. [Google Scholar] [PubMed]
- Tedersoo, L.; Kõljalg, U.; Hallenberg, N.; Larsson, K.H. Fine scale distribution of ectomycorrhizal fungi and roots across substrate layers including coarse woody debris in a mixed forest. New Phytol. 2003, 159, 153–165. [Google Scholar] [CrossRef] [Scilit] [PubMed]
- Heinonsalo, J.; Sun, H.; Santalahti, M.; Bäcklund, K.; Hari, P.; Pumpanen, J. Evidences on the ability of mycorrhizal genus Piloderma to use organic nitrogen and deliver it to Scots pine. PLoS ONE 2015, 10, e0131561. [Google Scholar] [CrossRef] [Scilit] [PubMed]
- Wang, P.; Zhang, Y.; Mi, F.; Tang, X.; He, X.; Cao, Y.; Liu, C.; Yang, D.; Dong, J.; Zhang, K.; et al. Recent advances in population genetics of ectomycorrhizal mushrooms Russula spp. Mycology 2015, 6, 110–120. [Google Scholar] [CrossRef] [Scilit] [PubMed]
- Meeds, J.A.; Kranabetter, J.M.; Zigg, I.; Dunn, D.; Miros, F.; Shipley, P.; Jones, M.D. Phosphorus deficiencies invoke optimal allocation of exoenzymes by ectomycorrhizas. ISME J. 2021, 15, 1478–1489. [Google Scholar] [CrossRef] [Scilit] [PubMed]
- Pettorelli, N.; Vik, J.O.; Mysterud, A.; Gaillard, J.-M.; Tucker, C.J.; Stenseth, N.C. Using the satellite-derived NDVI to assess ecological responses to environmental change. Trends Ecol. Evol. 2005, 20, 503–510. [Google Scholar] [CrossRef] [Scilit] [PubMed]

Disclaimer/Publisher’s Note: The statements, opinions and data contained in all publications are solely those of the individual author(s) and contributor(s) and not of MDPI and/or the editor(s). MDPI and/or the editor(s) disclaim responsibility for any injury to people or property resulting from any ideas, methods, instructions or products referred to in the content. |
© 2026 by the authors. Licensee MDPI, Basel, Switzerland. This article is an open access article distributed under the terms and conditions of the Creative Commons Attribution (CC BY) license.