Article

System Analysis of Wood Logistics Solutions Mitigating Environmental Impact in Polish Conditions: A Methodological Approach


1
Department of Biosystems Engineering, Institute of Mechanical Engineering, Warsaw University of Life Sciences (SGGW), Nowoursynowska 164, 02-787 Warsaw, Poland
2
Department of Forest Management Planning, Dendrometry and Forest Economics, Institute of Forest Sciences, Warsaw University of Life Sciences (SGGW), Nowoursynowska 159, 02-776 Warszawa, Poland
3
Department of Forest Utilization, Geomatics and Spatial Management, Institute of Forest Sciences, Warsaw University of Life Sciences (SGGW), Nowoursynowska 159, 02-776 Warszawa, Poland
*
Author to whom correspondence should be addressed.
Forests 2026, 17(8), 974; https://doi.org/10.3390/f17080974
Submission received: 20 April 2026 / Revised: 10 August 2026 / Accepted: 12 August 2026 / Published: 17 August 2026

Abstract

Efficient wood logistics is essential for a sustainable wood supply chain. In Poland, mounting symptoms of inefficiency highlight the need for a systematic and comprehensive performance assessment across the entire supply chain. Previous studies have predominantly focused on individual supply chain segments or specific stakeholder perspectives, but a comprehensive evaluation of wood supply chain efficiency in Poland remains unrealized. The study aimed to assess the efficiency of the timber supply chain at the Regional Directorate of State Forests level. The analysis encompasses the entire process from harvest planning to delivery to wood processing plants. The business-as-usual scenario derived from historical data is compared with improvement scenarios using a simulation–based optimization approach implemented in ArcGIS Pro 3.4.0. The scenarios are structured according to their decision-making impact: strategic logistics, tactical infrastructure, and operational routines. In total, 18 scenarios are developed to assess total operational costs, including environmental costs per m3 of timber. This covers harvesting, extraction, and transport across all feasible equipment combinations in Poland. The model’s performance was verified for timber harvesting and skidding.

1. Introduction

Wood constitutes a strategic natural resource that plays a significant role in climate change mitigation, particularly through carbon stored in long-duration wood products [1]. Beyond its environmental functions, it also has substantial economic and social importance [2,3]. Consequently, efficient wood logistics with reduced greenhouse gas (GHG) emissions is pivotal to the sustainability of the forest sector [4].

1.1. Geographical and Assortment Profile of Resources and Customers

The functioning of the wood supply chain is determined by several factors that vary significantly between countries. The area where raw material is expected to be harvested, its accessibility, and the choice of technological and technical solutions greatly determine the operational efficiency, fuel consumption, and consequently GHG emissions [5].
In Poland, the wood supply network encompasses nearly 338,700 forest complexes [6]; 999 potential assortments governed by the standardized species-dimension-quality matrix of the state timber trading system [7]; and approximately 6000 enterprises engaged in the procurement of raw material [8]. Structurally, forest complexes are aggregated spatial units grouped based on landscape connectivity. Among the complexes identified by Budniak [6], approximately 99% have an area of less than 200 ha, while very large complexes exceeding 25,000 ha represent only 0.40% of the total. This spatial fragmentation—combined with silvicultural practices favoring small-area harvesting systems—and adopted organizational solutions have led to frequent personnel and equipment relocations and, thus, to significant inefficiency [9].
Moreover, these areas produce different assortments depending on the species and cutting methods. The Polish timber sale system meets mill demand through custom assortment lengths, but this disperses storage and lowers transport efficiency due to multiple loading spots [10]. Furthermore, local supply is frequently insufficient in terms of quantity and assortment structure, which increases the transport distance to processing mills [11].
The majority of wood processing plants (94%) process up to 10,000 m3 of roundwood annually, collectively representing 30% of the market. Enterprises processing between 10,000 and 50,000 m3 constitute less than 5% of the total, yet account for 21% of the market share. Notably, a mere 1% of companies handle more than 50,000 m3 of roundwood per year, but they dominate the market at 49% of the total processing volume [12]. Their location is another critical determinant of supply chain efficiency. Large sawmills and pulp and paper mills are predominantly situated in regions with significant forest cover, such as north-western and south-eastern Poland, and near major rivers to secure water resources.

1.2. Wood Logistics Problem

Wood production and delivery to processing plants are facilitated through a well-structured wood supply chain. This constitutes a complex network of interrelated stages, including planning, harvesting, extraction, transportation, storage, and processing. Harvesting represents the first operational stage and has a crucial influence on overall efficiency. Size, spatial distribution, the accessibility of harvesting sites, and the selection of machinery and technology affect logistics performance [13]. Operational expenses in harvesting are mainly driven by fuel consumption, labor inputs, machine utilization, and administrative tasks. Among these cost components, fuel consumption per cubic meter is particularly affected by average tree size, the type of harvesting treatment, and harvesting intensity [11].
The efficiency of machines employed in timber harvesting, particularly multi-purpose harvesters, is significantly influenced by forest management. In Poland, this is strongly affected by forest fragmentation. This dispersed structure forces harvesting machines to operate on numerous small, spatially isolated sites, significantly increasing non-productive travel time. As a result, machines spend a considerable portion of the working shift relocating between tasks, which leads to higher fuel consumption, increased emissions, accelerated machinery wear, and rising operating costs. In extreme cases, machine relocation and associated activities may consume up to 50% of shift time, drastically reducing productivity [9]. In contrast, Scandinavian countries benefit from large, continuous forest areas that allow machines to remain on-site for extended periods, enabling higher utilization rates and lower unit costs [14]. Some of the organizational measures used to improve efficiency are aggregating harvesting tasks and selecting extraction equipment parameters according to the type and size of the load being transported.
A key logistical objective is to ensure the spatial and temporal balancing of supply and demand so that timber of suitable quality reaches customers at the appropriate time and in the correct quantity. Transportation plays a critical role in the wood supply chain, directly affecting costs, reliability, and environmental performance [15]. It is one of the most cost-intensive components, much more than in other sectors, accounting for about 30%–60% of overall supply chain expenses [16,17]. Transportation costs mainly depend on fuel consumption, which is driven by the type of vehicle and trailer, road network condition, speed and load limits, distance, and work organization [18].
The transport of timber from forest sites to processing plants is divided into two main stages: off-road transport (timber extraction/primary transportation) and long-distance transport (secondary transportation), most often carried out by road or rail. This division creates a need for transshipment and short-term storage, which are commonly provided by landings, terminals, or log sort yards of varying scale and infrastructure. Wood yard network configurations fundamentally shape skidding distances and determine how effectively harvesting equipment can be integrated with wood yard-side logistics. If wood yards are optimally located, average skidding distances decrease, reducing machine wear, fuel consumption, and overall operational costs [19]. A declining number of wood yards restricts opportunities for load consolidation and modal shifts, further limiting optimization potential across the entire wood supply chain.
Empirical studies indicate that road transport dominates timber logistics in most countries. According to Kärhä et al. [20], on average, 87% of the total volume of industrial roundwood is transported by trucks, exceeding 95% in countries such as Canada, the United States, and Japan. In Poland, 90% of timber is transported by road primarily using five- and six-axle diesel trucks [20] equipped with hydraulic cranes [21]. The trailer type selection is predominantly associated with a significant proportion of long assortments, demonstrating a preference for vehicles equipped with semi-trailers rather than trailers [22].
Research by Sieniawski and Trzciński [23] shows that the average transport distance in Poland for sawlogs is approximately 72 km, while pulpwood is transported over significantly longer distances, averaging 202 km. These long distances increase the economic and environmental attractiveness of rail transport, particularly when supported by centralized terminals, allowing for efficient loading and scheduling of rail shipments. Despite its advantages in terms of lower unit emissions and high transport capacity, rail transport remains limited due to infrastructure requirements and currently accounts for about 10% of transported volume [20]. The implementation of commercial solutions for alternative power sources in heavy-duty transport is a widespread phenomenon throughout Europe [24,25,26,27]. Nevertheless, this development has not yet been extensively implemented within the Polish forestry sector.
The efficiency of timber transport significantly depends on the distance traveled. However, this relationship may not be directly proportional. For short-distance transport, vehicles travel on roads with worse geometric and quality parameters, which reduces driving speeds, increases traffic resistance, and thus increases unit fuel consumption [20]. Furthermore, the high costs and low efficiency of rail transport in Poland result in a significant volume of timber being transported over long distances by trucks. For this reason, highway-type trucks that are not adapted for driving on forest roads are preferred, which can be a factor in creating terminals along public roads [28].
The organization of timber transport is influenced by several characteristics, including the seasonality of operations, predominantly one-directional transport flows, variable load characteristics, and diverse road and weather conditions. As a result, the success of companies specializing in timber transport depends not only on their own efficiency but also on close cooperation with forest owners, contractors, processing mills, and other actors involved in the logistics process [29].

1.3. Harvesting Systems, Machines and Vehicles

There are several methods for timber harvesting, differing in the type of assortments produced in the forest and the level of mechanization. In recent years, a dynamic increase in the use of the cut-to-length (CTL) method has been observed in many European countries. This system relies on harvesters for felling, delimbing, and cross-cutting trees into short assortments, and forwarders for transporting timber to landings [30,31]. The choice of machines and technology applied in the wood supply chain is determined by economic and terrain conditions: stand accessibility, required assortments, cutting treatment, forest property, and density of skid trails [32].
Chainsaws are usually used to harvest salvage wood or in challenging terrain conditions, such as on slopes or within wetlands. Their application often extends to private forests, producing tree-length (TL) assortments, and the harvesting of hardwood due to delimbing difficulties [33]. Harvesters are predominantly employed in the context of unified softwood stands, specifically as part of the CTL method [32]. The size of the harvester is selected based on the cutting treatment: small harvesters are employed for thinning and selection cutting, whereas large ones are utilized for final cutting, where they can harvest a significant volume in one spot [34]. The type of extraction machinery is contingent on the assortment length and extraction distance. Wood harvested using the CTL method is extracted by forwarders, while TL technology requires skidders [35,36]. Regarding extraction machinery, the size of the equipment employed is commensurate with the size of the harvesters used in the same harvesting process to avoid bottlenecks [37].
Moreover, the adoption of mechanized systems varies between countries due to differences in labor availability, investment capacity, and concerns related to employment. In countries with high labor costs, highly mechanized harvesting systems are more frequent, as they offer significantly higher labor productivity [38]. Poland is classified as a country with a medium level of mechanization of logging operations, which results in the prevalence of chainsaws in logging operations, even in relatively unchallenging stands. Nevertheless, research indicates a substantial increase in the use of harvesters in recent years. In 2021, mechanized harvesting accounted for 46.2% of total timber production, nearly doubling compared with 2016 [39].

1.4. Environmental Challenges for Wood Supply Chain

Apart from the efficiency aspect, environmental challenges must be considered in wood supply chain operations. The negative impact of harvesting is reflected in damage to soil and the remaining stand, and loss of biodiversity, especially in the case of clear-cutting [40]. Moreover, logging and transportation are important emission sources directly impacting climate change. Determining GHG emissions is typically contingent on the quantity of fuel consumed by forest machinery. The calculation is complemented by appropriate CO2 equivalent emission factors, which are used to calculate the global warming potential. In studies encompassing the entire supply chain, from harvesting to transport to the mill yard, as in [41], fuel consumption per unit of product amounts to 2.1 L·m−3, corresponding to 5.5 kg·m−3 of CO2 emissions. Further data [42] demonstrate that in 2018, a total of 492,000 t of CO2 eq was emitted in Austria during harvesting and transport activities of 19.2 hm3 of wood. This corresponds to 25.6 kg of CO2 equivalent per m3.
Fuel consumption by forestry machines is correlated with the same factors that affect operational efficiency. Average stump size, mechanization level (chainsaw versus harvester), harvesting intensity, and cutting type have the greatest impact on fuel consumption per m3 in the felling process [43,44]. In the extraction process, those factors are transport distance, removal intensity, and load size. Other influencing factors include harvesting method (CTL vs. TL), operational techniques [34], and the size of the machine [45]. For transport, load size and distance traveled are the basis for measuring energy efficiency. For that reason, analyses show that GHG emissions per ton-kilometer in Germany were about 63% higher for a trailer than for a train with 20 cars. Rail has the lowest GHG emissions, which are only one-third of those caused by a truck transporting roundwood, at 9.39 vs. 26.95 CO2 eq per m3 [42].

1.5. Measures to Reduce the Wood Supply Chain Impact on Environment

Aggregating harvesting activities is an important factor for mitigating the negative impacts of forest operations while also enhancing operational efficiency. In recent years, the optimization of harvest aggregation has evolved through the application of advanced mathematical modeling (e.g., Mixed Integer Programming—MIP) and spatial analysis tools [46,47]. Modern approaches emphasize aggregating harvest areas into operational blocks within specific forest complexes to improve machinery organization, reduce equipment displacement, and lower road construction and maintenance costs [48,49,50].
Harvesting concentration has a direct impact on further operations in the wood supply chain. It helps to efficiently plan landings by reducing the number of timber loading points, which eliminates unnecessary distances on forest roads, thereby streamlining wood reception and decreasing unproductive machine hours [10]. Furthermore, the strategic accumulation of timber in terminals serves as a vital alternative to direct deliveries, improving fleet utilization and allowing for moisture content management, which can reduce GHGs by up to 23.4% [51]. Another highly effective green logistics solution is backhauling—organizing return loads to minimize empty runs—which can cover 21%–46% of total timber transport and significantly lower direct costs and emissions [52]. The integration of GIS with advanced optimization algorithms further enhances the efficiency of the transport fleet, substantially reducing GHG emissions and improving overall safety in the wood supply chain [53].
Recent technological advancements in wood logistics focus on enhancing energy efficiency through supply chain electrification and the development of rail transport as a low-emission alternative for long-distance hauls. Due to current battery limitations for heavy machinery, hybrid systems have emerged as a pivotal solution, allowing for the storage of surplus energy and reducing fuel consumption [54]. Despite current productivity gaps versus diesel engines, prototype integration with renewable energy and expanded charging infrastructure is critical for environmental compliance.
The environmental impact of wood harvesting can be further mitigated through better equipment selection and the adoption of low-impact operational practices. Utilizing forwarders for CTL logging is the most environmentally sustainable method, as it minimizes soil disturbance and stand damage compared with traditional cable or grapple skidders [55]. Furthermore, matching machine size to specific operations, such as using compact harvesters for thinning, reduces fuel consumption and preserves the productivity of future forest stands [56]. Better planning in wood logistics through an optimization method considering ordered volumes, wood yards, road networks, and wood processing mills can significantly contribute to sustainable supply chain operations. Analyses at the strategic and tactical planning levels have been performed using a broad spectrum of methodologies, ranging from traditional mathematical programming (e.g., Linear Programming (LP) and MIP) [57] and heuristic algorithms for complex routing [53,58] to simulation-based optimization and emerging AI-driven approaches [59]. Combined with the potential introduction of alternative fuels like hydrogen or biofuels, these efforts represent the core of environmentally efficient wood supply chains.
In recent decades, substantial advances in modeling and decision support approaches for wood supply chains have been witnessed, addressing harvest scheduling, transportation planning, storage management, and supply chain coordination [15,24]. Several studies have developed integrated methods linking forest management and wood procurement decisions, such as the spatially explicit model proposed for Finland by Pekka et al. [60], while others have focused on improving transportation efficiency through mathematical programming and routing optimization [61,62].
In Poland, research has primarily focused on selected components of the wood supply chain, including optimization of wood extraction [63] or transportation processes for particular assortments and industrial recipients [10]. As a result, the interactions between harvesting operations, timber assortment structure, storage decisions, and transportation processes have rarely been analyzed within a single modeling framework.
This limitation is particularly relevant in the context of the Polish forestry sector, which operates within a unique institutional framework dominated by the State Forests National Forest Holding. This system is characterized by a large number of geographically dispersed harvesting locations and customers, multiple timber assortments, extensive use of direct long-distance road deliveries, and heterogeneous demand patterns across the wood-processing industry. Together, these features create complex interdependencies among decisions made at different steps of the supply chain that are difficult to capture using existing approaches.
Consequently, a significant research gap remains in the development of integrated frameworks capable of representing the entire wood supply chain at an operationally relevant scale of approximately 1 to 2 million m3. To address this gap, this paper presents the methodological foundations of a simulation-based decision-support tool for evaluating alternative operational scenarios in the wood supply chain based on harvesting concentration, timber allocation strategies, and wood yard network configurations.
Given the above, the main goal of the research and this publication was to develop a simulation model and computational algorithms for timber harvesting and skidding, focusing on efficiency, unit costs, and environmental costs. The model was validated using actual data collected from the State Forests National Forest Holding.

2. Materials and Methods

2.1. General Description

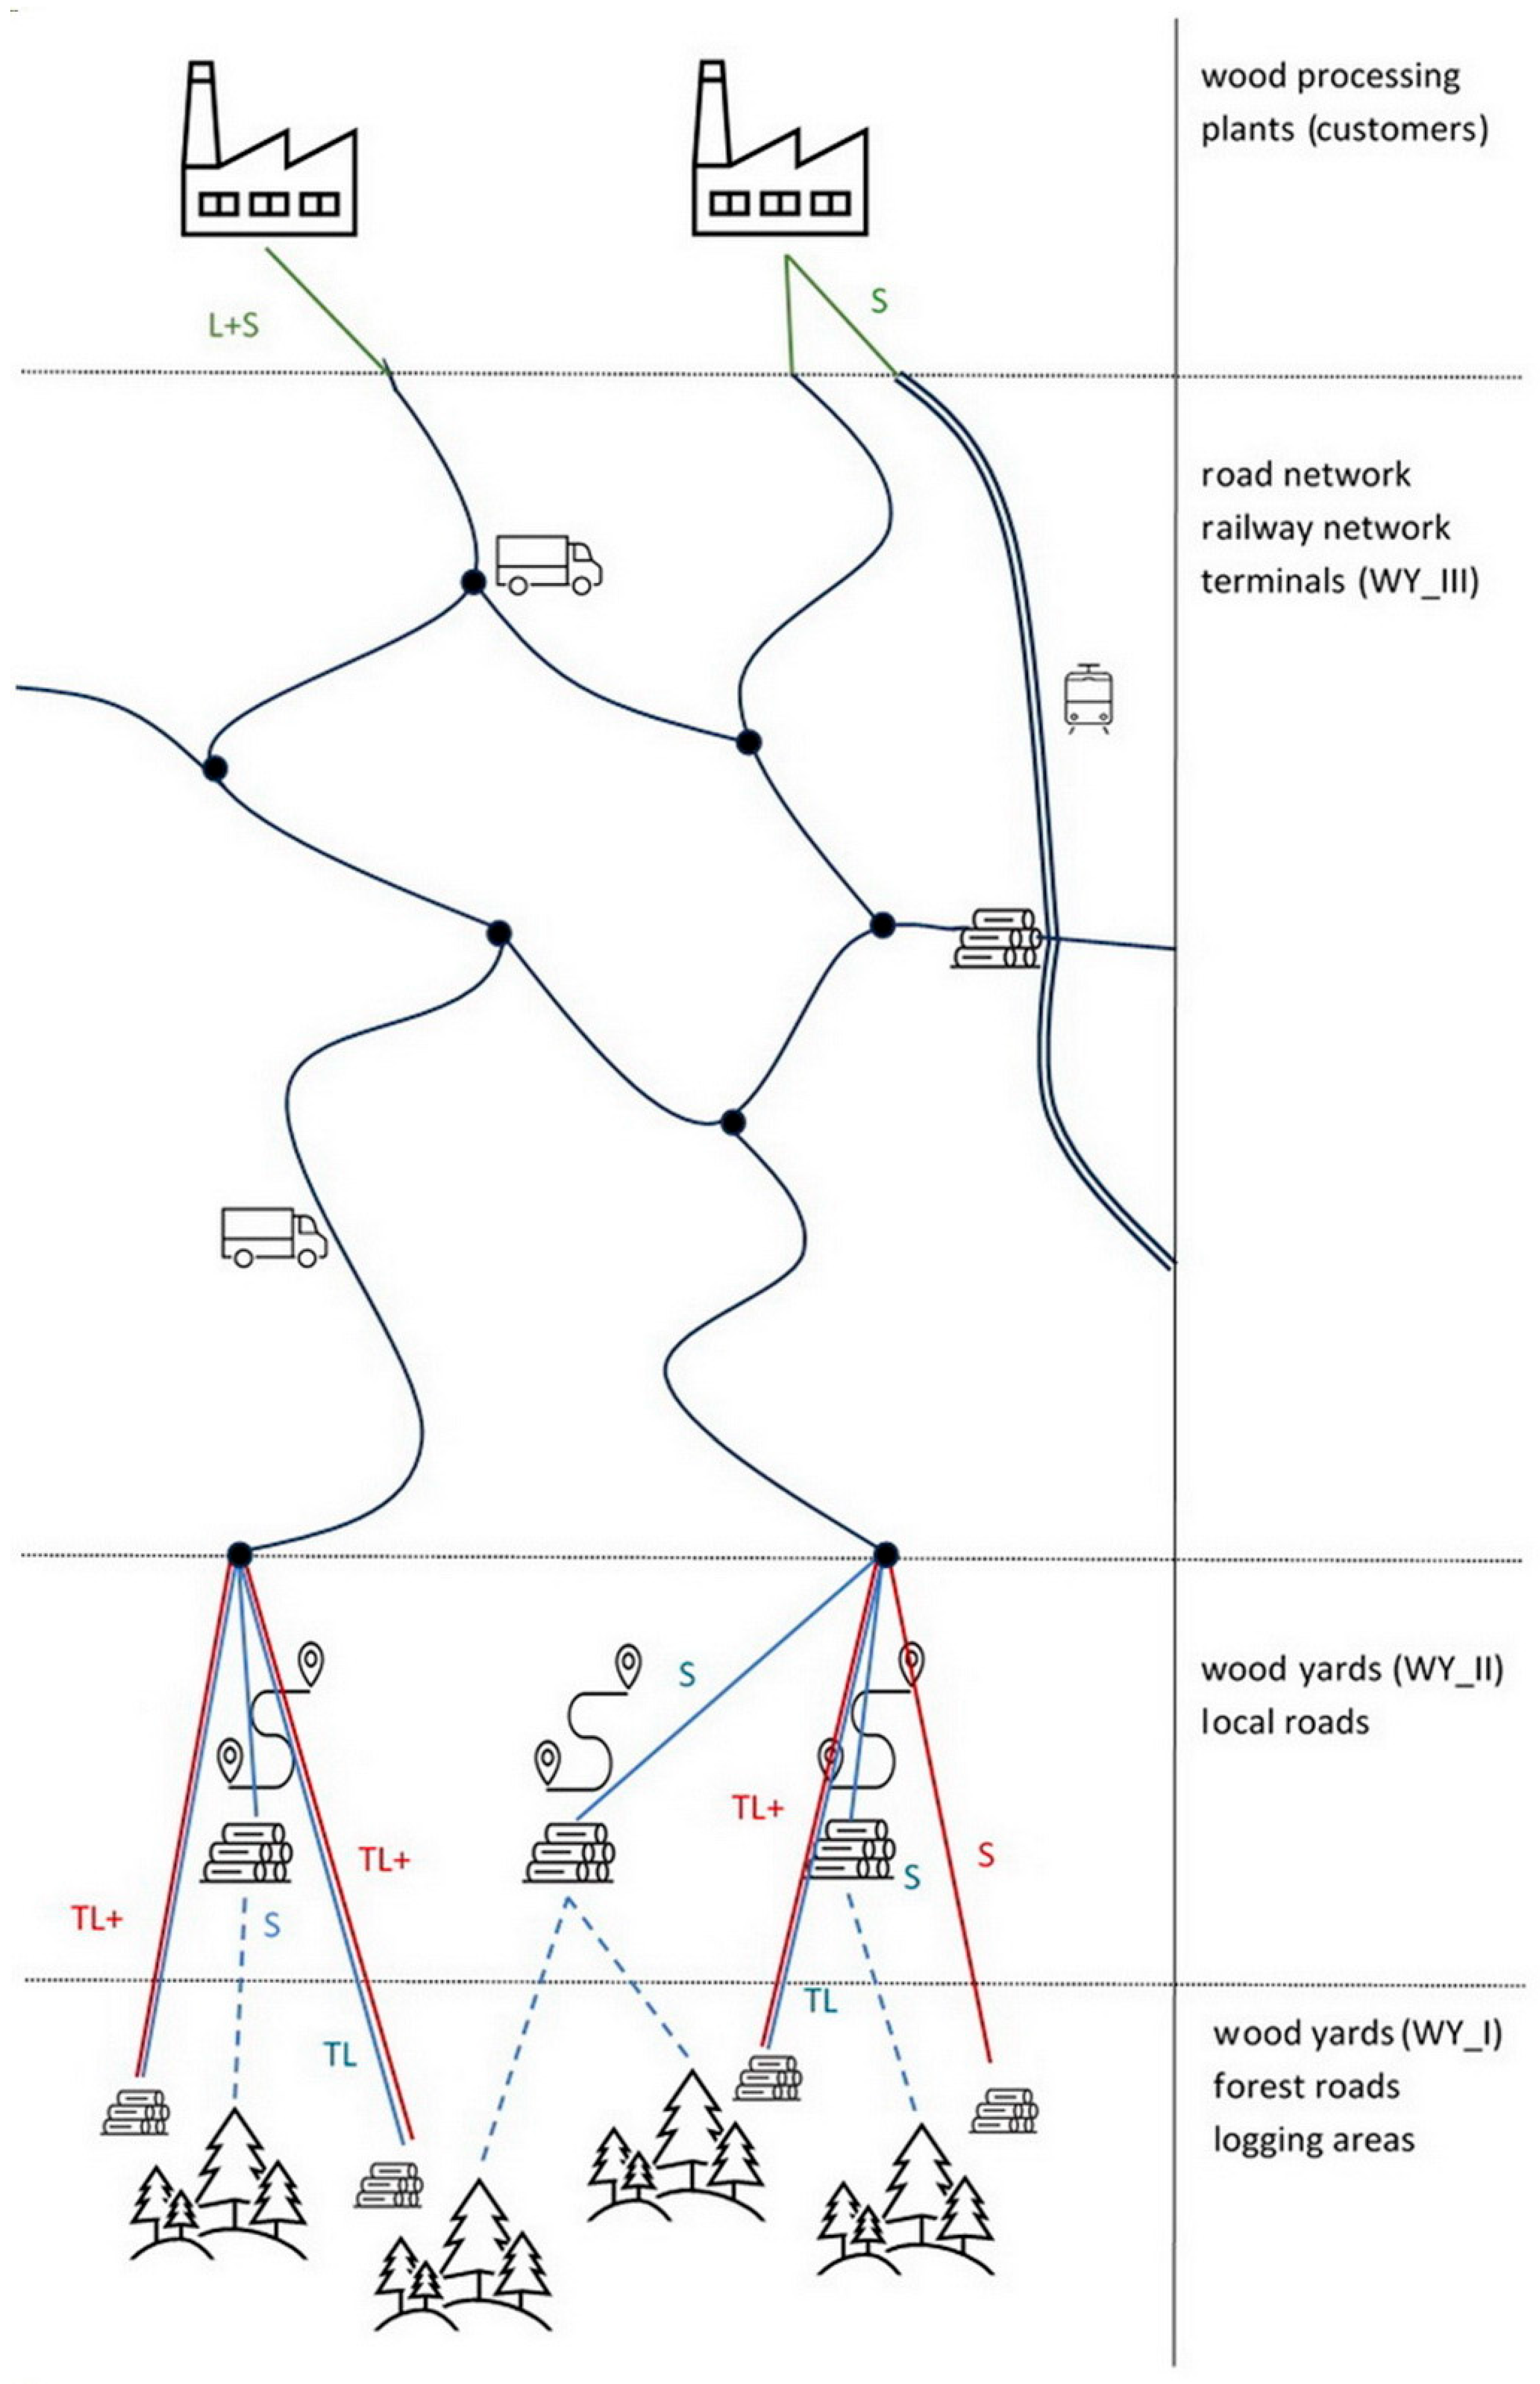
This study presents a structural model of the wood supply chain, encompassing harvesting, skidding, and transport to processing plants (Figure 1). Three logistical nodes are defined: roadside yards (WY_I) located adjacent to harvesting blocks; road-junction yards (WY_II) situated at intersections of forest and public roads; and terminals (WY_III). While WY_I and WY_II function as local accumulation points, WY_III terminals are designed for high-volume transshipment and intermodal transfers between road and rail networks.
Simulation calculations are performed separately for the area of the Regional Directorate of the State Forests (RDSF). These units oversee forest areas ranging from 168,000 to 643,000 hectares, characterized by diverse natural and economic conditions that directly influence wood supply chain operations. Developing a simulation model for harvesting and transport—from the source to the end-user—requires the identification of several primary data groups (described in detail in Section 2.2):
  • Forest stand characteristics (e.g., area and spatial distribution);
  • Machine and vehicle specifications involved in harvesting and transport operations;
  • Infrastructure parameters of both forest and public road networks;
  • Customer data, including wood processing plant locations and demand profiles.
For each stage of the wood supply chain, multiple technical variants were developed to simulate the operations of all machinery available in Poland suitable for specific forest and raw material specifications. Regarding skidding and transport, the simulations also incorporate various organizational scenarios, such as the use of wood yards (WY_II) dedicated exclusively to short-wood and log assortments, or different machine garaging options. Furthermore, the transport component accounts for different spatial allocations, linking specific timber supply points to designated recipients (Section 2.3).
The development of a simulation model will facilitate an evaluation of the environmental implications of all operations in the wood supply chain. The primary factor is fuel consumption (energy use) and, consequently, GHG emissions. The objective function is based on the total costs of delivering timber to the customer, taking into account environmental costs (see Section 2.4). The results of the simulation are expected to indicate the technological and organizational solutions resulting in minimal operational costs.

2.2. Materials

2.2.1. Logging Areas

The spatial framework of the study is based on the forest subcompartment, the fundamental forest management unit. The database structure for each unit comprises two distinct datasets. The primary section comprises data on the type and volume of timber assortments harvested from subcompartments, as well as their spatial coordinates. Since the simulation model focuses on machine performance rather than wood utilization, timber assortments were aggregated into broader categories to reduce computational complexity. These categories were defined based on two criteria: the specific technical means required for harvesting and transport and the uniformity of operational parameters during forest operations. Ultimately, 13 categories were defined (Table 1), each characterized by invariant machine operational parameters.
The second category refers to the type of cutting treatment. Given the range of machine sizes and technical capabilities, forest subcompartments were classified by treatment type to establish the suitability of specific machinery for each location.
To determine accessibility for specific machinery groups, four cutting treatments were defined based on silvicultural conditions and stand age:
  • CC: Clear-cutting (I) and group clear-cutting (IIIa) in stands exceeding 80 years;
  • PC (partial cutting): Shelterwood cuttings (II), group shelterwood cuttings (IIIb), irregular shelterwood cuttings (IV), and selection cuttings (V) in stands exceeding 80 years;
  • CT: Commercial thinning in stands aged 40 to 80 years;
  • ET: Early thinning in stands aged 30 to 40 years.
The classification of wood assortments and cutting treatments enables the exclusion of specific machinery from unsuitable operations. For example, large-scale harvesters may be excluded during early thinning (ET), while forwarders can be specifically assigned to the extraction of short-wood or log-length timber. This approach also allows for the assignment of differentiated operational parameters based on the assortment type, such as adjusting the forwarder load capacity depending on whether short-wood or logs are being transported. Furthermore, the integration of spatial data—specifically the geographic coordinates of cutting area centroids and potential wood yards—facilitates the precise modeling of skid trails.

2.2.2. Machinery and Transport Vehicles

Based on a comprehensive data analysis, 23 distinct machinery groups were identified for all wood supply chain operations. These groups were classified through a multi-criteria analysis considering operational characteristics, machine type, engine power, and physical dimensions. Detailed specifications are provided in Table 2.
Four categories of harvesting equipment were identified: chainsaws and three classes of harvesters, categorized by engine power based on current market specifications. Small harvesters (<70 kW) are designated for thinning operations, medium harvesters (70–140 kW) for both thinning and final felling (CC or PC), and large harvesters (>140 kW) exclusively for final felling. The primary transportation process is divided into two methods: forwarding (utilizing forwarders and agricultural tractors with trailers for short-wood and log-length timber) and skidding (utilizing skidders for semi-suspended transport of long-length timber). Forwarders and tractors are classified into three groups by load capacity: small (<10 t), medium (10–15 t), and large (>15 t). Skidders are categorized into two power classes: small (≤80 kW) and large (>80 kW). Regarding wood chipping, two distinct methodologies are modeled: self-propelled chippers operating within the stand and mobile chippers processing material at wood yards. Finally, five categories of heavy-duty timber transport vehicles (Gross Vehicle Weight approx. 40 Mg) were identified, including both diesel and electric variants. These transport sets consist of a truck and trailer, where only the primary vehicle is equipped with a hydraulic loader crane.
Technical and operational parameters were defined for each machinery and vehicle group, allowing for the adaptation of parameter values to specific site conditions and task requirements. These predefined datasets enable the calculation of key performance indicators (KPIs), including operational metrics (cycle time, service life, productivity, and fuel consumption) and economic indicators (depreciation, operating costs, and environmental impact costs). Furthermore, assigning unique identifiers to discrete machinery groups facilitates the implementation of operational constraints and access restrictions for specific cutting treatments.

2.2.3. Road Network and Wood Yards

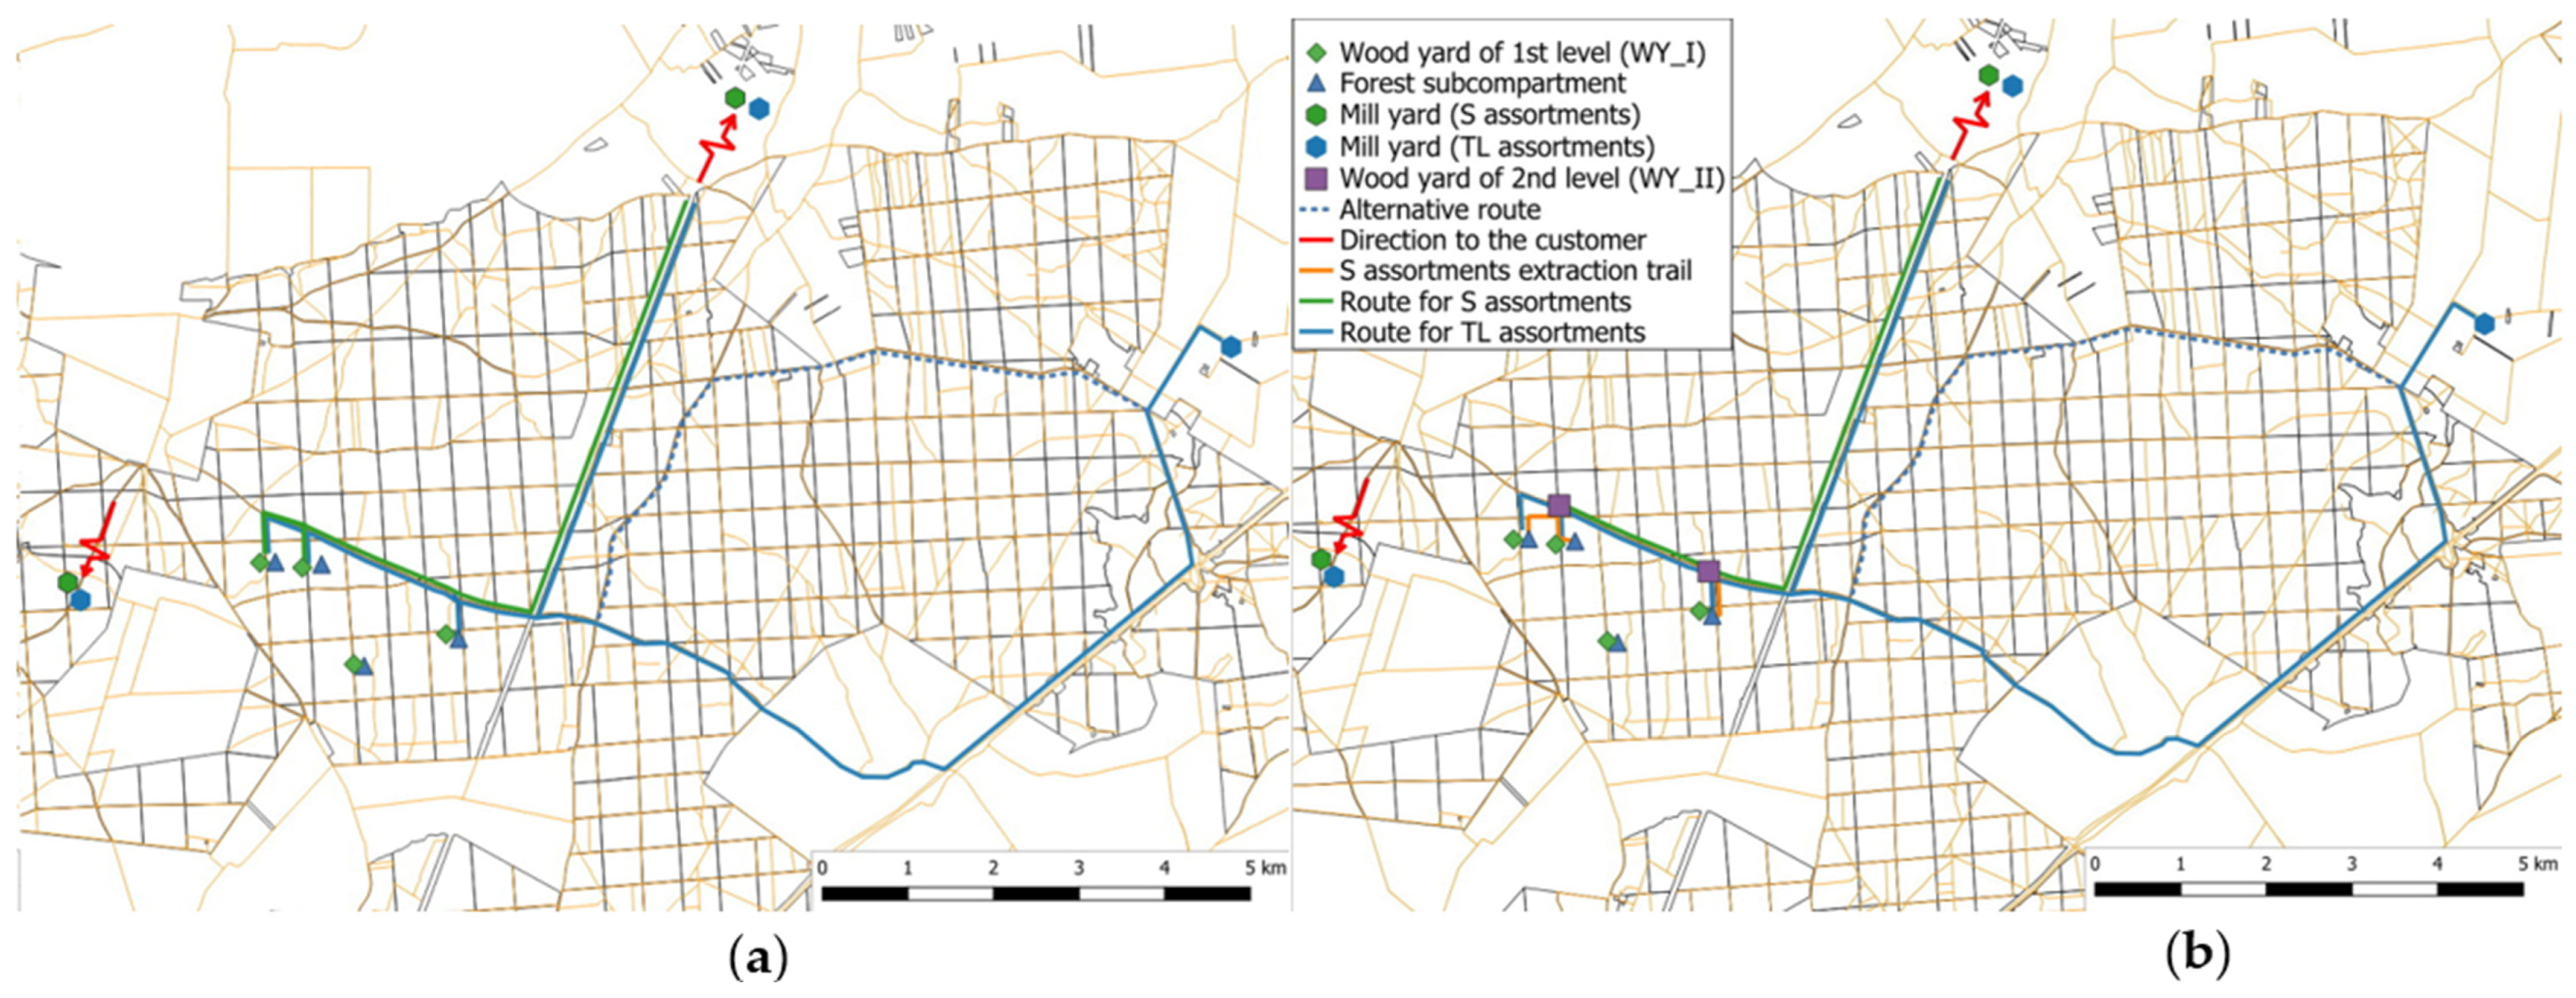
Integrated with existing and potential wood storage and transshipment yards, the road network constitutes a fundamental component of the modeled system. Timber transport is divided into two primary phases, spanning from the harvest site to the end user. The first phase, timber extraction, involves transporting assortments from the felling area to a wood yard accessible to high-capacity transport vehicles. This process occurs either entirely within the forest stand or along dedicated forest access roads. In the first case, the truck enters a designated route to collect timber positioned at a landing (wood yard of the 1st level), hereafter denoted as point WY_I. Timber extraction to point WY_I can be performed by various tractor types, with movement occurring exclusively on the forest soil to prevent road infrastructure damage. Point WY_I is situated on the forest road adjacent to the felling area (Figure 2).
In the second case, the wood yard is located at the junction of the logging road and the nearest local road, identified as a second-level wood yard (WY_II). Timber transport to this point is restricted exclusively to forwarders to prevent soil and track degradation associated with log skidding. Although this configuration may extend the extraction distance, it facilitates better access for high-capacity haulage vehicles. Figure 2 illustrates the proposed locations for the described wood yards.
The subsequent stage involves timber transportation to the wood processing plant. The road network used for the analysis is based on the Target Road Network of each forest district. To enhance the model’s realism, haulage roads were classified into three categories: forest roads, local roads, and main roads. Specific operational parameters were then defined for each category.
The model further incorporates terminals (WY_III) that serve as strategic accumulation depots within the haulage network. At these locations, timber delivered from WY_I and WY_II is consolidated and transferred to other transport modes to meet specific delivery requirements. This category includes rail transport, requiring WY_III points to be positioned adjacent to railway sidings. In the case of highly fragmented forest areas, these hubs are located at major transport junctions.

2.2.4. Customers

The final link in the wood supply chain consists of buyers, a group characterized by significant diversity in purchase volumes. While many companies acquire less than 1000 m3 annually, more than a dozen entities order over 1,000,000 m3 per year. Logistical analysis indicates that timber processing plants are distributed relatively uniformly across the country, without distinct regional concentrations. Consequently, large-scale procurement necessitates sourcing raw materials nationwide, whereas small-scale buyers typically rely on suppliers from neighboring forest districts.
Within the simulation model, the following attributes were assigned to wood buyers:
  • Location—defined by the postal code of the processing plant’s municipality to ensure data anonymization;
  • Order volume—the quantity of specific timber assortments requested over a five-year financial horizon;
  • Wood location—the specific forest compartment addresses from which individual assortments are sourced.
The simulation covers the five-year period through sequential annual iterations. This framework allows for the evaluation of various technological and organizational strategies to satisfy customer demand, which is defined as the five-year historical average. The solutions are proposed with the aim of optimizing the supply chain across these consecutive timeframes.

2.3. Simulation Scenarios

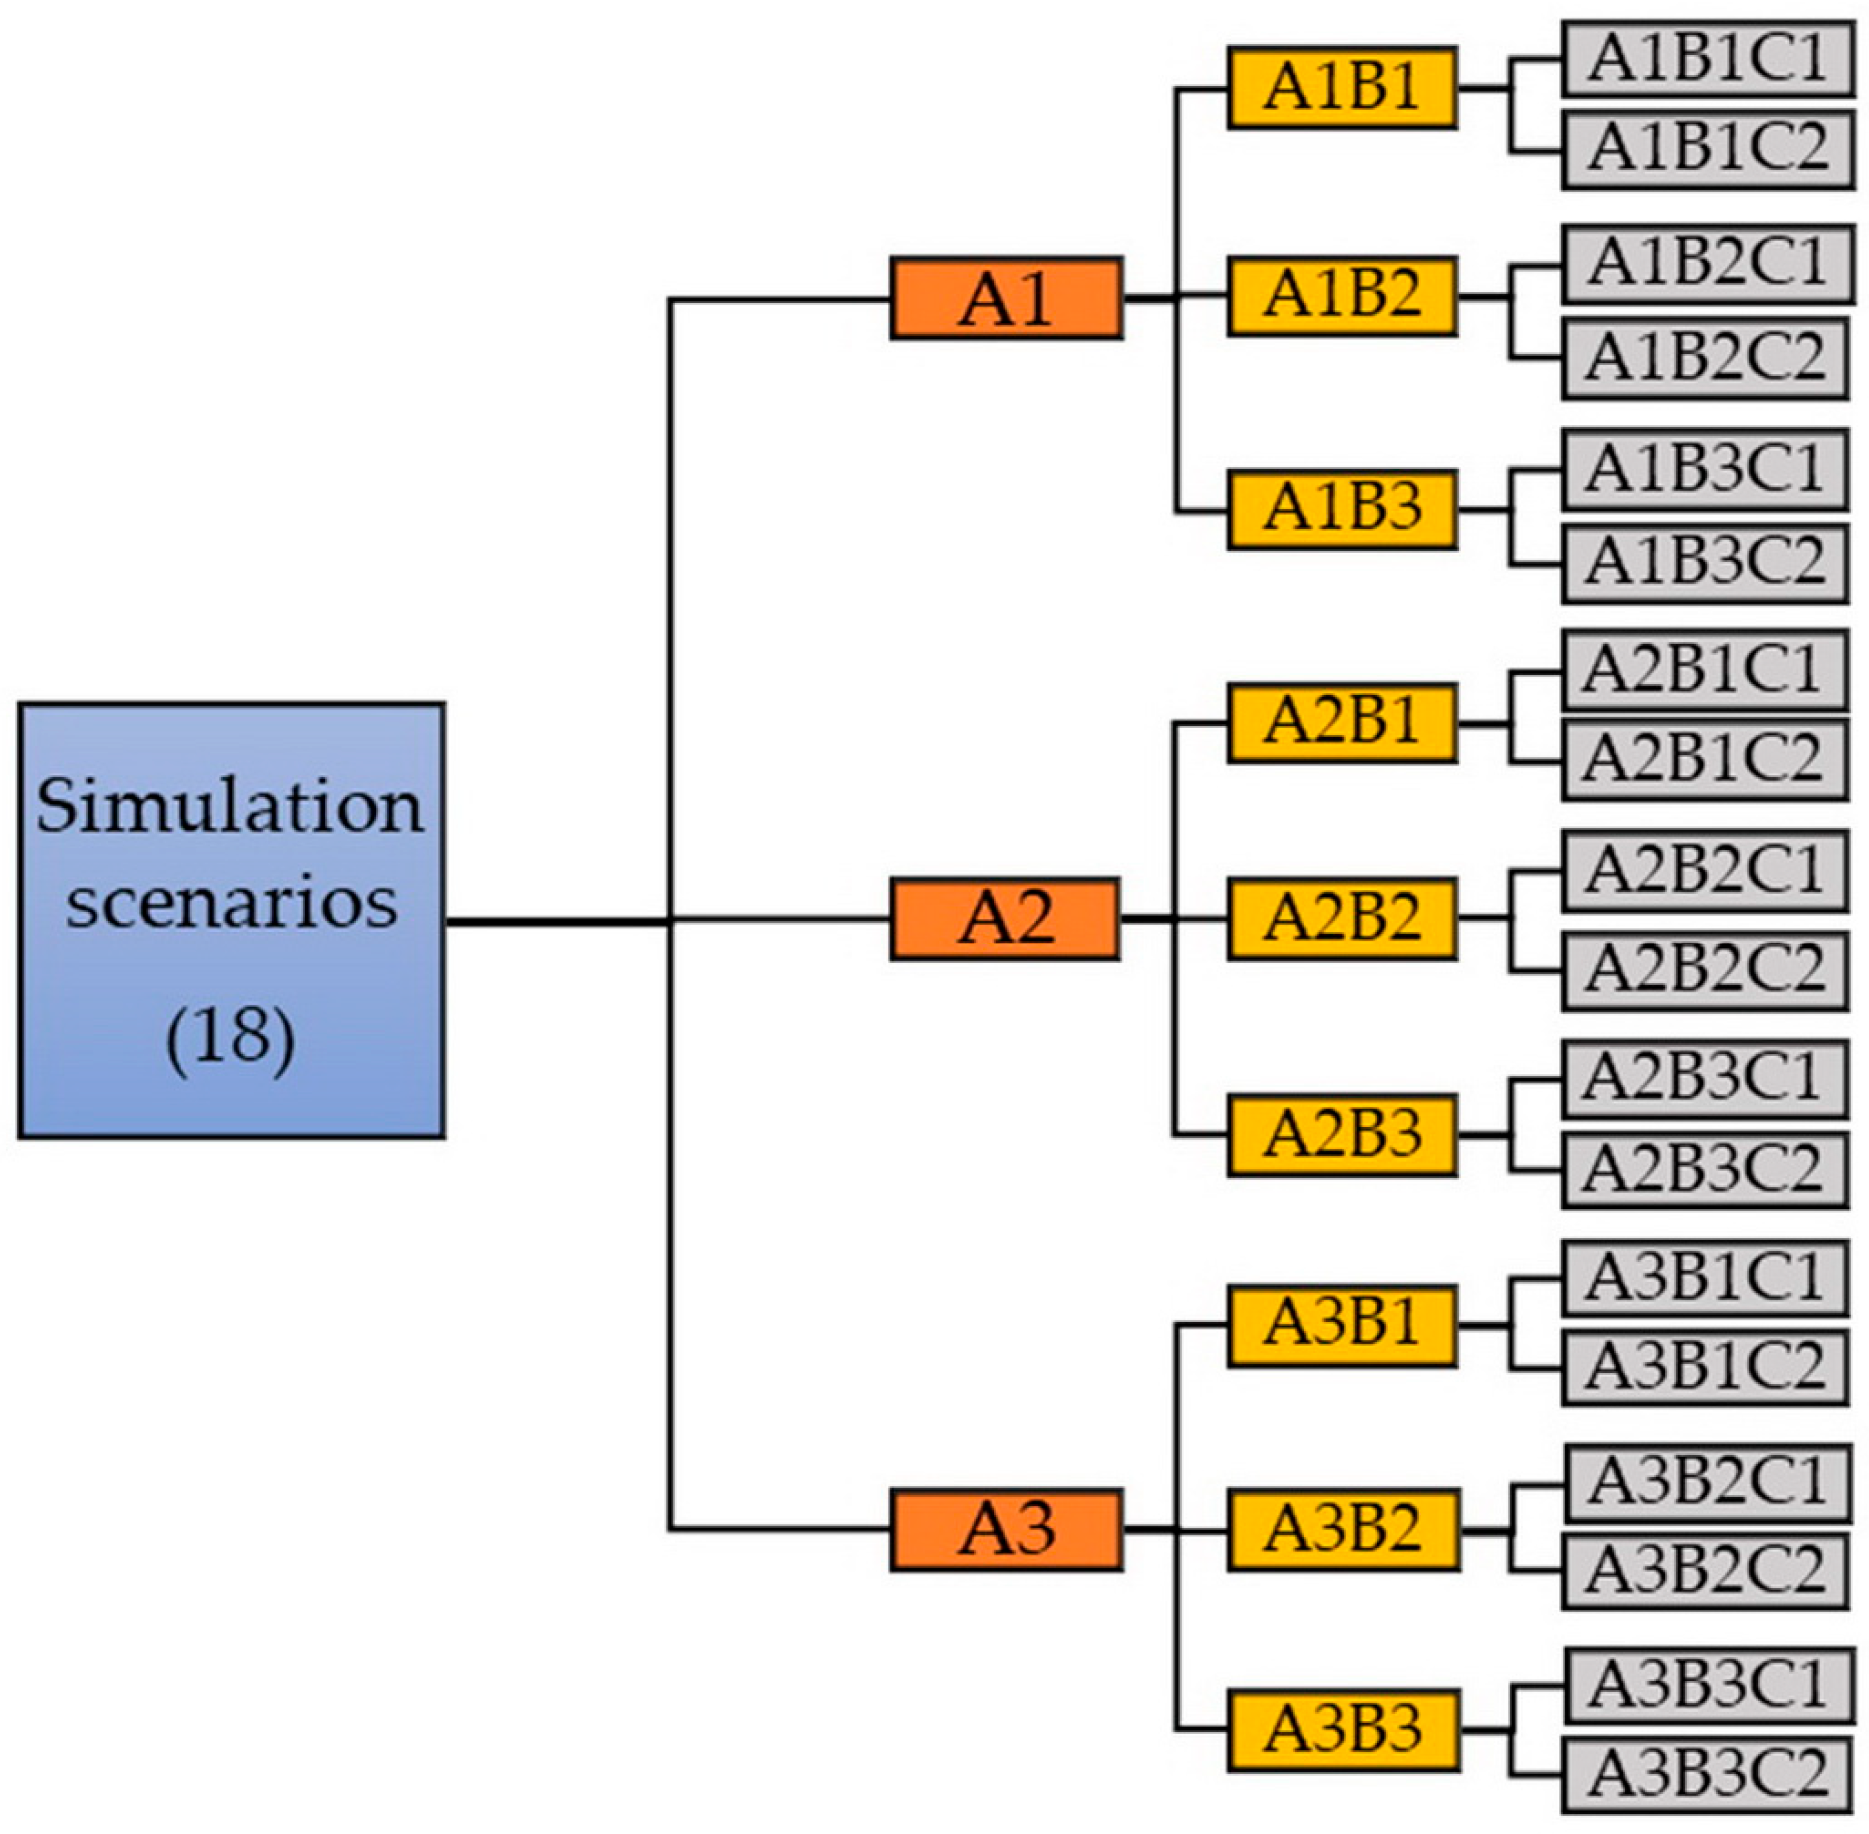
The simulation experiments comprise eighteen distinct scenarios (Figure 3). For each case, process parameters are calculated by accounting for the full range of available machinery and their operational capabilities. The simulation scenarios are structured into three levels: A, B, and C.
At Level A, wood from different wood yards is allocated to specific customers. The baseline scenario (A1) replicates the historical business-as-usual (BAU) conditions, utilizing data provided by the State Forests (PGL LP). This dataset includes precise information on harvesting (assortment types, volumes, and locations) and actual customer demand (assortment types and quantities). Optimal routing is determined based on the coordinates of each wood yard, with the objective of minimizing either travel distance or transport time along the road network. These routing calculations are executed using algorithms from the Network Analyst expansion of the ArcGIS Pro 3.4.0 environment [64].
The second scenario, A2, introduces an alternative allocation of wood from different wood yards to recipients, ensuring a full balance between supply and demand across all product ranges. In this case, the allocation and resulting truck routes are determined based on the minimum total transport effort, serving as the primary optimization indicator.
The alternative scenario, A3, introduces the concept of spatial harvesting concentration, defined as the reallocation of harvesting activities across years to minimize spatial dispersion while maintaining overall harvest volumes. To operationalize the concentration concept, forest compartments are aggregated into predefined spatial clusters (zones). The number of zones corresponds to the number of analyzed years, with each zone representing one operational year in the concentrated scenario.
The clustering procedure is implemented using the Build Balanced Zones algorithm (ArcGIS Pro 3.4.0), with total harvesting volume as the balancing criterion. Due to the stochastic nature of the algorithm, multiple clustering realizations were generated for each forest district, and the final configuration can be selected based on spatial coherence and expert evaluation. In a subsequent step, the model was extended so that it could adjust to the distribution of assortments for each year, ensuring that the composition of harvested wood remained consistent across years. This introduced an additional constraint to the spatial optimization problem, effectively transforming it into a multi-criteria allocation task combining spatial proximity and supply structure stability.
Transport effort was approximated using the total length of routes connecting all points within a given set. Forest subcompartments were represented as point features (centroids). The analysis employed a routing procedure to determine the shortest possible connections between points, assuming Euclidean distances. Although the forest road network was prepared and integrated into the GIS environment, it was not explicitly used in distance calculations to ensure comparability and to provide a lower-bound estimate of transport effort.
Level B evaluates different configurations of wood yards. Variant B1 assumes that all assortments are delivered to WY_I yards by either skidding or forwarding. In contrast, variant B2 differentiates the delivery points based on assortment type: long timber is moved to WY_I, while short-wood and logs are forwarded to WY_II. The spatial representation of these logistics chains (B1 and B2) is provided in Figure 1, where red lines delineate the initial transport phase for B1, and blue lines represent B2. In the latter, solid and dotted blue lines distinguish between road haulage and skidding to WY_II, respectively. Variant B3 introduces WY_III yards as strategic hubs for wood accumulation, aimed at optimizing long-distance transport and industrial processing.
Level C evaluates two operational strategies for machinery management. In scenario C1—the most common in Poland—machines are relocated to a designated base (e.g., the forest district office) at the end of each daily shift. From there, they either return to the previous task or proceed to the next assignment. Conversely, in scenario C2, machines remain at the harvesting site until the task is completed, after which they are moved directly to the next work area.

2.4. Model and Algorithm Description

The primary objective of the developed model is to determine the total costs associated with wood harvesting and its delivery to end customers. By adopting a comprehensive approach, the model accounts for the environmental impact of the machinery employed.
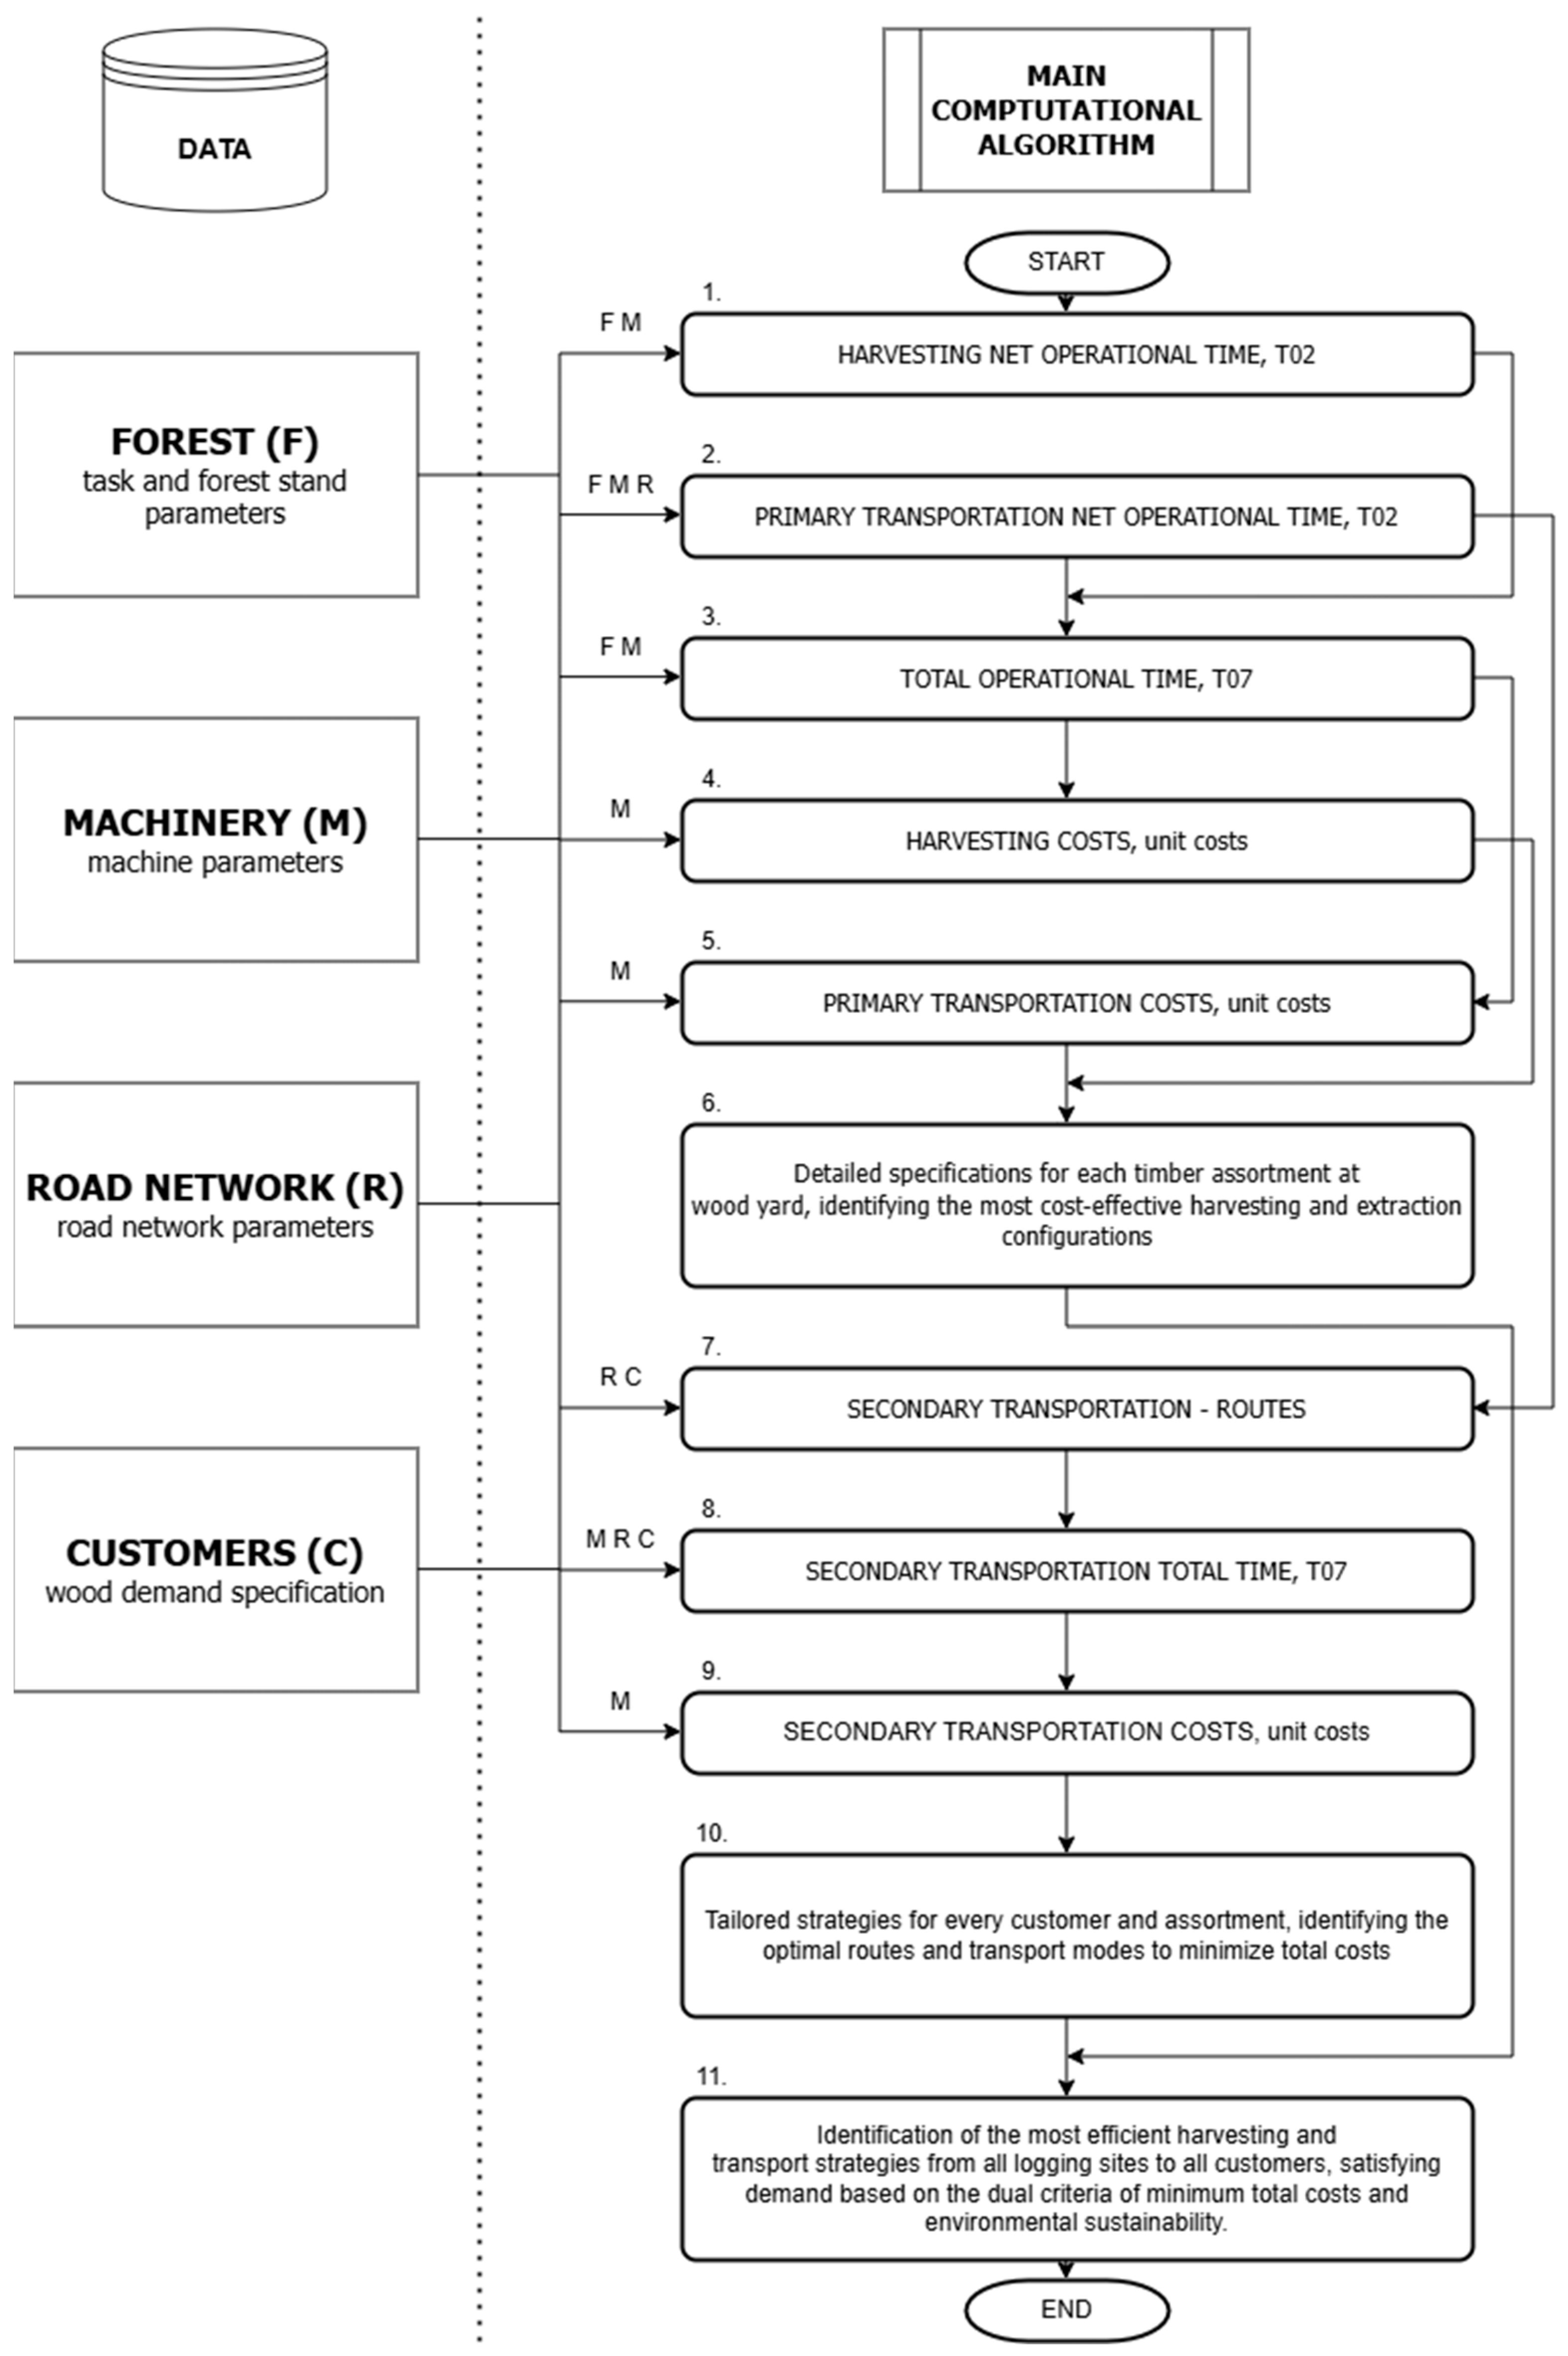
The schema of the main computational algorithm is shown in Figure 4. In addition to the calculation flow diagram on the right, the drawing also shows the data sets necessary to perform the calculations. The source data was divided into four sets: Forest (F), Machinery (M), Road Network (R), and Customers (C). The lines connecting the data sets to subsequent blocks of the algorithm are marked with appropriate letters, which indicate from which set the data is taken in a specific calculation step.

Description of the Main Computational Algorithm

The complete set of simulation calculations, according to the scheme in Figure 3, is carried out sequentially for the next indicated economic areas, separately in subsequent years from the selected range. For all customers, assortments, forest areas, machinery, and roads were included within the simulation scope, accounting for specific sites and stand conditions.
In the algorithm description below, the numbering of the subsequent steps described corresponds to the numbering of the calculation blocks shown in Figure 4.
  • HARVESTING NET OPERATIONAL TIME (step 1)
The harvester operational time (T02) is calculated for each task (assortment of wood in the forest plot) as the quotient of the volume of the harvested assortment (Vs) and the operational efficiency (P).
  • PRIMARY TRANSPORTATION NET OPERATIONAL TIME (step 2)
The productivity of the extraction equipment cannot be predefined in the ‘MACHINERY’ database, as it is a function of the skidding or forwarding distance. Nevertheless, the database provides specific parameters for machine speed across forest terrain and the time required for loading to full capacity. Consequently, the actual productivity (Pex) is calculated based on the following:
P e x   =   V s T 1   +   2 · l e x v e x m 3 · h 1
where
  • Vs—Volume of extracted assortment, m3;
  • T1—Time of loading, h;
  • lex—Extraction distance, km;
  • vex—Speed in forest area, km·h−1.
The extraction distance was determined based on the coordinates of wood yards (WYs) and the centroid of the harvested subcompartment. This method calculates the Euclidean distance (the shortest line) between the points of interest. To ensure a more realistic representation of machine movement, it was assumed that the skidder travels along the legs of a right-angled triangle, where the hypotenuse represents the direct distance between the loading point and the compartment centroid. Considering the standard dimensions of forest compartments in Poland (400 m × 600 m) and applying geometric principles, the extraction distance is calculated as follows:
l e   =   5 13 · l x y
l e     1.39 · l x y
where
  • le—Extraction distance, km;
  • lxy—Distance between the centroid of the subcompartment and the coordinates of the wood yard, km.
Thus, the calculation module will assign operational time T02 to each assortment harvested from a given subcompartment to the wood yard for each applicable extraction machinery.
  • TOTAL OPERATIONAL TIME (step 3)
Operational running time alone is insufficient for accurately determining machinery operating costs. It is necessary to calculate the total operating time (T07) as well as the shift time utilization factor (k07). These calculations account for the spatial distribution of individual forest areas (harvesting and extraction sites derived from the ‘FOREST’ database), the distances between them, and the overall work organization. Furthermore, the calculation of the coefficient integrates non-productive breaks occurring throughout the shift.
Total operational time for tasks performed within the forest district (T07) is determined using the following formula:
T 07   =   T 02   +   T 6   +   T 5 h
where
  • T6—Total inter-site travel time, h;
  • T5—Total downtime (machine maintenance and personal needs), h.
The time utilization coefficient (k07) is determined using the following formula:
k 07   =   T 02 / T 07
where
  • T02—Net operational time for tasks performed within the forest district, h;
  • T07—Total operational time for tasks performed within the forest district, h.
  • HARVESTING, PRIMARY TRANSPORTATION COSTS (steps 4–6)
Following the calculation of operational times for individual tasks and the k07 coefficient, the system determines the harvesting and extraction costs per cubic meter for each assortment within a specific forest area. The necessary parameter values are retrieved from the ‘MACHINERY’ database. The first step involves calculating the hourly operating costs for each machine (Ch):
C h   =   C h r   +   C h p   +   C h a   +   C h c o 2 e q E U R · h 1
where
  • Chr—Hourly labor costs, EUR·h−1;
  • Chp—Hourly cost of fuel and consumables, EUR·h−1;
  • Cha—Hourly depreciation and repair costs, EUR·h−1;
  • Chco2eq—Hourly GHG emission charge, EUR·h−1.
noting that
C h p   =   1   +   α h o · g m · c p E U R · h 1
where
  • cp—Fuel price, EUR·dm−3;
  • gm—Hourly fuel consumption, dm3·h−1;
  • αho—Consumables cost factor.
C h a   =   1   +   α h n · c m N y a · N h a E U R · h 1
where
  • cm—Initial investment cost, EUR;
  • Nya—Depreciation period, year;
  • Nha—Annual working time, h·year−1;
  • αhn—Maintenance cost coefficient.
C h c o 2 e q   =   g c o 2 e q · g m · c c o 2 1000 E U R · h 1
where
  • gco2eq—CO2eq emissions per liter of fuel, kg·dm−3;
  • gm—Hourly fuel consumption, dm3·h−1;
  • cco2—CO2 price, EUR·Mg−1.
The second step involves calculating the unit costs of harvesting and extracting, based on hourly operating costs and machine productivity within a given subcompartment:
C m 3   =   C h P · k 07     ( E U R m 3 )
where
  • P—Machine productivity, m3·h−1;
  • k07—Coefficient of utilization of scheduled machine time.
As a result of the calculations, harvesting and extracting costs for all applicable machinery are assigned to each cubic meter of timber stored at the wood yard. At this stage, it is necessary to aggregate the harvesting and extracting costs for all possible machine combinations.
In the next step, from among all possible technological combinations of harvesting and extraction, the combination with the lowest implementation costs is selected for each assortment in each wood yard. For the indicated (with minimal implementation costs) combination of harvesting and extraction, the share of environmental costs is calculated ( C h c o 2 e q ).
  • SECONDARY TRANSPORTATION ROUTES DETERMINATION (step 7)
In this step, routes connecting wood yards with wood recipients are designated. For this purpose, information on wood yards, generated by the PRIMARY TRANSPORT module, is used. This dataset contains wood yard locations (WY_I and/or WY_II and WY_III according to the simulation variants) integrated with the road network and volumes of stored assortments. We also use the CUSTOMERS dataset, which contains information regarding customers—including their locations linked to a digital map of the road network, and a list of the quantities of required assortments.
The algorithm utilizes a dataset that assigns each assortment and quantity from each wood yard to a specific customer based on historical data. An alternative assignment of assortments, including the optimization of transport routes, was implemented using Mixed-Integer Linear Programming (MILP), specifically the PuLP library within the Python 3.13 programming environment.
The objective function is to minimize the total transport work for each assortment— W t   ( m 3 k m ) :
W t   =   c i j x i j
where
  • i—Wood yard ID;
  • j—Customer ID;
  • cij—Transport distance of assortment from wood yard (i) to customer (j);
  • xij—Volume of assortment transported from wood yard (i) to customer (j).
Wood quantities on the supply side (wood yards) and demand side (customers) are balanced by assortments:
x i   =   x j
For each wood yard (i) and assortment (k), the volume of transported wood must equal the total stored volume:
x i k   =   x i j k
Similarly, the quantity of a given assortment delivered to a specific recipient must equal the stated demand:
x j k   =   x i j k
Both wood quantity (xijk) and transport distance (cijk) are restricted to non-negative values.
The resulting tables are specific to the assumed simulation variants and ensure that the assortments in the wood yards are balanced against customer requirements. In addition to the quantitative assignment of assortments, the tables include information linked to the road network. This integration enables determination of the transport routes and, consequently, the calculation of transport distance, classified by road category. Calculations are performed iteratively for every possible combination of transport vehicles, with results computed for each wood yard-recipient connection across all involved assortments.
  • SECONDARY TRANSPORTATION TOTAL TIME (step 8)
Based on the aforementioned data and vehicle speed determined for each road category (MACHINERY database), the average vehicle speed for the route connecting a specific wood yard with a designated customer, vtr (km·h−1), is calculated for each vehicle. This is determined as a weighted average, where the weights are the lengths of the different road categories along the itinerary. After calculating the average speed, for each vehicle the operational driving time (T02) needed to transport timber from each wood yard to each recipient is calculated.
The total driving time (T07) is calculated in the same way as for other machines, using Equation (4). T6, in this case, is the time of travel from the base and return to the base. The shift time utilization factor is calculated using Equation (5).
For designated routes, operational productivity (Pp) is also calculated for each vehicle.
P p   =   V s · v t r l t m 3 · h 1
where
  • Vs—Transported volume of a given assortment, m3;
  • lt—Transport distance, km.
  • SECONDARY TRANSPORT COSTS (steps 9 and 10)
First, hourly fuel consumption (gm) is calculated. Fuel consumption for transport vehicles is stored in the MACHINES database as distance-related fuel consumption (gp):
g m   =   g p · v t r     ( d m 3 h 1 )
where
  • gp—Distance-related fuel consumption, dm3·km−1;
  • vtr—Average vehicle speed on a given route, km·h−1.
The hourly operating cost of the vehicle, Ch (EUR·h−1), can then be calculated using Equations (6)–(9).
Subsequently, the unit cost of transport is determined:
C t m 3   =   C h P p E U R · m 3
The operational productivity Pp and average travel speed are calculated iteratively in the SECONDARY TRANSPORT TOTAL TIME module.
  • OPTIMAL NETWORK OF SECONDARY TRANSPORT FLOWS (step 11)
As a result of the calculations performed in steps 7, 8 and 9, a description of the transport system with the lowest total costs of transporting all assortments from all depots to all recipients (Ct) is created; this solution ensures that the needs of recipients are met and that these needs are balanced with the volume and structure of timber harvested.
  • THE MOST COST-EFFICIENT WOOD HARVESTING AND TRANSPORTATION SYSTEM (step 12)
The aggregate unit costs of harvesting and primary and secondary transportation (TC) are employed to evaluate 18 improvement scenarios within the wood supply chain (Figure 3).
The total unit cost of the process (TC) comprises three distinct components:
T C   =   C h m 3   +   C e m 3   +   C t m 3   E U R · m 3
where
  • Chm3—Unit harvesting cost, EUR·m−3;
  • Cem3—Unit extraction cost, EUR·m−3;
  • Ctm3—Unit transport cost, EUR·m−3.
The best solutions will be identified based on those indicators.
A comparative analysis of the total economic effects across the proposed simulation variants can be conducted to determine the process’s sensitivity to specific input variables. Sensitivity is expressed as the percentage change in supply chain costs, using variant A1B1C1 (Figure 3) as the reference. The baseline costs were calculated based on actual harvesting and customer data obtained from PGL LP.

3. Results

To evaluate the simulation model’s performance and verify its sensitivity to changes in input parameter values, a series of computational experiments was conducted. The calculations were based on timber harvesting data from a single year, sourced from one of the regional directorates of the State Forests in 2023. In accordance with the methodology, the analysis is presented as a case study and carried out for two wood yard configurations (B1 and B2) and two operational equipment management scenarios (C1 and C2). To assess the model’s response, certain operational parameters of the machinery were modified. This adjustment applied exclusively to primary transportation equipment. Depending on the scenario, the travel speeds and loading and unloading times of the machines were adjusted. These values are presented in Table 3 and Table 4.
The machine travel speeds in variants S2 and S3 were reduced across all machines covered by the model. The same speed values were selected for these variants to modify the loading and unloading times in variant S3 and to verify the model’s response.
According to the model assumptions, reducing the machine travel speed should increase travel times and, consequently, decrease operational efficiency and the value of the k07 coefficient. As a result, we expect a decline in machine operating performance and an increase in operational costs.
Reducing loading times for forwarders increases operational efficiency, resulting in higher operating performance and lower operational extraction costs. In the case of skidders, loading times increased, which should reduce operational efficiency.
Based on the simulation model results, the machine combinations that minimized the total harvesting and primary transportation cost per 1 m3 of timber for a given management task were selected from all available options. These results are presented in Table 5 and Table 6. Regarding harvesting productivity, the results remain identical across all variants because neither speed nor time was modified during this process. For primary transportation, as expected, productivity decreased in all cases under variant S2 compared with S1. This led to an increase in primary transportation costs for S2 relative to S1 (Table 6). Furthermore, a comparison between S2 and S3 reveals that consistently adjusting the loading and unloading times reliably increased productivity in S3. This indicates that skidders represent a minority share in the minimum-cost variants, particularly because the reduction in forwarder loading times was relatively small compared with the substantial increase in skidder loading times.
However, machine productivity did not recover to S1 levels. The reduction in travel speed elicited a stronger negative response than the positive impact of the adjusted loading and unloading times.
Table 6 also provides the average environmental cost values and shares. In each case, environmental costs accounted for approximately 3% of the total costs. A slight increase in the share of environmental costs is noticeable in S2. This is associated with longer machine travel times, which consequently increase carbon dioxide emissions during this operational phase. Conversely, reducing the loading and unloading times decreased this share, in some cases dropping below the values obtained in S1.
The simulation experiment results confirm that the model’s outputs respond correctly to changes in the input parameters. Both reductions in machine travel speeds and adjustments to loading and unloading times produced the expected effects. Specifically, a decrease in the k07 coefficient and in operating performance was observed when speeds were modified, whereas an increase in operating performance occurred following modifications to loading/unloading times. As anticipated, this translated directly into changes in harvesting and primary transportation costs. The validity of the model and its input parameter values is further confirmed by the consistent share of environmental costs within the total costs. Finally, a valuable conclusion from these experiments is the identification of machines that, due to the lowest costs, should be most frequently used in timber harvesting and felling. This information can provide valuable guidance for investors and forestry business owners.

4. Discussion

The main contribution of this study lies in the development of an integrated simulation-based framework capable of representing the main operational stages of the wood supply chain within a single analytical environment. Unlike approaches focusing exclusively on individual operational processes, the proposed framework enables the assessment of interactions between different supply chain components and supports the evaluation of alternative organizational and technological scenarios at the system level. Similar benefits of integrated planning approaches have been reported in studies combining harvest planning, transportation, and wood processing decisions within coordinated wood supply chain systems [65,66]. Such a holistic perspective is essential for sustainable wood supply chain management, where economic efficiency, operational feasibility, and environmental performance must be considered simultaneously [67].
This model merges the transport operations with the raw material procurement stage and is specifically calibrated to handle large-scale task sets and high-volume transport flows. Driven by this specific modeling objective, the mathematical description of the timber harvesting phase intentionally limits the differentiation of machine and forest site characteristics. Instead, priority is given to the precise spatial mapping of wood yards—and consequently, primary transportation distances—as well as the structural organization of harvesting operations, including task sequencing and the dynamic positioning of machine bases.
The case study presented in this paper primarily serves as a validation and sensitivity analysis exercise, assessing the responsiveness and internal consistency of a major part of the proposed model under controlled changes in operational parameters. The results provide important insights into the behavior of the system under varying technological conditions and demonstrate the potential of the model as a decision support tool for evaluating alternative harvesting and extraction strategies.
More specifically, the findings highlight several interactions between machine productivity, operational costs, and environmental performance. The comparison of scenarios including modified speed and loading/unloading time parameters of primary transportation further demonstrated that improvements in loading and unloading performance can partially compensate for productivity losses caused by reduced travel speeds. However, productivity levels remained below those observed in the baseline scenario. This finding suggests that, under the analyzed operational conditions, travel-related parameters exert a stronger influence on overall system performance than moderate changes in loading and unloading operations.
An additional observation concerns the composition of machine systems selected by the optimization procedure. Despite longer loading and unloading times, the increase in extraction productivity suggests that skidders played a relatively minor role in the cost-optimal solutions generated by the model. Instead, forwarder-based systems appear to dominate the selected harvesting configurations.
Particular attention should be paid to the environmental cost component. The average emission value obtained for harvesting and primary transportation operations (7.83 kg CO2 eq m−3) was higher than most of the values reported by Kärhä et al. [68] for different harvesting treatments in Finland (4.46–8.18 kg CO2 eq m−3), with the exception of first thinning operations (8.18 kg CO2 eq m−3). Similarly, Kühmaier et al. [42] reported emissions ranging from 0.26 to 3.40 kg CO2 eq m−3 for comparable harvesting methods and from 2.04 to 7.91 kg CO2 eq m−3 for comparable primary transportation methods in Austria. Therefore, the emission level obtained in this study is located in the upper range of values reported in the cited literature. This may be attributed to lower productivity, more fragmented forest complexes, and longer forwarding distances, all of which tend to increase fuel consumption per cubic meter of harvested timber.
Across all analyzed scenarios, environmental costs represented approximately 3% of total costs. While this share remained small compared with the operational cost categories, environmental costs consistently responded to changes in machine productivity and operating time. The slight increase in environmental costs observed in the case of reduced machine speed can be explained by longer machine operating times and the associated increase in fuel consumption and carbon dioxide emissions.
Although the numerical results refer to a specific regional dataset and a limited set of experimental scenarios, they provide important evidence regarding the validity of the modeling framework and its ability to represent relationships occurring within forest supply chains. In this respect, the results provide evidence that the model reproduces expected cause-and-effect relationships and can successfully evaluate the consequences of changes in key operational parameters. Overall, the results provide support for the methodological foundations of the proposed framework and confirm its potential as a decision support tool for analyzing alternative operational scenarios in wood supply chains. Consequently, the framework represents a significant step towards addressing the need for integrated modeling approaches capable of supporting operationally relevant planning and optimization of wood supply chains, particularly under the specific organizational conditions of the Polish forestry sector.
Despite the advantages of the proposed framework, several limitations should be acknowledged. The modeling approach necessarily relies on simplifications of the real wood harvesting and logistics processes. In practice, the efficiency of the supply chain is influenced by a wide range of factors, including terrain conditions, stand characteristics, seasonality, machine productivity differences, and market fluctuations. Due to the complexity and scale of the system, it was not possible to explicitly incorporate all these variables into the current model structure.
Furthermore, the framework assumes relatively stable operational parameters, such as average machine productivity, standardized transport costs, and typical operational conditions. In the field, these parameters may vary significantly depending on local conditions and temporal factors. The model also does not fully capture short-term operational disruptions, such as extreme weather conditions, road accessibility constraints, or sudden changes in industrial demand.
Another limitation relates to the spatial and organizational assumptions adopted for the improvement of scenarios. For example, the implementation of a three-level wood yard network or the aggregation of harvesting tasks may require organizational adjustments, infrastructure investments, and coordination between multiple stakeholders. Therefore, while the model allows the evaluation of potential efficiency gains, the practical feasibility of implementing certain solutions may depend on institutional, logistical, or economic constraints that are not fully captured in the analytical framework.

5. Conclusions

This study presents the first methodological framework for evaluating the efficiency of the wood supply chain in Poland at a large scale. The proposed framework integrates the main stages of the supply chain—harvesting, skidding, extraction, chipping, and transportation of raw material to wood processing plants—within a single analytical structure. This approach allows for a comprehensive assessment of both economic and environmental performance. By combining cost calculations with carbon footprint estimation, the proposed methodology enables the identification of operational scenarios that are efficient not only in economic terms, but also from an environmental perspective.
The literature analysis enabled the identification of improvement scenarios based on coordinated actions at the strategic, tactical, and operational planning levels. At the strategic level, one of the most important improvements concerns the better allocation of wooden raw material to customers in order to minimize transportation distances. Since transport constitutes a substantial share of total costs and emissions in the wood supply chain, optimizing delivery allocation can considerably improve overall system efficiency. Another strategic improvement involves aggregating harvesting tasks within neighboring harvesting areas. This spatial clustering of operations can reduce machine relocation distances, increase equipment utilization, and limit unnecessary fuel consumption.
At the tactical level, the development of an efficient three-level wood yard network represents a promising improvement option. The use of intermediate storage and consolidation points can enhance the organization of material flows and increase the flexibility of the supply chain. A well-designed network of wood yards may reduce transportation distances, improve coordination between harvesting operations and processing facilities, and help to stabilize the supply of raw materials to industrial customers.
Operational-level improvements address challenges specific to the organization of forest operations in Poland. In particular, the frequent relocation of machines after each working shift leads to additional costs, increased fuel consumption, and higher emissions. More effective planning and coordination of daily operations could significantly reduce these relocations and improve the overall efficiency of harvesting activities.
Consequently, the results should be interpreted as an estimate of the maximum achievable efficiency gains under a common set of assumptions rather than a direct operational solution. Nevertheless, the framework provides a robust basis for further development of decision support systems and optimization models for forest supply chain management.
The model and programming method presented in this publication enabled the achievement of the research objectives of estimating the efficiency of timber harvesting and skidding unit costs, with particular emphasis on environmental costs. Validation of the model, conducted using actual input data, confirmed its validity and proper functioning, and the literature supports the obtained results.

Author Contributions

Conceptualization, T.N. and M.T.; methodology, T.N. and W.Z.; investigation, M.A., A.G., T.M. and W.K.; writing—original draft preparation, T.N., W.Z. and M.T.; writing—review and editing, T.N., W.Z., M.T., M.A., A.G., W.K., T.M. and R.W.; visualization, W.Z. and A.G.; supervision, T.N.; project administration, M.T.; funding acquisition, T.N. All authors have read and agreed to the published version of the manuscript.

Funding

This research was subsidized from the Polish state budget and granted by the Minister of Education and Science within the Program ‘Science for Society II’, Project No. NdS-II/SP/0063/2024/01, grant amount PLN 1,000,000, total project value PLN 1,000,000.

Data Availability Statement

The raw data supporting the research findings and conclusions of this article will be made available by the authors upon request. For further inquiries, please contact the corresponding author.

Conflicts of Interest

The authors declare no conflicts of interest.

Abbreviations

The following abbreviations are used in this manuscript:
Ccostumer
CCclear-cutting
CTcommercial thinning
CTLcut-to-length
ETearly thinning
Fforests
GHGsgreenhouse gases
LPlinear programming
Mmachinery
MIPmixed integer programming
PCpartial cutting
PGL LPPolish State Forests
Rroad network
RDSFRegional Directorate of the State Forests
Slogs
TLtree-length assortments
WYwood yard

References

  1. Hurmekoski, E.; Seppälä, J.; Kilpeläinen, A.; Kunttu, J. Contribution of Wood-Based Products to Climate Change Mitigation. In Forest Bioeconomy and Climate Change; Hetemäki, L., Kangas, J., Peltola, H., Eds.; Springer International Publishing: Cham, Switzerland, 2022; pp. 129–149. [Google Scholar]
  2. Imbrenda, V.; Coluzzi, R.; Mariani, F.; Nosova, B.; Cudlinova, E.; Salvia, R.; Quaranta, G.; Salvati, L.; Lanfredi, M. Working in (Slow) Progress: Socio-Environmental and Economic Dynamics in the Forestry Sector and the Contribution to Sustainable Development in Europe. Sustainability 2023, 15, 10271. [Google Scholar] [CrossRef] [Scilit]
  3. Zastocki, D.; Oktaba, J.; Lachowicz, H. Changes in the Market of Precious Wood: A Case Study of Submission System in Poland. Forests 2021, 12, 421. [Google Scholar] [CrossRef] [Scilit]
  4. Palander, T. Environmental Benefits from Improving Transportation Efficiency in Wood Procurement Systems. Transp. Res. Part D Transp. Environ. 2016, 44, 211–218. [Google Scholar] [CrossRef] [Scilit]
  5. Lundbäck, M.; Häggström, C.; Nordfjell, T. Worldwide Trends in Methods for Harvesting and Extracting Industrial Roundwood. Int. J. For. Eng. 2021, 32, 202–215. [Google Scholar] [CrossRef] [Scilit]
  6. Budniak, P. Method of forest patches generalisation based on connectivity of forest and other wooded land areas. Sylwan 2020, 164, 820–830. [Google Scholar] [CrossRef]
  7. DGLP. Decyzja nr 139 Dyrektora Generalnego Lasów Państwowych z Dnia 18 Września 2025 r. w Sprawie Parametrów Oraz Regulaminów Sprzedaży w Portalu Leśno-Drzewnym i Aplikacji Internetowej e-Drewno–Portal Leśno-Drzewny; Dyrekcja Generalna Lasów Państwowych: Warszawa, Poland, 2025.
  8. DGLP. Komunikat w Sprawie Upublicznienia Deklaracji Przedsiębiorców Dotyczących Kryteriów Pozacenowych w Sprzedaży Ofertowej na I Półrocze 2023 r.–Portal Leśno-Drzewny; Dyrekcja Generalna Lasów Państwowych: Warszawa, Poland, 2022.
  9. Nurek, T. Metoda Oceny Efektywności Maszynowego Pozyskiwania Drewna w Warunkach Lasów Polskich; Rozprawy Naukowe i Monografie; Wydawnictwo SGGW: Warszawa, Poland, 2007. [Google Scholar]
  10. Tymendorf, Ł.; Trzciński, G. Driving on forest and public roads in deliveries of large–size Scots pine wood to sawmill. Sylwan 2020, 164, 651–662. [Google Scholar] [CrossRef]
  11. Aniszewska, M.; Gendek, A.; Kędziora, W.; Moskalik, T.; Nurek, T.; Trzcianowska, M.; Wójcik, R.; Zychowicz, W. Łańcuch Dostaw w Leśnictwie. Stan Obecny i Wyzwania; Aniszewska, M., Gendek, A., Nurek, T., Trzcianowska, M., Eds.; Wydawnictwo “Inżynieria Rolnicza”: Kraków, Poland, 2025. [Google Scholar]
  12. Gruszczyński, R. Nowoczesność i zrównoważona gospodarka–nowe wyzwania dla przemysłu drzewnego Polski. In Proceedings of the Seminarium “Łańcuch Dostaw w Leśnictwie–Czy Działamy Skutecznie?”, Warszawa, Poland, 25 February 2025. [Google Scholar]
  13. Visser, R.; Spinelli, R. Determining the Shape of the Productivity Function for Mechanized Felling and Felling-Processing. J. For. Res. 2012, 17, 397–402. [Google Scholar] [CrossRef] [Scilit]
  14. Nurek, T.; Gendek, A. The impact of selected logistic factors on the efficiency and operational costs of forest machinery. Zesz. Nauk. Szk. Głównej Gospod. Wiej. W Warszawie. Ekon. I Organ. Logistyki 2016, 1, 45–55. [Google Scholar]
  15. D’Amours, S.; Rönnqvist, M.; Weintraub, A. Using Operational Research for Supply Chain Planning in the Forest Products Industry. INFOR Inf. Syst. Oper. Res. 2008, 46, 265–281. [Google Scholar] [CrossRef] [Scilit]
  16. Hirsch, P. Minimizing Empty Truck Loads in Round Timber Transport with Tabu Search Strategies. Int. J. Inf. Syst. Supply Chain Manag. 2011, 4, 15–41. [Google Scholar] [CrossRef] [Scilit]
  17. Shaffer, R.M.; Stuart, W.B. A Checklist for Efficient Log Trucking; Virginia Cooperative Extension: Blacksburg, VA, USA, 2005; Publication 420-094; pp. 1–5. [Google Scholar]
  18. Klvac, R.; Kolařík, J.; Volná, M.; Drápela, K. Fuel Consumption in Timber Haulage. Croat. J. For. Eng. 2013, 34, 229–240. [Google Scholar]
  19. Kogler, C.; Rauch, P. Discrete Event Simulation of Multimodal and Unimodal Transportation in the Wood Supply Chain: A Literature Review. Silva Fenn. 2018, 52, 9984. [Google Scholar] [CrossRef] [Scilit]
  20. Kärhä, K.; Seuri, M.; Bradley, A.; Röser, D.; Pinto, W.; Dian, W.; Pandur, Z.; Dvořák, J.; Torbjørn Jørgensen, M.; Muiste, P.; et al. Overview of Global Long-Distance Road Transportation of Industrial Roundwood. Croat. J. For. Eng. 2024, 45, 217–236. [Google Scholar]
  21. Marciniec, T.; Szkoda, M. Analysis of supply chain of wood materials. Autobusy Tech. Eksploat. Syst. Transp. 2013, 14, 1497–1506. [Google Scholar]
  22. Kusiak, W.; Molińska-Glura, M.; Sarzyńska, E.; Wanat, L. Optimization of Transport Vehicle Space-Filling in Logistics Depending on Roundwood Assortment Dimensions. Acta Sci. Pol. Silvarum Colendarum Ratio Et Ind. Lignaria 2024, 23, 141–154. [Google Scholar] [CrossRef] [Scilit]
  23. Sieniawski, W.; Trzciński, G. Analysis of Large-size and Medium-size Wood Supply. In Proceedings of the Forest Operations Research in the Nordic Baltic Region, Honne, Norway, 20–22 October 2010; Belbo, H., Ed.; Norwegian Institute of Land Inventory: Ås, Norway, 2010; pp. 56–57. [Google Scholar]
  24. Rönnqvist, M.; Svenson, G.; Ahlinder, A.; Flisberg, P.; Muhr, J. The World’s First Battery Electric Timber Truck: Analysis of the First Two Years of Operation. Int. J. For. Eng. 2026, 37, 84–95. [Google Scholar] [CrossRef] [Scilit]
  25. Vinnova TREE–TRansition to Efficient Electrified Forestry Transport. Available online: https://www.vinnova.se/en/p/tree---transition-to-efficient-electrified-forestry-transport (accessed on 4 October 2024).
  26. Lind, H. Volvo to Launch Hydrogen-Powered Trucks. Available online: https://www.volvotrucks.com/en-en/news-stories/press-releases/2024/may/Volvo-to-launch-hydrogen-powered-trucks.html (accessed on 4 October 2024).
  27. Scania Group The Silent 70-Tonne Scania Timber Truck. Available online: https://www.scania.com/group/en/home/newsroom/news/2024/The-silent-70-tonne-Scania-timber-truck.html (accessed on 4 October 2024).
  28. Anttila, P.; Väätäinen, K. Could a Terminal-Based Operating Model Reduce Greenhouse-Gas Emissions in Road Transport of Timber? Int. J. For. Eng. 2026, 37, 96–110. [Google Scholar] [CrossRef] [Scilit]
  29. Managing Timber Transport. Good Practice Guide 2014. Forest Industry Transport Group. Available online: https://teagasc.ie/wp-content/uploads/2025/05/Managing-Timber-Transport-Good-Practice-Guide-Volume-1-2014-1-4.pdf (accessed on 14 January 2026). [CrossRef] [Scilit]
  30. Bolding, M.C.; Conrad, J.L.; Eliasson, L.; Spinelli, R.; Magagnotti, N.; Miller, T.R.; Mapatunage, H. The Evolution and Expansion of Cut-to-Length Harvesting Systems Beyond Scandinavia: Challenges and Opportunities in Central and Southern Europe and North America. Curr. For. Rep. 2025, 11, 24. [Google Scholar] [CrossRef] [Scilit]
  31. Moskalik, T.; Borz, S.; Dvořák, J.; Ferenčík, M.; Glushkov, S.; Muiste, P.; Lazdiņš, A.; Styranivsky, O. Timber Harvesting Methods in Eastern European Countries: A Review. Croat. J. For. Eng. 2017, 38, 231–241. [Google Scholar]
  32. Mederski, P.S.; Karaszewski, Z.; Rosińska, M.; Bembenek, M. Dynamics of harvester fleet change in Poland and factors determining machine occurrence. Sylwan 2016, 160, 795–804. [Google Scholar] [CrossRef]
  33. Vusić, D.; Zečić, Ž.; Turk, Z. Productivity of Chainsaw Felling and Processing in Selective Forests of Croatia. In Proceedings of the 45th International Symposium on Forestry Mechanization “Forest Engineering: Concern, Knowledge and Accountability in Today’s Environment”, Dubrovnik, Croatia, 8–12 October 2012; IUFRO: Zagreb, Croatia, 2012; pp. 1–7. [Google Scholar]
  34. Kärhä, K.; Eliasson, L.; Kühmaier, M.; Spinelli, R. Fuel Consumption and CO2 Emissions in Fully Mechanized Cut-to-Length (CTL) Harvesting Operations of Industrial Roundwood: A Review. Curr. For. Rep. 2024, 10, 255–272. [Google Scholar] [CrossRef] [Scilit]
  35. Dudek, T.; Halat, K. Comparing the Productivity and Costs of Extraction of Long and Short Wood. Ann. WULS For. Wood Technol. 2023, 124, 64–76. [Google Scholar] [CrossRef] [Scilit]
  36. Nurminen, T.; Korpunen, H.; Uusitalo, J. Time Consumption Analysis of the Mechanized Cut-to-Length Harvesting System. Silva Fenn. 2006, 40, 335–363. [Google Scholar] [CrossRef] [Scilit]
  37. Ghaffariyan, M.R. An Overview of Work Productivity Evaluation of Farm Tractors in Timber Skidding Operations. Silva Balc. 2022, 23, 21–36. [Google Scholar] [CrossRef] [Scilit]
  38. Asikainen, A.; Anttila, P.; Verkerk, H.; Díaz-Yáñez, O.; Röser, D. Development of Forest Machinery and Labour in the EU in 2010–2030. In Proceedings of the Pushing the Boundaries with Research and Innovation in Forest Engineering, Graz, Austria, 9–13 October 2011; University of Natural Resources and Life Sciences: Vienna, Austria, 2011; pp. 9–13. [Google Scholar]
  39. Bodył, M. Rozmiar pozyskania maszynowego w Polsce [Volume of timber harvested by mechanized felling in Poland]. Drwal 2022, 4, 24–28. [Google Scholar]
  40. Nazari, M.; Eteghadipour, M.; Zarebanadkouki, M.; Ghorbani, M.; Dippold, M.A.; Bilyera, N.; Zamanian, K. Impacts of Logging-Associated Compaction on Forest Soils: A Meta-Analysis. Front. For. Glob. Change 2021, 4, 780074. [Google Scholar] [CrossRef] [Scilit]
  41. Lijewski, P.; Merkisz, J.; Fuć, P.; Ziółkowski, A.; Rymaniak, Ł.; Kusiak, W. Fuel Consumption and Exhaust Emissions in the Process of Mechanized Timber Extraction and Transport. Eur. J. For. Res. 2017, 136, 153–160. [Google Scholar] [CrossRef] [Scilit]
  42. Kühmaier, M.; Kral, I.; Kanzian, C. Greenhouse Gas Emissions of the Forest Supply Chain in Austria in the Year 2018. Sustainability 2022, 14, 792. [Google Scholar] [CrossRef] [Scilit]
  43. Antonić, S.; Danilović, M.; Stojnić, D.; Dražić, S. Impact of Chainsaw Power on Fuel and Oil Consumption. Sustainability 2023, 15, 2795. [Google Scholar] [CrossRef] [Scilit]
  44. Labelle, E.R.; Lemmer, K. Selected Environmental Impacts of Forest Harvesting Operations with Varying Degree of Mechanization. Croat. J. For. Eng. 2019, 40, 239–257. [Google Scholar] [CrossRef] [Scilit]
  45. Eliasson, L.; Kärhä, K.; Arlinger, J. Fuel Consumption in Logging Operations in Sweden. Int. J. For. Eng. 2023, 34, 366–372. [Google Scholar] [CrossRef] [Scilit]
  46. Öhman, K.; Eriksson, L.O. Aggregating Harvest Activities in Long Term Forest Planning by Minimizing Harvest Area Perimeters. Silva Fenn. 2010, 44, 77–89. [Google Scholar] [CrossRef] [Scilit]
  47. Pascual, A.; Pukkala, T.; de Miguel, S.; Pesonen, A.; Packalen, P. Influence of Timber Harvesting Costs on the Layout of Cuttings and Economic Return in Forest Planning Based on Dynamic Treatment Units. For. Syst. 2018, 27, e001. [Google Scholar] [CrossRef] [Scilit]
  48. Đuka, A.; Papa, I.; Proto, A.R.; Latterini, F.; Mederski, P.S.; Borz, S.A.; Iordache, E.; Sokolović, D.; Karišik, A.; Stojnić, D.; et al. Forest Accessibility and Road Network Density: A Global Overview with a Special Focus on Europe. Curr. For. Rep. 2025, 11, 26. [Google Scholar] [CrossRef] [Scilit]
  49. Augustynczik, A.L.D.; Arce, J.E.; Silva, A.C.L. Aggregating Forest Harvesting Activities in Forest Plantations through Integer Linear Programming and Goal Programming. J. For. Econ. 2016, 24, 72–81. [Google Scholar] [CrossRef] [Scilit]
  50. Smaltschinski, T.; Seeling, U.; Becker, G. Clustering Forest Harvest Stands on Spatial Networks for Optimised Harvest Scheduling. Ann. For. Sci. 2012, 69, 651–657. [Google Scholar] [CrossRef] [Scilit]
  51. Brotherton, E.; Gravel, M.-L.; Lebel, L. Améliorer La Performance d’un Réseau D’approvisionnement Forestier Par Une Meilleure Gestion de L’humidité Dans Les Cours de Transit; CIRRELT-2020-37; Université de Montréal: Montréal, QC, Canada; Université Laval: Québec, QC, Canada, 2020. [Google Scholar]
  52. Palander, T.; Väätäinen, J. Impacts of Interenterprise Collaboration and Backhauling on Wood Procurement in Finland. Scand. J. For. Res. 2005, 20, 177–183. [Google Scholar] [CrossRef] [Scilit]
  53. Sun, G.; Li, T. Optimizing Logistics in Forestry Supply Chains: A Vehicle Routing Problem Based on Carbon Emission Reduction. Forests 2025, 16, 62. [Google Scholar] [CrossRef] [Scilit]
  54. Einola, K. Prestudy of a Power Management of a Cut-To-Length Forest Harvester with a Hydraulic Hybrid System. In Proceedings of the Linköping Electronic Conference Proceedings 92:8; Linköping University Electronic Press: Linköping, Sweden, 2013; pp. 71–83. [Google Scholar]
  55. Picchio, R.; Mederski, P.S.; Tavankar, F. How and How Much, Do Harvesting Activities Affect Forest Soil, Regeneration and Stands? Curr. For. Rep. 2020, 6, 115–128. [Google Scholar] [CrossRef] [Scilit]
  56. Tuomasjukka, D.; Martire, S.; Lindner, M.; Athanassiadis, D.; Kühmaier, M.; Tumajer, J.; Vis, M.; Spinelli, R.; Dees, M.; Prinz, R.; et al. Sustainability Impacts of Increased Forest Biomass Feedstock Supply—A Comparative Assessment of Technological Solutions. Int. J. For. Eng. 2018, 29, 99–116. [Google Scholar] [CrossRef] [Scilit]
  57. Beaudoin, D.; LeBel, L.; Frayret, J.-M. Tactical Supply Chain Planning in the Forest Products Industry through Optimization and Scenario-Based Analysis. Can. J. For. Res. 2007, 37, 128–140. [Google Scholar] [CrossRef] [Scilit]
  58. Scholz, J. Spatial Adaptive Large Neighborhood Search for Wood Supply Chain Optimization. Int. J. Appl. Geospat. Res. 2015, 6, 27–43. [Google Scholar] [CrossRef] [Scilit]
  59. Westlund, K. Simulation-Based Multi-Objective Optimization of Wood Supply Chains. Doctoral Dissertation, Uppsala University, Department of Civil and Industrial Engineering, Industrial Engineering and Management, Uppsala, Sweden, 2025. [Google Scholar]
  60. Pekka, H.; Reetta, L.; Juha, L.; Juha, L.; Tuula, P. Joining up Optimisation of Wood Supply Chains with Forest Management: A Case Study of North Karelia in Finland. Forestry 2020, 93, 163–177. [Google Scholar] [CrossRef] [Scilit]
  61. Hirsch, P.; Gronalt, M. The Timber Transport Order Smoothing Problem as Part of the Three-Stage Planning Approach for Round Timber Transport. J. Appl. Oper. Res. 2013, 5, 70–81. [Google Scholar]
  62. Hamilton, D.; Diederichs, V.; Sessions, J. Forestry Electric Vehicle Energy Routing and Mapping GIS Tool. Int. J. For. Eng. 2024, 35, 482–497. [Google Scholar] [CrossRef] [Scilit]
  63. Jabłoński, K.; Stempski, W. Optimization of Wood Extraction from a Clear-cut Area According to the Minimum Transportation Labour Criterion. Sylwan 2015, 159, 540–548. [Google Scholar]
  64. ESRI Inc. ArcGis Pro, version 3.4.x 2025; GIS Software for Mapping and Spatial Analytics; ESRI: Redlands, CA, USA, 2025. [Google Scholar]
  65. Westlund, K.; Ng, A.H.C. Decision Making in Wood Supply Chain Operations Using Simulation-Based Many-Objective Optimization for Enhancing Delivery Performance and Robustness. Computers 2026, 15, 70. [Google Scholar] [CrossRef] [Scilit]
  66. Luo, L.; O’Hehir, J.; Regan, C.M.; Meng, L.; Connor, J.D.; Chow, C.W.K. An Integrated Strategic and Tactical Optimization Model for Forest Supply Chain Planning. For. Policy Econ. 2021, 131, 102571. [Google Scholar] [CrossRef] [Scilit]
  67. Mena-Reyes, J.F.; Vergara, F.; Linfati, R.; Escobar, J.W. Quantitative Techniques for Sustainable Decision Making in Forest-to-Lumber Supply Chain: A Systematic Review. Forests 2024, 15, 297. [Google Scholar] [CrossRef] [Scilit]
  68. Kärhä, K.; Haavikko, H.; Kääriäinen, H.; Palander, T.; Eliasson, L.; Roininen, K. Fossil-Fuel Consumption and CO2eq Emissions of Cut-to-Length Industrial Roundwood Logging Operations in Finland. Eur. J. For. Res. 2023, 142, 547–563. [Google Scholar] [CrossRef] [Scilit]
Figure 1. Scope of the simulation model, including harvested areas, wood yards, road and railway networks, and wood processing plants. Abbreviations: TL—tree-length logs, S—logs. Red lines—variant B1, blue lines—variant B2, dark blue lines—public road, green lines—customers’ internal access roads, dashed lines—primary transportation, solid lines—secondary transportation.
Forests 17 00974 g001
Figure 2. Schemes of wood yard location, extraction, and transport routes for scenarios: (a) only with first-level wood yards; (b) with wood yards at levels I and II.
Forests 17 00974 g002
Figure 3. Selected scenarios for simulation experiments.
Forests 17 00974 g003
Figure 4. Schema of main simulation algorithms.
Forests 17 00974 g004
Table 1. Grouped wood assortments for analysis.
AssortmentGroup of SpeciesSizeLength
1softwoodmedium 0.5 to 2.6 m
2softwoodmedium2.7 to 6 m
3softwoodmedium≥6.1 m
4softwoodlarge0.5 to 2.6 m
5softwoodlarge2.7 to 6 m
6softwoodlarge≥6.1 m
7hardwoodmedium 0.5 to 2.6 m
8hardwoodmedium2.7 to 6 m
9hardwoodmedium≥6.1 m
10hardwoodlarge0.5 to 2.6 m
11hardwoodlarge2.7 to 6 m
12hardwoodlarge≥6.1 m
13biomass--
Table 2. Selected equipment for analysis.
OperationTypePropulsion SystemSize
FellingChainsaw petrol-
Harvesterdieselsmall
Harvesterdieselmedium
Harvesterdiesellarge
Primary transportationForwarderdieselsmall
Forwarderdieselmedium
Forwarderdiesellarge
Tractor with trailerdieselsmall
Tractor with trailerdiesellarge
Skidderdieselsmall
Skidderdieselmedium
ChippingSelf-propelled wood chipperdiesel-
Mobile wood chipper (trailer)diesel-
Secondary transportationTruck with crane and trailerdiesel-
Set of two trucks with trailersdiesel-
Truck with crane and semi-trailerdiesel-
Set of two trucks with semi-trailersdiesel-
Truck with semi-trailer for wood chipsdiesel-
Truck with crane and trailerelectric-
Set of two trucks with trailerselectric-
Truck with crane and semi-trailerelectric-
Set of two trucks with semi-trailerselectric-
Truck with semi-trailer for wood chipselectric-
Table 3. Travel speed values of primary transportation machinery.
Off-Road SpeedForest Road Speed
vt (km h−1)vd (km h−1)
Baseline scenario (S1) Forwarder_S515
Forwarder_M515
Forwarder_L515
Tractor with trailer_S415
Tractor with trailer_M415
Skidder_S315
Skidder_M315
Speed adjustment scenario (S2)Forwarder_S410
Forwarder_M410
Forwarder_L410
Tractor with trailer_S310
Tractor with trailer_M310
Skidder_S2.75
Skidder_M2.75
Speed and loading/unloading times adjustment (S3)Forwarder_S410
Forwarder_M410
Forwarder_L410
Tractor with trailer_S310
Tractor with trailer_M310
Skidder_S2.75
Skidder_M2.75
Table 4. Loading and unloading time values of primary transportation machinery.
ScenarioForwardersTractors with TrailersSkidders
tztwtztwtztw
(h)(h)(h)(h)(h)(h)
S1 and S2 0.420.210.50.240.150.06
S30.370.210.480.240.280.09
Table 5. Average productivity of harvesting and primary transportation for S1 to S3 scenarios.
Harvesting ProductivityPrimary Transportation ProductivityGHG Emissions
m3 h−1 (T07)m3 h−1 (T07)kg CO2 eq m−3
S1B1C28.3011.016.83
C17.3010.057.57
B2C28.3010.067.53
C17.307.388.67
S2B1C28.3010.187.07
C17.308.967.97
B2C28.308.687.93
C17.307.338.93
S3B1C28.3010.297.0
C17.309.307.9
B2C28.308.727.8
C17.307.768.8
Table 6. Average harvesting and primary transportation costs.
Average Total Harvesting and Primary Transportation CostsAverage Environmental CostsProportion
of Environmental Costs
EUR m−3EUR/m−3%
S1B1C216.410.482.91
C118.370.542.88
B2C217.630.533.02
C120.140.612.99
S2B1C216.810.502.93
C118.960.562.94
B2C217.440.563.14
C119.680.633.14
S3B1C217.150.502.90
C119.380.562.89
B2C218.990.552.89
C121.460.622.89
Disclaimer/Publisher’s Note: The statements, opinions and data contained in all publications are solely those of the individual author(s) and contributor(s) and not of MDPI and/or the editor(s). MDPI and/or the editor(s) disclaim responsibility for any injury to people or property resulting from any ideas, methods, instructions or products referred to in the content.