


Abstract
Thermal forcing is one of the most important drivers of leaf phenology and can be used to determine species’ phenological requirements. Counting on this, the aim of the study was to quantify the thermal regime and determine how it explains variation in spring phenology and senescence in European beech. To achieve this goal, we analyzed the 44 provenances tested in a common garden experiment established in the Carpathian region of Romania during the 4th series of international beech provenance trials. Using growing degree days and senescence degree days, cumulative precipitation over the previous 14 days, and photosynthetically active radiation as climatic factors, we modeled the spring leaf phenology and senescence, the thermal thresholds of provenances, and the length of the growing season. We found that thermal forcing is the primary driver of provenance phenology, but the other climatic parameters also significantly influence these processes. Significant variation among provenances was observed, but the effect of provenance was weaker than that of year or replication, suggesting that environmental conditions exert a stronger influence on leaf phenology dynamics. The identification of contrasting warming and cooling requirements suggests that, in provenance selection or assisted migration practices, thermal requirements are particularly important alongside growth performance.
1. Introduction
The intricate relationship between the biotic and abiotic components of the forest ecosystem [1] influences the species occurrence and richness in a specific geographical area [2]. Climate conditions, along with the ecological and morphological characteristics of species, are essential drivers of geographical distribution, effectively serving as reliable proxies of the various environmental factors [3,4,5]. In this context, phenology is involved as a key determinant of species’ distribution, as it controls the onset and cessation of vegetation [6,7], thus determining the forest species’ adaptive potential [8]. Air temperature is widely recognized as the primary environmental factor regulating phenological development [9], influencing the timing and progression of bud burst and senescence and ultimately determining the duration of the growing season [10,11]. As a consequence, the growth process is directly conditioned by the phenological activity [12,13]. In relation to temperature, other microclimatic factors are involved in shaping species phenology, such as light availability and water resources [14]. Since climatic conditions trigger tree species phenology, changes in current and future climatic conditions [15] directly affect this process [16].
Besides its proven importance in Europe [17], Fagus sylvatica L. is considered a moderately drought-sensitive species [18] and is expected to lose territory in the future due to the negative impact of global warming [19,20,21,22]. To the same extent, the upcoming changes in climate conditions will produce significant shifts in the spring phenology and leaf senescence of the species [11,23]. Nevertheless, significant differences in phenological dynamics among beech populations have been reported [24] sustaining the presence of genetic differentiation and local adaptation to contrasting environmental conditions, and also the existence of more resilient populations [25,26]. Therefore, analyzing the phenology of different populations may be enhanced in provenance trials, which are widely used to test the adaptation potential of tree species [27,28].
The installation of the 5th series of international beech provenance trials throughout Europe facilitated the study of phenological variation and adaptive responses among beech populations [29]. Von Wuehlisch et al. [30] demonstrated substantial variation in spring phenology among European beech provenances and identified a geographical trend, with eastern provenances generally flushing earlier than western ones, as a result of the oceanic influence in western Europe. Similar results were found in other studies that evidence the early flushing trend of eastern and southern beech populations [31,32]. These findings highlighted the adaptive significance of phenological traits and emphasized the importance of matching forest reproductive material to local climatic conditions. The variation in phenology among provenances was also confirmed by other studies [33,34], but Schueler and Liesebach [35] found that annual climatic conditions exerted a stronger influence on phenological timing than provenance origin. In addition, the phenotypic plasticity was reported not only in relation to growth traits [36,37,38] but also in the spring phenology [39].
Using data from the network of international provenance trials, Wang et al. [40] showed that beech provenances differ significantly in their response to spring temperature accumulation, with provenance-specific phenological patterns closely related to the climatic characteristics of their native environments. These findings provide strong evidence for local adaptation in European beech and highlight the importance of phenological traits in determining population responses to environmental variability and climate change.
Although air temperature is widely recognized as the primary driver of spring phenology, these processes are generally regulated by the accumulation of thermal forcing rather than by temperature values alone, and including climatic factors such as solar radiation and precipitation may significantly increase the prediction accuracy of phenology [40,41,42]. Such analyses remain relatively uncommon in provenance trials, despite their importance for understanding adaptive variation among populations.
Therefore, beyond assessing provenance-specific variation in the timing of spring phenology and senescence, the present study aimed to quantify the thermal requirements underlying these phenological processes and to determine whether their occurrence can be reliably predicted using cumulative thermal forcing, precipitation, and photosynthetically active radiation. These objectives were addressed by analyzing 44 international beech provenances tested in a provenance trial established in the Carpathian region of Romania.
2. Materials and Methods
2.1. Experimental Design and Site Conditions
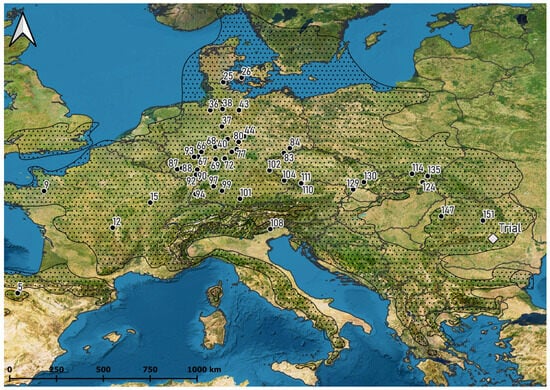
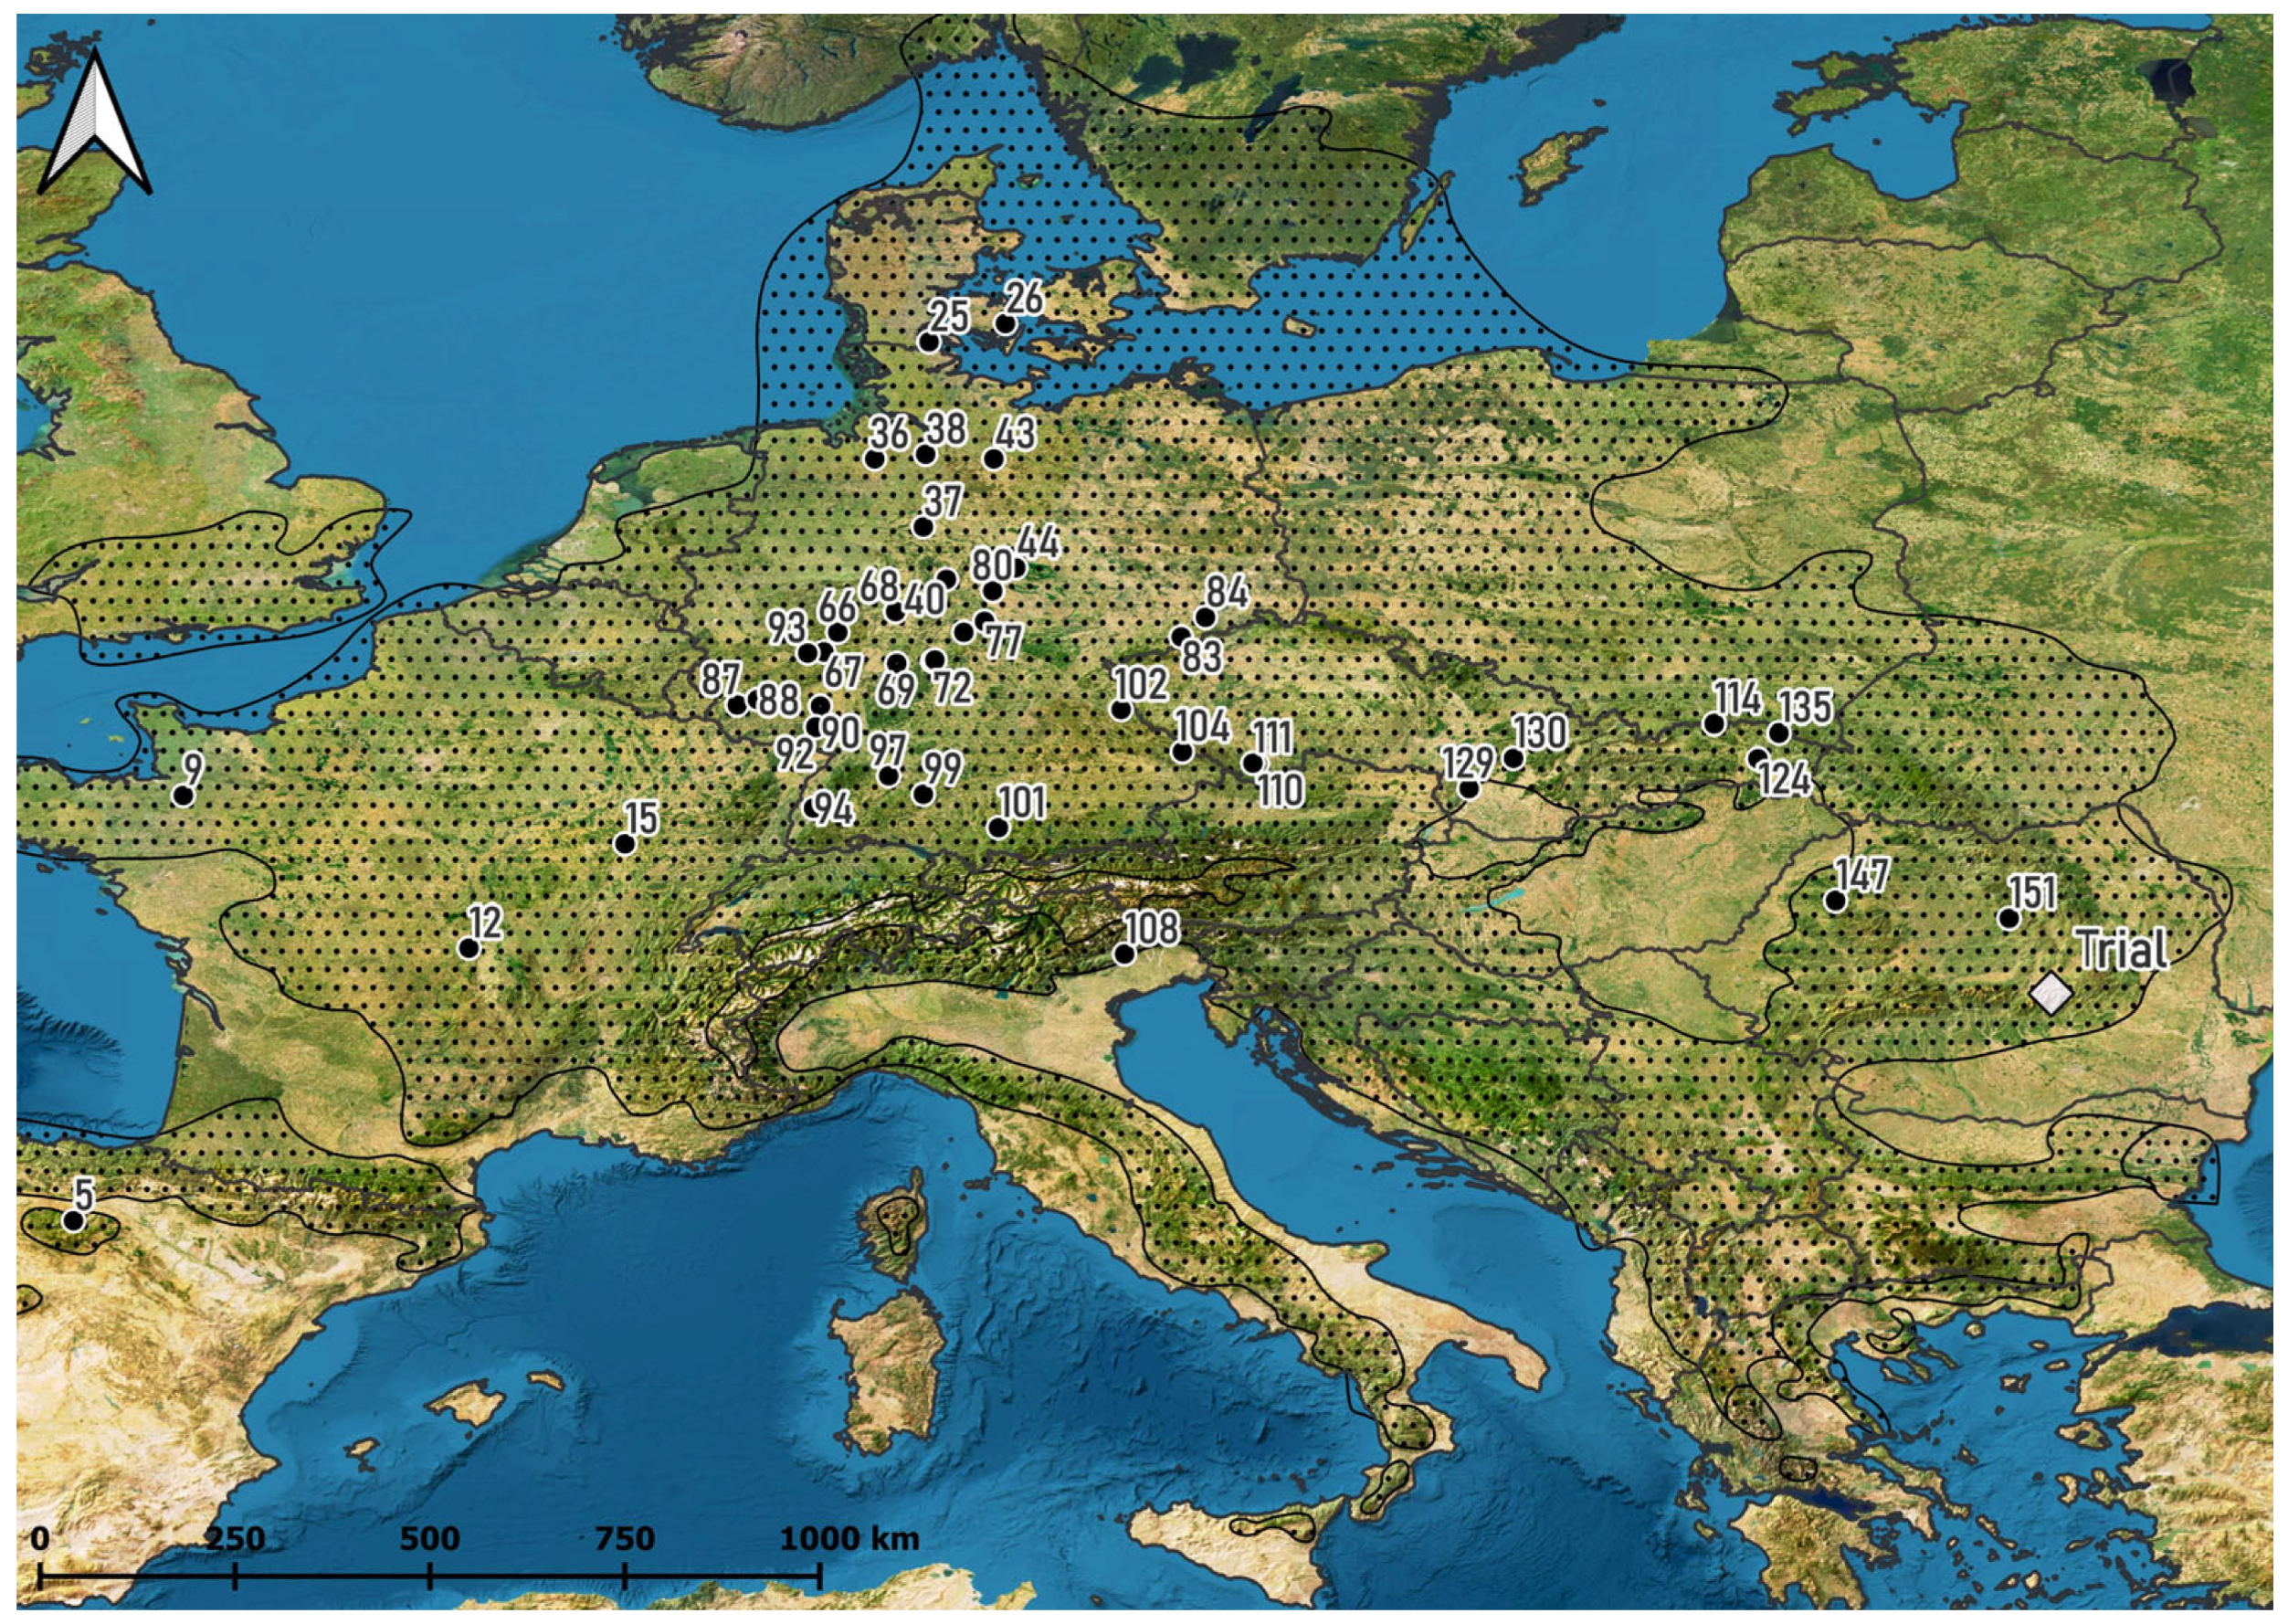
The phenological observations were made in the Sacele provenance trial, which is part of the 4th international beech provenance trials installed in Europe in the spring of 1995, with the purpose of testing the species’ adaptive capacity [29,43]. In this trial, 44 provenances are tested in a complete randomized block design, which includes three replications and 50 trees in each unitary plot [44].
The trial is located in the South Eastern part of the Carpathian Mountains, Brasov County, at an elevation of 873 m. It is a high meadow, with a relatively flat surface and an inclination ranging from 0° to 5°. The soil is an alluvial dystric cambosoil, and the forest type is a typical mixed forest with coniferous species and beech [45] (Figure 1).
Figure 1.
The locations of the tested provenances (black dots) and the trial (grey diamonds) within the natural distribution range of European beech (black points) [46] and the boundaries of European countries (black line) [47].
2.2. Phenological Observations
Phenological observations, including spring phenology (March–June) and senescence (September–November), were carried out over a three-year period (2022–2024) with a periodicity of seven days. For these observations, three dominant trees with well-developed crowns were selected from each provenance. The trees were selected in the spring of 2022 in two replications of the trial, as the third had lower survival. The observations were performed from the same position relative to the selected trees (the upslope side of the tree) using a binocular, allowing an optimal view of the upper part of the crown and ensuring consistency throughout the entire observation period. Each phenological stage was recorded as the day of the year (DOY) corresponding to its first appearance.
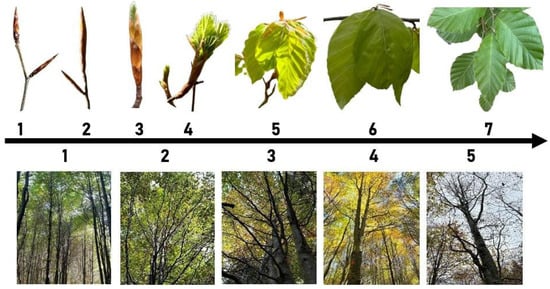
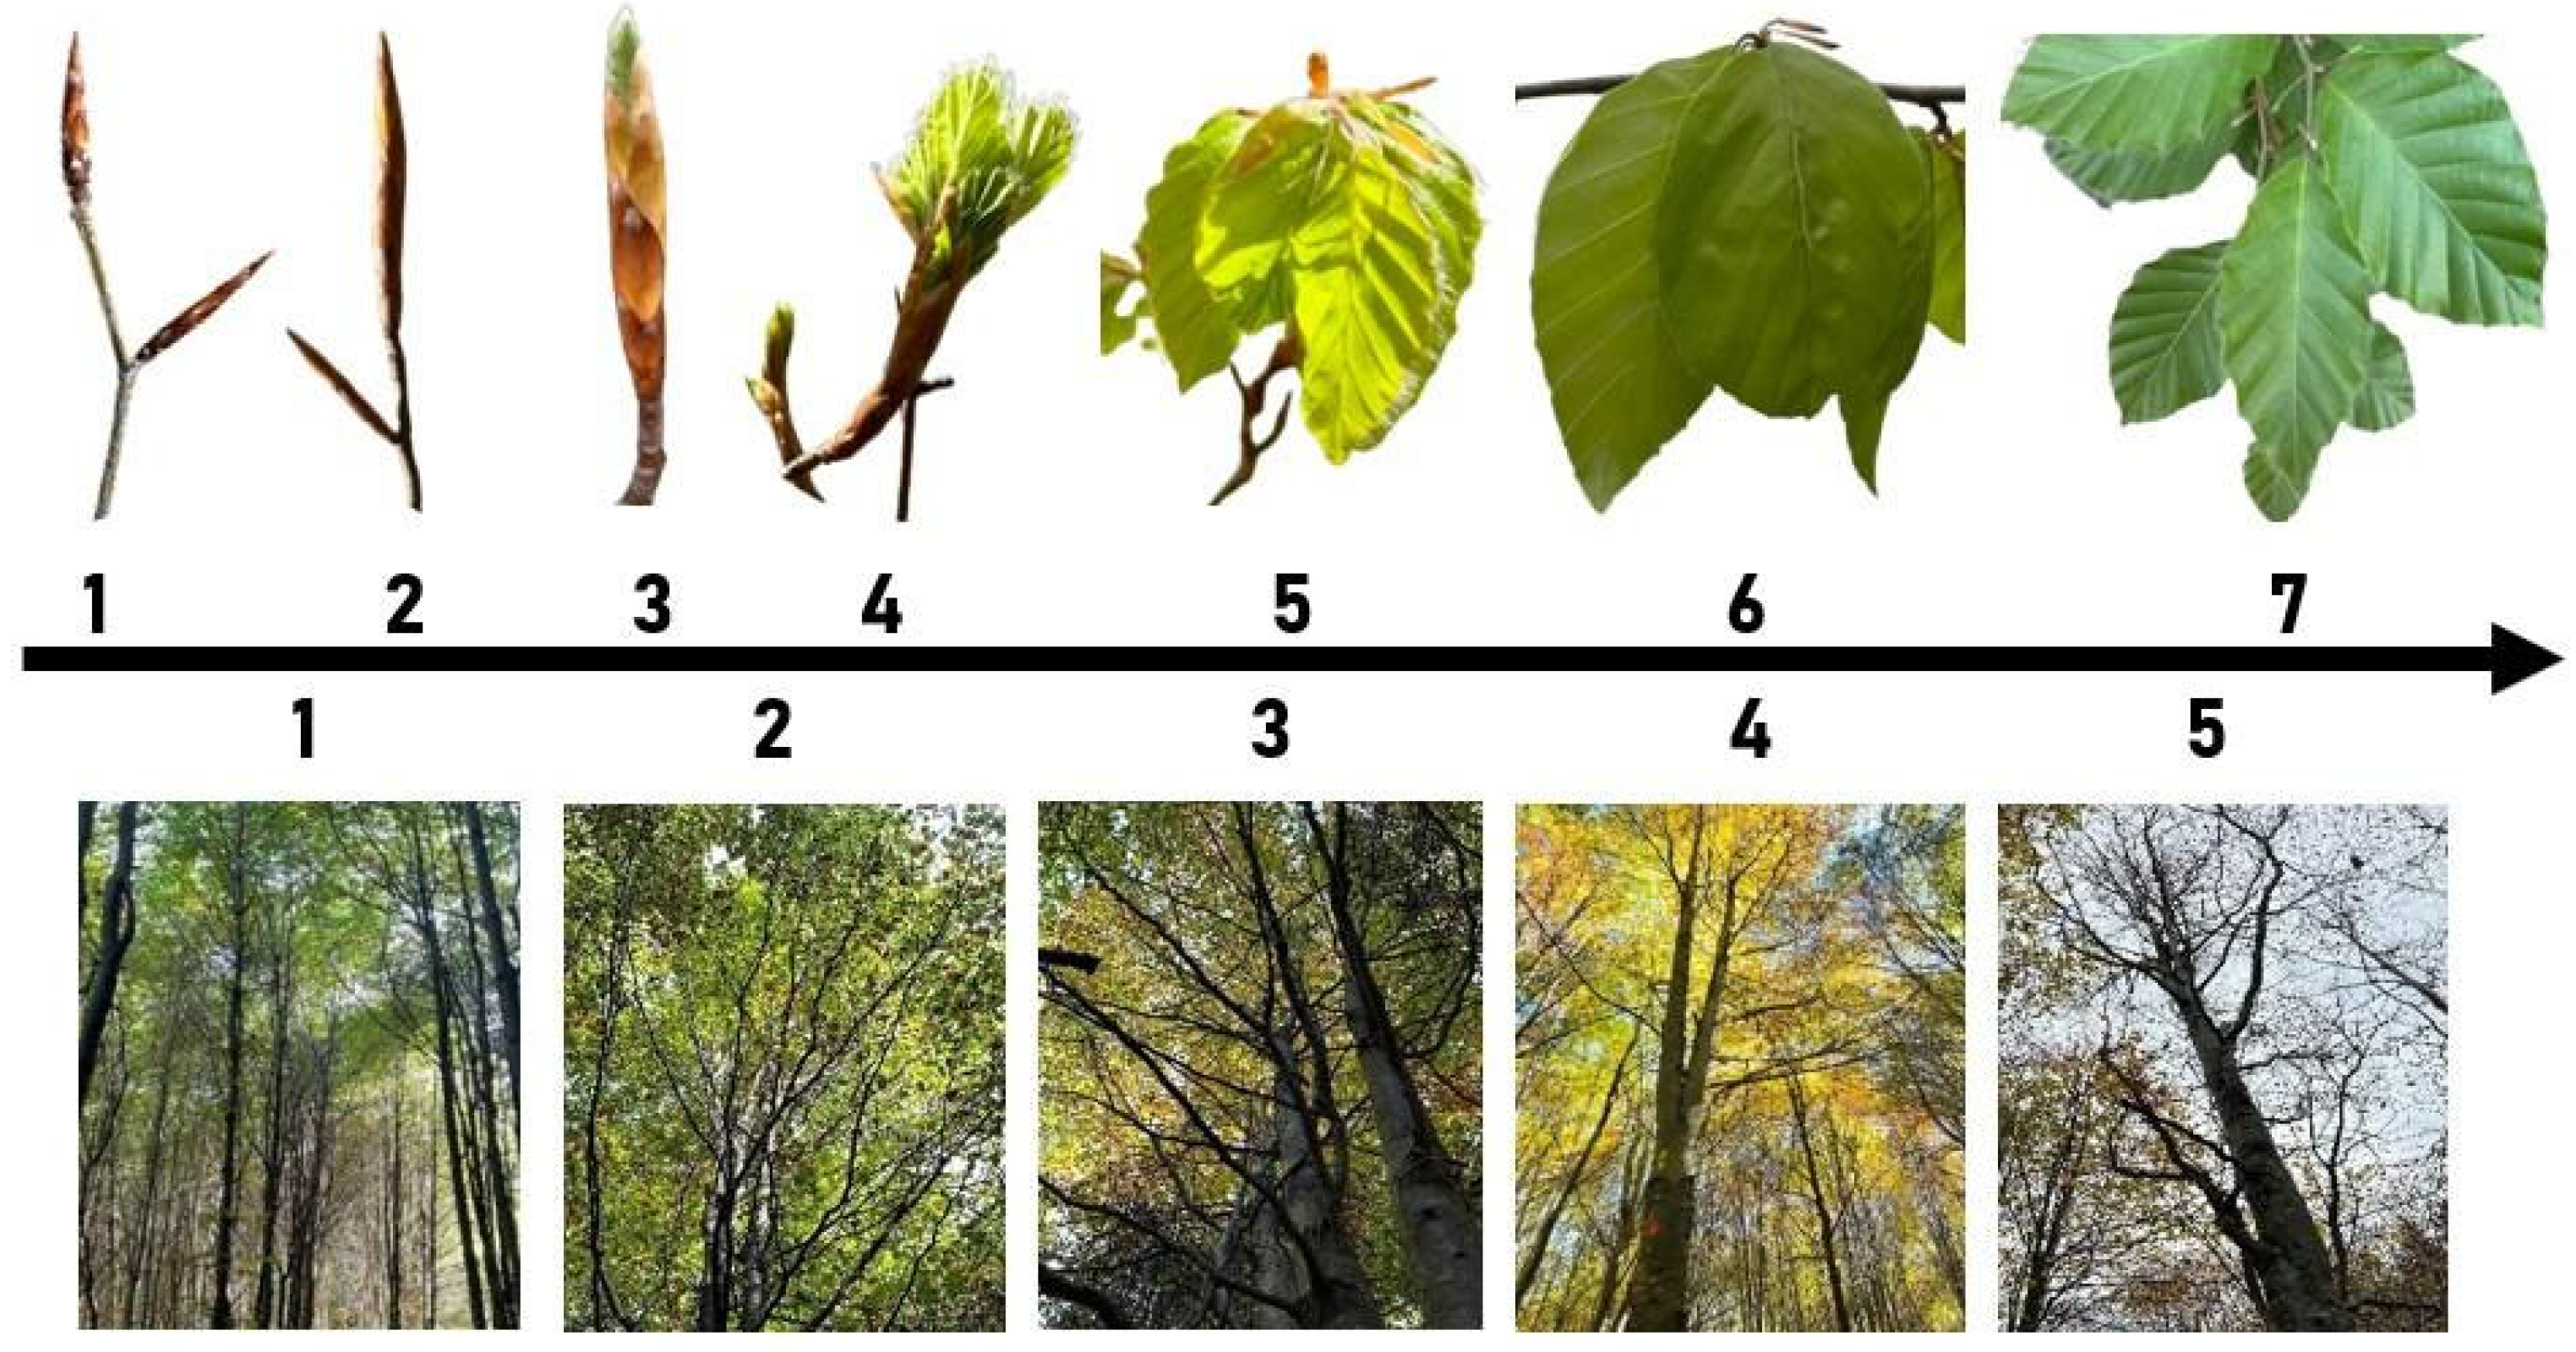
For these observations, the phenological methodology used previously in the international beech trials established across Europe was applied [31,43]. This methodology, developed by Du Cros et al. [48] includes seven classes for spring phenology and five classes for senescence (Table 1).
Table 1.
The description of the phenological scales.
The onset of vegetation was considered to correspond to the bud burst stage (class 3). This phase represents the transition from winter dormancy to active vegetative development and marks the beginning of leaf expansion, a representative stage of spring phenology [49]. In the case of senescence, the representative stage was considered the third class, associated with 5% to 50% of the leaves turning yellow. This methodology covers all stages of leaf development during the growing season, from bud swelling to leaf fall (Figure 2).
Figure 2.
The methodology used in the phenological observations, for spring phenology (up) and senescence (down).
2.3. Climate Data
In the phenological analyses, the climate data were obtained from a local forestry climate station located near the trial site, within the same watershed and elevation (approx. 500 m distance). The climatic parameters used were: air temperature, precipitation, and photosynthetically active radiation. Air temperature is known as the primary climatic factor that controls the phenological process [9], but light intensity also has direct implications for beech phenology [14], as well as the precipitation amount, which can affect growing season length [50].
The climatic parameters were collected as daily data registered at 10 min intervals. The final climate data set contains: mean temperature (Temp), minimum (T_min), maximum (T_max) temperatures, sum of diurnal photosynthetically active radiation (PAR), and sum of precipitation (PP_sum), calculated for the observation periods spanning from March to June for spring phenology and August to December for senescence.
To quantify the thermal requirements associated with the onset and cessation of vegetation in the beech provenances, two thermal indices were calculated: growing degree days (GDD) and senescence degree days (SDD). Both indices were computed at the daily level and calculated as the difference between the mean air temperature and a predefined base temperature [51,52]. Finally, the cumulative sums of these indices, which include negative and positive values, were calculated by summing daily values from the start of the observation period through the date of phenological assessment, which was used to determine the thermal requirements for reaching each phenological stage. The base temperature threshold of 5 °C applied for GDD calculations corresponds to the commonly accepted threshold for the onset of vegetative activity of beech [53]. In contrast, the SDD threshold was selected empirically after comparing multiple thermal thresholds (0–20 °C). For each threshold, cumulative SDD was recalculated, and the corresponding phenological model was fitted. The threshold of 15 °C was selected because it resulted in the best overall model performance. In addition, cumulative precipitation over the preceding 14-day period (PP_14) and daily PAR were derived and used as complementary climatic predictors in the phenological models. The PP_14 was selected because it provided the best model performance, indicating that recent moisture conditions were more strongly associated with phenological progression than shorter or longer accumulation periods. Multicollinearity among the climatic predictors was evaluated using variance inflation factors. All values were below 1.5, indicating negligible collinearity among the climatic parameters used.
2.4. Data Analysis
Data analysis was performed using the R statistical environment version 4.4.2 [54], while geographical data processing and map generation were carried out using QGIS software version 3.34.3 [55].
The Kolmogorov–Smirnov test [56] was applied to assess the data distribution. As the data were not normally distributed, differences among provenances, years, and replications were assessed using the non-parametric Kruskal–Wallis test [57], with DOY as the dependent variable.
To evaluate the relative importance of thermal accumulation and other climatic factors, phenological timing (DOY), referring to the day that the phenological event was captured, was modeled as a function of cumulative GDD, PP_14, and PAR using generalized linear mixed models (GLMMs). The Gamma distribution is particularly suitable for calendar-based phenological data characterized by positive values and non-normal distributions. The effect of the included climatic parameters was modeled using spline functions fitted separately for each year, capturing the nonlinear influence of temperature on phenological development and senescence, as well as interannual variability in these processes. The model was fitted using the glmmTMB package [58] (Equation (1)):
where is the expected DOY for observation in year ; is the overall intercept; is a natural spline function describing the non-linear response of phenology to cumulative thermal forcing; and quantify the effects of recent precipitation (PP_14) and photosynthetically active radiation (PAR), respectively; and is the random effect of year, accounting for unexplained interannual variation in phenological development.
A similar modeling approach was used to analyze the thermal requirements associated with the onset (bud burst) and cessation of vegetation (50% yellowing) in the beech provenances. In this case, to estimate the differences among provenances, the cumulative GDD and SDD values were considered as dependent variables, whereas provenance was treated as a fixed effect and year as a random effect to capture the interannual variation. The same model structure was further applied to evaluate the duration of the growing season, calculated as the number of days between the onset and cessation of the vegetation period [51,59]. Marginal (R2m) and conditional (R2c) coefficients of determination were calculated to assess model performance.
For a clearer interpretation of differences among provenances, model-estimated values were adjusted using the Holm correction method to generate homogeneous groups, implemented through the emmeans package [60]. Furthermore, the thermal requirements for each phenological class were represented graphically as a boxplot based on cumulative GDD and SDD values generated with the ggplot2 package [61], providing an overview of the progressive thermal accumulation required for phenological development. Differences in thermal forcing among classes were first evaluated using the Kruskal–Wallis test [57], and pairwise comparisons between classes were subsequently performed using Dunn’s post-hoc test [62].
3. Results
3.1. Spring Phenology
3.1.1. Evaluating the Differences Among the Spring Phenology Classes
The analyses of leaf flushing (spring phenology) revealed significant variation across all tested sources, although the response differed among phenological stages (Table 2). Significant differences among years were detected (p < 0.0001 ****) for all phenological stages, indicating consistent interannual variation in the timing of spring development. Regarding replications, significant differences (p < 0.0001 ****) were identified for classes two and three, as well as for the final two stages (classes six and seven). In contrast, the intermediate stages (classes four and five) showed no significant differences, suggesting similar phenological dynamics between replications. Provenance effects were more stage-specific, being significant (p < 0.01 **) only for class three, corresponding to the onset of vegetation, while weakly significant differences (p < 0.05 *) were identified for classes five and six, associated with leaf development. The analysis of within-provenance variability at each stage revealed low, non-significant variation, indicating relatively uniform phenological dynamics among trees of the same provenance.
Table 2.
The analysis of DOY variability in the phenological classes.
3.1.2. The Influence of Climatic Factors on Spring Phenology
The climate model identified cumulative GDD as the dominant driver of spring phenology, with a highly significant non-linear effect (Table 3). In addition, both precipitation accumulated over the preceding 14 days (PP_14) and PAR contributed significantly to the prediction of spring phenological timing, indicating that thermal forcing is complemented by hydric and radiative conditions. Despite the high explanatory power of the climatic predictors, the inclusion of year as a random effect further improved model performance, indicating that interannual differences not captured by the fixed climatic variables contributed to variation in spring phenology.
Table 3.
Fixed and random effects of the spring phenology model.
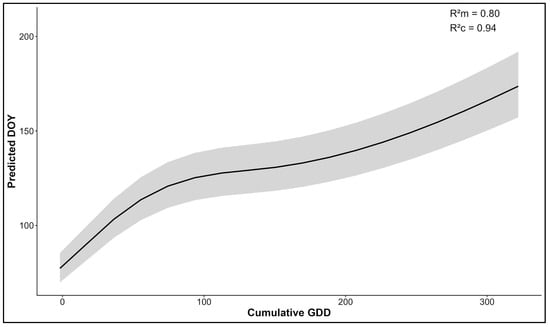
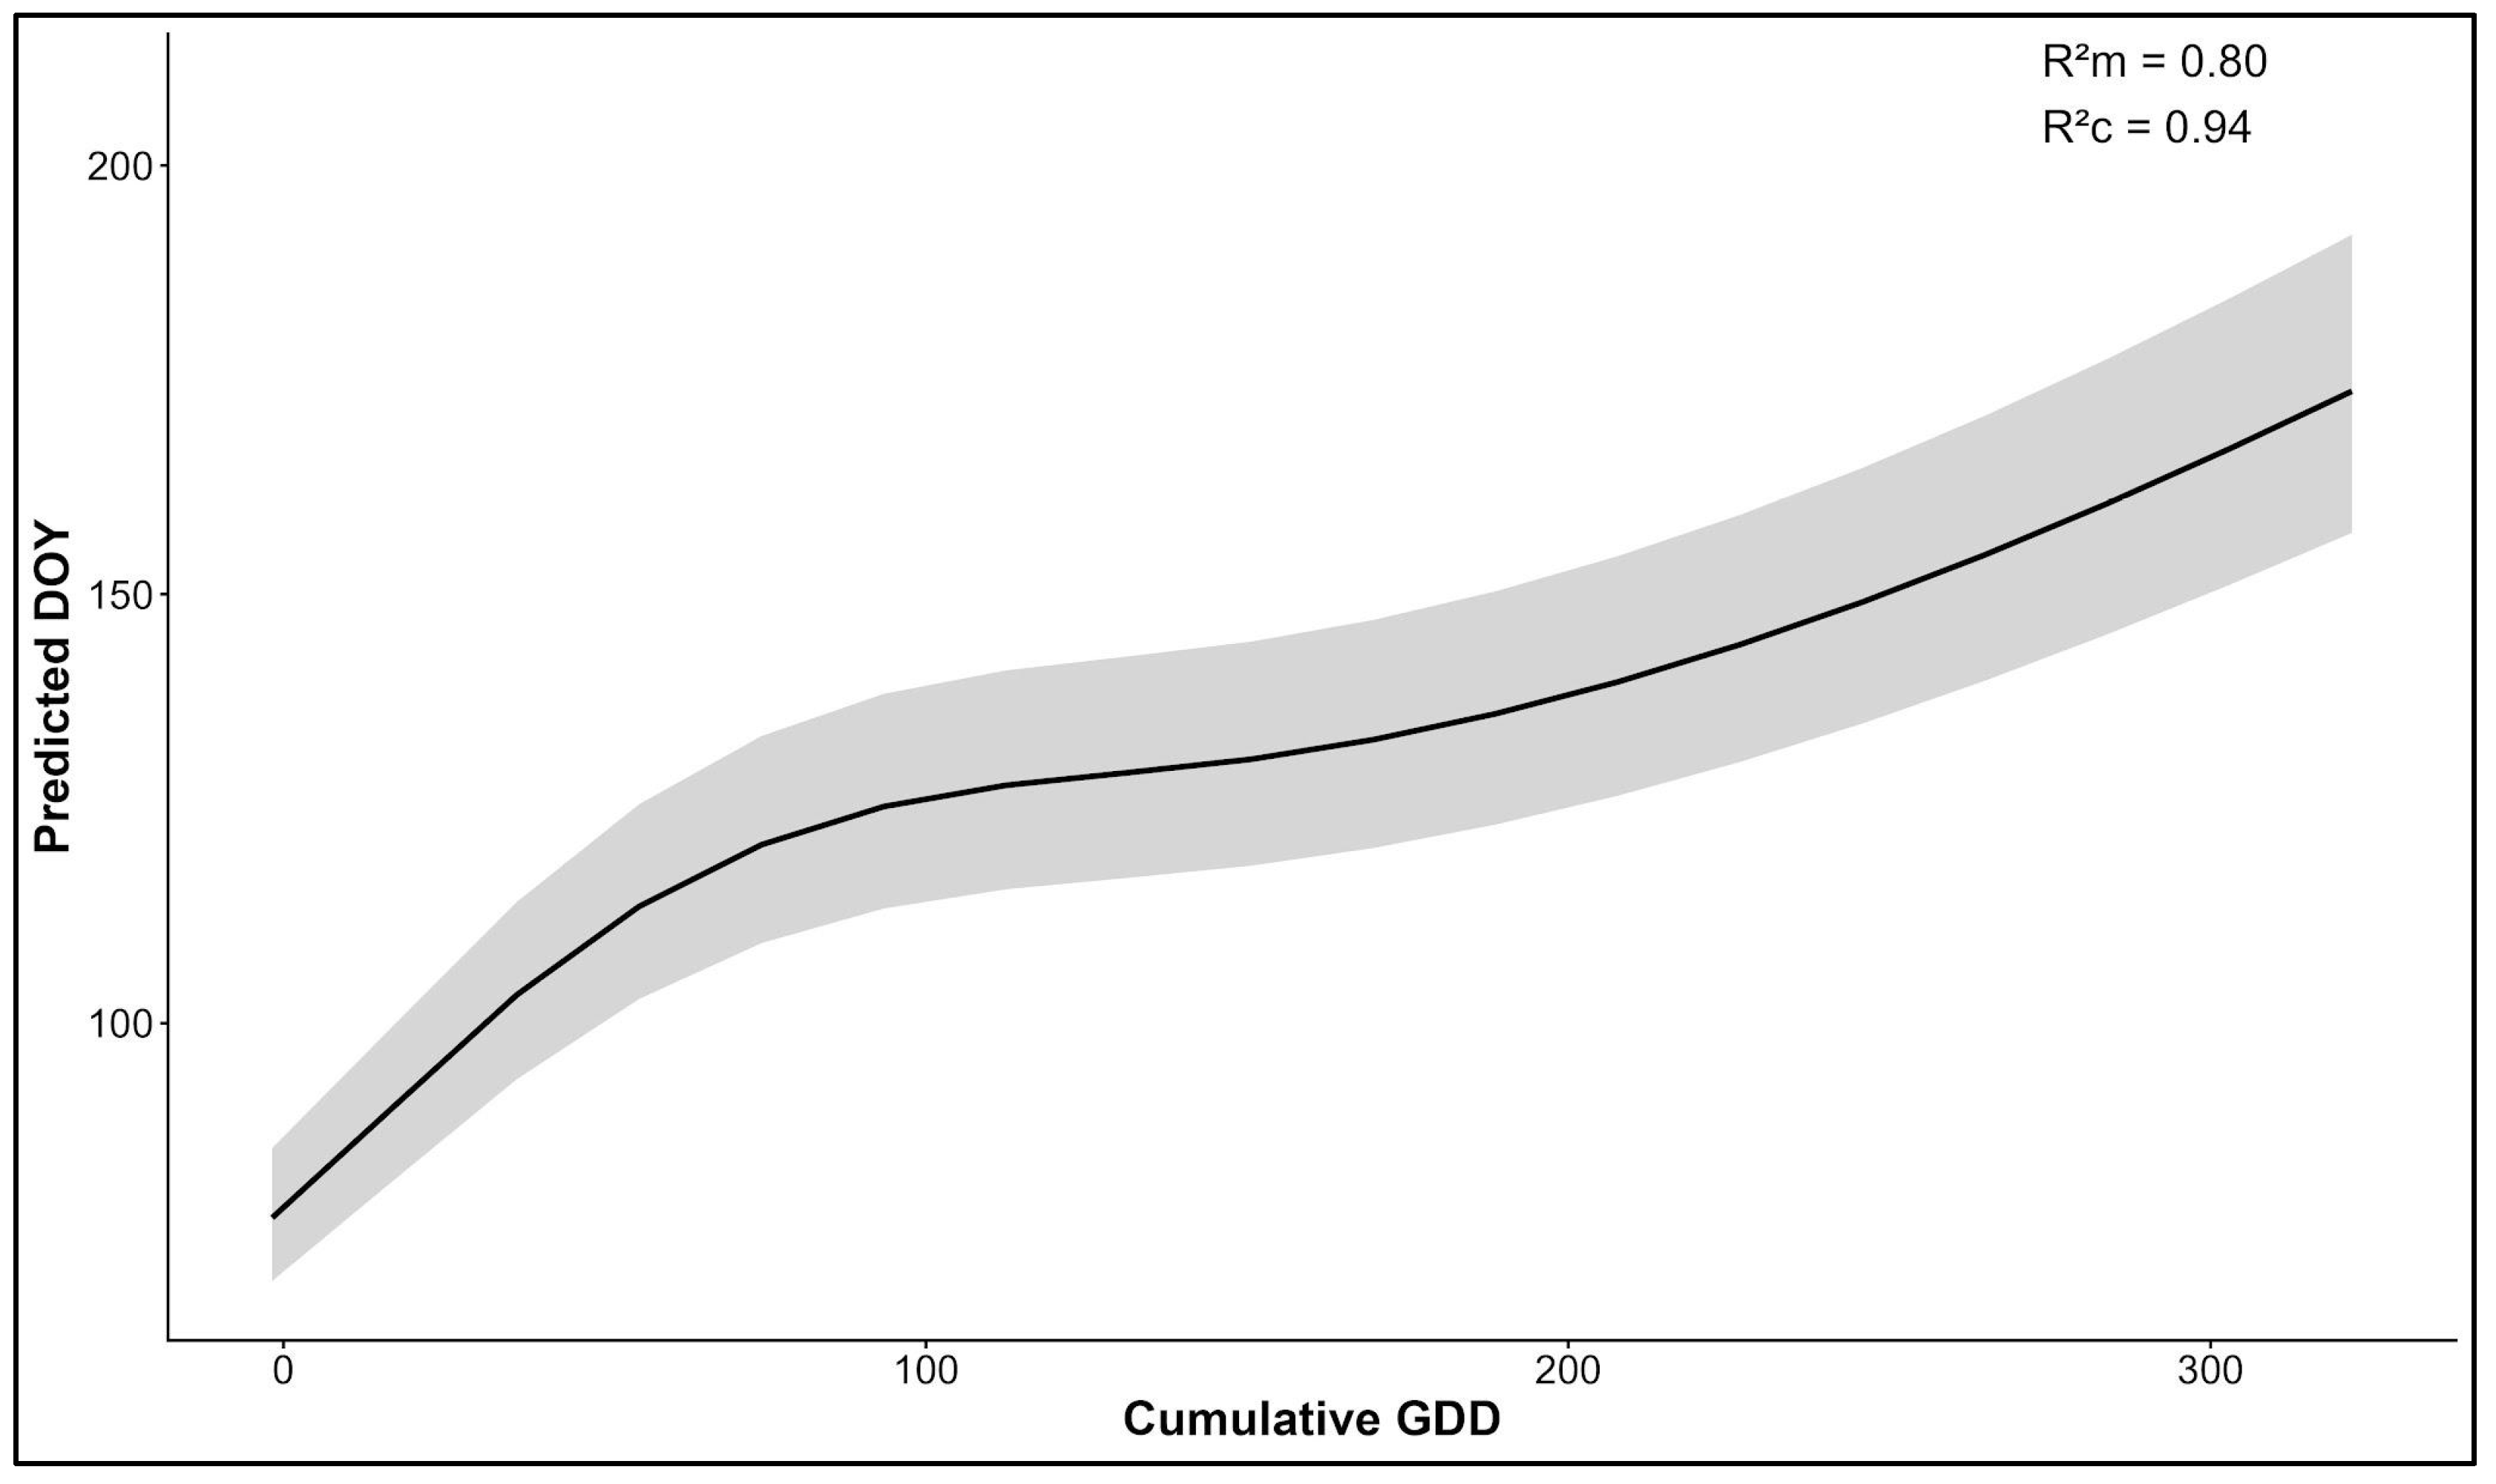
The relationship between cumulative GDD and phenological timing is illustrated in Figure 3. Climatic predictors explained 80% (R2m) of the variation in spring phenological timing, while accounting for interannual variability increased the total explained variance to 94% (R2c), highlighting the importance of year-specific environmental conditions that significantly influence the spring phenology process. Thus, the model achieves high accuracy in identifying the drivers of spring phenology. Among these climatic parameters, cumulative GDD was the primary driver of spring phenology, representing the thermal forcing, while PP_14 and PAR significantly improved model performance. This result was obtained after evaluating the climatic predictors individually, and cumulative GDD consistently produced the best model performance.
Figure 3.
The influence of thermal forcing on spring phenology. R2m is the marginal coefficient of determination, and R2c is the conditional coefficient of determination.
The non-linear response observed for cumulative GDD suggests that phenological advancement was not similar across the entire range of thermal accumulation. Instead, the strongest shifts in spring phenological classes occurred within the lower range of GDD values (0–100), where relatively small increases in accumulated thermal forcing led to substantial advances in spring development. The results indicate that the onset and progression of leaf development are primarily controlled by the accumulation of heat above the physiological threshold of 5 °C. As cumulative GDD increases, trees progress through successive spring phenological stages, confirming the central role of thermal forcing in regulating spring phenology. However, the spline function revealed a non-linear response, with a flatter section of the curve between approximately 100 and 200 cumulative GDD. This pattern suggests that, within this range of thermal accumulation, additional heat results in a smaller change in phenological progression than at lower GDD values. The significant effects of PP_14 and PAR further indicate that spring phenology is influenced by multiple environmental cues.
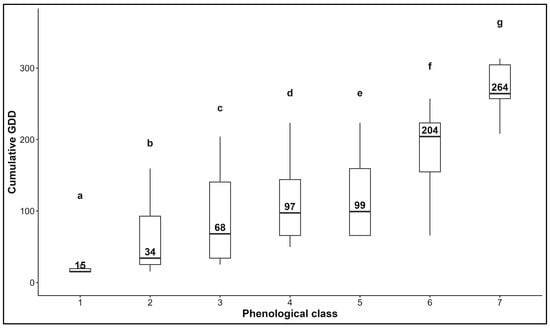
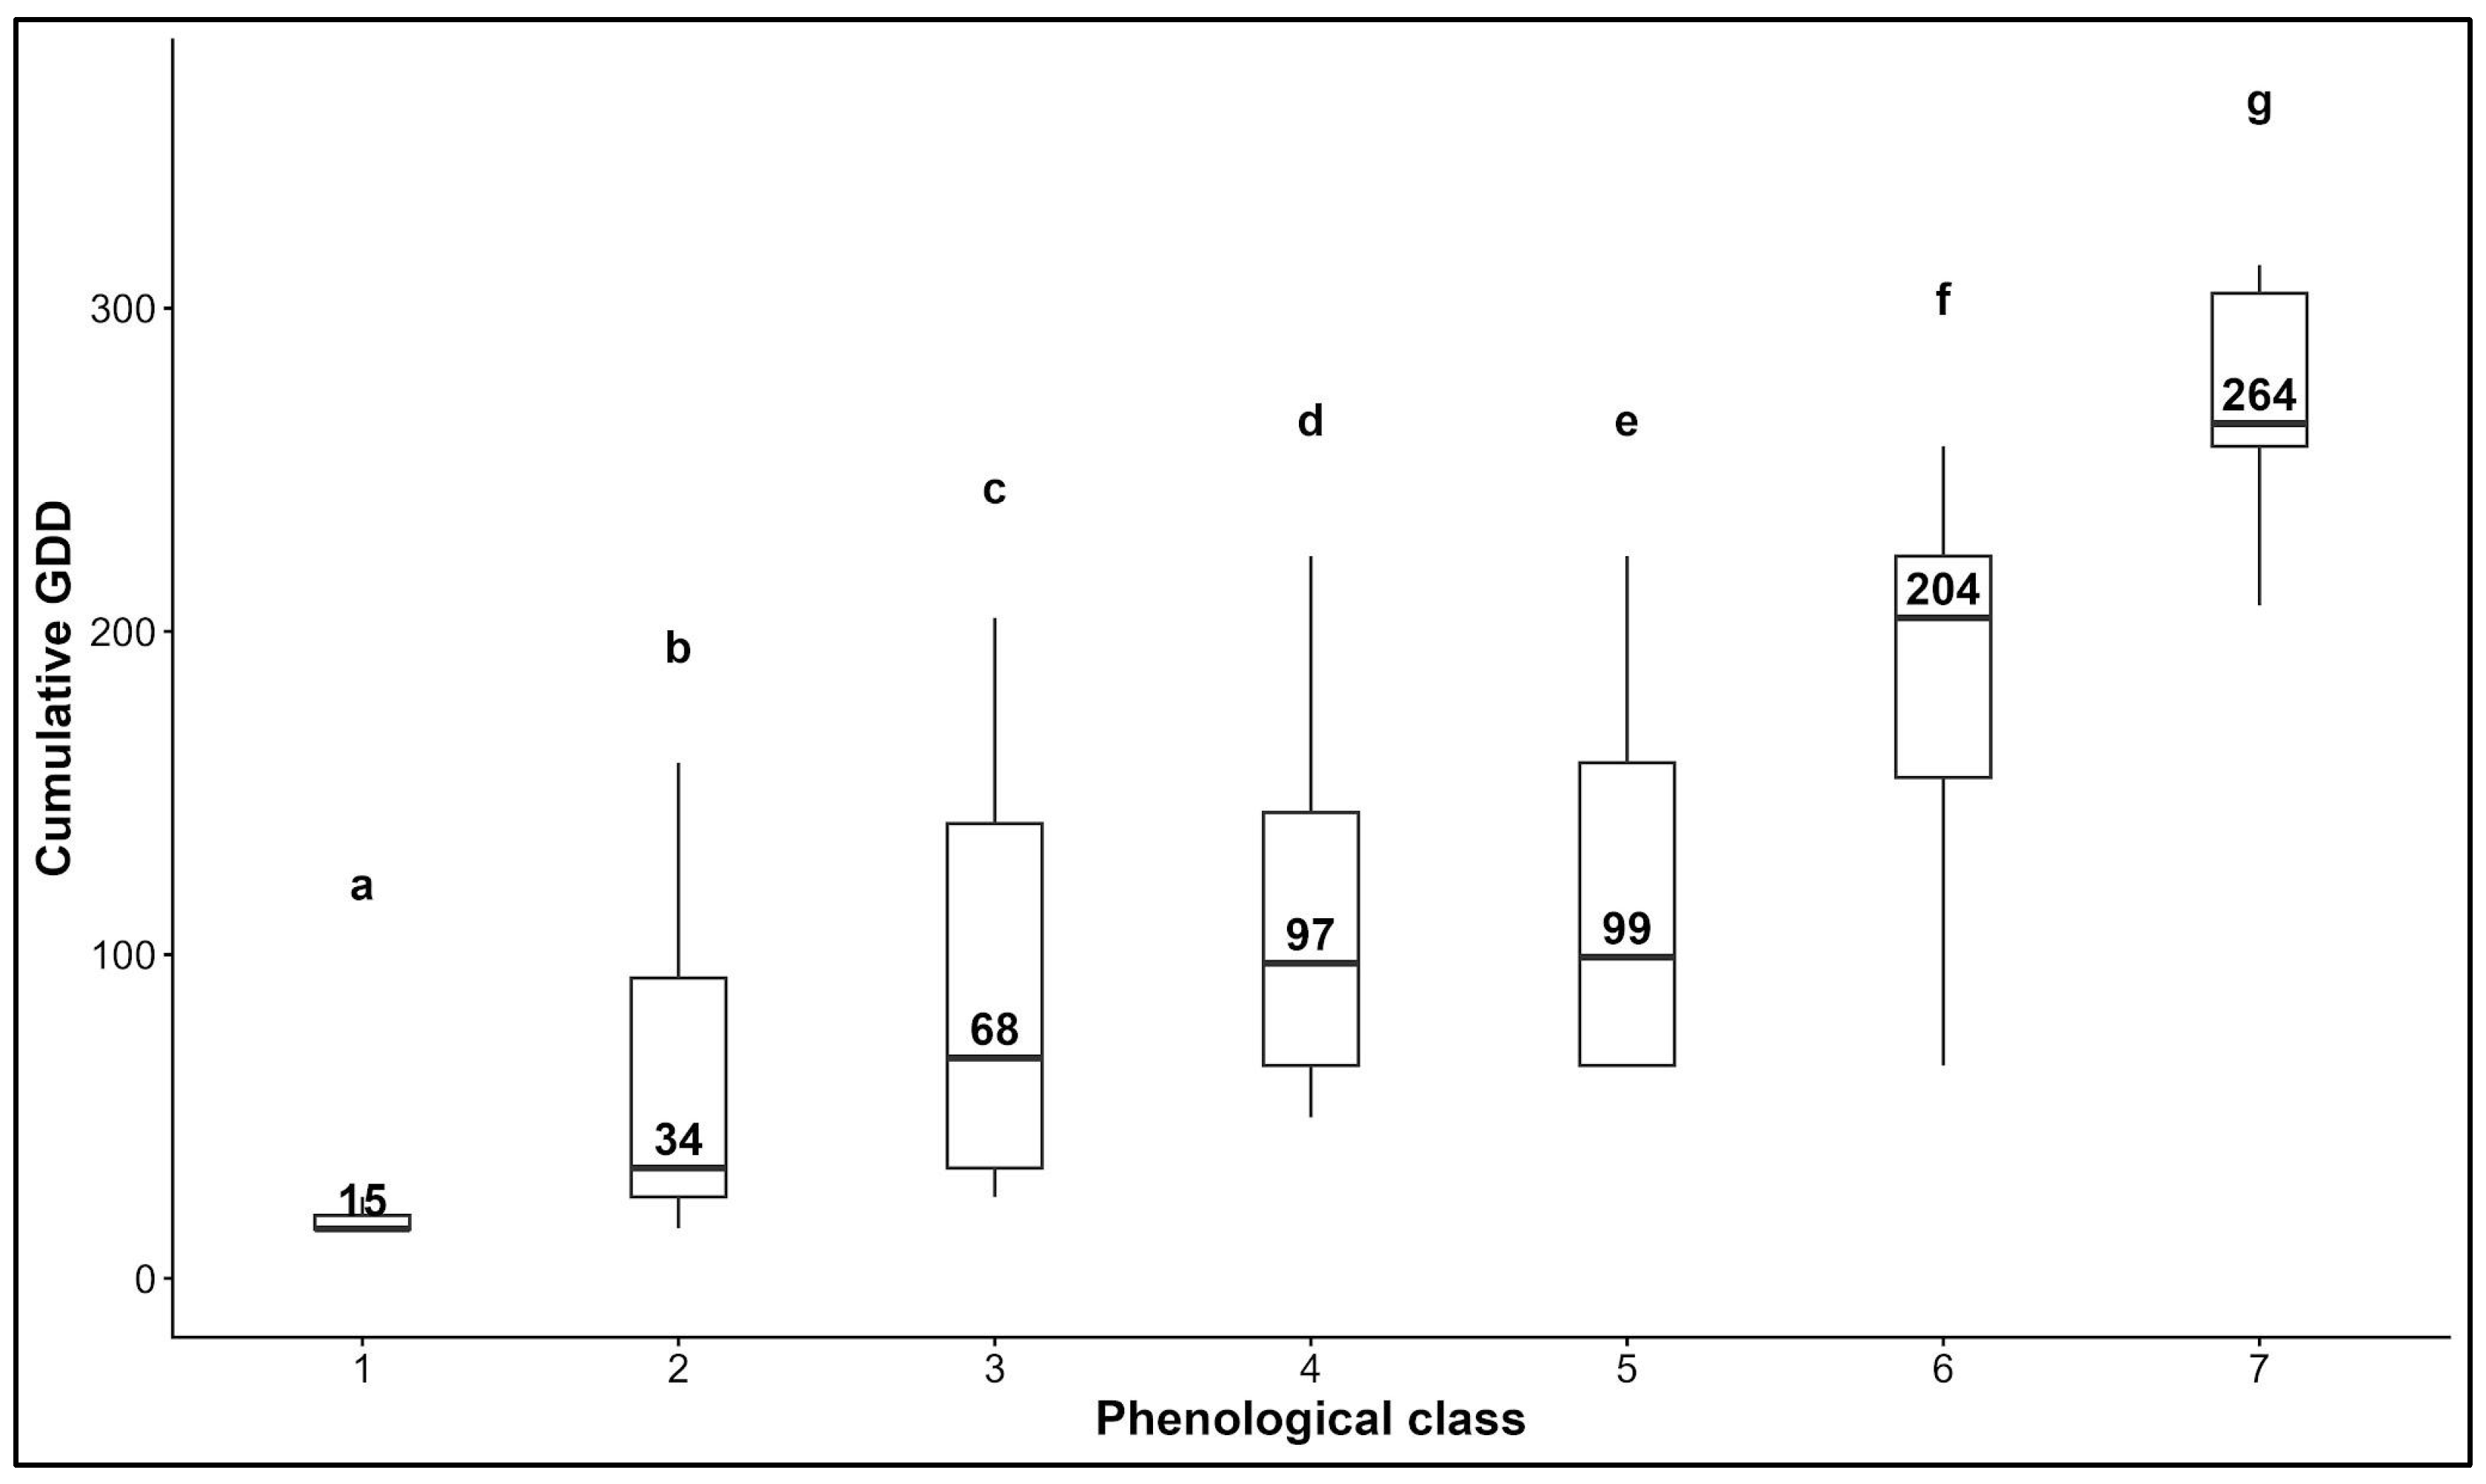
The cumulative GDD values increased progressively across successive phenological classes, indicating that spring phenological development in the tested provenances of European beech is closely linked to the accumulation of thermal forcing (Figure 4). Median GDD values ranged from 15 GDD in the dormant stage (class 1) to 264 GDD in the final stage characterized by fully expanded leaves (class 7). Statistical comparison revealed significant differences across phenological classes, indicating that each developmental stage was associated with a distinct level of cumulative thermal forcing. During the first stages, thermal accumulation increased gradually, with median GDD values rising from 15 GDD in class 1 to 68 GDD in class 3. Similarly, the transition from bud burst (class 3) to folded hairy leaves (class 4) required an additional 29 GDD. In contrast, classes 4 and 5 exhibited very similar median values (97 and 99), suggesting that these developmental stages occur within a relatively similar GDD interval. This aspect may be explained by a genetically defined development, rather than being exclusively dependent on GDD.
Figure 4.
The thermal forcing requirements for spring phenology classes. The boxplot describes the minimum value, the first quartile, the median, the third quartile, and the maximum value. The numbers inside the boxplot are the median values. Different letters indicate significant differences among phenological classes based on pairwise comparisons of estimated marginal means, with p-values adjusted using the Holm method.
The bud burst (class 3) occurred at a median accumulation of approximately 68 GDD and a median timing of DOY 117 (27 April), at which at least half of the provenances mark the transition from winter dormancy to active vegetative growth. The results suggest that accumulating approximately 68 GDD above the 5 °C base temperature is generally sufficient to trigger bud burst under the climatic conditions of the study area. The thermal requirements are double those for class 2.
The most pronounced increase in thermal forcing was observed between classes 5 and 6, where the median GDD increased by approximately 105 units. This result indicates that the transition between the two classes requires substantially greater thermal forcing than the earlier phases of bud development. A further increase of approximately 60 GDD was observed for the final stage of leaf development.
3.1.3. Provenances’ Thermal Requirements for the Onset of Spring Phenology
In spring phenology analyses, bud burst is considered the most important developmental stage, as it marks the onset of the growing season. Given its ecological and adaptive significance, the results on spring phenological variation among provenances are presented for this phenological stage.
The model results revealed significant differences among provenances in the thermal requirements to reach bud burst. In addition, it explained a substantial proportion of the observed variation, although interannual variability accounted for a larger share of the total variance than provenance effects. Estimated thermal requirements ranged from 57 to 94 GDD, indicating distinct phenological patterns. Provenances with lower thermal requirements entered the growing season after accumulating less heat, whereas provenances with higher thermal requirements required a greater accumulation of thermal forcing.
According to the results obtained (Table 4), the earliest was the German provenance 104, with an estimated thermal requirement of 57 GDD, followed by the Slovakian provenance 124 and the Czech provenance 111. At the opposite pole, the latest was the French provenance 15, which required approximately 94 GDD to reach bud burst, followed by the German provenances 92 and 36. The difference between the most sensitive and the most conservative provenance was approximately 36 GDD, indicating clear genetic differentiation in receptivity to spring warming. The Romanian provenances (147 and 151) showed similar GDD and were close to those with lower thermal requirements for bud burst. In addition, no consistent relationships were found between phenological traits and the geographical characteristics of the provenance origins (longitude, latitude, and elevation). The variation associated with year was greater than the variation attributable to provenance, suggesting that although genetic differences are evident, the climatic conditions specific to each year remain the primary factor influencing the timing of bud burst and the onset of the growing season.
Table 4.
Provenances’ cumulative GDD for bud burst.
3.2. Senescence
3.2.1. Evaluating the Differences Among the Senescence Classes
The processes associated with autumn senescence exhibited high variability among all tested provenances and across all phenological stages, except for the provenance effect in the fifth class (Table 5). Year was identified as the factor explaining the largest variation (p < 0.0001 ****), and its effect remained consistently significant across all senescence classes, indicating the strong influence of annual climatic conditions, whose fluctuations lead to shifts in the timing of senescence. At the replication level, significant differences were detected across all stages; however, the variation observed for the 5% yellowing class was relatively low (p < 0.05 *), indicating weaker differentiation at the beginning of senescence than in the subsequent stages of this process. Regarding provenance, differences were highly significant (p < 0.0001 ****) for the first four stages, indicating considerable variation among the tested provenances. In contrast, no significant differences among provenances were detected for the final stage (winter dormancy), suggesting a convergence of provenance responses. This pattern may indicate that the attainment of complete dormancy is influenced by a cumulus of environmental factors, leading to a more homogeneous response among provenances.
Table 5.
The analysis of DOY variability in the senescence classes.
3.2.2. The Influence of Climatic Factors on Senescence
As with the spring phenology model, the senescence model identified SDD as the principal climatic driver of this process, but all climatic predictors had significant effects (Table 6). This aspect was observed when removing SDD produced the largest reduction in marginal R2m, indicating that cumulative cooling contributed more strongly to model performance than PP_14 or PAR. Increased precipitation (PP_14) was associated with delayed senescence, whereas higher PAR values promoted earlier senescence progression. Although the random effect of year remained significant, its contribution was small because the interannual differences not captured by SDD, PP_14, and PAR contributed only modestly to the overall explanatory performance of the model.
Table 6.
Fixed and random effects of the senescence model.
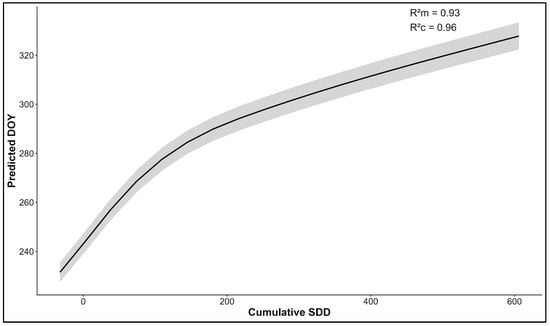
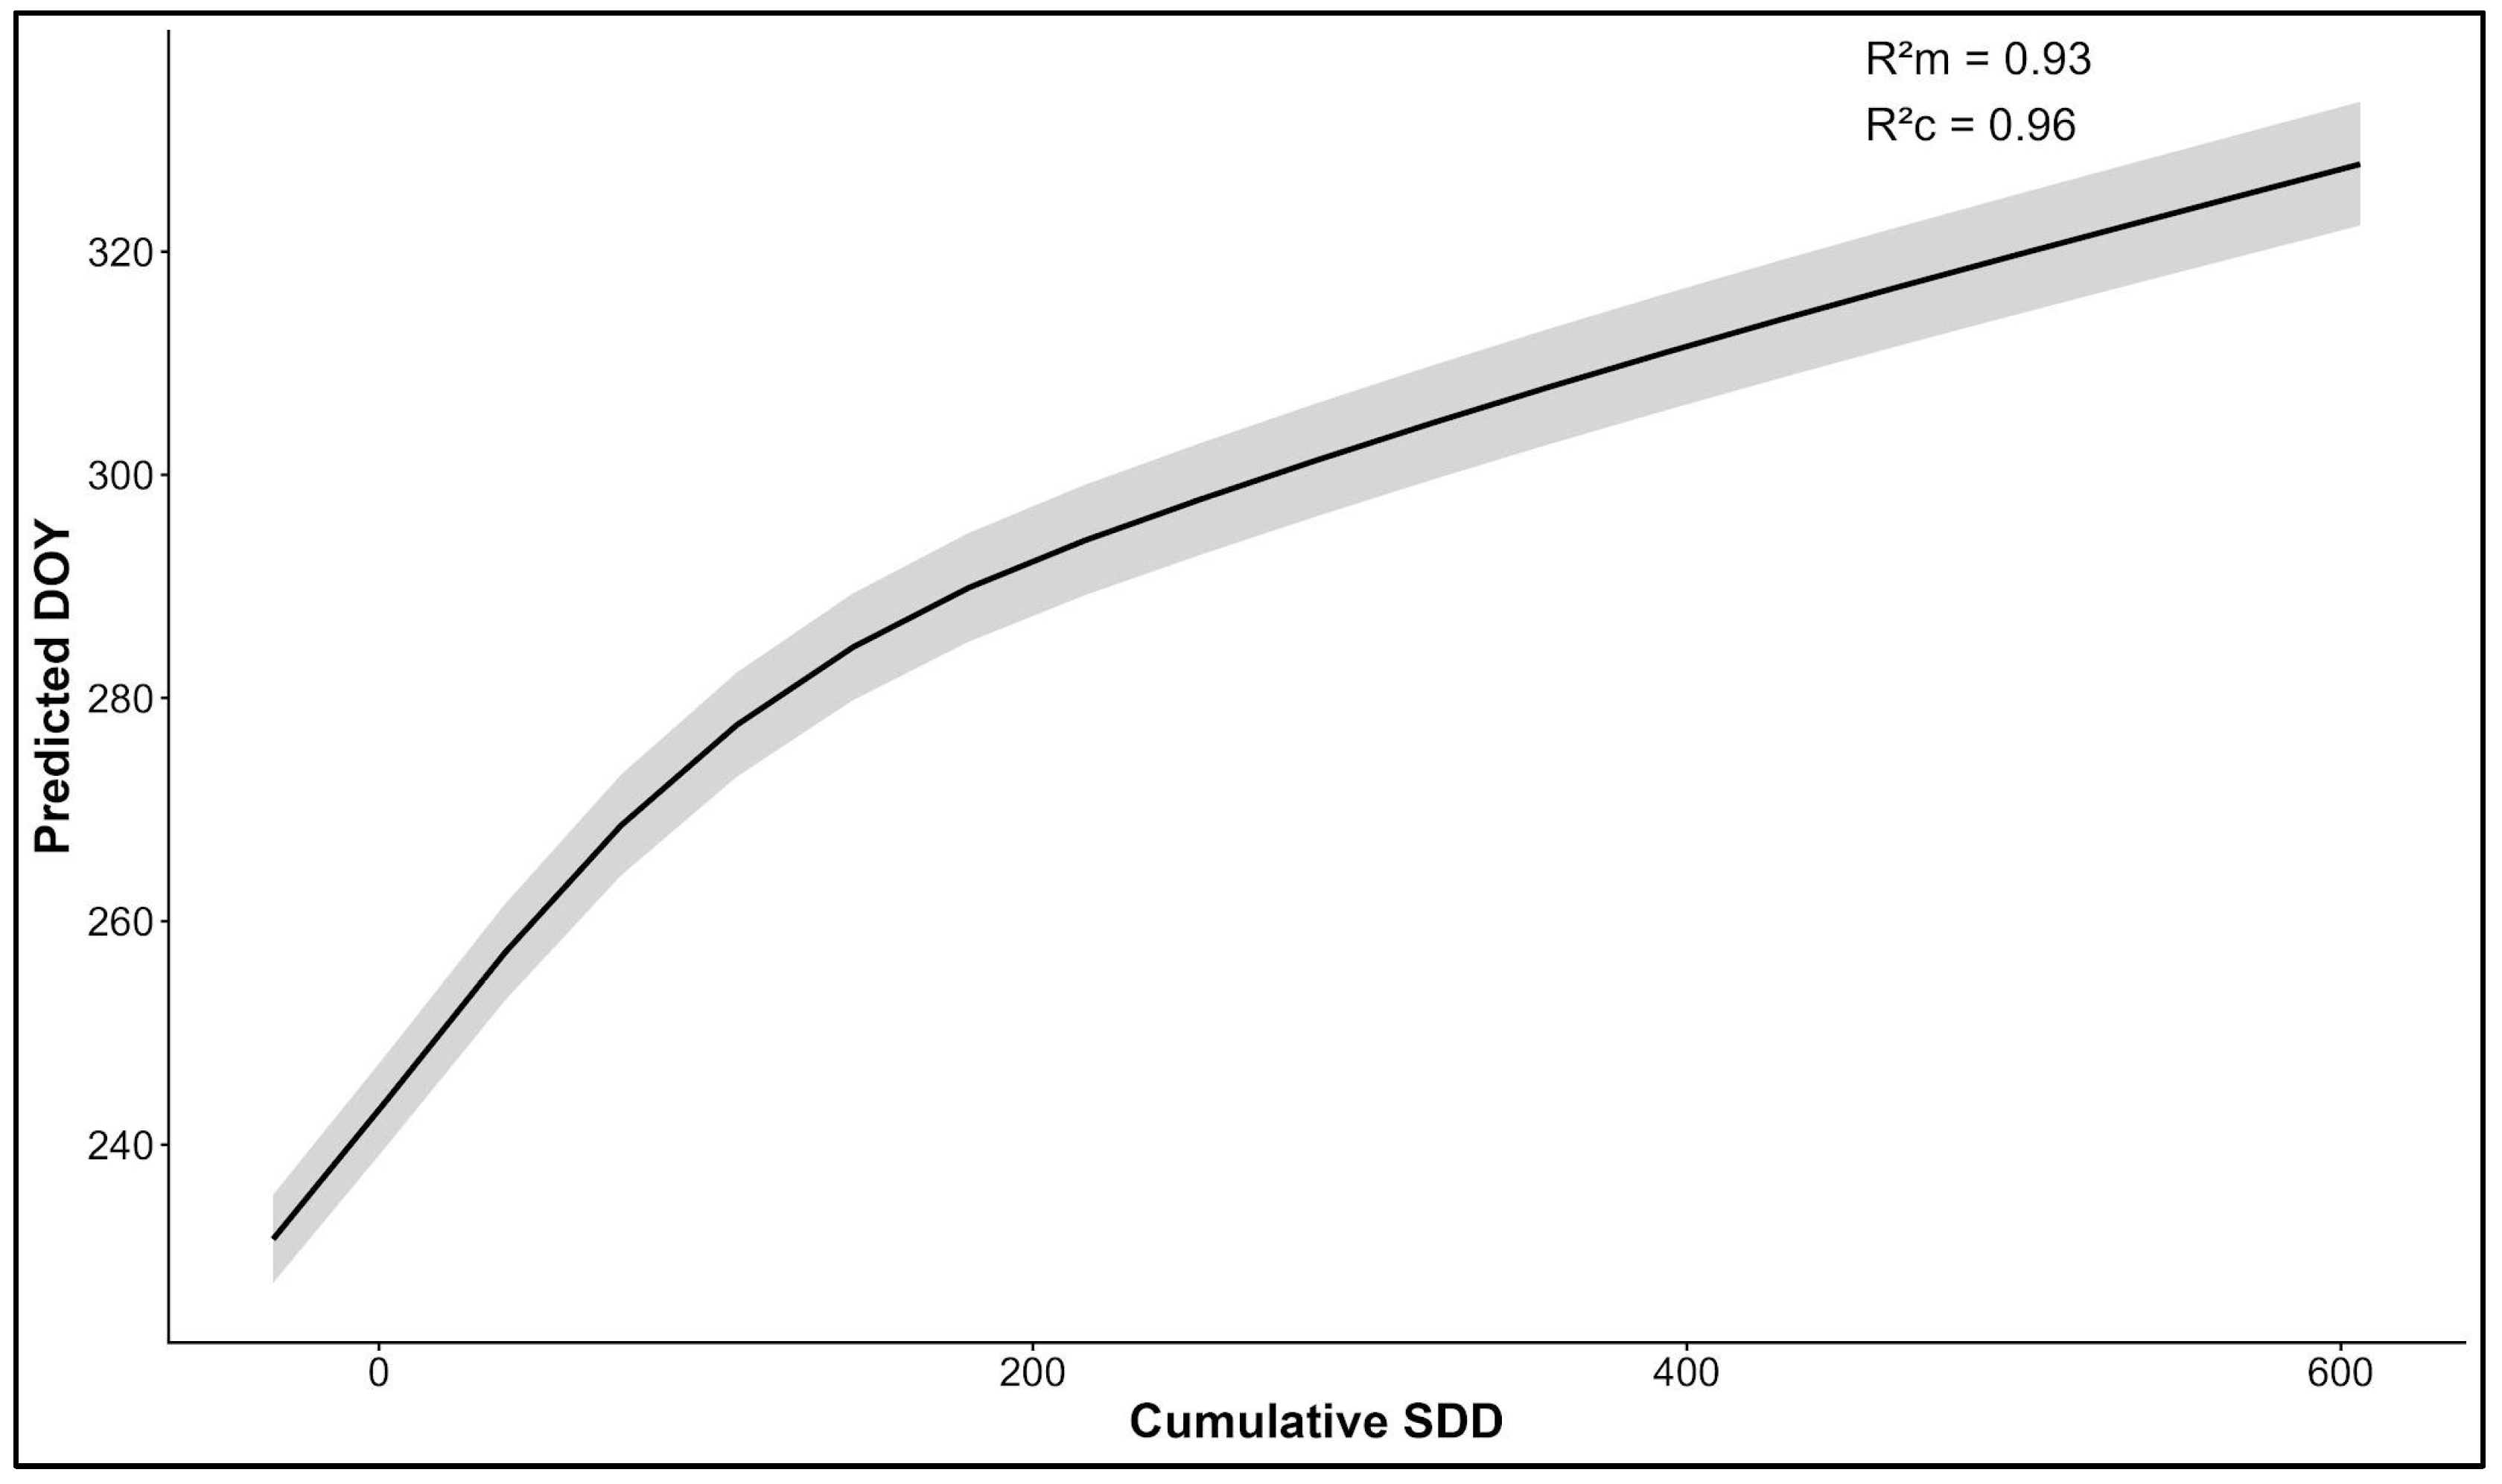
The climatic predictors explained 93% of the observed variation (R2m), indicating the predominant role of climatic parameters in controlling the senescence process, while annual variability had a lower impact, increasing the explained variation to only 3% (R2c = 96%). These results indicate that interannual variability had a relatively limited influence on the development of senescence compared with spring phenology. Among the climatic variables considered, cumulative cooling below the 15 °C threshold (SDD) was the dominant environmental driver of senescence. Therefore, as the number of cooling units increased, senescence progressed towards leaf fall. This pattern was evident during the initial phase of senescence (approximately DOY 240–280), when the curve showed the greatest increase, suggesting a strong sensitivity of senescence progression to the accumulation of SDD. Beyond this interval, the slope of the curve shows no abrupt increase while maintaining an upward trend, indicating a slightly lower dependence of the last senescence classes on additional SDD accumulation. This pattern suggests that cooling conditions play a more important role during the onset of senescence, whereas later stages become progressively less responsive to further decreases in temperature and may be influenced by other environmental factors, such as photoperiod or precipitation. Overall, the results suggest that senescence was more tightly coupled to climatic forcing and exhibited greater temporal stability than spring phenology, which was more strongly affected by interannual climatic variability (Figure 5).
Figure 5.
The influence of thermal forcing on senescence. R2m is the marginal coefficient of determination, and R2c is the conditional coefficient of determination.
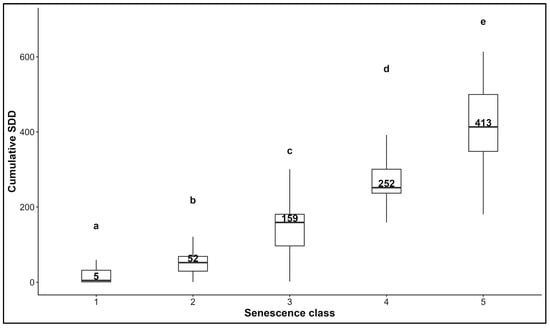
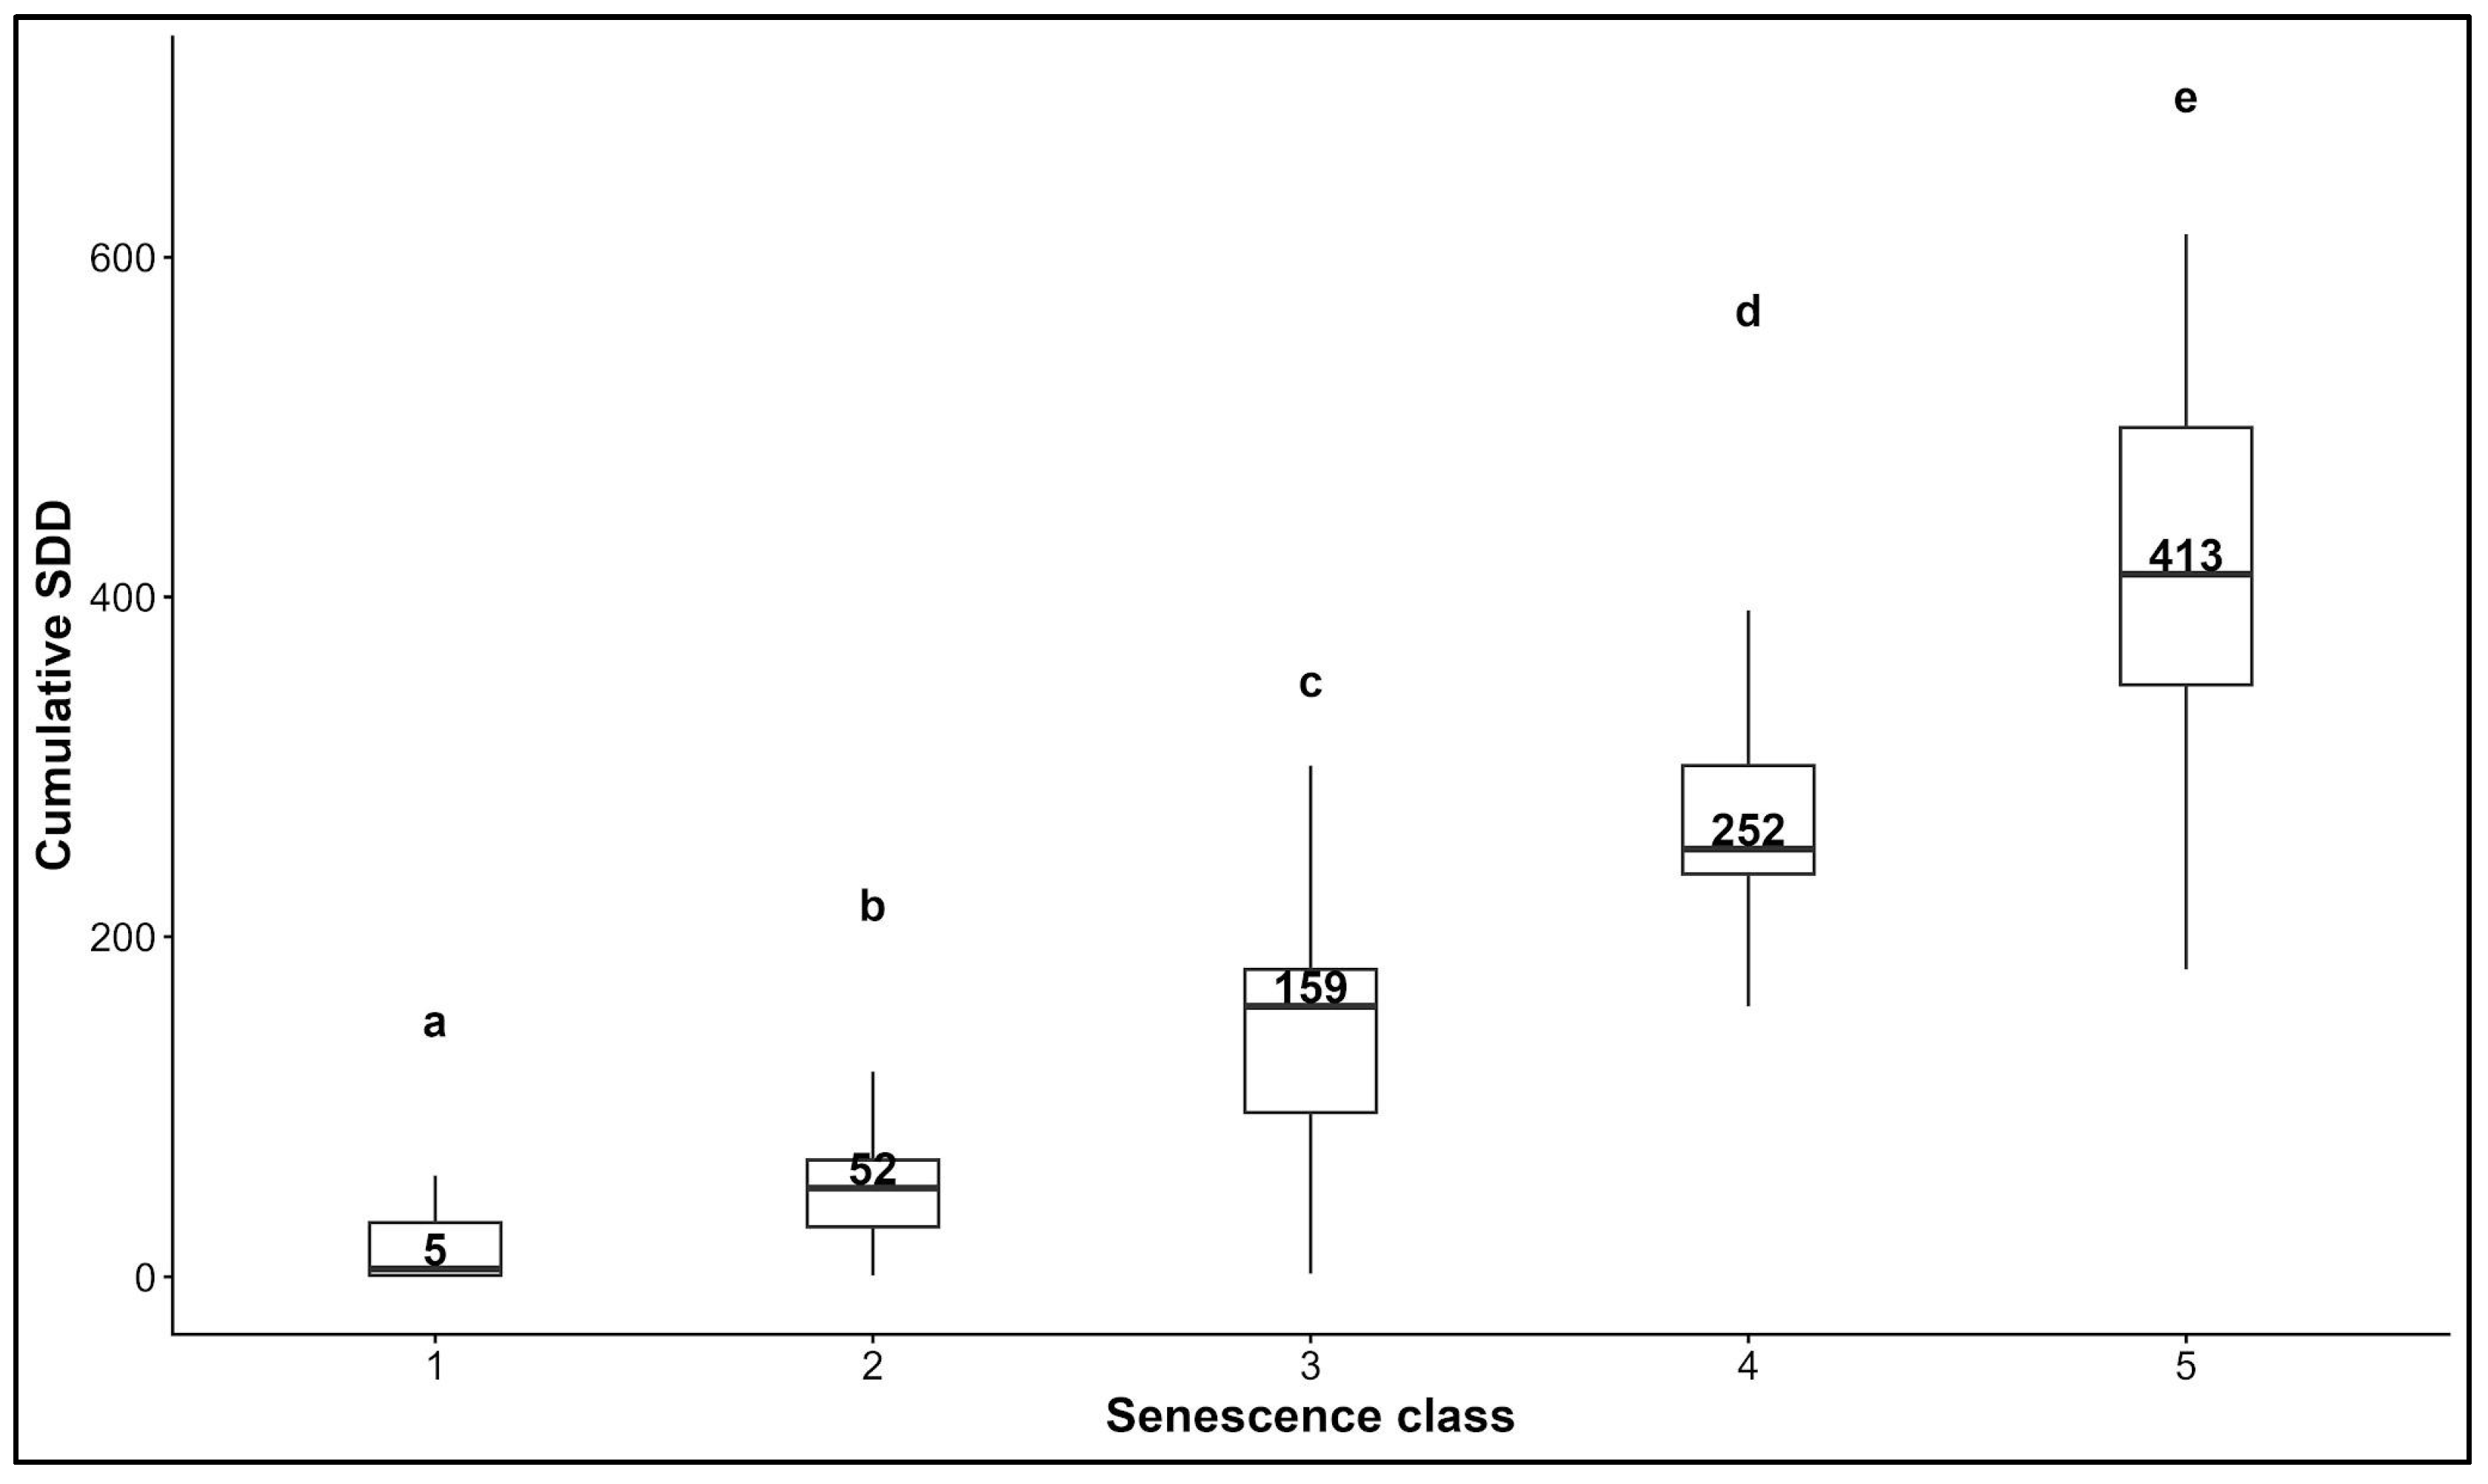
The progression of senescence was closely associated with increasing cumulative cooling requirements (SDD). Median SDD values increased steadily from 5 units in the fully green stage (class 1) to 413 units in the final senescence stage (class 5), confirming the strong influence of cooling accumulation on senescence development. The most pronounced increase in cooling requirements during the early phase of senescence was observed between classes 2 and 3, where median SDD increased by approximately 107 units (from 52 to 159 SDD). Since class 3 corresponds to 50% leaf yellowing, this result suggests the existence of a critical cooling threshold required to initiate visible senescence. On average, this stage was reached around DOY 285, corresponding to approximately 12 October. A second major increase was observed between classes 4 and 5 (+162 SDD), indicating that the completion of senescence requires prolonged exposure to cooling conditions. Overall, the results suggest that autumn phenological stages are separated by distinct thermal thresholds, with the strongest transitions occurring at the onset and completion of senescence (Figure 6).
Figure 6.
The thermal forcing requirements for senescence classes. The boxplot describes the minimum value, the first quartile, the median, the third quartile, and the maximum value. The numbers inside the boxplot are the median values. Different letters indicate significant differences among phenological classes based on pairwise comparisons of estimated marginal means, with p-values adjusted using the Holm method.
3.2.3. Provenances’ Thermal Requirements for the Onset of Senescence
The onset of senescence is generally considered the defining stage of autumn phenology, marking the transition from active growth to dormancy. In the present study, the onset of senescence was associated with the 50% leaf yellowing stage (class 3); therefore, provenance-level analyses focused on this phenological threshold.
To quantify provenance-specific cooling requirements for the onset of senescence, a nonlinear model based on SDD was applied, using a base temperature of 15 °C. The results indicated that cumulative cooling represents a stable predictor of autumn phenology, with relatively limited interannual variation compared with the differences observed among provenances. This pattern suggests that genetic differentiation plays an important role in determining the thermal requirements for senescence among beech provenances tested in the Sacele trial. On average, senescence onset occurred after the accumulation of approximately 155–160 SDD, corresponding to the experiment’s overall mean thermal requirement. The observed range of provenance-specific cooling requirements spanned 107–182 SDD, indicating substantial variation among populations. Consequently, the latest provenance required approximately 70% more accumulated cooling than the earliest provenance did to reach the 50% yellowing stage.
At the Sacele trial (Table 7), the German provenance 104 was identified as the earliest to enter senescence, requiring only 107 SDD. It was followed by Polish provenance 114, which differed by only 9 SDD. In contrast, the latest provenances were 99, 72, and 69, originating from central and southern Germany, which required more than 180 SDD before reaching the onset of senescence.
Table 7.
Provenances’ cumulative SDD for 50% yellowing.
Most provenances were concentrated within a large intermediate group characterized by cooling requirements between 127 and 155 SDD. The two Romanian provenances, originating from Sovata (151) and Remeti (147), also belonged to this central group, requiring 154 and 149 SDD, respectively, to reach the 50% yellowing stage.
3.3. Length of the Growing Season
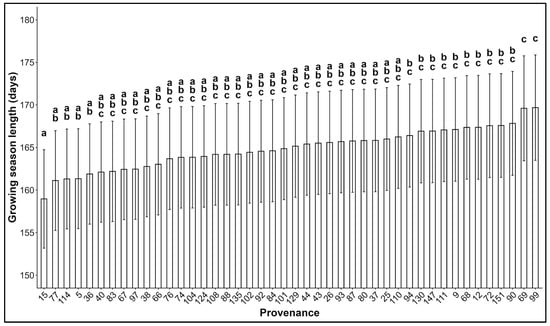
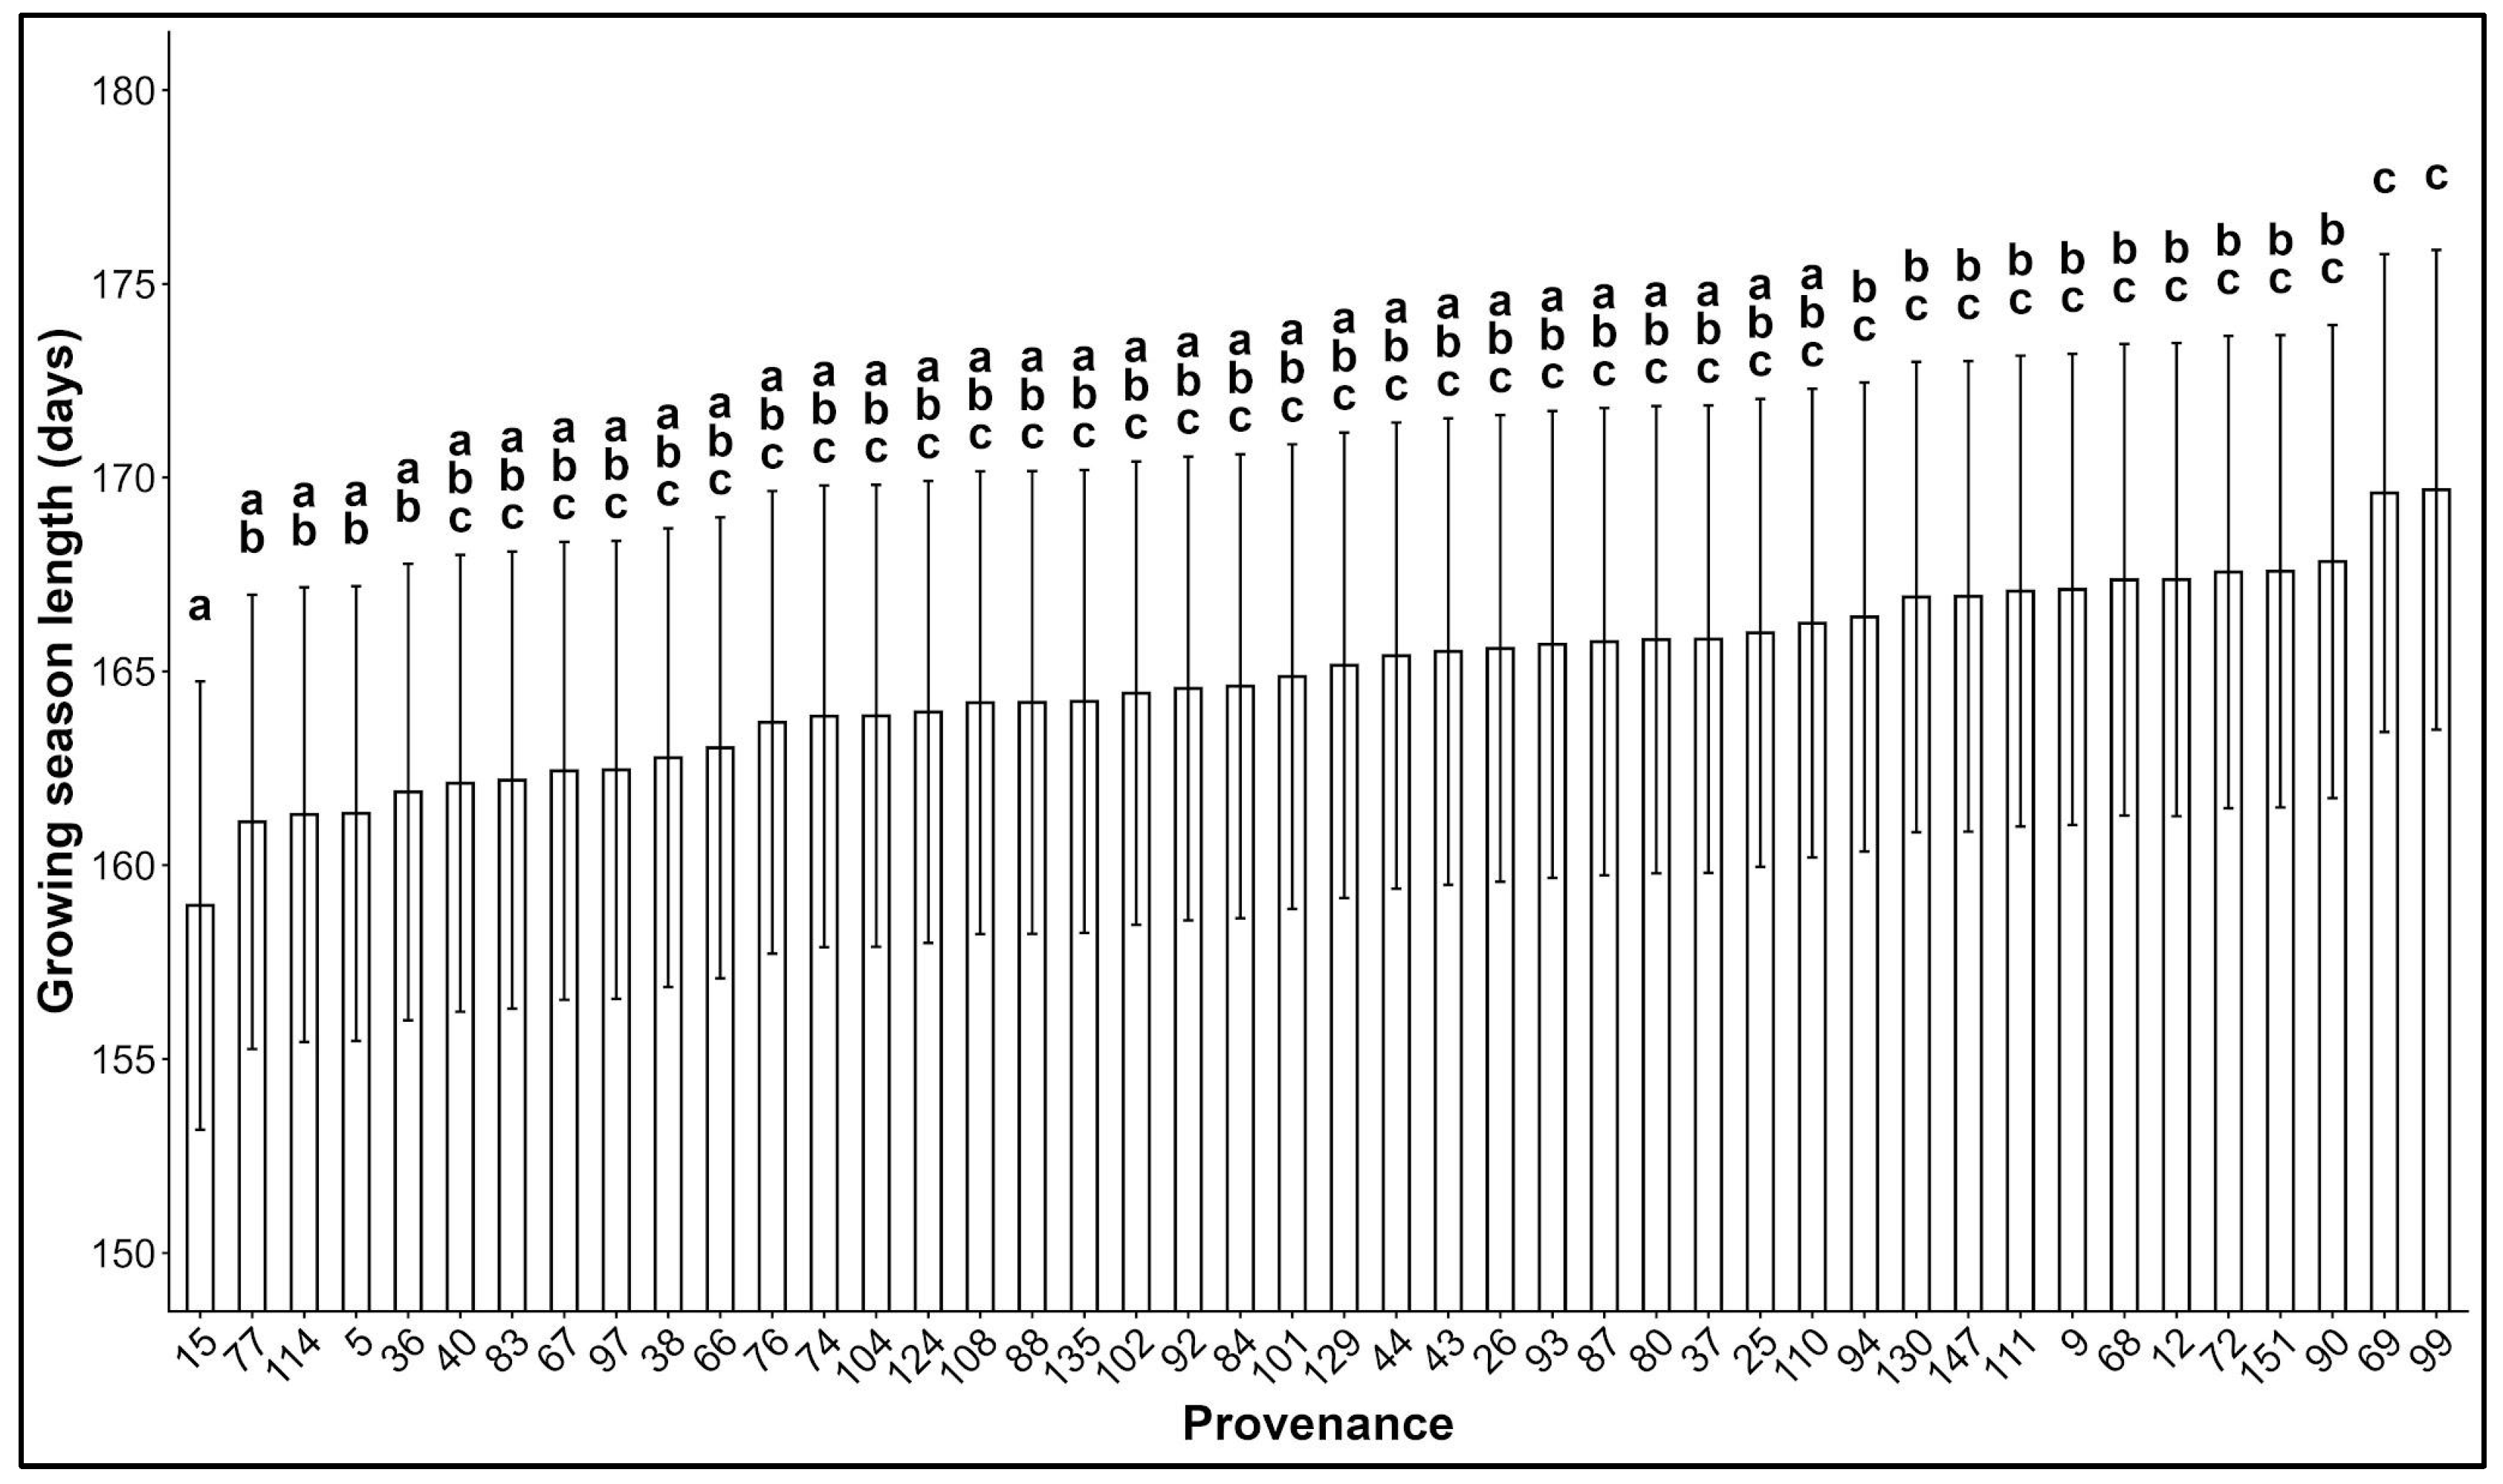
The mean growing season length was 162 days. The mixed-effects model revealed significant differences among provenances in growing season length, while inter-annual variation also contributed to the observed patterns. This trait was influenced by both interannual variation and, more prominently, by provenance effects, which were evident in each year of observation. Differences in growing season length reached up to 12 calendar days among provenances (Figure 7). These differences were most pronounced between the provenances with the shortest and longest growing season.
Figure 7.
Provenance growing season length. The black lines represent the standard error values. Different letters indicate significant differences among provenances based on pairwise comparisons of estimated marginal means, with p-values adjusted using the Holm method.
The shortest growing season was recorded for the French provenance 15, which was approximately three days shorter than the overall experimental mean. In contrast, the German provenances 69 and 99 displayed the longest growing seasons, exceeding the overall mean by more than eight days. Consistent with analyses of spring phenology and senescence, a large group of provenances exhibited similar growing season lengths (group including provenances 40 to 110). The Romanian provenances (147 and 151) were positioned within the group extending from provenances 94 to 90, characterized by significantly longer growing seasons, approximately six days above the experimental mean and approaching the values observed for the longest growing season provenances.
4. Discussion
4.1. Climatic Factors Determining Beech Provenances’ Phenology
Spring phenology and senescence are key phenological processes that influence the distribution, performance, and productivity of forest tree species [3,7]. Ongoing climate change continues to modify the duration and seasonal dynamics of the vegetation period [63]. As a result, tree populations are increasingly required to adjust their phenological dynamics and physiological activity to maintain performance under novel environmental conditions [10,64,65]. Consequently, understanding phenological variation among tree populations has become a major research priority, as it provides valuable information for assisted migration programs and supports the identification and deployment of provenances with enhanced adaptive capacity to future climatic conditions [66].
The present study aimed to assess the influence of site conditions on the phenological dynamics of beech provenances tested in the Sacele trial, with a particular focus on variation in the timing of spring phenology, senescence, and the length of the growing season.
Among the environmental factors controlling these processes, temperature is widely recognized as the dominant driver [9], although photoperiod and water availability may also contribute to the timing of phenological transitions [14,50]. In the present survey, the main focus was to analyze the annual phenological process in relation to the primary influence of temperature, as considered in numerous phenological studies on European beech [39,51,65,66,67].
The influence of temperature on spring phenology was assessed through the cumulative thermal requirements calculated based on GDD. The model’s accuracy effectively explains that spring phenological development is primarily regulated by cumulative thermal forcing in the preceding period, as reported by Menzel et al. [68] and by Vitasse et al. [69]. The progressive increase in GDD requirements across phenological stages indicates that bud burst and leaf development occur only after specific heat accumulation thresholds are met, rather than in response to the high temperatures near the phenological event [70]. The non-linear response of spring phenology to thermal accumulation indicates that phenological progression accelerates rapidly once specific heat accumulation thresholds are reached, but this response was not constant across the entire range of thermal conditions, indicating the implications of other factors in the leaf development process [71]. Therefore, the significant implications of PAR and cumulative precipitation (PP_14) suggest that, although thermal accumulation was the dominant environmental factor, both precipitation and light availability significantly enhanced model performance, confirming results from other studies that showed beech leaf development is also influenced by these climatic factors [50,72,73].
The timing of bud burst in the Sacele trial, associated with the onset of the vegetation season in at least half of the tested provenances, occurred after accumulating approximately 68 GDD above the 5 °C base temperature, which corresponds to the DOY 117 (27 April). This threshold is very similar to the one found by Ciocîrlan et al. [65] (60 GDD) in a study performed in natural beech stands near the Sacele trial. It also covers the temperature threshold for the onset of the growing season of the Carpathian beech forests [74].
Senescence showed an even stronger relationship with cumulative cooling than spring phenology did with heat accumulation. The high accuracy of the SDD model suggests that the progression of senescence is closely associated with the accumulation of temperatures below the selected threshold. Other studies support the primary influence of temperature on senescence, which influences the timing and the progression of this process [23,65,75]. The precipitation amount is another factor that triggers beech senescence [76], which was also found to significantly influence the senescence in the Sacele trial. In addition, the photoperiod is known as a key climatic factor that controls the senescence onset [14,23,77]. Similarly, PAR was shown to influence the progression of senescence in the analyzed beech provenances.
The effective onset of senescence was attributed to class 3, which occurred when 50% of the leaves turned yellow. To reach this stage, a cumulative cooling of 159 SDD was needed, which corresponds to 12 October (DOY 285). However, senescence exhibited a stronger climatic signal and lower interannual variability than spring phenology, indicating that senescence is more tightly constrained by accumulated cooling than spring phenology is by accumulated heat. The significant effect of the year detected for both spring phenology and senescence confirms the high sensitivity of beech phenology to interannual climatic variability [78,79]. As reported in previous studies, temperature is the main environmental factor controlling phenological processes, and even relatively small differences in seasonal thermal conditions can result in substantial shifts in the timing of leaf development and senescence [9,51,66,80,81].
4.2. Provenance Differentiation in Thermal Requirements for Phenological Processes
In the trial-level variability analyses, replication was a highly significant factor, highlighting the influence of microenvironmental variation on phenological processes. The role of microenvironmental conditions in shaping provenance responses was also reported by Besliu et al. [82] in a comparative Norway spruce provenance trial, and these conditions are also known to influence the timing and progression of beech phenology [14,77].
Provenance was another important factor that triggers the phenology process. Significant differences were observed in the early stages of both spring phenology and senescence, indicating genetic control of phenological processes. Similar findings have been reported in other beech provenance trials, where provenance-specific variation in phenological traits has been attributed to genetic differentiation among populations [31,33]. Consequently, the selection of provenances adapted to local environmental conditions is both feasible and necessary [30]. However, the effect of provenance was weaker than that of year or replication, suggesting that local environmental conditions exert a stronger influence on phenological development than genetic origin alone. This interpretation is consistent with the findings of Schueler and Liesebach [35], who investigated the phenological dynamics of international beech provenances established in two trials located in Germany and Austria, belonging to the same experimental series as the Sacele trial. Their results likewise highlighted the predominant role of site-specific environmental conditions in shaping phenological responses among provenances. To the same extent, Müller et al. [83] observed that among beech provenances tested in two trials in Germany, there was moderate differentiation in bud burst and even lower differentiation in the case of senescence. Altogether, this indicates that the genetic pattern is complemented by environmental factors in shaping phenological responses of common beech provenances. This fact was confirmed by Gárate-Escamilla et al. [84] who found a larger difference in phenology between provenances in the Slovak trial than in the German one.
The earliest bud burst was recorded for the Central European provenances 104 and 111, but also for the Slovakian provenance 124, indicating a higher sensitivity to spring temperature accumulation. Conversely, the French provenance 15 and the German provenances 92 and 36 exhibited the latest bud burst, suggesting a greater thermal requirement before starting the physiological activity. These findings are consistent with previous studies, which have identified Central European beech provenances as generally characterized by earlier spring phenology [85,86]. A similarly delayed flushing response of French beech provenances was reported by Jazbec et al. [34] in an international provenance trial in Croatia. The provenance 104 originates from a site elevation over 700 m in eastern Germany, while provenances 36 and 92 are transferred from low elevations of 25 to 140 m in the western part of the country, sustaining the trend that eastern provenances flush earlier, as a consequence of oceanic influence in western Europe [30,31].
The analyses of senescence enabled the identification of provenances that exhibit greater sensitivity to declining autumn temperatures. The provenances 104 and 114, originating from southeastern Germany and Poland, respectively, displayed the earliest onset of senescence and were therefore characterized by the most rapid autumn phenological response. Notably, provenance 104 was identified as the earliest provenance for both spring bud burst and autumn senescence (50% leaf yellowing), indicating a particularly high climatic sensitivity and a consistently accelerated phenological rhythm. In contrast, the German provenances 99, 72, and 69, originating from southern and central Germany, exhibited a greater cooling requirement before the onset of senescence, resulting in the latest autumn phenological development among the tested provenances. Similar patterns have been reported in previous studies. In a beech provenance trial established in Poland, Chmura and Rozkowski [87] found that provenances originating from the eastern and southern regions of the country began senescence earlier than other tested populations. Likewise, Petkova et al. [88] reported that a provenance from southern Germany exhibited the earliest onset of leaf yellowing in a comparative beech trial in Bulgaria. In addition, Besliu et al. [89] observed that provenance 104 registered the highest stem quality from those tested in the 1994 trials in Romania, which may be a link between faster cessation, which favors the avoidance of the negative impact of autumn frosts [90]. These findings support classifying the German provenance 104 and the Polish provenance 114 as the most responsive to autumn cooling in the Sacele trial.
The identification of provenances exhibiting contrasting patterns in the timing of bud burst and senescence highlights the need for careful consideration when selecting reproductive material for artificial regeneration. Provenances characterized by particularly early or late phenological development may be more vulnerable to late-spring or early-autumn frost events, potentially affecting their survival and growth performance [33,87,91]. Consequently, the transfer of forest reproductive material should be based on a careful evaluation of provenance-specific phenological responses and their compatibility with local and future climatic conditions, particularly in the context of assisted migration strategies and ongoing climate change [92].
Interestingly, both Romanian provenances (147 and 151) occupied an intermediate position for the onset of senescence, despite belonging to the relatively early-flushing group during spring. This combination suggests a phenological strategy characterized by an early start of the growing season without a correspondingly early cessation of growth. As a result, these provenances maintained a relatively long growing season compared with the experimental average. Such a strategy may extend the period available for carbon assimilation and growth while avoiding prolonged growing seasons and may be considered a long-term adaptation to Carpathian environmental conditions. Similar patterns have been reported in common-garden studies of European beech, where bud burst and leaf senescence jointly determined growing season length and reflected genetically differentiated adaptive strategies among populations [31].
The mean growing season length recorded in the present study was 162 days, with a difference of up to 12 days between the earliest and latest provenances. A comparable level of variation was reported by Bigler and Vitasse [70], who observed an average growing season length of approximately 149 days and an interannual variation of 12 days over a 26-year observation period. Similarly, Ciocîrlan et al. [51] identified a growing season of up to 150 days in the Carpathian beech forest located in the same region as the Sacele trial. The French provenance 15 exhibited the shortest growing season, approximately three days shorter than the experimental mean. This provenance was also identified as one of the latest to initiate spring phenology, contributing to its reduced growing period. In contrast, the German provenances 69 and 99 had growing seasons approximately eight days longer than average and were classified as having the longest periods of vegetative activity. These German provenances were also ranked among the best-performing provenances for growth traits in the Sacele trial [93]. This finding supports the widely reported positive relationship between growing season length and growth performance in European beech, whereby an extended period of photosynthetic activity allows for greater carbon assimilation and, consequently, enhanced growth potential [33,94]. These results indicate that differences in growing season length were primarily driven by the combined timing of spring flushing and autumn senescence. Similar conclusions have been drawn for European beech, where bud burst and leaf senescence were identified as the two phenological processes determining the duration of the growing season [84,95]. Therefore, growing season length should be considered an integrative trait that reflects the phenological strategies expressed at both ends of the vegetative period and provides insight into the adaptive responses of beech populations to local environmental conditions.
4.3. Study Limitations and Future Research Directions
The current results may be limited because the phenological analyses were conducted in a single trial, and the assessment of provenance responses across contrasting climatic environments was not possible. On the other hand, increasing the frequency of observations would improve the precision of phenological monitoring.
Future studies combining common garden experiments, UAV-based phenological monitoring, and leaf-level physiological assessments could provide a more comprehensive understanding of the adaptive mechanisms underlying phenological variation in European beech populations in response to ongoing climate change.
5. Conclusions
While thermal accumulation was the primary factor influencing both spring and autumn leaf phenology, precipitation and photosynthetically active radiation also played significant roles in the response of the European beech provenance. This indicates that thermal accumulation is a reliable predictor of both spring and autumn phenology in European beech, but phenological progression results from interactions among temperature, water availability, and light conditions.
The observed differences among provenances indicate a genetic effect in the regulation of the phenological process in European beech. Despite the stronger influence of other factors, the tested populations showed distinct thermal requirements for both spring phenology and senescence, resulting in differences in growing season length and distinct adaptation responses to the trial site conditions.
The identification of both early and late flushing provenances, along with contrasting cooling requirements for senescence, suggests that transferred populations may experience different levels of exposure to late spring and early autumn frost events. Therefore, in provenance selection or assisted migration practices, leaf phenology and thermal requirements are particularly important in addition to growth performance.
Author Contributions
Conceptualization, E.B., A.L.C. and M.B.; methodology E.B., A.L.C. and M.B.; software, E.B.; validation, A.L.C. and M.B.; formal analysis, E.B.; investigation, E.B. and M.B.; resources, E.B. and M.B.; data curation, M.B.; writing—original draft preparation, E.B.; writing—review and editing, E.B., M.B. and A.L.C.; visualization, E.B.; supervision, A.L.C.; project administration, M.B.; funding acquisition, M.B. All authors have read and agreed to the published version of the manuscript.
Funding
This paper was supported by the Romanian Ministry of Education and Research, through the project PN23090303 (Nucleu Programme 2023–2026), contracted with the National Institute for Research and Development in Forestry “Marin Drăcea” and within the PN-IV-P8-8.1-PRE-HE-ORG-2024-0187 project (contract 71PHE/2024) financed by the Romanian CNCS/CCCDI-UEFISCDI.
Data Availability Statement
The raw data supporting the conclusions of this article will be made available by the authors on request.
Acknowledgments
We are grateful to our colleagues Dan Pepelea and Gabriela Grosu for their involvement in data collection.
Conflicts of Interest
The authors declare no conflicts of interest. The funders had no role in the design of the study; in the collection, analysis, or interpretation of data; in the writing of the manuscript; or in the decision to publish the results.
Abbreviations
The following abbreviations are used in this manuscript:
| DOY | Day Of the Year |
| Temp | Mean Temperature |
| T_min | Minimum Temperature |
| T_max | Maximum Temperature |
| PAR | Sum of Diurnal Photosynthetically Active Radiation |
| GDD | Growing Degree Days |
| SDD | Senescence Degree Days |
| PP_sum | Sum of Precipitation |
| PP_14 | Cumulative Precipitation Over the Preceding 14-Days |
References
- Booth, T.H.; Nix, H.A.; Hutchinson, M.F.; Jovanic, T. Niche analysis and tree species introduction. For. Ecol. Manag. 1988, 23, 47–59. [Google Scholar] [CrossRef] [Scilit]
- Svenning, J.C.; Fitzpatrick, M.C.; Normand, S.; Graham, C.H.; Pearman, P.B.; Iverson, L.R.; Skov, F. Geography, topography, and history affect realized-to-potential tree species richness patterns in Europe. Ecography 2010, 33, 1070–1080. [Google Scholar] [CrossRef] [Scilit]
- Chuine, I.; Beaubien, E.G. Phenology is a major determinant of tree species range. Ecol. Lett. 2001, 4, 500–510. [Google Scholar] [CrossRef] [Scilit]
- Hickler, T.; Vohland, K.; Feehan, J.; Miller, P.A.; Smith, B.; Costa, L.; Giesecke, T.; Fronzek, S.; Carter, T.R.; Cramer, W. Projecting the future distribution of European potential natural vegetation zones with a generalized, tree species-based dynamic vegetation model. Glob. Ecol. Biogeogr. 2012, 21, 50–63. [Google Scholar] [CrossRef] [Scilit]
- Pearson, R.G.; Dawson, T.P. Predicting the impacts of climate change on the distribution of species: Are bioclimate envelope models useful? Glob. Ecol. Biogeogr. 2003, 12, 361–371. [Google Scholar] [CrossRef] [Scilit]
- Körner, C.; Basler, D.; Hoch, G.; Kollas, C.; Lenz, A.; Randin, C.F.; Vitasse, Y.; Zimmermann, N.E. Where, why and how? Explaining the low-temperature range limits of temperate tree species. J. Ecol. 2016, 104, 1076–1088. [Google Scholar] [CrossRef] [Scilit]
- Chuine, I. Why does phenology drive species distribution? Philos. Trans. R. Soc. B Biol. Sci. 2010, 365, 3149–3160. [Google Scholar] [CrossRef] [Scilit] [PubMed]
- Royer-Tardif, S.; Boisvert-Marsh, L.; Godbout, J.; Isabel, N.; Aubin, I. Finding common ground: Toward comparable indicators of adaptive capacity of tree species to a changing climate. Ecol. Evol. 2021, 11, 13081–13100. [Google Scholar] [CrossRef] [Scilit] [PubMed]
- Chuine, I.; Cour, P. Climatic determinants of budburst seasonality in four temperate-zone tree species. New Phytol. 1999, 143, 339–349. [Google Scholar] [CrossRef] [Scilit]
- Badeck, F.-W.; Bondeau, A.; Böttcher, K.; Doktor, D.; Lucht, W.; Schaber, J.; Sitch, S. Responses of spring phenology to climate change. New Phytol. 2004, 162, 295–309. [Google Scholar] [CrossRef] [Scilit]
- Zohner, C.M.; Renner, S.S.; Sebald, V.; Crowther, T.W. How changes in spring and autumn phenology translate into growth-experimental evidence of asymmetric effects. J. Ecol. 2021, 109, 2717–2728. [Google Scholar] [CrossRef] [Scilit]
- Zohner, C.M.; Mo, L.; Pugh, T.A.M.; Bastin, J.-F.; Crowther, T.W. Interactive climate factors restrict future increases in spring productivity of temperate and boreal trees. Glob. Chang. Biol. 2020, 26, 4042–4055. [Google Scholar] [CrossRef] [Scilit] [PubMed]
- Chen, M.; Melaas, E.K.; Gray, J.M.; Friedl, M.A.; Richardson, A.D. A new seasonal-deciduous spring phenology submodel in the Community Land Model 4.5: Impacts on carbon and water cycling under future climate scenarios. Glob. Chang. Biol. 2016, 22, 3675–3688. [Google Scholar] [CrossRef] [Scilit] [PubMed]
- Vitasse, Y.; Baumgarten, F.; Zohner, C.M.; Kaewthongrach, R.; Fu, Y.H.; Walde, M.G.; Moser, B. Impact of microclimatic conditions and resource availability on spring and autumn phenology of temperate tree seedlings. New Phytol. 2021, 232, 537–550. [Google Scholar] [CrossRef] [Scilit] [PubMed]
- Lee, H.; Calvin, K.; Dasgupta, D.; Krinner, G.; Mukherji, A.; Thorne, P.; Trisos, C.; Romero, J.; Aldunce, P.; Barret, K. IPCC, 2023: Climate Change 2023: Synthesis Report, Summary for Policymakers. Contribution of Working Groups I, II and III to the Sixth Assessment Report of the Intergovernmental Panel on Climate Change; Core Writing Team, Lee, H., Romero, J., Eds.; Intergovernmental Panel on Climate Change (IPCC): Geneva, Switzerland, 2023. [Google Scholar]
- Muñoz-Mazón, M.; Seidl, R. Warming-induced changes in leaf phenology could amplify the effects of spring drought on tree seedlings. Agric. For. Meteorol. 2026, 379, 111022. [Google Scholar] [CrossRef] [Scilit]
- Leuschner, C.; Meier, I.C.; Hertel, D. On the niche breadth of Fagus sylvatica: Soil nutrient status in 50 Central European beech stands on a broad range of bedrock types. Ann. For. Sci. 2006, 63, 355–368. [Google Scholar] [CrossRef] [Scilit]
- Leuschner, C. Drought response of European beech (Fagus sylvatica L.)—A review. Perspect. Plant Ecol. Evol. Syst. 2020, 47, 125576. [Google Scholar] [CrossRef] [Scilit]
- Fuchs, Z.; Vacek, Z.; Vacek, S.; Černý, J.; Cukor, J.; Šimůnek, V.; Gallo, J.; Hájek, V. Growth Responses of European Beech (Fagus sylvatica L.) and Oriental Beech (Fagus orientalis Lipsky) Along an Elevation Gradient Under Global Climate Change. Forests 2025, 16, 655. [Google Scholar] [CrossRef] [Scilit]
- Noce, S.; Cipriano, C.; Santini, M. Altitudinal shifting of major forest tree species in Italian mountains under climate change. Front. For. Glob. Chang. 2023, 6, 1250651. [Google Scholar] [CrossRef] [Scilit]
- Dolar, N.Š.; Castillo, E.M.D.; Serrano-Notivoli, R.; Arrillaga, M.D.L.; Novak, K.; Merela, M.; Čufar, K. Spatial and temporal variation of Fagus sylvatica growth in marginal areas under progressive climate change. Dendrochronologia 2023, 81, 126135. [Google Scholar] [CrossRef] [Scilit]
- Kasper, J.; Leuschner, C.; Walentowski, H.; Petritan, A.M.; Weigel, R. Winners and losers of climate warming: Declining growth in Fagus and Tilia vs. stable growth in three Quercus species in the natural beech–oak forest ecotone (western Romania). For. Ecol. Manag. 2022, 506, 119892. [Google Scholar] [CrossRef] [Scilit]
- Vitasse, Y.; François, C.; Delpierre, N.; Dufrêne, E.; Kremer, A.; Chuine, I.; Delzon, S. Assessing the effects of climate change on the phenology of European temperate trees. Agric. For. Meteorol. 2011, 151, 969–980. [Google Scholar] [CrossRef] [Scilit]
- Vitasse, Y.; Hoch, G.; Randin, C.F.; Lenz, A.; Kollas, C.; Scheepens, J.F.; Körner, C. Elevational adaptation and plasticity in seedling phenology of temperate deciduous tree species. Oecologia 2013, 171, 663–678. [Google Scholar] [CrossRef] [Scilit] [PubMed]
- Benito-Garzon, M.; Ha-Duong, M.; Frascaria-Lacoste, N.; Fernandez-Manharres, F. Extreme climate variability should be considered in forestry-assisted migration. BioScience 2013, 63, 317. [Google Scholar] [CrossRef] [Scilit][Green Version]
- Müller, M.; Leuschner, C.; Weithmann, G.; Weigel, R.; Banzragch, B.-E.; Steiner, W.; Gailing, O. A genome-wide genetic association study reveals SNPs significantly associated with environmental variables and specific leaf area in European beech. Physiol. Plant. 2024, 176, e14334. [Google Scholar] [CrossRef] [Scilit] [PubMed]
- Mátyás, C. Climatic adaptation of trees: Rediscovering provenance tests. Euphytica 1996, 92, 45–54. [Google Scholar] [CrossRef] [Scilit]
- Liepe, K.J.; van der Maaten, E.; van der Maaten-Theunissen, M.; Kormann, J.M.; Wolf, H.; Liesebach, M. Ecotypic variation in multiple traits of European beech: Selection of suitable provenances based on performance and stability. Eur. J. For. Res. 2024, 143, 831–845. [Google Scholar] [CrossRef] [Scilit]
- Von Wuehlisch, G. Series of international provenance trials of European beech. In Proceedings of the 7th International Beech Symposium IUFRO Research Group, Tehran, Iran, 10–20 May 2004; pp. 135–144. [Google Scholar]
- Von Wuehlisch, G.; Krusche, D.; Muhs, H.J. Variation in temperature sum requirement for flushing of beech provenances. Silvae Genet. 1995, 44, 343–346. [Google Scholar]
- Robson, T.M.; Rasztovits, E.; Aphalo, P.J.; Alia, R.; Aranda, I. Flushing phenology and fitness of European beech (Fagus sylvatica L.) provenances from a trial in La Rioja, Spain, segregate according to their climate of origin. Agric. For. Meteorol. 2013, 180, 76–85. [Google Scholar] [CrossRef] [Scilit]
- Thompson, D. Provenances of beech best suited for Ireland. In Proceedings of the Coford Connects, Wicklow, Ireland, 19 September 2007; p. 4. [Google Scholar]
- Gömöry, D.; Paule, L. Trade-off between height growth and spring flushing in common beech (Fagus sylvatica L.). Ann. For. Sci. 2011, 68, 975–984. [Google Scholar] [CrossRef] [Scilit]
- Jazbec, A.; Šegotić, K.; Ivanković, M.; Marjanović, H.; Perić, S. Ranking of European beech provenances in Croatia using statistical analysis and analytical hierarchy process. For. An. Int. J. For. Res. 2007, 80, 151–162. [Google Scholar] [CrossRef] [Scilit][Green Version]
- Schueler, S.; Liesebach, M. Latitudinal population transfer reduces temperature sum requirements for bud burst of European beech. Plant Ecol. 2015, 216, 111–122. [Google Scholar] [CrossRef] [Scilit]
- Besliu, E.; Curtu, A.L.; Apostol, E.N.; Budeanu, M. Using Adapted and Productive European Beech (Fagus sylvatica L.) Provenances as Future Solutions for Sustainable Forest Management in Romania. Land 2024, 13, 183. [Google Scholar] [CrossRef] [Scilit]
- Müller, M.; Kempen, T.; Finkeldey, R.; Gailing, O. Low population differentiation but high phenotypic plasticity of european beech in Germany. Forests 2020, 11, 1354. [Google Scholar] [CrossRef] [Scilit]
- Martínez-Sancho, E.; Rellstab, C.; Fonti, P.; Benito Garzón, M.; Bigler, C.; Miranda, J.C.; Ninot, M.A.; Chmura, D.J.; Clark, J.; Kjær, E.D.; et al. Genetic and plastic effects on trait variability in two major tree species: Insights from common garden experiments across Europe. For. Ecol. Manag. 2025, 597, 123126. [Google Scholar] [CrossRef] [Scilit]
- Kramer, K.; Ducousso, A.; Gömöry, D.; Hansen, J.K.; Ionita, L.; Liesebach, M.; Lorenţ, A.; Schüler, S.; Sulkowska, M.; De Vries, S. Chilling and forcing requirements for foliage bud burst of European beech (Fagus sylvatica L.) differ between provenances and are phenotypically plastic. Agric. For. Meteorol. 2017, 234, 172–181. [Google Scholar] [CrossRef] [Scilit]
- Wang, H.; Lin, S.; Dai, J.; Ge, Q. Modeling the effect of adaptation to future climate change on spring phenological trend of European beech (Fagus sylvatica L.). Sci. Total Environ. 2022, 846, 157540. [Google Scholar] [CrossRef] [Scilit] [PubMed]
- Chuine, I. A Unified Model for Budburst of Trees. J. Theor. Biol. 2000, 207, 337–347. [Google Scholar] [CrossRef] [Scilit] [PubMed]
- Basler, D. Evaluating phenological models for the prediction of leaf-out dates in six temperate tree species across central Europe. Agric. For. Meteorol. 2016, 217, 10–21. [Google Scholar] [CrossRef] [Scilit]
- Robson, T.M.; Garzón, M.B. Phenotypic trait variation measured on European genetic trials of Fagus sylvatica L. Sci. Data 2018, 5, 180149. [Google Scholar] [CrossRef] [Scilit] [PubMed]
- Liesebach, M. International beech provenance trial 1993/95—Site Schädtbek (Bu19-1). In Proceedings of the German Russian Conference on Forest Genetics—Proceedings—Ahrensburg, 21–23 November 2017; Johann Heinrich von Thünen-Institut: Braunschweig, Germany, 2017; pp. 131–137. [Google Scholar]
- Experimental Base Sacele. Management Plan of Production Unit II Tigai, Experimental Base Sacele. 2024; Unpublished.
- Caudullo, G.; Welk, E.; San-Miguel-Ayanz, J. Chorological maps for the main European woody species. Data Brief. 2017, 12, 662–666. [Google Scholar] [CrossRef] [Scilit] [PubMed]
- Sevdari, K.; Marmullaku, D. Shapefile of European Countries. Technical University of Denmark. Dataset. 2023. Available online: https://data.dtu.dk/articles/dataset/Shapefile_of_European_countries/23686383 (accessed on 15 May 2026).
- Du Cros, E.T.; Thiebaut, B.; Duval, H. Variability in beech: Budding, height growth and tree form. Ann. Des. Sci. For. 1988, 45, 383–398. [Google Scholar] [CrossRef] [Scilit]
- Schieber, B.; Janík, R.; Snopková, Z. Phenology of common beech (Fagus sylvatica L.) along the altitudinal gradient in Slovakia (Inner Western Carpathians). J. For. Sci. 2013, 59, 176–184. [Google Scholar] [CrossRef] [Scilit]
- Skvareninova, J.; Sitko, R.; Vido, J.; Snopková, Z.; Skvarenina, J. Phenological response of European beech (Fagus sylvatica L.) to climate change in the Western Carpathian climatic-geographical zones. Front. Plant Sci. 2024, 15, 1242695. [Google Scholar] [CrossRef] [Scilit] [PubMed]
- Ciocîrlan, M.I.C.; Ciocîrlan, E.; Chira, D.; Radu, G.R.; Păcurar, V.D.; Beșliu, E.; Zormpa, O.G.; Gailing, O.; Curtu, A.L. Large Differences in Bud Burst and Senescence between Low- and High-Altitude European Beech Populations along an Altitudinal Transect in the South-Eastern Carpathians. Forests 2024, 15, 468. [Google Scholar] [CrossRef] [Scilit]
- McMaster, G.S.; Wilhelm, W.W. Growing degree-days: One equation, two interpretations. Agric. For. Meteorol. 1997, 87, 291–300. [Google Scholar] [CrossRef] [Scilit]
- Murray, M.B.; Cannell, M.G.R.; Smith, R.I. Date of Budburst of Fifteen Tree Species in Britain Following Climatic Warming. J. Appl. Ecol. 1989, 26, 693–700. [Google Scholar] [CrossRef] [Scilit] [PubMed]
- R Core Team. R: A Language and Environment for Statistical Computing; R Foundation for Statistical Computing: Vienna, Austria, 2024. [Google Scholar]
- QGIS Development Team. QGIS Geographic Information System, 3.34.3; QGIS Association: Grüt, Switzerland, 2024. [Google Scholar]
- Conover, W.J. Practical Nonparametric Statistics; John Wiley & Sons: New York, NY, USA, 1999. [Google Scholar]
- Kruskal, W.H.; Wallis, W.A. Use of Ranks in One-Criterion Variance Analysis. J. Am. Stat. Assoc. 1952, 47, 583–621. [Google Scholar] [CrossRef]
- Brooks, M.E.; Kristensen, K.; Van Benthem, K.J.; Magnusson, A.; Berg, C.W.; Nielsen, A.; Skaug, H.J.; Mächler, M.; Bolker, B.M. GlmmTMB balances speed and flexibility among packages for zero-inflated generalized linear mixed modeling. R J. 2017, 9, 378–400. [Google Scholar] [CrossRef] [Scilit]
- Drobyshev, I.; Övergaard, R.; Saygin, I.; Niklasson, M.; Hickler, T.; Karlsson, M.; Sykes, M.T. Masting behaviour and dendrochronology of European beech (Fagus sylvatica L.) in southern Sweden. For. Ecol. Manag. 2010, 259, 2160–2171. [Google Scholar] [CrossRef] [Scilit]
- Lenth, R. emmeans: Estimated Marginal Means, aka Least-Squares Means, R package version 1.8.5; CRAN: Vienna, Austria, 2023. [Google Scholar]
- Wickham, H. Ggplot2. Wiley Interdiscip. Rev. Comput. Stat. 2011, 3, 180–185. [Google Scholar] [CrossRef] [Scilit]
- Dunn, O.J. Multiple Comparisons Using Rank Sums. Technometrics 1964, 6, 241–252. [Google Scholar] [CrossRef]
- Corona, C.; Guiot, J.; Edouard, J.L.; Chalié, F.; Büntgen, U.; Nola, P.; Urbinati, C. Millennium-long summer temperature variations in the European Alps as reconstructed from tree rings. Clim. Past. 2010, 6, 379–400. [Google Scholar] [CrossRef] [Scilit]
- Aitken, S.N.; Yeaman, S.; Holliday, J.A.; Wang, T.; Curtis-McLane, S. Adaptation, migration or extirpation: Climate change outcomes for tree populations. Evol. Appl. 2008, 1, 95–111. [Google Scholar] [CrossRef] [Scilit] [PubMed]
- Ciocîrlan, M.I.C.; Curtu, A.L.; Radu, G.R. Predicting Leaf Phenology in Forest Tree Species Using UAVs and Satellite Images: A Case Study for European Beech (Fagus sylvatica L.). Remote Sens. 2022, 14, 6198. [Google Scholar] [CrossRef] [Scilit]
- Vitasse, Y.; Delzon, S.; Bresson, C.C.; Michalet, R.; Kremer, A. Altitudinal differentiation in growth and phenology among populations of temperate-zone tree species growing in a common garden. Can. J. For. Res. 2009, 39, 1259–1269. [Google Scholar] [CrossRef] [Scilit]
- Vitasse, Y.; Bresson, C.C.; Kremer, A.; Michalet, R.; Delzon, S. Quantifying phenological plasticity to temperature in two temperate tree species. Funct. Ecol. 2010, 24, 1211–1218. [Google Scholar] [CrossRef] [Scilit]
- Menzel, A.; Sparks, T.H.; Estrella, N.; Koch, E.; Aasa, A.; Ahas, R.; Alm-Kübler, K.; Bissolli, P.; Braslavská, O.G.; Briede, A.; et al. European phenological response to climate change matches the warming pattern. Glob. Chang. Biol. 2006, 12, 1969–1976. [Google Scholar] [CrossRef] [Scilit]
- Vitasse, Y.; Delzon, S.; Dufrêne, E.; Pontailler, J.-Y.; Louvet, J.-M.; Kremer, A.; Michalet, R. Leaf phenology sensitivity to temperature in European trees: Do within-species populations exhibit similar responses? Agric. For. Meteorol. 2009, 149, 735–744. [Google Scholar] [CrossRef] [Scilit]
- Bigler, C.; Vitasse, Y. Daily Maximum Temperatures Induce Lagged Effects on Leaf Unfolding in Temperate Woody Species Across Large Elevational Gradients. Front. Plant Sci. 2019, 10, 398. [Google Scholar] [CrossRef] [Scilit] [PubMed]
- Jochner, S.; Sparks, T.H.; Laube, J.; Menzel, A. Can we detect a nonlinear response to temperature in European plant phenology? Int. J. Biometeorol. 2016, 60, 1551–1561. [Google Scholar] [CrossRef] [Scilit] [PubMed]
- Vitasse, Y.; Basler, D. What role for photoperiod in the bud burst phenology of European beech. Eur. J. For. Res. 2013, 132, 1–8. [Google Scholar] [CrossRef] [Scilit]
- Vilhar, U.; De Groot, M.; Zust, A.; Skudnik, M.; Simoncic, P. Predicting phenology of European beech in forest habitats. iForest-Biogeosciences For. 2018, 11, 41–47. [Google Scholar] [CrossRef] [Scilit]
- Popescu, R.; Șofletea, N. Spring and autumn phenology in sub-mesothermal beech stands from the southwestern extremity of the Carpathians. Not. Bot. Horti Agrobot. Cluj.-Napoca 2020, 48, 1057–1069. [Google Scholar] [CrossRef] [Scilit]
- Fu, Y.H.; Piao, S.; Delpierre, N.; Hao, F.; Hänninen, H.; Liu, Y.; Sun, W.; Janssens, I.A.; Campioli, M. Larger temperature response of autumn leaf senescence than spring leaf-out phenology. Glob. Chang. Biol. 2018, 24, 2159–2168. [Google Scholar] [CrossRef] [Scilit] [PubMed]
- Walde, M.G.; Gessler, A.; Vitasse, Y. Effects of reduced precipitation and advanced spring phenology on intra- and interspecific competition between beech, oak and linden saplings. J. Ecol. 2026, 114, e70231. [Google Scholar] [CrossRef] [Scilit]
- Gressler, E.; Jochner, S.; Capdevielle-Vargas, R.M.; Morellato, L.P.C.; Menzel, A. Vertical variation in autumn leaf phenology of Fagus sylvatica L. in southern Germany. Agric. For. Meteorol. 2015, 201, 176–186. [Google Scholar] [CrossRef] [Scilit]
- Kolář, T.; Giagli, K.; Trnka, M.; Bednářová, E.; Vavrčík, H.; Rybníček, M. Response of the leaf phenology and tree-ring width of European beech to climate variability. Silva Fenn. 2016, 50, 1520. [Google Scholar] [CrossRef] [Scilit]
- Čufar, K.; De Luis, M.; Saz, M.A.; Črepinšek, Z.; Kajfež-Bogataj, L. Temporal shifts in leaf phenology of beech (Fagus sylvatica) depend on elevation. Trees 2012, 26, 1091–1100. [Google Scholar] [CrossRef] [Scilit]
- Delpierre, N.; Vitasse, Y.; Chuine, I.; Guillemot, J.; Bazot, S.; Rutishauser, T.; Rathgeber, C.B.K. Temperate and boreal forest tree phenology: From organ-scale processes to terrestrial ecosystem models. Ann. For. Sci. 2016, 73, 5–25. [Google Scholar] [CrossRef] [Scilit]
- Nezval, O.; Foltýnová, L.; Fajstavr, M.; Krejza, J.; Šigut, L.; Světlík, J.; Řehořková, Š.; Stojanović, M. Temperature-Driven onset and light quality-linked senescence in Fagus sylvatica phenology. Agric. For. Meteorol. 2025, 375, 110834. [Google Scholar] [CrossRef] [Scilit]
- Besliu, E.; Budeanu, M.; Apostol, E.N.; Radu, R.G. Microenvironment Impact on Survival Rate, Growth and Stability Traits, in a Half-Sib Test of Pendula and Pyramidalis Varieties of Norway Spruce. Forests 2022, 13, 1691. [Google Scholar] [CrossRef] [Scilit]
- Müller, M.; Schmidt, D.; Hofmann, M.; Steiner, W.; Gailing, O. Limited provenance differentiation and trait-dependent site effects revealed in a European beech provenance trial. Trees For. People 2026, 24, 101214. [Google Scholar] [CrossRef] [Scilit]
- Gárate-Escamilla, H.; Brelsford, C.C.; Hampe, A.; Robson, T.M.; Garzón, M.B. Greater capacity to exploit warming temperatures in northern populations of European beech is partly driven by delayed leaf senescence. Agric. For. Meteorol. 2020, 284, 107908. [Google Scholar] [CrossRef] [Scilit]
- Horváth, A. Beech Adaptation to Climate Change According to Provenance Trials in Europe. Ph.D. Thesis, University of West Hungary, Faculty of Forestry, Sopron, Hungary, 2016. [Google Scholar]
- Vander Mijnsbrugge, K.; Malanguis, J.M.; Moreels, S.; Lauwers, A.; Thomaes, A.; De Keersmaeker, L.; Vandekerkhove, K. Growth Recovery and Phenological Responses of Juvenile Beech (Fagus sylvatica L.) Exposed to Spring Warming and Late Spring Frost. Forests 2021, 12, 1604. [Google Scholar] [CrossRef] [Scilit]
- Chmura, D.; Rozkowski, R. Variability of beech provenances in spring and autumn phenology. Silvae Genet. 2002, 51, 123–127. [Google Scholar]
- Petkova, K.; Molle, E.; Huber, G.; Konnert, M.; Gaviria, J. Spring and autumn phenology of Bulgarian and German provenances of Common beech (Fagus sylvatica L.) under similar climatic conditions. Silvae Genet. 2017, 66, 24–32. [Google Scholar] [CrossRef] [Scilit]
- Besliu, E.; Budeanu, M.; Curtu, A.L. Analyzing the Adaptive Reaction of European Beech Provenances from the Perspective of Quality Traits. Bull. Transilv. Univ. Bras. Ser. II For. Wood Ind. Agric. Food Eng. 2024, 17, 1–20. [Google Scholar] [CrossRef] [Scilit]
- Ningre, F.; Colin, F. Frost damage on the terminal shoot as a risk factor of fork incidence on common beech (Fagus sylvatica L.). Ann. For. Sci. 2007, 64, 79–86. [Google Scholar] [CrossRef] [Scilit]
- Robson, T.M.; Alia, R.; Bozic, G.; Clark, J.; Forsteuter, M.; Gomory, D.; Liesebach, M.; Mertens, P.; Rasztovits, E.; Zitová, M. The timing of leaf flush in European beech (Fagus sylvatica L.) saplings. In Proceedings of the COST E52 Final Meeting, Burgos, Spain, 4–6 May 2011; pp. 61–80. [Google Scholar]
- Konnert, M.; Fady, B.; Gömöry, D.; A’hara, S.; Wolter, F.; Ducci, F.; Koskela, J.; Bozzano, M.; Maaten, T.; Kowalczyk, J. Use and Transfer of Forest Reproductive Material in Europe in the Context of Climate Change; European Forest Genetic Resources Programme (EUFORGEN), Bioversity International: Rome, Italy, 2015. [Google Scholar]
- Besliu, E.; Curtu, A.L.; Budeanu, M.; Apostol, E.N.; Ciocîrlan, M.I.C. Exploring the effects of the assisted transfer of European beech (Fagus sylvatica L.) provenances in the Romanian Carpathians. Not. Bot. Horti Agrobot. Cluj.-Napoca 2024, 52, 13968. [Google Scholar] [CrossRef] [Scilit]
- Prislan, P.; Gričar, J.; Čufar, K.; de Luis, M.; Merela, M.; Rossi, S. Growing season and radial growth predicted for Fagus sylvatica under climate change. Clim. Chang. 2019, 153, 181–197. [Google Scholar] [CrossRef] [Scilit]
- Bednářová, E.; Kučera, J.; Merklová, L. The onset and duration of vegetative phenological stages in European beech (Fagus sylvatica L.) under changing conditions of the environment. Acta Univ. Agric. Silvic. Mendel. Brun. 2014, 58, 23–30. [Google Scholar] [CrossRef] [Scilit]

Disclaimer/Publisher’s Note: The statements, opinions and data contained in all publications are solely those of the individual author(s) and contributor(s) and not of MDPI and/or the editor(s). MDPI and/or the editor(s) disclaim responsibility for any injury to people or property resulting from any ideas, methods, instructions or products referred to in the content. |
© 2026 by the authors. Licensee MDPI, Basel, Switzerland. This article is an open access article distributed under the terms and conditions of the Creative Commons Attribution (CC BY) license.