


Abstract
Under-forest wild-simulated cultivation of Gastrodia elata Bl. f. glauca S. Chow (Wu Tianma, WTM) offers a viable pathway for reconciling ecological conservation with economic and health benefits, yet optimal seed tuber regimes remain understudied. We established nine planting regimes varying in single-tuber weight and per-hole dosage in a karst plateau area, monitored tuber yield and bioactive components (gastrodin, p-Hydroxybenzyl alcohol, and parishin), and evaluated performance via one-way ANOVA and a comprehensive index. At equal per-hole dosage, individual tubers of 10–15 g achieved the highest comprehensive index (57.13%), whereas those <5 g performed poorly (28.66%). With respect to seeding rate, the maximum yield (5.27 kg/m2) was achieved at 250 g per hole, while the highest combined content of gastrodin and p-Hydroxybenzyl alcohol (0.29%) and the peak parishin content were observed at 350 g and 150 g per hole, respectively. While tuber weight and seeding rate significantly affected yield, they had minor impacts on bioactive composition, suggesting that medium-sized seed tubers with moderately increased dosage can synergistically improve yield and quality. Our findings provide empirical benchmarks for germplasm selection and agronomic optimization in WTM cultivation, and call for multi-scale studies integrating soil microbiota and microclimate to unravel cascading mechanisms for sustainable quality enhancement.
1. Introduction
Gastrodia elata Bl. f. glauca S. Chow is a perennial herbaceous species of the genus Gastrodia (Orchidaceae) [1]. It contains bioactive constituents such as Gastrodin, p-Hydroxybenzyl alcohol, and Parishin, and is therefore a valuable medicinal resource recognized for both medicine and dietary uses. According to traditional Chinese medicine records [2], its constituents are used to relieve convulsions, calm internal wind, pacify the liver and suppress hyperactive yang, and promote meridian circulation and alleviate pain. Particularly, it exhibits prominent pharmacological activities in bacteriostasis and anti-inflammation, sedation and hypnosis, memory amelioration, antioxidation, anti-tumor, anti-epilepsy, and the intervention of neurodegenerative diseases [3,4]. However, increasing market demand for Gastrodia has intensified harvesting pressure, placing wild germplasm resources of G. elata at risk [5,6]. In this context, the under-forest-imitated wild cultivation of G. elata is considered a practical approach to expand supply and conserve wild resources and associated diversity for supporting sustainable industry development. At present, large-scale introduced cultivation of artificially propagated G. elata is rarely implemented worldwide, with only small-scale trial cultivation conducted in the Republic of Korea. Commercial cultivation of this medicinal herb is highly geographically restricted to mountainous regions of China, primarily distributed across Southwest China (Yunnan, Guizhou, and Sichuan Provinces), the Qinling-Daba Mountains (Shaanxi and southern Gansu Provinces), and the Wuling Mountains (western Hubei Province) [7]. The artificial inoculation of Armillaria mellea drastically reshapes the community structure of soil fungi in under-forest karst mountain habitats and squeezes the ecological niches of native saprophytic and mycorrhizal fungi [8]. Furthermore, a large proportion of newly reclaimed cultivation lands are located within the ecologically fragile karst zones of Southwest China [9]. Large-scale under-forest cultivation of G. elata poses multiple ecological risks, including timber logging for fungus substrates, soil disturbance, and degradation of native understory herbaceous communities. Against this backdrop, achieving coordinated improvements in the yield and quality of G. elata within limited forestland represents a critical scientific issue that urgently needs to be addressed.
In recent years, the yield and bioactive ingredients of cultivated G. elata have become a hot topic of research and a focus of attention. First of all, scholars have generally focused on the impact of the environment on yield and quality. For example, in experiments conducted at an altitude of 1400–1800 m, it was found that G. elata f. elata achieved the highest yield at 1800 m, and its Gastrodin and polysaccharide contents were significantly superior to those of G. elata f. viridis [10]. More recent multi-region cultivation data have shown that the relative abundance of soil microorganisms (especially the fungus Armillaria), soil available potassium content, and temperature variation are the key factors affecting yield and quality [11]. In addition, researchers have investigated the yield and bioactive constituent accumulation of G. elata from the perspective of varietal genetic backgrounds, such as different cultivated subspecies [12,13]. Equally importantly, cultivation patterns constitute another widely researched topic. For instance, a recent comparative study between traditional wood-based cultivation and artificial mycelial mat cultivation demonstrated that G. elata cultivated via the traditional wood-based cultivation method contained a higher content of Gastrodigenin. In contrast, the artificial mycelial mat cultivation method resulted in significantly richer polysaccharides, sweet amino acids, and other flavor compounds. However, the Gastrodin content was comparable between the two cultivation modes [14]. These findings suggest that different imitated wild cultivation systems (e.g., varying substrates or cultivation techniques) may modulate the pharmacodynamic components and sensory quality of G. elata. Furthermore, provenance (geographical origin or cultivation method) has been shown to exert a significant effect on the distribution of trace elements and chemical constituents, confirming that environmental conditions and cultivation practices shape the bioactive ingredient profile [15,16]. By integrating environmental conditions, inherent germplasm properties, and cultivation regimes into a unified path model for plant yield and quality, these studies deliver prominent methodological value.
Despite extensive previous work, scant studies address the seed utilization problems of artificially wild-simulated cultivated WTM (a medicinal herb with high commercial value) under forest canopies, particularly in karst areas characterized by significant spatial heterogeneity, poor soil nutrients, water stress, and prominent adverse conditions of high calcium. To fill this knowledge gap, we quantified tuber yield and active constituent contents responding to varied single tuber weight and seeding dosage, performed one-way ANOVA coupled with the Tukey test to identify significant differences among these production indices, and simultaneously applied the comprehensive index method to evaluate the comprehensive yield effects of two different groups of seed tubers based on the weight of output indicators constructed by the entropy weight method. We hypothesize that individual seed tuber weight and increased seeding rate can synergistically enhance both the yield and the bioactive pharmaceutical components. Our objectives were: (1) to determine whether there are significant differences between different seed tuber usage strategies in terms of yield and bioactive ingredient contents; (2) to propose the optimal seed selection and seed tuber usage mode based on the comprehensive yield of yield and pharmacodynamic ingredients. Our research results are expected to provide decision-making references for the protection of wild G. elata resources and the quality and efficiency improvement of artificial-imitation wild cultivation in regions with the same background.
2. Materials and Methods
2.1. Study Area
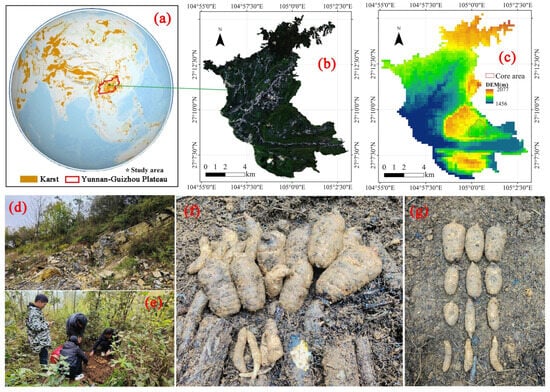
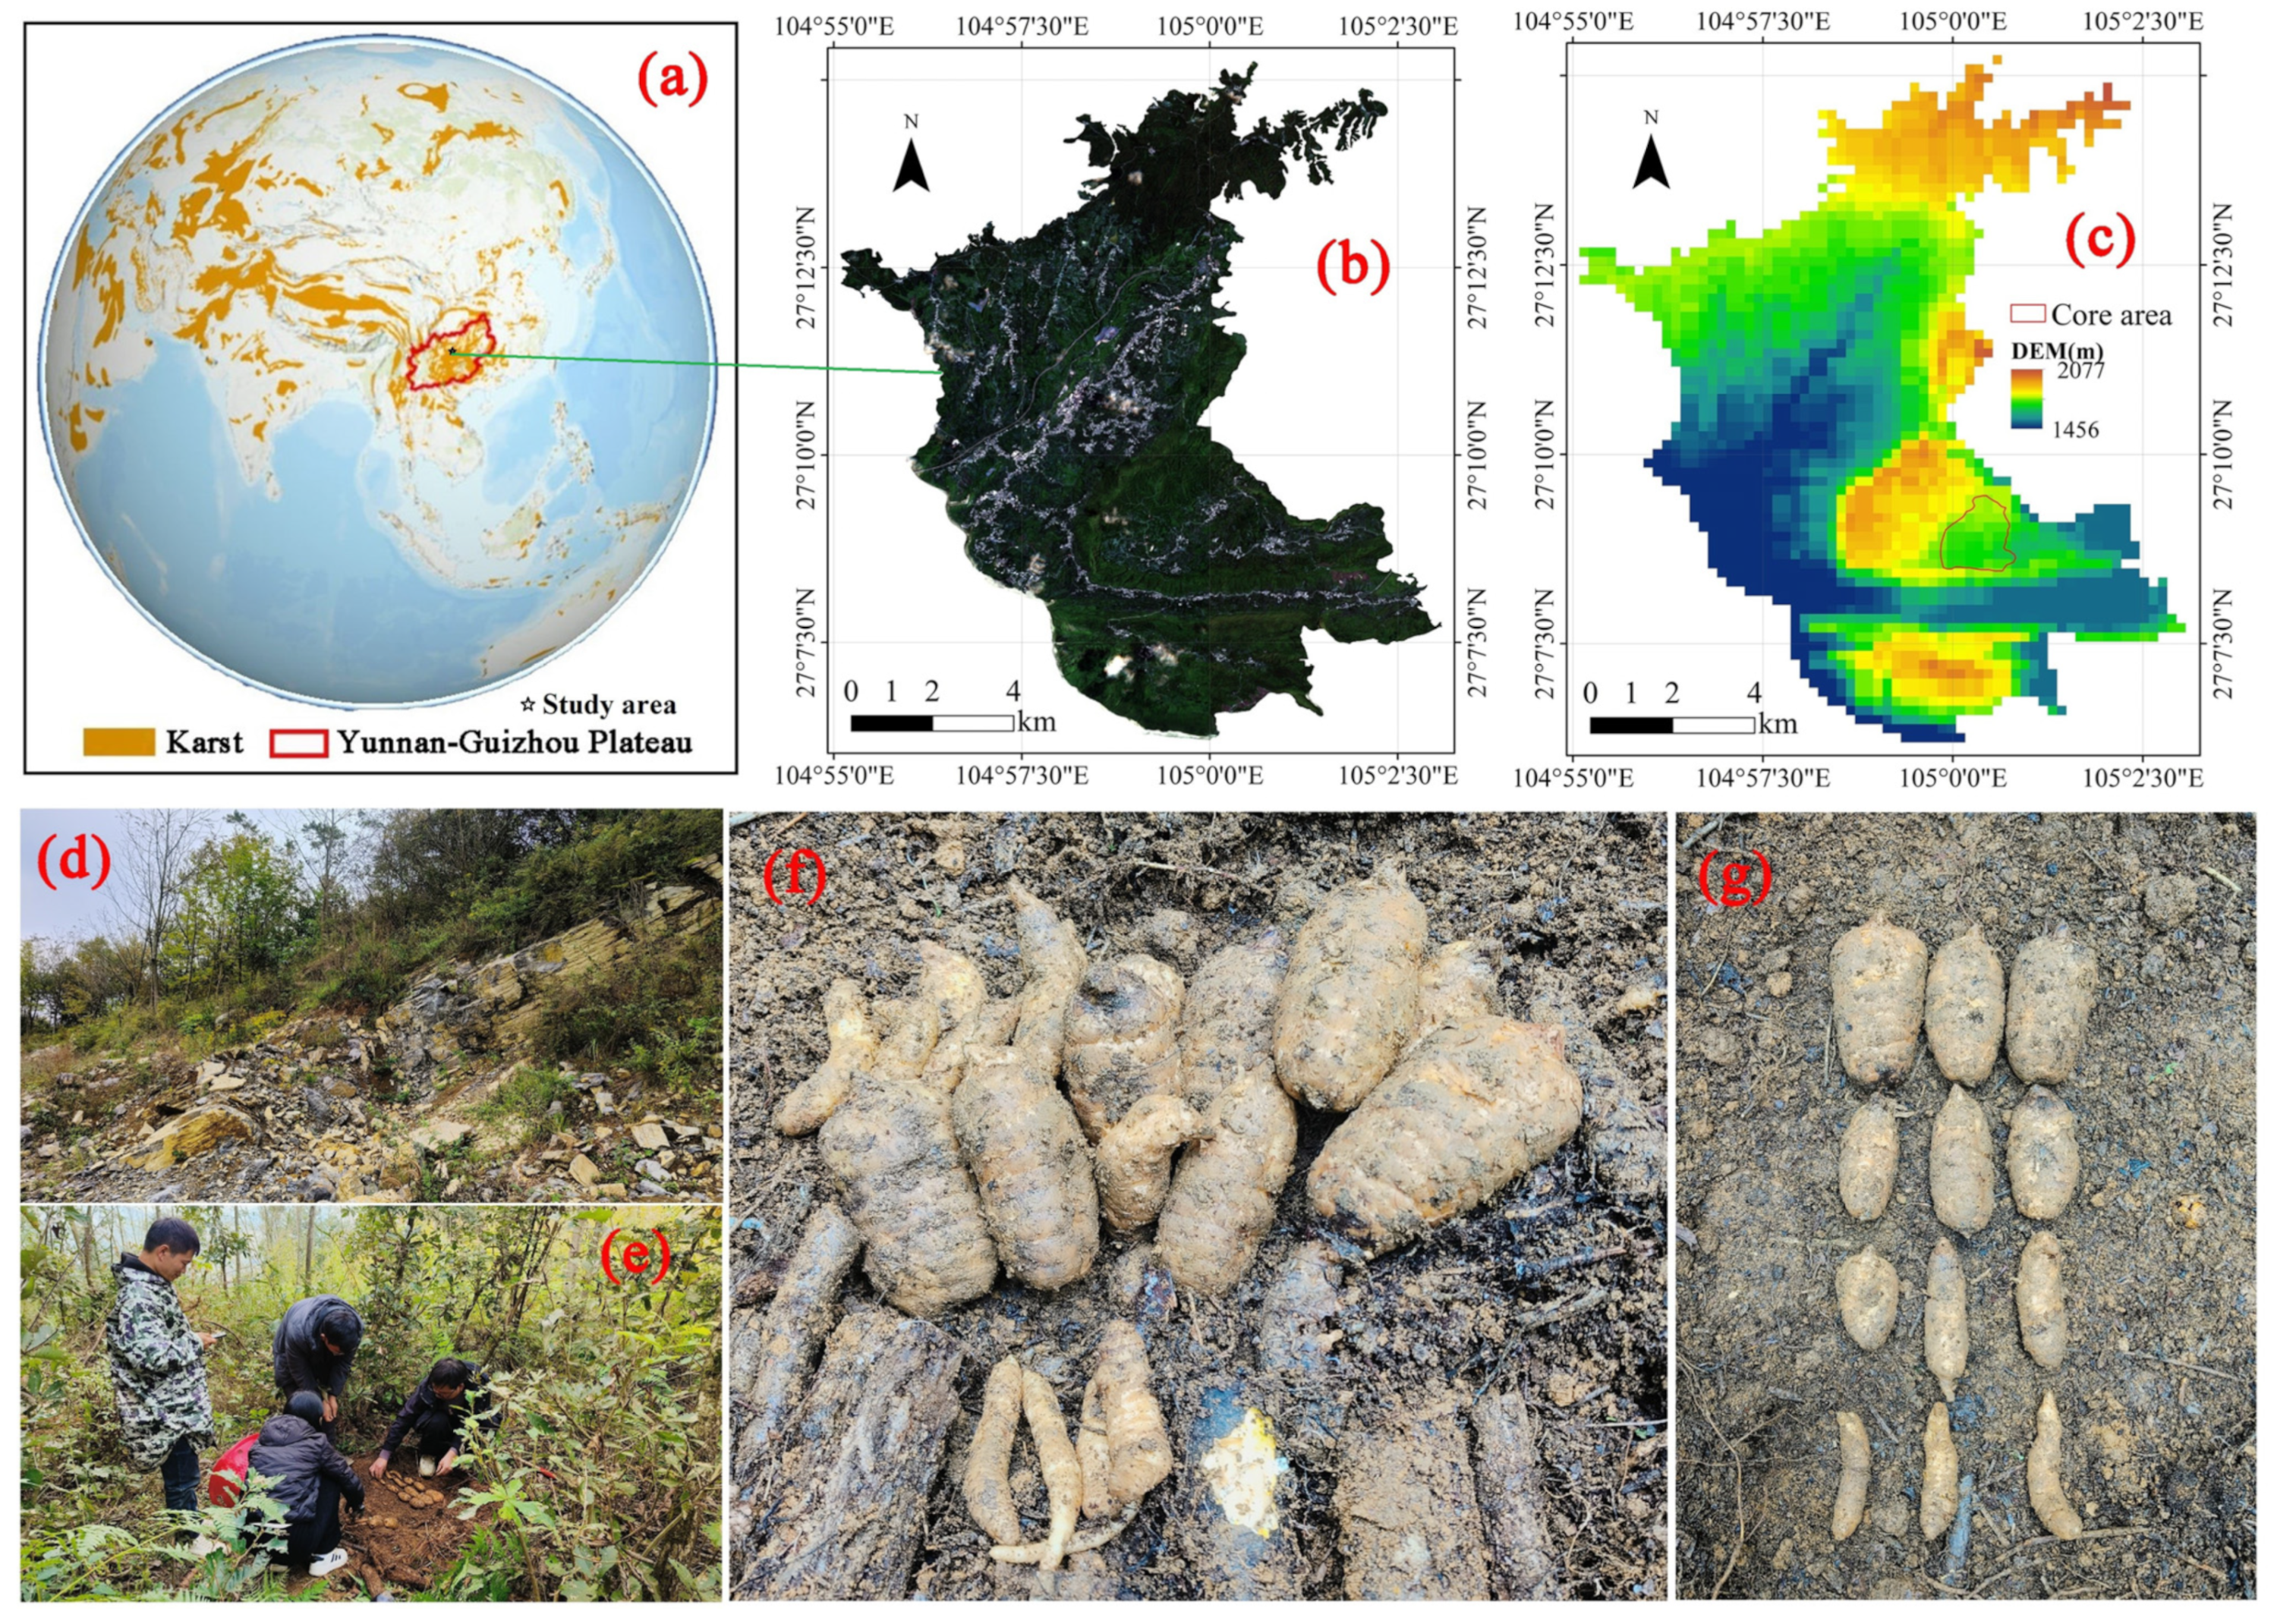
Yangjiawan study area (Qixingguan District, Bijie City, Guizhou Province, China) is located in the north-central Yunnan-Guizhou Plateau and typifies karst plateau-mountain terrain [17,18]. Elevation ranges from 1456 to 2077 m, with a mean elevation of approximately 1670 m (Figure 1b–d). Representative woody species include Chinese chestnut, birch, chestnut, and walnut. Mean annual rainfall is ~1150 mm, and mean annual temperature is 12 °C. Soil sampling experiments were carried out in the study area in accordance with national agricultural and forestry soil testing standards of China [19,20,21,22]. The topsoil is a brown sandy loam (pH 5.0) with 280.36 mg/kg hydrolyzable N, 11.02 mg/kg of available P, 69.03 mg/kg available K, and 160.12 g/kg of organic matter. Characterized by diversified habitats [23], this area furnishes favorable growing conditions for WTM. Our research group has conducted field cultivation trials of WTM tubers at this site since 2019. Detailed geographic information and experimental layout of the WTM trials are presented in Figure 1a–g.
Figure 1.
Selection and characterization of the study area: (a) Global and regional location of the study area, Yunnan-Guizhou Plateau, and the distribution of karst; (b) satellite imagery of the study area; (c) Digital Elevation Model (DEM) and core cultivation zone of WTM; (d) representative karst ecological environment within the study area; (e) harvesting of WTM at a sample plot; (f) examples of Commercial and Albino WTM from a sample plot; (g) examples of first-, second-, third-, and fourth-grade WTM from a sample plot.
2.2. Experimental Design
2.2.1. WTM Cultivation and Harvesting
A single-factor (one-way) experiment was conducted, with plots established based on the weight of a single seed and different seeding rates; three replicates were set up for each plot type. Each planting pit measured 0.5 m × 0.6 m (0.3 m2). Two seeding treatment scenarios were set up. In the first scenario, the total weight of WTM tubers per pit was fixed at 250 ± 20 g, while individual seed tubers differed in weight. On the basis of single tuber mass, plots were divided into four treatments: ≤5 g, 5–10 g, 10–15 g, and 15–20 g per single tuber. In the second scenario, the weight of each individual seed tuber was maintained at 15 ± 3 g, whereas the total tuber mass per pit was set to five levels: 150 g, 200 g, 250 g, 300 g, and 350 g. Cyclobalanopsis logs with a length of 20–30 cm and a diameter of 6.0–7.0 cm were used as the fungus-bearing wood. Armillaria mellea spawn was obtained from Dafang County, Guizhou Province, Guizhou Jiulong Tianma Co., Ltd. Zero-generation tuber seeds with uniform size, intact epidermis, and no pest or disease symptoms were selected as experimental materials. These seed tubers were collected from Xiaocaoba Town, Yiliang County, Zhaotong City, Yunnan Province, China. The tuber seeds were planted in April 2020 and harvested in December of the same year. Monthly mean temperature and precipitation throughout the growing season are provided in the Supplementary Materials.
2.2.2. Monitoring of Yield and Bioactive Constituent Contents
- (1)
- Monitoring of Yield and Drying Loss Rate
Samples of WTM were rinsed and allowed to drain until no visible surface moisture remained. Using an analytical balance, the fresh yields of albino and commercial-grade WTM were determined for each plot. The samples were then washed, air-dried, steamed, and dried in a forced-air oven maintained at 55 °C, with periodic ventilation dissipation at 8–12 h intervals. After drying, the samples were weighed, and the drying rate was calculated based on the change in mass.
- (2)
- Monitoring of Bioactive Constituents
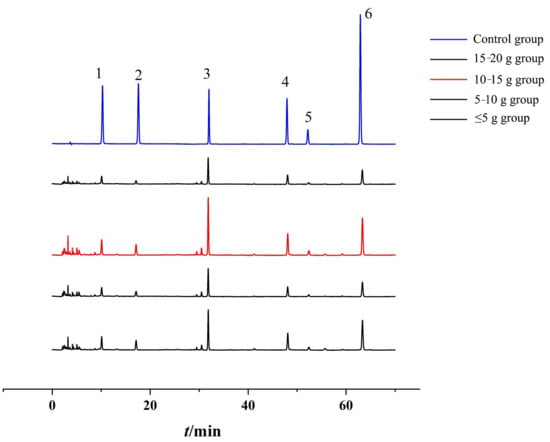
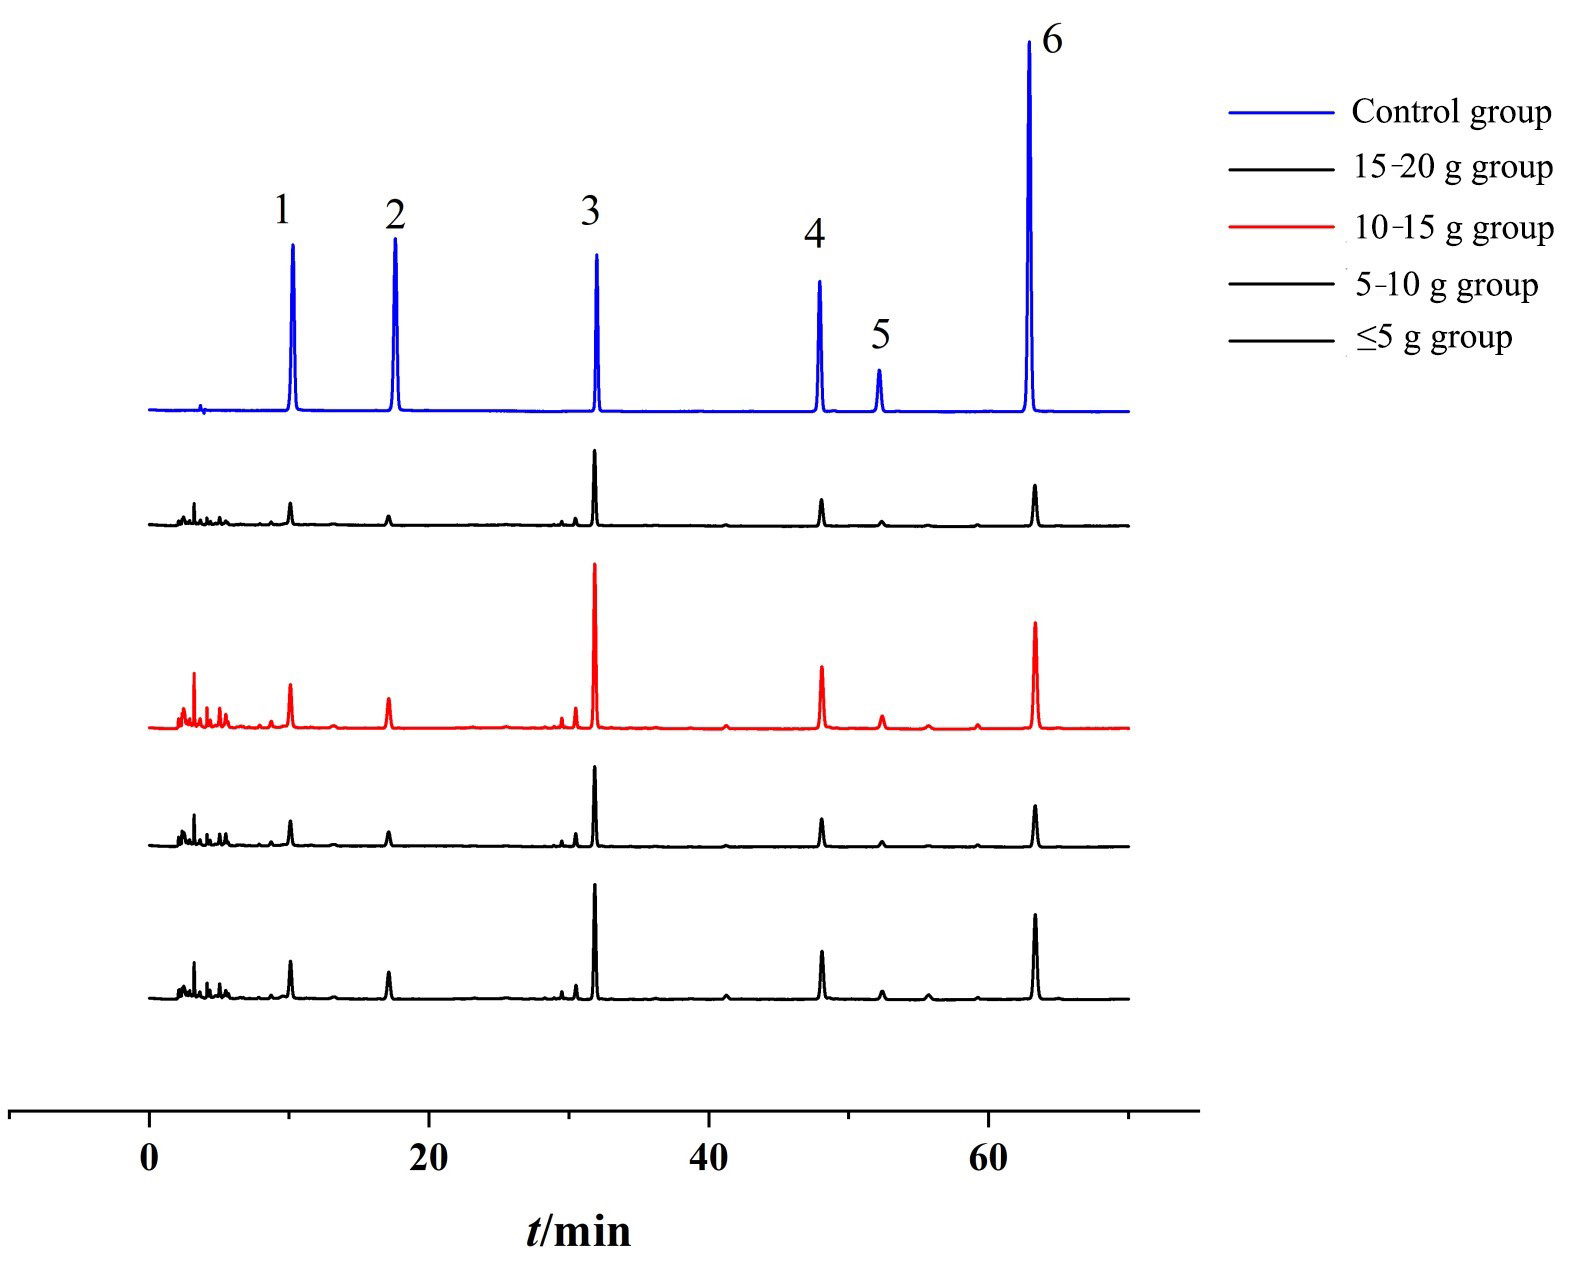
Based on the summary by Wang et al. (2026) [24] regarding the major active components of G. elata, we selected parameters such as moisture content, gastrodin, p-Hydroxybenzyl alcohol, parishin A, parishin B, parishin C, and parishin E to characterize its active components. Moisture content of WTM was determined using the oven-drying method in accordance with General Rule 0832 of the 2020 edition of the Chinese Pharmacopoeia. The contents of bioactive constituents were quantified by liquid chromatography. The target analytes included gastrodin, p-Hydroxybenzyl alcohol, parishin A, parishin B, parishin C, and parishin E. The liquid chromatography method followed Zhang et al. (2022) [25], and used a Phenomenon Luna C18 column (250 mm × 4.6 mm, 5 μm). The mobile phases were acetonitrile (A) and 0.1% (v/v) phosphoric acid in water (B). Gradient elution was programmed as follows: (%A): 5–15 min, 3.0%–5.0%; 15–22 min, 5.0; 22–25 min, 5.0–10.1; 25–35 min, 10.1%–10.2%; 35–45 min, 10.2%–14.0%; 45–52 min, 14.0%; 52–55 min, 14.0%–16.5%; 55–63 min, 16.5%–17.5%; 63–65 min, 17.5%–20.0%; 65–70 min, 20.0%. The column temperature was 35 °C, the flow rate was 1.0 mL/min, detection was at 220 nm, and injection volume was 4 μL. Under these chromatographic conditions, the target components were identified and quantified in each treated WTM sample by comparison with reference standards. Representative chromatograms are shown in Figure 2.
Figure 2.
Liquid chromatography chromatograms of WTM samples from each group and the corresponding reference standard. Peaks 1–6 correspond to gastrodin, p-Hydroxybenzyl alcohol, parishin E, parishin B, parishin C, and parishin A, respectively.
The main instruments used for active-ingredient analysis were an UltiMate 3000 High Performance Liquid Chromatograph (Thermo Fisher Scientific, Waltham, MA, USA), an OLB-1210 Intelligent Karl Fischer Moisture Analyzer (Jinan Oulibo Scientific Instrument Co., Ltd., Jinan, Shandong, China), a 125D-1CN Precision Electronic Balance (readability 0.0001 g, Sartorius (Shanghai) Trading Co., Ltd., Shanghai, China), an FTT-2505T Ultra-Fine Grinder (Dongguan Fangtai Electric Co., Ltd., Dongguan, Guangdong, China), and a KQ-250DE Dual-Frequency Ultrasonic Cleaner (Kunshan Ultrasonic Instrument Co., Ltd., Kunshan, Jiangsu, China). Reference standards included gastrodin (Purity ≥ 98%, Batch No.: B1723054) and p-Hydroxybenzyl alcohol (Purity ≥ 98%, Batch No.: A1829056) from Aladdin Reagent Co., Ltd. Shanghai, China; Palisene A (Purity ≥ 98%, Batch No. PRF20091710), Palisin B (Purity ≥ 98%, Batch No. PRF21030901), Palisin C (Purity ≥ 98%, Batch No. PRF20122541), and Palisin E (Purity ≥ 98%, Batch No. PRF20092841) from Shanghai McLean Biochemical Technology Co., Ltd. Shanghai, China; Acetonitrile (HPLC grade) was purchased from Merck KGaA, Darmstadt, Germany; Phosphoric acid (AR grade; Tianjin Kemiou Chemical Reagent Co., Ltd., Tianjin, China); and purified water (Wahaha).
2.3. Data Statistics, Analysis, and Visualization
2.3.1. Statistical Significance Analysis
Differences in yield and bioactive-component contents of WTM were evaluated using one-way analysis of variance (ANOVA) combined with Tukey’s multiple comparison test using OriginPro 2026b (64-bit) SR1 software (OriginLab, Northampton, MA, USA).
2.3.2. Calculation of Composite Index
A composite index integrates multiple indicators into a single score to represent the overall level of performance of the evaluated object. We use the comprehensive index method based on the entropy method to quantify the overall benefits of each WTM output type. This method avoids cognitive bias caused by individual preferences or prejudices. The calculation procedure follows Li et al. (2023) [26].
3. Results
3.1. Yield and Bioactive Component Contents of Harvested WTM Derived from Seed Tubers of Different Individual Weights
3.1.1. Yield Variability
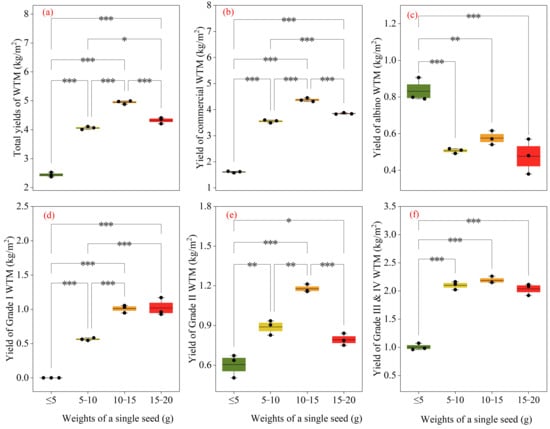
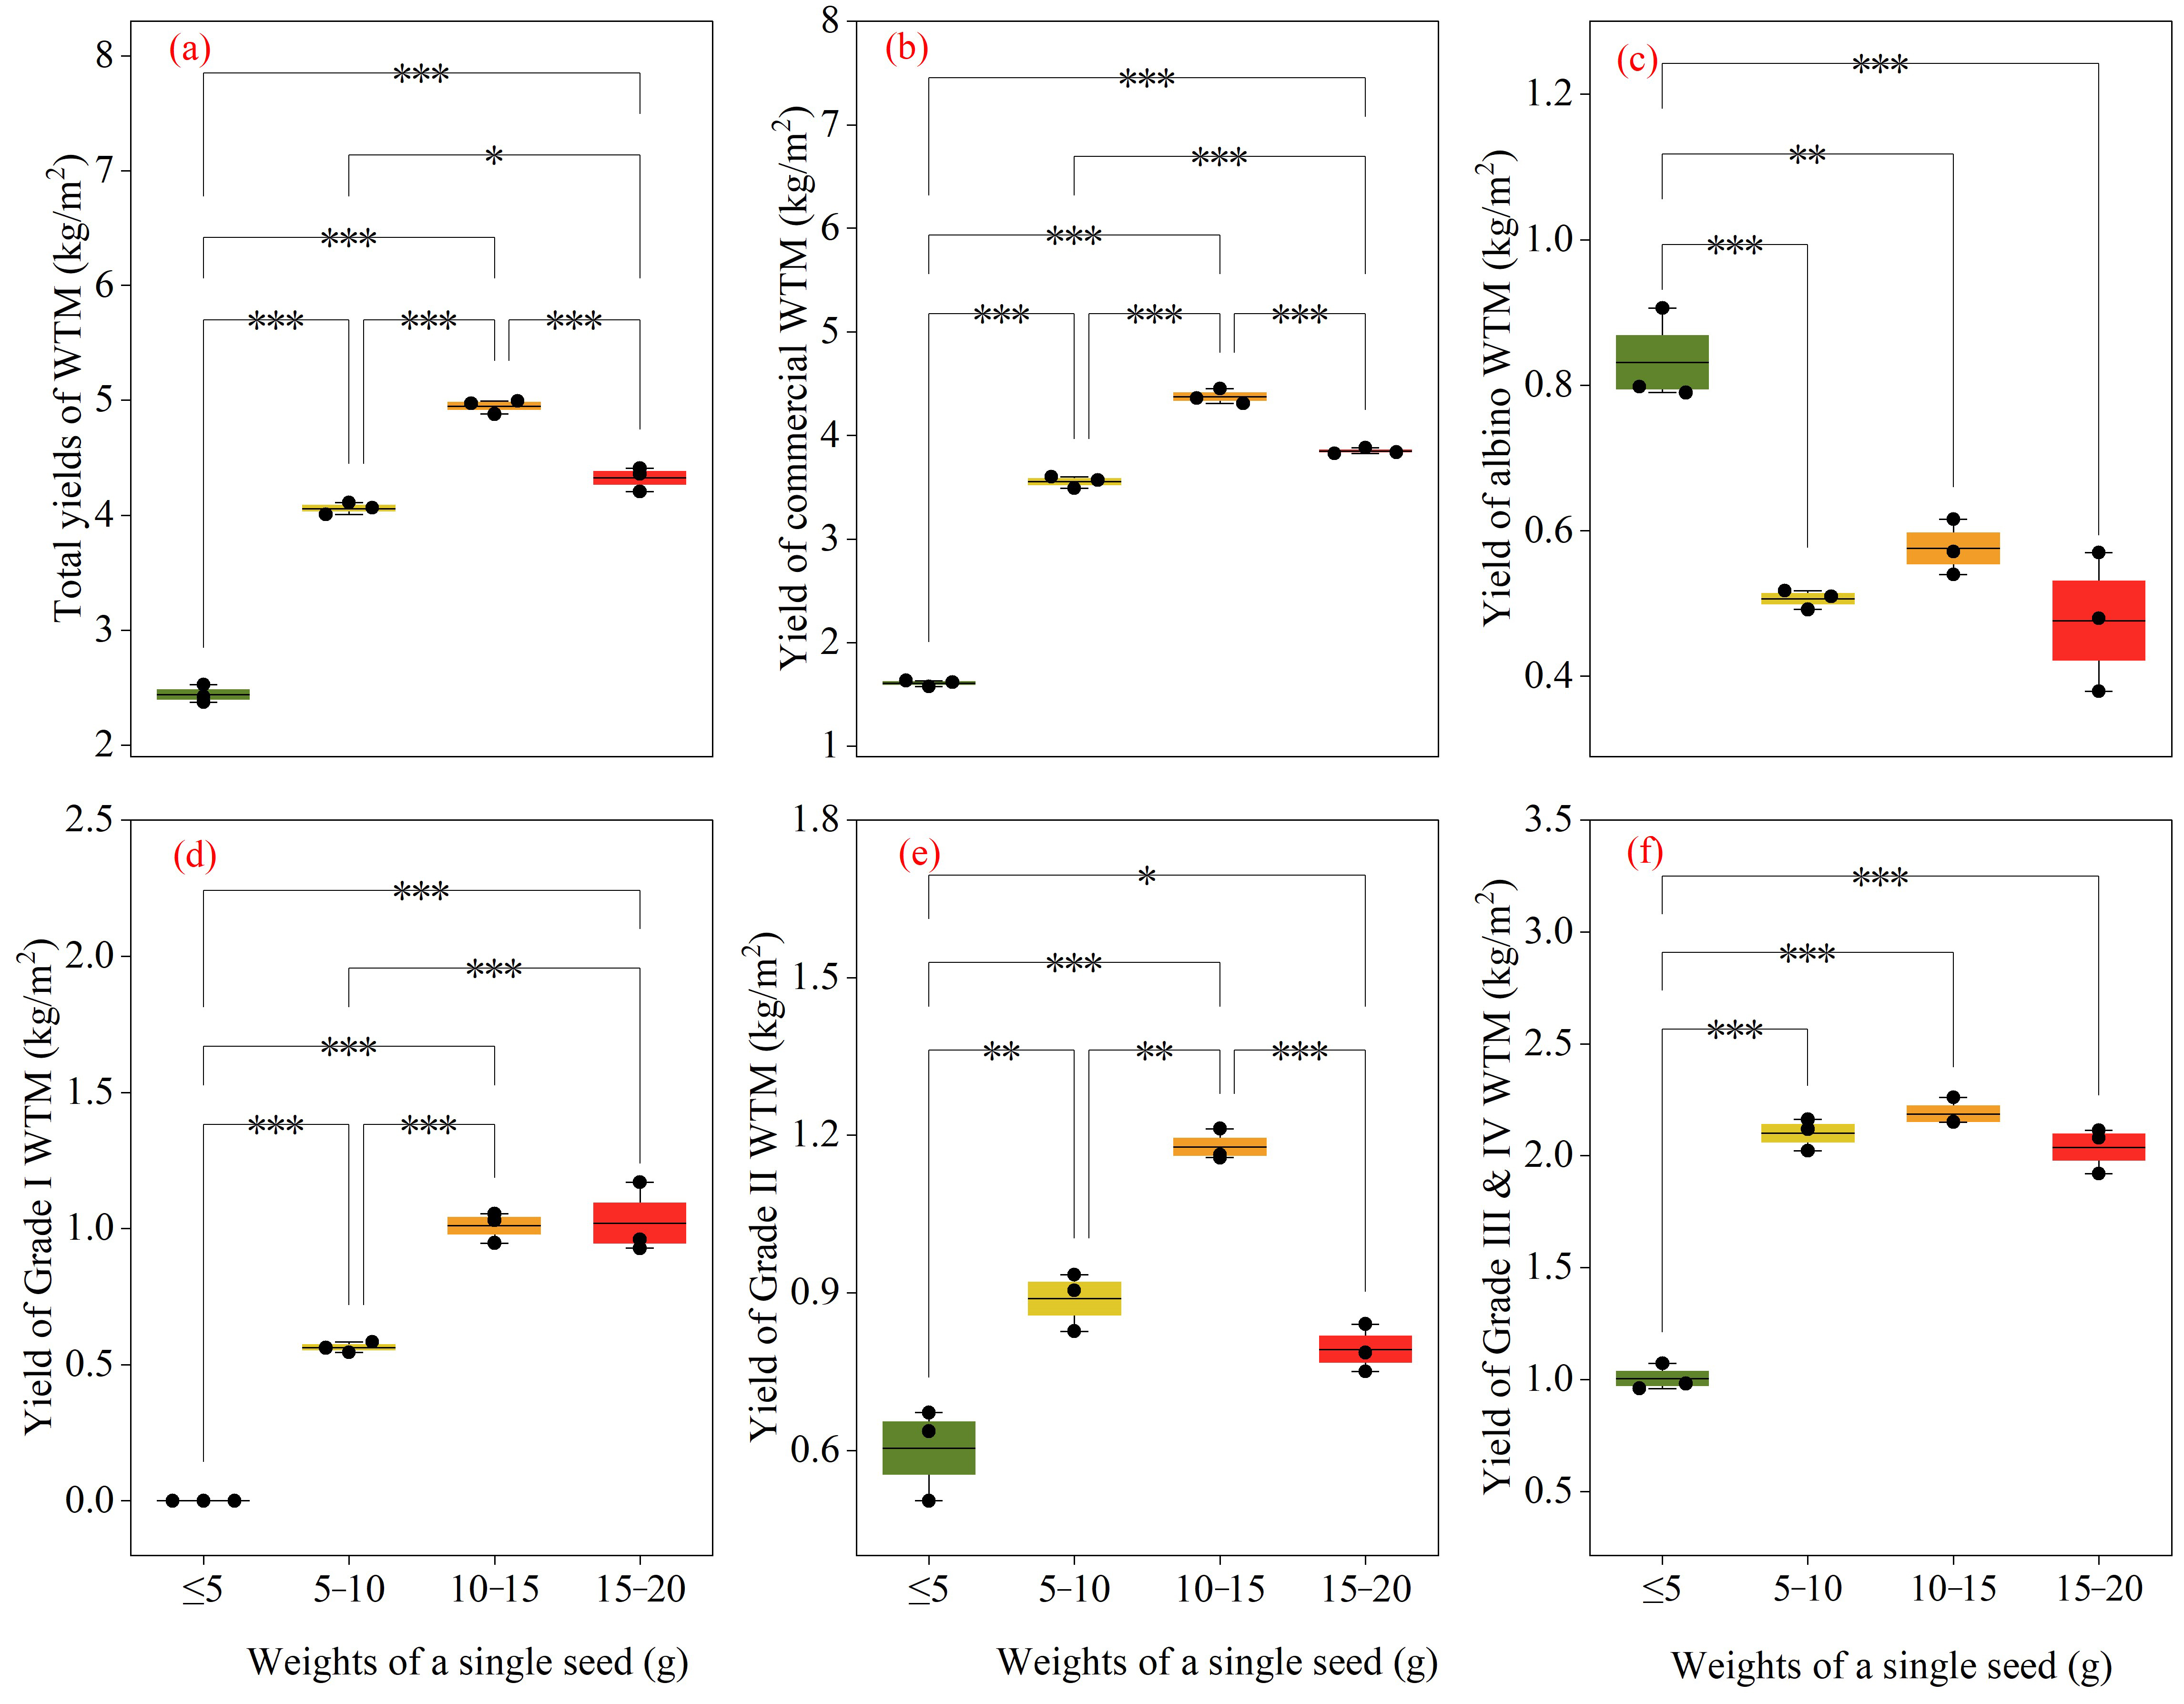
As shown in Figure 3a, seed tubers weighing 10–15 g produced the highest total yield (4.95 kg/m2), followed by the 15–20 g and 5–10 g groups. The <5 g group had the lowest total yield, with an average of 2.44 kg/m2. Marketable WTM yield followed the same pattern as total yield (Figure 3b), and both total and marketable yield differed significantly among the four seed-tuber weight classes. By contrast, the yield of albino WTM was highest in the <5 g group (0.83 kg/m2) and lowest in the 15–20 g group (0.48 kg/m2). The <5 g group differed significantly from the other three groups (Figure 3c). Overall, increasing seed-tuber weight tended to increase total and marketable yield, whereas albino WTM yield showed the opposite trend.
Figure 3.
Yield performance of WTM seed-tuber weight classes after planting. (a) Total yield; (b) marketable yield; (c) albino WTM yield; (d) Grade I WTM yield; (e) Grade II WTM yield; (f) combined Grade III-IV WTM yield. The boxes represent the interquartile range (IQR), whiskers correspond to the maximum and minimum values, and the middle line inside each box indicates the mean value. The markers ***, **, and * indicate significant differences at p < 0.001, p < 0.01 and p < 0.05, respectively.
The grading analysis showed that the 15–20 g seed-tuber group produced the highest Grade I yield (1.02 kg/m2), followed closely by the 10–15 g group (1.01 kg/m2) and then the 5–10 g group (0.56 kg/m2). The <5 g group did not produce Grade I tubers. Grade I yield generally increased with seed-tuber weight, and all pairwise comparisons were significant except for the comparison between the 10–15 g and 15–20 g groups (Figure 3d). For Grade II tubers, the yields of the <5 g, 5–10 g, and 10–15 g groups were 0.60, 0.889, and 1.01 kg/m2, respectively. Notably, the Grade II WTM yield of the 15–20 g group was 792 kg/m2, only surpassing the ≤5 g group. The yield of Grade 2 tubers followed an inverted V-shaped pattern. There was no significant difference between the 5–10 g and 15–20 g groups, while significant differences were observed for all other group comparisons. For combined Grade III and Grade IV yield, the ≤5 g group had the minimum output (1.01 kg/m2). The yields of the remaining three groups were similar (2.1–2.19 kg/m2). Significant differences only occurred between the ≤5 g group and the other three groups, and no significant differences were detected among the three medium-to-large seed tuber groups (Figure 3e,f).
3.1.2. Variations in Drying Loss Rate and Moisture Content
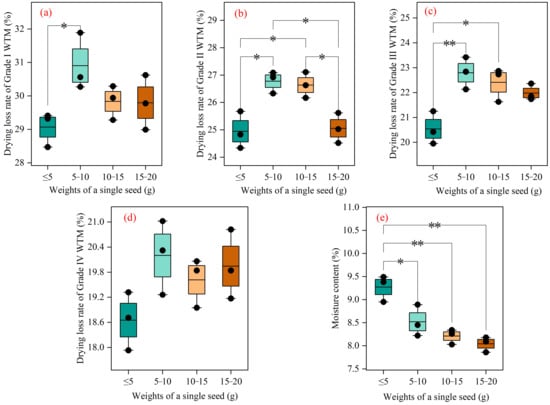
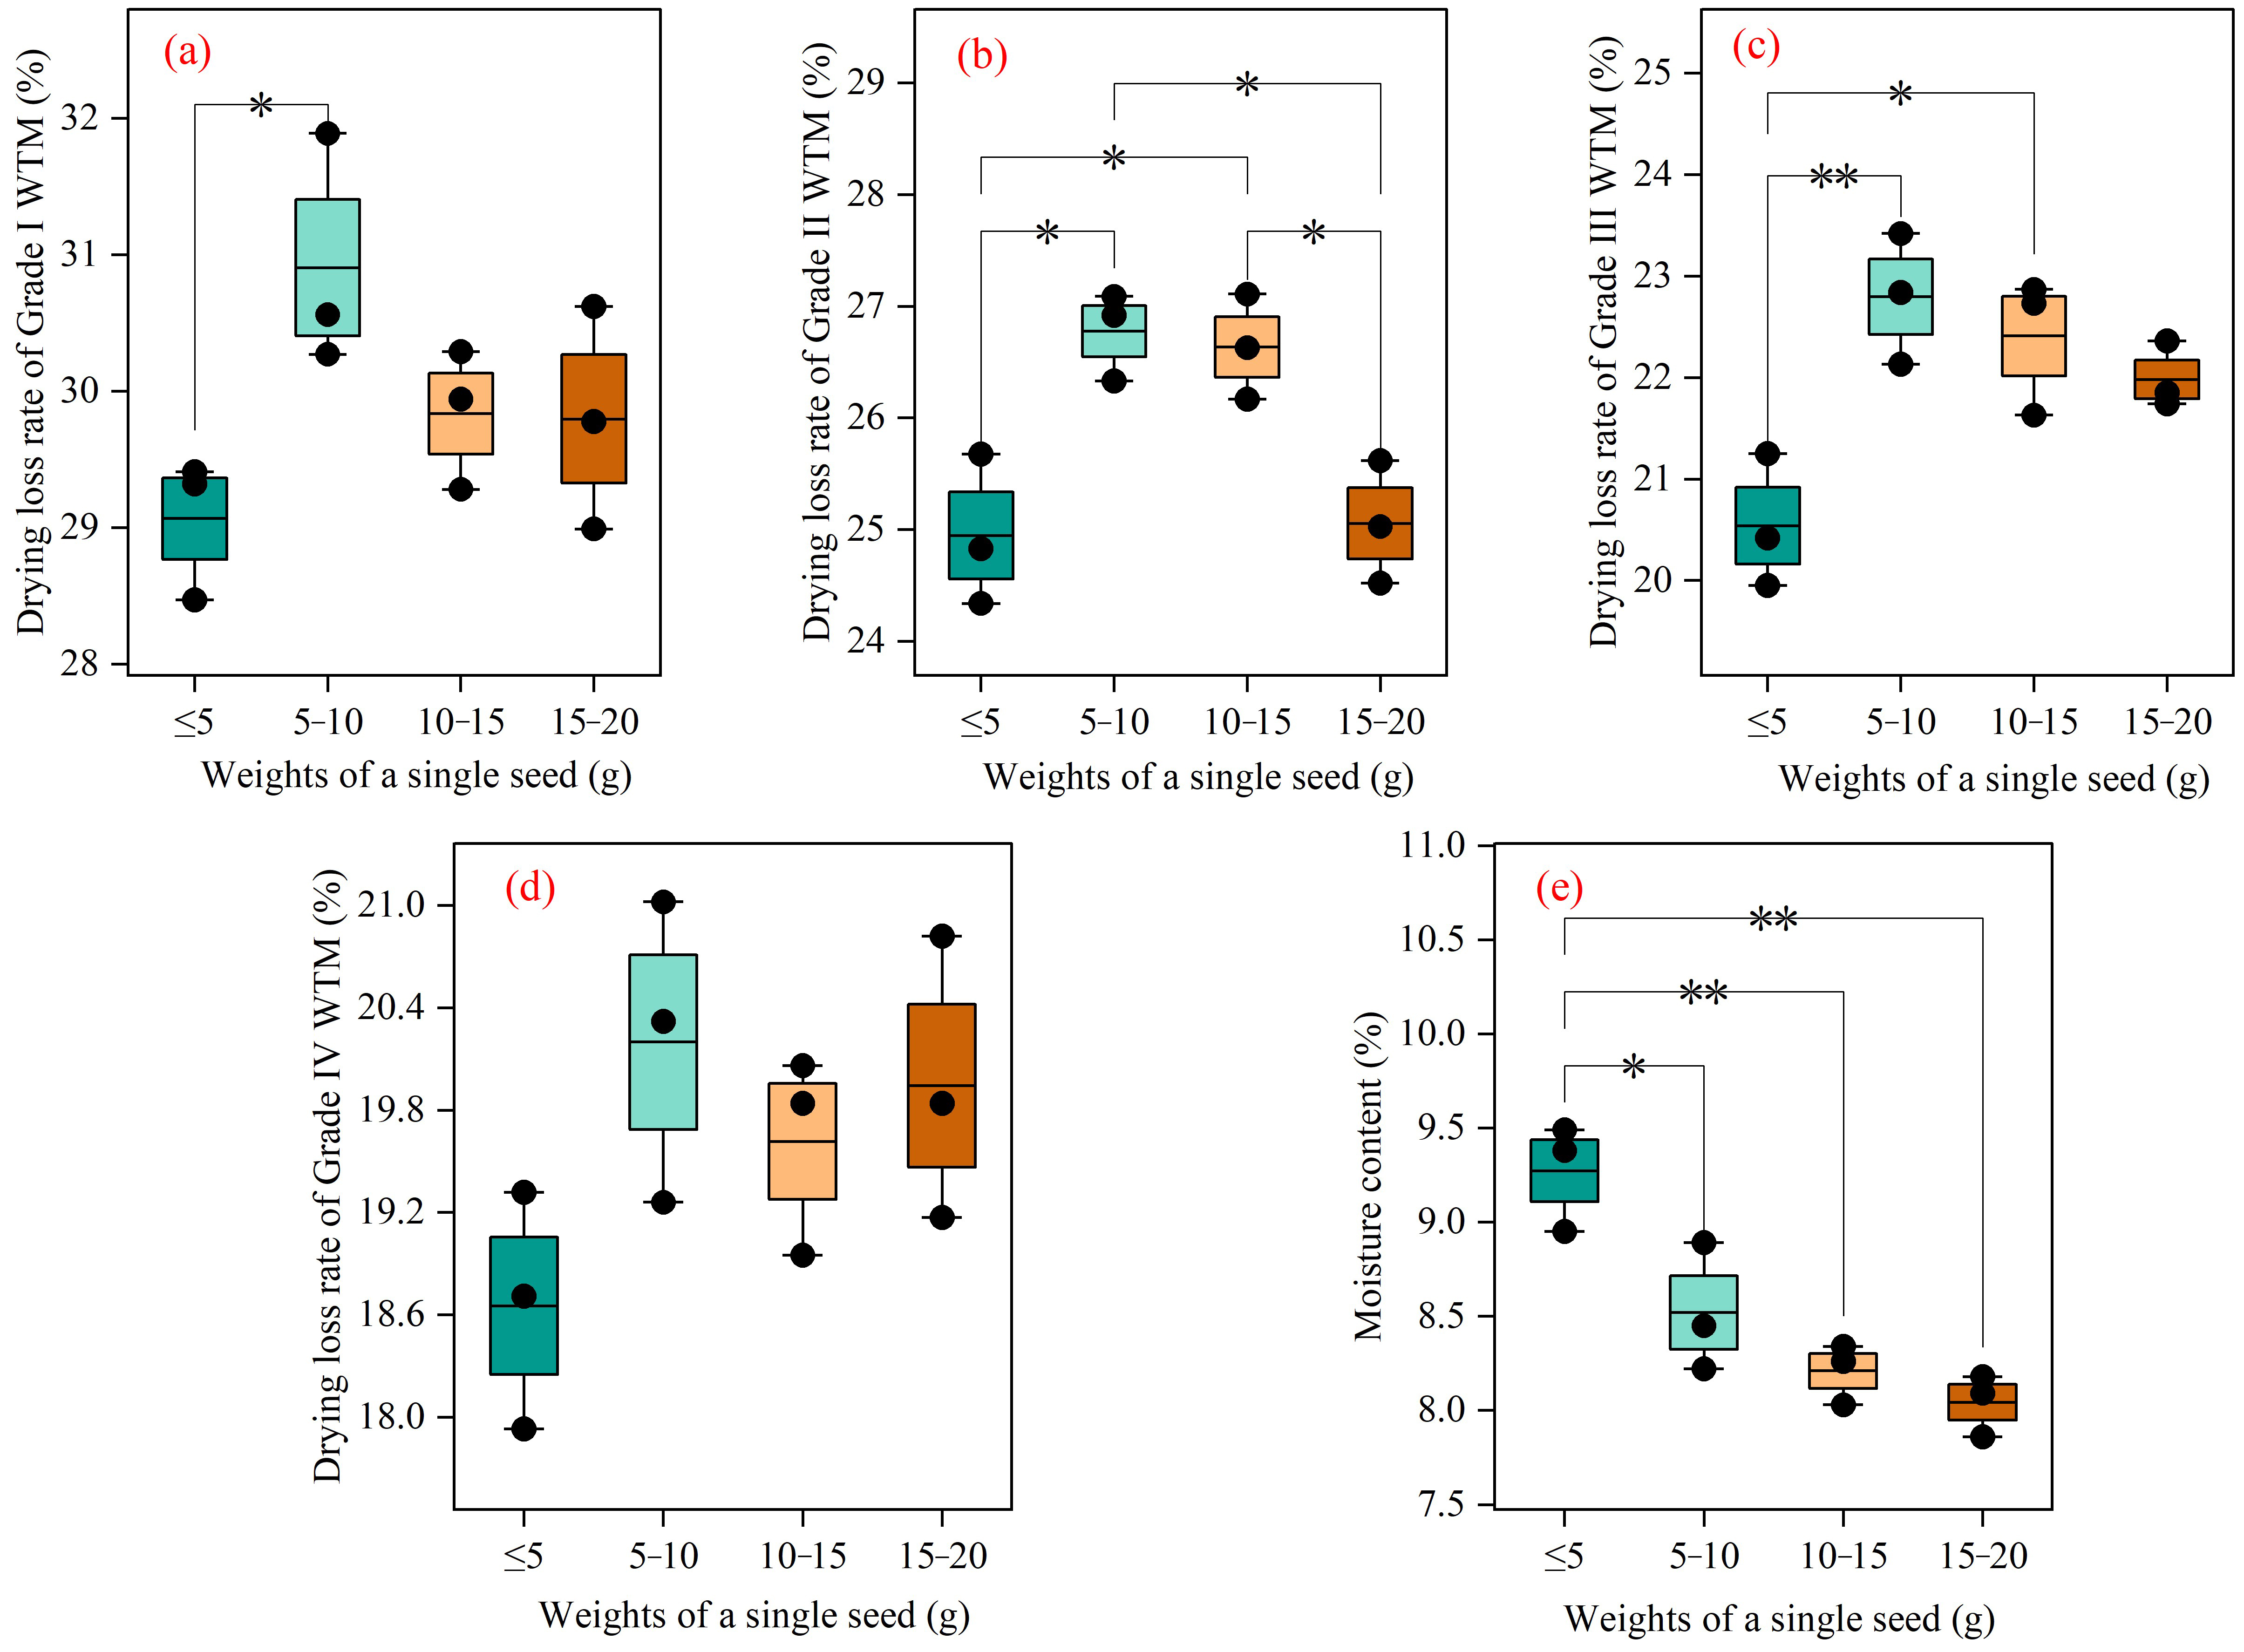
As shown in Figure 4a–d, the drying loss rate of Grade I, Grade II, Grade III, and Grade IV harvested WTM tubers exhibited the following order across seed tuber weight groups: 5–10 g group > 15–20 g group > 10–15 g group > ≤5 g group. Specifically, the ≤5 g group had the minimum drying loss rate at 29.07%, whereas the 5–10 g group achieved the maximum value of 30.91%. On average, the dry matter conversion rate of Grade II WTM was 4 percentage points lower than that of Grade I WTM. Similarly, the drying loss rate of Grade III and Grade IV WTM was 3–4 percentage points lower relative to Grade I and Grade II WTM.
Figure 4.
Drying loss rates and moisture contents of WTM from different seed-tuber weight classes. Panels (a–d) represent Grade I, II, III, and IV tubers, respectively. Panel (e) represents moisture content. The boxes represent the interquartile range (IQR), whiskers correspond to the maximum and minimum values, and the middle line inside each box indicates the mean value. The markers **, and * indicate significant differences at p < 0.01 and p < 0.05, respectively.
For Grade I WTM, a significant difference in drying loss rate was only detected between the ≤5 g group and the 5–10 g group. With respect to Grade II WTM, non-significant differences were observed between the ≤5 g group and the 15–20 g group, as well as between the 5–10 g group and the 10–15 g group; significant differences existed in all other pairwise comparisons. In Grade III WTM, significant differences only occurred between the ≤5 g group and the 5–10 g and 10–15 g groups, with no significant differences among the remaining group pairs. No statistically significant differences in dry matter conversion rate were found among all groups for Grade IV WTM.
The moisture content of harvested WTM tubers displayed a descending trend along the seed tuber weight gradient: ≤5 g group (9.27%) > 5–10 g group (8.52%) > 10–15 g group (8.21%) > 15–20 g group (8.04%). In general, larger seed tubers produced WTM products with lower moisture content. Significant differences in moisture content were only identified between the ≤5 g group and the other three treatments, and no significant differences were detected among the other groups.
3.1.3. Variations in Bioactive Component Contents
- (1)
- Gastrodin and p-Hydroxybenzyl Alcohol Contents
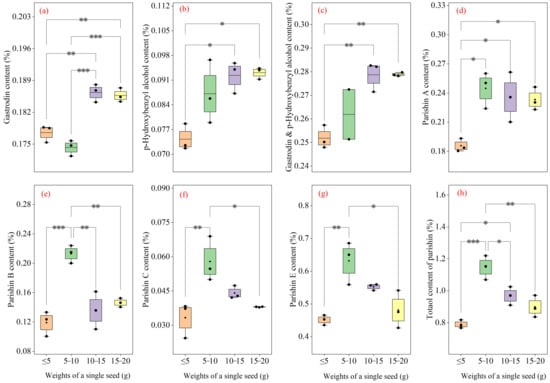
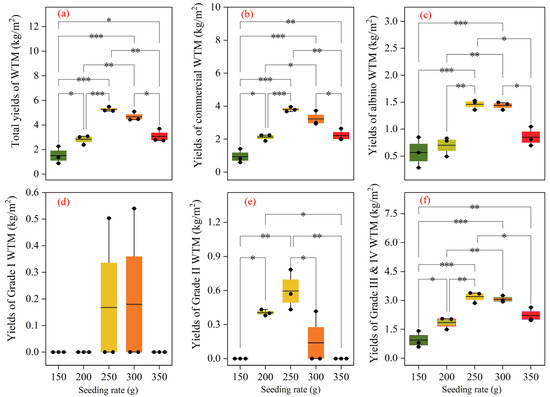
As shown in Figure 5a, the gastrodin content followed the order 10–15 g (0.1864%) > 15–20 g (0.1857%) > <5 g (0.1775%) > 5–10 g (0.1743%). Significant differences were observed only between the ≥10 g group and <10 g groups. p-Hydroxybenzyl alcohol content increased with seed-tuber weight, following the order 15–20 g (0.0931%) > 10–15 g (0.0924%) > 5–10 g (0.0872%) > <5 g (0.0743%). The <5 g group differed significantly from the 10–15 g and 15–20 g groups, whereas the other comparisons were not significant (Figure 5b). The combined content of gastrodin and p-Hydroxybenzyl alcohol was highest in the 15–20 g group (0.2788%), followed by the 10–15 g (0.2787%), 5–10 g (0.2614%), and <5 g (0.2518%) groups; only the <5 g group differed significantly from the 10–15 g and 15–20 g groups (Figure 5c). Overall, the effect of seed-tuber weight on bioactive-component contents was less pronounced than its effect on yield; in particular, highly significant effects are rare.
Figure 5.
Comparison of moisture and major bioactive constituents in WTM across different weight groups. Panels (a–c) show gastrodin content, p-Hydroxybenzyl alcohol content, and their combined content, respectively; panels (d–h) denote parishin A, parishin B, parishin C, parishin E content, and total parishins, respectively. The boxes represent the interquartile range (IQR), whiskers correspond to the maximum and minimum values, and the middle line inside each box indicates the mean value. The markers ***, **, and * indicate significant differences at p < 0.001, p < 0.01 and p < 0.05, respectively.
- (2)
- Parishin Content
Significant variations in parishin contents were observed among WTM tubers harvested from seed tubers of different weights. Specifically, the parishin A content was relatively low in the ≤5 g seed tuber group (0.1857%), while higher values were detected in the 5–10 g, 10–15 g, and 15–20 g groups. A statistically significant difference was only found between the ≤5 g group and the other three groups (Figure 5d). In terms of parishin B content, the ≤5 g group had the minimum concentration (0.1191%), whereas the 5–10 g group showed the highest value of 0.213%. The 15–20 g group (0.1462%) and the 10–15 g group (0.1358%) ranked second and third, respectively. Significant differences in parishin B were only present between the 5–10 g group and the remaining three treatments (Figure 5e). For parishin C content, the measured values were 0.0333%, 0.0579%, 0.0441%, and 0.038% for the ≤5 g, 5–10 g, 10–15 g, and 15–20 g groups in sequence. Significant differences were only detected between the 5–10 g group and the ≤5 g group as well as the 15–20 g group (Figure 5f). With regard to parishin E content, the ≤5 g group possessed the lowest level (0.4511%), and the 5–10 g group exhibited the maximum content (0.6313%). The pattern of statistical differences across groups was identical to that of parishin C (Figure 5g).
Total parishin content (sum of parishin A, B, C, and D) peaked in the 5–10 g group at 1.147%, followed by the 10–15 g group (0.9679%) and the 15–20 g group (0.8984%). The ≤5 g group had the lowest total parishin content (0.7891%). The 5–10 g group was significantly different from the other three groups, and a significant difference was also identified between the ≤5 g group and the 10–15 g group (Figure 5h).
3.2. Effects of Seeding Rate on Yield and Bioactive Component Contents
3.2.1. Yield Under Different Seeding Rates
- (1)
- Yield Comparison
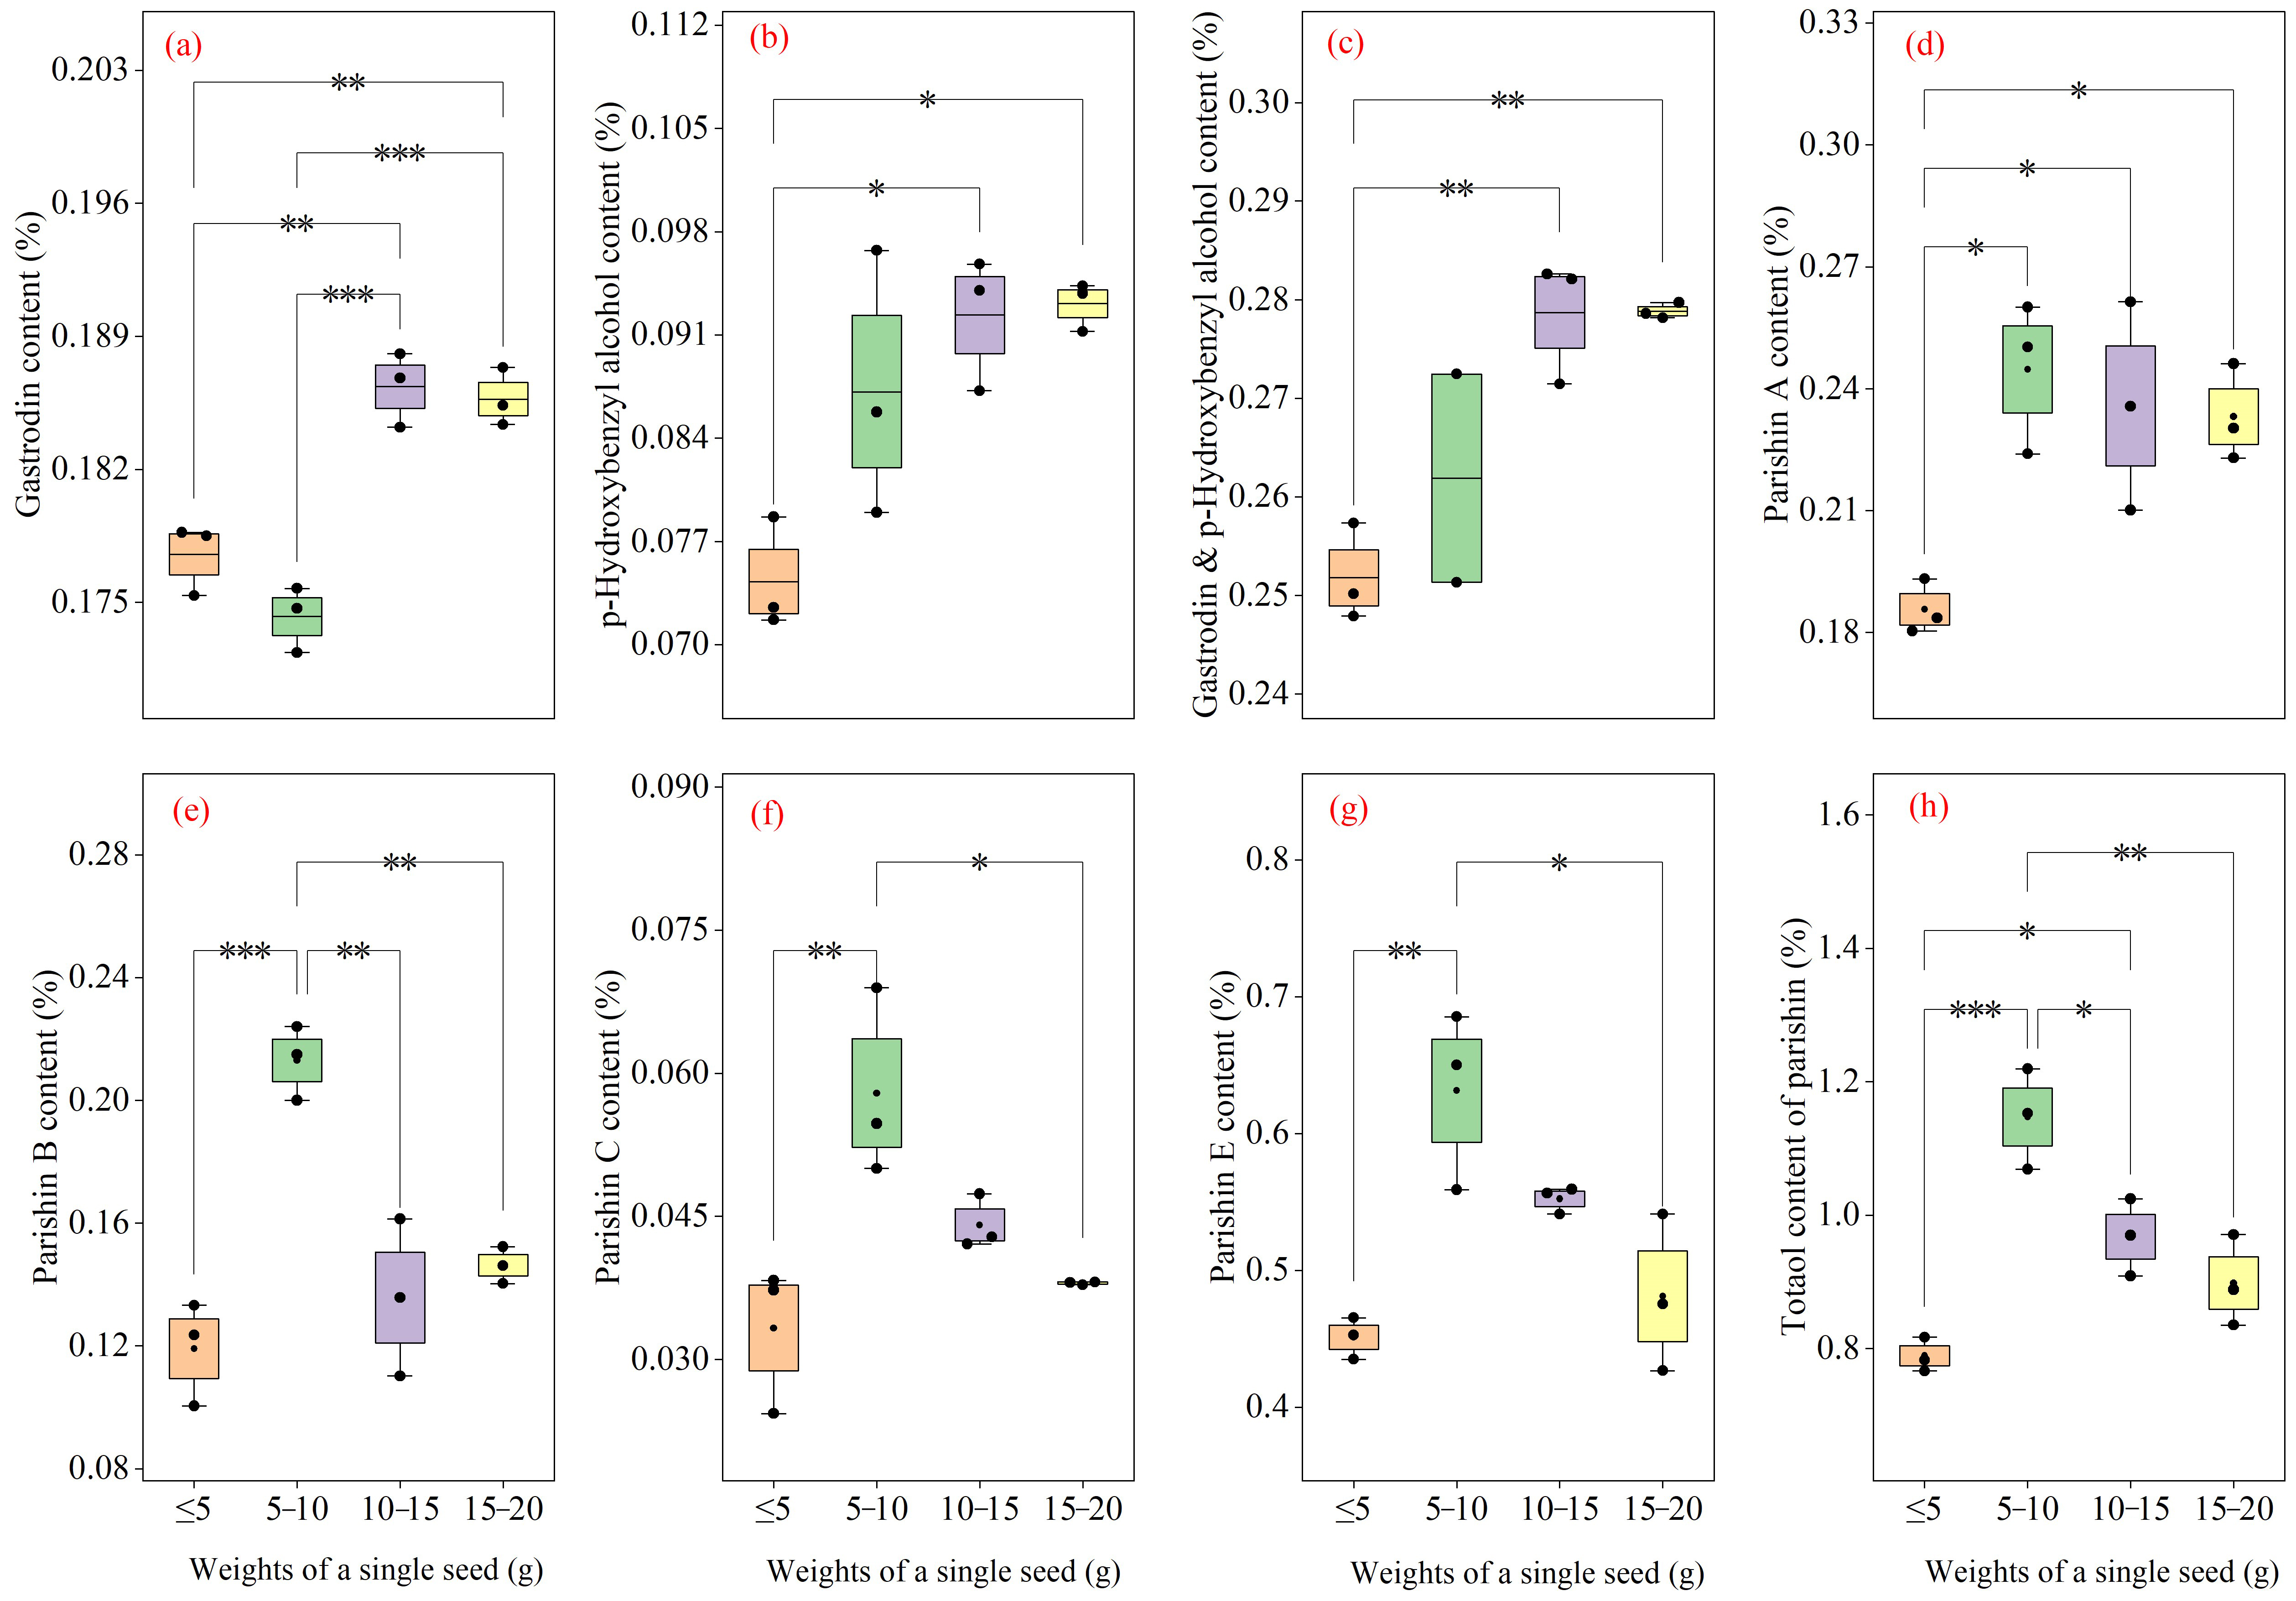
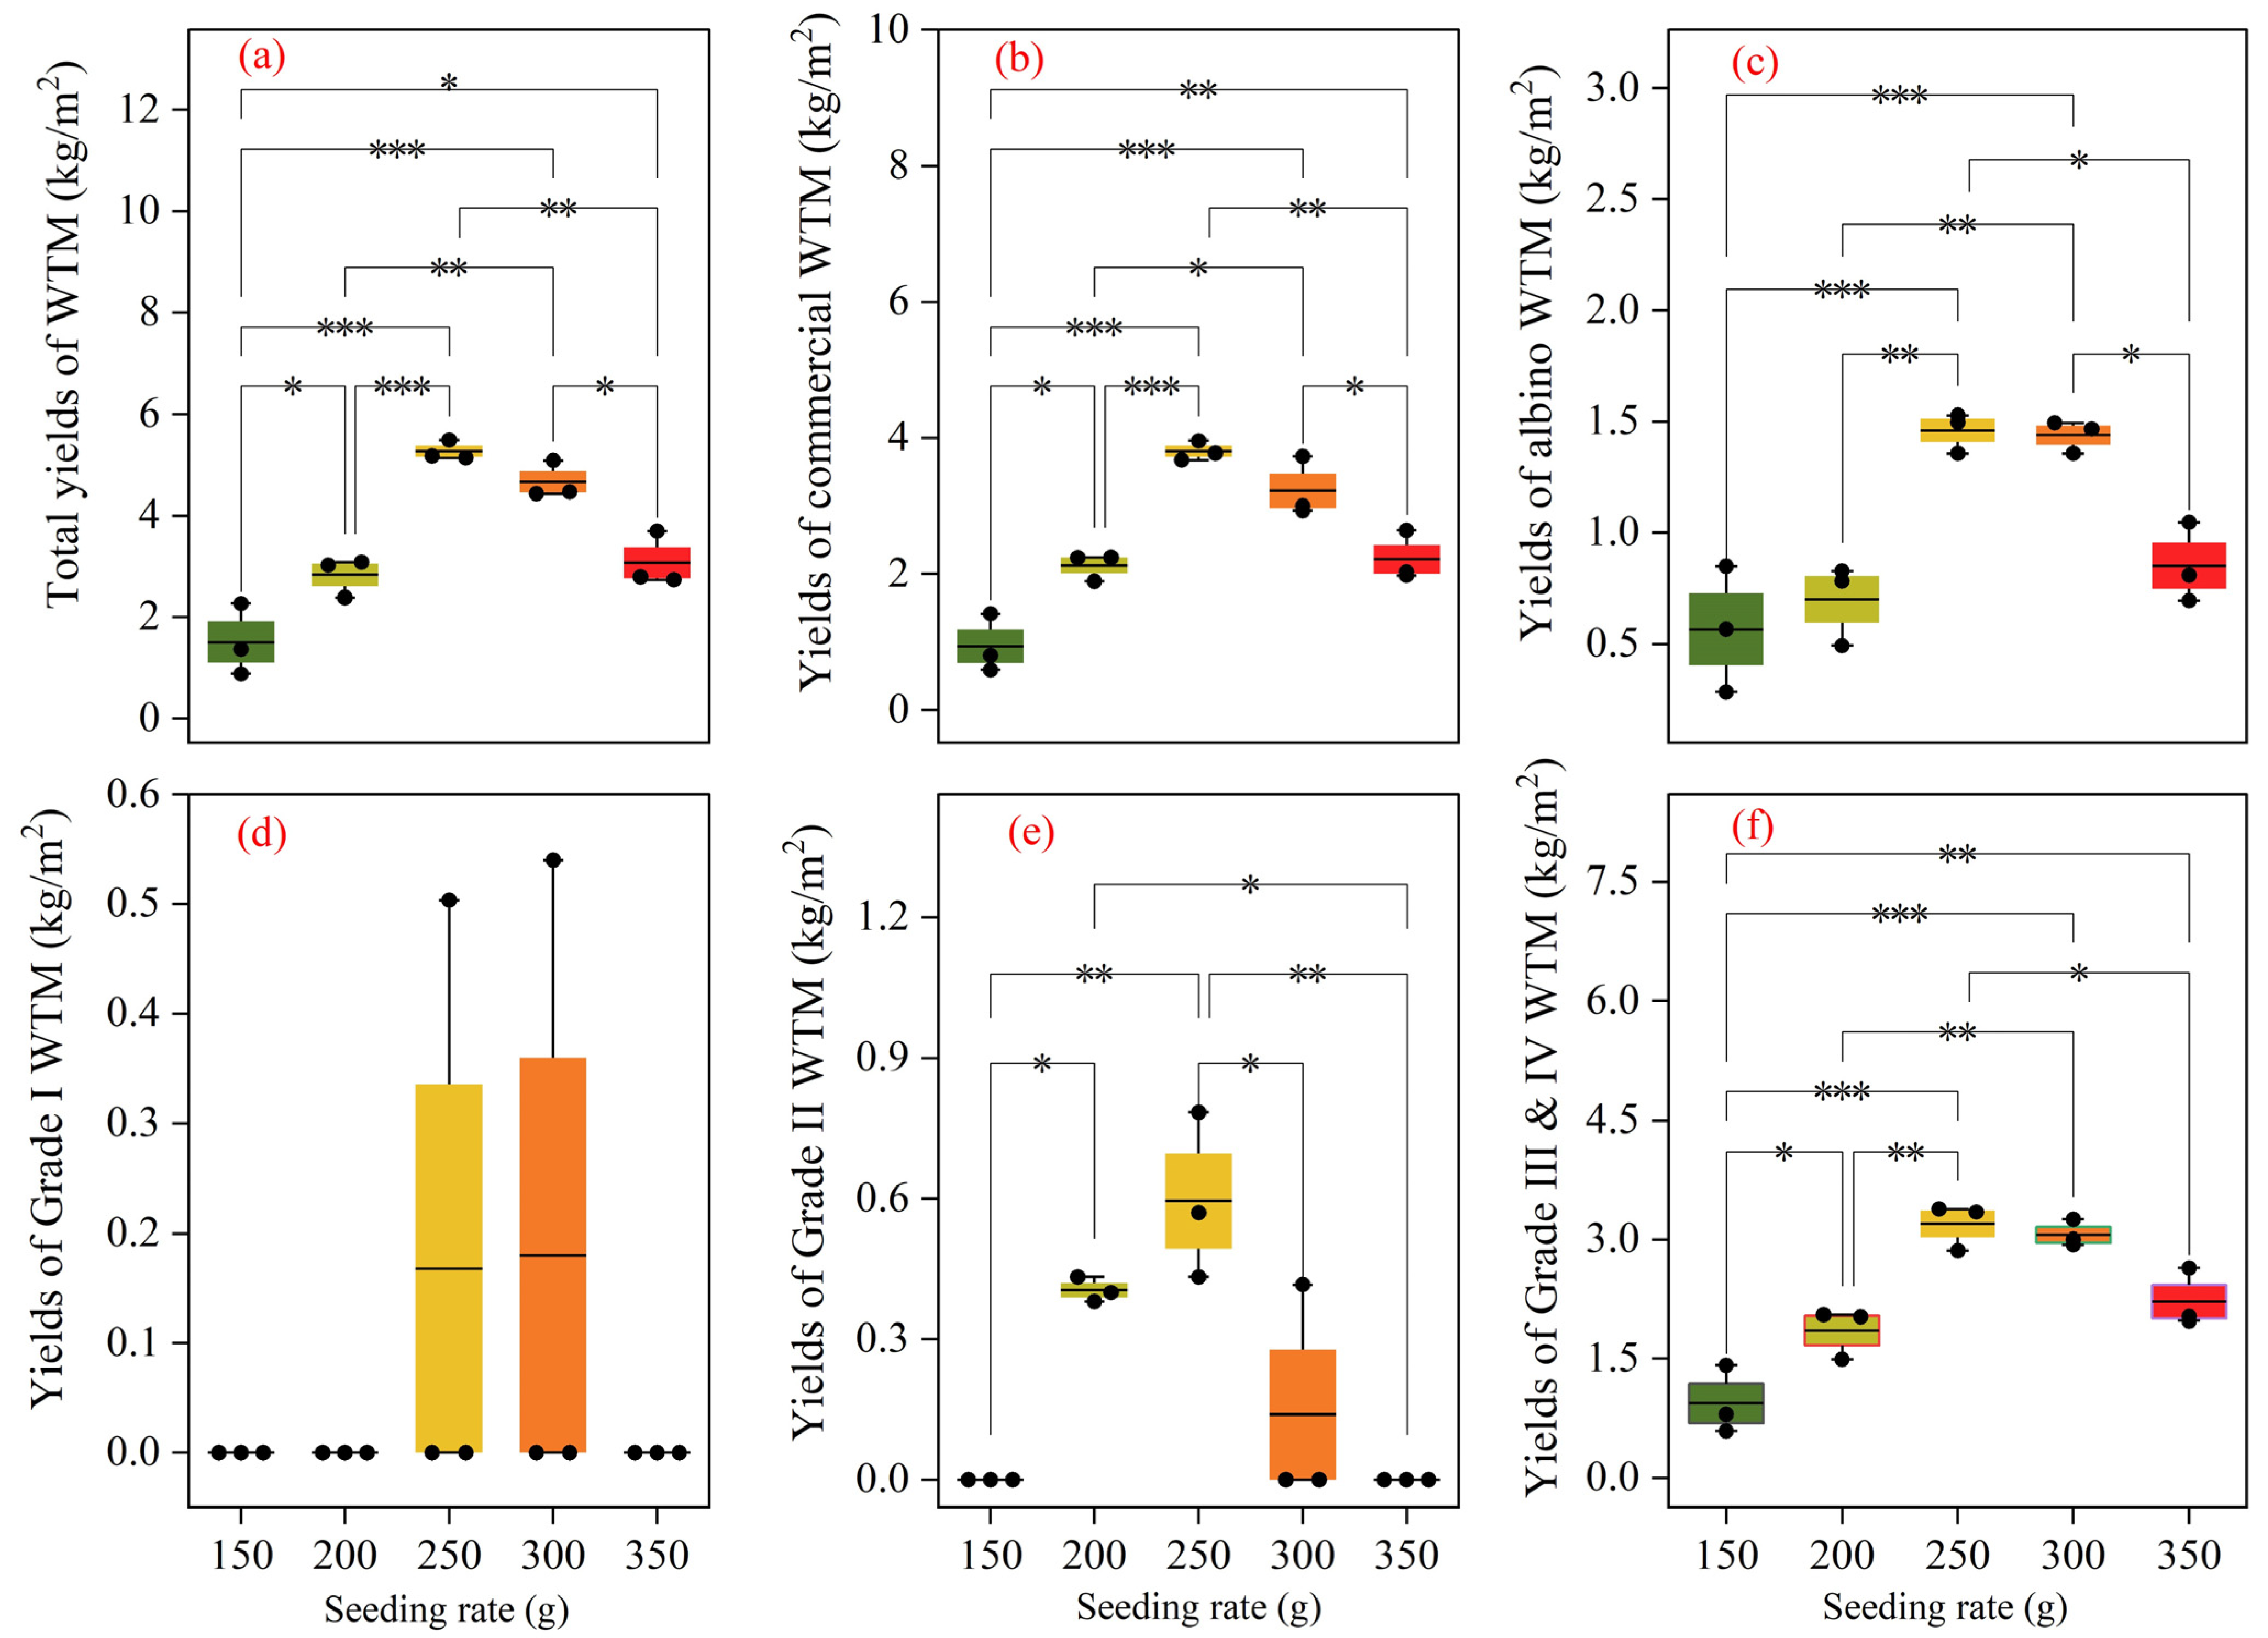
As shown in Figure 6a, total yield was highest at a seeding rate of 250 g (5.27 kg/m2), followed by 300 g, 350 g, and 200 g; the 150 g treatment had the lowest yield, with an average of 1.50 kg/m2. Marketable WTM yield showed the same distribution pattern as total yield (Figure 6b). For total yield and marketable yield, all pairwise comparisons were significant except 200 g versus 300 g and 250 g versus 300 g. Albino WTM yield was relatively high in the 250 g and 300 g treatments (1.46 and 1.44 kg/m2, respectively), while the other three treatments produced <1.00 kg/m2 (Figure 6c). Significant differences in albino WTM yield were mainly observed between the 250/300 g treatments and the other treatments. Across the 150–350 g range, total, marketable, and albino WTM yields exhibited an inverted V-shaped response.
Figure 6.
Yield performance of WTM under different seeding rates. (a–c) Total yield, marketable yield, and albino WTM yield, respectively; (d–f) Grade I, Grade II, and combined Grade III–IV yields, respectively. The boxes represent the interquartile range (IQR), whiskers correspond to the maximum and minimum values, and the middle line inside each box indicates the mean value. The markers ***, **, and * indicate significant differences at p < 0.001, p < 0.01 and p < 0.05, respectively.
The grading analysis showed that Grade I yield was similar in the 300 g and 250 g treatments (0.18 and 0.17 kg/m2, respectively), whereas the 150 g, 200 g, and 350 g treatments produced no Grade I tubers (Figure 6d). Because Grade I yield was similar between the 250 g and 300 g treatments, no significant difference was detected between them; the three treatments without Grade I tubers also did not differ significantly from one another. For Grade II tubers, the 250 g treatment had the highest yield (0.60 kg/m2), followed by the 200 g treatment (0.40 kg/m2); Significant statistical differences were detected between treatments that produced Grade II tubers and those that did not (Figure 6e). The combined yield of Grade III–IV tubers showed a trend generally consistent with total yield, and the pattern of statistical significance was also similar (Figure 6f).
3.2.2. Variations in Drying Loss Rate and Moisture Content
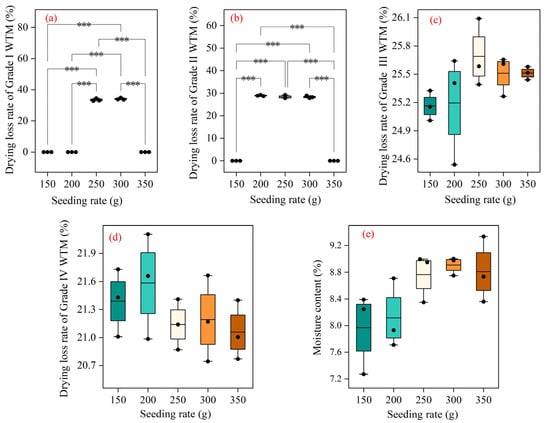
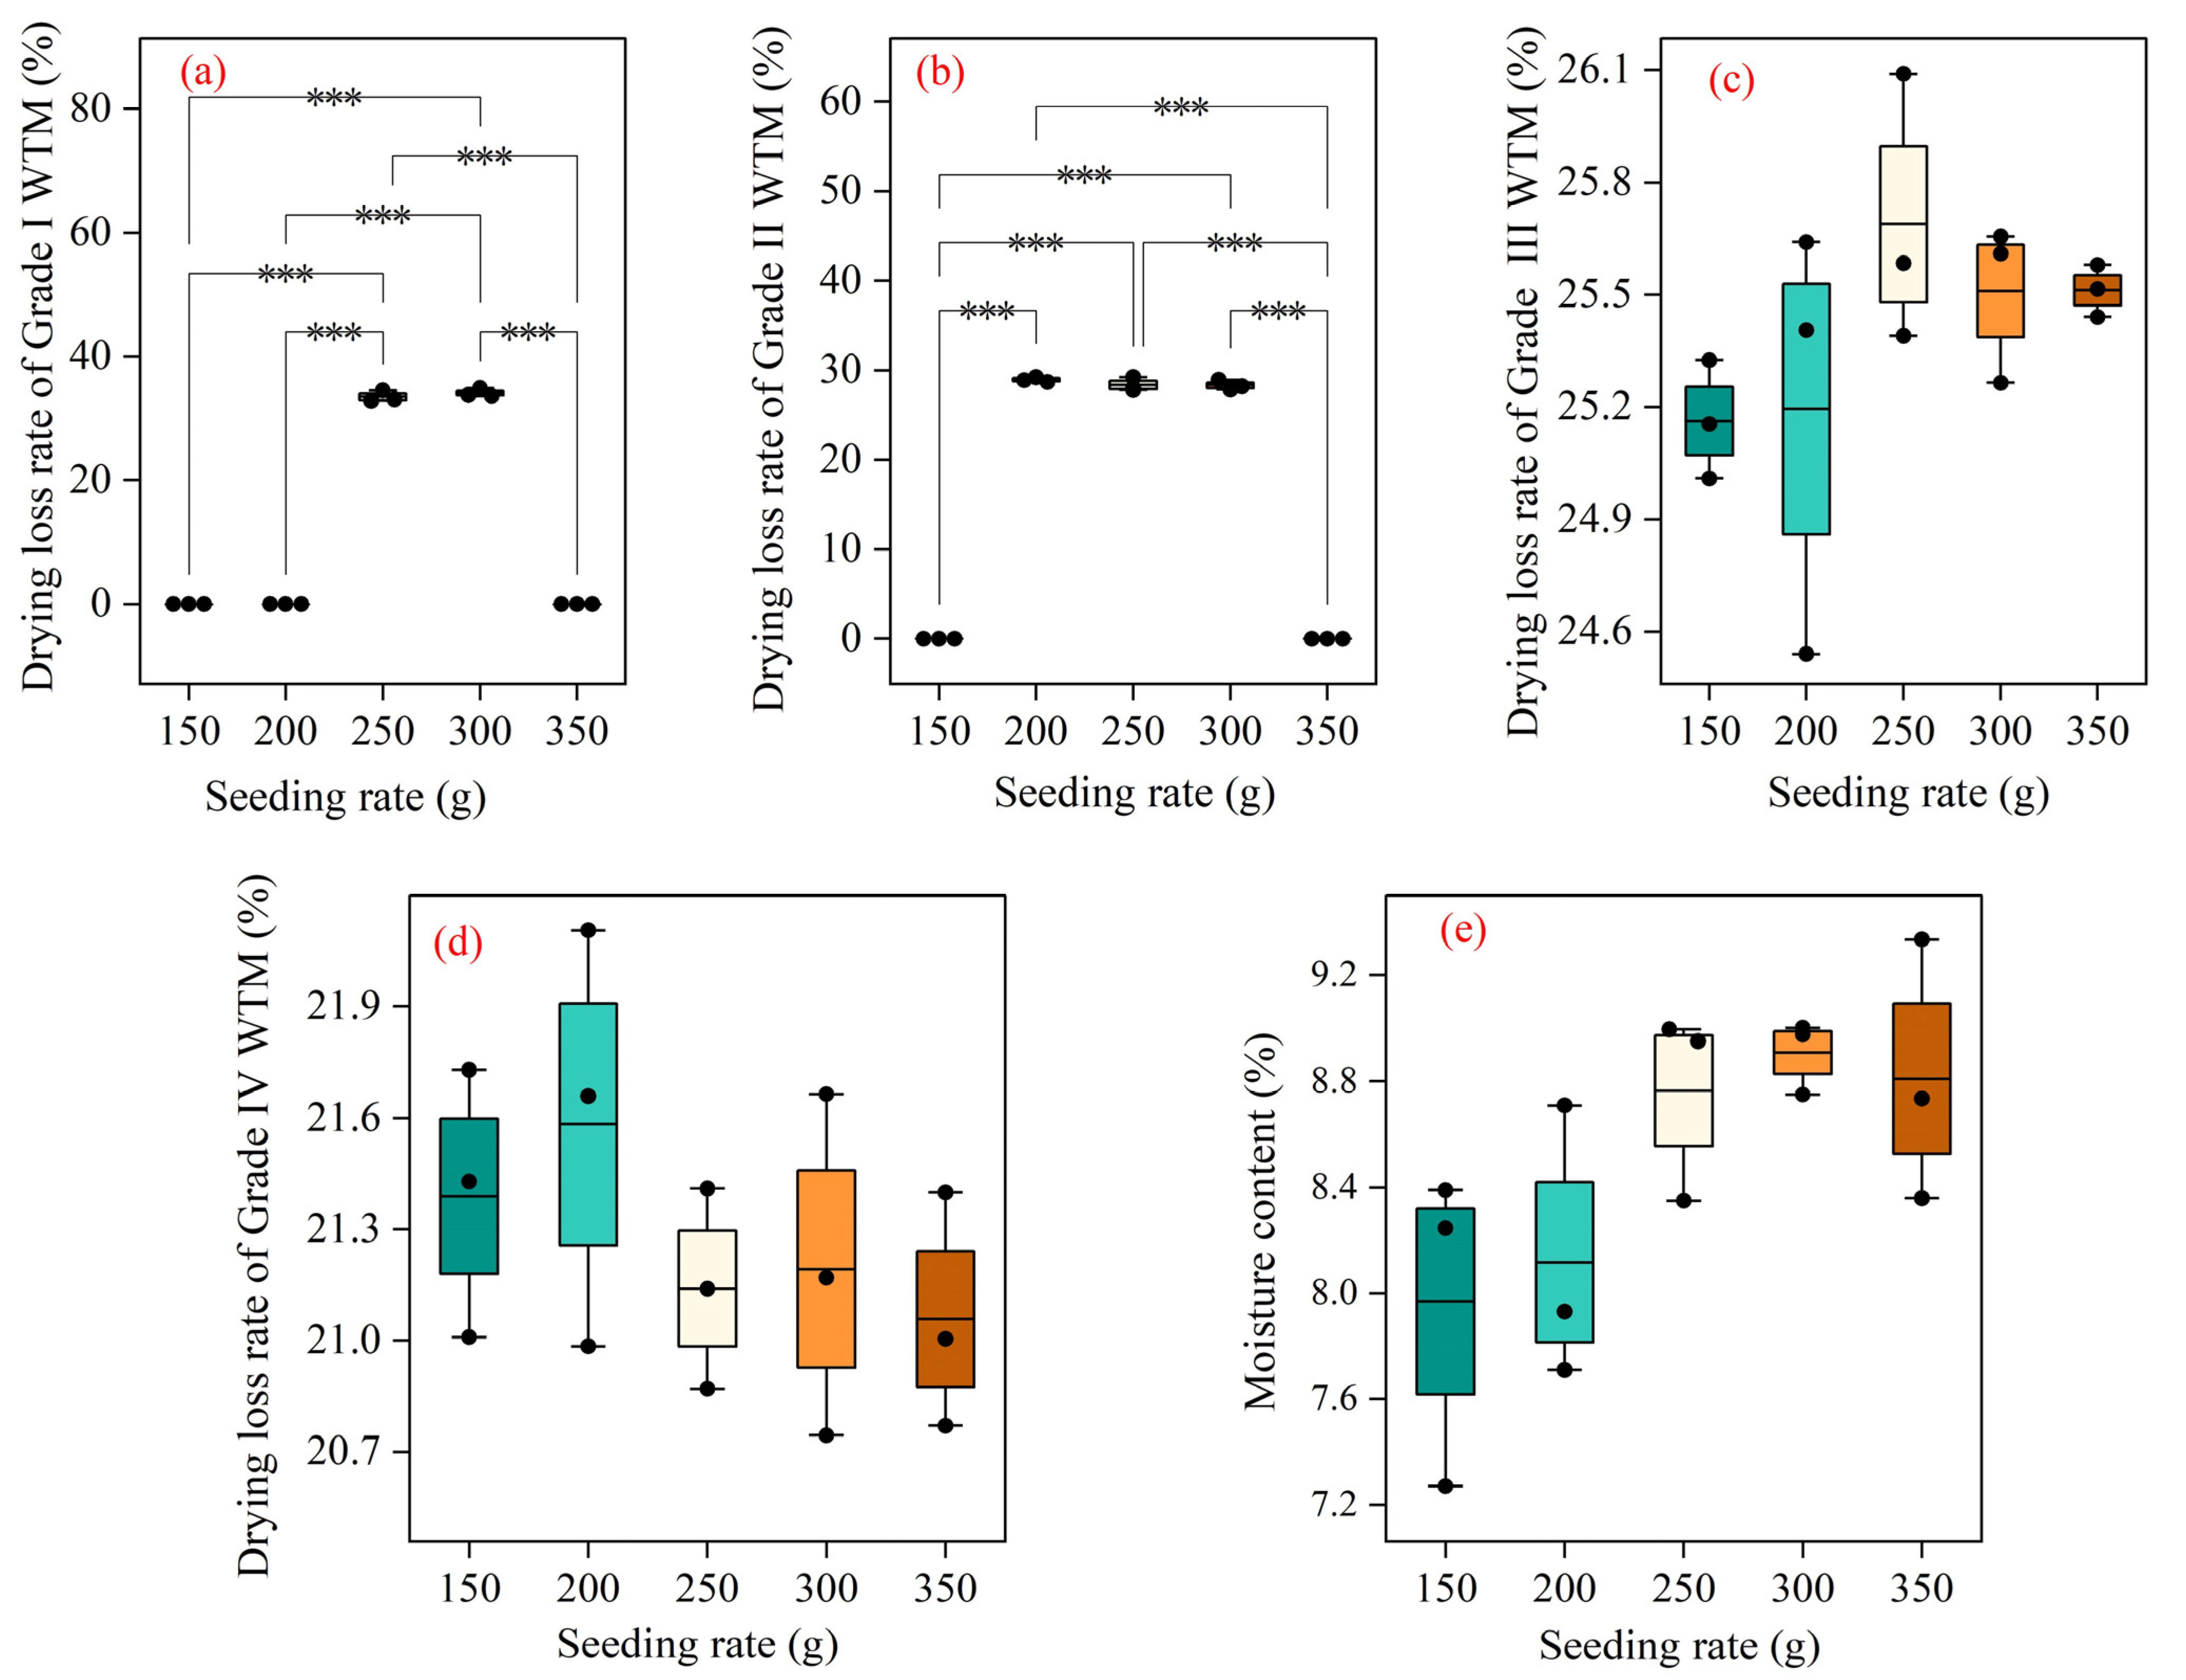
As shown in Figure 7a, only the 250 g and 300 g treatments produced Grade I tubers. The maximum drying loss rate of Grade I tubers reached approximately 34% across sampling sites. Grade II tubers were harvested solely in the 200 g, 250 g, and 300 g groups, with an average drying loss rate of roughly 28% (Figure 7b). Grade III and Grade IV tubers were collected at all sampling points; the drying loss rate generally averaged around 25% for Grade III tubers and approximately 21% for Grade IV tubers (Figure 7c,d). Significant differences in the dry matter conversion rates of Grade I and Grade II tubers were only found between yielding and non-yielding groups. No statistically significant differences were observed among different tuber application rate groups for both Grade III and Grade IV tubers.
Figure 7.
Drying loss rates and moisture contents of WTM from different seeding rates. Panels (a–d) represent Grade I, Grade II, Grade III, and Grade IV tubers, respectively. (e) Moisture contents of WTM from different seeding rates. The boxes represent the interquartile range (IQR), whiskers correspond to the maximum and minimum values, and the middle line inside each box indicates the mean value. The marker *** indicates significant differences at p < 0.001.
In terms of moisture content (Figure 7e), the moisture levels of harvested tubers under different tuber application rates followed the order: 300 g group (8.91%) > 350 g group (8.81%) > 250 g group (8.77%) > 200 g group (8.21%) > 150 g group (7.97%). Overall, higher seeding dosage corresponded to higher moisture content in the harvested WTM products. Although numerical differences in dry matter conversion rate existed among treatments, no statistically significant differences were detected between any groups.
3.2.3. Bioactive Component Contents Under Different Seeding Rates
- (1)
- Gastrodin and p-Hydroxybenzyl Alcohol Contents
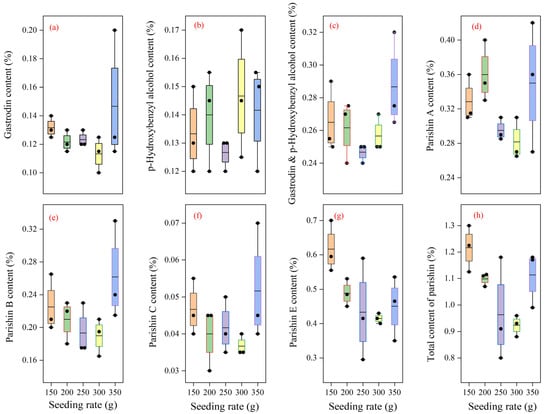
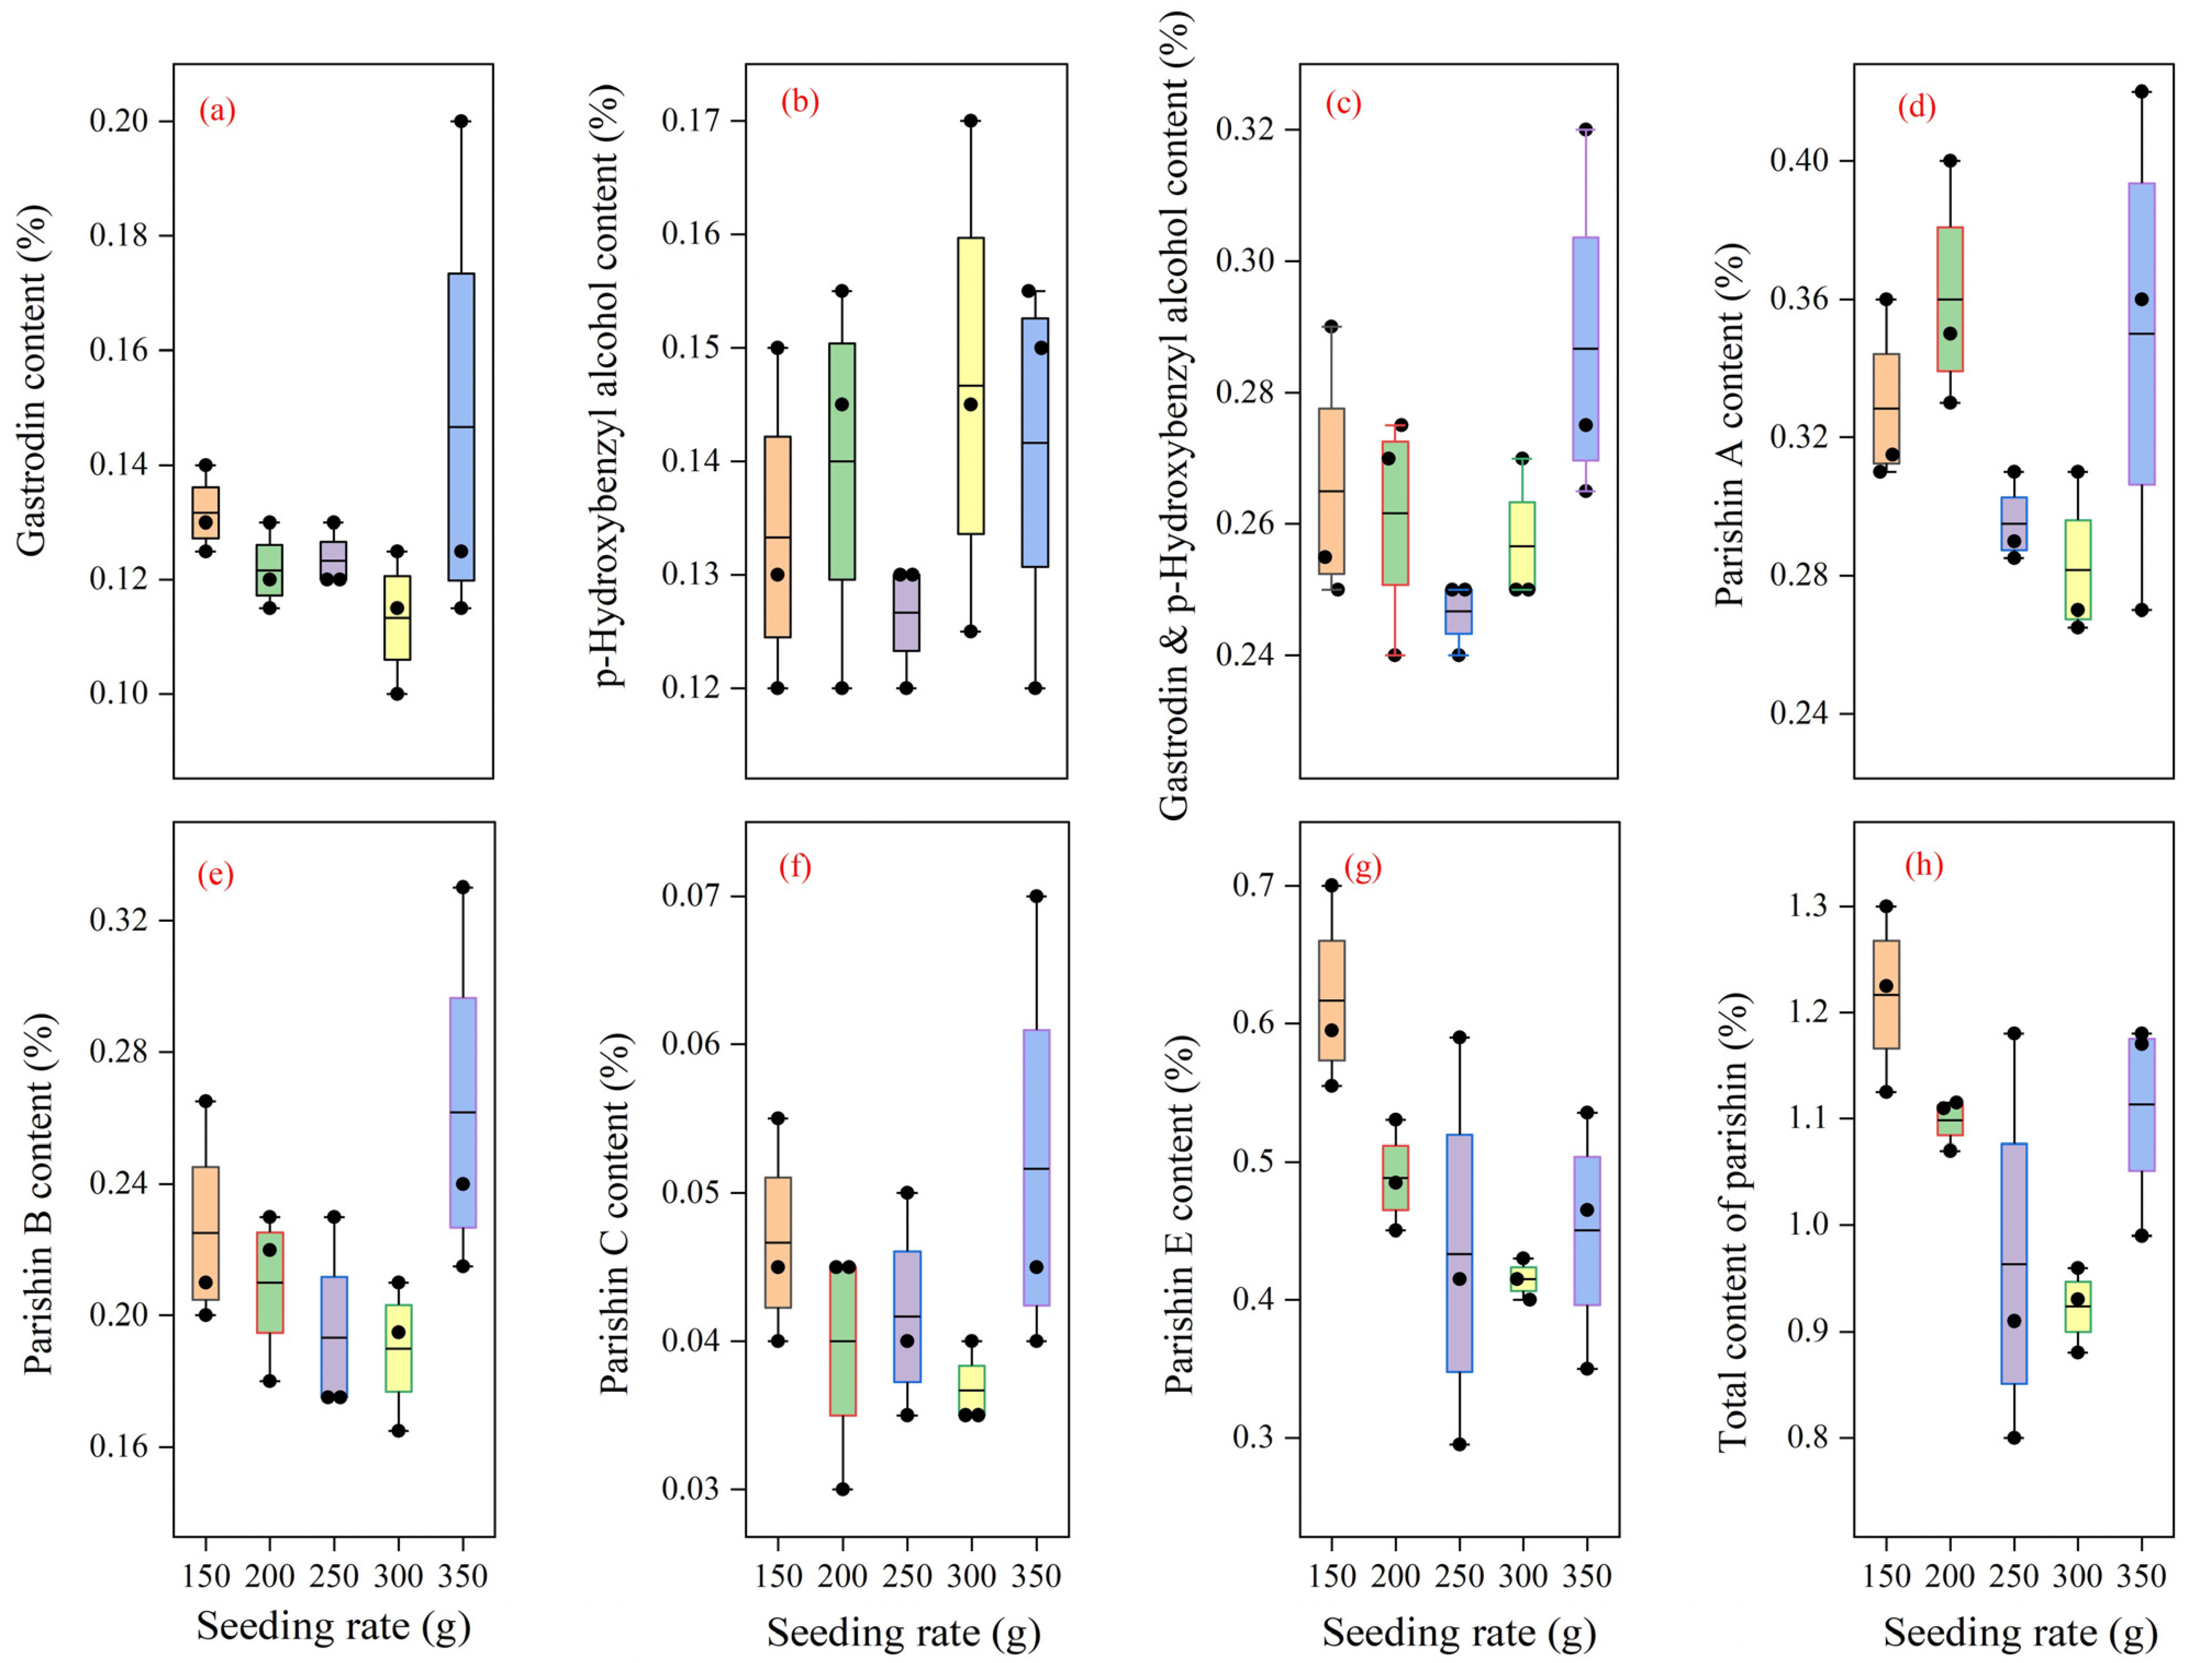
As shown in Figure 8a–c, Gastrodin content followed the order 350 g (0.15%) > 150 g (0.13%) > 200 g and 250 g (0.12%) > 300 g (0.11%), suggesting an overall decline in gastrodin content at higher seeding rates. p-Hydroxybenzyl alcohol content followed the order 300 g (0.15%) > 350 g and 200 g (0.14%) > 250 g and 150 g (0.13%), suggesting a slight increase with seeding rate. In regard to the total content of gastrodin and p-Hydroxybenzyl alcohol, the ranking among treatments was as follows: 350 g group (0.86%) > 150 g group (0.795%) > 200 g group (0.785%) > 300 g group (0.77%) > 250 g group. Excluding the 350 g treatment, the total content declined gradually with the increase in tuber application rate. Nevertheless, no statistically significant intergroup differences were observed for individual gastrodin, p-Hydroxybenzyl alcohol content, nor their summed total content.
Figure 8.
Bioactive component contents in WTM produced under different seeding rates. (a–c) Gastrodin, p-Hydroxybenzyl alcohol, and their combined contents; (d–h) parishin A, parishin B, parishin C, parishin E, and total parishin contents, respectively. The boxes represent the interquartile range (IQR), whiskers correspond to the maximum and minimum values, and the middle line inside each box indicates the mean value.
- (2)
- Parishin Content
As shown in Figure 8c–h, parishin A content followed the order 200 g (0.36%) > 350 g (0.35%) > 150 g (0.33%) > 250 g (0.30%) > 300 g (0.28%). Parishin B content followed the order 350 g (0.26%) > 150 g (0.23%) > 200 g (0.21%) > 250 g and 300 g (0.19%). Parishin C content was higher in the 150 g and 350 g treatments (0.05%) than in the 200 g, 250 g, and 300 g treatments (0.04%). Parishin E content followed the order 150 g (0.62%) > 200 g (0.49%) > 350 g (0.45%) > 250 g (0.43%) > 300 g (0.42%), showing a decreasing trend with increasing seeding rate. Total parishin content followed the order 150 g (1.22%) > 350 g (1.11%) > 200 g (1.10%) > 250 g (0.96%) > 300 g (0.92%), which was generally opposite to the yield trend. No statistically significant differences were detected in the individual contents of each parishin component as well as total parishin content across all tuber seeding rate treatments.
3.3. Comprehensive Index Analysis of WTM Yield and Bioactive Component Contents
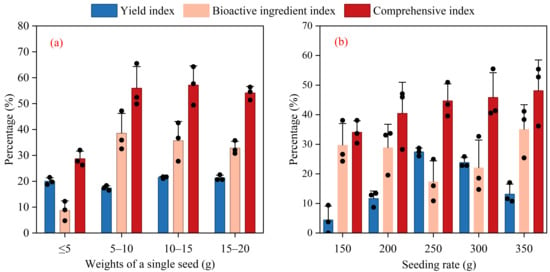
A comprehensive analysis of yield and bioactive component contents in harvested WTM is presented in Figure 9a. The yield indices for the <5 g, 5–10 g, 10–15 g, and 15–20 g seed-tuber groups were 20.01%, 17.39%, 21.49%, and 21.27%, respectively, indicating that the 10–15 g and 15–20 g groups had comparable yield performance, with the 10–15 g group slightly higher. The bioactive-component index followed the order 5–10 g (38.53%) > 10–15 g (35.64%) > 15–20 g (32.82%) > <5 g (8.65%), indicating that seed tubers weighing >5 g produced relatively favorable bioactive-component levels. The composite index followed the order 10–15 g (57.13%) > 15–20 g (55.92%) > 5–10 g (54.10%) > <5 g (28.66%). These results indicate that seed tubers weighing at least 10 g generally performed well, with the 10–15 g class being the most suitable under the present experimental conditions.
Figure 9.
Comprehensive yield and bioactive-component indices of WTM under (a) different seed-tuber weight classes and (b) seeding rates.
For seeding rate, the yield index followed the order 250 g (27.39%) > 300 g (23.82%) > 350 g (13.13%) > 200 g (11.63%) > 150 g (6.58%), showing an inverted V-shaped response. In contrast, the bioactive-component index followed the order 350 g (34.96%) > 150 g (29.64%) > 200 g (28.78%) > 300 g (21.98%) > 250 g (17.27%). When yield and bioactive-component contents were considered together, the composite index followed the order 350 g (48.09%) > 300 g (45.79%) > 250 g (44.65%) > 200 g (40.41%) > 150 g (34.02%) (Figure 9b). Thus, although yield alone peaked at 250 g, the highest composite performance was obtained at 350 g because of its higher bioactive-component index.
4. Discussions
4.1. Advantages of Medium-Sized G. elata Seed Tubers and Their Practical Significance
This study showed that seed tubers weighing 10–15 g achieved the best overall balance between yield and bioactive-component contents. This finding provides empirical support for selecting seed-tuber size in G. elata production. From an economic and agronomic perspective, excessively small seed tubers (<5 g) may have insufficient nutrient reserves and limited capacity to establish an effective symbiotic interface with Armillaria spp., thereby reducing early growth vigor and harvest quality. Conversely, very large seed tubers (>15–20 g) may produce high-quality individual plants, but their higher input cost and lower planting number per unit mass may reduce cost-effectiveness at the field scale. The 10–15 g class therefore appears to balance propagule vigor with resource-use efficiency. The underlying theoretical basis is that the effect of seed tuber weight on G. elata yield is governed by cascading responses originating from disparities in initial nutrient reserves, the formation efficiency of reproductive organs, growth initiation efficiency determined by intrinsic nutrients, and biomass accumulation. G. elata seeds are extremely tiny and endosperm-free; their germination and early developmental processes are completely dependent on endogenous nutrient storage and colonization by symbiotic fungi such as Armillaria mellea [27]. This biological trait gives rise to a priming effect exerted by seed tuber weight on final yield. Heavier seed tubers generally contain higher levels of basal nutrients including proteins and carbohydrates, which supply sufficient energy for protocorm generation and further improve germination percentage and early seedling survival rate. Seedlings germinated from large seed tubers develop bigger tubers at the seedling stage. Larger tuber surface areas facilitate the attachment of fungal rhizomorphs, thereby elevating the nutrient acquisition efficiency via symbiotic fungi. This process eventually establishes a positive feedback loop: large seed tuber → robust seedling → large protocorm → elevated yield. In contrast, seedlings derived from light seed tubers suffer suppressed early growth. Even under favorable environmental conditions in later developmental stages, these seedlings cannot compensate for the deficit in initial biomass [28]. Our observations are highly consistent with the natural distribution and variation rules of seed size reported in plant ecology [29].
The results also showed that individual seed-tuber weight substantially affected yield but had a weaker and less consistent effect on measured bioactive components. This suggests that the accumulation of gastrodin, p-Hydroxybenzyl alcohol, and parishin may be regulated more strongly by genotype, developmental stage, fungal partners, and environmental conditions than by initial seed-tuber mass alone. First, the biosynthetic capacity for major bioactive compounds is largely associated with varietal genetic background [30]. Second, G. elata is a mycoheterotrophic medicinal plant, and the production of bioactive compounds is closely related to its symbiotic interaction with Armillaria spp. and other fungal communities. Previous studies have reported positive associations between Armillaria colonization and gastrodin accumulation, while wood-decaying and plant-pathogenic fungi may also influence secondary metabolism through community-level interactions. Third, bioactive compounds in G. elata show developmental-stage specificity: gastrodin and parishin A, B, and E are usually enriched during the mi-ma stage, whereas p-Hydroxybenzyl alcohol may peak at the protocorm or early developmental stage [31]. This dynamic variation verifies the theory that the accumulation of medicinal active ingredients is mainly controlled by the genetics, hereditary characteristics, and developmental progress of seed tubers, rather than the initial weight of seed tubers [32,33,34].
4.2. Nonlinear Relationship Between Bioactive Components and Yield Under Different Seeding Rates and Its Implications for “Quality-Yield” Management
This study indicated that appropriate increases in seed rate can significantly improve the yield of WTM, which is synergistically mediated by population ecological adaptation, plant physiological development, fungus-plant symbiosis, and multi-level molecular regulatory mechanisms. Resource distribution in forest understory habitats is heterogeneous, and optimal population density can enhance the resource utilization efficiency of G. elata. Moderately high population density strengthens intraspecific mutualism through mycelial nutrient sharing and collective resistance to pests and diseases, and regulates microenvironmental factors including local temperature, humidity, and CO2 concentration via plant transpiration and respiration. At the cellular and organ levels, suitable sowing density maintains vigorous metabolic activity in cortical cells, promotes the accumulation of starch, protein, and other storage substances, remodels key agronomic traits such as bud length, tuber morphology and single tuber fresh weight, and modulates core physiological processes including photosynthesis, respiration, and secondary metabolism [35]. Still, seed rate regulates yield formation mainly by restructuring the symbiotic relationship between G. elata and Armillaria mellea [36]. Increased sowing density elevates the contact probability between host and fungi, optimizes the area and density of symbiotic interfaces, and consequently improves the efficiency of nutrient translocation. Meanwhile, seed rate stabilizes the establishment and maintenance of symbiosis by modulating the succession of rhizosphere microbial communities. At the molecular level, seed rate mediates G. elata yield through multiple regulatory pathways, covering gene transcription and translation, protein expression and activity, phytohormone and signal transduction, as well as epigenetic modification [37,38,39,40].
Notably, yield exhibited a nonlinear correlation with active ingredient content, and yield improvement did not cause significant changes in the accumulation of bioactive components, reflecting a coordinated stability of yield and quality. Unlike photosynthetic plants that present typical density-dependent resource trade-offs [41], G. elata is an obligate heterotrophic mycorrhizal plant that completely relies on A. mellea for carbon and nitrogen nutrition [42]. The key enzymes (C4H, PAL, 4CL) involved in the biosynthesis of gastrodin and parishin are primarily determined by genotype and tuber developmental stage, whereas planting density and initial seedling weight have no substantial effect on the transcription of secondary metabolic genes [43,44]. Density-induced vegetative growth merely activates carbon anabolism for biomass synthesis without competing for secondary metabolic precursors. The auxin signaling pathway only regulates tuber branching rather than inhibiting the expression of key enzymes in the phenylpropanoid pathway, thereby preventing the dilution of active ingredients under high-yield conditions [45]. Furthermore, population density only alters tuber quantity per unit area and exerts no significant influence on individual tuber maturity and metabolite accumulation duration [46]. These findings differ from the classical plant optimal resource allocation theory, which emphasizes resource trade-offs, symbiotic fluctuation, and genetic antagonism between yield and quality [47].
4.3. Limitations and Outlooks
Although extensive field monitoring and laboratory experiments in this study have determined the optimal seed weight and seeding rate for WTM cultivation in karst plateau mountainous regions based on yield and bioactive ingredient performances, the current results are obtained from single-season trials with limited temporal and spatial scales. Furthermore, this study fails to elaborate the cascading mechanism linking site conditions, seed screening, agronomic traits, yield formation, and active ingredient accumulation. More importantly, the specific characteristics of karst habitat conditions and their underlying roles in driving the differential yield and quality performance of G. elata remain unclarified in the present work. Future studies should conduct multi-site and multi-year replicated field trials across the main karst G. elata production areas of the Yunnan-Guizhou Plateau and should include systematic measurements of soil moisture, soil nutrients, temperature, humidity, Armillaria colonization, microbial community composition, and tuber developmental stage. Combining metabolomics, transcriptomics, and microbiome profiling would help clarify the biological pathways linking seed-tuber size and seeding rate to secondary-metabolite accumulation. In addition, causal inference approaches, such as structural equation modeling or other causal models, could be used to quantify direct and indirect effects of seed-tuber traits, site conditions, and fungal interactions on yield and quality. Digital growth models may also be useful for integrating microenvironmental data with phenotypic outcomes, but they should be developed only after sufficient multi-site empirical data have been collected.
5. Conclusions
This study systematically evaluated the effects of seed-tuber weight and seeding rate on the yield and medicinal quality of WTM under forest-simulated cultivation in karst mountainous areas. Our findings demonstrate that medium-sized tubers offer the optimal output between yield and bioactive components, making them the preferred choice for direct production. Although small-sized tubers are less productive, they remain viable for commercial seed propagation without compromising the pharmaceutical quality of the final harvest. Furthermore, an appropriately increased seeding rate can significantly improve tuber productivity and enhance the utilization of limited ecological resources, while maintaining stable levels of key bioactive ingredients. These results provide actionable guidelines for germplasm selection and planting regime optimization in heterogeneous karst environments, supporting the sustainable integration of ecological conservation with economic returns. Future research should evaluate superior seed-tuber sources across temporal and spatial scales and should focus on genetic background, microhabitat conditions, fungal symbionts, and climate factors. Given the strong spatial heterogeneity of karst regions, we should clarify the environment–composition–efficacy relationship of WTM and determine how karst stresses, such as drought, high calcium availability, and nutrient-poor soils, influence secondary-metabolite accumulation and pharmacological quality.
Supplementary Materials
The following supporting information can be downloaded at: https://www.mdpi.com/article/10.3390/f17080956/s1, Figure S1: Monthly precipitation and mean air temperature during the growing season in the study area.
Author Contributions
Conceptualization, Data curation, Formal analysis, Investigation, Methodology, and Drawing, Y.W.; Methodology and Drawing, Writing—review and editing, Formal analysis, Y.L.; Methodology, Investigation, and Data curation, Z.C., C.W., M.L. and M.Z.; Writing—review and editing, Funding acquisition, and Supervision, X.Z.; All authors have read and agreed to the published version of the manuscript.
Funding
This research was funded by the Guizhou Provincial Talent Base Construction Project (Grant No. RCJD2020-21), Bijie City’s Third Batch of Talent Team Projects (Grant No. BWRLBT2023-16), and Guizhou Provincial Science and Technology Support Program Project (Grant No. QKHZC2024-YB108).
Data Availability Statement
The raw data supporting the conclusions of this article will be made available by the authors on request.
Acknowledgments
The authors thank the reviewers and editor for their insightful comments and constructive suggestions.
Conflicts of Interest
The authors declare no conflicts of interest.
References
- Gong, M.Q.; Lai, F.F.; Chen, J.Z.; Li, X.H.; Chen, Y.J.; He, Y. Traditional uses, phytochemistry, pharmacology, applications, and quality control of Gastrodia elata Blume: A comprehensive review. J. Ethnopharmacol. 2024, 319, 117128. [Google Scholar] [CrossRef] [Scilit] [PubMed]
- National Pharmacopoeia Commission of the People’s Republic of China. Pharmacopoeia of the People’s Republic of China, 2020th ed.; China Medical Science Press: Beijing, China, 2020; Volume I. [Google Scholar]
- Zhong, Y.F.; Li, J.Q.; Liu, H.G.; Wang, Y.Z. The traditional uses, phytochemistry and pharmacology of Gastrodia elata Blume: A comprehensive review. Arab. J. Chem. 2025, 18, 106086. [Google Scholar] [CrossRef] [Scilit]
- Zhou, H.B.; Lu, S.Z.; Yu, Z.S.; Zhang, J.L.; Mei, Z.N. Mechanisms for the biological activity of Gastrodia elata Blume and its constituents: A comprehensive review on sedative-hypnotic, and antidepressant properties. Phytomedicine 2024, 123, 155251. [Google Scholar] [CrossRef] [Scilit] [PubMed]
- Li, C.P.; Shen, T.; Liu, H.G.; Wang, Y.Z. Simulation of suitable habitats and geographic tracing based on medicinal and edible plants with Gastrodia elata Bl. as an example. Glob. Ecol. Conserv. 2024, 49, e02790. [Google Scholar] [CrossRef] [Scilit]
- Chen, H.Y.; Yu, Y.; Zhao, J.H.; Zhang, J. Integrative Transcriptomic and Metabolomic Analysis Reveals Regulatory Networks and Metabolite Dynamics in Gastrodia elata Flower Development. Agronomy 2025, 15, 441. [Google Scholar] [CrossRef] [Scilit]
- Liu, S.; Wang, Z.; Lu, X. Gastrodia elata production areas in China: Climate and distribution changes (A.D. 25–2100). Front. Clim. 2026, 8, 1784735. [Google Scholar] [CrossRef] [Scilit]
- Wang, Y.H.; Xu, J.; Yuan, Q.S.; Guo, L.P.; Xiao, C.H.; Yang, C.G.; Li, L.Y.; Jiang, W.K.; Zhou, T. Effect of symbiotic fungi-Armillaria gallica on the yield of Gastrodia elata Bl. and insight into the response of soil microbial community. Front. Microbiol. 2023, 14, 1233555. [Google Scholar] [CrossRef] [Scilit] [PubMed]
- Fan, Y.X.; Tian, M.H.; Hu, D.F.; Xiong, Y. Exploring the Biocultural Nexus of Gastrodia elata in Zhaotong: A Pathway to Ecological Conservation and Economic Growth. Biology 2025, 14, 846. [Google Scholar] [CrossRef] [Scilit] [PubMed]
- Zeng, Y.; Cai, C.T.; Liu, G.Z.; Wen, P. Yield and Quality Variation in Two Varieties of Gastrodia elata Blume in Bionic Wild Cultivation at Different Altitudes. Plant Sci. J. 2011, 1, 637–643. [Google Scholar]
- Xu, J.P.; Guo, S.X. Retrospect on the research of the cultivation of Gastrodia elata Bl, a rare traditional Chinese medicine. Chin. Med. J. 2002, 113, 686–692. [Google Scholar]
- Jiang, X.J.; Dai, J.; Huang, Y.; Zhao, D.; Yin, Y.; Lin, Q.; Hou, M.M.; Jin, H. Comprehensive quantitative evaluation and mechanism analysis of influencing factors on yield and quality of cultivated Gastrodia elata Blume. Sci. Rep. 2025, 15, 18457. [Google Scholar] [CrossRef] [Scilit] [PubMed]
- Yu, E.; Gao, Y.G.; Li, Y.Q.; Pu, Z.; Zhao, Y.; He, Z.M. An exploration of mechanism of high quality and yield of Gastrodia elata Bl. f. glauca by the isolation, identification and evaluation of Armillaria. BMC Plant Biol. 2022, 22, 621. [Google Scholar] [CrossRef] [Scilit] [PubMed]
- Zhang, B.B.; Zhu, H.J.; Hua, L.; Li, X.H.; Luo, M.; Liu, D.H. Quality comparison of Gastrodia elata grown using artificial mushroom cultivation kits and traditional wood-based cultivation. Sci. Rep. 2025, 16, 2264. [Google Scholar] [CrossRef] [Scilit] [PubMed]
- Shang, Y.J.; Yang, S.Q.; Chang, Q.X.; Shen, K.Z.; Chen, S.N.; Liang, Z.S. Comparative analysis of the multi-element and pharmacological composition of Gastrodia elata blume from different geographic origins. J. Agric. Food Res. 2025, 22, 102087. [Google Scholar] [CrossRef] [Scilit]
- Shi, Y.; Gao, D.X.; Xiang, Y.L.; Pan, B.W.; Pang, Y.X. Comparative analysis of the nutritional and bioactive composition of Gastrodia elata from different varieties and origins. J. Food Compos. Anal. 2025, 148, 108385. [Google Scholar] [CrossRef] [Scilit]
- Sun, W.; Song, J.; Yang, W.; Zheng, Y.; Li, C.; Kuang, D. Distribution of carbonate rocks and variation analysis of karst water resources in China. Carbonates Evaporites 2020, 35, 121. [Google Scholar] [CrossRef] [Scilit]
- Veress, M. Karst Types and Their Karstification. J. Earth Sci. 2020, 31, 621–634. [Google Scholar] [CrossRef] [Scilit]
- Standard NY/T 1121.2-2006; Soil Testing Part 2: Determination of Soil pH. China Agriculture Press (Ministry of Agriculture of China): Beijing, China, 2006.
- Standard NY/T 1121.7-2014; Soil Testing Part 7: Determination of Soil Available Phosphorus. China Agriculture Press (Ministry of Agriculture of China): Beijing, China, 2014.
- Standard LY/T 1234-2015; Determination of Potassium in Forest Soil. China Standards Press (State Forestry Administration of China): Beijing, China, 2015.
- Standard LY/T 1228-2015; Determination of Nitrogen in Forest Soil. China Standards Press (State Forestry Administration of China): Beijing, China, 2015.
- Bátori, Z.; Valkó, O.; Vojtkó, A.; Tölgyesi, C.; Farkas, T.; Frei, K.; Hábenczyus, A.A.; Tóth, Á.; Li, G.; Rádai, Z.; et al. Environmental heterogeneity increases the conservation value of small natural features in karst landscapes. Sci. Total Environ. 2023, 872, 162120. [Google Scholar] [CrossRef] [Scilit] [PubMed]
- Wang, Y.F.; Li, Y.W.; Qu, S.H.; Peng, X.J.; Nong, G.Y.; Cui, X.M.; Yang, Y.; Lai, C.J.S.; Zhao, H.Y.; Xu, T.R.; et al. A rapid method for quantitative analysis of traditional Chinese medicine activity: A case study on antioxidant activity of Gastrodia elata. J. Ethnopharmacol. 2026, 360, 121173. [Google Scholar] [CrossRef] [Scilit] [PubMed]
- Zhang, Y.; Wang, C.Y.; Zhou, X.; Zhu, P.Y.; Ge, F.H.; Ruan, P.J.; Zhang, S. Quality characteristics of different parts of Gastrodia elata tuber based onsimultaneous quantification of multiple index components. Chin. Tradit. Herb. Drugs 2022, 53, 6337–6342. [Google Scholar]
- Li, Y.; Xiong, K.; Zhang, W.; Song, S.; Luo, L. Analyzing Characteristics of Grassland Gross Ecosystem Product to Inform Decision Making in the Karst Desertification Control. Agronomy 2023, 13, 1861. [Google Scholar] [CrossRef] [Scilit]
- Fan, S.C.; Liu, D.X.; Chen, C. Analysis on the Development Trend and Hot Spots of Gastrodia elata Bl. Research Based on Bibliometrics. Chin. J. Mod. Appl. Pharm. 2021, 38, 2754–2762. [Google Scholar]
- Hsieh, C.H.; Liang, C.Z.; Shieh, W.J.; Chang, S.L.; Ho, W.J. Effects of nutrients and growth regulators on seed germination and development of juvenile rhizome proliferation of Gastrodia elata in vitro. Agriculture 2022, 12, 1210. [Google Scholar] [CrossRef] [Scilit]
- Ou, O.Z.; Chen, Y.S.; Zhou, S.B.; Xu, Z.D. Analysis on variation of seed size of common autumn-matured plants in Tianma Nature Reserve. J. Plant Resour. Environ. 2012, 21, 53–59. [Google Scholar]
- Zhang, S.; Guo, D.; Zhao, C.; Shi, Y.; Zou, J.; Shi, H.; Cheng, J.; Sun, J.; Zhang, X. Integrating serum pharmacochemistry with network pharmacology and pharmacological validation to elucidate the mechanism of KaiXinSan in treating insomnia. BMC Complement. Med. Ther. 2025, 26, 5. [Google Scholar] [CrossRef] [Scilit] [PubMed]
- Li, P.; Xu, J.G.; Ji, D.; Mao, C.Q.; Zhang, K.W.; Song, Y.; Lu, T.L. Correlation between appearance characteristics and intrinsic quality of Gastrodiae Rhizoma. China J. Chin. Mater. Medica 2019, 44, 4460–4466. [Google Scholar]
- Tsusaka, T.; Sakurai, M. Estimation of the heritability of medicinal compound contents in Glycyrrhiza uralensis. PLoS ONE 2025, 20, e0327885. [Google Scholar] [CrossRef] [Scilit] [PubMed]
- Li, X.; Mu, Y.; Hua, M.; Wang, J.; Zhang, X. Integrated phenotypic, transcriptomics and metabolomics: Growth status and metabolite accumulation pattern of medicinal materials at different harvest periods of Astragalus Membranaceus Mongholicus. BMC Plant Biol. 2024, 24, 358. [Google Scholar] [CrossRef] [Scilit] [PubMed]
- Liu, L.L.; Guo, F.X.; Chen, Y.; Chen, Y.Z.; Wang, H.Y.; Zhang, B.Q.; Guo, A.H. Effect of seedling size on the medicinal properties of Codonopsis pilosula under organic cultivation. Chin. J. Eco-Agric. 2021, 29, 1902–1912. [Google Scholar]
- Yuan, Q.S.; Wang, H.; Jiang, W.K.; Ou, X.H.; Xu, J.; Wang, X.A.; Wang, L.; Ou, Y.Y.; Zhou, T. Dissection of seed development of Gastrodia elata at different temperatures. China J. Chin. Mater. Medica 2020, 45, 485–490. [Google Scholar]
- Wang, L.; Zhang, J.Y.; Yuan, Y.; Liu, T.R. Effects of soil relative water content on growth characteristics of Armillaria spp. and seedling production of Gastrodia elata f. glauca. China J. Chin. Mater. Medica 2024, 49, 3178–3184. [Google Scholar] [CrossRef] [Scilit] [PubMed]
- Ho, L.H.; Lee, Y.I.; Hsieh, S.Y.; Lin, I.S.; Wu, Y.C.; Ko, H.Y.; Klemens, P.A.; Neuhaus, H.E.; Chen, Y.M.; Huang, T.P.; et al. GeSUT4 mediates sucrose import at the symbiotic interface for carbon allocation of heterotrophic Gastrodia elata (Orchidaceae). Plant Cell Environ. 2021, 44, 20–33. [Google Scholar] [CrossRef] [Scilit] [PubMed]
- Chen, J.; Liu, H.G.; Chang, P.; Yuan, Y.; Dai, Y.C. Insight into the Gastrodia elata microbiome and its relationship with secondary metabolites. Ind. Crop. Prod. 2025, 223, 120248. [Google Scholar] [CrossRef] [Scilit]
- Zhou, T. Fungal symbiont Mycena complements impaired nitrogen utilization in Gastrodia elata and supplies indole-3-acetic acid to facilitate its seed germination. Plant Commun. 2025, 6, 101500. [Google Scholar] [CrossRef] [Scilit] [PubMed]
- Yuan, Y.; Jin, X.H.; Liu, J.; Zhao, X.; Zhou, J.H.; Wang, X.; Wang, D.Y.; Lai, C.J.S.; Xu, W.; Huang, J.W.; et al. The Gastrodia elata genome provides insights into plant adaptation to heterotrophy. Nat. Commun. 2018, 9, 1615. [Google Scholar] [CrossRef] [Scilit] [PubMed]
- Wang, C.H.; Zeng, Y.J.; Hou, Y.B.; Zeng, C.H.; Wang, M.; Wang, Y.H. Effects of Armillaria species on growth and quantity of active medicinal components of G. elata Bl. F. elata tubers along an altitude gradient: Evidence from empirical experiments. Phytochem. Lett. 2023, 54, 101–106. [Google Scholar] [CrossRef] [Scilit]
- Liu, J.J.; Yang, X.Q.; Li, Z.Y.; Miao, J.Y.; Li, S.B.; Zhang, W.P.; Lin, Y.C.; Lin, L.B. The role of symbiotic fungi in the life cycle of Gastrodia elata Blume (Orchidaceae): A comprehensive review. Front. Plant Sci. 2024, 14, 1309038. [Google Scholar] [CrossRef] [Scilit] [PubMed]
- Diao, H.; Pan, D.; Wang, J.; Guo, S. Altitude modulates growth and bioactive compounds in two Gastrodia elata forms through the microenvironment and soil microbes. Front. Plant Sci. 2026, 17, 1734174. [Google Scholar] [CrossRef] [Scilit] [PubMed]
- Xu, Y.; Wu, Z.Q.; Gao, Y.G.; Zang, P.; Yang, X.Y.; Zhao, Y.; Liu, Q. GePIF4 Increases the Multi-Flower/Capsule-Bearing Traits and Gastrodin Biosynthesis in Gastrodia elata. Plants 2025, 14, 1684. [Google Scholar] [CrossRef] [Scilit] [PubMed]
- Liu, Q.; Wu, Z.; Gao, Y.; Xu, Y.; Zang, P.; Yang, X.; Zhao, Y.; Liao, P.; Boachon, B.; Kai, G. GeARF5/GeIAA33-GeSWEET14 module balances the secondary metabolic biosynthesis to increase the yield and quality in Gastrodia elata. J. Integr. Plant Biol. 2026, 68, 1155–1175. [Google Scholar] [CrossRef] [Scilit] [PubMed]
- Duan, J.; Tu, Y.; Zhu, H.; Dong, J.; Zhang, L.; Ji, P. Unraveling the metabolic network and key bioactive compound accumulation during critical developmental stages of Gastrodia elata. Front. Plant Sci. 2026, 17, 1804747. [Google Scholar] [CrossRef] [Scilit] [PubMed]
- Brown, K.E.; Kelly, J.K. Severe inbreeding depression is predicted by the “rare allele load” in Mimulus guttatus. Evolution 2020, 74, 587–596. [Google Scholar] [CrossRef] [Scilit] [PubMed]
Disclaimer/Publisher’s Note: The statements, opinions and data contained in all publications are solely those of the individual author(s) and contributor(s) and not of MDPI and/or the editor(s). MDPI and/or the editor(s) disclaim responsibility for any injury to people or property resulting from any ideas, methods, instructions or products referred to in the content. |
© 2026 by the authors. Licensee MDPI, Basel, Switzerland. This article is an open access article distributed under the terms and conditions of the Creative Commons Attribution (CC BY) license.