


Abstract
Salt stress severely limits plant growth, particularly in woody species. In this study, a time-course transcriptomic analysis (0–24 h NaCl treatment) revealed a clear time-dependent transcriptional reprogramming pattern in Betula platyphylla, characterized by rapid early activation followed by gradual stabilization. The response can be divided into three phases: early stress perception and signaling (1–3 h), mid-stage metabolic and hormonal reprogramming (5–9 h), and late-stage homeostasis and physiological adaptation (12–24 h). Early responses are dominated by signal transduction, the middle phase by metabolic reorganization and enhanced translation, and the late phase by redox and cellular homeostasis. Compared to the limited role of the Dehydration-Responsive Element-Binding protein (DREB) pathway, Abscisic acid (ABA) and Jasmonic acid (JA) signaling appear to play more central regulatory roles. Further analyses revealed the coordinated temporal activation of Reactive oxygen species (ROS), Salt Overly Sensitive (SOS), and ABA pathways: ROS shows an early burst followed by antioxidant activation; the SOS pathway regulates ion homeostasis via the Calcineurin B-like protein (CBL)-CBL-interacting protein kinase (CIPK) module; and ABA signaling progresses from biosynthesis to downstream transcriptional regulation. Protein interaction network analysis further identifies ABA signaling as a central hub integrating Ca2+ signaling, ROS metabolism, and ion transport. Overall, B. platyphylla responds to salt stress through a temporally coordinated regulatory network, providing new molecular insights into salt tolerance mechanisms in woody plants.
1. Introduction
Soil salinity is a prevalent environmental challenge that severely limits plant growth and productivity worldwide [1,2]. Excessive salt disrupts cellular ion balance and osmotic regulation. This leads to reduced photosynthetic efficiency, accumulation of reactive oxygen species, and impaired development [3,4]. Therefore, uncovering the molecular mechanisms underlying salt tolerance is critical for ecological restoration, sustainable forestry, and crop improvement.
White birch (Betula platyphylla) is a temperate tree species of considerable ecological and economic value, widely cultivated for timber, pulp, and landscape purposes [5]. This species exhibits moderate resilience to abiotic stresses, including drought and salinity, making it a promising model for exploring stress responses in woody plants [6,7,8,9,10,11,12,13,14]. However, previous studies have provided important insights into salt stress responses in birch, including physiological analyses and transcriptomic investigations. However, the temporal dynamics and coordinated regulation of multiple stress-responsive pathways during the progression of salt stress remain to be further elucidated, particularly through time-resolved transcriptomic approaches.
High salt concentration disrupts cellular ion homeostasis and osmotic balance, leading to photosynthetic inhibition, oxidative damage, and growth retardation. To survive under such stress, plants have evolved sophisticated molecular mechanisms that maintain ion equilibrium, stabilize cellular metabolism, and regulate stress-responsive gene expression [1,4]. Salt tolerance involves several interconnected processes. First, salt stress is perceived by membrane-localized receptors and ion sensors, which activate downstream calcium signaling and Mitogen-activated protein kinase (MAPK) cascades [1,2]. The SOS pathway, consisting of SOS3–SOS2–SOS1, plays a key role in mediating Na+ efflux and maintaining cytosolic ion balance [15]. Second, ion transporters such as NHX, HKT, and AKT1 regulate Na+ and K+ distribution across membranes to sustain ionic homeostasis [16]. Third, plants accumulate compatible solutes such as proline, soluble sugars, and betaine, synthesized by enzymes like P5CS and BADH, to alleviate osmotic stress [17]. Moreover, antioxidant enzymes including SOD, CAT, POD and APX are activated to remove excess reactive oxygen species (ROS) and mitigate oxidative injury [18]. Soil salinization severely limits plant growth, particularly in woody species. Although ROS regulation has been extensively studied in both herbaceous and woody plants, the molecular mechanisms underlying ROS homeostasis and its integration with stress signaling networks in woody species remain to be further elucidated, particularly in long-lived trees with complex environmental adaptation strategies [19]. Myo-inositol metabolism plays an important role in plant stress responses, and its rate-limiting enzyme Myoinositol phosphate synthase (MIPS) can promote ROS scavenging and improve stress tolerance. However, its function in woody plants remains largely unclear [20]. Under salt stress conditions, ABA biosynthesis is rapidly enhanced (e.g., via upregulation of NCED), and its accumulation acts as an early signal to trigger stomatal closure, osmotic adjustment, and the expression of stress-responsive genes. ABA is perceived by PYR/PYL receptors, which inhibit PP2C phosphatases (ABI1/ABI2), thereby activating SnRK2 kinases and downstream ABF transcription factors to regulate the expression of genes involved in ion transport, antioxidant defense, and osmotic regulation [1,2]. ABA is a central phytohormone involved in plant responses to salt stress. Under saline conditions, ABA accumulation contributes to stress adaptation by regulating processes such as stomatal closure, osmotic adjustment, and the expression of stress-responsive genes. In addition, ABA signaling is closely associated with ROS metabolism, as ROS can function as signaling molecules downstream of ABA responses, while ABA-regulated antioxidant systems contribute to maintaining ROS homeostasis during stress adaptation. Therefore, the coordination between ABA signaling and ROS balance represents an important component of plant salt stress responses [1,2].
At the transcriptional level, numerous transcription factor families, such as WRKY, NAC, MYB, bZIP and DREB/CBF regulate the expression of salt-responsive genes [21]. These transcription factors act as molecular switches that integrate signaling networks controlling ion transport, osmotic regulation, and antioxidant defense [22,23]. In B. platyphylla, several transcription factors have been identified as key regulators in stress responses. For example, BpWRKY32 and BpWRKY49 are significantly induced under salt stress and enhance salt tolerance by regulating ROS scavenging and the expression of stress-responsive genes [24]. In addition, NAC, MYB and bZIP transcription factors also play important roles in tolerance to salt and osmotic stress [6,14,25]. In addition, emerging evidence indicates that noncoding RNAs, including microRNAs and long noncoding RNAs, participate in salt stress regulation, adding another layer of post-transcriptional control [26]. The salt-responsive lncRNA BplncSIR1 enhances salt tolerance and promotes growth in B. platyphylla by activating BpNAC2 expression, which in turn regulates stress-responsive genes, reduces ROS accumulation, and induces stomatal closure [8].
High-throughput RNA sequencing (RNA-seq) has emerged as a powerful tool to capture genome-wide expression profiles under stress conditions [27]. Time-course RNA-seq, in particular, enables the detection of early, intermediate, and late response genes, revealing dynamic regulatory networks that single-time-point studies cannot capture, as they often overlook transiently expressed regulators that are critical for early stress responses. This approach facilitates the identification of key regulators and provides a comprehensive view of the temporal coordination of stress responses.
To date, most salt stress transcriptomic studies have focused on model species or crops, including Arabidopsis thaliana [28], rice [29] and wheat [30]. In woody plants, such as poplar and white birch, relevant studies remain scarce. Existing evidence suggests that these species employ mechanisms similar to herbaceous plants—ion homeostasis, osmotic adjustment, and antioxidant defenses [31]—but systematic time-series analyses and identification of core hub genes are still lacking. Addressing this gap is essential for revealing the molecular basis of salt tolerance and for guiding future breeding efforts.
In this study, we performed a high-resolution time-course transcriptomic analysis of B. platyphylla subjected to NaCl treatment to elucidate the temporal architecture of its salt-stress response. By integrating differential gene expression profiling, time-series clustering, and pathway-specific analyses, we aimed to characterize the sequential activation of key regulatory networks, including reactive oxygen species (ROS) signaling, SOS-mediated ion homeostasis, and abscisic acid (ABA) signaling. We further identified phase-specific transcriptional regulators and core hub genes that coordinate early stress perception, mid-term metabolic adjustment, and late-stage physiological stabilization. This work provides valuable genetic resources for future functional studies and breeding of salt-tolerant B. platyphylla varieties.
2. Result
2.1. Global Transcriptional Dynamics of B. platyphylla in Response to Salt Stress
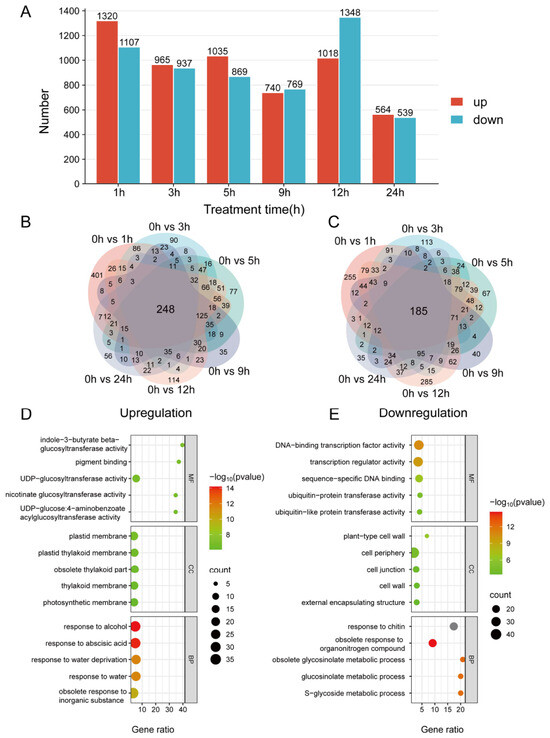
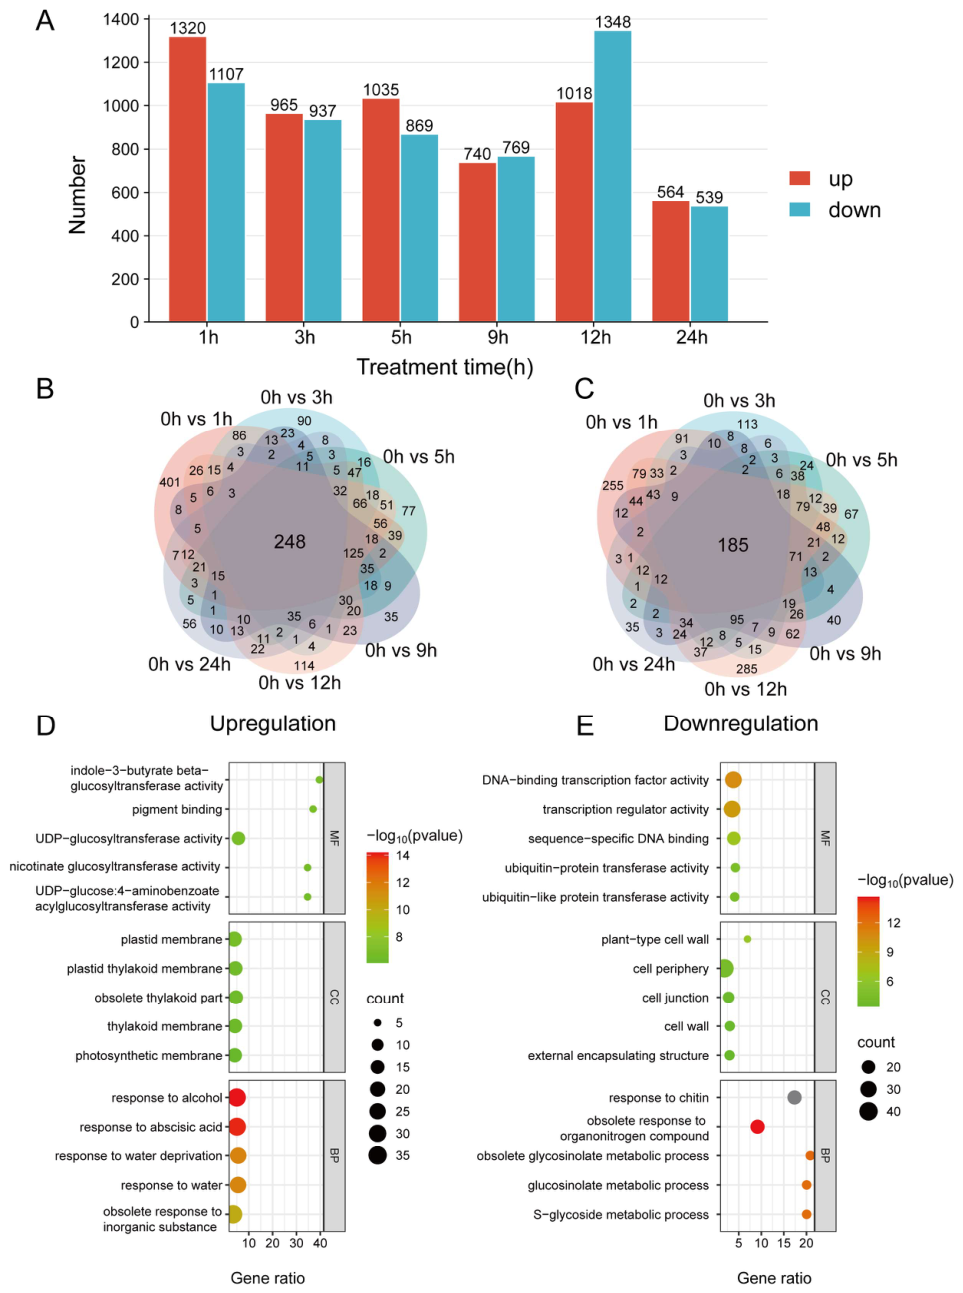
To elucidate the time-dependent transcriptional responses of B. platyphylla to salt stress, differentially expressed genes (DEGs) were identified at six time points (1, 3, 5, 9, 12, and 24 h) following NaCl treatment and compared with the untreated control (Figure 1, Figures S1 and S2). Salt stress triggered dynamic changes in gene expression over time. At 1 h after treatment, the number of up-regulated genes peaked at 1320, accompanied by 1107 down-regulated genes. By 24 h, the total number of DEGs declined markedly (564 up-regulated and 539 down-regulated genes) (Figure 1A). Overlap analysis of differentially expressed genes (DEGs) across time points (Figure 1B,C) revealed a limited overlap among different time points, highlighting strong temporal specificity in the transcriptional response to salt stress. Among up-regulated genes (Figure 1B), only 248 genes were shared across all comparisons, whereas a large proportion were uniquely induced at individual time points, indicating stage-specific regulatory roles. Similarly, only 185 down-regulated genes were common to all time points (Figure 1C).
Figure 1.
Temporal transcriptional reprogramming of B. platyphylla under progressive salt stress. (A) Quantification of upregulated (red) and downregulated (cyan) DEGs across six sampling time points (1–24 h, 0 h as untreated baseline). (B,C) Venn analysis of overlapping upregulated (B) and downregulated (C) DEGs across time points. (D,E) GO enrichment analysis for upregulated (D) and downregulated (E) DEGs. X-axis = enriched DEG number; color gradient = −log10 (p-value). BP: Biological Process; CC: Cellular Component; MF: Molecular Function. Gene ratio represents the number of differentially expressed genes (DEGs) associated with each GO term divided by the total number of DEGs analyzed.
Functional enrichment analysis of DEGs (Figure 1D,E) further revealed clear functional divergence between up- and down-regulated genes. The enriched functions of up-regulated genes could be broadly classified into three major biological themes, including stress signaling, photosynthesis-related processes, and glycosyltransferase activity. Specifically, these genes were significantly enriched in responses to abiotic stresses such as drought and abscisic acid signaling, photosynthetic membrane organization (including thylakoid-associated components), and glycosyltransferase activity (e.g., indole-3-butyric acid β-glucosyltransferase and UDP-glucosyltransferase) (Figure 1D). In contrast, down-regulated genes were mainly associated with transcriptional regulation, protein ubiquitination, and metabolic processes. These included DNA-binding transcription factor activity, ubiquitination-related pathways, and cell wall or cell periphery components (Figure 1E), with DNA-binding transcription factor activity showing the strongest enrichment (−log10 (P) = 12). In addition, genes involved in sugar and lipid metabolism, including glucosinolate metabolic pathways, were generally repressed, suggesting a coordinated downregulation of energy-consuming and secondary metabolic processes under salt stress. Collectively, This dynamic transcriptional reprogramming reflects a shift from acute stress response to longer-term adaptive regulation.
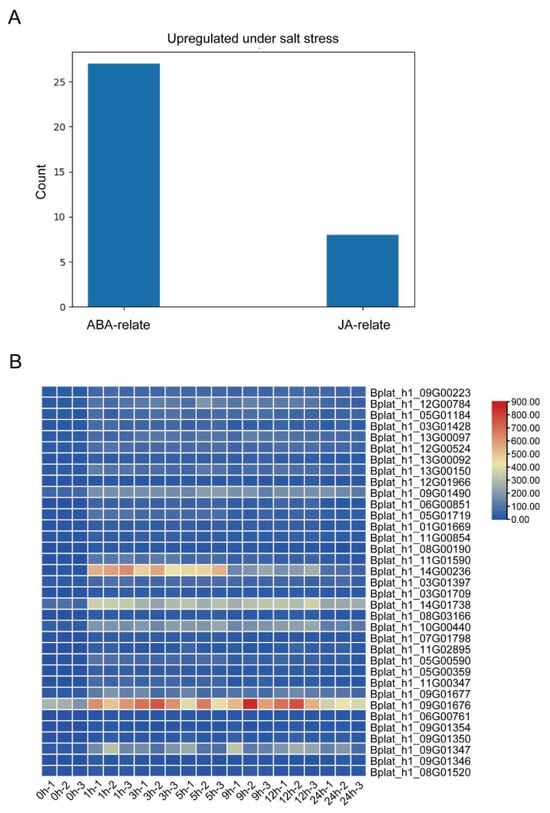
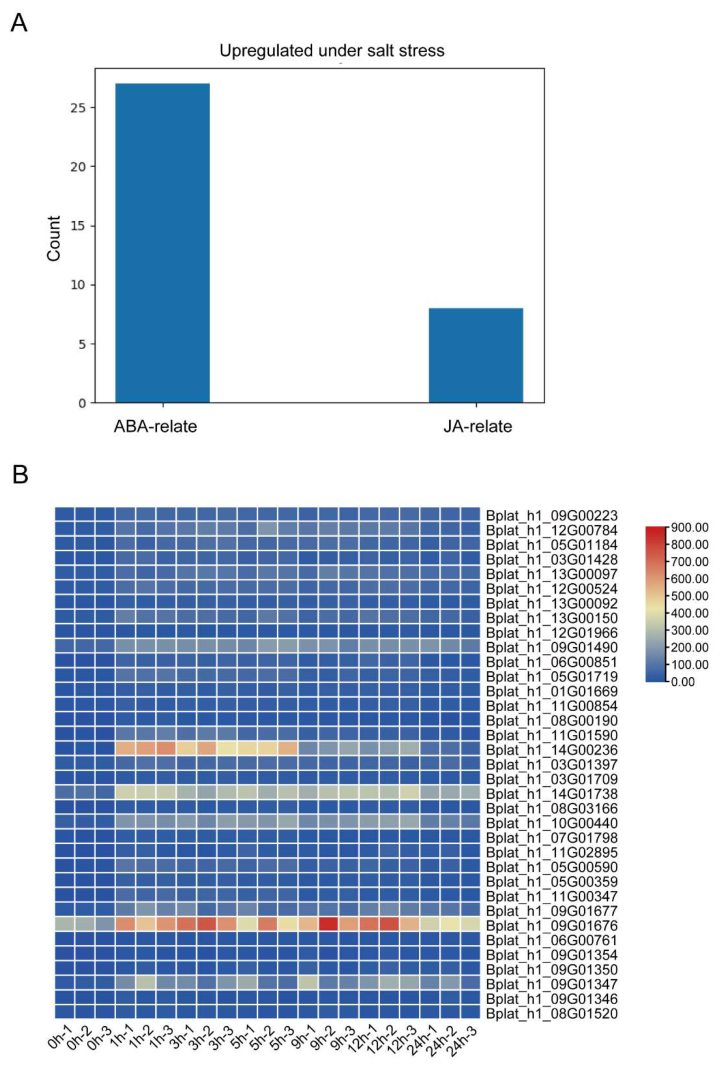
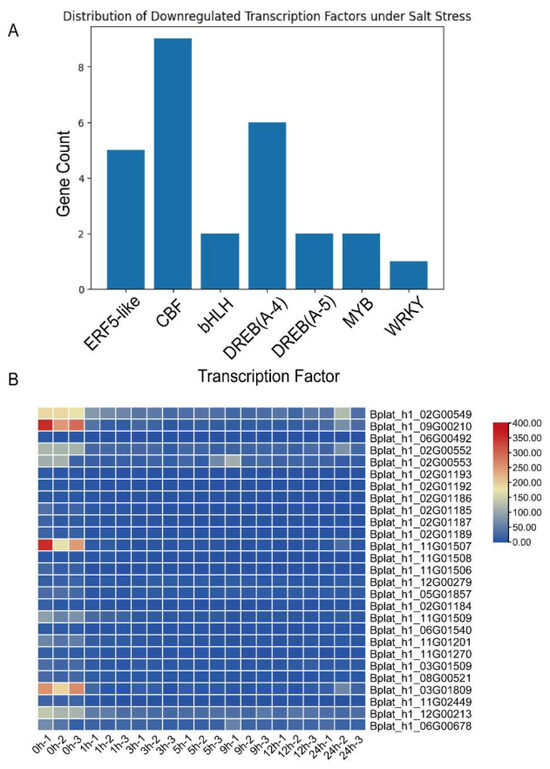
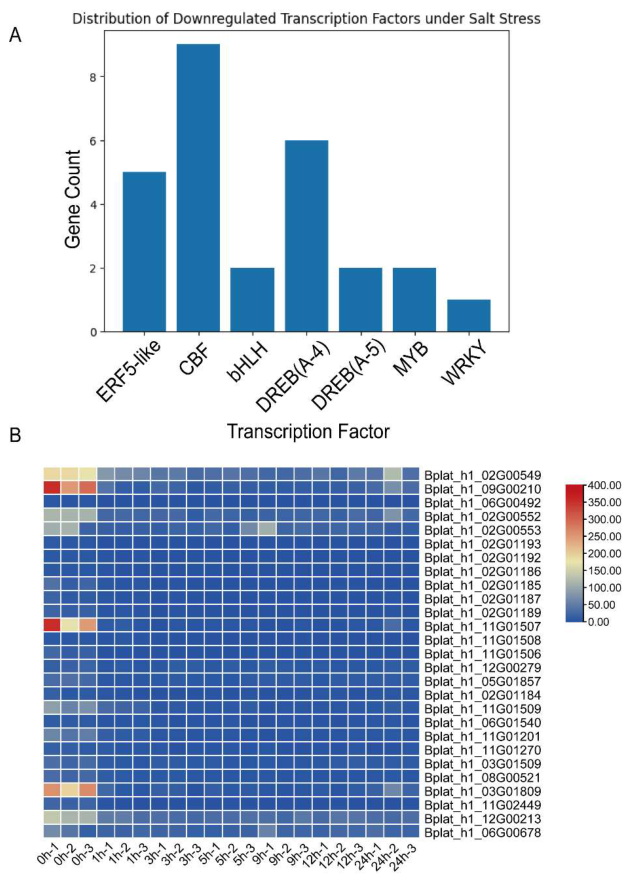
We further analyzed the genes involved in the up- and down-regulated pathways. The results showed that up-regulated genes were mainly enriched in abscisic acid (ABA) and jasmonic acid (JA) response-related pathways, suggesting that hormone signaling plays a dominant role in the early response to salt stress (Figure 2). In contrast, the down-regulated genes were significantly enriched in the GO term “DNA-binding transcription factor activity” and were mainly associated with the AP2/ERF superfamily, including the CBF and DREB subfamilies. Although CBF and DREB are generally considered key regulators in classical stress responses, these transcription factors exhibited a sustained down-regulation in this study and did not show clear stage-specific induction patterns (Figure 3).
Figure 2.
Analysis of upregulated genes enriched in GO biological process (BP) terms under salt stress in B. platyphylla. (A) Functional classification and abundance of upregulated gene categories. (B) Heatmap showing normalized expression levels of genes across control and salt stress treatments. Red and blue colors indicate relatively high and low expression levels, respectively.
Figure 3.
Distribution and expression profiles of downregulated transcription factors under salt stress. (A) Classification and abundance of downregulated TF families. (B) Heatmap showing normalized expression levels of TFs across control and salt stress treatments. Red and blue colors indicate relatively high and low expression levels, respectively.
This observation suggests that the DREB-related pathway may not play a major regulatory role in the salt stress response of B. platyphylla, and its contribution appears to be relatively limited. In comparison, ABA and JA signaling pathways are likely to have a more central role in regulating stress tolerance.
2.2. Stage-Specific Distribution and Functional Enrichment of DEGs Under Salt Stress
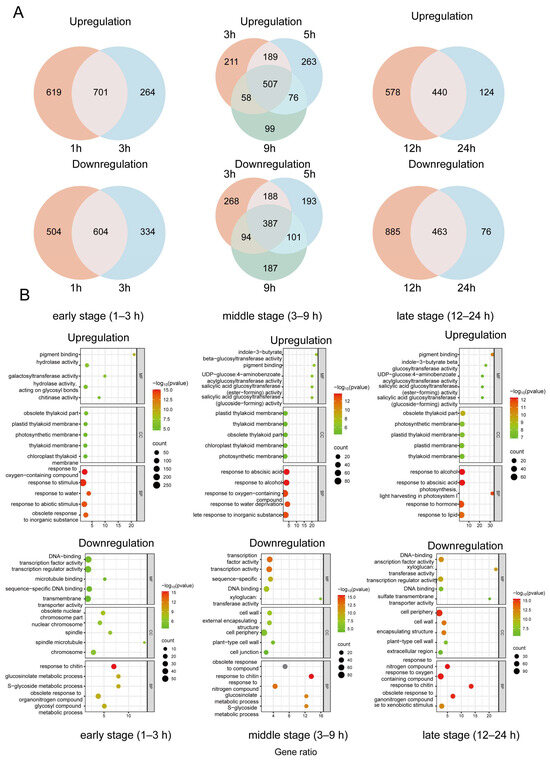
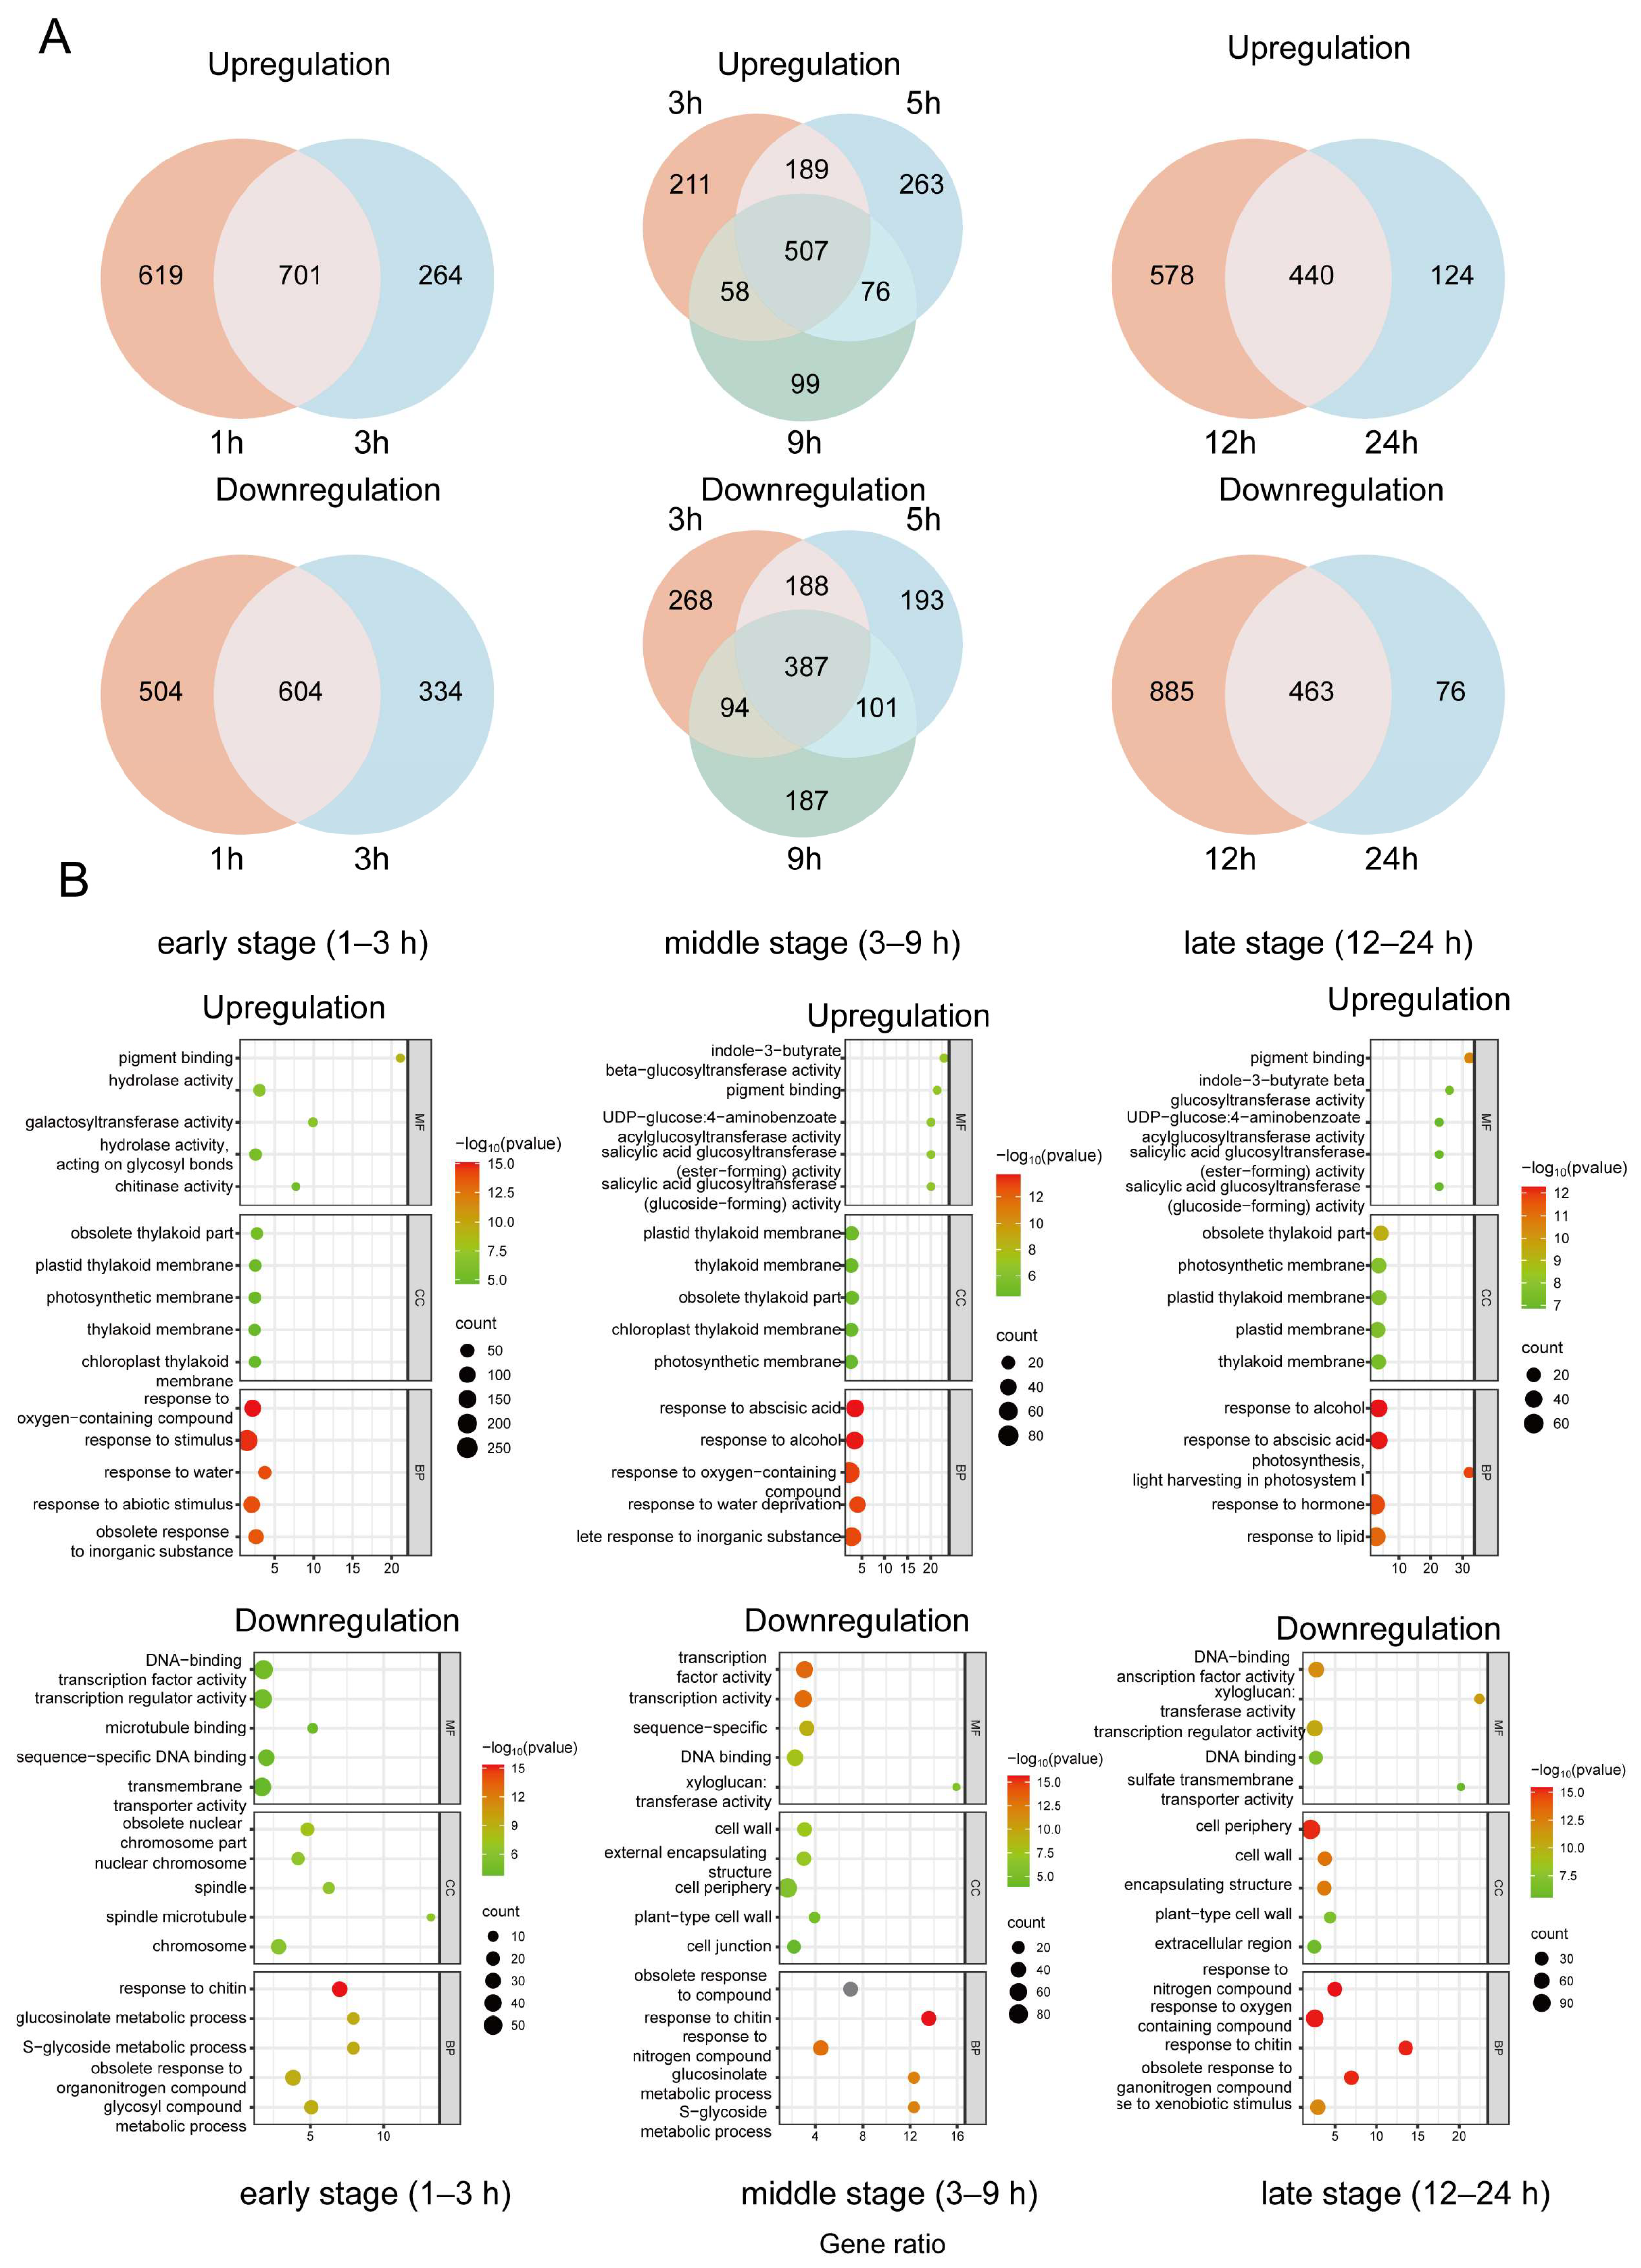
To further characterize the temporal structure of the salt stress response in B. platyphylla, DEGs were grouped into three expression phases—early (1–3 h), middle (3–9 h), and late (12–24 h)—based on their dynamic expression patterns (Figure 4). During the early stage of salt stress (1–3 h), a total of 701 up-regulated and 604 down-regulated genes were identified. In the middle stage (5–9 h), the numbers of up- and down-regulated genes decreased to 507 and 387, respectively. In the late stage (12–24 h), the number of up-regulated genes further declined to 440, while 463 genes were down-regulated, collectively indicating a transition from a strong early response to a more stabilized transcriptional state at later stages (Figure 4A).
Figure 4.
Stage-specific distribution and functional enrichment of differentially expressed genes under salt stress. (A) Venn diagrams showing overlaps of upregulated and downregulated DEGs at early (1–3 h), middle (3–9 h), and late (12–24 h) stages. (B) GO enrichment analysis of DEGs in each stage. Dot size represents gene counts and color indicates significance (−log10 (p-value)). Gene ratio represents the number of differentially expressed genes (DEGs) associated with each GO term divided by the total number of DEGs analyzed.
GO enrichment analysis revealed distinct functional signatures associated with each phase. In the early stage (1–3 h), up-regulated DEGs were primarily enriched in oxidative stress responses, pigment binding, hydrolase activity, and abscisic acid- and water deprivation-related processes. In contrast, down-regulated genes were mainly associated with transcription factor activity, sequence-specific DNA binding, transmembrane transport, and glucoside metabolic processes, suggesting a transient suppression of growth- and transport-related functions (Figure 4B). During the middle stage (3–9 h), up-regulated DEGs were significantly enriched in abscisic acid and auxin responses, photosynthetic membrane organization, and UDP-glucosyltransferase activity, indicating extensive metabolic reprogramming and hormone-mediated regulation. Meanwhile, down-regulated DEGs were associated with cell wall organization, external encapsulating structures, and transmembrane transporter activity, reflecting resource reallocation during sustained stress exposure (Figure 4B). In the late stage (12–24 h), up-regulated DEGs were predominantly enriched in photosynthesis-related processes, including pigment binding and light-harvesting functions, This suggests that photosynthetic activity is partially maintained or restored to support energy demands during sustained stress conditions. Conversely, down-regulated DEGs were enriched in sulfur compound metabolism, cell wall biogenesis, and glycoside biosynthesis pathways, indicating a shift toward metabolic stabilization and long-term adjustment (Figure 4B).
Together, these results demonstrate that B. platyphylla displays a temporally structured transcriptional response to salt stress, characterized by rapid stress perception and signaling during the early phase, extensive metabolic and hormonal regulation during the middle phase, and transcriptional stabilization associated with physiological adaptation at later stages.
2.3. Time-Course Clustering Patterns and Functional Enrichment of DEGs
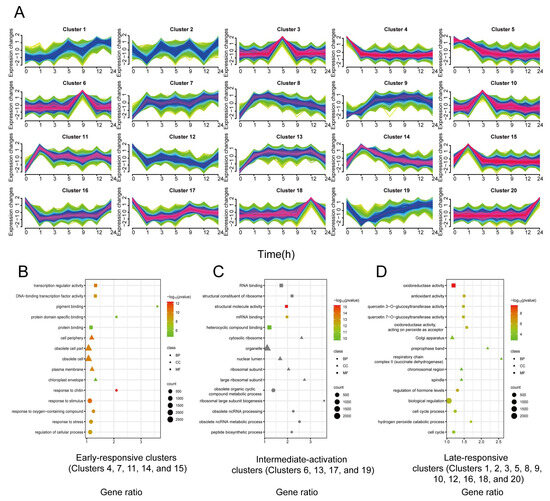
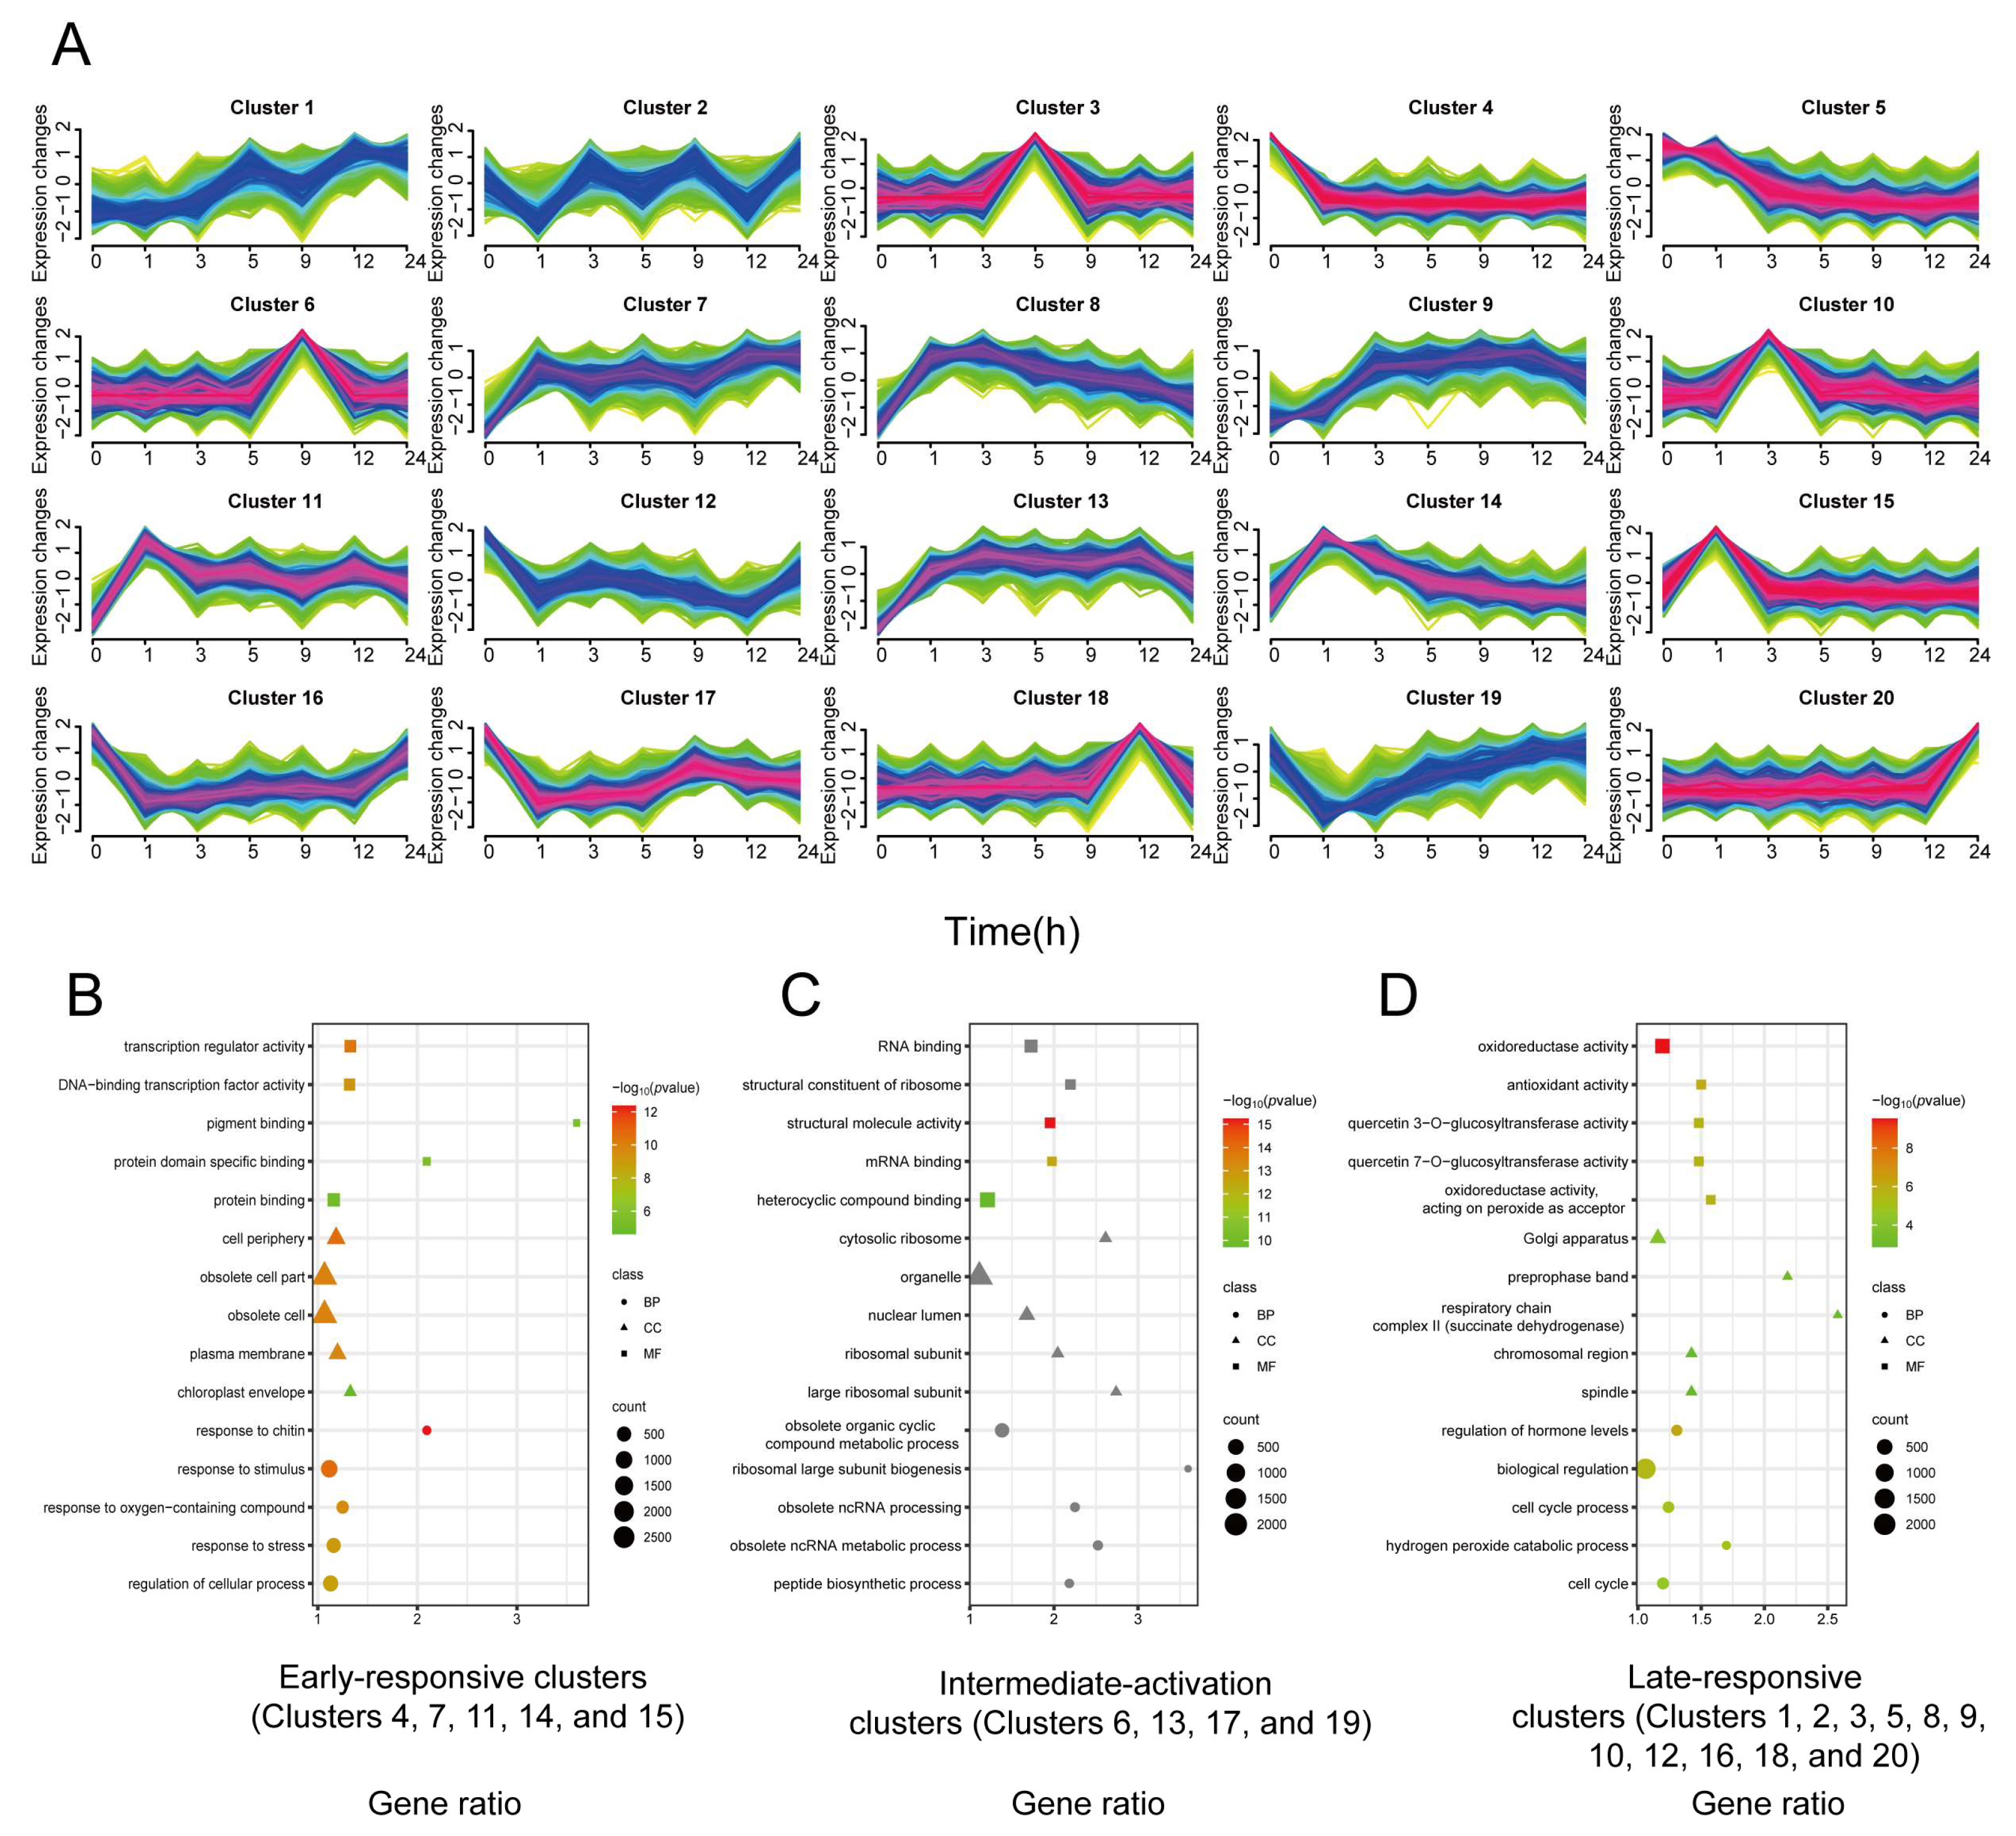
To further investigate the temporal dynamics of gene expression under NaCl stress, all DEGs were subjected to time-series clustering analysis (Table 1). Time-series clustering analysis was performed to identify coordinated expression patterns during salt stress (Figure 5A, Table 1). Based on their expression trajectories across time points, DEGs were grouped into 20 distinct clusters using a model-based clustering algorithm.
Table 1.
Functional summary of 20 Mfuzz clusters under NaCl treatment.
Figure 5.
Time-series clustering and functional enrichment analysis of gene expression under NaCl treatment. (A) Time-course expression clustering of DEGs identified at 0, 1, 3, 5, 9, 12, and 24 h after NaCl treatment. A total of 20 distinct expression clusters (Cluster 1–20) were obtained. Each subplot represents one cluster, with colored lines indicating the temporal expression trends of individual genes or subgroups within the cluster. (B–D) GO enrichment analysis of representative clusters corresponding to early, middle, and late response phases. Dot color indicates enrichment significance (−log10(padj)), and dot size represents the number of genes associated with each GO term. (B) Early-response clusters: Clusters 4, 7, 11, 14, and 15. (C) Middle-response clusters: Clusters 6, 13, 17, and 19. (D) Late-response clusters: Clusters 1, 2, 3, 5, 8, 9, 10, 12, 16, 18, and 20. BP, CC, and MF correspond to the GO categories Biological Process, Cellular Component, and Molecular Function, respectively. Gene ratio represents the number of differentially expressed genes (DEGs) associated with each GO term divided by the total number of DEGs analyzed.
Clusters define early, middle and late transcriptional response phases (Figure 5B–D), to facilitate biological interpretation, the 20 clusters were further classified into three major response categories—early-response, mid-activation, and late-response clusters—according to their dominant expression trends. Genes in early-response clusters were primarily enriched in transcriptional regulatory functions, including DNA-binding transcription factor activity and protein binding, as well as responses to abiotic stress-related stimuli such as chlorine- and oxygen-containing compounds. Mid-activation clusters were significantly enriched in ribosomal structural constituents, RNA-binding activity, and metabolic processes related to ribosome biogenesis and mRNA processing. Ribosome-associated categories contained the largest number of enriched genes, suggesting that the middle phase of the salt stress response is characterized by enhanced translational capacity and active metabolic reprogramming. In contrast, genes in late-response clusters were mainly enriched in glycosyltransferase activity (e.g., β-1,3-glucan transferase), regulation of cellular processes such as homologous recombination and cell cycle control, and oxidative stress-related functions, including hydrogen peroxide catabolic processes. In the late stage of salt stress, plant responses involve complex metabolic regulation and the maintenance of cellular homeostasis under prolonged stress conditions.
Overall, time-series clustering analysis supports a sequential transcriptional response of B. platyphylla to NaCl stress, consisting of rapid stress perception and transcriptional activation during the early phase, enhanced metabolic and translational activity during the middle phase, and cellular adjustment coupled with oxidative stress mitigation during the late phase.
2.4. Dynamic Transcriptional Changes in ROS-Related Genes Under Salt Stress
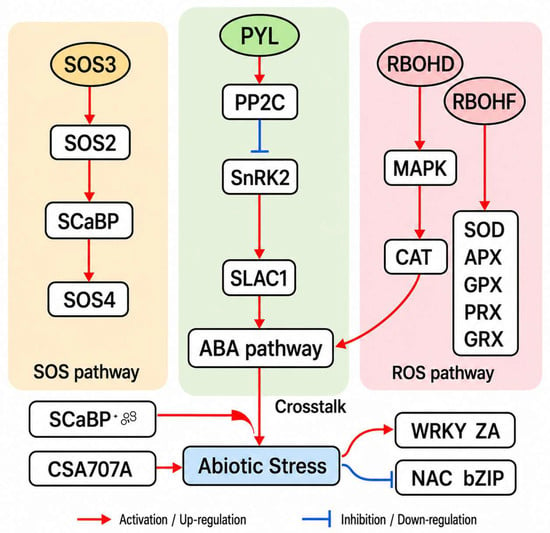
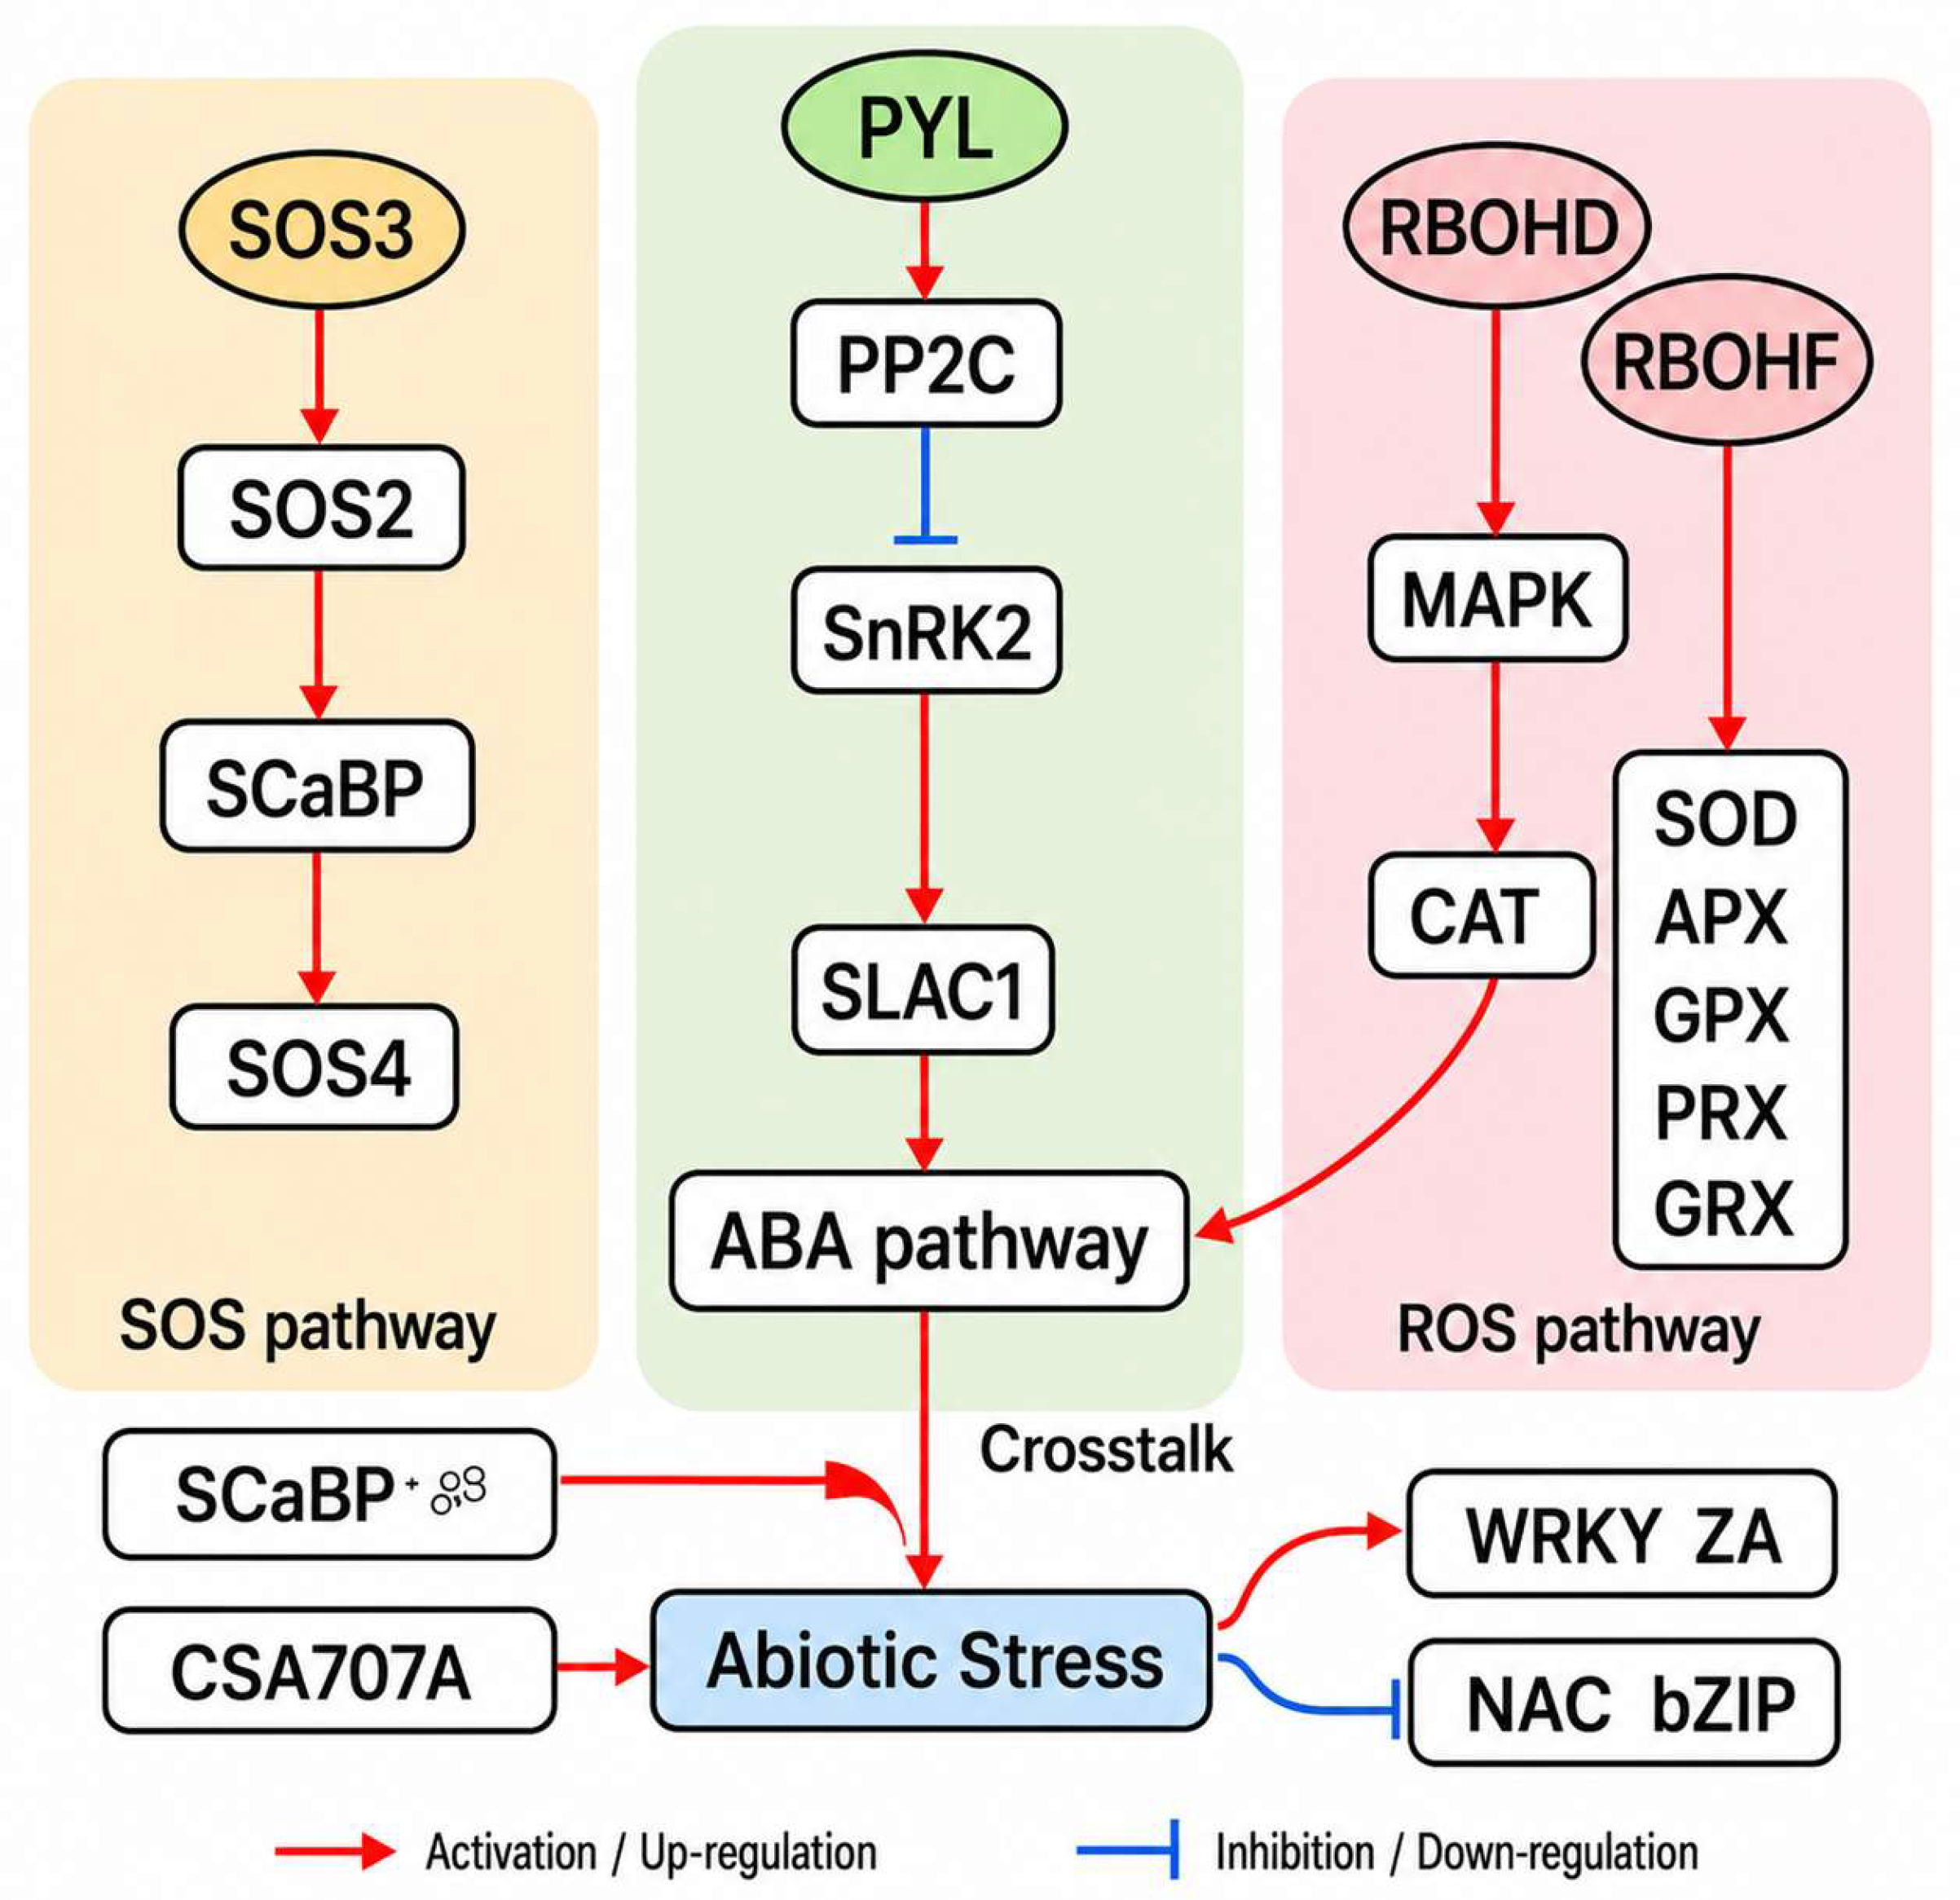
Salt stress is known to activate the SOS, ABA, and ROS signaling pathways in herbaceous plants, involving Ca2+ sensing, osmotic adjustment, and reactive oxygen species detoxification, with extensive crosstalk converging on key transcription factor families such as WRKY, NAC and bZIP (Figure 6). During the early stages of plant responses to salt stress, reactive oxygen species (ROS) typically accumulate rapidly and act as important signaling molecules in regulating stress responses. Previous studies have shown that salt stress can induce a rapid ROS burst, thereby activating a series of defense-related genes and signaling pathways [32]. We further analyzed the expression patterns of genes involved in ROS production and scavenging at different time points.
Figure 6.
Integrated model of SOS, ABA, and ROS signaling pathways in B. platyphylla under salt stress. The diagram illustrates the key signaling components and their interactions in response to salt stress. Salt-induced Ca2+ signals activate the SOS module (left), where SCaBP/SOS3 and SOS2 regulate downstream Na+ transport processes to maintain ion homeostasis. In parallel, ABA signaling (middle) is triggered via PYL receptors, leading to PP2C inhibition and SnRK2 activation, which modulates ion channels and osmotic adjustment. Concurrently, ROS production mediated by RBOHD/F (right) activates MAPK cascade signaling and antioxidant defenses. Arrows indicate activation or signal transduction, while the convergence of the three pathways on stress-responsive transcription factors (e.g., WRKY, NAC, bZIP, ZAT) highlights their coordinated regulation during salt stress adaptation. Red arrows indicate up-regulation or activation, whereas blue T-shaped lines indicate down-regulation or inhibition.
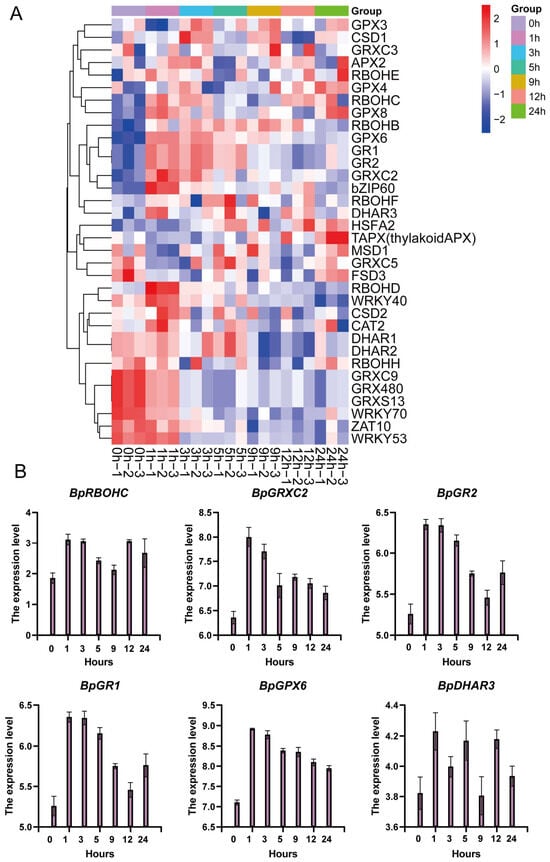
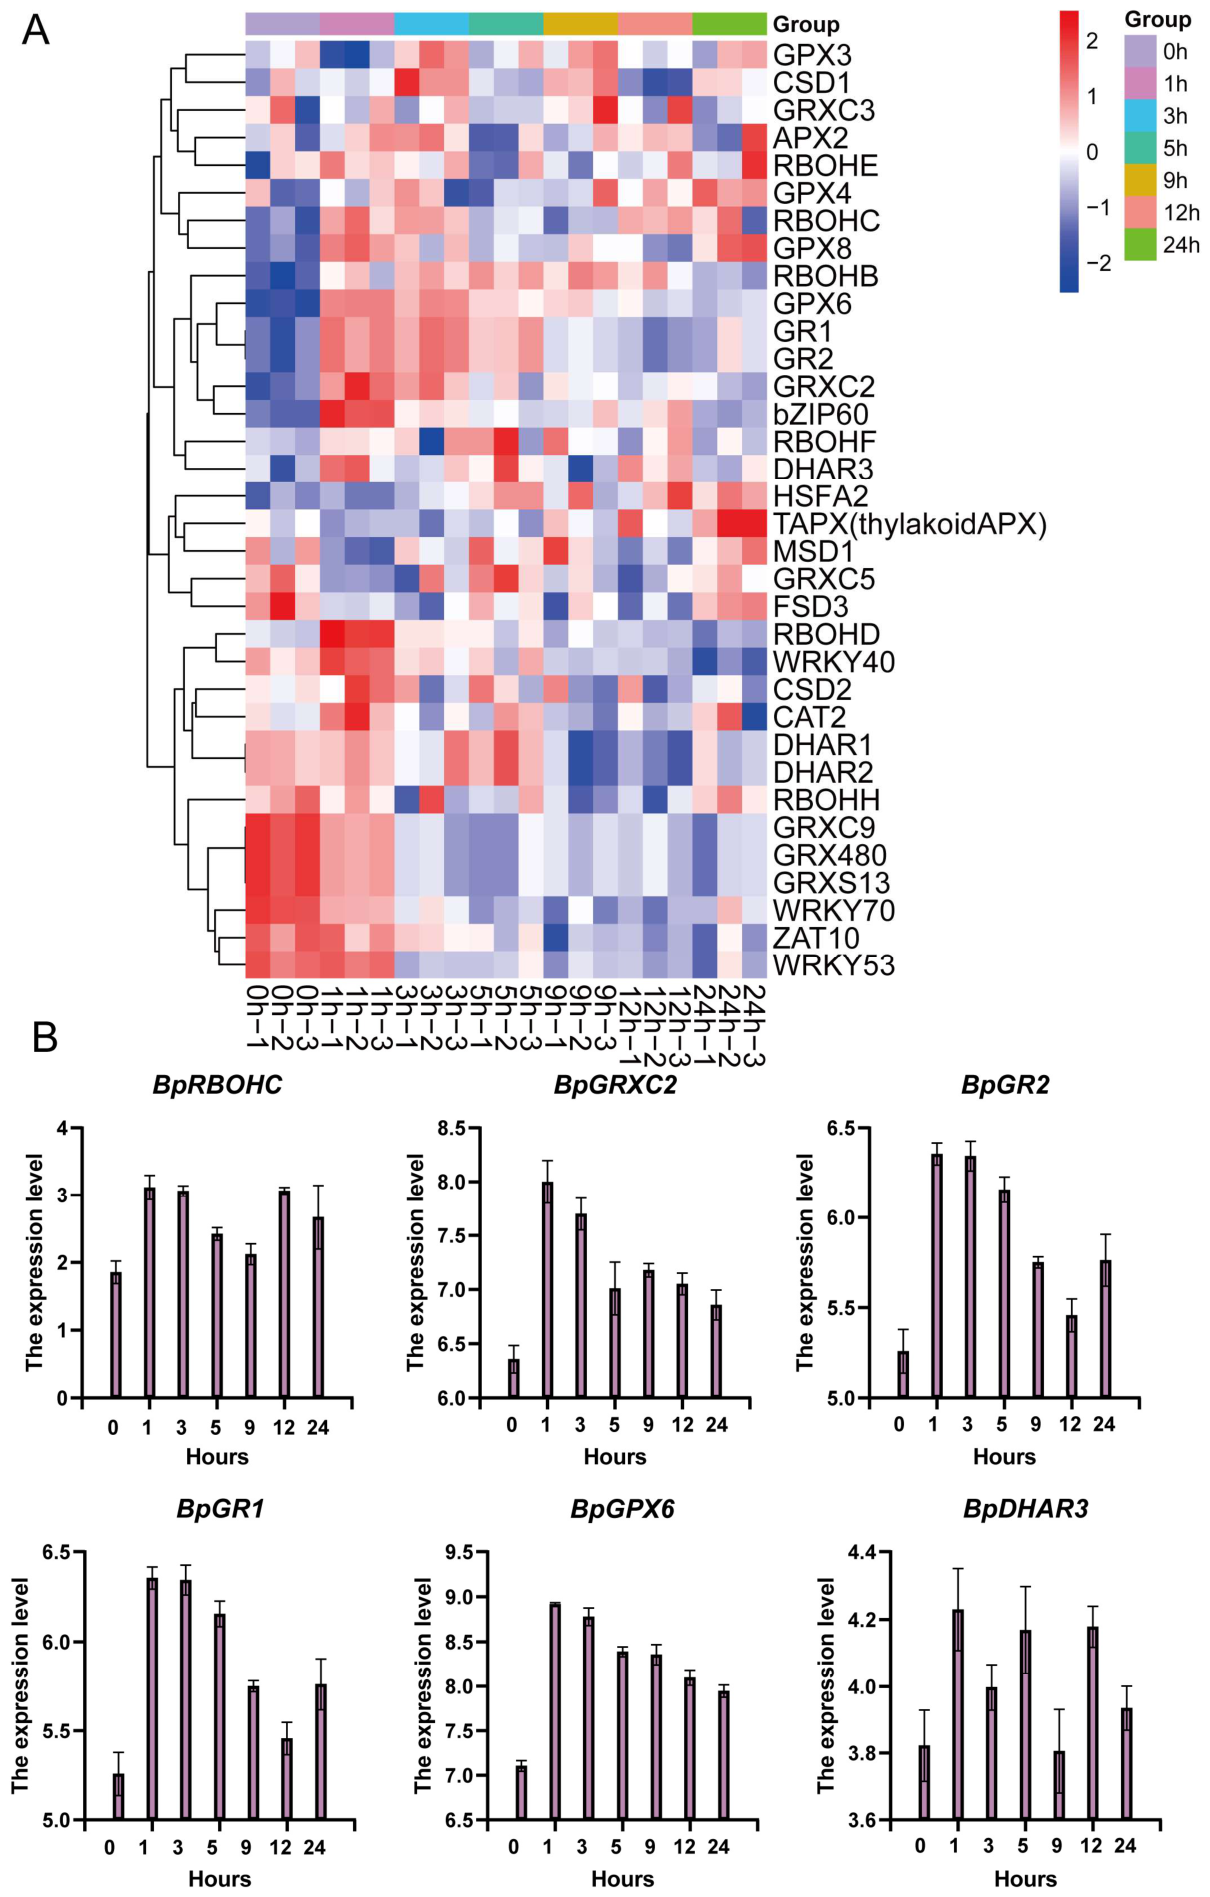
To investigate how B. platyphylla regulates redox homeostasis under salt stress, the expression patterns of 34 ROS-related genes were examined across seven time points. The heatmap analysis revealed pronounced time-dependent transcriptional reprogramming involving ROS production, antioxidant detoxification, redox regulation, and stress-responsive transcription factors (Figure 7A). During the early phase of salt stress (1–3 h), several respiratory burst oxidase homolog (RBOH) genes involved in ROS generation, including RBOHC, RBOHB, and RBOHD, were transcriptionally up-regulated, indicating a rapid oxidative burst following salt perception. RBOHF and RBOHE also showed moderate induction at early time points. Concurrently, a subset of antioxidant genes, such as CSD1 and APX2, exhibited early upregulation. During the intermediate phase (5–12 h), a broad range of antioxidant-related genes showed strong transcriptional induction. Multiple glutathione peroxidases (GPX4, GPX6, and GPX8) and key components of the ascorbate–glutathione cycle, including GR1 and GR2 were strongly induced. In addition, major antioxidant enzymes such as CAT2 and CSD2 also displayed elevated expression levels. This coordinated induction suggests that B. platyphylla actively reinforces its enzymatic antioxidant system following the initial oxidative burst to maintain cellular redox balance.
Figure 7.
Temporal expression patterns of ROS production, antioxidant, and redox-regulating genes in B. platyphylla under NaCl stress. (A) Heatmap illustrates the normalized expression profiles (z-scores of TPM values) of genes involved in reactive oxygen species (ROS) production, scavenging, and redox regulation across seven salt-treatment time points (0, 1, 3, 5, 9, 12, and 24 h). (B) The expression patterns of six representative genes (BpRBOHC, BpGRXC2, BpGR2, BpGR1, and BpDHAR3). Data are presented as mean ± standard error (SE, n = 3 biological replicates).
Transcription factors involved in ROS signaling show early-to-mid activation. Several transcription factors associated with ROS signaling and stress responses displayed marked temporal regulation. bZIP60 was mainly induced during the intermediate phase, consistent with its role in endoplasmic reticulum stress and ROS signaling. Members of the WRKY family, including WRKY40, showed early induction. These expression patterns indicate that transcriptional regulation plays a central role in coordinating early ROS signaling and subsequent antioxidant responses. Key genes, including BpRBOHC, BpGRXC2, BpGR1, BpGR2, and BpDHAR3, all reached peak expression levels at 1–3 h under salt stress (Figure 7B), suggesting that the antioxidant defense system in B. platyphylla is rapidly activated at the early stage of stress to mitigate oxidative damage.
2.5. Dynamic Expression of SOS Signaling Pathway Genes Under Salt Stress
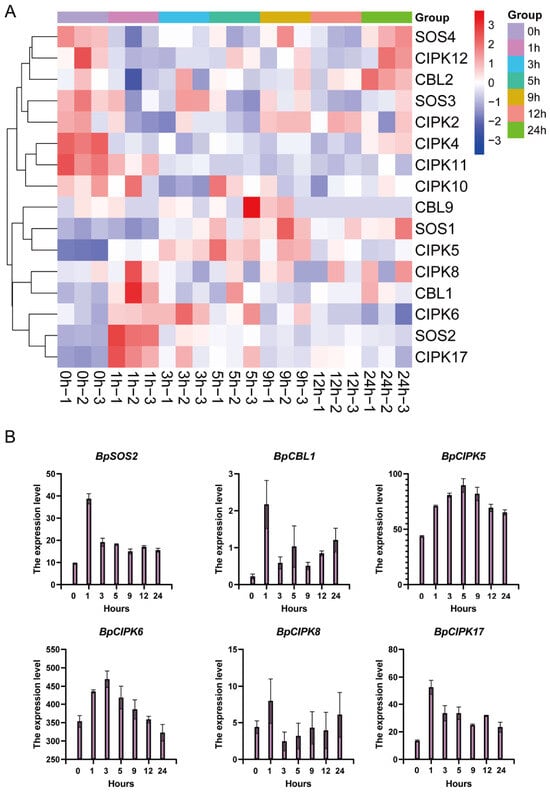
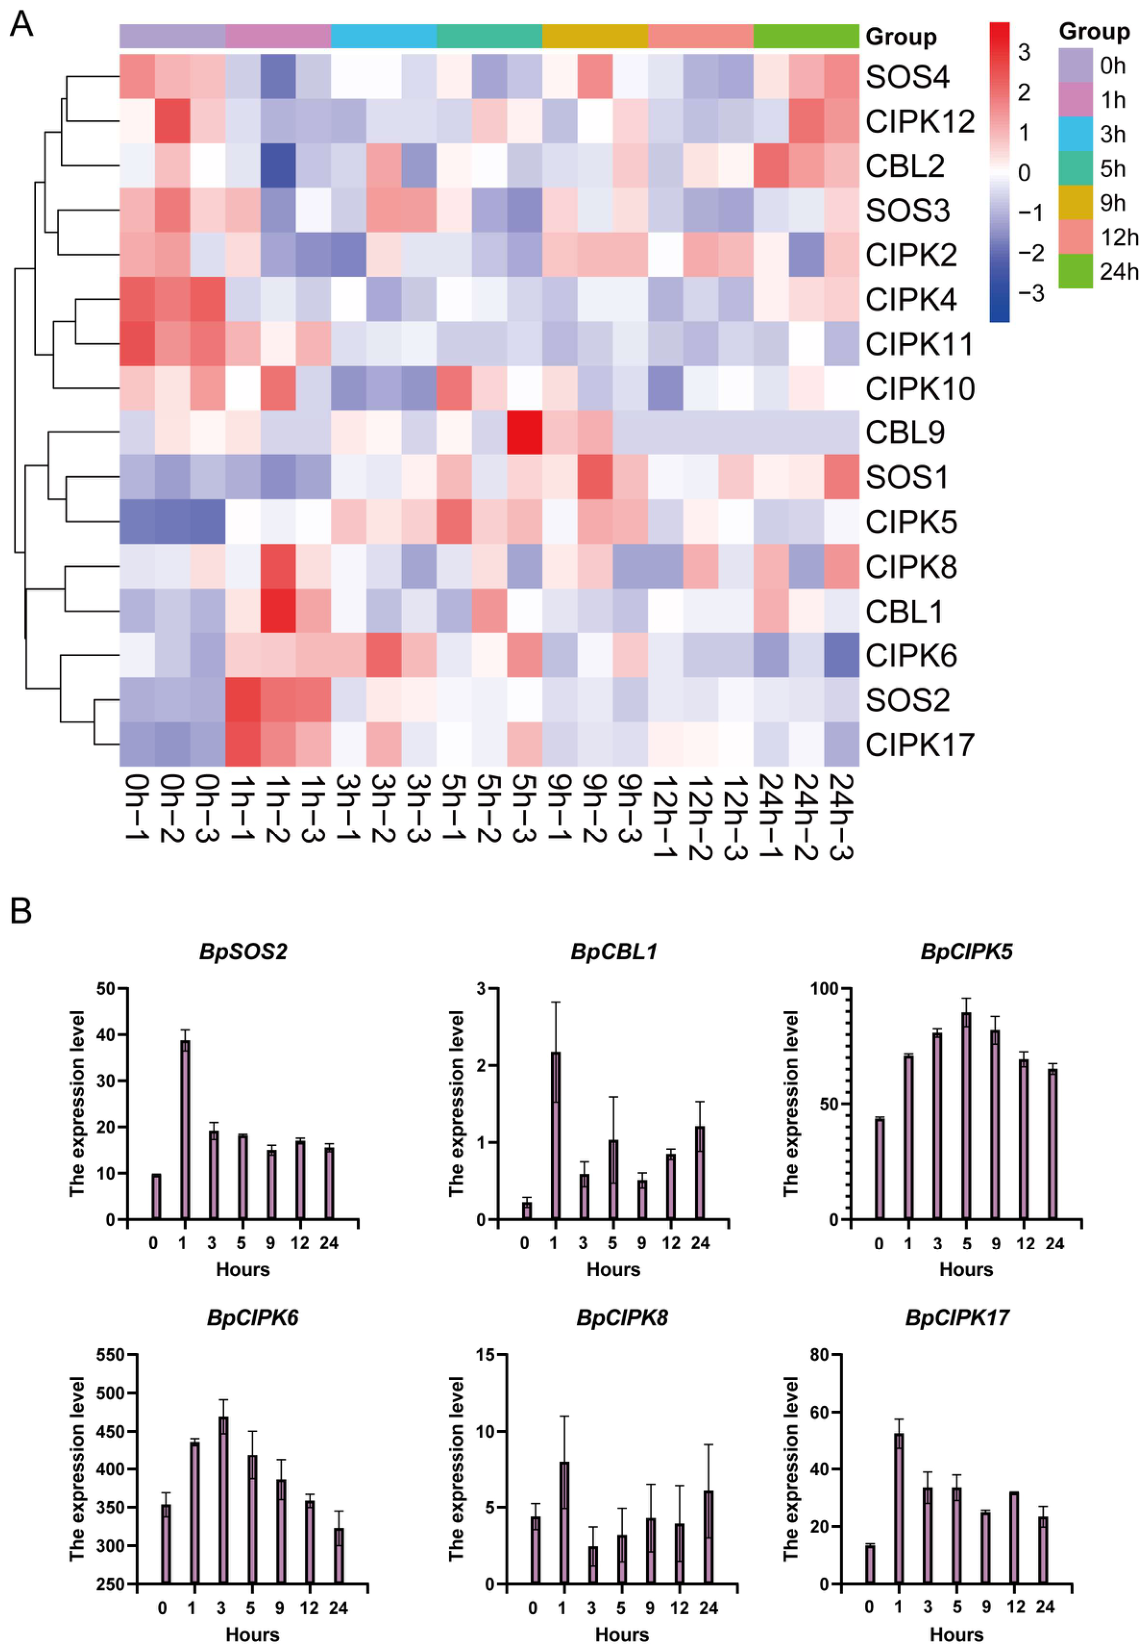
To investigate the transcriptional regulation of the SOS signaling pathway under salt stress, the expression profiles of Ca2+ sensors (CBL family), CBL-interacting protein kinases (CIPKs), and core SOS components (SOS1–SOS4) were analyzed across seven time points (0–24 h). All raw RNA-seq read counts were normalized to TPM values to eliminate the bias of gene length and sequencing depth; hierarchical clustering based on Euclidean distance was performed on standardized TPM data to classify genes with similar expression patterns. The results revealed a clear time-dependent activation of SOS pathway-related genes, reflecting sequential regulation of signal perception, transduction, and ion homeostasis (Figure 8A).
Figure 8.
Temporal expression patterns of SOS pathway genes under NaCl treatment in B. platyphylla. (A) heatmap shows the normalized expression profiles (z-scores of TPM values) of key components in the SOS signaling pathway. (B) The expression patterns of six representative genes (BpSOS2, BpCBL1, BpCIPK5, BpCIPK6, and BpCIPK8). Data are presented as mean ± standard error (SE, n = 3 biological replicates).
During the early stage of salt stress, several Ca2+ sensor genes, including CBL1, showed strong transcriptional induction. Consistently, multiple CIPK genes (CIPK5, CIPK6, CIPK8, and CIPK17) were also markedly up-regulated during this period, representing the most pronounced early transcriptional response within the SOS pathway. The core regulatory components SOS1 and SOS2, which form the central signaling module of the SOS pathway, exhibited moderate but consistent transcriptional upregulation. Although their induction levels were lower than those of upstream CBLs and CIPKs, the sustained expression of SOS1 and SOS2 suggests continuous reinforcement of SOS signaling during the intermediate phase of salt stress.
Six key genes, including BpSOS2, BpCBL1, BpCIPK5, BpCIPK6, BpCIPK8, and BpCIPK17, all responded to salt stress. Among them, BpSOS2 was significantly upregulated as early as 1 h after treatment and reached its peak expression level. BpCIPK5, BpCIPK6, and BpCIPK17 exhibited peak expression at 1–3 h, followed by a gradual decline with prolonged treatment. In contrast, BpCBL1 and BpCIPK8 showed an induced upregulation trend at the early stage of treatment (Figure 8B). These results indicate that genes associated with the CBL–CIPK–SOS signaling pathway are rapidly activated in the early phase of salt stress, likely participating in the rapid response of birch to salt stress through the regulation of calcium signaling.
2.6. Temporal Expression Dynamics of ABA Signaling Pathway Genes Under Salt Stress
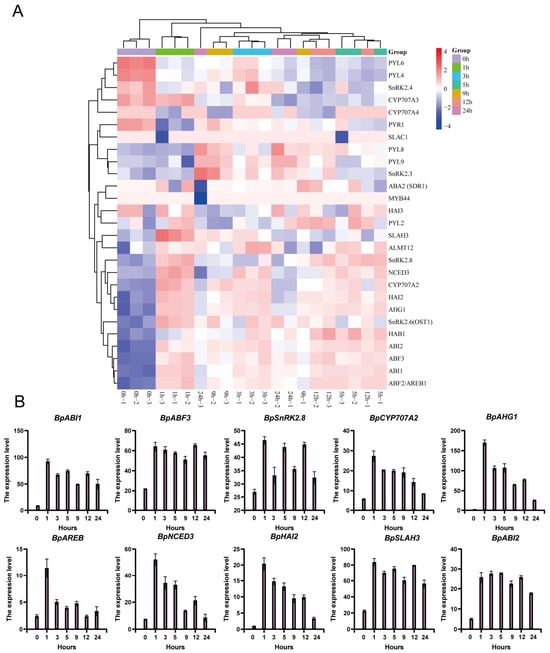
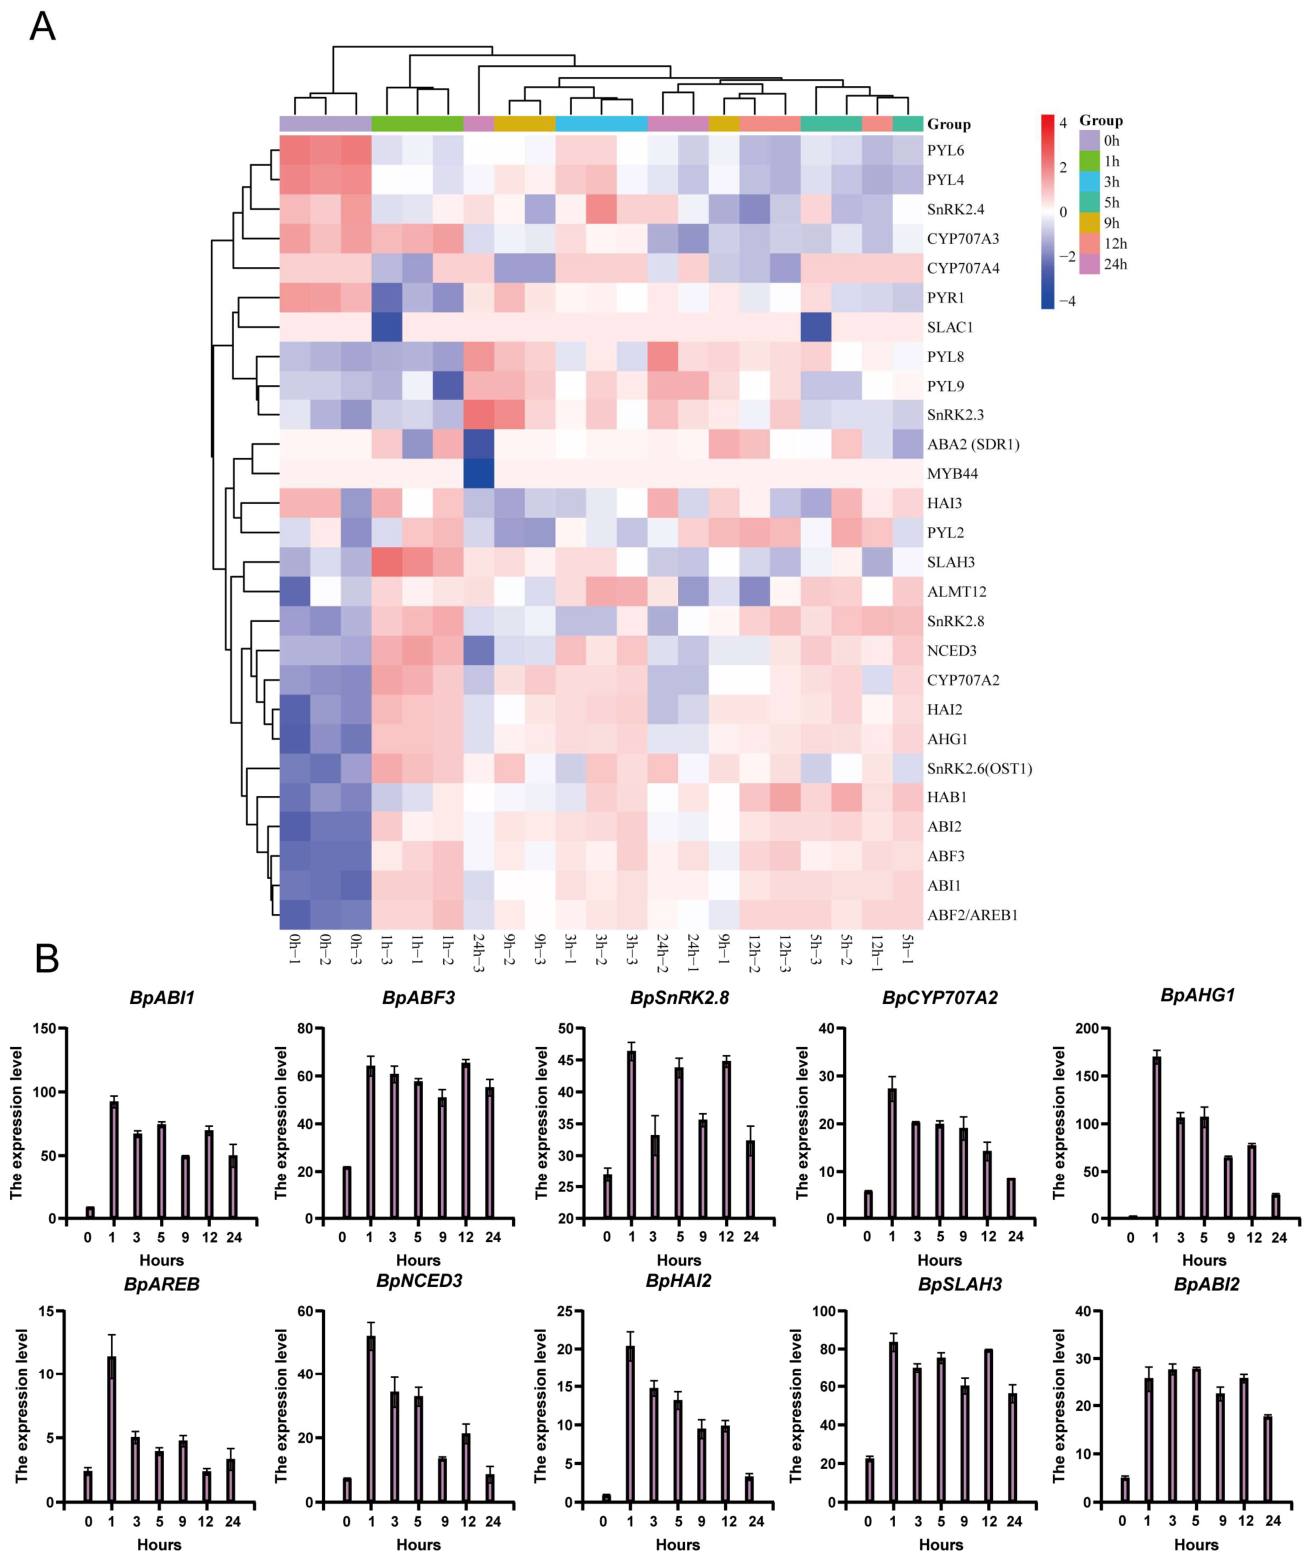
To examine the role of abscisic acid (ABA) signaling in B. platyphylla under salt stress, in this study, 30 ABA pathway-related genes of B. platyphylla were identified via homologous sequence alignment. These genes fall into six major functional categories: ABA biosynthesis and catabolism, PYR/PYL ABA receptors, SnRK2 protein kinases, PP2C phosphatases, ABA-responsive transcription factors, and ion channel regulatory proteins. We further performed quantitative analysis of their temporal expression patterns across multiple time gradients (Figure 9A).
Figure 9.
Temporal expression patterns of ABA biosynthesis, signaling, and response genes in B. platyphylla under NaCl stress. (A) heatmap displays the normalized expression profiles (z-scores of TPM values) of key ABA pathway genes across seven time points following NaCl treatment (0, 1, 3, 5, 9, 12, and 24 h). (B) The expression patterns of ten representative genes. Data are presented as mean ± standard error (SE, n = 3 biological replicates).
During the early phase of salt exposure, the key ABA biosynthetic gene NCED3 exhibited strong transcriptional induction. During the middle phase, a broad set of ABA signaling components showed pronounced transcriptional activation. Multiple ABA receptors (PYL2, PYL8, and PYL9) exhibited sustained induction, accompanied by strong upregulation of SnRK2 kinases, including SnRK2.3, SnRK2.6/OST1, and SnRK2.8. These coordinated expression patterns indicate that ABA signal transduction reaches maximal intensity between 5 h and 12 h after salt treatment. At the same time, several PP2C phosphatases (ABI1, ABI2, HAB1, HAI2, and AHG1) displayed moderate and dynamic expression changes, reflecting the fine-tuned balance between positive and negative regulation within the ABA signaling pathway. The activation of this signaling cascade can further regulate ABA-responsive transcription factors (e.g., ABFs), thereby modulating the expression of downstream stress-responsive genes. At later stages of salt stress, downstream ABA-responsive transcription factors, including ABF2/AREB1 and ABF3, were strongly induced. In addition, key ion channel genes involved in stomatal regulation and osmotic adjustment, such as SLAH3 and ALMT12, also exhibited increased expression levels, indicating activation of ABA-mediated control of ion transport and water balance during the late phase.
Ten key genes, including BpABI1, BpABF3, BpSnRK2.8, BpCYP707A2, BpAHG1, BpAREB, BpNCED3, BpHAI2, BpSLAH3, and BpABI2, all responded to salt stress (Figure 9B). Among them, BpNCED3 was significantly upregulated at 1 h after treatment and reached its peak expression level. Signal transduction components and downstream transcription factors, such as BpSnRK2.8, BpABF3, and BpABI1, also exhibited peak expression at 1–3 h. In contrast, the ABA catabolic gene BpCYP707A2 showed a continuous downregulation following treatment. These results indicate that the ABA signaling pathway is rapidly activated at the early stage of salt stress, likely contributing to the rapid response of B. platyphylla by regulating the expression of stress-responsive genes.
2.7. Protein–Protein Interaction (PPI) Network Analysis Based on ABA, ROS, and SOS Pathways
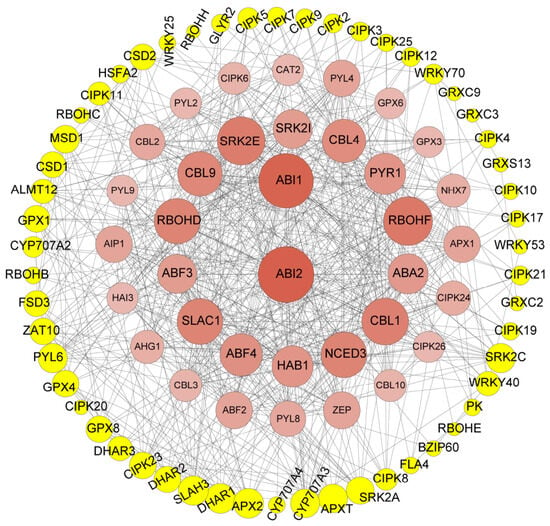
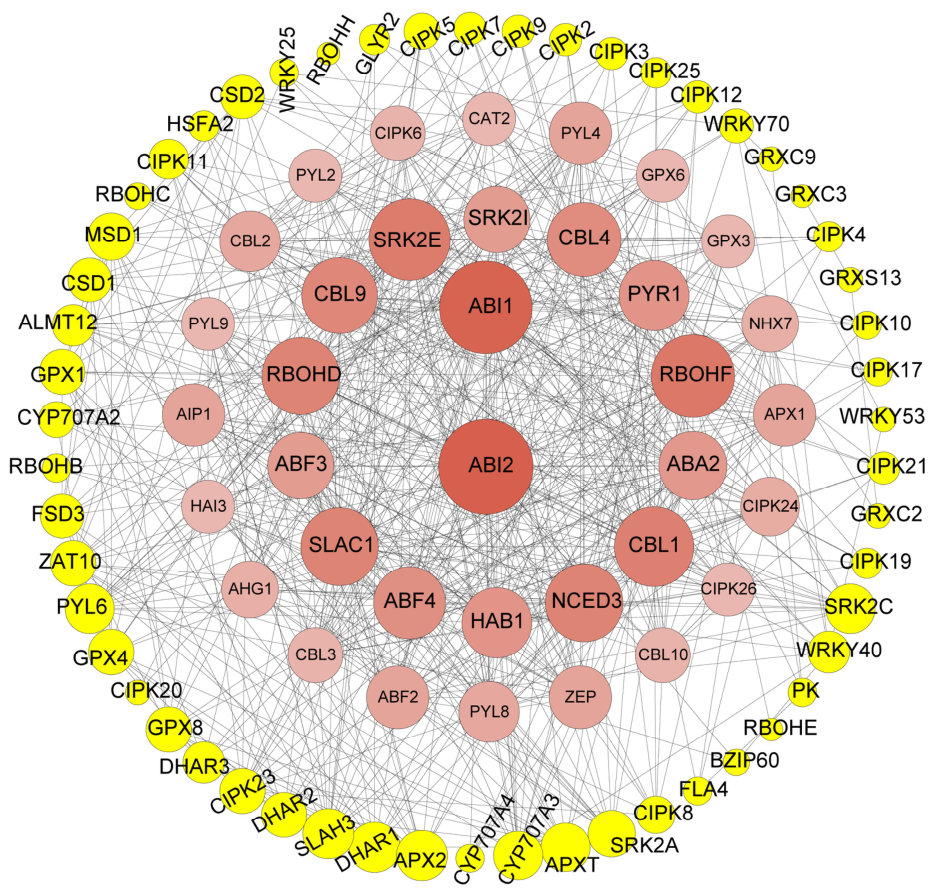
To investigate the coordinated regulatory roles of the selected genes in plant stress responses, a protein–protein interaction (PPI) network was constructed, identifying core interacting nodes that formed a tightly connected regulatory network (Figure 10). The ABA signaling pathway forms the primary cascade backbone of the entire interaction network, covering all components across the complete signal transmission cascade. Biosynthetic genes (ZEP, NCED3, ABA2) for ABA production, ABA receptor genes (PYR1, PYL4, PYL8, PYL9) responsible for stress signal perception, intermediate signaling regulators including PP2C phosphatases (ABI1/ABI2, HAB1, HAI3, AHG1) and SnRK2 kinases (SRK2E, SRK2I), as well as downstream transcription factors (ABF2, ABF3, ABF4). Located at the geometric center of the network, ABI1 and ABI2 interact with the vast majority of upstream and downstream ABA pathway components.
Figure 10.
Protein–protein interaction (PPI) network analysis based on ABA, ROS, and SOS pathways. The figure shows a protein–protein interaction (PPI) network constructed around the abscisic acid (ABA) signaling pathway, reactive oxygen species (ROS) metabolic pathway, and the salt stress-related SOS ion homeostasis pathway. Nodes represent proteins, and edges indicate the interactions between proteins.
The calcium signaling pathway realizes coupled regulation with the ABA pathway via the CBL–CIPK module. Inner-layer calcium sensor proteins CBL1, CBL2, CBL3, CBL4, CBL9 and CBL10 all physically interact with the core ABA hubs ABI1 and ABI2, while abundant CIPK family proteins distributed at the peripheral ring of the network further expand the regulatory scope of calcium signals. ROS metabolism is governed by two counterbalancing branches for ROS generation and scavenging. The mid-layer nodes RBOHD and RBOHF receive regulatory inputs from upstream ABA and calcium signals and mediate controlled intracellular ROS biosynthesis. Antioxidant proteins including APX1, CAT2, GRX family and DHAR family are enriched at the network periphery and interact with RBOH homologs to eliminate excess reactive oxygen species.
Ion transporter proteins function as downstream effector modules of the regulatory cascade. The vacuolar Na+/H+ antiporter gene NHX7, together with ion channel genes SLAH3 and ALMT12, are dually regulated by ABA-dependent downstream transcription factors and upstream calcium signaling. In summary, this PPI network centers on the ABA signaling pathway as the master regulatory hub, and connects the SOS calcium cascade, ROS metabolic pathway and multiple ion transport modules through protein crosstalk, constructing a hierarchically organized and tightly balanced regulatory interactome. Its multi-layered topological structure drives mild, long-lasting overall signaling responses, which aligns with the moderate salt-tolerant trait of B. platyphylla, and provides systematic molecular regulatory support for B. platyphylla to cope with salt-induced abiotic stress.
3. Discussion
Salt stress triggers complex and dynamic transcriptional responses that enable plants to perceive environmental changes and establish adaptive physiological states. In this study, a time-resolved transcriptomic analysis was performed to elucidate the temporal regulatory landscape of salt stress responses in B. platyphylla. The results reveal that B. platyphylla responds to salt stress through a highly structured, phase-dependent transcriptional program, integrating early signaling, mid-term metabolic and hormonal reprogramming, and late-stage homeostatic regulation.
Salt stress imposes strong osmotic and ionic challenges on plants, and extensive studies in herbaceous species have revealed the central roles of ROS signaling, Ca2+–CBL–CIPK modules, SOS ion-homeostasis pathways, and ABA-mediated osmotic regulation in coordinating transcriptional and physiological responses [1,33]. These foundational studies illustrate how rapid ROS bursts, Ca2+ transients, and hormone signaling converge to initiate transcriptional reprogramming and maintain cellular homeostasis. However, most mechanistic insights derive from short-lived herbaceous models, whereas the temporal organization of stress responses in long-lived woody plants remains comparatively understudied [34,35,36].
In woody species, salt tolerance is further complicated by large biomass, slow tissue turnover, and long-term carbon allocation strategies. In poplar and other trees, salt stress has been shown to alter photosynthesis, antioxidant capacity, ion distribution, and ABA signaling [37,38]. Yet, the timing of these regulatory events—how trees transition from early perception to acclimation and eventual stabilization—has rarely been characterized at high temporal resolution. Unlike annual herbaceous plants that can rapidly complete their life cycles, perennial woody species must maintain cellular activity and growth over extended periods while coping with recurrent environmental fluctuations. Therefore, the ability to establish a precisely coordinated temporal stress response may represent an important adaptive strategy for woody plants. Evidence suggests that woody plants maintain prolonged signaling phases and greater redox-buffering capacity than herbaceous species [39], reflecting their distinct life histories and larger, long-lived tissues. Consistent with this concept, our time-resolved transcriptomic analysis revealed a sequential response pattern in B. platyphylla, characterized by early activation of stress signaling-related genes, followed by metabolic and hormonal adjustment, and later regulation of homeostasis-associated processes. This temporal organization may reflect the necessity of balancing rapid stress perception with sustained physiological stability in long-lived woody plants.
The ROS regulatory network exhibited a clear separation between early oxidative signaling and subsequent detoxification. Strong induction of RBOH isoforms corresponded with the canonical early ROS burst that initiates downstream signaling cascades [40,41]. During the mid-phase (5–12 h), the robust upregulation of antioxidant enzymes and components of the ascorbate–glutathione cycle indicates enhanced ROS scavenging capacity [42,43]. The phased expression of glutaredoxins and thiol–redox regulators underscores the importance of protein redox homeostasis in long-lived woody species. The phased expression of glutaredoxins and thiol–redox regulators not only contributes to the fine-tuning of ROS signaling, but also maintains protein functional stability by regulating protein thiol status, further highlighting the critical role of protein redox homeostasis in the adaptation of long-lived woody species to environmental changes. In addition, cell cycle-related genes also respond to salt stress. During the late stage of salt treatment, the upregulation of cell cycle-associated genes indicates a transition from a defensive state to the resumption of growth. This dynamic regulatory pattern of “suppression-recovery” not only helps prevent the accumulation and propagation of damaged cellular components, but also ensures that plants maintain basic survival under stress conditions while rapidly restoring growth once conditions improve. Therefore, the stage-specific regulation of the cell cycle during salt stress responses represents an important mechanism by which plants balance growth and stress tolerance.
SOS signaling displayed a similarly structured temporal architecture. The rapid activation of CBL–CIPK components during the early phase is indicative of efficient decoding of salt-induced Ca2+ transients [44,45,46,47,48]. In contrast, the delayed yet strong induction of SOS1 during 9–24 h highlights the temporal decoupling between early perception and later Na+ extrusion. This pattern is consistent with previous observations in other plant species [49,50] and may represent a physiological strategy in woody plants, where large tissue volumes necessitate more controlled ion redistribution.
ABA signaling followed a highly structured three-stage progression: early enhancement of biosynthesis (e.g., NCED3), mid-term amplification through PYR/PYL receptors and SnRK2 kinases, and late-phase transcriptional and physiological execution involving ABF transcription factors and ion channels. This progression reinforces the role of ABA as a central integrator connecting osmotic adjustment, ion homeostasis, and global transcriptional coordination during salt exposure [51,52].
Integrating the dynamics of the ROS, SOS, and ABA pathways reveals a hierarchical and interconnected regulatory framework. Early ROS and Ca2+ signals initiate defense programming, followed by coordinated activation of metabolic and translational adjustments, and ultimately the restoration of redox and ionic stability. Such temporally structured responses align with the broader understanding of tree physiology, where stress adaptation is shaped by large, long-lived tissues and slow turnover rates [53,54]. Compared with herbaceous plants, B. platyphylla exhibits extended signaling windows, stronger redox buffering, and delayed yet robust ion-homeostasis adjustments—features consistent with woody-specific adaptive strategies [55,56,57,58].
Collectively, this work provides a high-resolution view of the dynamic transcriptional landscape underlying salt tolerance in B. platyphylla. The identification of phase-specific regulators—including RBOH isoforms, CIPK10, NCED3, PYL6, SnRK2.6, ABF2, and SOS1—offers promising targets for genetic improvement and functional validation. However, it should be noted that this study is primarily based on transcriptomic analysis, and direct physiological measurements and experimental validation (e.g., qRT-PCR or functional assays) were not included, which represents a limitation of the current work. Despite this, our findings provide a robust framework for understanding the coordinated regulation of salt stress responses and generate testable hypotheses for future studies. These results not only deepen our understanding of salt-stress adaptation in B. platyphylla but also provide a conceptual framework for exploring long-term stress resilience in woody plants. Future work integrating metabolomics, phosphoproteomics, and gene-editing approaches will be essential to validate the functional roles of these candidate genes and further advance the development of salt-tolerant B. platyphylla cultivars.
4. Materials and Methods
4.1. Plant Materials and Salt Treatment
B. platyphylla seedlings were cultivated in pots containing a soil and perlite mixture (2:1, v/v) under controlled greenhouse conditions. The growth environment was maintained at 20–24 °C with a 16 h light/8 h dark photoperiod and approximately 70% relative humidity. Ten-week-old seedlings were used for salt stress treatment. Before treatment, plants were grown under well-watered conditions for three weeks.
Salt stress was imposed by treating seedlings with a 200 mmol/L NaCl solution according to the method described in the original study [59]. The salt concentration was selected based on previous studies and experimental observations [11], as it was sufficient to induce significant salt-responsive transcriptional changes while maintaining plant viability during the short-term treatment period. Control plants were treated with water under the same conditions.
To investigate early transcriptional responses to salinity, leaf samples were collected at 1, 3, 5, 9, 12, and 24 h after NaCl treatment. According to the original study [59], each treatment included at least 20 seedlings, and three independent biological replicates were performed for each treatment time point. Leaf tissues were collected for RNA-seq analysis. The sampling schedule was designed so that all samples could be harvested within the designated time windows, thereby minimizing potential variation caused by circadian rhythms or temporal fluctuations [7,59].
4.2. Data Source
In the present study, we utilized the publicly available RNA-seq dataset derived from the above experiment, downloaded from the NCBI Sequence Read Archive (SRA): (Experiment ID:SRX28995372, SRX28995373, SRX28995384, SRX28995386, SRX28995387, SRX28995388, SRX28995389, SRX28995390, SRX28995391, SRX28995392, SRX28995374, SRX28995375, SRX28995376, SRX28995377, SRX28995378, SRX28995379, SRX28995380, SRX28995381, SRX28995382, SRX28995383, SRX28995385). The dataset includes three biological replicates for each time point, with the 0 h samples serving as untreated controls for downstream secondary analysis.
4.3. Data Acquisition and Quality Control
Raw sequencing reads in FASTQ format were downloaded from NCBI SRA using the SRA Toolkit (v3.0.0) [60]. Quality assessment was performed using FastQC (v0.11.9) to evaluate per-base quality scores, GC content, sequence duplication, and adapter contamination [61]. Low-quality reads (Phred score < 20) and reads shorter than 50 bp were removed using Trimmomatic (v0.39). Clean reads were retained for downstream analyses [62]. Adapter sequences and low-quality bases were removed, and reads with an average Phred quality score below 20 or a length shorter than 50 bp after trimming were discarded. The resulting high-quality clean reads were used for subsequent genome alignment and transcriptomic analyses. Quality control statistics, including total reads, clean reads, and retained read proportions, were summarized for each sample before downstream analysis.
4.4. Read Alignment and Expression Quantification
Clean reads were aligned to the Betula platyphylla reference genome using HISAT2 (v2.2.1) with default parameters. Alignment efficiency was evaluated based on the percentage of mapped reads and uniquely mapped reads for each sample. The aligned reads were subsequently assigned to annotated genes using featureCounts (v2.0.3) to generate gene-level raw read count matrices. Normalized expression values were calculated as transcripts per million (TPM) to enable comparison of gene expression patterns among different samples and time points. The resulting expression matrix was used for downstream differential expression analysis, functional enrichment analysis, and time-series expression pattern analysis.
4.5. Differential Gene Expression Analysis
Differentially expressed genes (DEGs) were identified by comparing each NaCl-treated time point (1, 3, 5, 9, 12, and 24 h) with the corresponding 0 h untreated control samples. Differential expression analysis was performed using the DESeq2 package (v1.36.0) based on raw read count data. Genes with an absolute log2 fold change (|log2FC|) ≥ 1 and a false discovery rate (FDR) < 0.05 were considered significantly differentially expressed. Upregulated and downregulated DEGs were identified separately for each time point. Temporal changes in DEG numbers were visualized using bar plots, while volcano plots and Venn diagrams were generated to illustrate the overall distribution and overlap of salt-responsive genes across different treatment durations.
4.6. Functional Annotation and Pathway Enrichment
Gene Ontology (GO) enrichment analyses were performed using TBtools-II (Toolbox for Biologists), version 2.485 based on the identified DEGs. Significantly enriched GO terms were determined using a false discovery rate (FDR) threshold of <0.05. Enriched biological processes were classified according to their functional relevance to salt stress responses, with particular emphasis on processes involved in ion transport and homeostasis, osmotic adjustment, reactive oxygen species (ROS) metabolism, hormone signaling, and stress-responsive regulation. For selected salt-responsive pathways, including SOS-mediated ion transport regulation, ABA signaling, ROS scavenging pathways, and transcriptional regulation networks, expression patterns of representative genes were further examined to characterize their dynamic responses during salt treatment.
4.7. Time-Series Clustering
To characterize the dynamic transcriptional responses to salt stress, time-series clustering of differentially expressed genes (DEGs) was performed using the Mfuzz package (v2.58.0) based on fuzzy c-means clustering. Prior to clustering, TPM expression values were transformed as log2(TPM + 1) and standardized to eliminate scale differences among genes. The optimal fuzzification parameter (m) was estimated using the mestimate() function implemented in Mfuzz. To determine the appropriate number of clusters, a range of cluster numbers (c = 8–25) was tested. Based on cluster separation, pattern stability, and biological interpretability, 20 clusters were selected as the optimal clustering solution. Each gene was assigned a membership value indicating its degree of association with a given cluster. Genes with membership values greater than 0.5 were considered to be reliably assigned and were retained for downstream analysis. According to the temporal expression patterns of cluster centroids, the clusters were further grouped into three major response phases, representing distinct stages of transcriptional regulation under salt stress conditions. Functional enrichment analysis of genes within each cluster was performed using the clusterProfiler package 4.8.1, and significantly enriched Gene Ontology (GO) terms were identified with an adjusted p < 0.05.
5. Conclusions
In this study, a time-course transcriptomic reanalysis was conducted to investigate the dynamic transcriptional responses of white birch to salt stress. The results reveal that salt stress induces a clearly structured and phase-dependent transcriptional program, characterized by rapid early stress perception, coordinated mid-phase metabolic and hormonal reprogramming, and late-stage transcriptional stabilization associated with physiological adaptation.
Integrated analyses further demonstrate that reactive oxygen species (ROS), salt overly sensitive (SOS), and abscisic acid (ABA) signaling pathways are sequentially and coordinately activated during salt stress. The temporal interplay among early ROS and Ca2+ signaling, mid-phase ABA-mediated signal transduction, and late SOS-dependent ion homeostasis highlights an integrated regulatory network supporting salt tolerance in birch. Together, these findings provide a dynamic transcriptional framework for understanding salt stress adaptation in woody plants and identify candidate genes and regulatory processes for future functional validation.
Supplementary Materials
The following supporting information can be downloaded at https://www.mdpi.com/article/10.3390/f17080919/s1. Figure S1. Principal component analysis (PCA) of transcriptome profiles. Figure S2. Volcano plots of differentially expressed genes (DEGs) in white birch at different time points under salt stress.
Author Contributions
L.Y. prepared and revised the original draft of the manuscript. S.L. contributed to data analysis. S.Y. conceived and supervised the project and critically reviewed and edited the manuscript. All authors have read and agreed to the published version of the manuscript.
Funding
This research received no external funding.
Data Availability Statement
The transcriptome datasets analyzed in this study are publicly available from the NCBI Sequence Read Archive (SRA) database under accession numbers SRX28995372–SRX28995392. The processed data generated and analyzed in this study are available from the corresponding author upon reasonable request.
Acknowledgments
The authors acknowledge the use of ChatGPT-4 (OpenAI, https://chat.openai.com/) for language editing and improvement during manuscript preparation.
Conflicts of Interest
The authors declare no conflicts of interest.
References
- Zhu, J.K. Abiotic Stress Signaling and Responses in Plants. Cell 2016, 167, 313–324. [Google Scholar] [CrossRef] [Scilit] [PubMed]
- Nykiel, M.; Gietler, M.; Fidler, J.; Prabucka, B.; Labudda, M. Abiotic Stress Signaling and Responses in Plants. Plants 2023, 12, 3405. [Google Scholar] [CrossRef] [Scilit] [PubMed]
- Flowers, T.J.; Colmer, T.D. Plant salt tolerance: Adaptations in halophytes. Ann. Bot. 2015, 115, 327–331. [Google Scholar] [CrossRef] [Scilit] [PubMed]
- Munns, R.; Tester, M. Mechanisms of salinity tolerance. Annu. Rev. Plant Biol. 2008, 59, 651–681. [Google Scholar] [CrossRef] [Scilit] [PubMed]
- Wang, S.; Yang, C.; Zhao, X.; Chen, S.; Qu, G.Z. Complete chloroplast genome sequence of Betula platyphylla: Gene organization, RNA editing, and comparative and phylogenetic analyses. BMC Genom. 2018, 19, 950. [Google Scholar] [CrossRef] [Scilit] [PubMed]
- Hu, P.; Zhang, K.; Yang, C. BpNAC012 Positively Regulates Abiotic Stress Responses and Secondary Wall Biosynthesis. Plant Physiol. 2019, 179, 700–717. [Google Scholar] [CrossRef] [Scilit] [PubMed]
- Jia, Y.; Zhao, H.; Niu, Y.; Wang, Y. Identification of birch lncRNAs and mRNAs responding to salt stress and characterization of functions of lncRNA. Hortic. Res. 2023, 10, uhac277. [Google Scholar] [CrossRef] [Scilit] [PubMed]
- Jia, Y.; Zhao, H.; Niu, Y.; Wang, Y. Long noncoding RNA from Betula platyphylla, BplncSIR1, confers salt tolerance by regulating BpNAC2 to mediate reactive oxygen species scavenging and stomatal movement. Plant Biotechnol. J. 2024, 22, 48–65. [Google Scholar] [CrossRef] [Scilit] [PubMed]
- Liu, Z.; Shi, X.; Wang, Z.; Qu, M.; Gao, C.; Wang, C.; Wang, Y. Acetylation of transcription factor BpTCP20 by acetyltransferase BpPDCE23 modulates salt tolerance in birch. Plant Physiol. 2024, 195, 2354–2371. [Google Scholar] [CrossRef] [Scilit] [PubMed]
- Liu, Z.; Xu, R.; Fan, Y.; Dong, W.; Han, Y.; Xie, Q.; Li, J.; Liu, B.; Wang, C.; Wang, Y.; et al. Bp-miR408a participates in osmotic and salt stress responses by regulating BpBCP1 in Betula platyphylla. Tree Physiol. 2024, 44, tpad159. [Google Scholar] [CrossRef] [Scilit] [PubMed]
- Liu, Z.; Zhang, T.; Xu, R.; Liu, B.; Han, Y.; Dong, W.; Xie, Q.; Tang, Z.; Lei, X.; Wang, C.; et al. BpGRP1 acts downstream of BpmiR396c/BpGRF3 to confer salt tolerance in Betula platyphylla. Plant Biotechnol. J. 2024, 22, 131–147. [Google Scholar] [CrossRef] [Scilit] [PubMed]
- Zhang, W.; Yang, G.; Mu, D.; Li, H.; Zang, D.; Xu, H.; Zou, X.; Wang, Y. An Ethylene-responsive Factor BpERF11 Negatively Modulates Salt and Osmotic Tolerance in Betula platyphylla. Sci. Rep. 2016, 6, 23085. [Google Scholar] [CrossRef] [Scilit] [PubMed]
- Zhang, X.; Guo, Q.; Qin, L.; Li, L. A Cys2His2 Zinc Finger Transcription Factor BpSZA1 Positively Modulates Salt Stress in Betula platyphylla. Front. Plant Sci. 2022, 13, 823547. [Google Scholar] [CrossRef] [Scilit] [PubMed]
- Zhou, X.; Ren, R.; Sun, H.; Wang, L.; He, W.; Guo, H. BpMYB06 acts as a positive regulatory factor in saline-alkaline stress resistance by binding to two novel elements. Plant Cell Physiol. 2025, 66, 318–332. [Google Scholar] [CrossRef] [Scilit] [PubMed]
- Zhu, J.K. Salt and drought stress signal transduction in plants. Annu. Rev. Plant Biol. 2002, 53, 247–273. [Google Scholar] [CrossRef] [Scilit] [PubMed]
- Hauser, F.; Horie, T. A conserved primary salt tolerance mechanism mediated by HKT transporters: A mechanism for sodium exclusion and maintenance of high K(+)/Na(+) ratio in leaves during salinity stress. Plant Cell Environ. 2010, 33, 552–565. [Google Scholar] [CrossRef] [Scilit] [PubMed]
- Chen, T.H.; Murata, N. Glycinebetaine protects plants against abiotic stress: Mechanisms and biotechnological applications. Plant Cell Environ. 2011, 34, 1–20. [Google Scholar] [CrossRef] [Scilit] [PubMed]
- Apel, K.; Hirt, H. Reactive oxygen species: Metabolism, oxidative stress, and signal transduction. Annu. Rev. Plant Biol. 2004, 55, 373–399. [Google Scholar] [CrossRef] [Scilit] [PubMed]
- Wang, J.; Ding, C.; Cui, C.; Song, J.; Ji, G.; Sun, N.; Qi, S.; Li, J.; Xu, Z.; Zhang, H. Physiological and molecular responses of poplar to salt stress and functional analysis of PagGRXC9 to salt tolerance. Tree Physiol. 2025, 45, tpaf039. [Google Scholar] [CrossRef] [Scilit] [PubMed]
- Zhang, J.; Yang, N.; Li, Y.; Zhu, S.; Zhang, S.; Sun, Y.; Zhang, H.X.; Wang, L.; Su, H. Overexpression of PeMIPS1 confers tolerance to salt and copper stresses by scavenging reactive oxygen species in transgenic poplar. Tree Physiol. 2018, 38, 1566–1577. [Google Scholar] [CrossRef] [Scilit] [PubMed]
- Yang, Y.; Guo, Y. Elucidating the molecular mechanisms mediating plant salt-stress responses. New Phytol. 2018, 217, 523–539. [Google Scholar] [CrossRef] [Scilit] [PubMed]
- Hu, H.; Dai, M.; Yao, J.; Xiao, B.; Li, X.; Zhang, Q.; Xiong, L. Overexpressing a NAM, ATAF, and CUC (NAC) transcription factor enhances drought resistance and salt tolerance in rice. Proc. Natl. Acad. Sci. USA 2006, 103, 12987–12992. [Google Scholar] [CrossRef] [Scilit] [PubMed]
- Jiang, Y.; Deyholos, M.K. Functional characterization of Arabidopsis NaCl-inducible WRKY25 and WRKY33 transcription factors in abiotic stresses. Plant Mol. Biol. 2009, 69, 91–105. [Google Scholar] [CrossRef] [Scilit] [PubMed]
- Liu, Z.; Wang, P.; Wang, Z.; Wang, C.; Wang, Y. Birch WRKY transcription factor, BpWRKY32, confers salt tolerance by mediating stomatal closing, proline accumulation, and reactive oxygen species scavenging. Plant Physiol. Biochem. 2024, 210, 108599. [Google Scholar] [CrossRef] [Scilit] [PubMed]
- Guo, H.; Wang, Y.; Wang, L.; Hu, P.; Wang, Y.; Jia, Y.; Zhang, C.; Zhang, Y.; Zhang, Y.; Wang, C.; et al. Expression of the MYB transcription factor gene BplMYB46 affects abiotic stress tolerance and secondary cell wall deposition in Betula platyphylla. Plant Biotechnol. J. 2017, 15, 107–121. [Google Scholar] [CrossRef] [Scilit] [PubMed]
- Wang, T.; Chen, L.; Zhao, M.; Tian, Q.; Zhang, W.H. Identification of drought-responsive microRNAs in Medicago truncatula by genome-wide high-throughput sequencing. BMC Genom. 2011, 12, 367. [Google Scholar] [CrossRef] [Scilit] [PubMed]
- Liu, J.G.; Han, X.; Yang, T.; Cui, W.H.; Wu, A.M.; Fu, C.X.; Wang, B.C.; Liu, L.J. Genome-wide transcriptional adaptation to salt stress in Populus. BMC Plant Biol. 2019, 19, 367. [Google Scholar] [CrossRef] [Scilit] [PubMed]
- Ding, F.; Cui, P.; Wang, Z.; Zhang, S.; Ali, S.; Xiong, L. Genome-wide analysis of alternative splicing of pre-mRNA under salt stress in Arabidopsis. BMC Genom. 2014, 15, 431. [Google Scholar] [CrossRef] [Scilit] [PubMed]
- Ren, X.; Fan, J.; Li, X.; Shan, Y.; Wang, L.; Ma, L.; Li, Y.; Li, X. Application of RNA sequencing to understand the response of rice seedlings to salt-alkali stress. BMC Genom. 2023, 24, 21. [Google Scholar] [CrossRef] [Scilit] [PubMed]
- Nakayama, R.; Safi, M.T.; Ahmadzai, W.; Sato, K.; Kawaura, K. Comparative transcriptome analysis of synthetic and common wheat in response to salt stress. Sci. Rep. 2022, 12, 11534. [Google Scholar] [CrossRef] [Scilit] [PubMed]
- Fu, H.; Yang, Y. How Plants Tolerate Salt Stress. Curr. Issues Mol. Biol. 2023, 45, 5914–5934. [Google Scholar] [CrossRef] [Scilit] [PubMed]
- Miller, G.; Suzuki, N.; Ciftci-Yilmaz, S.; Mittler, R. Reactive oxygen species homeostasis and signalling during drought and salinity stresses. Plant Cell Environ. 2010, 33, 453–467. [Google Scholar] [CrossRef] [Scilit] [PubMed]
- Shabala, S.; Bose, J.; Hedrich, R. Salt bladders: Do they matter? Trends Plant Sci. 2014, 19, 687–691. [Google Scholar] [CrossRef] [Scilit] [PubMed]
- Li, Q.; Chen, L.; Yang, A. The Molecular Mechanisms Underlying Iron Deficiency Responses in Rice. Int. J. Mol. Sci. 2019, 21, 43. [Google Scholar] [CrossRef] [Scilit] [PubMed]
- Xie, Z.; Nolan, T.M.; Jiang, H.; Yin, Y. AP2/ERF Transcription Factor Regulatory Networks in Hormone and Abiotic Stress Responses in Arabidopsis. Front. Plant Sci. 2019, 10, 228. [Google Scholar] [CrossRef] [Scilit] [PubMed]
- Zhu, Y.; Gao, H.; Lu, M.; Hao, C.; Pu, Z.; Guo, M.; Hou, D.; Chen, L.Y.; Huang, X. Melatonin-Nitric Oxide Crosstalk and Their Roles in the Redox Network in Plants. Int. J. Mol. Sci. 2019, 20, 6200. [Google Scholar] [CrossRef] [Scilit] [PubMed]
- Brinker, M.; Brosché, M.; Vinocur, B.; Abo-Ogiala, A.; Fayyaz, P.; Janz, D.; Ottow, E.A.; Cullmann, A.D.; Saborowski, J.; Kangasjärvi, J.; et al. Linking the salt transcriptome with physiological responses of a salt-resistant Populus species as a strategy to identify genes important for stress acclimation. Plant Physiol. 2010, 154, 1697–1709. [Google Scholar] [CrossRef] [Scilit] [PubMed]
- Zhang, X.; Liu, L.; Chen, B.; Qin, Z.; Xiao, Y.; Zhang, Y.; Yao, R.; Liu, H.; Yang, H. Progress in Understanding the Physiological and Molecular Responses of Populus to Salt Stress. Int. J. Mol. Sci. 2019, 20, 1312. [Google Scholar] [CrossRef] [Scilit] [PubMed]
- Anderegg, W.R.L.; Wolf, A.; Arango-Velez, A.; Choat, B.; Chmura, D.J.; Jansen, S.; Kolb, T.; Li, S.; Meinzer, F.C.; Pita, P.; et al. Woody plants optimise stomatal behaviour relative to hydraulic risk. Ecol. Lett. 2018, 21, 968–977. [Google Scholar] [CrossRef] [Scilit] [PubMed]
- Mittler, R. ROS Are Good. Trends Plant Sci. 2017, 22, 11–19. [Google Scholar] [CrossRef] [Scilit] [PubMed]
- Suzuki, N.; Koussevitzky, S.; Mittler, R.; Miller, G. ROS and redox signalling in the response of plants to abiotic stress. Plant Cell Environ. 2012, 35, 259–270. [Google Scholar] [CrossRef] [Scilit] [PubMed]
- Foyer, C.H.; Noctor, G. Stress-triggered redox signalling: What’s in pROSpect? Plant Cell Environ. 2016, 39, 951–964. [Google Scholar] [CrossRef] [Scilit] [PubMed]
- Mhamdi, A.; Noctor, G.; Baker, A. Plant catalases: Peroxisomal redox guardians. Arch. Biochem. Biophys. 2012, 525, 181–194. [Google Scholar] [CrossRef] [Scilit] [PubMed]
- Srivastava, A.K.; Shankar, A.; Nalini Chandran, A.K.; Sharma, M.; Jung, K.H.; Suprasanna, P.; Pandey, G.K. Emerging concepts of potassium homeostasis in plants. J. Exp. Bot. 2020, 71, 608–619. [Google Scholar] [CrossRef] [Scilit] [PubMed]
- Ye, Y.; Ding, Y.; Jiang, Q.; Wang, F.; Sun, J.; Zhu, C. The role of receptor-like protein kinases (RLKs) in abiotic stress response in plants. Plant Cell Rep. 2017, 36, 235–242. [Google Scholar] [CrossRef] [Scilit] [PubMed]
- Zhu, J.K. Cell signaling under salt, water and cold stresses. Curr. Opin. Plant Biol. 2001, 4, 401–406. [Google Scholar] [CrossRef] [Scilit] [PubMed]
- Zhu, J.K. Regulation of ion homeostasis under salt stress. Curr. Opin. Plant Biol. 2003, 6, 441–445. [Google Scholar] [CrossRef] [Scilit] [PubMed]
- Weinl, S.; Kudla, J. The CBL-CIPK Ca(2+)-decoding signaling network: Function and perspectives. New Phytol. 2009, 184, 517–528. [Google Scholar] [CrossRef] [Scilit] [PubMed]
- Shi, H.; Ishitani, M.; Kim, C.; Zhu, J.K. The Arabidopsis thaliana salt tolerance gene SOS1 encodes a putative Na+/H+ antiporter. Proc. Natl. Acad. Sci. USA 2000, 97, 6896–6901. [Google Scholar] [CrossRef] [Scilit] [PubMed]
- Ji, H.; Pardo, J.M.; Batelli, G.; Van Oosten, M.J.; Bressan, R.A.; Li, X. The Salt Overly Sensitive (SOS) pathway: Established and emerging roles. Mol. Plant 2013, 6, 275–286. [Google Scholar] [CrossRef] [Scilit] [PubMed]
- Cutler, S.R.; Rodriguez, P.L.; Finkelstein, R.R.; Abrams, S.R. Abscisic acid: Emergence of a core signaling network. Annu. Rev. Plant Biol. 2010, 61, 651–679. [Google Scholar] [CrossRef] [Scilit] [PubMed]
- Yoshida, T.; Christmann, A.; Yamaguchi-Shinozaki, K.; Grill, E.; Fernie, A.R. Revisiting the Basal Role of ABA—Roles Outside of Stress. Trends Plant Sci. 2019, 24, 625–635. [Google Scholar] [CrossRef] [Scilit] [PubMed]
- Lebedev, V.G.; Popova, A.A.; Shestibratov, K.A. Genetic Engineering and Genome Editing for Improving Nitrogen Use Efficiency in Plants. Cells 2021, 10, 3303. [Google Scholar] [CrossRef] [Scilit] [PubMed]
- Stuart, E.K.; Plett, K.L. Digging Deeper: In Search of the Mechanisms of Carbon and Nitrogen Exchange in Ectomycorrhizal Symbioses. Front. Plant Sci. 2019, 10, 1658. [Google Scholar] [CrossRef] [Scilit] [PubMed]
- Lima, L.L.; Frosi, G.; Lopes, R.; Santos, M.G. Remobilization of leaf Na(+) content and use of nonstructural carbohydrates vary depending on the time when salt stress begins in woody species. Plant Physiol. Biochem. 2021, 158, 385–395. [Google Scholar] [CrossRef] [Scilit] [PubMed]
- Duan, Q.; Zhu, Z.; Wang, B.; Chen, M. Recent Progress on the Salt Tolerance Mechanisms and Application of Tamarisk. Int. J. Mol. Sci. 2022, 23, 3325. [Google Scholar] [CrossRef] [Scilit] [PubMed]
- El Yamani, M.; Cordovilla, M.D.P. Tolerance Mechanisms of Olive Tree (Olea europaea) under Saline Conditions. Plants 2024, 13, 2094. [Google Scholar] [CrossRef] [Scilit] [PubMed]
- Toscano, S.; Romano, D.; Ferrante, A. Molecular Responses of Vegetable, Ornamental Crops, and Model Plants to Salinity Stress. Int. J. Mol. Sci. 2023, 24, 3190. [Google Scholar] [CrossRef] [Scilit] [PubMed]
- Wang, J.; Sun, X.; Wang, P.; Wu, S.; Wang, Y. Exploring Birch Salt Tolerance Using Gene Regulatory Network Highlighting Hormone Signaling, Reactive Oxygen Species Scavenging, and Ion Homeostasis. Physiol. Plant 2025, 177, e70331. [Google Scholar] [CrossRef] [Scilit] [PubMed]
- Sayers, E.W.; Barrett, T.; Benson, D.A.; Bolton, E.; Bryant, S.H.; Canese, K.; Chetvernin, V.; Church, D.M.; Dicuccio, M.; Federhen, S.; et al. Database resources of the National Center for Biotechnology Information. Nucleic Acids Res. 2012, 40, D13–D25. [Google Scholar] [CrossRef] [Scilit] [PubMed]
- de Sena Brandine, G.; Smith, A.D. Falco: High-speed FastQC emulation for quality control of sequencing data. F1000Res 2019, 8, 1874. [Google Scholar] [CrossRef] [Scilit] [PubMed]
- Bolger, A.M.; Lohse, M.; Usadel, B. Trimmomatic: A flexible trimmer for Illumina sequence data. Bioinformatics 2014, 30, 2114–2120. [Google Scholar] [CrossRef] [Scilit] [PubMed]

Disclaimer/Publisher’s Note: The statements, opinions and data contained in all publications are solely those of the individual author(s) and contributor(s) and not of MDPI and/or the editor(s). MDPI and/or the editor(s) disclaim responsibility for any injury to people or property resulting from any ideas, methods, instructions or products referred to in the content. |
© 2026 by the authors. Licensee MDPI, Basel, Switzerland. This article is an open access article distributed under the terms and conditions of the Creative Commons Attribution (CC BY) license.