


Abstract
Understanding patterns and processes affecting genetic diversity and structure of fragmented tree populations is essential for defining effective conservation strategies. Here, we investigate the genetic diversity of the Macedonian oak (Quercus trojana Webb 1839) across its entire Italian range by sampling 546 georeferenced trees from 30 forest stands. Using ten polymorphic nuclear microsatellite markers, we assessed within-population genetic variability and population structure, estimated effective population size (Ne), bottleneck signatures, and fine-scale relatedness among individual trees. Our results showed overall moderate genetic diversity, but marked variation emerged among populations and between two subregions. Populations in the North-Western Murge subregion exhibited lower allelic richness (Ar), critically small Ne (<50 in 12 populations), evidence of past bottlenecks, and higher pairwise differentiation, with three populations standing out as genetically distinct. Isolation by distance was significant only within the South-Eastern Murge subregion, suggesting contrasting demographic histories. Fine-scale relatedness analysis revealed higher within-site relatedness in North-Western Murge and a substantial proportion (30%) of related dyads across subregions, indicating large-scale connectivity due to natural or anthropogenic factors. Overall, our results reveal a complex scenario of historical and ongoing genetic erosion in some populations, particularly in the northern part of the range, alongside relatively high gene flow across the study area, especially in the south. We recommend prioritizing conservation actions for populations with critically low Ne and distinct gene pools, while maintaining genetic diversity hotspots and landscape connectivity.
1. Introduction
The loss and degradation of habitat are the leading drivers of global biodiversity decline. In forest ecosystems, these processes often lead to population fragmentation, isolation, and reduced effective population size [1,2,3]. Such changes increase genetic drift and inbreeding, ultimately reducing genetic diversity and compromising both genetic connectivity and ecosystem functioning [3,4]. Intra-specific genetic diversity is essential for enabling forest tree species to adapt to environmental change and respond to the emerging threats, such as climate change and novel pests and diseases [5,6,7,8]. Maintaining this diversity is therefore critical to enhancing the local resilience and long-term survival of forest populations. However, the genetic dimension of biodiversity is still often overlooked in conservation policy and practice [9,10], although the goal of maintaining genetic diversity to safeguard the adaptive potential of species is explicitly stated in Target 4 of the Convention on Biological Diversity’s post-2020 Global Biodiversity Framework [11,12]. For these reasons, monitoring genetic diversity and estimating population structure are of fundamental importance for informing conservation strategies aimed at the long-term survival of natural populations [13,14], including forest trees [15,16].
The Macedonian oak (Quercus trojana Webb, 1839) is a remarkable species native to the eastern Mediterranean and Balkan regions [17]. This medium-sized, semi-deciduous tree is characterized by subcoriaceous, elongated leaves and acorns enclosed in a woody dome with hairy scales. It typically thrives in particularly thermophilic environments, preferring dry, predominantly limestone soils that are neutral to slightly acidic [18]. Taxonomically, it belongs to the subgenus Cerris, specifically the section Cerris [19,20] forming part of the exclusively Eurasian “Old World clade” with a presumed Miocene origin [21,22]. Its disjunct distribution range extends from western Anatolia across parts of the eastern Mediterranean and the Balkans, with a few fragmented and disconnected outposts in southeastern Italy [23,24,25].
In Italy, Q. trojana (locally known as fragno) grows naturally only on the Murge plateau (300–680 m above sea level), which lies mostly within the region of Apulia and the southeastern corner of the Basilicata region [18]. Its current distribution is interpreted as the result of a range contraction during the Last Glacial Maximum (LGM), followed by a drastic reduction of forest stands due to human exploitation [26].
From an ecological and bioclimatic perspective, the Murge region is commonly subdivided into north-western and south-eastern sectors, separated by the Gioia del Colle saddle [27,28,29,30]. The north-western Murge subregion (hereafter, NW Murge) includes the Alta Murgia National Park and the Premurge (the Southern Apennine foredeep). This area is influenced by the climatic effects of the nearby Southern Apennines and, in the case of the Alta Murgia, by its higher elevation, resulting in more continental and relatively cooler conditions than the south-eastern sectors, particularly in the Alta Murgia [31]. Within a landscape dominated by extensive dry grasslands shaped by long-term deforestation and grazing, Q. trojana occurs sporadically in small, fragmented, and often relict woodland patches, typically associated with rocky substrates and locally favourable edaphic conditions. In contrast, the south-eastern Murge (hereafter, SE Murge), comprising the southernmost sector of the Murgian plateau closer to the Ionian coast and including the Regional Natural Park of Terra delle Gravine, is more strongly influenced by Mediterranean climatic conditions and experiences higher summer thermal and hydrological stress. This area is also characterized by a higher occurrence of fertile soils, where Q. trojana is more abundant and forms larger and more continuous stands, including within agricultural landscapes [32,33]. According to the classical biogeographic subdivision, the Murge Materane (in the Basilicata administrative region) are generally included within the SE Murge domain, although they represent a transitional sector towards the Bradanic foredeep and the Apennine foothills, characterized by greater landscape heterogeneity. Here, Q. trojana is well represented, although with a discontinuous distribution.
The present-day distribution of Q. trojana woodlands across the two subregions reflects not only ecological and bioclimatic differences but also contrasting histories of land use and forest exploitation. Historical studies on the vegetation of the Murge [34,35] documented a marked contraction of the species’ distribution during the last centuries, particularly in the NW Murge, where broadleaved forests underwent more extensive clearing. Deforestation reached substantially higher levels in the north-western sector, with forest cover losses estimated at 70%–80%, whereas the SE Murge retained more extensive woodlands and currently hosts the largest stands of Macedonian oak in the region [32]. These contrasting trajectories largely reflect differences in historical land-use dynamics and socio-economic systems between the two sectors [36]. As a consequence, the present landscape is highly fragmented, with remnant woodlands embedded within a matrix of grasslands, agricultural land, and urban areas, resulting in habitat degradation, reduced connectivity among populations, and an increased risk of genetic erosion [18].
In this context, Q. trojana woodlands in Italy are designated as a habitat type of community interest for conservation under the EU Habitats Directive (92/43/EEC, Annex I, Code 9250, Subtype 41.782), owing to their ecological significance and their historical and cultural value [37]. Nevertheless, the woodlands’ current unfavorable conservation status requires targeted management, and coordinated regional strategies are strongly recommended to support habitat recovery and the species’ long-term persistence [18,26,37]. This need is underscored by ongoing habitat loss and degradation, worsened by current climate and global changes, which threaten to further reduce the size of Q. trojana populations, increase their isolation and erode their genetic diversity, highlighting the urgent need for genetic monitoring and concrete future conservation actions.
Carabeo et al. [18] assessed the genetic diversity and structure of 16 Q. trojana populations in Apulia, Italy, using six SSR markers, revealing substantial diversity, three distinct gene pools, and favorable conditions for conservation. Building on this work, we sampled a further 14 sites to achieve the first complete coverage of the species’ distribution in Italy. We also employed a larger set of polymorphic SSRs to improve genetic resolution, within the framework of the Italian National Biodiversity Future Center (NBFC) initiative, which aims to promote the sustainable management of genetic resources in Mediterranean forest ecosystems. Through expanded sampling and an enhanced marker set, this study provides a comprehensive genetic assessment of Quercus trojana across its Italian range, offering a valuable tool for guiding future conservation and management programs.
Specifically, we aimed to: (a) characterize the genetic diversity levels and demographic status (current effective population size, Ne; recent and past bottlenecks) of 30 forest stands using a set of 10 nuclear microsatellite (SSR) markers; (b) assess genetic differentiation and population structure across the species’ fragmented Italian distribution, comparing recorded patterns in the two ecologically distinct subregions: North-Western (NW) Murge and South-Eastern (SE) Murge; and (c) quantify fine-scale relatedness among individual trees to assess local genetic structure within populations and to infer patterns of contemporary or historical gene flow across the landscape, including between the two subregions. Based on the recorded results, we identified genetically valuable populations (e.g., reservoirs of high genetic diversity, unique gene pools) and those at highest risk (e.g., critically low Ne, low genetic diversity, evidence of bottlenecks), and characterized gene flow among populations and subregions to provide genetically informed recommendations for prioritizing conservation actions and managing genetic resources in this Mediterranean endemic tree.
2. Materials and Methods
2.1. Plant Material and Selected Populations
A total of 546 georeferenced Quercus trojana trees from 30 populations in southern Italy, spanning both the North-Western (NW) and South-Eastern (SE) Murge subregions, were included in the analysis (Figure 1 and Table S1). Of these, 298 trees from 16 populations were previously collected [18] and 248 trees were newly sampled from 14 populations located across the Basilicata and Apulia regions. The sampling areas include the National Park of Alta Murgia and the Regional Natural Parks of the Murgia Materana and Terra delle Gravine, as well as the small State Natural Reserves of the Murge Sud-orientali and the stands surrounding these protected areas (Figure 1 and Table S1). Trees were randomly selected with a spacing of at least 30–50 m to minimize the chances of intercrossing. Samples of four to six healthy green leaves per tree were collected and stored for genetic analysis.
Figure 1.
Geographical distribution of the 30 Quercus trojana populations analyzed in this study. Sampling sites are colored according to subregion (red = North-Western (NW) Murge; light blue = South-Eastern (SE) Murge) and scaled according to allelic richness (Ar).
2.2. DNA Extraction and Microsatellite Analysis
Total genomic DNA was isolated from 20 to 50 mg of fresh leaf tissue and purified using the DNeasy® 96 Plant Kit (QIAGEN GmbH, Hilden, Germany), according to the manufacturer’s instructions. DNA quality was checked by loading the DNA onto a 1% agarose gel. Based on the available information about polymorphism, position on different linkage groups, and potential transferability to Q. trojana, a set of 12 nuclear SSR markers developed in Quercus and Castanea was selected [18,38,39,40,41,42,43]. Out of these, 10 SSRs that produced reproducible and polymorphic results were selected for the analysis and organized in four multiplex-PCR mixtures (Table S2). Polymerase chain reaction (PCR) was performed using a GeneAmp 2700 Thermal Cycler (Applied BiosystemsTM, Foster City, CA, USA). The PCR reaction mixture comprised a total volume of 12.5 μL, containing 4 μL template DNA (∼20 ng), following the Type-It® Microsatellite PCR Kit (QIAGEN GmbH, Germany) protocol. The cycling parameters were 15 min initial denaturation at 95 °C; 30 cycles of 30 s at 94 °C, 90 s at 57 °C and 1 min elongation at 72 °C; and a final step of 30 min extension at 72 °C. The amplification products (1 μL) were mixed with 20 μL of formamide and 0.3 μL of GeneScanTM 500 LIZ dye size standard (Applied BiosystemsTM, Foster City, CA, USA), and then denatured at 95 °C for 5 min. Samples were run on an ABI PRISM® 3130xL Avant Genetic Analyzer DNA sequencer (Applied BiosystemsTM, Foster City, CA, USA). The allele size scoring was performed using the GeneMapperTM Software v. 4.0 (Thermo Fisher Scientific, Waltham, MA, USA).
2.3. Genetic Diversity and Demographic Analysis
Each SSR locus was tested for the presence of allele drop-out and scoring errors using Micro-Checker (University of Hull, Hull, UK) [44]. Pairwise linkage disequilibrium (LD) between all loci was tested using Arlequin v. 3.5.2.2 [45], both across the entire dataset and within each population separately.
Intra-population genetic diversity indices were calculated for each population. Specifically, the observed (Ao) and effective (Ae) number of alleles, private alleles (Pa), observed (Ho) and expected (He) heterozygosity [46], as well as unbiased expected heterozygosity (uHe) [47], were estimated using GenAlEx v. 6.503 [48]. Because estimates of the mean number of alleles per locus can be biased by unequal sample sizes [49], allelic richness (Ar) and private allelic richness (PAr) were computed using the rarefaction method, which corrects for differences in sample size [50], as implemented in HP-RARE v. 1.0 software [51]. This method estimates the expected number of (private) alleles in a standardized subsample of n individuals randomly drawn from the original sample of N, where n corresponds to the smallest population sample size. In our dataset, this value was nine individuals (n = 9), after excluding the JPT population. This population comprised only five individuals, a sample size that would lead to increased stochasticity and unreliable estimates of allelic and private allelic richness under rarefaction. To investigate geographic patterns of genetic diversity, we compared values of allelic richness (Ar) and unbiased expected heterozygosity (uHe) in the two subregions (NW Murge and SE Murge), testing for differences using the non-parametric Wilcoxon rank-sum test, which does not assume normality [52].
To assess levels of inbreeding and genetic differentiation across hierarchical levels, unbiased estimates of Wright’s fixation indices [53], i.e., the within-population inbreeding coefficient (FIS) and the among-population genetic differentiation coefficient (FST), were computed in Arlequin v. 3.5.2.2 [45]. The statistical significance of the fixation indices was tested using a non-parametric permutation approach (10,000 permutations), as described by [54].
The contemporary effective population size (Ne) was estimated using the linkage disequilibrium method [55], as implemented in the RLDNe v. 0.1.0 R package, that conveniently interfaces with NeEstimator 2.1 [56]. Estimates of Ne were calculated for each population, and 95% confidence intervals were obtained using the jackknife method. A critical allele frequency threshold of 0.05 was applied to reduce potential bias due to rare alleles.
To detect population size reductions, we used two complementary approaches that operate on different temporal scales. First, we used BOTTLENECK v. 1.2.02 [57,58] to test for recent population reductions. By comparing the observed heterozygosity with that expected under mutation-drift equilibrium, this software can detect a transient excess of heterozygosity relative to that predicted in a population of constant size. This signal arises shortly after a bottleneck and typically persists for about 2Ne to 4Ne generations, depending on several factors such as the severity of the bottleneck and the mutation rate of the loci being studied [57]. To account for uncertainty in microsatellite mutational patterns, which can vary among taxa and loci, analyses were performed under two mutational models. The Two-Phase Mutation (TPM) model was first tested because it is generally considered the most realistic and conservative model for microsatellite evolution, as it allows for both single-step and occasional multi-step mutations [57,58]; analyses were performed using 70% single-step mutations and 30% multi-step mutations, with a variance of 12 among multi-step mutations. In addition, analysis was repeated using the Infinite Allele Model (IAM), which, although considered a less appropriate model according to theoretical expectations and more prone to false positives, has proven to be more sensitive to recent reductions in effective population size than TPM [57]. One-tailed Wilcoxon signed-rank tests were used to evaluate whether the observed heterozygosity was significantly higher (excess) or lower (deficiency) than expected. Second, the Garza–Williamson Index (M-ratio [59]) was calculated using Arlequin v. 3.5.2.2 to assess signals of more ancient bottlenecks. This index measures the ratio between the number of alleles and the range in allele sizes across loci, and typically remains low for longer following a population reduction than heterozygosity excess. Following Garza and Williamson [59], values below 0.68 were considered indicative of a historical bottleneck. However, because the critical threshold may vary depending on mutation rate, effective population size, and the specific demographic history, the 0.68 value should be regarded as a general rule of thumb rather than a strict diagnostic cutoff [59]. According to simulations, the Garza and Williamson index can retain detectable signals of population size reductions for up to approximately 125 generations when populations recover rapidly after a severe bottleneck, and for up to approximately 500 generations when population size remains reduced [59]. Given its small sample size (n = 5), the JPT population was excluded from effective population size (Ne) estimation and bottleneck analyses, as these methods can be strongly biased when applied to very small samples.
2.4. Genetic Differentiation and Population Structure
We assessed genetic differentiation and structure among Italian Q. trojana populations to identify distinct genetic clusters and evaluate gene flow across their fragmented range. Genetic differentiation between populations was estimated using pairwise FST [53], as implemented in Arlequin v. 3.5.2.2 [45]. These values were then visualized using the heatmap.2 function implemented in the R package gplots (v. 3.3.0) [60] to generate a heatmap and a UPGMA dendrogram based on FST values. FST statistical significance was assessed with 10,000 permutations, and associated p-values were adjusted for multiple comparisons using the false discovery rate (FDR) method [61], as implemented in the p.adjust R function. Pairwise Jost’s D was also calculated using the mmod (v. 1.3.2) R package [62] as an alternative measure of genetic differentiation, being generally less constrained by levels of within-population diversity. To explore genetic relationships among Q. trojana populations, a Discriminant Analysis of Principal Components (DAPC) was performed using the R package adegenet v. 2.1.10 [63]. In the DAPC, population was used as the grouping factor, and 60 principal components were retained, explaining approximately 90% of the total genetic variation. Genetic structure was subsequently analyzed using the model-based Bayesian approach implemented in STRUCTURE v. 2.3.4 [64] to infer the most likely number of genetic clusters (K). The analysis employed the admixture model with correlated allele frequencies [65] and incorporated the LOCPRIOR model to include sampling locations as prior information for cluster assignment, which can improve resolution in cases of weak population structure [66,67]. The informativeness of the prior was assessed using the r parameter, with values below 1 indicating informative sampling locations. Based on initial results, the number of tested clusters (K) ranged from 1 to 15, with 12 independent runs performed for each K. Each run included a burn-in period of 10,000 steps followed by 100,000 Markov chain Monte Carlo (MCMC) iterations. Replicate runs for each K were summarized using the online software CLUMPAK v. 1.1 [68]. The optimal number of genetic clusters (K) was identified using the ΔK method by Evanno et al. [69], which identifies the most likely number of clusters based on the second-order rate of change in the log probability of the data between successive K values. In addition, we visually assessed trends in the mean log-likelihood of the data [Mean LnP(K)] across K values to evaluate the consistency of the inferred clustering scenario. Both ΔK and Mean LnP(K) were calculated using the online tool StructureSelector [70]. Additionally, a map showing each population’s membership coefficients (Qi) in the inferred K clusters was generated to visualize the spatial distribution of genetic structure. The map was created using QGIS v. 3.16 [71].
2.5. Spatial Genetic Analysis and Sub-Regional Differentiation Among Populations
To evaluate how genetic variability is structured across geographic space in Q. trojana populations, we tested for isolation by distance (IBD) by assessing the correlation between genetic and geographic distances using a nonparametric Mantel test across the full dataset [72,73]. Given the non-linear spatial distribution of sampling sites, Slatkin’s linearized pairwise FST values [FST/(1 − FST)] were regressed against the natural logarithm of straight-line geographic distances (km). Additionally, a Mantel correlogram was generated to assess how genetic distance varies with geographic distance across multiple spatial scales. Considering the limited spatial extent of the study area (maximum distance between sites: ~120 km), we selected five distance classes. The analysis was performed using the R package ecodist (v. 2.1.3) [74]. The JPT population was excluded from IBD and subsequent analyses due to its small sample size (n = 5), which can lead to biased estimates. Given the presence of two geographically separated and ecologically distinct subregions within the study area (see Section 1 and Figure 1 and Table S1), we assessed IBD separately for NW and SE Murge to identify potential differences in spatial genetic patterns.
To assess how genetic variation is structured across hierarchical levels, we performed a hierarchical AMOVA comparing the two subregions (NW and SE Murge) using the R package ade4 (v. 1.7-24) [75]. The analysis partitioned genetic variation into three levels: among subregions, among populations within subregions, and within populations. Variance components were estimated, and their statistical significance was tested via 999 random permutations using the randtest function. To test for differences in population differentiation between the two subregions, we compared pairwise FST values computed among populations within each subregion using the Brunner–Munzel test, which does not require equal variances between groups [76].
2.6. Local and Global Patterns of Genetic Relatedness
Finally, to investigate fine-scale patterns of genetic structure, we estimated pairwise relatedness (r) between individual trees using the EMIBD9 software (v. 1.1.0.0) [77]. This program implements the joint likelihood estimator of Wang [77], which is specifically designed for small samples or datasets containing a high proportion of related individuals by jointly estimating allele frequencies and the nine condensed identity-by-descent coefficients through an expectation-maximization (EM) algorithm. Given that our dataset comprises 30 populations with variable sample sizes and a potentially high proportion of close relatives due to the species’ fragmented distribution and isolation, we used the joint EM estimator (EM_Method = 1), allowing simultaneous estimation of allele frequencies and IBD coefficients rather than relying on allele frequencies estimated from a large, unrelated reference sample. Inbreeding was allowed during the estimation (Inbreed = 1), such that all nine condensed IBD coefficients were estimated for each pair of individuals, and the EM algorithm was initialized with randomly generated IBD coefficients (RndDelta0 = 0), following the procedure described by Wang [77]. The joint estimation framework has been shown to provide accurate relatedness estimates even for very small sample sizes or datasets containing a high proportion of closely related individuals, conditions under which allele frequencies cannot be estimated reliably using conventional approaches. Since allele frequencies are estimated jointly with identity-by-descent coefficients, the method remains robust also when the effective sample size is reduced by missing genotypes, and has also been shown to perform well in highly genetically structured samples [77].
Relatedness was calculated at two levels: (1) within populations, by estimating relatedness among individuals sampled at the same site (i.e., intra-site comparisons), with results grouped by subregion; and (2) across the entire dataset by treating all individuals from all sites as a single population. This two-tiered approach enabled us to evaluate both local and global patterns of relatedness in Q. trojana populations. A relatedness value of r ≥ 0.25 was used as a conservative threshold to identify highly related dyads. This cutoff has been frequently adopted in microsatellite-based relatedness analyses [77], including studies on forest tree species, such as the analysis performed by Poljak et al. [78] on Castanea sativa using 10 microsatellite markers. We did not perform fine-scale dyadic relatedness assessments (e.g., distinguishing between first- and second-order relatives), because this would require a proper parentage analysis, which, in the case of forest trees characterized by pollen-mediated gene flow, would involve the use of a higher number of genetic markers, likely exceeding 30 loci [79].
3. Results
3.1. Genetic Diversity and Demographic History
A total of 546 Quercus trojana samples from 30 forest stands were successfully genotyped at the 10 SSR markers, nine stands from the North-Western (NW) Murge subregion and 21 stands from the South-Eastern (SE) Murge subregions. Micro-Checker excluded the presence of allelic drop-out or scoring errors. No evidence of systematic genotypic disequilibrium was observed between the selected loci.
In general, considerable variation in genetic diversity estimates was observed among populations (Table 1 and Figure 1).
Table 1.
Genetic diversity of Quercus trojana populations: mean no. of alleles per locus (Ao), mean no. of effective alleles per locus (Ae), no. of private alleles (Pa), allelic richness (Ar), private allelic richness (PAr), observed (Ho) and expected (He) heterozygosity, unbiased expected heterozygosity (uHe), within-population inbreeding coefficient (FIS), and among-population genetic differentiation (FST), as defined by [53]. Ar and PAr were calculated using rarefaction with a standardized sample size of N = 9. † Population JPT was excluded from the calculations of Ar and PAr because of its exceedingly small sample size (N = 5). Populations in bold are located in the North-Western Murge subregion; all others belong to South-Eastern Murge.
Allelic richness (Ar) ranged from 4.57 to 6.32 (mean 5.47), indicating low to moderate genetic diversity for a temperate tree species. The populations with the lowest Ar values were TDM (4.57), CMT (4.77), REM (4.8) and MAC (5.01). A similar pattern emerged for the observed number of alleles (Ao), although with larger variation due to differences in population size (range 4.80–8.40, mean 7.0; excluding JPT which showed an Ao of 3.2 but based only on 5 individuals). Private alleles (Pa) ranged from 0 to 8, with the highest value observed in MAC (8), but were generally low (mean 0.8). Similarly, private allelic richness (PAr) ranged from 0 to 0.36, with the highest value in MAC (0.36), followed by CMT (0.19), and a mean of 0.07. Unbiased expected heterozygosity (uHe) showed moderate to high values (mean 0.63), with most populations (27 out of 30) ranging from 0.60 to 0.70 and PAR showing the highest value (0.70). Only three populations showed lower values: JPT (0.52), TDM (0.56), and PIA (0.59). Moreover, allelic richness (Ar) differed significantly between the two subregions (Wilcoxon rank-sum test, W = 39, p = 0.030), with lower values observed in the NW Murge. However, considerable variance was detected within each subregion (Figure S2A). No significant differences in expected heterozygosity (uHe) were found between subregions.
The global inbreeding coefficient (FIS) was high and significant (FIS = 0.100, p < 0.001), with observed heterozygosity (Ho) lower than expected under Hardy–Weinberg equilibrium across populations (Table 1). At the population level, 14 out of 30 populations showed significant positive FIS values, with the highest in SOR (0.186), COL (0.159), and CRO (0.141). Genetic differentiation among populations was low but significant (global FST = 0.029, p < 0.001; Table 1).
Contemporary effective population size (Ne) showed a considerable variation among populations, ranging from 6 (in BSA) to infinite (Table 2). Nineteen of the 30 populations (63%) had point estimates of Ne below 500, although for six of these populations the upper 95% confidence interval extended to infinity. Among these, 12 (40% of the total) showed critically small estimates (Ne < 50). In addition to BSA, CMT also showed an extremely low Ne value (10.4). Bottleneck analyses revealed significant heterozygosity excess in PAR under the IAM model (p = 0.04), consistent with a recent bottleneck in this population, whereas no significant results were detected under the TPM model (Table 2). According to the Garza–Williamson Index (M-ratio), 17 out of 30 populations exhibited values below the 0.68 threshold (Table 2), generally considered indicative of a past bottleneck [59], with MAC, TDM, CMT, and GRA showing the lowest values (<0.60).
Table 2.
Sample size (N), estimated effective population size (Ne) with associated 95% confidence interval (Ne 95% CIs), probability of heterozygosity excess (BOTTLENECK), and Garza–Williamson (GW) index for the 30 Quercus trojana populations. Populations (Pop) shown in bold belong to the North-Western Murge subregion; all others belong to the South-Eastern Murge. Probability of heterozygosity excess is shown only for the IAM model, as all p-values for the TPM model were not significant. Significant Bottleneck p-values are highlighted in bold; GW index values < 0.68 (critical threshold) are marked with an asterisk (*).
3.2. Genetic Differentiation, Population Structure and Spatial Analysis
Pairwise FST values ranged from 0 to 0.097 (MAC-REM), with a mean of 0.025 (SD = 0.022), indicating low to moderate genetic differentiation among populations, with substantial variation among pairs (Table S3). The populations CMT, MAC, and TDM consistently showed the highest, significant, pairwise FST values in almost all comparisons (Table S3; Figure 2), suggesting greater genetic divergence from the other populations. Jost’s D values were highly similar to pairwise FST and were therefore not reported.
Figure 2.
Pairwise FST heatmap and dendrogram based on FST values among the 29 Quercus trojana populations, after excluding JPT (n = 5). The color scale ranges from 0 (white) to 0.097 (dark red).
The Discriminant Analysis of Principal Components (DAPC) and STRUCTURE analysis yielded consistent results, revealing two main gene pools and genetic divergence between two core populations (MAC and CMT) and the remaining populations, although some admixture was detected in a few populations (Figure 3 and Figures S1). Specifically, STRUCTURE identified K = 2 as the most likely number of clusters (Figure S1), with MAC and CMT showing high membership coefficients to the same genetic cluster (in grey; Q2 = 0.90 and 0.84, respectively) (Figure 3B,C).
Figure 3.
Population structure inferred for 30 Quercus trojana populations using data from 10 SSR markers. (A) Discriminant Analysis of Principal Components (DAPC) showing the genetic clustering of individuals based on the first two discriminant functions. (B) Estimated membership proportions (Q values) of individuals for K = 2 clusters inferred with STRUCTURE. (C) Map of population-level average membership proportions (Qi) for the inferred K = 2 clusters.
Hierarchical AMOVA revealed that the majority of genetic variation (95.24%) was distributed within populations, while 4.23% occurred among populations within subregions and 0.53% between the two subregions (NW and SE Murge) (Table 3). The overall fixation index for the among-population component relative to the total variance (ΦST = 0.048, p < 0.01) indicated low but significant genetic structure.
Table 3.
Results of the hierarchical analysis of molecular variance (AMOVA) considering the two subregions (North-Western vs. South-Eastern Murge). Genetic variation was partitioned into three hierarchical levels: among subregions, among populations within subregions, and within populations. Variance components, percentage of total variation, and ΦST statistics were estimated, and significance was assessed using 999 random permutations (* = p < 0.05; ** = p < 0.01).
The Mantel test for isolation by distance (IBD), computed on the whole dataset using Slatkin’s linearized pairwise FST values, showed a moderate but statistically significant correlation between genetic and geographic distances (Mantel r = 0.321, p = 0.004; Figure 4A). Mantel correlograms based on five distance classes revealed significant spatial autocorrelation for the three smallest distance classes (0–8.5 km), whereas no significant association was detected at larger geographic distances (Figure 4B). When IBD was computed separately for the two subregions, no significant correlation was observed for NW Murge (Mantel r = −0.028, p > 0.05) (Figure 4C), whereas the correlation remained significant and was slightly higher for SE Murge (Mantel r = 0.353, p = 0.003) (Figure 4D).
Figure 4.
Isolation by distance (IBD) in Quercus trojana populations. (A) Mantel test performed on the full dataset using Slatkin’s linearized pairwise FST values [FST/(1 − FST)] and the natural logarithm of straight-line geographic distances. (B) Mantel correlogram showing the relationship between genetic and geographic distance across five distance classes, with black circles indicating distance classes showing significant correlation (p < 0.05). (C) Mantel test performed for the North-Western Murge subregion. (D) Mantel test performed for the South-Eastern Murge subregion.
Pairwise FST values differed significantly between the two subregions (Brunner–Munzel test, p < 0.001; Figure S2B), with mean differentiation substantially higher in NW Murge (mean FST = 0.053) than in SE Murge (mean FST = 0.014). Moreover, the variance in pairwise FST values was significantly greater in NW Murge than in SE Murge (F-test, F = 9.87, p < 0.001), indicating that genetic differentiation is not only stronger but also more heterogeneous among populations in the northwestern subregion (Figure S2B).
3.3. Local and Global Patterns of Genetic Relatedness
At the population level, mean pairwise relatedness (r) among individuals within sampling sites was significantly higher in NW Murge (mean r = 0.087) than in SE Murge (mean r = 0.074; Wilcoxon rank-sum test, p = 0.008; Brunner–Munzel test, p = 0.011). The variance in relatedness values was also significantly greater in NW Murge (variance = 0.007) compared to SE Murge (variance = 0.005; F-test, p < 0.001), indicating that local relatedness is both higher and more variable among populations in the northwestern subregion (Figure 5A). This difference was most likely driven by a higher proportion of intermediate relatedness values (0.15 > r < 0.3) in NW Murge (19%) compared with SE Murge (14%).
Figure 5.
Pairwise relatedness (r) among Quercus trojana samples. (A) Violin plots showing the distribution of intra-site (i.e., within populations) relatedness values, grouped by subregion (North-Western Murge vs. South-Eastern Murge). (B) Bar plot showing, for each site, the number of pairwise comparisons with r ≥ 0.25 involving individuals from populations belonging to different subregions (inter-subregion comparisons).
In the global relatedness analysis, considering all sites without subregional distinction, 1619 out of 145,570 pairwise comparisons (1.11%) exhibited r ≥ 0.25, which can be used as a threshold for considering dyads as highly related based on microsatellite markers (see Section 2.6). Of these, 1133 (69.98%) corresponded to comparisons within the same subregion, including 158 (9.76%) involving individuals from the same sampling site, whereas 486 (30.02%) involved individuals from different subregions (i.e., inter-subregion comparisons), suggesting genetic connectivity between NW and SE Murge. Inter-subregion related dyads (r ≥ 0.25) were not evenly distributed across populations (Figure 5B). All populations in NW Murge contributed at least 29 such comparisons, with TDM, MAC, BPL, GIU, and BAQ exceeding 50. In SE Murge, PAP, BMF, COL, and CRO each accounted for more than 30 inter-subregion related dyads. Importantly, the number of inter-subregion-related comparisons was not correlated with sample size (Pearson’s correlation, r = 0.039, p > 0.05), indicating that these patterns are not simply an artifact of uneven sampling.
4. Discussion
4.1. Genetic Diversity and Demographic History: Evidence of Recent and Past Bottlenecks
To the best of our knowledge, the present study represents the most comprehensive evaluation of genetic diversity and population structure in Quercus trojana to date, covering 30 forest stands across its whole distribution range in Italy. The analysis of genetic diversity revealed significant variation among Q. trojana populations, with a clear distinction between the two subregions. Allelic richness (Ar) was significantly lower in North-Western (NW) Murge compared with South-Eastern (SE) Murge (Table 1, Figure 1 and Figure S2A), while unbiased expected heterozygosity (uHe) did not differ significantly between subregions. Reduced allelic richness but maintained heterozygosity is a pattern consistent with recent population declines or fragmentation [80,81]. Indeed, allelic richness is known to be more sensitive to population bottlenecks than heterozygosity, as rare alleles are lost more rapidly than overall heterozygosity [82]. The lower Ar values observed in NW Murge (e.g., TDM, CMT, and MAC; Table 1) suggest that these populations have undergone demographic reductions that have eroded overall allelic diversity. Three NW Murge populations (TDM, MAC, GIU) also exhibited significant positive FIS values (Table 1), consistent with a heterozygote deficit that may reflect inbreeding. Interestingly, MAC and CMT also exhibited the highest private allelic richness (PAr) values: this pattern could be explained as a result of genetic drift in isolated populations, where allele loss may be accompanied by the elevation of rare alleles to population-specific variants [83]. In contrast, the higher Ar values in SE Murge (e.g., SOR, SIG, and MPL) indicate greater long-term stability or larger effective population sizes in this subregion. The exceptionally high allelic richness observed in SOR (Ar = 6.32) and the high uHe values in several SE populations (e.g., LOC, 0.68; SIG, 0.66; Table 1) indicate genetically diverse populations that may represent important reservoirs of diversity, being of particular conservation value for preserving the adaptive potential of the species [84]. Nevertheless, 11 out of 21 SE Murge populations also showed significant positive FIS (Table 1). Apparently, this pattern may contradict the relatively high Ar observed in some of these same populations (e.g., SOR, MPL). However, these two metrics reflect different aspects of genetic variation and operate over partially different temporal scales. Ar primarily reflects the long-term accumulation and retention of alleles, being influenced by historical demographic processes such as population stability, long-term effective population size, and mutation-drift equilibrium. Conversely, FIS provides a measure of deviations from random mating within the sampled generation and may therefore be affected by more recent demographic processes, mating patterns, and population structure. Thus, the coexistence of high Ar and positive FIS values is not necessarily contradictory and may indicate the persistence of historically accumulated genetic diversity despite contemporary processes affecting heterozygosity. Although direct evidence is lacking for Q. trojana, the species is presumed to be predominantly outcrossing, as are most oaks [85]. Even if occasional self-fertilization may occur, in most long-lived trees selfed progeny are expected to experience strong inbreeding depression [86], therefore limiting the contribution of selfing to adult populations. Thus, the significant positive FIS values observed in some populations are unlikely to be primarily explained by selfing alone, but may instead reflect a combination of other processes, such as biparental inbreeding (i.e., mating between genetically related individuals), and recent demographic changes that increase the probability of mating among relatives. Such processes may generate heterozygote deficits while allowing the persistence of historically accumulated allelic diversity over relatively short timescales. As an alternative explanation, it should be noted that positive FIS values may also result from the Wahlund effect, i.e., a reduction in observed heterozygosity arising when a sample contains two or more genetically distinct subpopulations with different allele frequencies [87]. However, based on the STRUCTURE admixture patterns (Figure 3B), in the seven populations showing significant positive FIS (PAL, MPL, SOR, VER, PRE, PAP, TER), all individuals exhibit roughly similar and intermediate admixture proportions between the two genetic clusters, rather than a bimodal distribution of distinct ancestry classes. Although subtle spatial genetic substructure cannot be completely excluded, the absence of marked ancestry differences suggests that a pronounced Wahlund effect is unlikely to represent the main driver of the observed heterozygote deficits. The significant positive FIS values observed in several populations might also reflect the legacy of historical silvicultural practices. Specifically, the historical management of Q. trojana stands as coppice systems across several Murge areas might have influenced the genetic patterns observed in some populations. By relying on vegetative regeneration over successive cutting cycles, coppicing may alter stand demographic structure and the distribution of reproductive individuals, thereby increasing the influence of genetic drift and enhancing mating among related individuals. However, in this particular case, this shortcoming may have been less critical as, in coppice forestry in Italy, and in the Q. trojana woodlands of Apulia in particular, even where short rotations have been applied in the past, standard trees (matricine) have traditionally always been released. These are individuals grown from seed or propagated asexually, designated (among other things) for the production of acorns to feed livestock, and thus capable of reaching flowering stage and consequently producing pollen (the primary vector of gene flow). In any case, although our sampling protocol, with sampled trees separated by at least 30–50 m, minimizes the risk of sampling replicate ramets from the same clone, historical coppice-related persistence of demographic signatures in contemporary mating patterns cannot be excluded. Finally, sampling size should also be considered when interpreting population-specific FIS estimates. Although the number of sampled individuals in the 11 SE Murge populations showing significant positive FIS values (N = 17–20) is within the range commonly adopted in microsatellite-based population genetic studies, estimates based on a limited number of loci may still be affected by sampling variance [88]. Nevertheless, the consistent occurrence of significant heterozygote deficits across multiple populations suggests that sampling effects alone are unlikely to fully explain the observed pattern, although their contribution cannot be excluded.
Estimates of effective population size (Ne) revealed a highly heterogeneous demographic landscape. While 19 populations had Ne estimates below 500, for six of these the confidence intervals extended to infinity (Table 2), indicating that the precision of these estimates is limited. Twelve out of 30 populations exhibited critically small Ne values (<50), five of them being located in NW Murge (62.5%). In particular, BSA and CMT resulted in extremely low Ne estimates of 6 and 10.4, respectively. These low Ne estimates are in line with the reduced allelic richness observed in these populations, supporting the inference of demographic decline. Following the guidelines originally proposed by Franklin [89], in classical conservation genetics theory, Ne values below 50 are generally considered indicative of an increased risk of inbreeding and thus reduced short-term population viability, whereas values below approximately 500 may compromise the long-term maintenance of adaptive genetic variation, thereby posing threats to the long-term survival of populations. It should be noted, however, that in forest tree species, which are characterized by peculiar life-history, often large census size, and pollen-mediated gene flow, there is no consensus in the use of Ne as a genetic diversity indicator [90,91], as reliable Ne estimates are generally expected mainly for small and isolated populations, whereas large and interconnected populations may frequently yield inaccurate estimates [92]. However, many of the Q. trojana populations investigated here fall into the former category and, despite the methodological limitations described above, populations showing critically low Ne values (<50) deserve great attention. Low Ne estimates have been reported for other European oak species, particularly in marginal and isolated populations. For instance, in Quercus robur, a recent genetic survey across the Italian peninsula highlighted 10 populations with Ne < 500, three of which had Ne < 50; notably, the proportion of populations below these thresholds increased markedly from north to south [93]. Similarly, low Ne were estimated for four Belgian stands of Q. robur with a history of forest fragmentation (Ne = 20–60) [94], for a peripheral and isolated population of Q. pubescens in Poland (Ne ≈ 30) [95], and for Q. robur and Q. petrae in the Jamy forest reserve in Poland (Ne = 72–115) [96]. In nine populations (Table 2), Ne estimates resulted in “infinite” values. The linkage disequilibrium (LD) method can yield an infinite Ne when the observed LD is not significantly different from zero [56], indicating no detectable evidence of recent genetic drift and potentially implying a large contemporary population size. However, the power of the LD method to detect drift is influenced by sample size (N), as well as by marker characteristics and demographic history; thus, estimates from populations with small N should be interpreted cautiously, as they may result from limited statistical power. This is particularly relevant for BPL and REM (N = 12 and N = 9, respectively), which are two of the populations resulting in infinite Ne estimates, but also applies to other populations with low sample size (N) that yielded low-to-medium Ne values. Similarly, the wide confidence intervals obtained for the estimates in several populations also warrant caution. However, in the case of populations with low Ne estimates, it should also be emphasized that, since the sampling effort was constant across all sites, the low sample size reflects the fact that the species was indeed locally rare at those sites.
The Garza-Williamson index (M-ratio) provided further evidence of historical population reductions. This index is particularly useful for detecting ancient bottlenecks (up to 100 or even a few hundred generations ago), as it reflects a persistent reduction in the ratio of allele number to allele size range [59]. Seventeen populations exhibited M-ratio values below 0.68, i.e., the threshold proposed by Garza and Williamson as indicative of a past bottleneck [59], with MAC, TDM, CMT, and GRA showing the lowest values (<0.60). However, it should be noted that while 0.68 is widely adopted as a conventional threshold for bottleneck detection, it was derived from simulations based on specific mutation parameters and demographic assumptions, including a stable effective population size prior to the bottleneck [59]. Therefore, its limitations must be acknowledged, as deviations from these assumptions, such as variation in mutation rates among loci or complex demographic histories, as well as low sample size, may lead to false-positive or false-negative signals. Consequently, populations with M-ratio values close to this cutoff should be interpreted with caution. Nevertheless, the particularly low values detected for the above-mentioned populations and the concordance among multiple independent indicators provide stronger support for demographic declines. In particular, the combination of M-ratio values, reduced allelic richness, and small Ne estimates in some NW Murge populations (CMT, MAC, and TDM) suggests a history of sustained or repeated demographic contractions for Q. trojana in this subregion, a pattern further supported by the observation that three NW Murge populations (TDM, MAC, GIU) also showed evidence for inbreeding. In contrast, the significant heterozygosity excess detected for PAR under the IAM model points to a more recent bottleneck event, highlighting that this NW Murge population might have experienced only recent demographic decline; however, because the IAM model is more sensitive than the TPM model but also more prone to false positives [57], this signal should be interpreted with caution.
4.2. Genetic Differentiation and the Distinctiveness of Some NW Murge Populations
Overall genetic differentiation was low but significant (FST = 0.029, p < 0.001), with pairwise FST values being generally low (mean = 0.025), consistent with expectations for an outcrossing, long-lived tree species with effective gene flow [97]. However, the populations CMT, MAC, and TDM consistently showed the highest FST values in pairwise comparisons (Figure 2), indicating greater genetic divergence from the rest of the study populations. DAPC and STRUCTURE analyses confirmed this pattern, revealing a sharp genetic divergence between the MAC-CMT cluster and all other populations, although some admixture was detected in a few sites (Figure 3). The genetic distinctiveness of these two NW Murge populations aligns with their reduced allelic richness, low Ne, and evidence of past bottlenecks, suggesting that they represent isolated or historically fragmented units that have undergone divergence due to genetic drift. As an alternative explanation, human-mediated dispersal processes might have contributed to the observed bottlenecks and genetic divergence in these populations via founder effects, consistent with the occurrence of Q. trojana in the Murge region both in natural forest stands and as isolated trees or linear plantings within agricultural landscapes, including croplands, pastures, field boundaries, and rural roads.
Interestingly, the hierarchical AMOVA attributed only 0.53% of the genetic variation to differences between subregions (Table 3), whereas pairwise comparisons and clustering analyses clearly distinguished certain NW Murge populations (Figure 2 and Figure 3). This apparent discrepancy arises because AMOVA partitions genetic variation across the entire dataset, while the distinctiveness of CMT and MAC is driven by population-specific processes rather than a general subregional differentiation. Overall, the absence of a clear genetic break between the NW and SE Murge subregions suggests that broad-scale bioclimatic gradients are insufficiently pronounced to drive ecotypic differentiation, particularly given the homogenizing potential of long-distance pollen flow across a landscape without major physical barriers. Instead, the observed genetic structure is best explained by fine-scale microevolutionary processes, such as localized genetic drift, historical fragmentation, and stand-level demographic dynamics, that operate primarily at the level of individual forest stands and their immediate surrounding landscapes.
4.3. Spatial Genetic Patterns: Contrasting Isolation by Distance Between Subregions
The Mantel test across the whole dataset revealed a moderate but significant isolation by distance (IBD) pattern (Mantel r = 0.321), and Mantel correlograms showed significant spatial autocorrelation only for the smallest distance classes (0–8.5 km) (Figure 4A,B). This pattern is typical of species in which gene flow is restricted on a local scale, consistent with limited dispersal combined with past or occasional long-distance gene flow [98]. However, when IBD was analyzed separately for each subregion, a clear difference emerged. SE Murge exhibited a significant and slightly stronger IBD signal (Mantel r = 0.353), while NW Murge showed no significant correlation (Mantel r = −0.028) (Figure 4C,D). This difference was accompanied by a significantly higher mean pairwise FST in NW Murge (0.053) compared to SE Murge (0.014), as well as greater variance in FST values (Figure S2), indicating that genetic differentiation in this subregion is both stronger and more heterogeneous. The absence of an IBD signal in NW Murge suggests that genetic structure in this subregion is not primarily driven by geographic distance, but rather by historical fragmentation, localized genetic drift, and possibly barriers to gene flow not captured by Euclidean distance alone (e.g., habitat discontinuities and historical land use). In contrast, SE Murge appears to function as a more continuous demographic unit, where gene flow follows a classic isolation-by-distance model, consistent with the higher genetic diversity and larger effective population sizes observed in this subregion.
4.4. Fine-Scale Relatedness: Local Structure and Trans-Subregional Connectivity
The analysis of pairwise relatedness (r) among individuals provided further insight into demographic processes operating at local and regional scales. Mean relatedness within sampling sites was significantly higher in NW Murge (0.087) than in SE Murge (0.074), and the variance in relatedness was also greater in NW Murge (Figure 5A). This pattern, combined with a higher proportion of intermediate relatedness values (0.15–0.30) in NW Murge, suggests that populations in this subregion are characterized by a more pronounced local genetic structure, potentially reflecting smaller effective population sizes, greater isolation, restricted seed and pollen dispersal [98], or anthropogenic impact. Notably, these fine-scale genetic patterns align with the contrasting landscape characteristics of the two subregions: in NW Murge, Q. trojana populations are more fragmented and occur in a matrix of agricultural land, while greater habitat connectivity is observed among forest stands in SE Murge (see Section 1).
Overall, these results reveal that a substantial proportion of related individuals (approximately 30% of all related dyads) are shared between the two subregions, suggesting that gene flow or historical connectivity has occurred across the study area despite current fragmentation. Interestingly, several NW Murge populations (TDM, MAC, BPL, GIU, and BAQ) contributed disproportionately to inter-subregion relatedness, each with more than 50 comparisons involving highly related individuals from SE Murge (Figure 5B), and this pattern was not explained by sample size (Pearson’s correlation, r = 0.039, p = 0.975). The presence of highly related individuals across subregions suggests that some gene flow has occurred across the whole study area, despite current fragmentation and the genetic distinctiveness of some populations. Given that Macedonian oak has a long history of forest management in Italy [37], this pattern could also reflect human-mediated processes, such as past translocations of reproductive material (e.g., seeds or seedlings) across subregions. In the Murge area, this oak can be found not only in natural forest stands, but also as scattered isolated trees among cultivated fields and pastures, as well as in rows along field boundaries and rural roads. It is also conceivable that the historical network of transhumance routes (“tratturi”) acted as corridors for human-mediated spread, thereby contributing to the observed genetic connectivity between geographically distant populations. At first glance, the coexistence of significant genetic differentiation (e.g., high FST for CMT and MAC) and evidence of trans-subregional relatedness may appear contradictory. However, these findings are not mutually exclusive and reflect processes operating at different timescales. The relatedness signal captures relatively recent genealogical connections, likely within the last few generations, whereas differentiation metrics such as FST and the M-ratio reflect deeper, longer-term demographic processes. Thus, it is plausible that while some NW Murge populations (e.g., CMT and MAC) have been historically isolated and have diverged through genetic drift, ongoing or very recent gene flow, possibly mediated by pollen dispersal or human-mediated seed movement, has generated detectable individual relatedness across the landscape, without fully homogenizing allele frequencies.
4.5. Conservation Implications and Future Perspectives
The results of this study have significant implications for the conservation of Q. trojana in Italy. The critically low effective population sizes (Ne < 50) observed in 12 of 30 populations (Table 2) highlight the presence of forest stands vulnerable to genetic erosion and potentially more prone to inbreeding depression [99], raising concern about their future viability. This pattern was more pronounced in North-Western (NW) Murge where, beyond low Ne estimates in 62.5% of the sampled populations, reduced allelic richness, evidence of historical bottlenecks and higher within-population relatedness indicate that deforestation, land use change and long-term fragmentation have heavily affected the genetic diversity of several stands. Conversely, most populations in South-Eastern (SE) Murge maintained higher diversity (particularly in terms of allelic richness), larger effective population sizes (although bearing the methodological limitations discussed in Section 4.1), and a more continuous spatial genetic structure, making them valuable reservoirs of genetic variation.
From an in situ conservation perspective, the most straightforward candidate populations are those located within protected areas, being safeguarded from possible future land-use changes and subject to controlled management regimes (e.g., sustainable silviculture). Among these, in the NW Murge subregion, GIU (National Park of Alta Murgia), which exhibits the highest allelic richness (Ar = 5.66) in this subregion despite showing signs of inbreeding (positive FIS), and BPL (National Park of Alta Murgia; Ar = 5.54), which shows relatively high diversity, are noteworthy. In the SE Murge subregion, populations within protected areas that are characterized by high genetic diversity are SIG (in the Natural Reserve of the Murge Sud-orientali; Ar = 5.98) and SSV (in the Regional Natural Park of Terra delle Gravine; Ar = 5.52). However, a significant gap in protection is evident in both regions. Indeed, PAR, which is another one of the most diverse populations, is located outside natural parks, as is MAC, which harbors the highest private allelic richness in the entire dataset (PAr = 0.36); the latter deserves particular attention, as it harbors unique genetic variants that warrant protection. Similarly, in SE Murge, SOR (Ar = 6.32), the most diverse population, along with MPL and PAL (both ranking among the top five in terms of Ar), are currently not under protection of natural parks. Ideally, it would be desirable to establish new protected areas; alternatively, other conservation measures should be implemented to safeguard these genetically diverse forest stands. Additionally, the population BSA deserves high conservation priority, representing a critically small population (Ne = 6) within a protected area (Regional Natural Park of Terra delle Gravine) that may require immediate monitoring and active management to prevent further genetic erosion. Furthermore, for coppice-managed woodlands, future research should indeed more rigorously assess the legacies of historical silvicultural regimes on genetic parameters. In any case, provided that not all coppice woodlands (whether of Q. troiana or other species) have sufficient soil fertility to sustain generative regeneration once converted to high-forest, advocating tout court and generically the promotion of natural regeneration as a priority to counteract the effects of genetic drift, is not the best strategy. Rather, the promotion of modern coppice silviculture approaches and a landscape perspective to coppice forest management [100], should be considered. This would enhance soil fertility and biodiversity, maintain carbon sequestration capacity and the conservation of genetic variability of foundation tree populations. This is even more important in the Mediterranean environment where, due to disturbances (e.g., summer droughts, wildfires, grazing), coppicing has become the established management method ensuring forest regeneration in harsh conditions, and where the effects of climate change are further exacerbating the unpredictability of forest seed regeneration.
Ex situ measures can act as a complementary tool to in situ conservation, providing vital support to populations facing rapid environmental change. However, ex situ conservation in oaks faces a fundamental challenge: the seeds (acorns) are generally recalcitrant, meaning they do not tolerate the intense desiccation required for conventional conservation in germplasm banks [101]. Therefore, ex situ conservation strategies must rely on other approaches, the most traditional of which is the establishment of living collections. In this regard, parks could play an important role by establishing plantations with the help of forest nurseries present in some of them (such as in the Regional Park of the Murgia Materana). For ex situ seed collections, sampling should cover the entire distribution range, prioritizing populations with high levels of genetic diversity (see above) while also ensuring the inclusion of populations harboring rare or private genetic variants, in order to maximize the representation of the species’ overall genetic diversity. Within each selected population, seeds should be collected from an adequate number of spatially separated maternal trees (ideally >15, if possible), to maximize within-population genetic diversity while minimizing the sampling of closely related individuals [101].
Seed material collected from living collections or directly from natural forest stands can also be employed in afforestation and reforestation projects designed to preserve or improve habitat connectivity, which is fundamental to ensuring gene flow and supporting evolutionary-oriented conservation. In this regard, the North-Western (NW) Murge region, where most populations appear genetically depauperate and isolated, should be given the highest priority. Here, the goal should be to create stepping-stone populations between isolated sites, including the planting and preservation of scattered trees in agricultural areas, since these isolated trees may be crucial for pollen-mediated gene flow.
Lastly, we recommend establishing temporal monitoring of forest genetic indicators [102,103] across at least a representative subset of populations, with surveys repeated at the recommended interval of approximately 10 years [102] and potentially more frequently in populations with the lowest diversity. In these latter populations, if genetic erosion persists, assisted gene flow should be considered, and their gene pool should be prioritized for ex situ conservation. Importantly, any potential assisted gene flow interventions should be carefully evaluated to minimize the risk of introducing maladapted genotypes [104].
The use of nuclear microsatellite markers has proven to be a valuable and cost-effective tool for characterizing neutral diversity, gene flow, and recent demographic changes across the 30 Q. trojana populations examined, with the results being translated into targeted conservation strategies. However, future research should implement population genomic approaches (e.g., genome-wide SNP analyses), integrating them with environmental data to identify adaptive variation across the ecological gradients of different subregions, to better assess the evolutionary potential of populations to respond to ongoing climate change and other pressures. Moreover, genomic data could help to identify populations potentially vulnerable to future environmental changes by estimating genomic offset, i.e., the mismatch between current adaptive genetic variation and what is predicted to be optimal under future climatic conditions [105], and assess the potential effects of inbreeding on the fitness of populations. This will provide a more comprehensive understanding of the evolutionary potential of Q. trojana populations and support the development of effective conservation strategies for the long-term survival of this Mediterranean tree species.
Supplementary Materials
The following supporting information can be downloaded at: https://www.mdpi.com/article/10.3390/f17080901/s1, Figure S1: Inference of the most probable number of genetic clusters (K) using STRUCTURE. The ΔK statistic calculated according to the method of Evanno et al. [69] (second-order rate of change in the log-likelihood) is plotted as a function of K, based on 12 replicate runs for each K value; Figure S2: Comparison of genetic diversity and differentiation between the North-Western (NW) and South-Eastern (SE) Murge subregions. (A) Allelic richness (Ar) per population, calculated using rarefaction with a standardized sample size of N = 9, showing significantly higher values in SE Murge (Wilcoxon rank-sum test, p < 0.05). (B) Distribution of pairwise FST values within each subregion, showing significantly higher genetic differentiation among populations in NW Murge (Brunner–Munzel test, p < 0.001). The number of pairwise comparisons was N = 28 for NW_Murge and N = 210 for SE_Murge; Table S1: Description of the 30 Quercus trojana stands sampled in southern Italy, covering the North-Western (NW) Murge and South-Eastern (SE) Murge subregions: identification code, sampling location, number of trees, geographical coordinates (decimal degrees), and elevation. Populations in bold correspond to the 14 newly sampled populations included in this study. The remaining 16 populations were previously collected and analysed using six SSR markers by Carabeo et al. [18]; Table S2: Genetic characterization and polymorphism of the 10 selected SSR markers grouped into multiplexes A, B, C, and D for 546 Quercus trojana individuals across 30 populations. For each locus, the following parameters are reported: observed (Ao) and effective (Ae) number of alleles, number of private alleles (Pa), Shannon’s index (I), observed (Ho) and expected (He) heterozygosity, unbiased expected heterozygosity (uHe), within-population inbreeding coefficient (FIS), total-population inbreeding coefficient (FIT), among-population genetic differentiation (FST), and polymorphic information content (PIC); Table S3: Pairwise Fst matrix among populations (i.e., sampling sites). Below the diagonal, pairwise Fst values are reported; above the diagonal, significance of pairwise differentiation is indicated, with “+” denoting significant comparisons (p < 0.05) and “−” denoting non-significant comparisons. Pairwise Fst values were calculated according to the method of Weir and Cockerham using ARLEQUIN 3.5; statistical significance was assessed with 10,000 permutations, and resulting p-values were adjusted for multiple comparisons using false discovery rate (FDR [61]), as implemented in the ‘p.adjust’ R function.
Author Contributions
Conceptualization, A.M., F.A., C.M., P.P. and P.M.; methodology, A.M., F.A., C.M. and P.P.; software, A.M. and F.A.; formal analysis, A.M. and F.A.; samples collection, C.M., P.M., M.C., L.L. and F.C.; data curation, A.M., F.A. and C.M.; writing—original draft preparation, A.M. and F.A.; writing—review and editing, A.M., F.A., C.M., P.P., F.C. and P.M.; supervision, C.M.; project administration, C.M., P.P. and A.M.; funding acquisition, C.M. and P.P. All authors have read and agreed to the published version of the manuscript.
Funding
This research was funded under the National Recovery and Resilience Plan (NRRP), Mission 4 Component 2 Investment 1.4—Call for tender No. 3138 of 16 December 2021, rectified by Decree n. 3175 of 18 December 2021 of the Italian Ministry of University and Research funded by the European Union—NextGenerationEU; Award Number: Project code CN_00000033, Concession Decree No. 1034 of 17 June 2022 adopted by the Italian Ministry of the University and Research, CUP D33C22000960007, Project title “National Biodiversity Future Center—NBFC”. From January 2023 to December 2024, Francisco Alcaide was supported by a ‘Margarita Salas’ postdoctoral contract from the University of Extremadura, funded by the Spanish Ministry of Universities and European Funds under UNI/551/2022 aid (code 724).
Institutional Review Board Statement
The collection of leaf material for genetic analysis was made in accordance with international and national regulations.
Data Availability Statement
The SSR dataset generated and analyzed during the current study is publicly available at: https://doi.org/10.6084/m9.figshare.32406252. Further inquiries can be directed to the corresponding authors.
Acknowledgments
The authors warmly thank the command of the Biodiversity unit of Carabinieri, Martina Franca (TA, Italy), in the persons of Lieutenant Colonel Giovanni Notarnicola and the Chosen appointee Giuseppe Geronimo, for their support during the survey in the State Nature Reserve Murge Orientali. This study was funded by the National Biodiversity Future Center (NBFC) Project funded by the European Union—NextGenerationEU.
Conflicts of Interest
The authors declare no conflicts of interest.
Abbreviations
The following abbreviations are used in this manuscript:
| SSR | Short Sequence Repeat |
| IBD | Isolation By Distance |
| DAPC | Discriminant Analysis of Principal Components |
| AMOVA | Analysis of Molecular Variance |
| NW Murge | North-Western Murge |
| SE Murge | South-Eastern Murge |
References
- Breed, M.F.; Harrison, P.A.; Blyth, C.; Byrne, M.; Gaget, V.; Gellie, N.J.C.; Groom, S.V.C.; Hodgson, R.; Mills, J.G.; Prowse, T.A.A.; et al. The potential of genomics for restoring ecosystems and biodiversity. Nat. Rev. Genet. 2019, 20, 615–628. [Google Scholar] [CrossRef] [Scilit]
- FAO. Global Forest Resources Assessment 2020: Main Report; FAO: Rome, Italy, 2020. [Google Scholar] [CrossRef] [Scilit]
- Pinto, A.V.; Hansson, B.; Patramanis, I.; van Oosterhout, C. The impact of habitat loss and population fragmentation on genomic erosion. Conserv. Genet. 2024, 25, 49–57. [Google Scholar] [CrossRef] [Scilit]
- Newbold, T.; Hudson, L.N.; Hill, S.L.; Contu, S.; Lysenko, I.; Senior, R.A.; Börger, L.; Bennett, D.J.; Choimes, A.; Collen, B.; et al. Global effects of land use on local terrestrial biodiversity. Nature 2015, 520, 45–50. [Google Scholar] [CrossRef] [Scilit] [PubMed]
- Budde, K.B.; Nielsen, L.R.; Ravn, H.P.; Kjær, E.D. The natural evolutionary potential of tree populations to cope with newly introduced pests and pathogens—Lessons learned from forest health catastrophes in recent decades. Curr. For. Rep. 2016, 2, 18–29. [Google Scholar] [CrossRef] [Scilit]
- Alfaro, R.I.; Fady, B.; Vendramin, G.G.; Dawson, I.K.; Fleming, R.A.; Sáenz-Romero, C.; Lindig-Cisneros, R.A.; Murdock, T.; Vinceti, B.; Navarro, C.M.; et al. The role of forest genetic resources in responding to biotic and abiotic factors in the context of anthropogenic climate change. For. Ecol. Manag. 2014, 333, 76–83. [Google Scholar] [CrossRef] [Scilit]
- Alcaide, F.; Solla, A.; Mattioni, C.; Castellana, S.; Martín, M.Á. Adaptive diversity and drought tolerance in Castanea sativa assessed through EST-SSR genic markers. Forestry 2019, 92, 287–296. [Google Scholar] [CrossRef] [Scilit]
- Kremer, A.; Chen, J.; Lascoux, M. Chimes of resilience: What makes forest trees genetically resilient? New Phytol. 2025, 246, 1934–1951. [Google Scholar] [CrossRef] [Scilit] [PubMed]
- Laikre, L. Genetic diversity is overlooked in international conservation policy implementation. Conserv. Genet. 2010, 11, 349–354. [Google Scholar] [CrossRef] [Scilit]
- Minter, M.; O’Brien, D.; Cottrell, J.; Ennos, R.; Hill, J.K.; Hall, J. Exploring the potential for ‘Gene Conservation Units’ to conserve genetic diversity in wild populations. Ecol. Solut. Evid. 2021, 2, e12061. [Google Scholar] [CrossRef] [Scilit]
- Convention on Biological Diversity (CBD). Kunming–Montreal Global Biodiversity Framework; Secretariat of the Convention on Biological Diversity: Montreal, QC, Canada, 2022; Available online: https://www.cbd.int/doc/decisions/cop-15/cop-15-dec-04-en.pdf (accessed on 27 July 2026).
- Hoban, S.; Bruford, M.; D’Urban Jackson, J.; Lopes-Fernandes, M.; Heuertz, M.; Hohenlohe, P.A.; Paz-Vinas, I.; Sjögren-Gulve, P.; Segelbacher, G.; Vernesi, C.; et al. Genetic diversity targets and indicators in the CBD post-2020 Global Biodiversity Framework must be improved. Biol. Conserv. 2020, 248, 108654. [Google Scholar] [CrossRef] [Scilit]
- Klütsch, C.F.C.; Laikre, L. Closing the conservation genetics gap: Integrating genetic knowledge in conservation management to ensure evolutionary potential. In Closing the Knowledge-Implementation Gap in Conservation Science: Interdisciplinary Evidence Transfer Across Sectors and Spatiotemporal Scales; Ferreira, C.C., Klütsch, C.F.C., Eds.; Springer International Publishing: Cham, Switzerland, 2022; pp. 51–82. [Google Scholar] [CrossRef] [Scilit]
- Hoban, S.; Paz-Vinas, I.; Shaw, R.E.; Castillo-Reina, L.; da Silva, J.M.; Dewoody, J.A.; Ekblom, R.; Fedorca, A.; Forester, B.R.; Funk, W.C.; et al. DNA-based studies and genetic diversity indicator assessments are complementary approaches to conserving evolutionary potential. Conserv. Genet. 2024, 25, 1147–1153. [Google Scholar] [CrossRef] [Scilit]
- Feng, L.; Du, F.K. Landscape genomics in tree conservation under a changing environment. Front. Plant Sci. 2022, 13, 822217. [Google Scholar] [CrossRef] [Scilit] [PubMed]
- de Vries, S.M.G.; Alan, M.; Bozzano, M.; Burianek, V.; Collin, E.; Cottrell, J.; Ivankovic, M.; Kelleher, C.T.; Koskela, J.; Rotach, P.; et al. Pan-European Strategy for Genetic Conservation of Forest Trees and Establishment of a Core Network of Dynamic Conservation Units; European Forest Genetic Resources Programme (EUFORGEN); Bioversity International: Rome, Italy, 2015; p. xii + 40. Available online: http://www.euforgen.org/fileadmin/templates/euforgen.org/upload/Publications/Thematic_publications/EUFORGEN_FGR_conservation_strategy_web.pdf (accessed on 27 July 2026).
- Zielinski, J.; Petrova, A.; Tomaszewski, D. Quercus trojana subsp. yaltirikii (Fagaceae), a new subspecies from Southern Turkey. Willdenowia 2006, 36, 845–849. [Google Scholar] [CrossRef] [Scilit]
- Carabeo, M.; Simeone, M.C.; Cherubini, M.; Mattia, C.; Chiocchini, F.; Bertini, L.; Caruso, C.; La Mantia, T.; Villani, F.; Mattioni, C. Estimating the genetic diversity and structure of Quercus trojana Webb populations in Italy by SSRs: Implications for management and conservation. Can. J. For. Res. 2017, 47, 331–339. [Google Scholar] [CrossRef] [Scilit]
- Denk, T.; Grimm, G.W.; Manos, P.S.; Deng, M.; Hipp, A.L. An updated infrageneric classification of the oaks: Review of previous taxonomic schemes and synthesis of evolutionary patterns. In Oaks Physiological Ecology. Exploring the Functional Diversity of Genus Quercus L.; Gil-Pelegrín, E., Peguero-Pina, J.J., Sancho-Knapik, D., Eds.; Springer International Publishing: Cham, Switzerland, 2017; pp. 13–38. [Google Scholar] [CrossRef] [Scilit]
- Simeone, M.C.; Cardoni, S.; Piredda, R.; Imperatori, F.; Avishai, M.; Grimm, G.W.; Denk, T. Comparative systematics and phylogeography of Quercus section Cerris in Western Eurasia: Inferences from plastid and nuclear DNA variation. PeerJ 2018, 6, e5793. [Google Scholar] [CrossRef] [Scilit] [PubMed]
- Hubert, F.; Grimm, G.W.; Jousselin, E.; Berry, V.; Franc, A.; Kremer, A. Multiple nuclear genes stabilize the phylogenetic backbone of the genus Quercus. Syst. Biodivers. 2014, 12, 405–423. [Google Scholar] [CrossRef] [Scilit]
- Hipp, A.L.; Manos, P.S.; Hahn, M.; Avishai, M.; Bodénès, C.; Cavender-Bares, J.; Crowl, A.A.; Deng, M.; Denk, T.; Fitz-Gibbon, S.; et al. Genomic landscape of the global oak phylogeny. New Phytol. 2020, 226, 1198–1212. [Google Scholar] [CrossRef] [Scilit] [PubMed]
- Jalas, J.; Suominen, J. Atlas Florae Europaeae: Volume 3: Distribution of Vascular Plants in Europe; Cambridge University Press: Cambridge, UK, 1988; Volume 3. [Google Scholar]
- Carrero, C.; Jerome, D.; Beckman, E.; Byrne, A.; Coombes, A.J.; Deng, M.; González-Rodríguez, A.; Van Sam, H.; Khoo, E.; Nguyen, N.; et al. The Red List of Oaks 2020; The Morton Arboretum: Lisle, IL, USA, 2020; Available online: https://mortonarb.org/app/uploads/2021/05/RedListOaks2020.pdf (accessed on 27 July 2026).
- Caudullo, G.; Welk, E.; San-Miguel-Ayanz, J. Chorological maps for the main European woody species. Data Brief 2017, 12, 662–666. [Google Scholar] [CrossRef] [Scilit] [PubMed]
- Bozzano, M.; Turok, J. (Eds.) Mediterranean Oaks Network: Report of the Second Meeting, 2–4 May 2002—Gozo, Malta; International Plant Genetic Resources Institute: Rome, Italy, 2003; Available online: https://cgspace.cgiar.org/bitstreams/26810999-bd4d-412f-b810-fc00ee647672/download (accessed on 27 July 2026).
- Colamonico, C. Aspetti Geografici Sulla Puglia; Amministrazione Provinciale di Bari: Bari, Italy, 1971; 466p. [Google Scholar]
- Bianco, P. Fiori Spontanei di Murgia; Regione Puglia, Assessorato alla Cultura e P.I. C.R.S.E.C. BA/7: Cassano delle Murge, Italy, 1990. [Google Scholar]
- Cocozza Talia, M.C.; La Viola, A.M.F. Aspetti climatici e vegetazionali della Lama S. Giorgio. Options Méditerranéennes Sér. A Sémin. Méditerranéens (CIHEAM) 2000, 53, 261–273. Available online: http://om.ciheam.org/om/pdf/c53/01002039.pdf (accessed on 27 July 2026).
- Chiatante, G. Nesting ecology of lesser grey and woodchat shrikes in Apulia, Southern Italy. Avocetta 2020, 44, 2. [Google Scholar] [CrossRef] [Scilit]
- Terzi, M.; Forte, L.; Cavallaro, V.; Lattanzi, A.; Macchia, F. Ecological factors of biodiversity for the Mediterranean steppic grassland of Murgia (Apulia Italy). Options Méditerranéennes Sér. A Sémin. Méditerranéens (CIHEAM) 2001, 47, 73–90. [Google Scholar]
- Di Pietro, R.; Misano, G. Analisi fitosociologica e considerazioni sintassonomiche sulla vegetazione forestale delle gravine occidentali dell’arco Ionico (Murge Pugliesi e Lucane, Italia Meridionale). Inf. Bot. Ital. 2009, 41, 215–246. [Google Scholar]
- Giardina, G.; La Mantia, T.; Sala, G.; Di Leo, C.; Pasta, S. Possibile origine e consistenza di un popolamento di Quercus trojana Webb subsp. trojana (Fagaceae) nel bosco della Ficuzza (Palermo, Sicilia). Nat. Sicil. 2014, 38, 265–290. [Google Scholar]
- Amico, A. Fitostoria descrittiva della provincia di Bari. Atti e Relazioni dell’Accademia Pugliese delle Scienze. Sci. Fis. Med. Nat. 1954, 52, 365–640. [Google Scholar]
- Francini Corti, E. Aspetti della vegetazione pugliese e contingente paleoegeico meridionale della Puglia. Ann. Accad. Ital. Sci. For. 1966, 15, 137–193. [Google Scholar]
- Fiore, T. Un Popolo di Formiche; Nuova Palomar: Bari, Italy, 2020. [Google Scholar]
- Misano, G.; Di Pietro, R. L’Habitat 9250 “Boschi a Quercus trojana” in Italia. Fitosociologia 2007, 44, 235–238. [Google Scholar]
- Steinkellner, H.; Fluch, S.; Turetschek, E.; Lexer, C.; Streiff, R.; Kremer, A.; Burg, K.; Glössl, J. Identification and characterization of (GA/CT)n-microsatellite loci from Quercus petraea. Plant Mol. Biol. 1997, 33, 1093–1096. [Google Scholar] [CrossRef] [Scilit] [PubMed]
- Steinkellner, H.; Lexer, C.; Turetschek, E.; Glössl, J. Conservation of (GA)n microsatellite loci between Quercus species. Mol. Ecol. 1997, 6, 1189–1194. [Google Scholar] [CrossRef] [Scilit]
- Barreneche, T.; Casasoli, M.; Russell, K.; Akkak, A.; Meddour, H.; Plomion, C.; Villani, F.; Kremer, A. Comparative mapping between Quercus and Castanea using Simple-Sequence Repeats (SSRs). Theor. Appl. Genet. 2004, 108, 558–566. [Google Scholar] [CrossRef] [Scilit] [PubMed]
- Casasoli, M.; Pot, D.; Plomion, C.; Monteverdi, M.C.; Barreneche, T.; Lauteri, M.; Villani, F. Identification of QTLs affecting adaptive traits in Castanea sativa Mill. Plant Cell Environ. 2004, 27, 1088–1101. [Google Scholar] [CrossRef] [Scilit]
- Martín, A.; Alcaide, F.; González, R.; Cuenca, B.; Ocaña, L.; Luquero, L.; Pérez, F.; Solla, A. Diversidad genética y estructura poblacional de Quercus ilex y Q. suber en España. In Proceedings of the 8º Congreso Forestal Español, Sociedad Española de Ciencias Forestales (SECF), Lleida, Spain, 27 June–1 July 2022; Paper 8CFE-1084. Available online: https://8cfe.congresoforestal.es/sites/default/files/actas/8CFE-1084.pdf (accessed on 27 July 2026).
- Assemar, F.E.; Alami, M.; Rabeh, K.; Medraoui, L.; El Antri, S.; Filali-Maltouf, A.; Belkadi, B. Genetic diversity and population structure in Quercus suber L. revealed by nuclear microsatellite markers and generation of a core collection. Tree Genet. Genomes 2024, 20, 5. [Google Scholar] [CrossRef] [Scilit]
- Van Oosterhout, C.; Hutchinson, W.F.; Wills, D.P.; Shipley, P. MICRO-CHECKER: Software for identifying and correcting genotyping errors in microsatellite data. Mol. Ecol. Notes 2004, 4, 535–538. [Google Scholar] [CrossRef] [Scilit]
- Excoffier, L.; Lischer, H.E. Arlequin Suite Ver 3.5: A new series of programs to perform population genetics analyses under Linux and Windows. Mol. Ecol. Res. 2010, 10, 564–567. [Google Scholar] [CrossRef] [Scilit] [PubMed]
- Nei, M. Analysis of gene diversity in subdivided populations. Proc. Natl. Acad. Sci. USA 1973, 70, 3321–3323. [Google Scholar] [CrossRef] [Scilit] [PubMed]
- Nei, M.; Roychoudhury, A.K. Sampling variances of heterozygosity and genetic distance. Genetics 1974, 76, 379–390. [Google Scholar] [CrossRef] [Scilit] [PubMed]
- Peakall, R.; Smouse, P.E. GenAlEx 6.5: Genetic analysis in Excel. Population genetic software for teaching and research—An update. Bioinformatics 2012, 28, 2537–2539. [Google Scholar] [CrossRef] [Scilit] [PubMed]
- Kalinowski, S.T. Counting alleles with rarefaction: Private alleles and hierarchical sampling designs. Conserv. Genet. 2004, 5, 539–543. [Google Scholar] [CrossRef] [Scilit]
- El Mousadik, A.; Petit, R.J. High level of genetic differentiation for allelic richness among populations of the argan tree [Argania spinosa (L.) Skeels] endemic to Morocco. Theor. Appl. Genet. 1996, 92, 832–839. [Google Scholar] [CrossRef] [PubMed]
- Kalinowski, S.T. HP-RARE 1.0: A computer program for performing rarefaction on measures of allelic richness. Mol. Ecol. Notes 2005, 5, 187–189. [Google Scholar] [CrossRef] [Scilit]
- Wilcoxon, F. Individual comparisons by ranking methods. Biom. Bull. 1945, 1, 80–83. [Google Scholar] [CrossRef] [Scilit]
- Weir, B.S.; Cockerham, C.C. Estimating F-statistics for the analysis of population structure. Evolution 1984, 38, 1358–1370. [Google Scholar] [CrossRef] [Scilit] [PubMed]
- Excoffier, L.; Smouse, P.E.; Quattro, J.M. Analysis of molecular variance inferred from metric distances among DNA haplotypes: Application to human mitochondrial DNA restriction data. Genetics 1992, 131, 479–491. [Google Scholar] [CrossRef] [Scilit] [PubMed]
- Hill, W.G. Estimation of effective population size from data on linkage disequilibrium. Genet. Res. 1981, 38, 209–216. [Google Scholar] [CrossRef] [Scilit]
- Do, C.; Waples, R.S.; Peel, D.; Macbeth, G.M.; Tillett, B.J.; Ovenden, J.R. NeEstimator V2: Re-implementation of software for the estimation of contemporary effective population size (Ne) from genetic data. Mol. Ecol. Res. 2014, 14, 209–214. [Google Scholar] [CrossRef] [Scilit] [PubMed]
- Cornuet, J.M.; Luikart, G. Description and power analysis of two tests for detecting recent population bottlenecks from allele frequency data. Genetics 1996, 144, 2001–2014. [Google Scholar] [CrossRef] [Scilit] [PubMed]
- Piry, S.; Luikart, G.; Cornuet, J.M. BOTTLENECK: A computer program for detecting recent reductions in the effective size using allele frequency data. J. Hered. 1999, 90, 502–503. [Google Scholar] [CrossRef] [Scilit]
- Garza, J.C.; Williamson, E.G. Detection of reduction in population size using data from microsatellite loci. Mol. Ecol. 2001, 10, 305–318. [Google Scholar] [CrossRef] [Scilit] [PubMed]
- Warnes, G.; Bolker, B.; Bonebakker, L.; Gentleman, R.; Huber, W.; Liaw, A.; Lumley, T.; Maechler, M.; Magnusson, A.; Moeller, S.; et al. gplots: Various R programming tools for plotting data; R package version 3.3.0. 2025. Available online: https://github.com/talgalili/gplots (accessed on 27 July 2026).
- Benjamini, Y.; Hochberg, Y. Controlling the false discovery rate: A practical and powerful approach to multiple testing. J. R. Stat. Soc. Ser. B 1995, 57, 289–300. [Google Scholar] [CrossRef] [Scilit]
- Winter, D.J. MMOD: An R library for the calculation of population differentiation statistics. Mol. Ecol. Res. 2012, 12, 1158–1160. [Google Scholar] [CrossRef] [Scilit] [PubMed]
- Jombart, T.; Ahmed, I. Adegenet 1.3-1: New tools for the analysis of genome-wide SNP data. Bioinformatics 2011, 27, 3070–3071. [Google Scholar] [CrossRef] [Scilit] [PubMed]
- Pritchard, J.K.; Stephens, M.; Donnelly, P. Inference of population structure using multilocus genotype data. Genetics 2000, 155, 945–959. [Google Scholar] [CrossRef] [Scilit] [PubMed]
- Falush, D.; Stephens, M.; Pritchard, J.K. Inference of population structure using multilocus genotype data: Linked loci and correlated allele frequencies. Genetics 2003, 164, 1567–1587. [Google Scholar] [CrossRef] [Scilit] [PubMed]
- Falush, D.; Stephens, M.; Pritchard, J.K. Inference of population structure using multilocus genotype data: Dominant markers and null alleles. Mol. Ecol. Notes 2007, 7, 574–578. [Google Scholar] [CrossRef] [Scilit] [PubMed]
- Hubisz, M.J.; Falush, D.; Stephens, M.; Pritchard, J.K. Inferring weak population structure with the assistance of sample group information. Mol. Ecol. Res. 2009, 9, 1322–1332. [Google Scholar] [CrossRef] [Scilit] [PubMed]
- Kopelman, N.M.; Mayzel, J.; Jakobsson, M.; Rosenberg, N.A.; Mayrose, I. CLUMPAK: A program for identifying clustering modes and packaging population structure inferences across K. Mol. Ecol. Res. 2015, 15, 1179–1191. [Google Scholar] [CrossRef] [Scilit] [PubMed]
- Evanno, G.; Regnaut, S.; Goudet, J. Detecting the number of clusters of individuals using the software STRUCTURE: A simulation study. Mol. Ecol. 2005, 14, 2611–2620. [Google Scholar] [CrossRef] [Scilit] [PubMed]
- Li, Y.L.; Liu, J.X. StructureSelector: A web-based software to select and visualize the optimal number of clusters using multiple methods. Mol. Ecol. Res. 2018, 18, 176–177. [Google Scholar] [CrossRef] [Scilit] [PubMed]
- QGIS Development Team. QGIS Geographic Information System; Version 3.16; Open Source Geospatial Foundation: Beaverton, OR, USA, 2021; Available online: https://qgis.org (accessed on 27 July 2026).
- Mantel, N. The detection of disease clustering and a generalized regression approach. Cancer Res. 1967, 27, 209–220. [Google Scholar] [PubMed]
- Smouse, P.E.; Long, J.C.; Sokal, R.R. Multiple regression and correlation extensions of the Mantel test of matrix correspondence. Syst. Zool. 1986, 35, 627–632. [Google Scholar] [CrossRef] [Scilit] [PubMed]
- Goslee, S.C.; Urban, D.L. The Ecodist package for dissimilarity-based analysis of ecological data. J. Stat. Softw. 2007, 22, 1–19. [Google Scholar] [CrossRef] [Scilit]
- Dray, S.; Dufour, A.B. The Ade4 package: Implementing the duality diagram for ecologists. J. Stat. Softw. 2007, 22, 1–20. [Google Scholar] [CrossRef] [Scilit]
- Brunner, E.; Munzel, U. The nonparametric Behrens-Fisher problem: Asymptotic theory and a small-sample approximation. Biometr. J. 2000, 42, 17–25. [Google Scholar] [CrossRef]
- Wang, J. A joint likelihood estimator of relatedness and allele frequencies from a small sample of individuals. Methods Ecol. Evol. 2022, 13, 2443–2462. [Google Scholar] [CrossRef] [Scilit]
- Poljak, I.; Idžojtic, M.; Šatovic, Z.; Ježic, M.; Curkovic-Perica, M.; Simovski, B.; Kovacevic, V.; Liber, Z. Genetic diversity of the sweet chestnut (Castanea sativa Mill.) in Central Europe and the western part of the Balkan Peninsula and evidence of marron genotype introgression into wild populations. Tree Genet. Genomes 2017, 13, 18. [Google Scholar] [CrossRef] [Scilit]
- Stone, J.; Björklund, M. DELRIOUS: A computer program designed to analyse molecular marker data and calculate delta and relatedness estimates with confidence. Mol. Ecol. Notes 2001, 1, 209–212. [Google Scholar] [CrossRef] [Scilit]
- Allendorf, F.W. Genetic drift and the loss of alleles versus heterozygosity. Zoo Biol. 1986, 5, 181–190. [Google Scholar] [CrossRef] [Scilit]
- Broquet, T.; Angelone, S.; Jaquiery, J.; Joly, P.; Lena, J.-P.; Lengagne, T.; Plenet, S.; Luquet, E.; Perrin, N. Genetic bottlenecks driven by population disconnection. Conserv. Biol. 2010, 24, 1596–1605. [Google Scholar] [CrossRef] [Scilit] [PubMed]
- Nei, M.; Maruyama, T.; Chakraborty, R. The bottleneck effect and genetic variability in populations. Evolution 1975, 29, 1–10. [Google Scholar] [CrossRef] [Scilit] [PubMed]
- Young, A.; Boyle, T.; Brown, T. The population genetic consequences of habitat fragmentation for plants. Trends Ecol. Evol. 1996, 11, 413–418. [Google Scholar] [CrossRef] [Scilit] [PubMed]
- Jump, A.S.; Marchant, R.; Peñuelas, J. Environmental change and the option value of genetic diversity. Trends Plant Sci. 2009, 14, 51–58. [Google Scholar] [CrossRef] [Scilit] [PubMed]
- Ducousso, A.; Michaud, H.; Lumaret, R. Reproduction and gene flow in the genus Quercus L. Ann. For. Sci. 1993, 50, 91s–106s. [Google Scholar] [CrossRef] [Scilit]
- Husband, B.C.; Schemske, D.W. Evolution of the magnitude and timing of inbreeding depression in plants. Evolution 1996, 50, 54–70. [Google Scholar] [CrossRef] [Scilit]
- Zhivotovsky, L.A. Relationships between Wright’s FST and FIS statistics in a context of Wahlund effect. J. Hered. 2015, 106, 306–309. [Google Scholar] [CrossRef] [Scilit] [PubMed]
- Allendorf, F.W.; Funk, W.C.; Aitken, S.N.; Byrne, M.; Luikart, G. Conservation and the Genomics of Populations, 3rd ed.; Oxford University Press: Oxford, UK, 2022. [Google Scholar] [CrossRef] [Scilit]
- Franklin, I.R. Evolutionary changes in small populations. In Conservation Biology: An Evolutionary-Ecological Perspective; Soulé, M.E., Wilcox, B.A., Eds.; Sinauer Associates: Sunderland, MA, USA, 1980; pp. 135–149. [Google Scholar]
- Fady, B.; Bozzano, M. Effective population size does not make a practical indicator of genetic diversity in forest trees. Biol. Conserv. 2021, 253, 108904. [Google Scholar] [CrossRef] [Scilit]
- Hoban, S.; Paz-Vinas, I.; Aitken, S.; Bertola, L.D.; Breed, M.F.; Bruford, M.W.; Funk, W.C.; Grueber, C.E.; Heuertz, M.; Hohenlohe, P.; et al. Effective population size remains a suitable, pragmatic indicator of genetic diversity for all species, including forest trees. Biol. Conserv. 2021, 253, 108906. [Google Scholar] [CrossRef] [Scilit]
- Santos-del-Blanco, L.; Olsson, S.; Budde, K.B.; Grivet, D.; González-Martínez, S.C.; Alía, R.; Robledo-Arnuncio, J.J. On the feasibility of estimating contemporary effective population size (Ne) for genetic conservation and monitoring of forest trees. Biol. Conserv. 2022, 273, 109704. [Google Scholar] [CrossRef] [Scilit]
- Avanzi, C.; Bagnoli, F.; Romiti, E.; Spanu, I.; Tsuda, Y.; Vajana, E.; Brousseau, L.; Piotti, A. Latitudinal trends in genetic diversity and distinctiveness of Quercus robur rear edge forest remnants call for new conservation priorities. Divers. Distrib. 2025, 31, e70018. [Google Scholar] [CrossRef] [Scilit]
- Vranckx, G.; Jacquemyn, H.; Mergeay, J.; Cox, K.; Kint, V.; Muys, B.; Honnay, O. Transmission of Genetic Variation from the Adult Generation to Naturally Established Seedling Cohorts in Small Forest Stands of Pedunculate Oak (Quercus robur L.). For. Ecol. Manag. 2014, 312, 19–27. [Google Scholar] [CrossRef] [Scilit]
- Chybicki, I.J.; Oleksa, A.; Kowalkowska, K.; Burczyk, J. Genetic evidence of reproductive isolation in a remote enclave of Quercus pubescens in the presence of cross-fertile species. Plant Syst. Evol. 2012, 298, 1045–1056. [Google Scholar] [CrossRef] [Scilit]
- Sandurska, E.; Ulaszewski, B.; Burczyk, J. Genetic diversity and differentiation of coexisting populations of Quercus robur L. and Q. petraea (Matt.) Liebl. Acta Biol. Cracov. Ser. Bot. 2019, 61, 17–28. [Google Scholar] [CrossRef] [Scilit]
- Hamrick, J.L.; Godt, M.J.W.; Sherman-Broyles, S.L. Factors influencing levels of genetic diversity in woody plant species. New For. 1992, 6, 95–124. [Google Scholar] [CrossRef] [Scilit]
- Vekemans, X.; Hardy, O.J. New insights from fine-scale spatial genetic structure analyses in plant populations. Mol. Ecol. 2004, 13, 921–935. [Google Scholar] [CrossRef] [Scilit] [PubMed]
- Frankham, R.; Ballou, J.D.; Ralls, K.; Eldridge, M.; Dudash, M.R.; Fenster, C.B.; Lacy, R.C.; Sunnucks, P. Genetic Management of Fragmented Animal and Plant Populations; Oxford University Press: Oxford, UK, 2017. [Google Scholar] [CrossRef] [Scilit]
- Mairota, P.; Manetti, M.C.; Amorini, E.; Pelleri, F.; Terradura, M.; Frattegiani, M.; Savini, P.; Grohmann, F.; Mori, P.; Terzuolo, P.G.; et al. Opportunities for coppice management at the landscape level: The Italian experience. iForest 2016, 9, 775–782. [Google Scholar] [CrossRef] [Scilit]
- George, J.P.; Kelleher, C.; Desgroux, A.; Scholzen, É.; Muheim, L.; Božic, G.; Bozzano, M.; Farsakoglou, A.M. Dynamic and Static ex situ Conservation: Minimum Requirements, Data Standards and Indicators for Monitoring; European Forest Institute: Barcelona, Spain, 2026. [Google Scholar] [CrossRef] [Scilit]
- Aravanopoulos, F.A.; Tollefsrud, M.M.; Graudal, L.; Koskela, J.; Kätzel, R.; Soto, A.; Nagy, L.; Pilipovic, A.; Zhelev, P.; Božic, G.; et al. Development of Genetic Monitoring Methods for Genetic Conservation Units of Forest Trees in Europe; European Forest Genetic Resources Programme (EUFORGEN); Bioversity International: Rome, Italy, 2015; xvi + 55p, Available online: https://www.euforgen.org/publications/publication/genetic-monitoring-methods-for-genetic-conservation-units-of-forest-trees-in-europe (accessed on 27 July 2026).
- Bajc, M.; Aravanopoulos, F.A.; Westergren, M.; Fussi, B.; Kavaliauskas, D.; Alizoti, P.; Kiourtsis, F.; Kraigher, H. (Eds.) Manual for Forest Genetic Monitoring; Slovenian Forestry Institute, Silva Slovenica Publishing Centre: Ljubljana, Slovenia, 2020. [Google Scholar] [CrossRef] [Scilit]
- Aitken, S.N.; Whitlock, M.C. Assisted gene flow to facilitate local adaptation to climate change. Annu. Rev. Ecol. Evol. Syst. 2013, 44, 367–388. [Google Scholar] [CrossRef] [Scilit]
- Rellstab, C.; Dauphin, B.; Exposito-Alonso, M. Prospects and limitations of genomic offset in conservation management. Evol. Appl. 2021, 14, 1202–1212. [Google Scholar] [CrossRef] [Scilit] [PubMed]
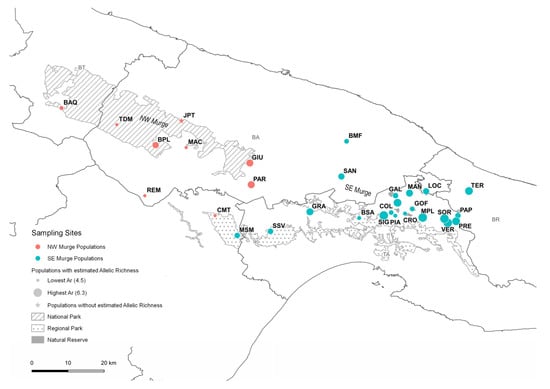
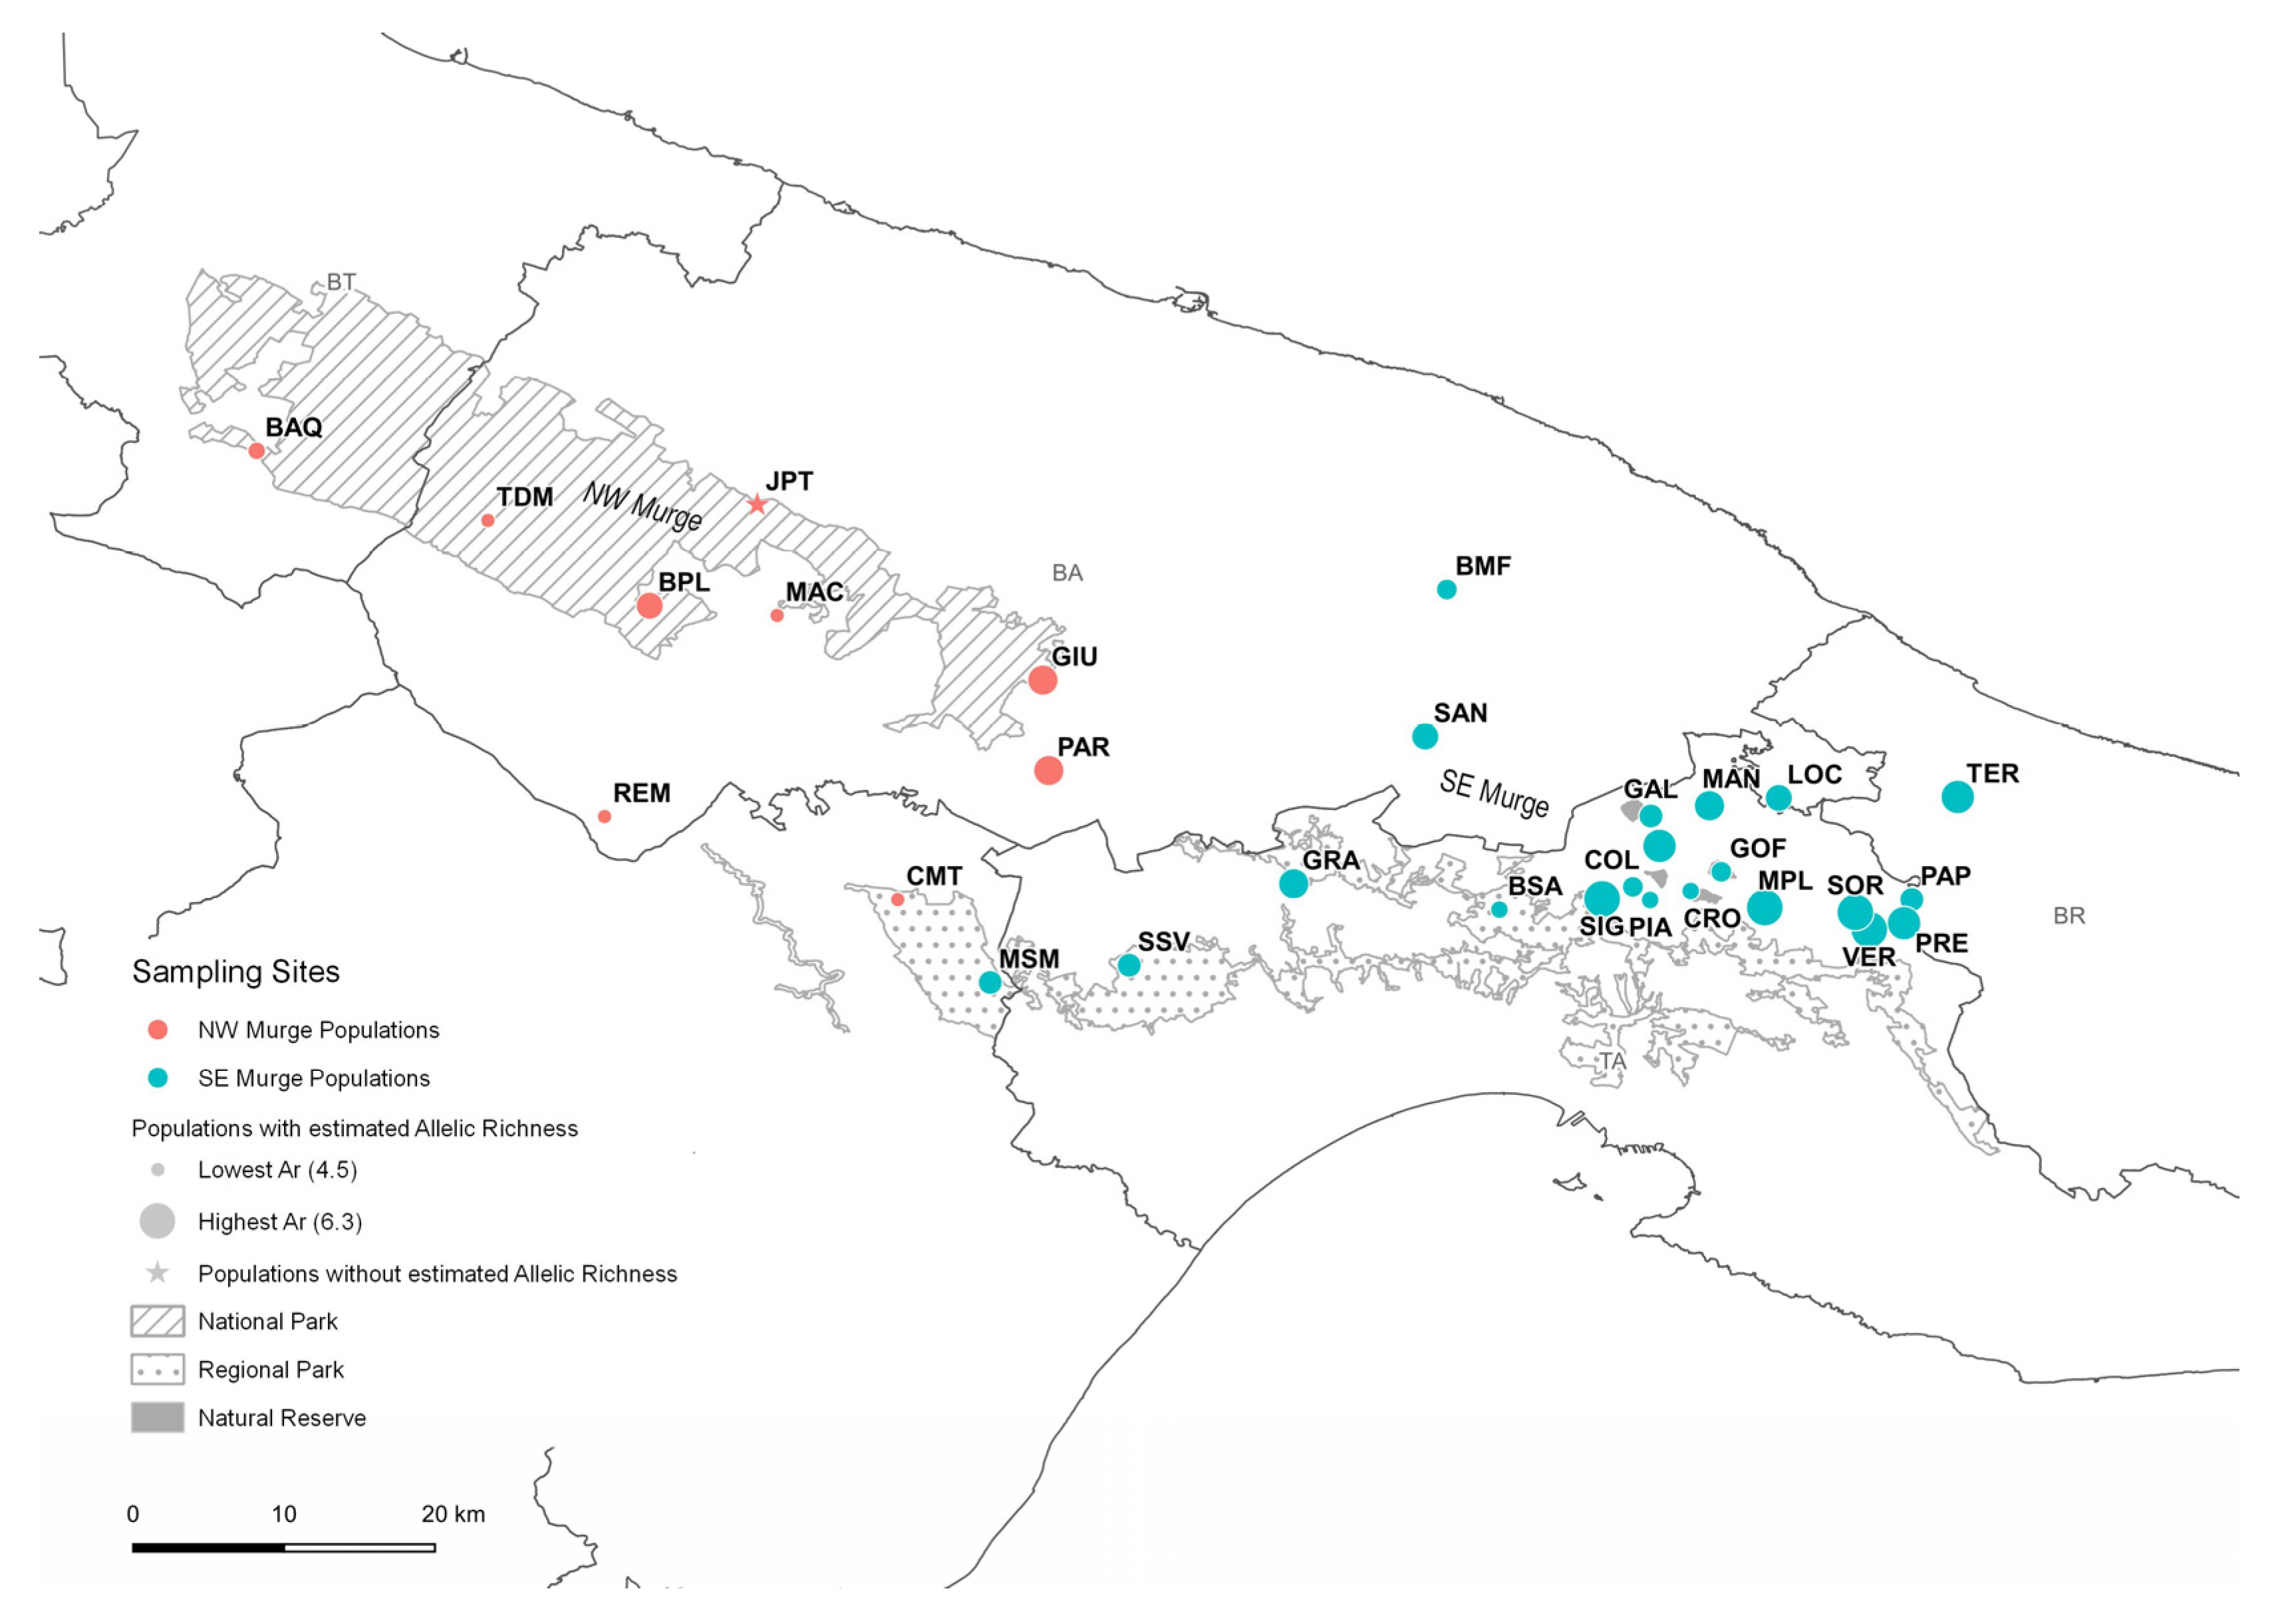
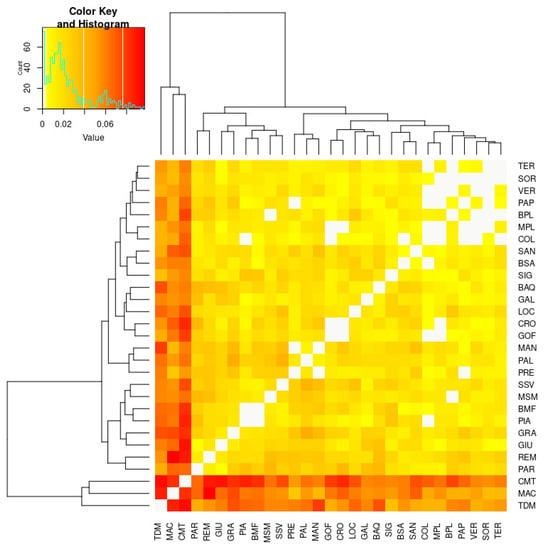
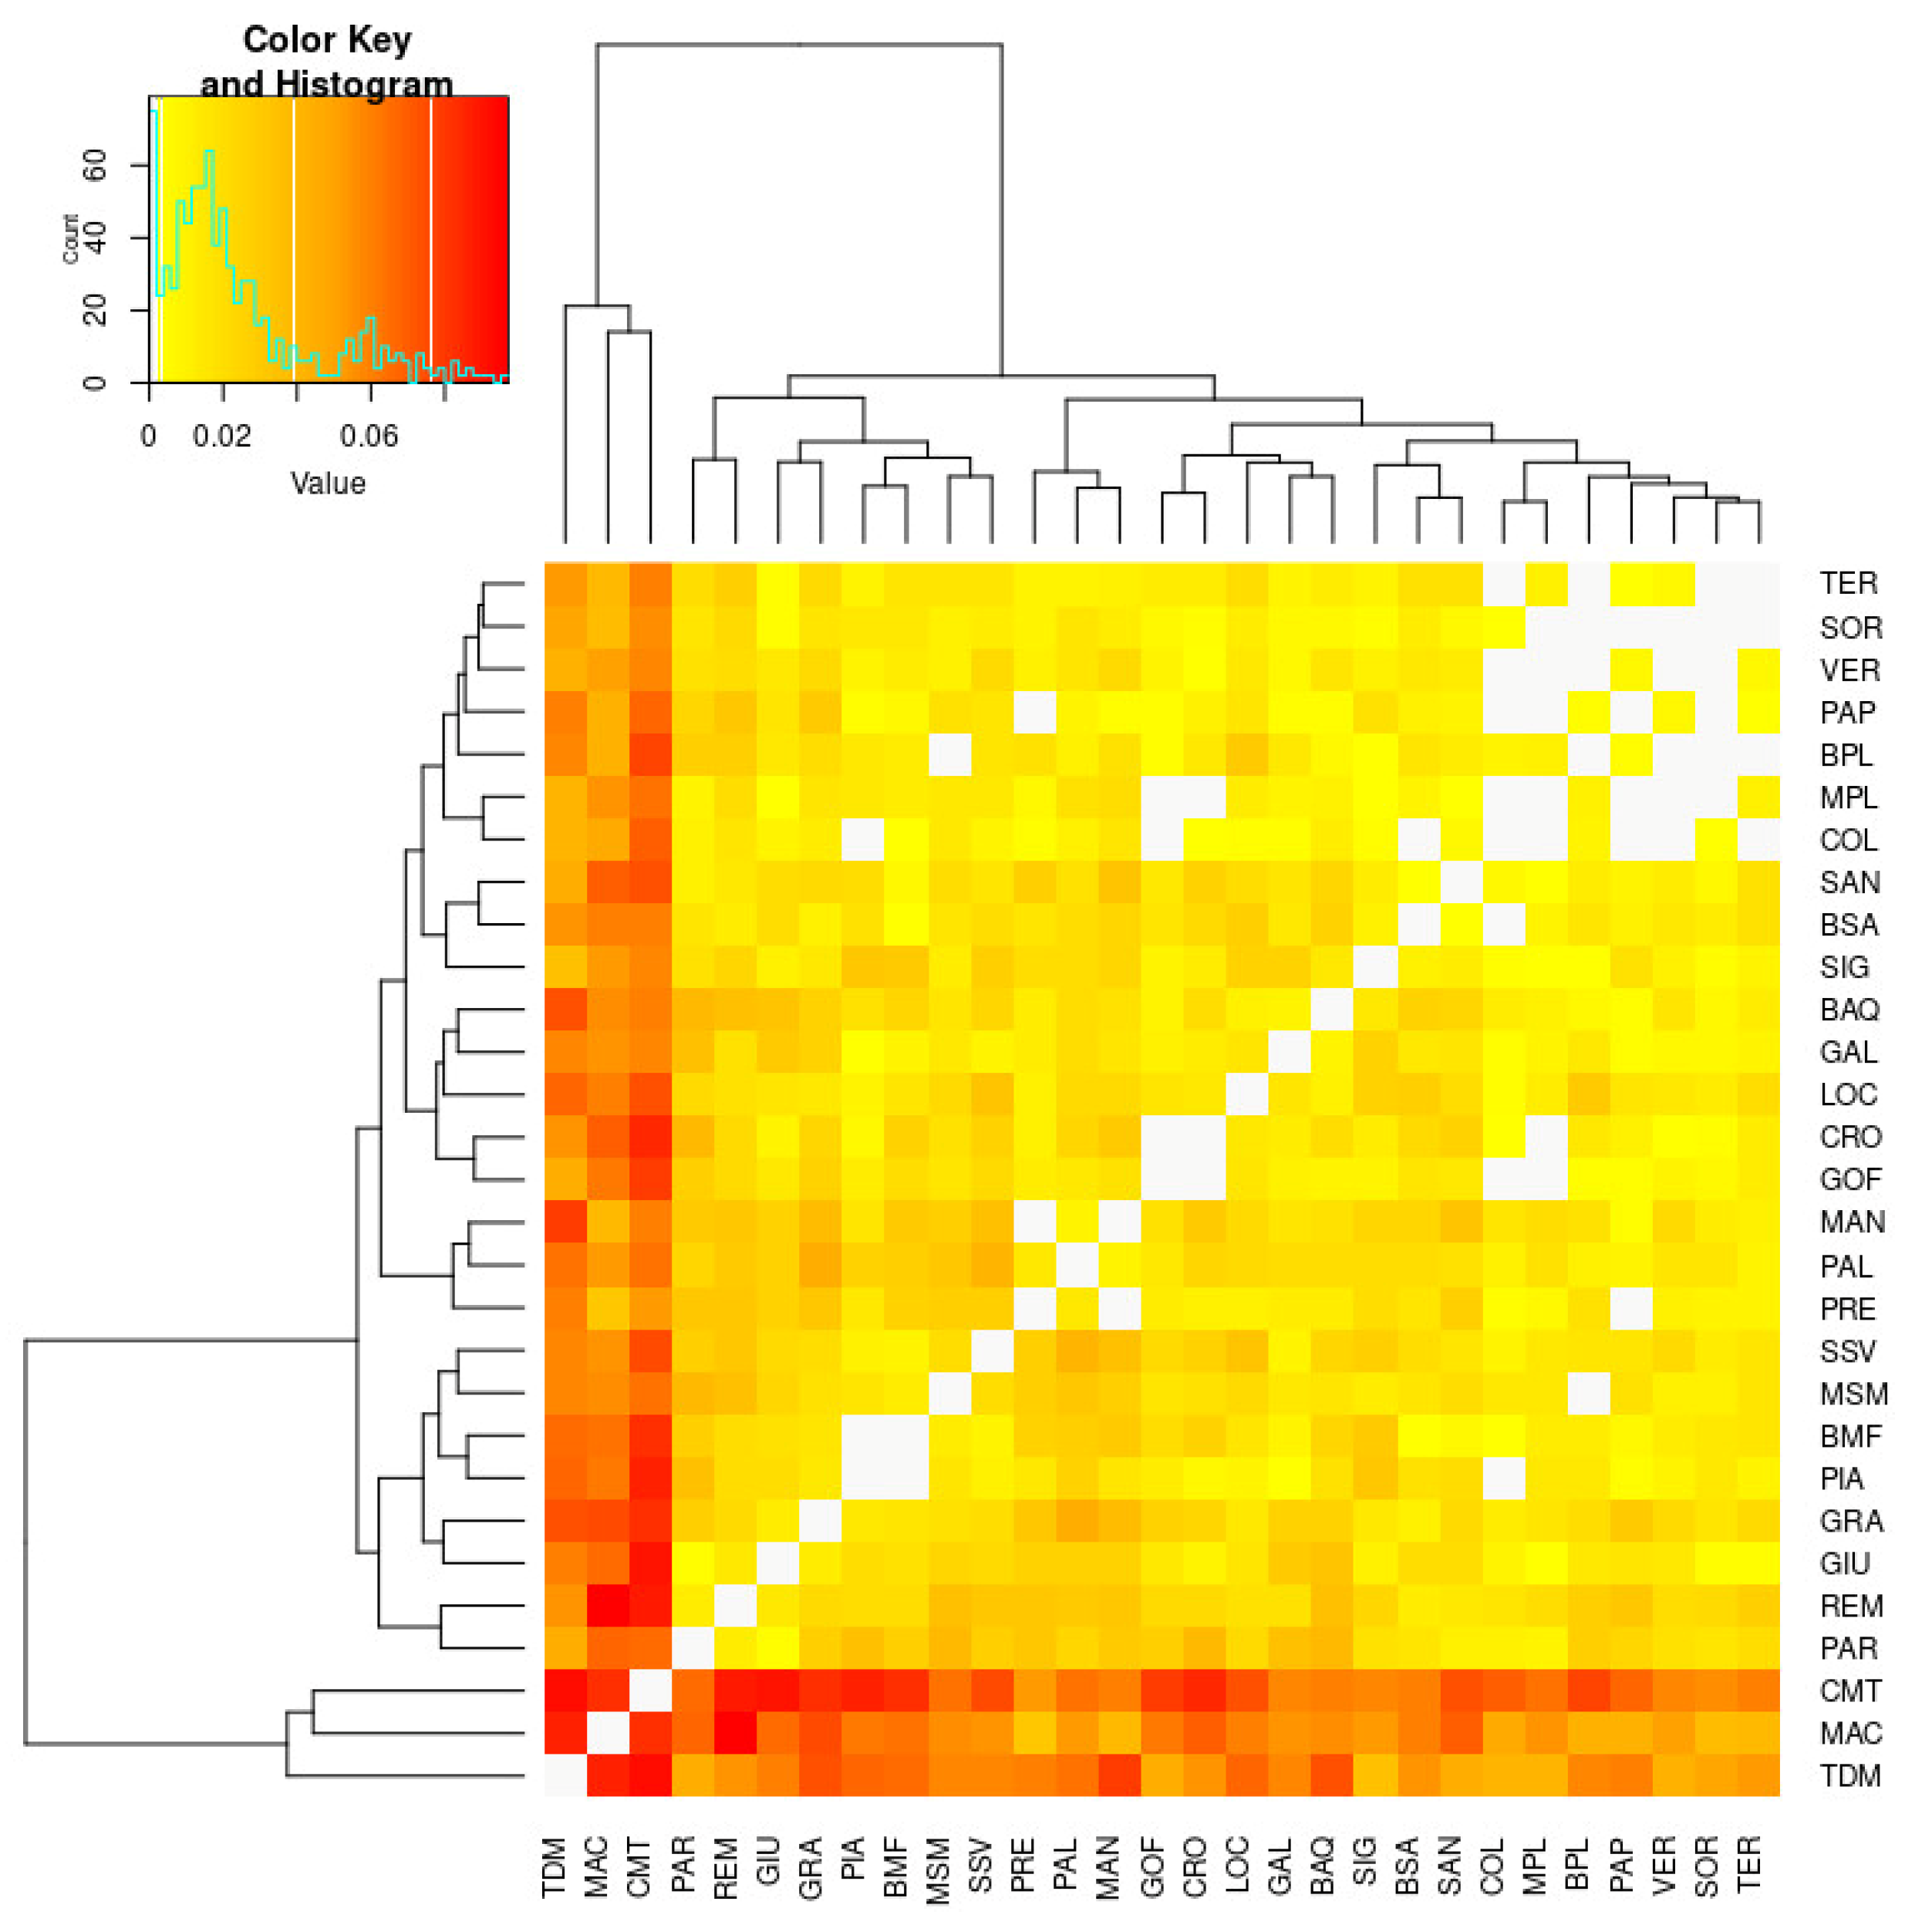
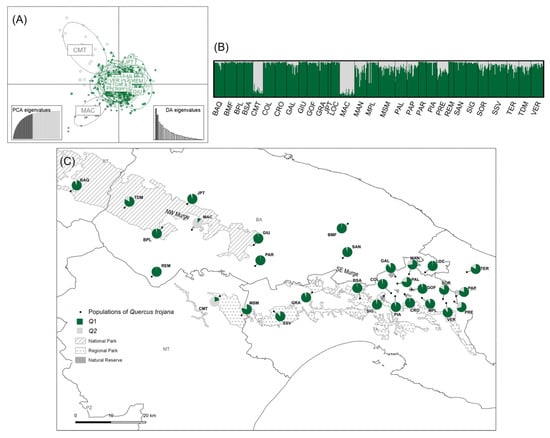
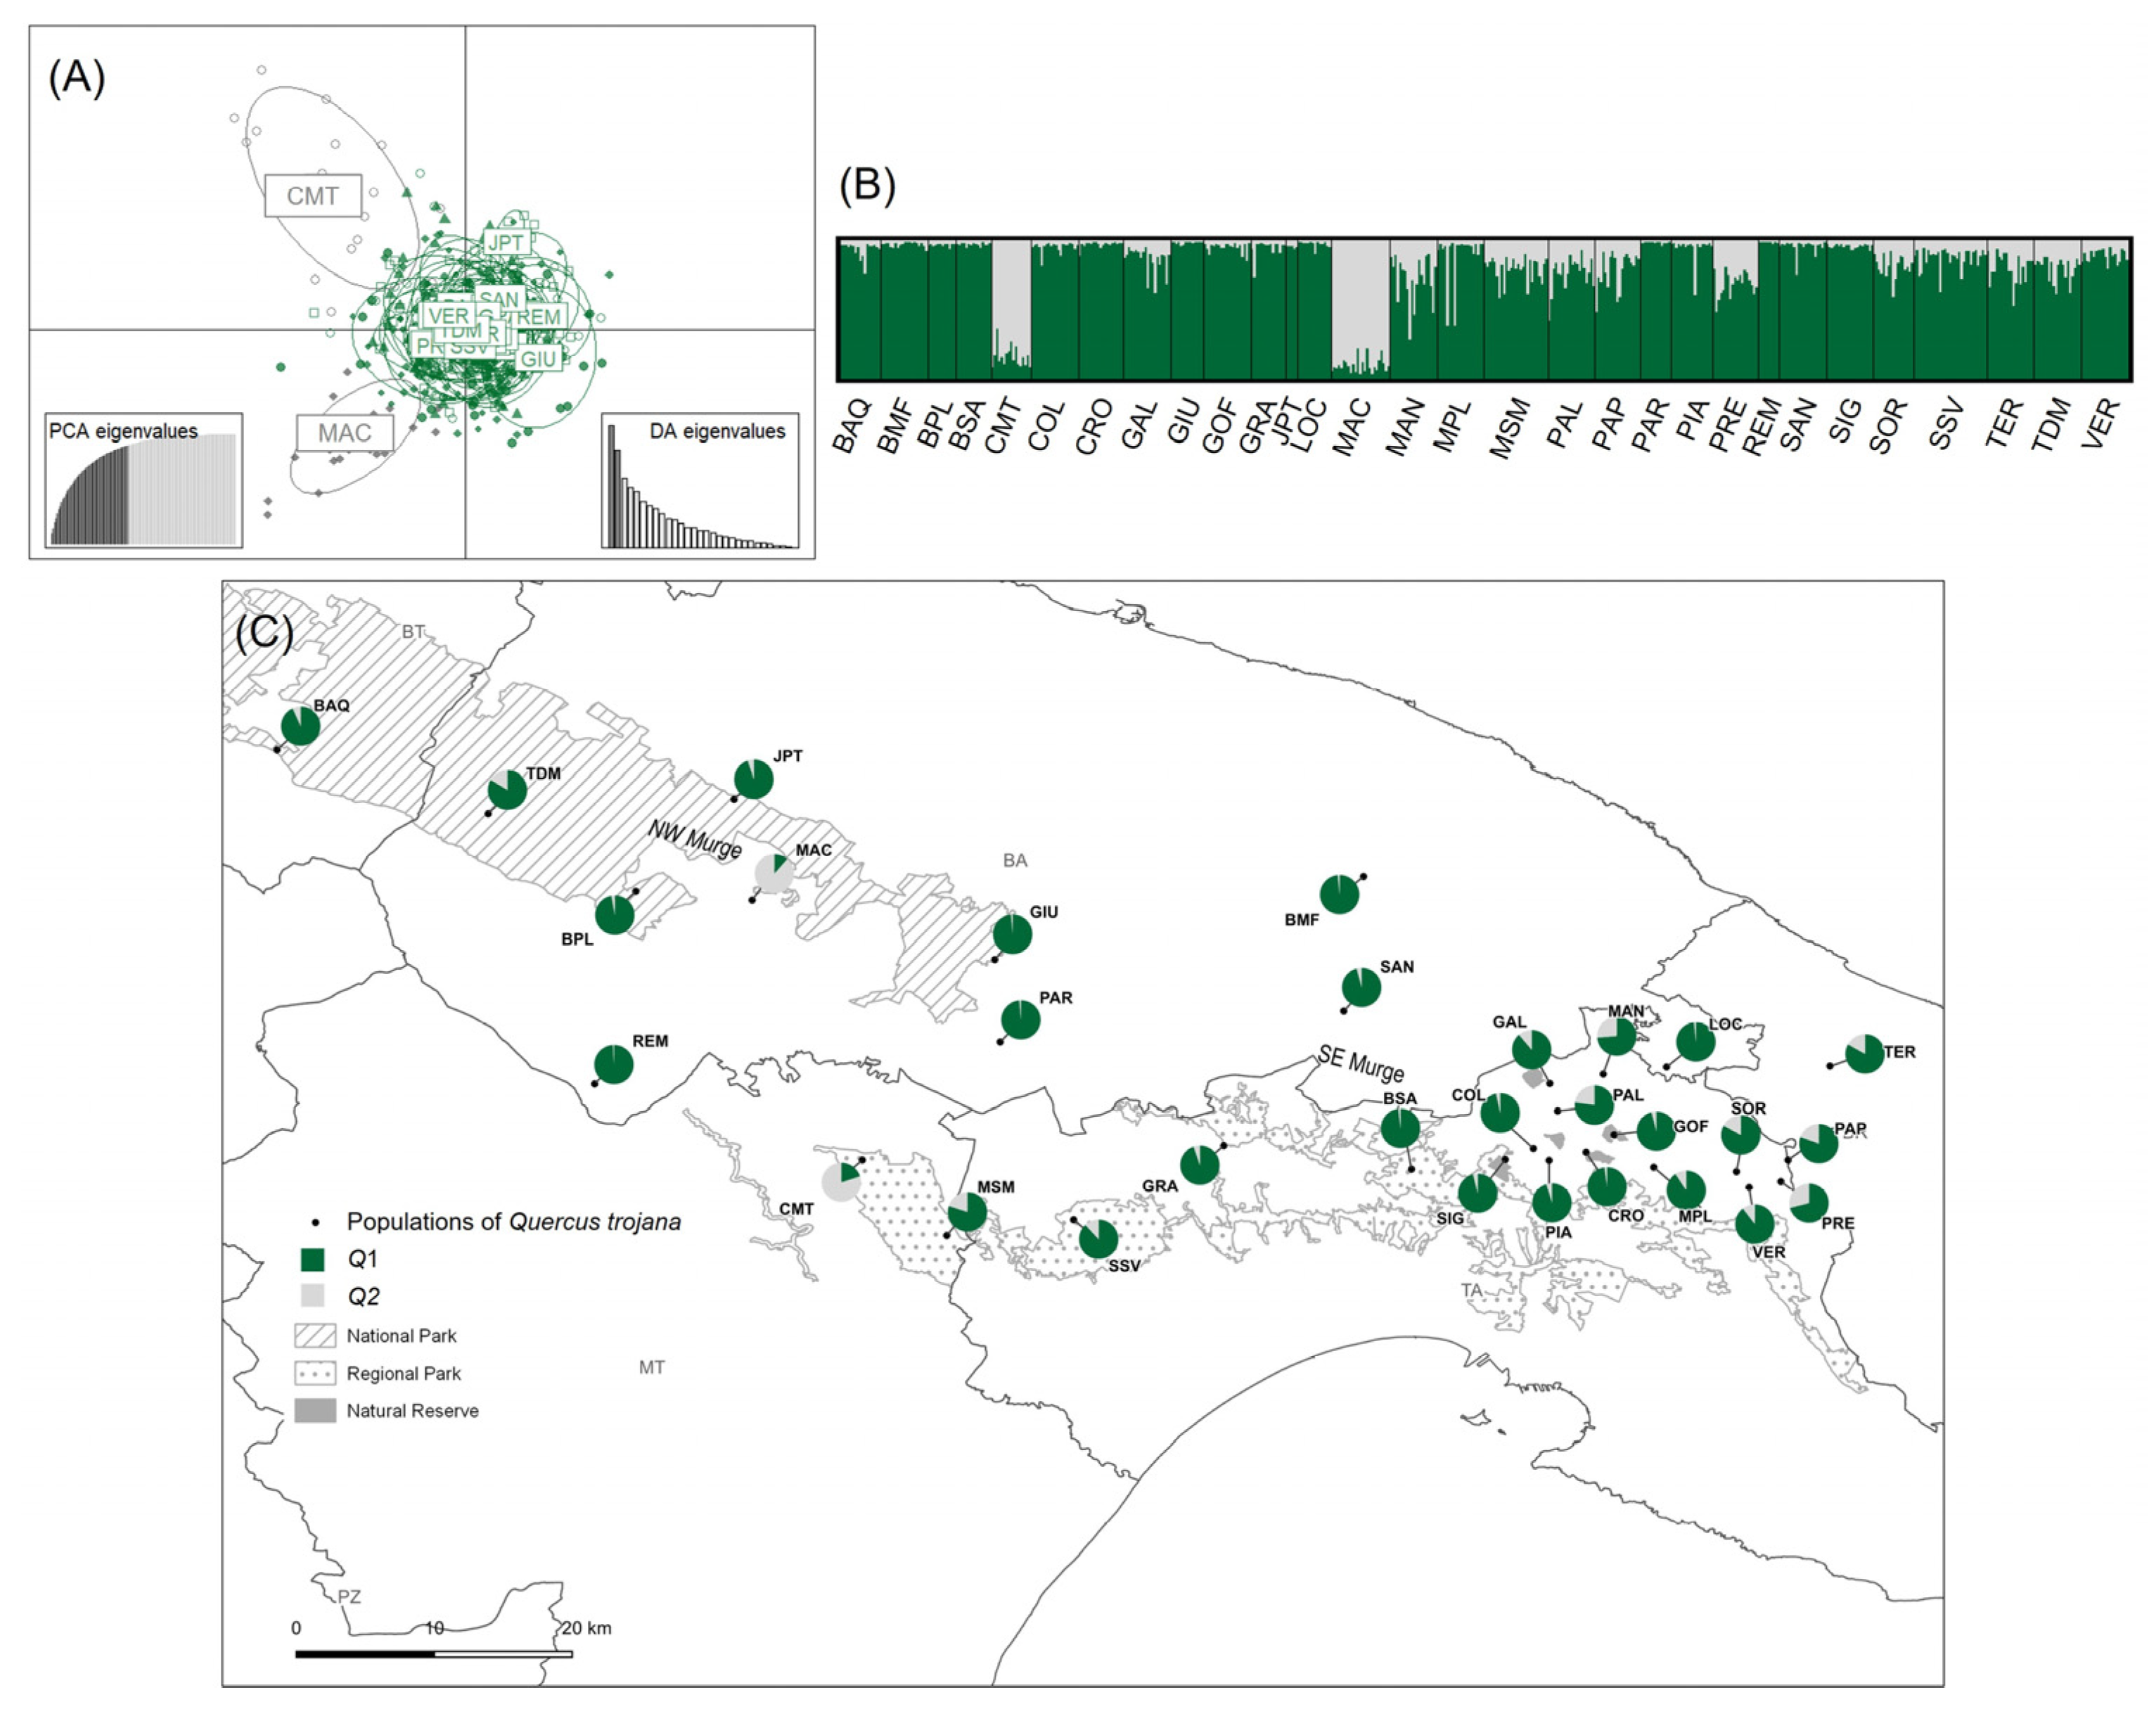
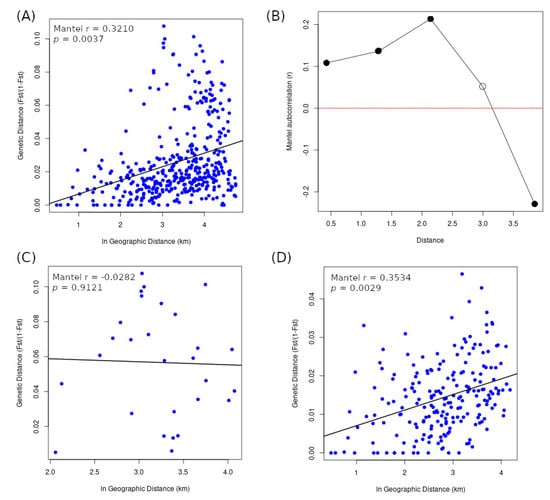
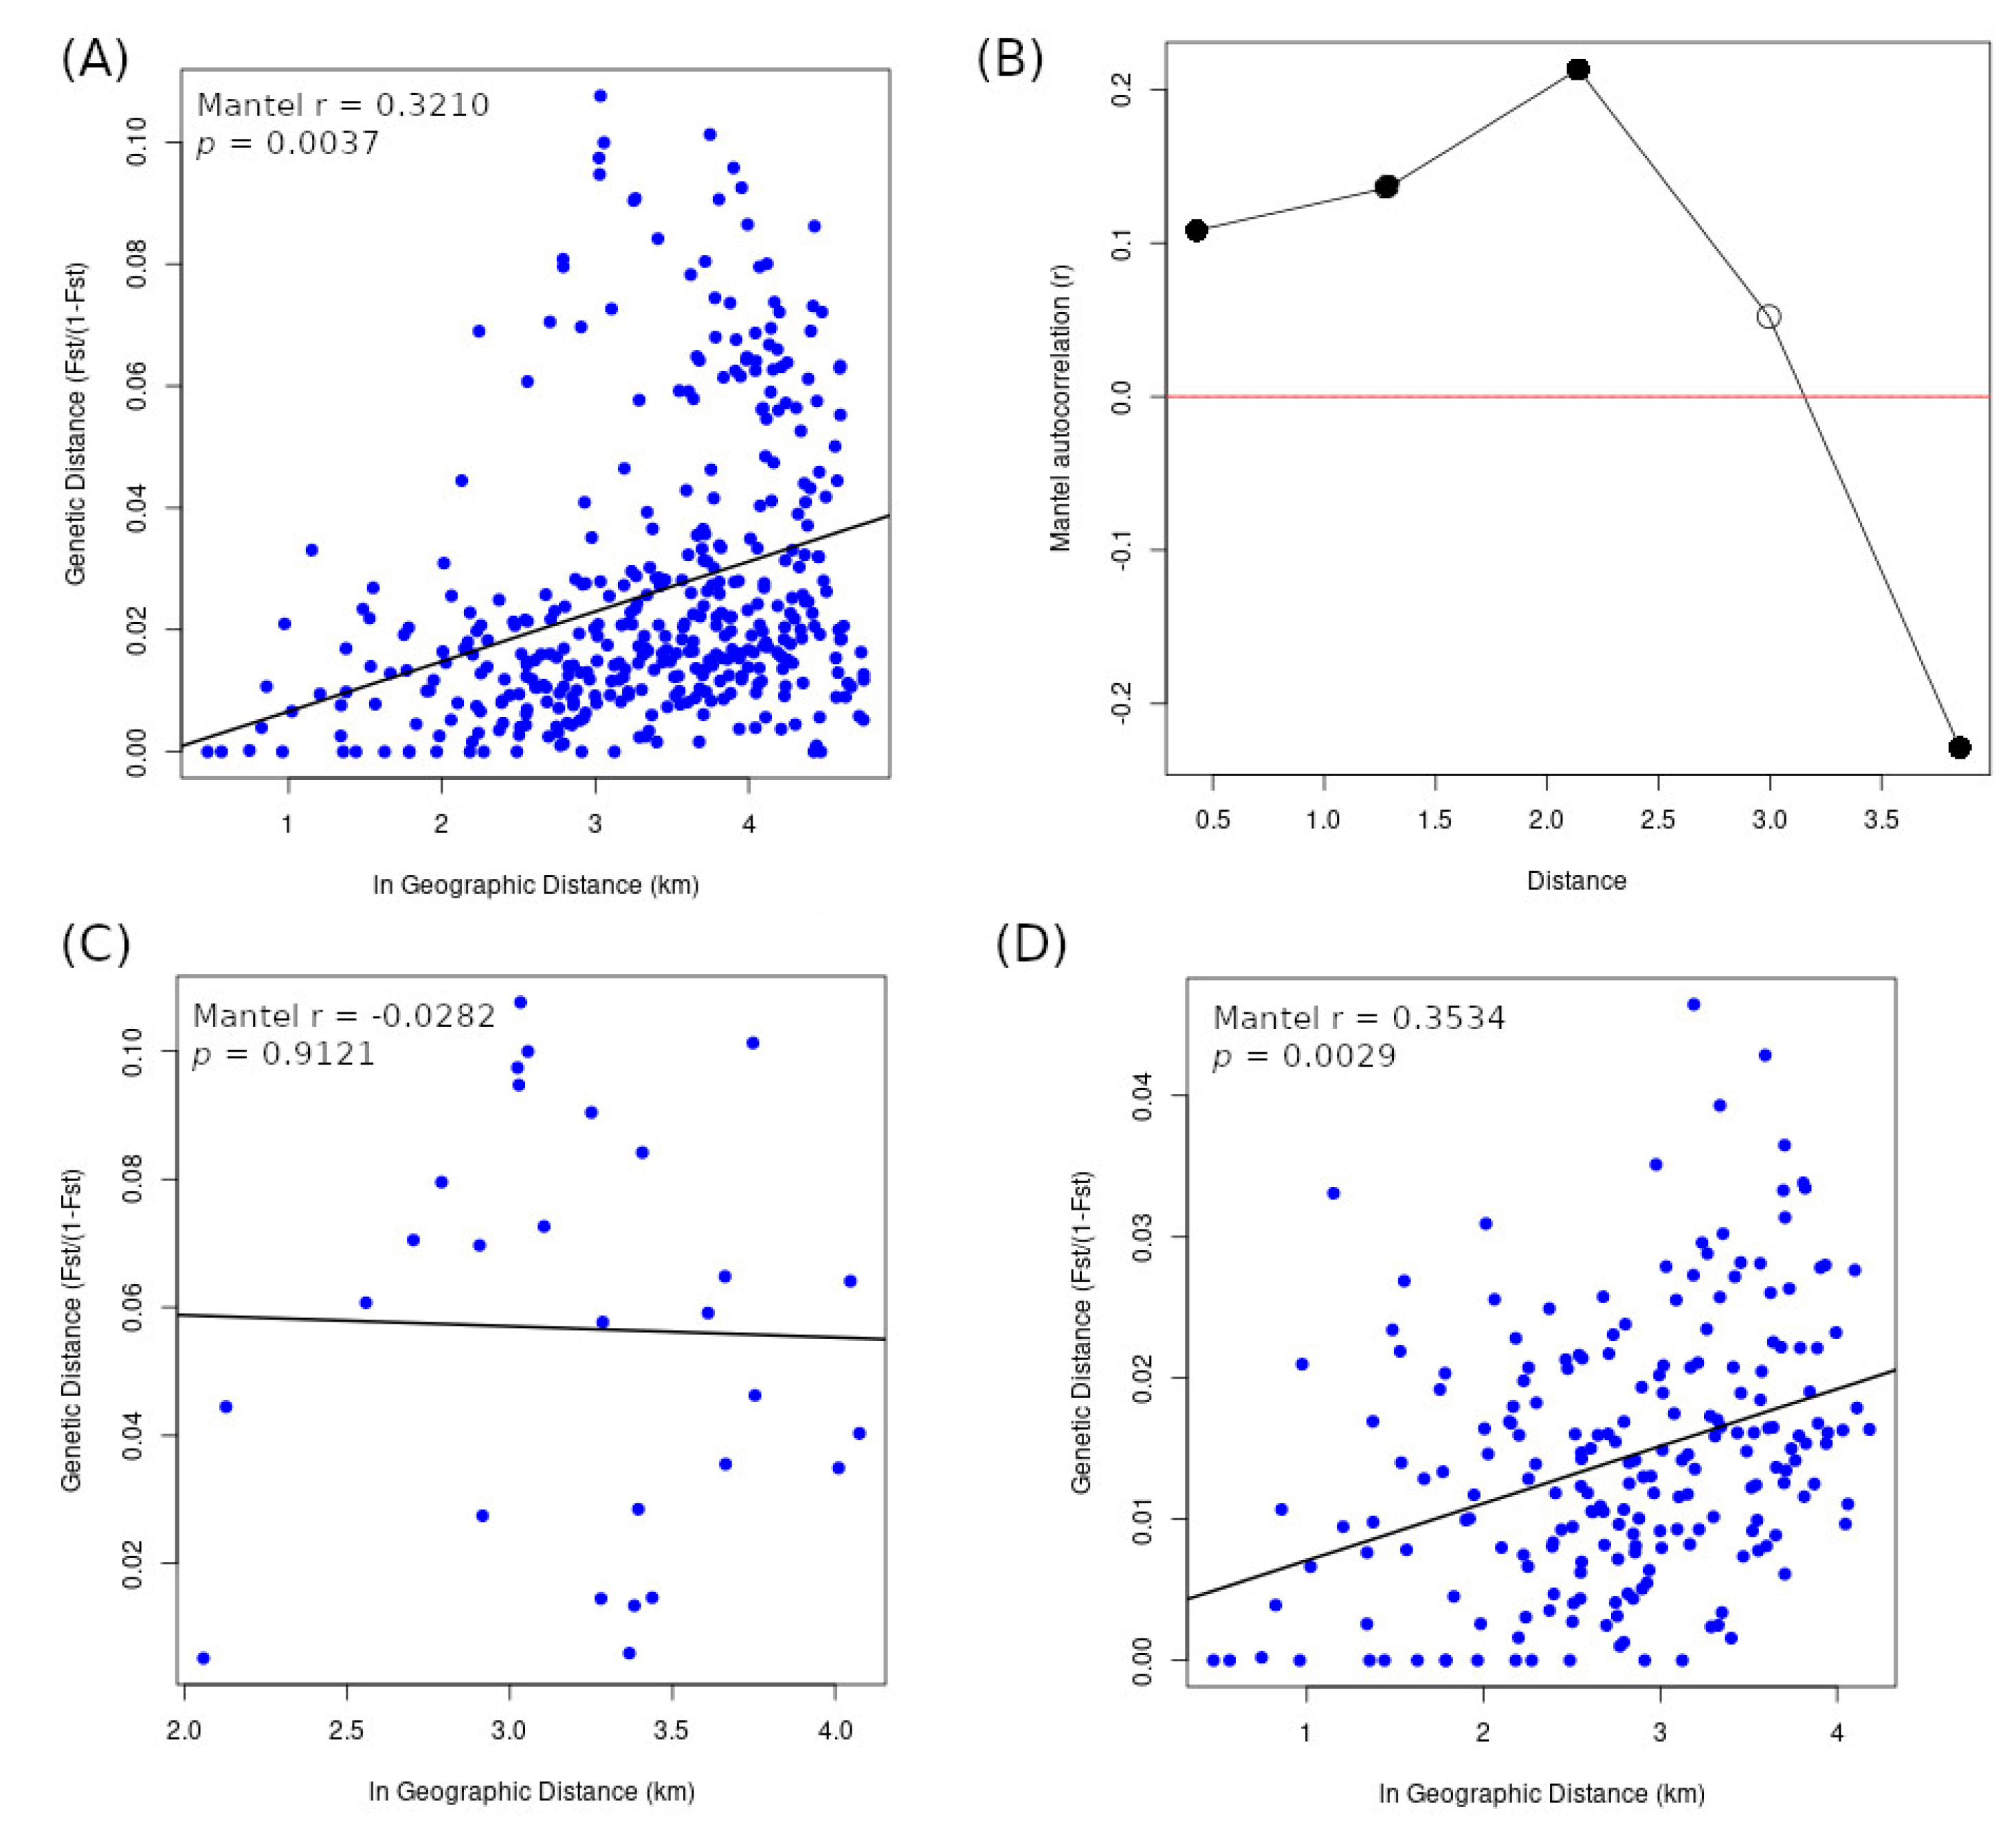
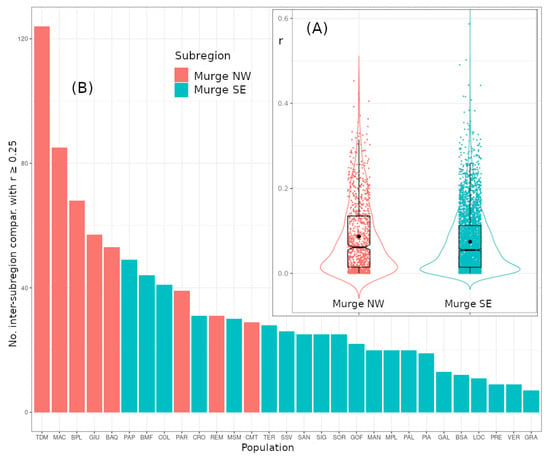
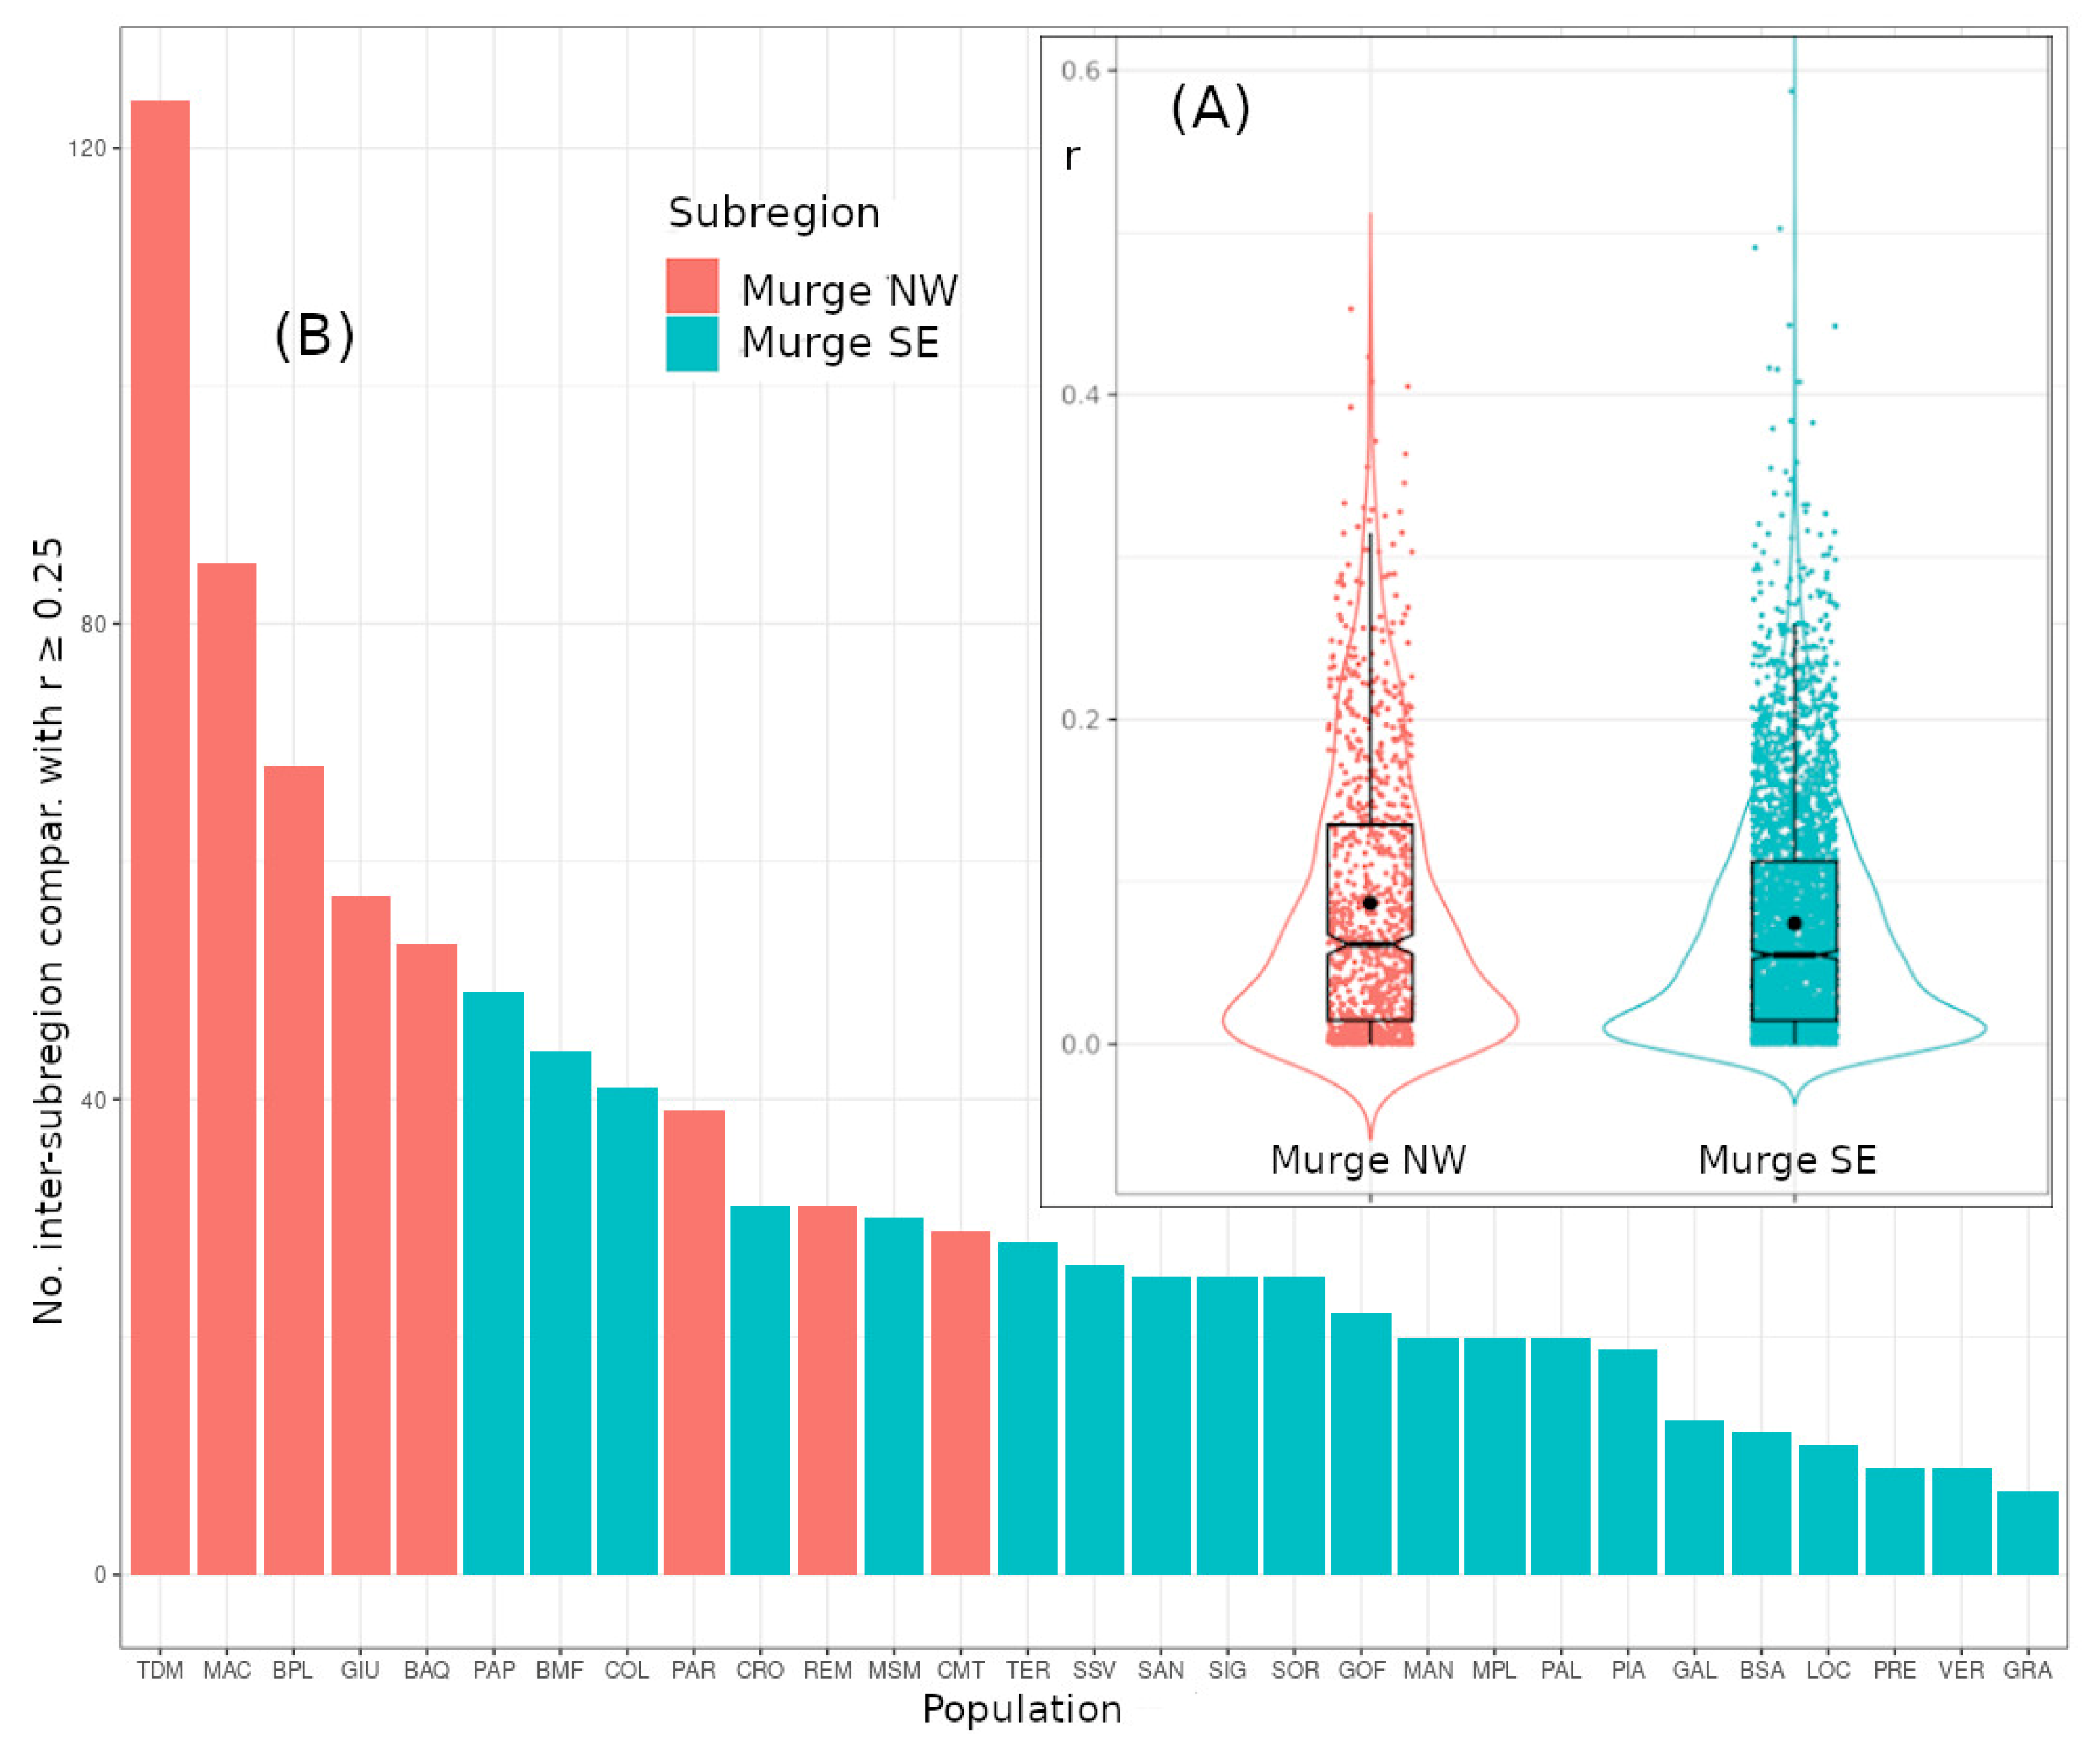

Disclaimer/Publisher’s Note: The statements, opinions and data contained in all publications are solely those of the individual author(s) and contributor(s) and not of MDPI and/or the editor(s). MDPI and/or the editor(s) disclaim responsibility for any injury to people or property resulting from any ideas, methods, instructions or products referred to in the content. |
© 2026 by the authors. Licensee MDPI, Basel, Switzerland. This article is an open access article distributed under the terms and conditions of the Creative Commons Attribution (CC BY) license.