Article

Economic Aspects of the Timber-Production Function in Different Forest Stand Types

1
Department of Forest and Wood Products Economics and Policy, Faculty of Forestry and Wood Technology, Mendel University in Brno, Zemědělská 3, 613 00 Brno, Czech Republic
2
Department of Silviculture, Faculty of Forestry and Wood Technology, Mendel University in Brno, Zemědělská 3, 613 00 Brno, Czech Republic
3
Forestry and Game Management Research Institute, Strnady 136, 252 02 Jíloviště, Czech Republic
*
Author to whom correspondence should be addressed.
Forests 2026, 17(7), 827; https://doi.org/10.3390/f17070827
Submission received: 14 June 2026 / Revised: 10 July 2026 / Accepted: 12 July 2026 / Published: 14 July 2026
(This article belongs to the Section Forest Economics, Policy, and Social Science)

Abstract

This study evaluates the economic efficiency of the timber-production function across 24 forest stands in Czech Republic, representing monocultures, low-diversity mixed stands, mixed stands, and structurally differentiated stands, in the context of the profound changes that have affected forestry in the Czech Republic in recent years. Bark beetle outbreaks, climatic extremes, and the degradation of Norway spruce monocultures have increased concerns about their long-term production reliability and economic stability, highlighting the need to identify more resilient and sustainable management approaches. Mixed and structurally diversified stands, owing to their species diversity and higher ecological stability, represent a potential alternative; however, their management and economic assessment require more complex planning and interpretation. The study analyses the volume production of selected stands, timber market prices by assortments and tree species recalculated on a per-hectare basis and compares silvicultural and harvesting costs. Economic efficiency is expressed using the cost coefficient (Kn) and the efficiency coefficient (Ke), which quantify both direct production costs and the economic return of individual stand types. Results show that monoculture stands, especially those with a high share of valuable assortments, achieved the highest economic efficiency under the applied static cost–revenue assessment. This finding reflects the observed assortment structure, realized timber prices, and selected management costs. In the broader Central European forestry context, however, previous studies indicate that even-aged conifer monocultures may be more exposed to biotic and abiotic disturbance risks, which can affect their long-term production reliability and economic stability. Stands with higher species and structural diversity exhibit an economic profile that differs substantially from that of monocultures. Based on aggregated price and cost inputs for the reference period 2020–2024, low-diversity mixed and mixed stands reach intermediate values of cost intensity and efficiency, whereas structurally differentiated stands display the highest cost intensity and the lowest efficiency. Monocultures, by contrast, achieve the highest economic efficiency, primarily due to a greater share of high-quality timber assortments (classes I–III). Diversified stand structures (mixed and structurally differentiated stands) broaden the assortment composition and produce a more even distribution of monetization across quality classes. Diversification, therefore, did not maximize immediate economic efficiency in the static assessment; rather, it was associated with broader assortment composition and a less concentrated revenue structure across quality classes.

1. Introduction

Forests represent a key component of landscape ecosystem structure, providing a wide range of productive and non-productive functions, from carbon sequestration and water-regime regulation to soil protection against erosion. International studies emphasize that maintaining these functions under conditions of climate change requires adaptive management approaches [1,2,3] that account not only for economic stability but also for the ecological resilience of forest stands [4,5]. Recent analyses also highlight the importance of tree-species diversification, the application of close-to-nature silvicultural practices [6,7,8], and the use of predictive models [9,10,11] to optimize carbon balances and the multifunctionality of forest ecosystems [12,13], including the links between biodiversity, ecosystem functioning, and the provision of ecosystem services [1,14,15].
Timber production remains a central economic pillar of forestry; however, the long forestry tradition in Czechia and across Europe requires a fundamental revision of management approaches [16,17,18,19] to address climate change. Even-aged conifer monocultures, particularly those dominated by Picea abies, show increased vulnerability to drought and heat [20,21], while forests play a critical role in achieving emission-reduction targets and therefore require quantitatively supported mitigation and adaptation strategies [11,22,23,24,25,26]. Adaptation therefore necessitates the implementation of comprehensive strategies at both national and enterprise levels [11,27,28], including the regeneration and restoration of close-to-nature forests to enhance long-term carbon retention [29], and adaptive forest management in Central Europe aimed at ecological stability, including the use of mixed-stand structures to reduce climate sensitivity and increase stand resistance [30,31,32,33,34,35]. In mountain forests, maintaining protective functions requires an ecosystem-based approach to disaster-risk reduction (Eco-DRR) and targeted planning of protection forests [17,36,37].
Empirical and synthesis studies show that traditional Norway spruce (Picea abies) monocultures are unsustainable under accelerating climate change [38,39] and increasing disturbance regimes: in high-mountain Alpine environments, increased mortality and destabilization of spruce and beech stands have been observed [20,40,41], even-aged monocultures demonstrate lower short- to medium-term carbon stability than age-comparable mixed plantations [42], while the acceleration of growth dynamics since 1870 complicates long-term silvicultural planning [43]. At the same time, empirical studies across Europe show that transitioning from monocultures to structurally differentiated stands can enhance production stability and reduce sensitivity of growth to drought and warming. The magnitude of the effect depends on the context, especially the water regime and site fertility [44,45,46,47].
Conversely, some regional analytical studies suggest that monocultures may achieve higher short- to medium-term productivity on optimal sites and under favorable climate conditions [48,49] than mixed stands. However, this effect is strongly conditioned by strict site selection, stand-age structure, and adaptive silvicultural interventions that address climate- and disturbance-related risks, particularly in Northern and Central Europe [32,50].
Diversified management focusing on mixed stands, by contrast, increases ecological resilience, adaptability, and long-term sustainability, with up to ~70% higher carbon stocks in certain combinations of tree species, age classes, and site conditions. Although the magnitude of this effect varies across studies, mixed stands tend to be more stable during extreme events and yield economic benefits arising from increased biodiversity, risk management, and recreational values [12,13,22,42,43,45,51,52,53,54,55,56]. Structural diversification also aligns more closely with public preferences for recreational forest functions [52,57].
Mixed forests represent a key approach to enhancing the resilience of forest ecosystems. Compared with monocultures, they distribute risks more effectively, reduce stand vulnerability to pests and pathogens, and provide a wider range of ecosystem services, including biodiversity enhancement, water-regulation functions, and recreation [12,15]. Species complementarity provides productivity advantages across a broad range of site conditions, supporting stand stability during climatic extremes [58,59]. Current developments in ecological research indicate a significant shift towards a preference for mixed forests [60]. This has managerial implications, highlighting the need for adaptive, close-to-nature silviculture, the maintenance of stand structure, and adjustments to thinning and harvesting practices as pathways to reducing risks and maintaining essential forest functions [31].
Mixed forests in Central and Northern Europe, particularly patch-based mixtures of spruce and birch, demonstrate quantifiable economic benefits under adaptive management (e.g., well-timed thinning, integration of energy biomass), reflected in positive net present value (NPV) and higher net cash flows compared with monocultures, assuming that they are dependent on model-specific parameters, such as timber prices, discount rates, and cost curves [61,62,63]. An expanded portfolio of ecosystem services and statistically lower exposure to disturbances, particularly pests, pathogens and wind, also play an important role [12,55,60,64,65,66,67,68,69,70,71].
The significance of converting monocultures into mixed stands lies not only in risk diversification and economic stability but also in the potential to reduce emissions through enhanced carbon-sequestration capacity. Empirical studies from Central Europe show that mixed stands achieve higher mean annual increments in above-ground carbon than monocultures [58,59,72,73]. This is primarily due to complementary growth strategies and more efficient resource use [74]. Modeling studies further confirm that climate scenarios (e.g., RCP/SSP) deteriorate the expected carbon balance of spruce monocultures, whereas mixed stands demonstrate greater ecological resilience and more effectively maintain productive and carbon functions [24,46,75,76]. Evidence from other contexts supports this pattern: meta-analyses show that tropical mixed plantations possess substantially higher above-ground carbon stocks than monocultures [77,78]. Although these results must be applied with caution to the Central European environment due to differing growth regimes and disturbance patterns, incorporating carbon payments yields better economic returns [61]. This suggests that similar mechanisms may strengthen the case for mixed forests in Central Europe.
Despite their greater ecological stability and improved carbon balance, numerous empirical studies highlight important limitations of mixed forests. Trade-offs between ecosystem services and timber production [79,80] indicate that increased biodiversity may reduce short-term productive performance in certain species compositions [12,14,50]. Management complexity and higher costs [1,27] stem from the need for differentiated interventions and expert planning, thereby increasing management-related economic uncertainty [31,61,81]. Biotic risks [82,83] may also occur in some species mixtures or structural configurations, where particular host combinations or stand conditions can increase susceptibility to generalist pests and pathogens [15,60]. Climatic uncertainty and extremes may selectively damage species, thereby reducing carbon balance and production stability [20,43,75]. Finally, economic uncertainty [27,53,84], associated with higher initial costs and revenue variability, necessitates adaptive management, scenario-based planning and sensitivity analyses [28,85]. Establishing mixed stands typically entails higher initial costs and slower cash flow development, suggesting the need for full life-cycle economic evaluation (NPV—Net present value/IRR—Internal rate of return) across regions [50,81].
In the context of increasing climate extremes, disturbances, and economic uncertainties, the debate over whether the traditional focus on monocultures can ensure long-term production stability and economic efficiency is growing. Existing evidence suggests that structurally differentiated (mixed and structurally rich) stands show greater resistance to both biotic and abiotic stresses and enable more effective risk distribution. It is, therefore, essential to determine whether tree species diversification truly represents a viable alternative to monocultures, not only from an ecological but also from an economic perspective. The objective of this study is to compare the timber-production economic profile of monocultures, low-diversity mixed stands, mixed stands, and structurally differentiated stands using observed assortment structure, local timber prices, selected management costs, and static cost–revenue indicators. Long-term economic stability, disturbance exposure, and dynamic investment criteria are considered as interpretative aspects rather than directly quantified outputs of the present analysis. It should be noted, however, that the analysis adopts a static approach based on aggregated economic data for the reference period 2020–2024. As such, the results do not directly capture dynamic processes over time but provide a comparative assessment of current cost and revenue structures under recent market conditions.

2. Materials and Methods

The methodological procedure was designed with an emphasis on transparency and reproducibility. Transparency was ensured by explicitly defining all input variables, data sources, and calculation procedures. Reproducibility was achieved through the use of a standardized analytical framework with fixed input parameters and clearly stated assumptions, enabling independent replication of the results.
The methodology encompasses the key steps of field data collection, data processing, and analysis, allowing verification of the effects of tree species composition on production and economic indicators. The sample represents a set of research plots established within a dedicated project aimed at analyzing the effects of tree species composition and stand structure under controlled site conditions. The selection was therefore criterion-based, reflecting the requirements of the research design rather than a purely random sampling approach. The dataset should therefore be interpreted as a criterion-based comparative sample rather than as a statistically representative sample of the entire Czech forest estate. The results are primarily applicable to the evaluated mature stands and to comparable site and management conditions. Extrapolation to the Czech forest estate as a whole or to other Central European regions should be made with caution and would require a larger, statistically representative dataset covering a broader range of site productivity, age structures, management regimes, and regional conditions.
The selection of sample plots ensured that individual locations represent different management units and typological classes, covering a wide range of ecological conditions. Within each location, all stand variants are situated on the same site-class typological unit (SLT) and within the same management unit (HS), facilitating mutually comparable and methodologically robust assessments.

2.1. Geographical Location of the Study Plots

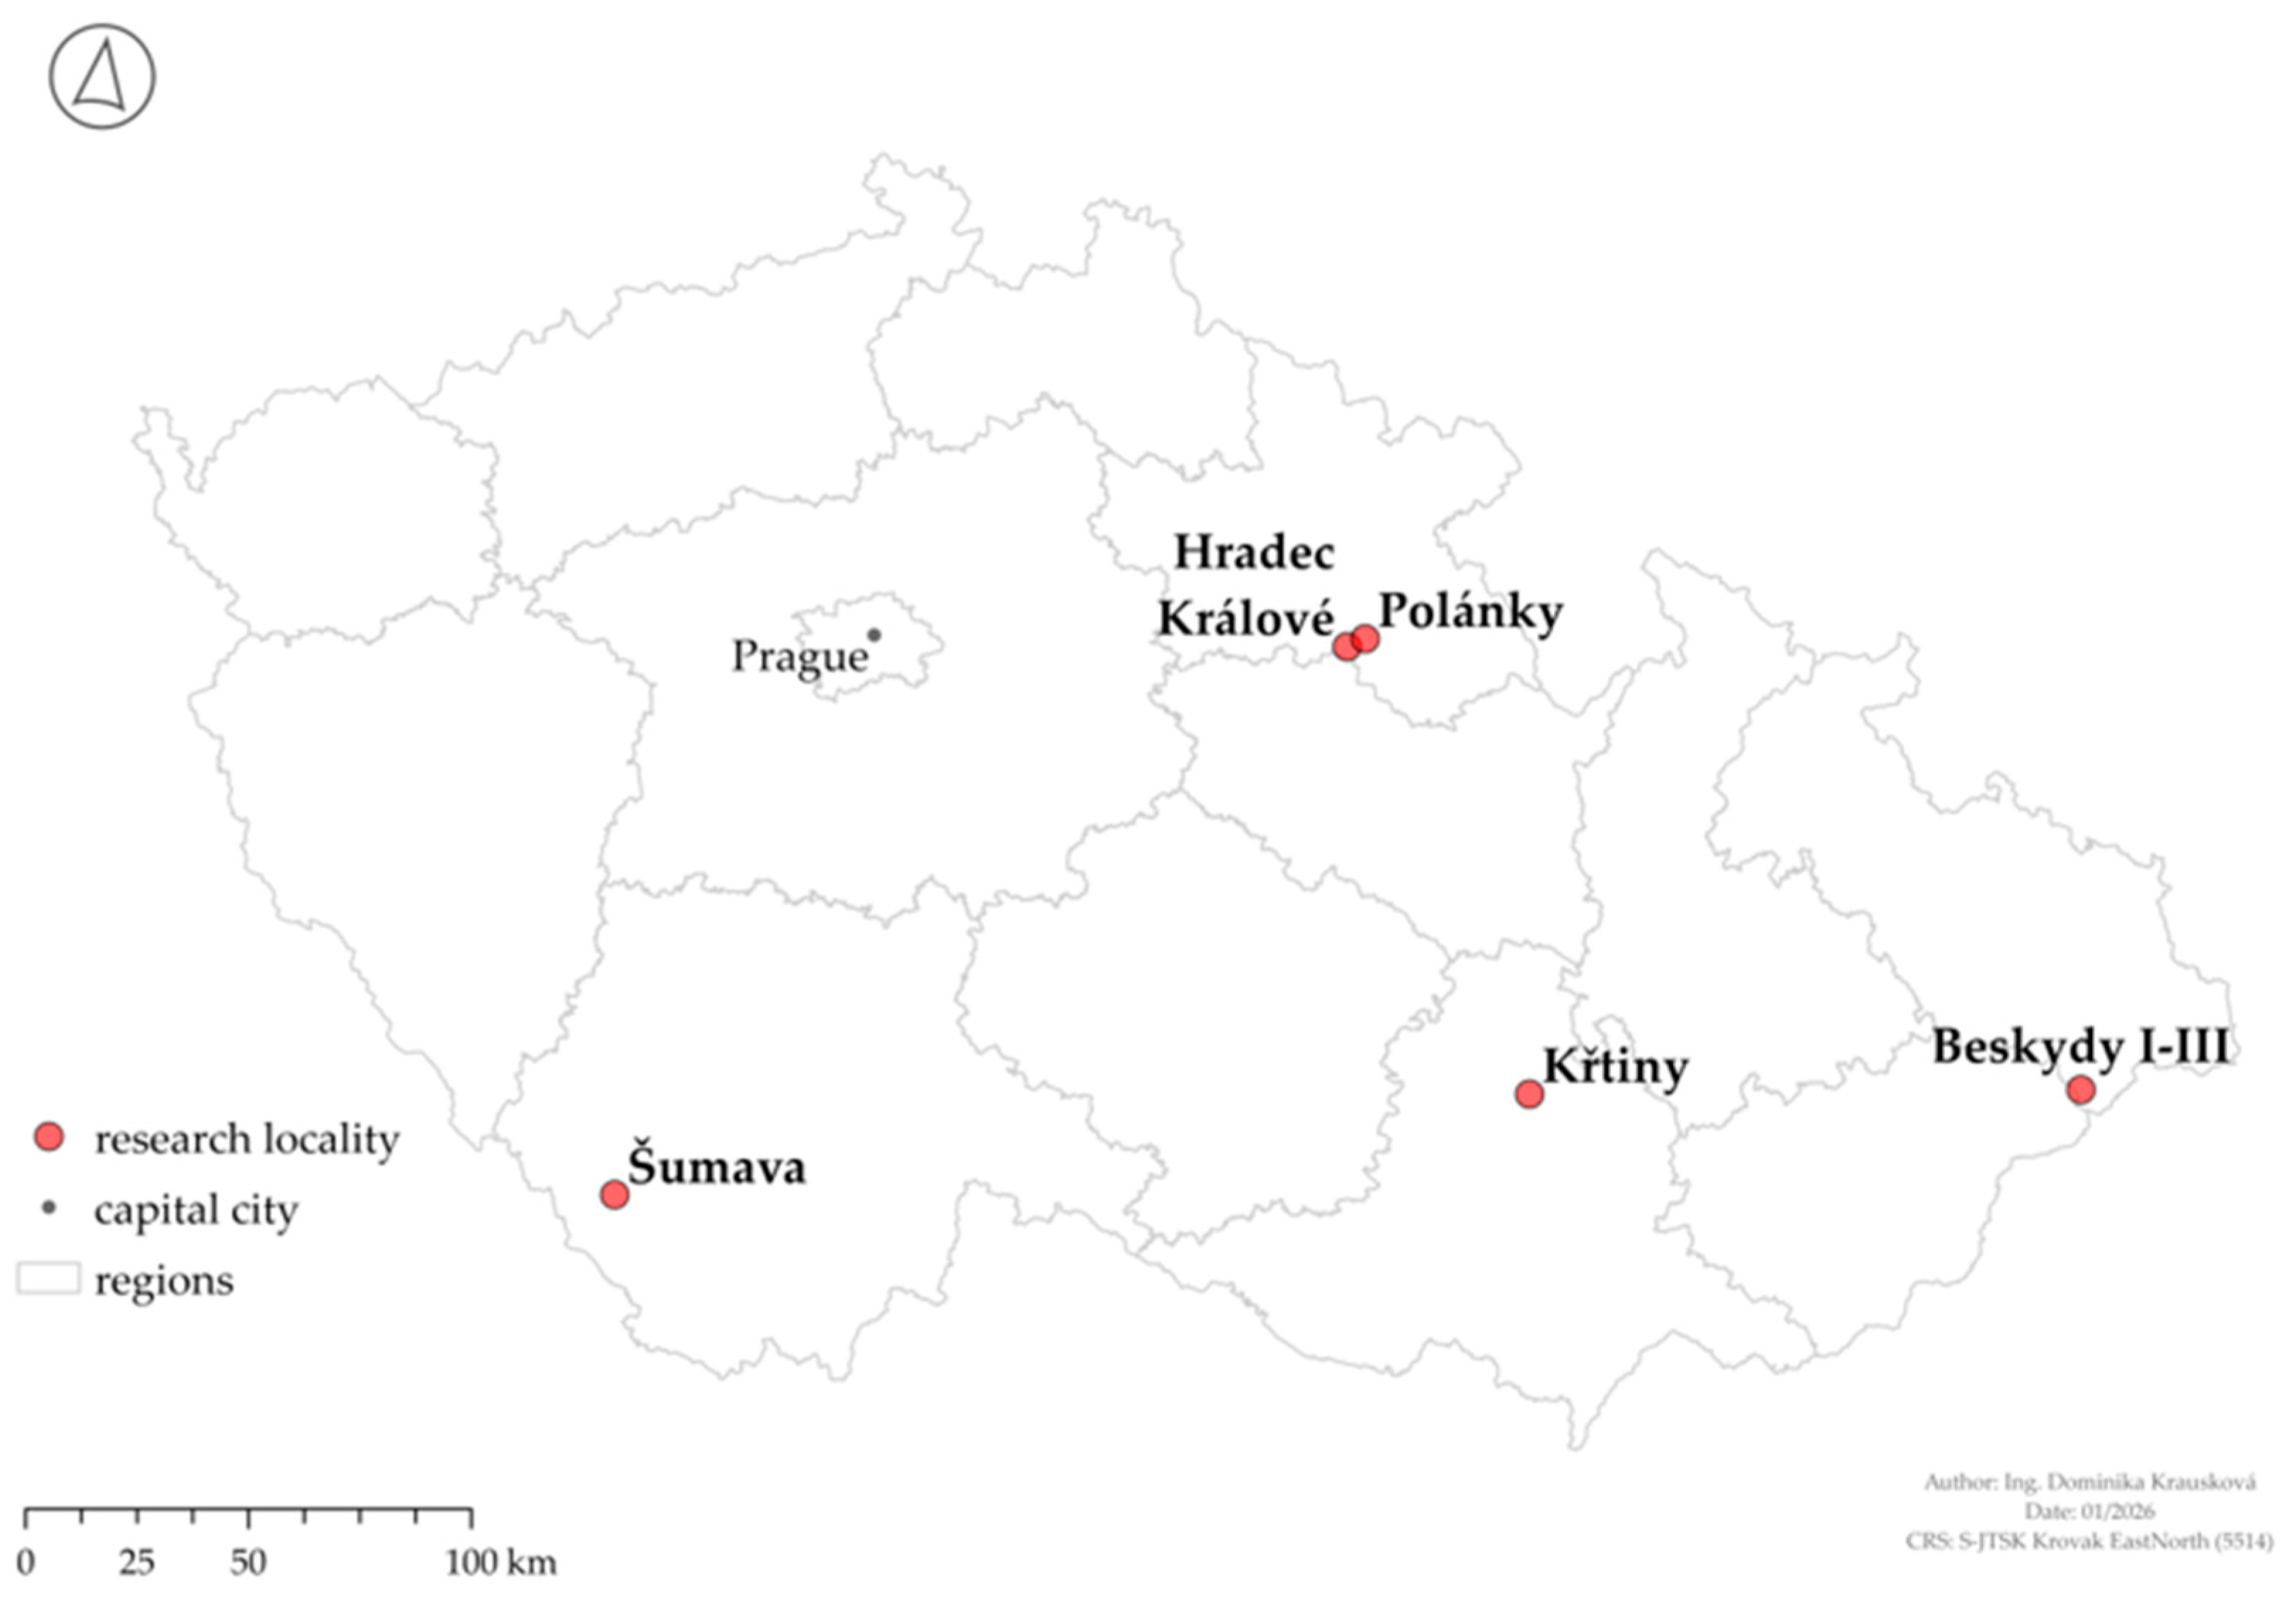
The study includes plots situated across various parts of the Czech Republic, reflecting diverse natural and management conditions. In the southwest, the Šumava region is characterized by a montane vegetation zone, cool climate, and higher elevations. Northeastern Bohemia is represented by the Hradec Králové and Polánky areas, which are dominated by lowland pine and oak stands on acidic sandy soils. In central Moravia, the Křtiny area is included, typified by nutrient-poor sites developed on granodiorite and limestone substrates. The easternmost part of the study area is highlighted by the Beskydy Mountains, which represent submontane and montane conditions and include beech, spruce, and fir stands.
This spatial distribution (see Figure 1) allows for a comprehensive comparison of the effects of tree species diversity on stand stability and economic efficiency. For clarity and consistency, each locality is abbreviated throughout the text: BE (Beskydy), HK (Hradec Králové), KR (Křtiny), and SU (Šumava). These codes are also used to identify stand variants within each location.

2.2. Basic Characteristics of the Study Plots

A series of seven research plots were included in the analysis, located in the Beskydy Mountains (BE), the Křtiny area (KR), the Polánky area (PO), the Hradec Králové region (HK), and the Šumava Mountains (SU). These series represent a broad range of site conditions, from lowland pine stands corresponding to Site Type Groups (STGs) of acidophilous pine forests to submontane and montane beech and spruce STGs typical of colder, higher-elevation locations. Each series (locality) contains three to four research plots that differ in tree species composition and spatial structure. Represented categories include monocultures, mixed stands (including stands with a low degree of mixing), and structurally differentiated stands with pronounced vertical differentiation.
The species composition of individual series reflects their respective positions along the site gradient: pine and oak dominate at lower elevations (HK, PO), whereas spruce and beech prevail at mid-elevation (KR) to higher-elevation sites (BE, SU). This combination allows assessment of the effects of stand structure across contrasting ecological conditions.
Table 1 summarizes the basic site and stand characteristics of all seven series, including stand categorization, aspect, slope inclination, basal area (BA/ha), total standing volume (V/ha), stand density (n/ha), and age structure. These data provide a comprehensive overview of the variability in site and structural parameters that underpin the evaluation of the influence of species diversity and structural differentiation on production stability and economic efficiency.

2.3. Classification of Stands According to the Degree of Species and Structural Differentiation

Following an ecosystem function-based approach to forest stand classification [86], the plots were further divided into four categories according to the degree of species mixture and spatial stand structure. Monocultures were defined as stands dominated by a single tree species, accounting for 90% or more of the total species composition, with no significant vertical or horizontal differentiation.
In this study, low-diversity mixed stands were defined as stands in which the dominant tree species accounted for approximately 70%–90% of the total stand volume, while the remaining share was formed by one or more accompanying species. Mixed stands were characterized by a more balanced representation of two to three tree species, without the dominance of a single component and with partial structural differentiation. The highest category was structurally differentiated stands. For the purposes of this study, the term structurally differentiated stands refers to stands combining both species diversity and vertical or horizontal structural differentiation. The term is therefore used as an operational category of the present dataset, not as a general synonym for uneven-aged structure alone.
This classification served as the analytical framework for assessing relationships between species composition, production stability, and the economic efficiency of forest stands. To improve the readability of stand identification in the tables and figures, each stand was additionally assigned a stand-type prefix indicating its structural category: M = monoculture, LDM = low-diversity mixed stand, MX = mixed stand, and SD = structurally differentiated stand. The original locality-based code was retained after this prefix to preserve the link with field records and site-specific information. For example, PO_A_DB is reported as M_PO_A_DB, whereas PO_C is reported as SD_PO_C.

2.4. Rules for Measurement and Assortment Classification on the Sample Plots

Across all seven series of research plots (24 in total), a detailed stand inventory was conducted to determine the volumetric structure of timber by individual assortment classes. Field measurements included the determination of tree diameter using a caliper (Haglöf Sweden AB, Långsele, SWE) in two perpendicular directions with a precision of 0.1 cm, and measurement of tree height using a Vertex IV hypsometer (Haglöf, Sweden AB, SWE) with a precision of 0.1 m. Based on these measurements, stem volume was calculated for all tree species present, followed by classification into assortments according to qualitative and dimensional parameters.
All stems with a minimum top diameter of 7 cm were included in the analysis, corresponding to the standard threshold for commercial assortment classification. Trees below this threshold were not included in the merchantable timber assortment volume or in the subsequent revenue calculation. This approach is appropriate for evaluating commercially classifiable timber assortments, but it may underrepresent the contribution of young or small-diameter trees, particularly in structurally differentiated stands, where such trees can form a larger part of the stand structure. Therefore, the reported assortment volumes and revenues should be interpreted as merchantable timber-based indicators rather than as estimates of total stand biomass, total biological production, or the full structural complexity of the stand. The classification procedure adhered to the Recommended Rules for Timber Measurement and Classification in the Czech Republic [87]. This methodology establishes uniform procedures for measurement, volume calculation, and assortment classification. It is recommended for practical use in the Czech timber trade. This approach ensures full comparability of results and their reliable interpretability in forestry practice.

2.5. Methodology for Determining Price Inputs

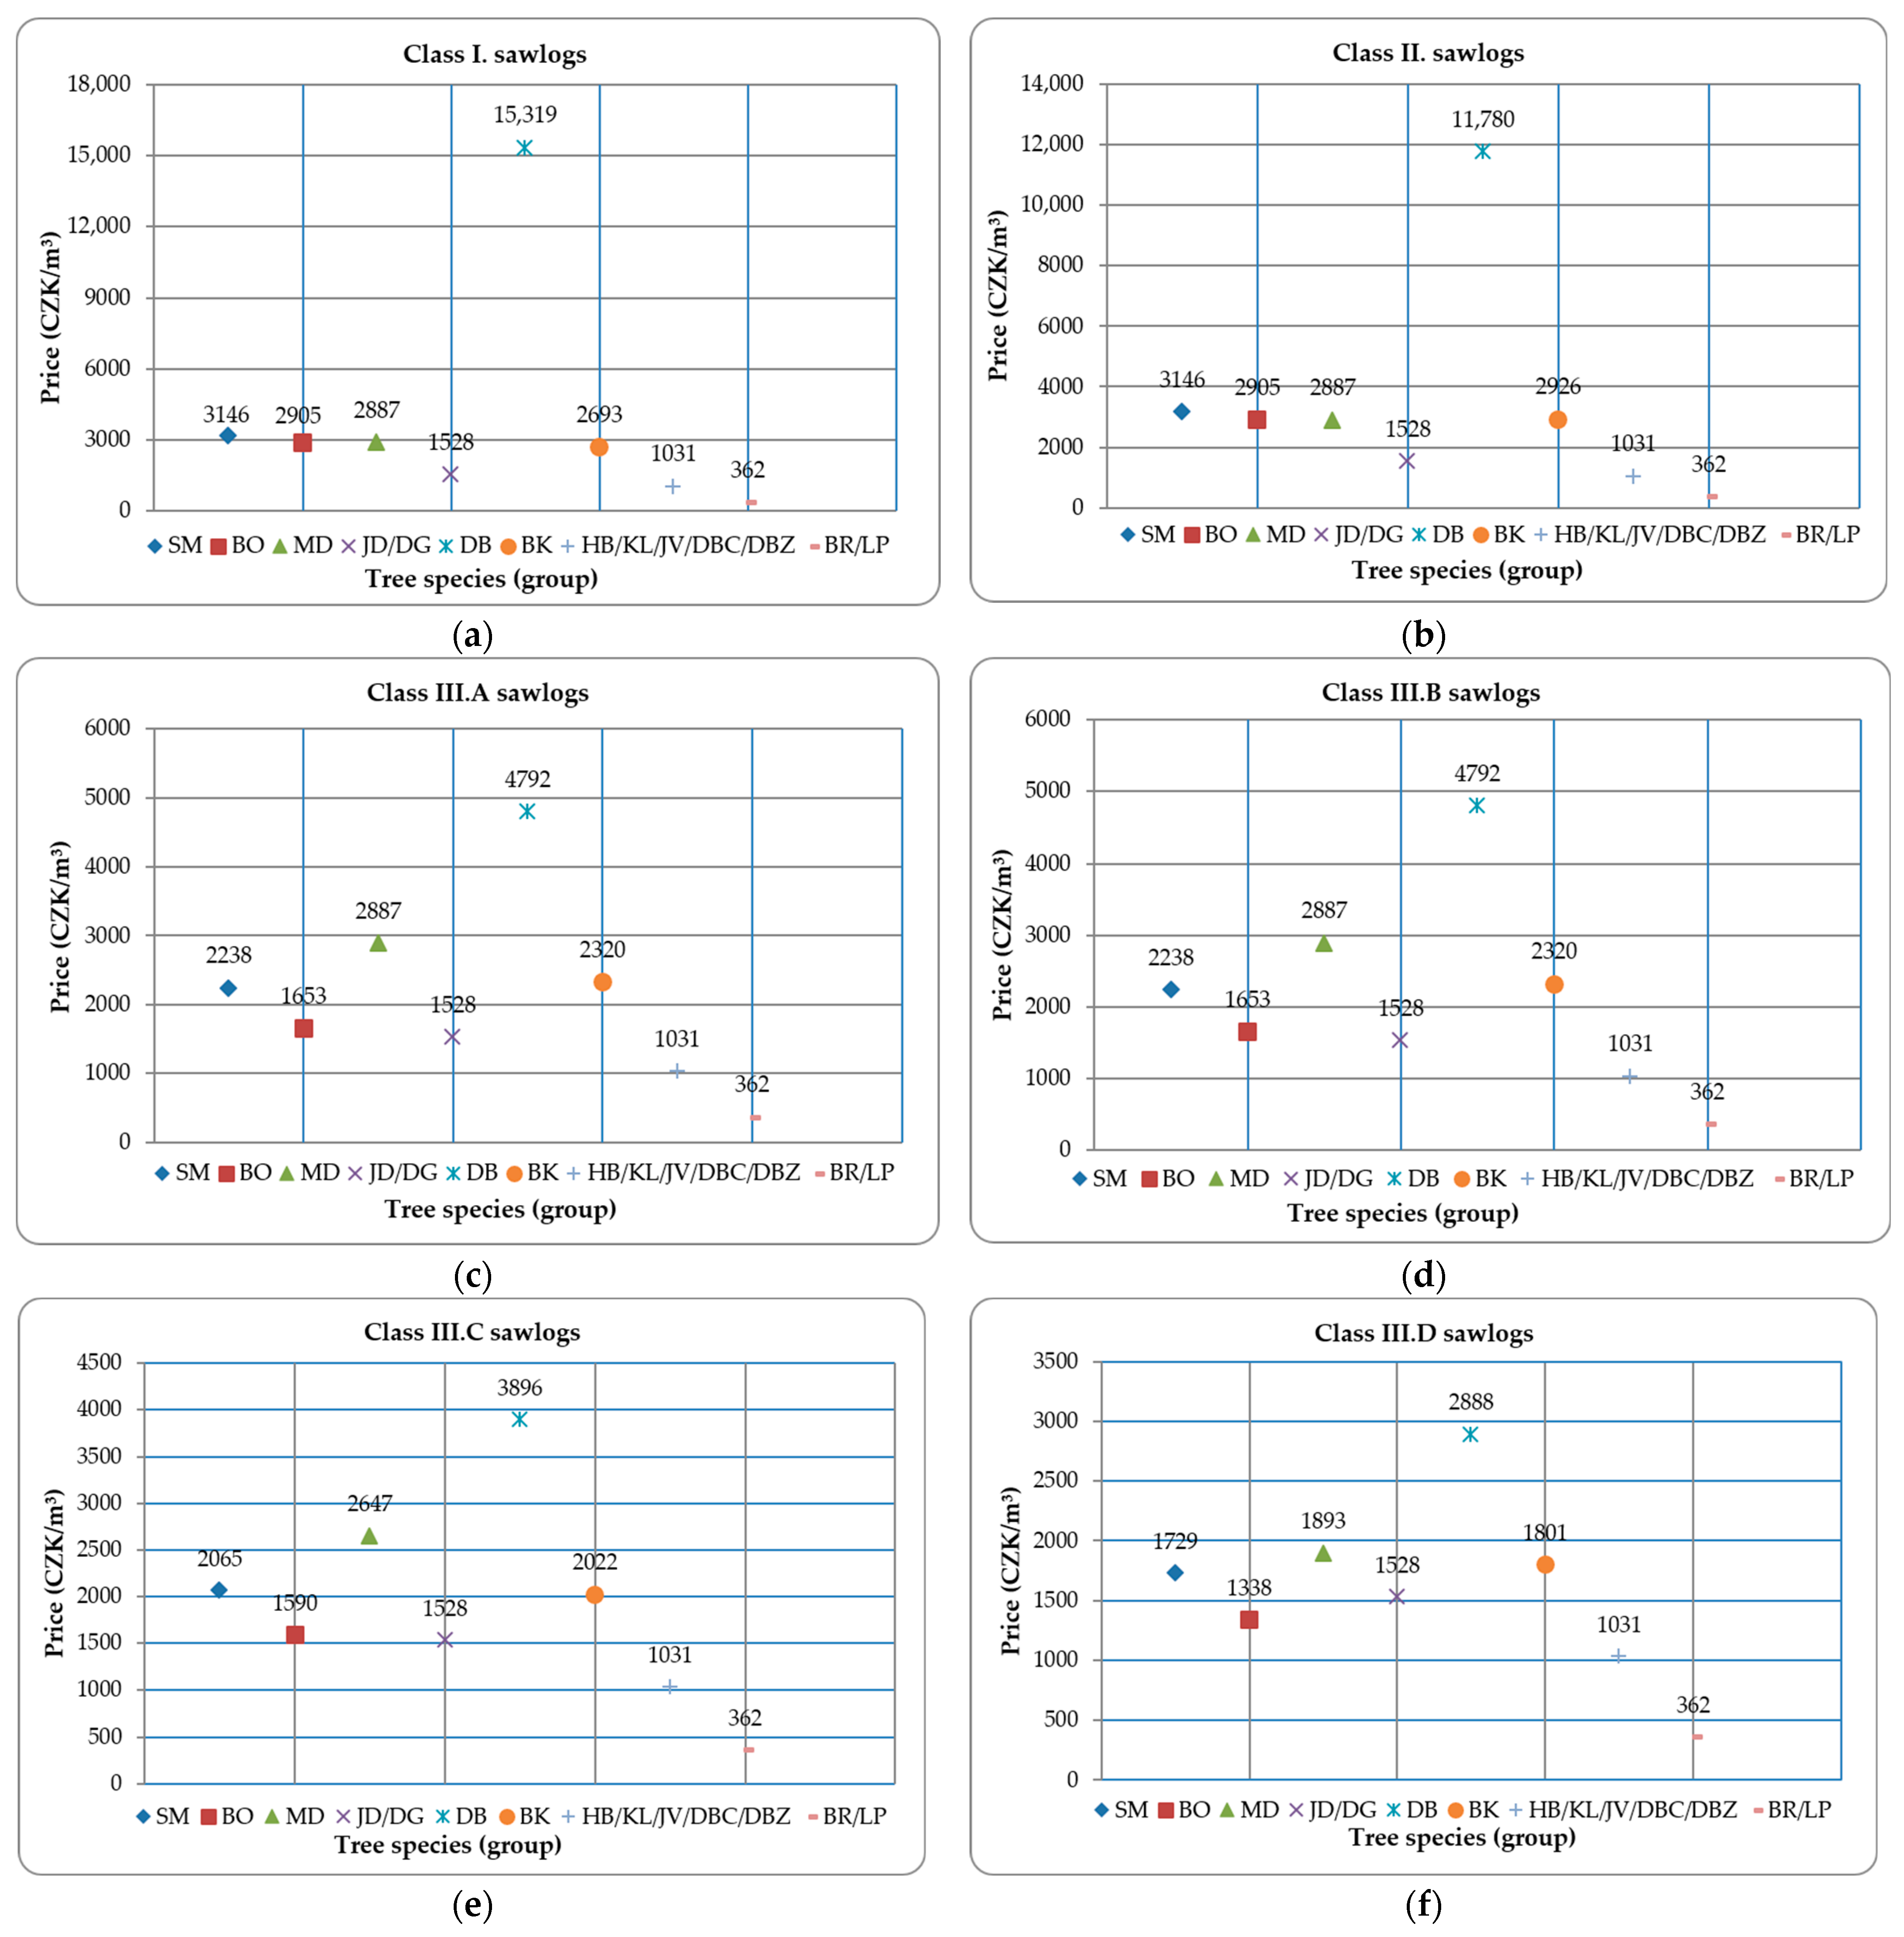
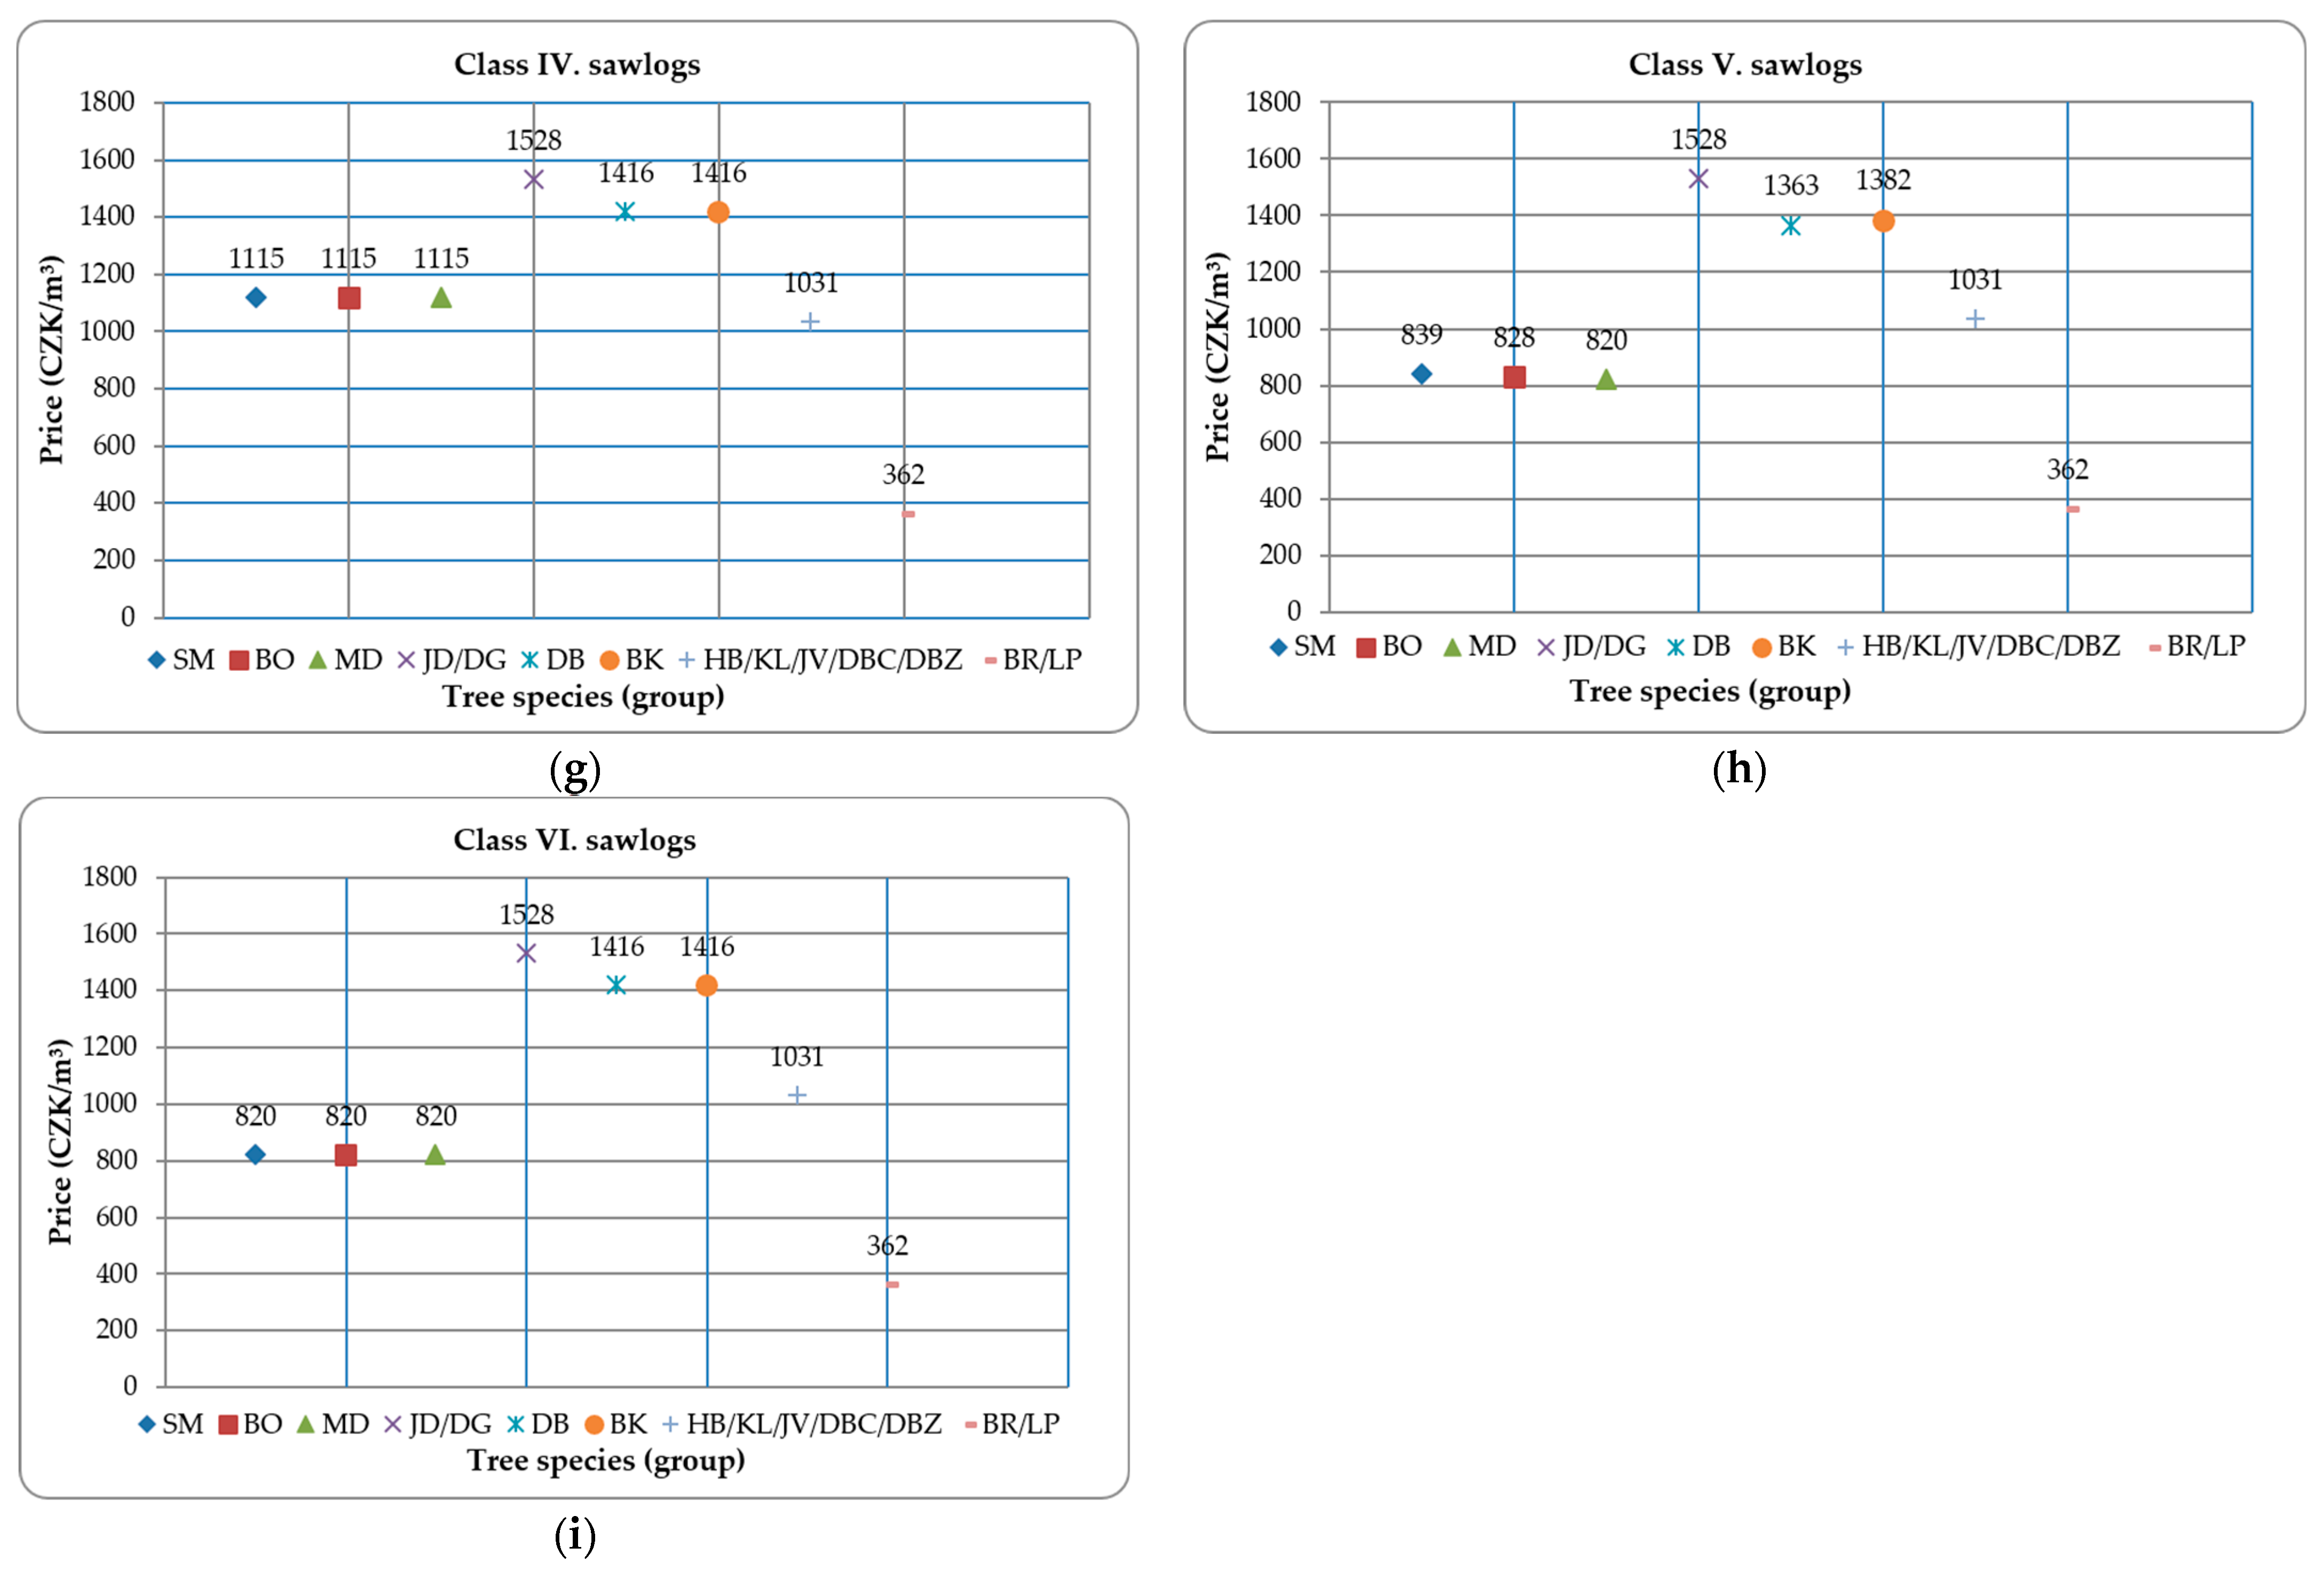
To calculate economic efficiency, price data were compiled from several sources to ensure consistency and representativeness of the price inputs. For the main commercial tree species (spruce, pine, larch, oak, beech), average realized timber prices were taken from the Green Reports issued by the Ministry of Agriculture and aggregated into a five-year average (2020–2024). The same data sources were used for the price values visualized in Figure 2 and for the revenue calculations presented in Table 3. This approach reduces the influence of individual annual anomalies in timber prices during the reference period 2020–2024.
For other tree species lacking national macroeconomic price statistics, prices were obtained from public tenders (procurement procedures) of the state enterprise Forests of the Czech Republic (Lesy ČR, Hradec Králové), which manages roughly half of the nation’s commercial forests and thus represents a relevant source of market-based prices. Five-year averages were also used here.
All price data were structured according to the assortment classification defined in the Recommended Rules for Timber Measurement and Classification in the Czech Republic, enabling direct linkage with the assortment specific volume structure identified during field surveys. This unified methodology ensures compatibility between price inputs and production parameters and provides the basis for calculating the revenue component in assessing productive performance and economic efficiency.

2.6. Methodology for Determining Cost Inputs

The cost component of the economic efficiency assessment was defined using average unit costs based on national statistical data for selected forest management operations, which represent key activities related to regeneration, silvicultural care, and harvesting. The cost structure included the following items:
  • forest regeneration
  • tending of forest crops
  • cleaning operations (pre-commercial thinning)
  • forest protection
  • total silvicultural operations
  • timber harvesting (Extraction distances to the roadside timber depot within the evaluated stands range from approximately 60 to 680 m (median = 220 m). These values represent normative extraction distances corresponding to standard operational conditions in forestry and serve as an explanatory reference for the cost items associated with timber harvesting and extraction)
  • timber extraction (skidding/forwarding)
  • timber transport
  • maintenance and repair of forest roads
Based on this range, it can be stated that the application of average cost values for harvesting and extraction is not significantly affected by the methodology used. At the same time, differences in the density of the forest road network among individual stands should be acknowledged. However, the influence of road network density on the cost component is difficult to quantify and cannot be reliably incorporated into individual cost items without detailed spatial analysis.
Units were specified according to the type of operation: silvicultural activities were expressed per hectare of forest land, whereas harvesting operations were expressed per cubic meter of timber. To ensure comparability and limit the influence of short-term cost fluctuations, five-year averages for 2020–2024 were applied, corresponding to the same time frame used for the revenue component.
Cost data were sourced from national statistics published in the Green Reports of the Ministry of Agriculture, which provide average in-house costs for individual forestry operations differentiated by cost category. Other cost types were excluded due to insufficient structural data for model-based calculations. This methodology establishes a standardized framework for connecting cost inputs to production parameters, facilitating subsequent economic efficiency evaluation.

2.7. Methodology for Assessing the Economic Efficiency of Monocultures and Mixed Forests

Two core indicators were used to assess economic efficiency: the cost coefficient (Kn) and the economic efficiency coefficient (Ke). These indicators enable consistent comparisons between management variants regardless of stand size or total production volume, as they express the relationship between costs and revenues in relative terms (Kn = TC/TR; Ke = TR/TC), when TC = total costs; TR = total revenues.
  • Cost coefficient (Kn) is defined as the ratio of total costs to total revenues and expresses how many monetary units of cost are required to generate one monetary unit of revenue. This formulation reflects an economic perspective on efficiency rather than a purely technical cost-per-output measure. Lower Kn values indicate higher cost efficiency and are particularly useful for assessing the economic viability of management, especially in mixed stands where the cost structure may be more complex due to multiple tree species and differing silvicultural requirements.
  • Economic efficiency coefficient (Ke) is defined as the inverse ratio (Ke = TR/TC) and indicates how many monetary units of revenue are generated per unit of cost. Higher Ke values reflect better economic performance and facilitate comparison across stand types, including monocultures and mixed stands, which may differ in both revenue structure and management intensity.
Although both indicators are mathematically reciprocal, they are reported together to provide complementary interpretative perspectives: Kn emphasizes cost intensity, whereas Ke highlights return efficiency. Together, these indicators provide a comprehensive perspective on management efficiency, accounting not only for absolute levels of costs and revenues but also for their mutual relationship, which is essential when evaluating stand structures in the context of long-term economic stability. It should be noted that Kn and Ke are static ratio-based indicators calculated from the observed stand-level assortment structure, realized timber prices, and selected management costs for the reference period 2020–2024. They do not incorporate the time value of money, full-rotation cash flows, or land expectation value. Dynamic investment criteria such as net present value (NPV), internal rate of return (IRR), or land expectation value (LEV, Faustmann approach) would require a complete time series of establishment, tending, thinning, protection, harvesting, and regeneration costs, as well as revenues over the full rotation period. Such data were not available at the required stand-level detail for all evaluated stands.

3. Results

The presented results are based on comprehensive field surveys conducted on sample plots across different Site Type Groups (STGs) in the Czech Republic. These represent contrasting ecological conditions ranging from lowland pine sites to submontane and montane beech and spruce types. The objective is to interpret the influence of tree species composition on the productive characteristics of forest stands and their economic efficiency. The dataset includes the volumetric distribution of timber across diameter-based assortment classes (I, II, III_A–III_D, IV, V, VI), enabling a detailed analysis of the assortment structure and its effects on production parameters.
The assortment analysis (see Table 2) presents total volumes aggregated into combined assortment groups (I–II, III_AB, III_CD, IV, V–VI) and the percentage of individual tree species within each stand. The consolidation of detailed diameter classes (I, II, III_A–III_D, IV, V, VI) into five combined assortment groups was performed to simplify the structure and improve clarity in interpreting results.
At the same time, volumetric data were aggregated from the level of individual tree species within a stand to the stand level. This made it possible to quickly compare assortment structure across sites. Percentages of tree species within each combined group were retained to preserve species-composition information despite the reduction of detailed classes. The reduction was performed solely by summing related classes, without modifying the original values, thereby ensuring full compatibility with field-measurement data.
Tree species composition within individual assortment groups is expressed using standardized tree species abbreviations corresponding to Czech species names, with their English equivalents provided: BO—Scots pine, SM—Norway spruce, JD—silver fir, MD—European larch, DG—Douglas fir, DB—oak, DBZ—sessile oak, DBC—Northern red oak, BK—European beech, HB—hornbeam, LP—lime/linden, BR—birch, JV—Norway maple, and KL—sycamore maple. Percentage values indicate the proportional representation of individual tree species within each assortment class.
Variation in stand composition and structure strongly influenced the representation of tree species across assortment groups. The highest shares of assortment classes I–III were found in monocultures, particularly in the montane and submontane areas of the Beskydy Mountains. Stand M_BE_II_A reached a total volume of 1093.9 m3, of which 879.8 m3 belonged to classes I–III (80.4%). The total volume of stand LDM_BE_I_B was 979.4 m3, of which 813.5 m3 fell within classes I–III (83.1%). Stand M_BE_I_A similarly exhibited a high-volume concentration within the highest-quality assortment classes. High shares of classes I–III were also observed in monocultural stands in the Křtiny region, especially in M_KR_A_SM and M_KR_A_BK, where high standing volume led to a greater concentration of higher-value assortments.
A distinct intermediate group is formed by stands with a low degree of mixing, in which the proportion of assortment classes I–III generally falls between the values observed in monocultures and mixed stands. This category includes stands LDM_PO_A_BO, LDM_HK_B, which achieve relatively high total volumes but exhibit slightly lower concentrations of the highest-quality assortments compared with pure monocultures. This outcome reflects a more balanced volume distribution across the assortment classes due to the presence of accompanying tree species.
In mixed stands, the highest values were observed for MX_PO_B, MX_SU_B_BO_SM, and MX_SU_B_SM_BK, with total volumes ranging from 404.5 to 560.5 m3. The proportion of classes I–III ranged from approximately 71% to 79%, reflecting the combined influence of species diversity and the differing growth characteristics of individual species. Mixed stands thus continue to exhibit a substantial share of high-quality assortments, albeit with a reduced concentration than in monocultures.
Among the structurally differentiated stands, the highest measured volume was recorded in SD_BE_III_C, totaling 881.8 m3, of which 699.6 m3 (79.3%) belonged to classes I–III. Stands SD_KR_C and SD_PO_C also displayed elevated but more evenly distributed volumes across the assortment classes. This interpretation does not imply that structural heterogeneity necessarily reduces total standing volume. Rather, in the evaluated stands, greater age and diameter differentiation was associated with a broader distribution of timber among assortment classes, including a relatively higher share of lower-dimension or lower-quality assortments. As a result, the concentration of volume in the highest-value classes I–III was lower than in several less structurally differentiated stand.
To evaluate timber price parameters, data on average realized domestic timber prices were compiled and harmonized by tree-species group and assortment class. The values shown in Figure 2 represent five-year average prices for 2020–2024 expressed in CZK/m3. In each panel, the x-axis represents tree species or aggregated tree-species groups, while the y-axis represents the average realized timber price in CZK/m3. Numeric labels placed near the points indicate the corresponding average price values. The price data were derived from the Green Reports of the Ministry of Agriculture of the Czech Republic for the main commercial tree species and from public tender data of Forests of the Czech Republic (state enterprise) for less-represented species; all values were further processed by the authors.
Prices varied substantially among assortment classes and tree species groups (Figure 2). For clarity, abbreviations denoting the main economically important species are used. Within the coniferous group, the abbreviations SM (Norway spruce), BO (Scots pine), MD (European larch), and JD/DG (silver fir and Douglas fir) are applied. Broadleaved species are represented by DB (oak) and BK (European beech), while other hard broadleaved species are aggregated under the combined category HB/KL/JV/DBC/DBZ (hornbeam, sycamore maple, Norway maple, Northern red oak, sessile oak), and other soft broadleaved species are included in the group BR/LP (birch, linden).
The values presented are based on aggregated price data organized by assortment classification and represent average realized prices for raw timber in the domestic market. Graphical processing enables comparison of price differences between tree species groups and assortment classes, serving as a basis for the subsequent assessment of the economic parameters of the stands.
Revenue for each assortment class was calculated directly from field-measured volumes and corresponding price data. Indicators were reported only for those tree-species groups and assortment-class combinations that were actually represented in each stand. Where a given stand did not contain a particular tree-species group within the relevant quality classes, the corresponding statistic was considered not applicable rather than missing. The table below (Table 3) provides an overview of total revenues aggregated across assortment classes I–VI, as well as the average monetization of higher-value assortments (I–III) and lower-quality assortments (IV–VI), expressed as their proportional contribution to total revenue. This overview forms the foundation for the subsequent evaluation of the economic significance of individual stand categories—monocultures, mixed stands, and structurally differentiated stands.
For international comparison, all monetary values were converted from Czech crowns (CZK) to euros (EUR) using the five-year average CZK/EUR exchange rate of 24.794. The use of a long-term average exchange rate eliminates short-term fluctuations in currency markets and ensures more stable and internationally interpretable economic indicators across the studied stands and localities.
The table summarizes the price levels of individual forest stands using average realized timber prices (CZK/m3), differentiated by quality classes I–III and IV–VI, as well as by tree-species group (coniferous and broadleaved). The columns “Average revenue of classes I–III—coniferous” and “Average revenue of classes I–III—broadleaved” present weighted average prices for higher-value assortments. The final column, “Average revenue of assortments I–VI”, expresses the overall weighted average price across all assortment classes and both coniferous and broadleaved species within a given stand. The indicator “Stand revenues” captures the actual financial return generated by the interaction of harvested volume and unit prices.
This structure enables comparison of price levels among individual stands, supports identification of the effects of assortment quality and species composition on economic performance, and serves as the basis for analyses of price differentials, benchmarking, index construction, and scenario-based management, in which shifts in quality structure or species composition directly influence a stand’s overall price level.
Monocultural stands exhibit a strong dependence of their overall price level on the share of broadleaved species within the high-quality assortment classes (I–III). Representative examples include M_PO_A_DB (average monetization of assortments I–VI ≈ 2496.50 CZK/100.7 EUR/m3; classes I–III—broadleaved ≈ 5690 CZK/≈ 229.5 EUR/m3) and M_HK_A_DB (I–VI ≈ 1955.19 CZK/78.9 EUR/m3; classes I–III—broadleaved ≈ 3835.13 CZK/154.7 EUR/m3). In these cases, the high prices of premium broadleaved assortments substantially increase the overall weighted average.
By contrast, conifer-dominated structurally differentiated stands as SD_BE_I_C (I–VI ≈ 1644.30 CZK/66.3 EUR/m3) and SD_BE_II_C (I–VI ≈ 1622.34 CZK/65.4 EUR/m3) achieve comparatively high prices in classes I–III (typically above 2100 CZK/≈85 EUR/m3), but decreased monetization of assortments IV–VI reduces their overall price level.
Stands with a low degree of species mixing represent a transitional category between monocultures and fully mixed stands. Within this group, LDM_PO_A_BO, LDM_HK_B, and LDM_BE_I_B achieve average monetization of assortments I–VI of approximately 2085.70 CZK/84.1 EUR/m3 (LDM_PO_A_BO), 1930.80 CZK/77.9 EUR/m3 (LDM_HK_B). and 1583.6 CZK/63.9 EUR/m3 (LDM_BE_I_B).
In LDM_PO_A_BO, the higher price level is driven by the strong contribution of expensive broadleaved assortments in classes I–III (≈4138.43 CZK/166.9 EUR/m3), while in LDM_HK_B, this effect is attributable primarily to oak (≈3605.80 CZK/145.4 EUR/m3). The monoculture M_BE_II_B by contrast, is characterized by a more even coniferous price profile in classes I–III (≈2078.30 CZK/83.8 EUR/m3), consistent with the strong dominance of spruce in the stand. These results show that even limited proportions of accompanying broadleaved species can significantly influence a stand’s final price level, sometimes bringing it close to that of stands with more diverse species composition.
Mixed stands exhibit greater variability in economic outcomes, depending on their assortment structure and species-specific price profiles. Stand MX_PO_B achieves an average monetization of assortments I–VI of approximately 2057.89 CZK/83.0 EUR/m3, confirming that a well-balanced combination of species composition and quality structure can produce above-average economic performance.
Conversely, MX_SU_B_BO_SM (classes I–VI ≈ 712.11 CZK/28.7 EUR/m3) and SD_SU_C (classes I–VI ≈ 688.29 CZK/27.8 EUR/m3) illustrate that species mixture or structural differentiation alone does not guarantee high monetization, and that both assortment-quality structure and achieved market price levels play a decisive role.
Structurally differentiated stands are characterized by a more balanced distribution of prices across assortment classes, which helps offset the negative impact of lower-priced assortments. Stands MX_KR_B (I–III total ≈ 2066.83 CZK/85.0 EUR/m3; IV–VI ≈ 1550.00 CZK/62.5 EUR/m3; I–VI ≈ 1630.51 CZK/65.8 EUR/m3), and SD_KR_C (I–VI ≈ 1569.83 CZK/63.3 EUR/m3) show a less concentrated monetization profile compared with stands dominated by a narrowly structured assortment composition.
Higher structural diversity thus contributes to a broader assortment-based revenue structure across individual quality classes. Thus, increasing economic value requires either enhancing the share of broadleaved species in high-quality assortments or broadening the assortment-based revenue structure through structural diversification. After the revenue component had been derived from stand-level assortment volumes and corresponding timber prices, the cost component was incorporated into the economic assessment. For this purpose, standardized average unit costs of selected forest management operations were used, covering silvicultural, harvesting, extraction, transport, and road-maintenance activities. These cost inputs provide the basis for calculating the relationship between generated revenues and required management costs in the subsequent efficiency analysis. The applied cost parameters are summarized in Table 4.
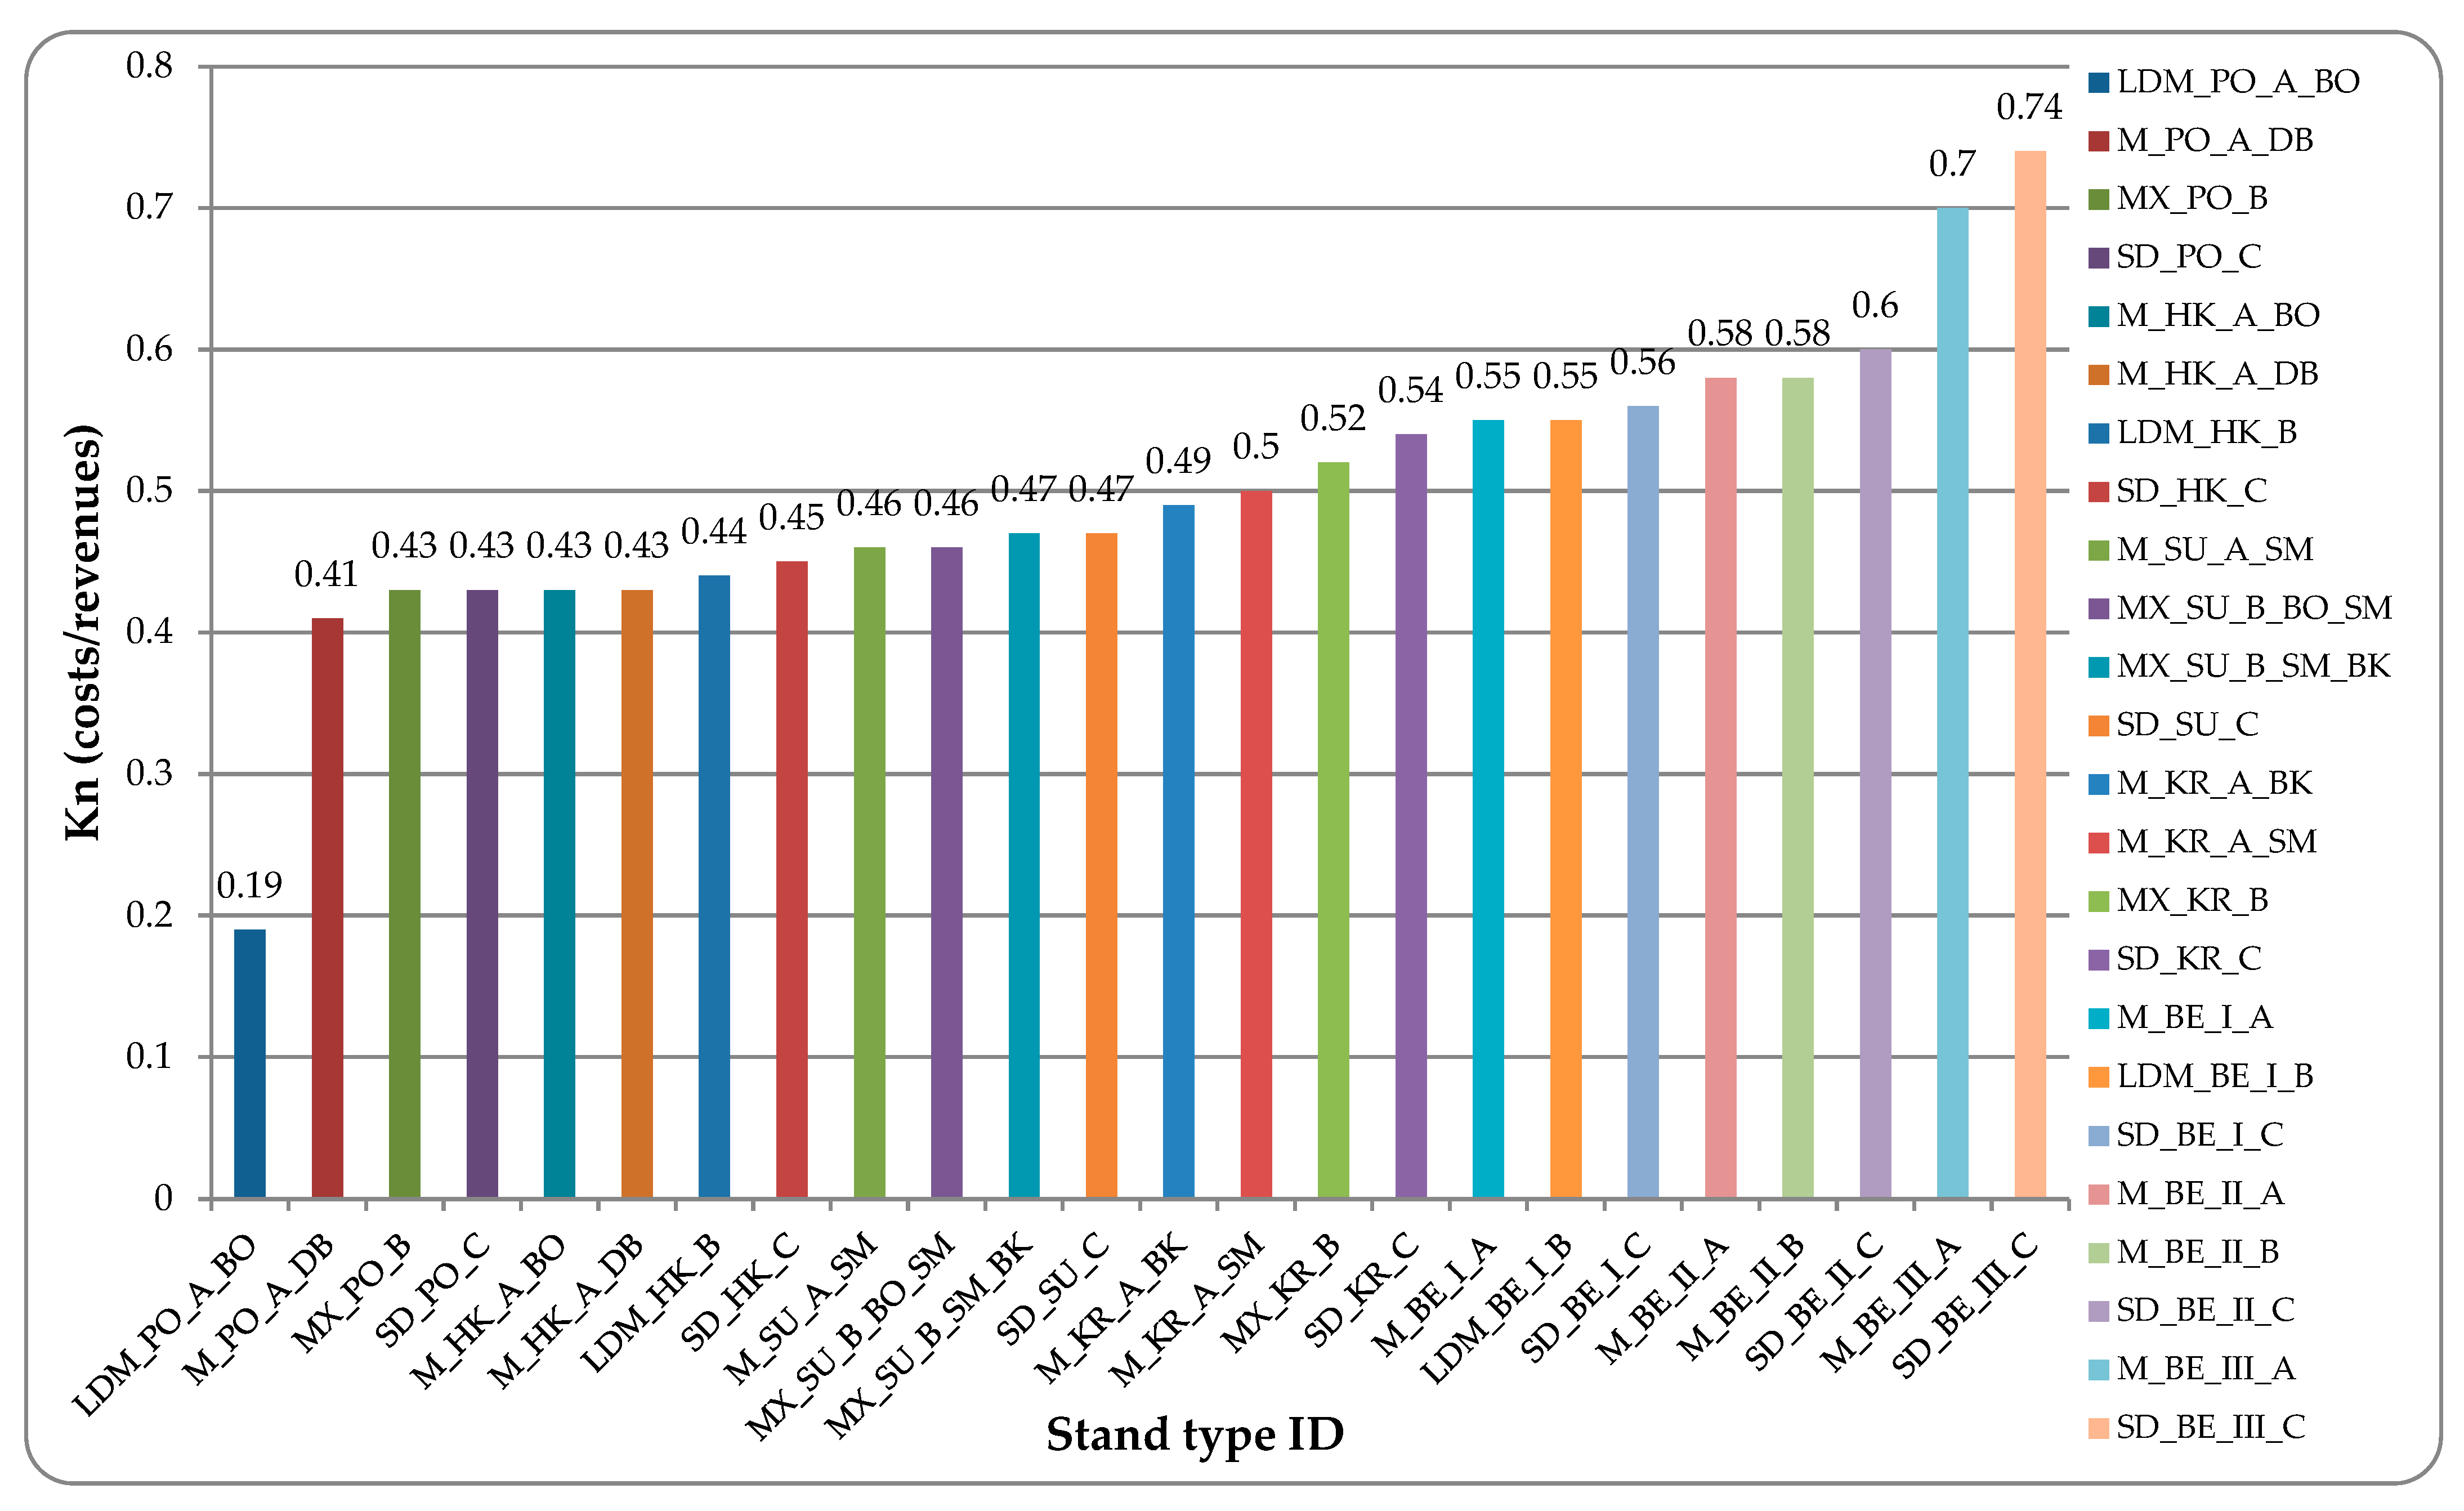
Using the revenue parameters presented in Table 3 and the standardized cost inputs summarized in Table 4, two key indicators were calculated to assess the economic performance of the evaluated stands: the cost coefficient (Kn) and the economic efficiency coefficient (Ke). These indicators express the relationship between achieved assortment monetization and the corresponding cost component, enabling an objective comparison of economic performance among individual management variants. Although Kn and Ke are mathematically reciprocal, their joint graphical presentation offers an important interpretative advantage. While Kn captures the cost intensity required to generate revenues, Ke reflects the efficiency with which invested costs are transformed into economic returns. This complementary perspective is particularly useful when comparing stands that differ in species composition and structural complexity, because economic performance depends not only on the volume of production, but also on assortment quality and its monetization potential.
The values of both indicators varied substantially among stands, indicating clear differences in economic performance across the evaluated management variants.
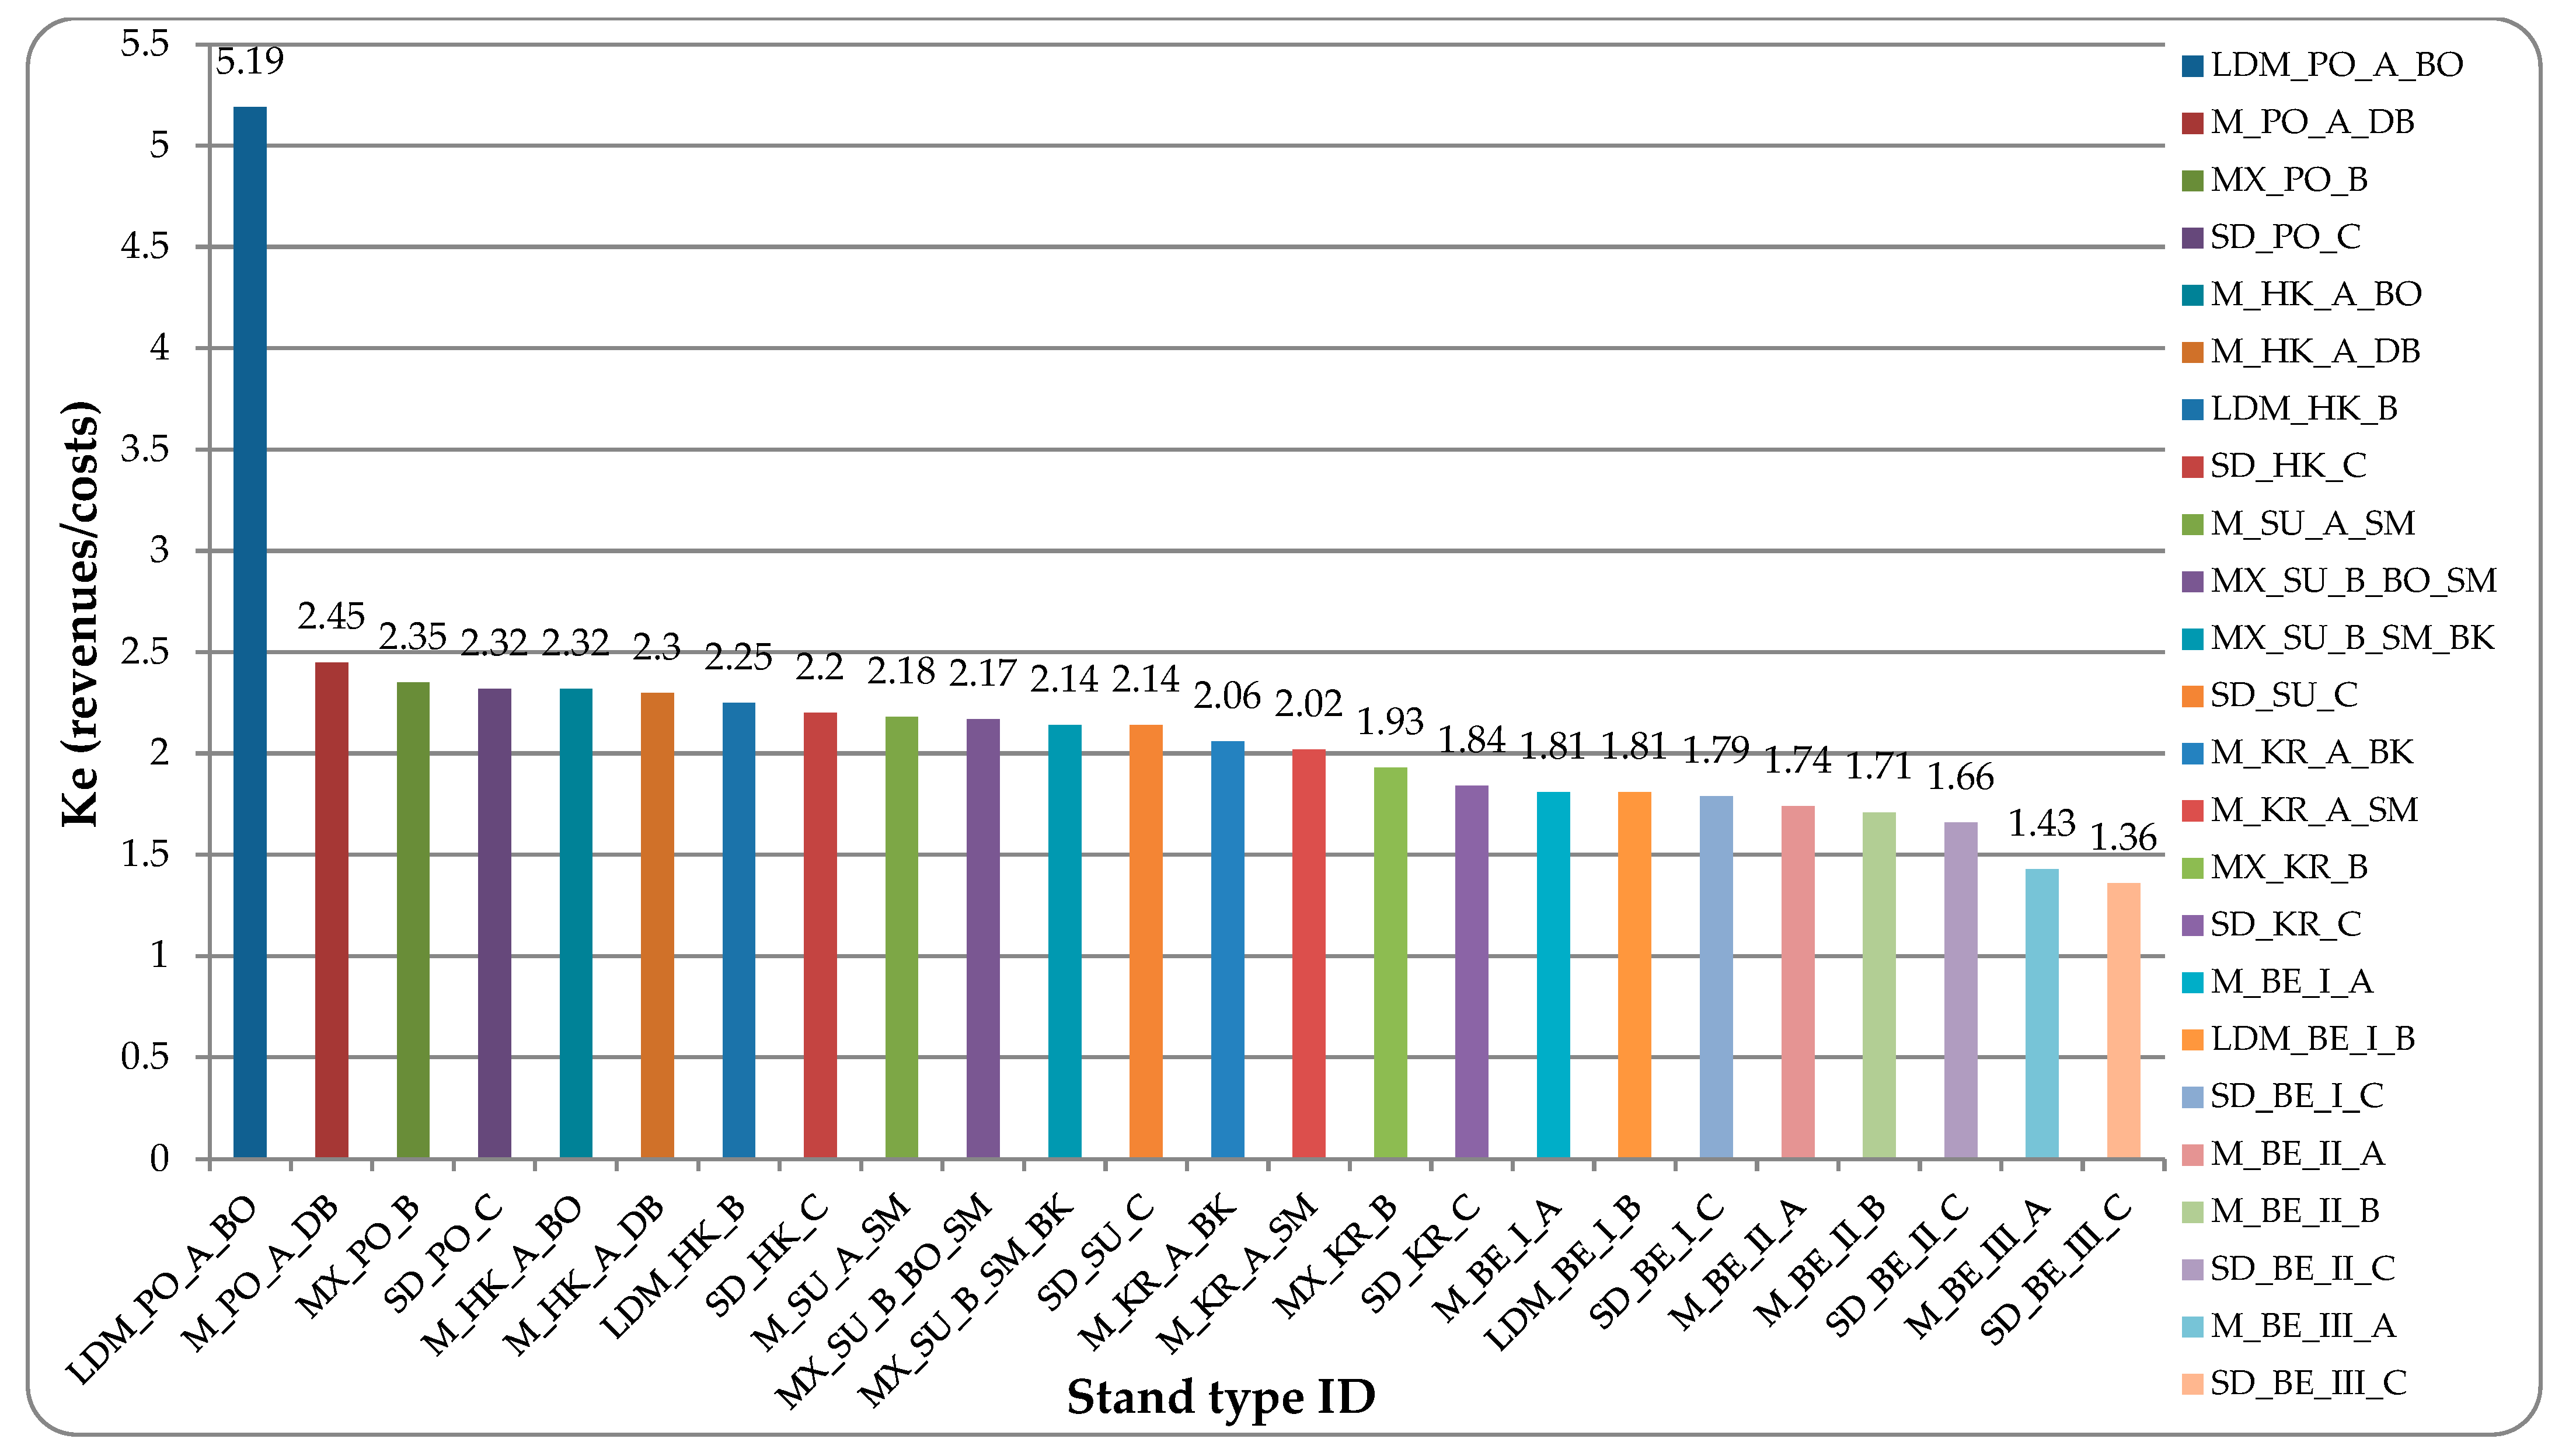
Values of both indicators (Kn and Ke) differ substantially across stands (Figure 3 and Figure 4).
The analysis demonstrated that assortment classes I–III represent a key factor in the economic efficiency of the evaluated forest stands. On average, classes I–III account for approximately 88.7% of total revenues, while their share of total volume amounts to 78.6%. This imbalance clearly indicates that higher-quality assortment classes generate a disproportionately higher share of revenues relative to their volumetric representation. Consequently, the entire portfolio reaches a cost coefficient (Kn ≈ 0.457) and an economic efficiency coefficient (Ke ≈ 2.186), meaning that approximately 0.46 units of cost are required per unit of revenue, or conversely, that each unit of cost generates 2.19 units of revenue.
From the perspective of stand categories defined according to the degree of species mixture and spatial stand structure as outlined in the methodological section pronounced differences in the economic performance of individual groups become evident.
Monocultures, characterised by the dominant representation of a single tree species exceeding 90% and the absence of significant vertical or horizontal differentiation (n = 10), achieve the lowest weighted cost coefficient (Kn ≈ 0.409) and simultaneously the highest weighted economic efficiency (Ke ≈ 2.443). These stands exhibit a high weighted revenue share of assortment classes I–III (≈89.6%) alongside a volume share of ≈79.6%, confirming the strong influence of the concentration of higher-quality assortments on overall economic performance.
Stands with a low degree of mixing, defined by the pronounced dominance of one main species (typically 70%–95% of total volume), complemented by smaller shares of stabilising accompanying species (n = 3), reach Kn ≈ 0.487 and Ke ≈ 2.052. Their economic indicators fall between those of monocultures and fully mixed stands, reflecting their transitional nature in terms of both species composition and stand structure.
Mixed stands, characterised by a more balanced representation of two to three species without strong dominance of a single component and with partial structural differentiation (n = 4), achieve a weighted Kn ≈ 0.507 and Ke ≈ 1.973.
The revenue share of assortment classes I–III is ≈86.8%, while their volume share is ≈77.0%, reflecting a lower concentration of premium assortments and higher heterogeneity of the production structure compared with monocultures.
Structurally differentiated stands, defined by higher species diversity (three or more species), pronounced vertical and horizontal differentiation, and a higher degree of naturalness (n = 7), show the highest cost coefficient (Kn ≈ 0.612) and the lowest economic efficiency (Ke ≈ 1.635). These stands reach a lower revenue share of assortment classes I–III (≈76.3%) and a lower volume share (≈67.4%), confirming that a higher proportion of lower-quality assortments is associated with reduced overall economic performance. The results clearly confirm that a higher representation of assortment classes I–III, both in volume and in revenues, is systematically associated with lower cost intensity and higher economic efficiency, with this relationship being strongest in monocultures and, to a lesser extent, in stands with a low degree of mixing. The most economically efficient stands (e.g., M_PO_A_DB, M_HK_A_DB, LDM_BE_I_B) exhibit a revenue share of assortment classes I–III ≥ 90%, with Kn values ranging from 0.19 to 0.43 and Ke values between 2.32 and 5.19. These stands belong to the category of monocultures and low-diversity mixed stands, consistent with the overall pattern of higher economic efficiency observed in stands with low species and structural differentiation. Conversely, stands with a lower share of assortment classes I–III (e.g., M_KR_A_BK and SD_KR_C) show higher cost coefficients (Kn ≈ 0.47–0.74) and lower economic efficiency (Ke ≈ 1.36–2.14). M_KR_A_BK represents a beech monoculture with a low proportion of high-quality assortments, whereas SD_KR_C is a structurally differentiated stand with a higher representation of classes IV–VI. From a practical standpoint, this suggests that assortment optimization remains an important management lever, particularly where it can be achieved without increasing unit costs. By contrast, higher species and structural diversity primarily provide stabilising and ecological functions, rather than maximising short-term economic returns.

4. Discussion

The results of the study confirm that stand structure significantly influences the economic efficiency of forest management. The analysis revealed differences among forest-stand categories, reflected in the values of the cost coefficient and the economic efficiency coefficient. Monocultures exhibit lower cost intensity and greater efficiency, whereas stands with a higher degree of species and structural differentiation (mixed and structurally differentiated stands) achieve more conservative values under the applied unit input parameters. Similar differences between even-aged, uneven-aged, pure, and mixed stand management have been reported in studies that emphasize the importance of regeneration assumptions, harvesting costs, timber prices, interest rates, and optimisation criteria for economic outcomes [88,89,90].
The higher economic efficiency of monocultures observed in this study is a robust result within the applied static cost–revenue framework. It primarily reflects the observed assortment structure, realized timber prices, selected management costs, and the disproportionate contribution of assortment classes I–III to total revenues. However, this result should be interpreted only within the limits of the applied static cost–revenue framework and not as a complete long-term economic ranking of stand types, because disturbance risks, post-disturbance restoration costs, regeneration pathways, price volatility, discount-rate sensitivity, and dynamic cash flows over the full rotation period were outside the scope of the present model [88,89,91,92]. These findings indicate that simpler stand structures may appear more advantageous from the perspective of current economic indicators; however, their interpretation requires a broader context of long-term management stability.
The study uses five-year averages of prices, costs, and ratio-based indicators, providing a consistent basis for comparing recent cost–revenue relationships across the evaluated stands. The reference period 2020–2024 reduces the influence of short-term annual anomalies in prices and costs and supports a retrospective comparison of current economic performance. At the same time, it should be interpreted as a static retrospective reference period rather than as an intertemporal analysis of long-term economic trends. This limitation is particularly important when the results are compared with studies evaluating forest management over full rotation periods or under stochastic disturbance, price, and interest-rate conditions [88,89,90,91,92,93]. Assessing temporal decline in economic performance or long-term price stability would require longer time series of timber prices, costs, disturbance occurrence, and stand development. A further limitation of the present assessment is the absence of a full present-value analysis. This is consistent with forest economic literature showing that conclusions about the relative profitability of even-aged and uneven-aged systems are highly sensitive to the assumed regeneration mechanism, harvesting costs, timber price structure, interest rate, and optimisation criterion. In particular, studies from Fennoscandian conditions demonstrate that the economic ranking of management systems may change after regeneration costs, harvesting costs, stumpage prices, and discounting are included in the optimisation framework [88,89]. Stochastic extensions of the Faustmann framework further show that future stand states and timber prices should ideally be treated probabilistically rather than as deterministic inputs when assessing long-term forest value [91,92]. Dynamic approaches such as NPV, IRR, or Faustmann land expectation value would provide a more appropriate framework for comparing the long-term financial performance of different stand structures, particularly because rotation age, the timing of silvicultural interventions, and delayed revenues strongly affect forestry profitability. However, applying such an approach would require complete stand-specific cash-flow trajectories over the full rotation period, including establishment and regeneration costs, tending and thinning operations, protection costs, intermediate revenues, final harvest revenues, disturbance-related losses, restoration costs, and an explicitly defined discount rate. The available dataset was designed to compare mature stands using observed assortment structure, recent price inputs, and selected cost components, rather than to reconstruct full-rotation investment histories. Therefore, the present results should be interpreted as a static comparison of current cost–revenue relationships, while NPV-, IRR-, or LEV-based evaluation represents an important direction for future research.
A further limitation concerns the simplified representation of establishment and regeneration costs within the calculation framework described in Section 2.6. The present model is based on standardized unit input parameters and selected cost components, which provide a consistent basis for comparing recent cost–revenue relationships among the evaluated mature stands. However, the model does not differentiate stand-specific regeneration pathways, such as planting, natural regeneration, tending, protection, fencing, repeated regeneration operations, or species-specific regeneration success. This is important because regeneration and establishment assumptions can substantially affect the economic ranking of forest management alternatives. Recent cost-modelling approaches at the European scale explicitly distinguish regeneration, afforestation, continuous-cover forestry, species groups, and spatial variability, illustrating that a more differentiated treatment of costs requires a substantially broader data basis than was available in the present study [94].
This limitation is particularly relevant for uneven-aged and structurally differentiated mixed stands, where continuous natural regeneration may reduce or partly replace planting costs. In Fennoscandian optimisation studies, the assumption of natural regeneration strongly influences the economic comparison between uneven-aged and even-aged systems [88,89]. Similarly, mixed-stand simulations from southern Sweden show that regeneration pathways may combine natural regeneration of birch with planting of Norway spruce, with important consequences for productivity and profitability [90]. Therefore, the cost efficiency of structurally differentiated stands may be underestimated if natural regeneration is not explicitly considered.
Species-specific regeneration costs also require attention. Norway spruce may regenerate successfully under a range of stand conditions, especially where soil scarification or suitable canopy conditions facilitate seedling establishment, whereas silver fir regeneration is more strongly constrained by site conditions and browsing pressure [95,96]. Several studies show that ungulate browsing can substantially reduce the density, height, and diameter of silver fir regeneration and may shift regeneration dynamics in favour of Norway spruce [97,98]. Protection measures such as fencing or individual browsing protection may therefore be necessary for fir regeneration, but these measures increase establishment costs and may be economically justified primarily where species conservation, adaptation, or long-term resilience objectives are considered alongside timber revenues [98]. These aspects were not included in the present static cost model and should be addressed in future studies using species-specific regeneration pathways, protection costs, discounting, and dynamic investment criteria.
From a practical point of view, the results show that optimizing the assortment mix and managing costs effectively are key elements for improving economic indicators. Mixed stands and low-diversity mixed stands, which exhibit higher cost intensity in this analysis, may achieve a better balance between economic efficiency and operational and ecological stability when assortment structure and technological procedures are appropriately adjusted. This practical conclusion is consistent with literature underscoring the unique performance characteristics of various stand types. This outcome aligns with studies indicating that the productivity advantage of mixed stands over monocultures is context-dependent and not always evident under comparable site conditions, particularly over short- to medium-term horizons [48,49,50]. At the same time, published syntheses and empirical studies emphasize that mixed and structurally differentiated stands can contribute to ecological resilience, reduce selected disturbance-related vulnerabilities, and support biodiversity and carbon-related ecosystem services [6,7,8,12,13,14,99]. Under conditions of climate change, adaptive management approaches based on species diversification, close-to-nature silviculture, decision-support systems, and predictive modelling are therefore recommended [3,6,9,10,11,18,100], while climate-sensitive growth responses in mixed stands further support the need to consider species composition in adaptive planning [44].
In other words, contemporary “static” economic indicators (Kn/Ke) capture the current cost-to-revenue relationship, whereas the literature demonstrates long-term resilience and multifunctionality through broader benefits that are only partially reflected in simple ratio-based calculations. In the context of the vulnerability of even-aged coniferous monocultures, particularly Norway spruce, to drought, heat, and disturbances [20,21,101,102], current Kn/Ke values in monocultures should not be interpreted as excluding the strategic advantages of mixed or structurally differentiated stands but rather as indicating their complementary role.
The proposed approaches promote the development of stands with higher species and structural differentiation, which maintain a high share of assortment classes I–III (economic quality) while simultaneously reducing risks and improving carbon balance (ecological stability). This approach aligns with the ecosystem-based disaster risk reduction (Eco-DRR) framework in mountain forests [17,36,37]. Furthermore, such management is highly compatible with current emission targets and policy frameworks [23], making it particularly suitable under shifting climate change scenarios [24,39,75].
At the stand level, the data suggest that a higher share of revenues from quality classes I–III is associated with lower cost intensity (Kn) and greater economic efficiency (Ke), typically in stands such as M_PO_A_DB, SD_BE_II_C, and LDM_BE_I_B. Conversely, stands with a smaller proportion of classes I–III (e.g., M_KR_A_BK, SD_KR_C) exhibit higher cost intensity and lower efficiency. This pattern corresponds with observations that improved assortment quality often linked to a greater proportion of broadleaved species in classes I–III increases average prices and subsequently enhances economic performance [12,13]. However, the present results confirm this relationship only at the level of economic indicators, not within the broader context of ecological stability.
From a management perspective, mixed stands should be designed to maintain high economic stability, as species and structural diversity effectively dampen volatility and disturbance risks [6,60,65]. Although these aspects are not directly assessed in this study, the interpreted data are relevant for drawing analogous long-term conclusions. Trade-offs between ecosystem services and production must also be considered. Several studies [79,80,84] show that increased biodiversity may, in certain species compositions, reduce short-term production and increase management complexity or costs, although it significantly strengthens long-term resilience and ecosystem stability [1,31,81,85]. This indicates that decisions on appropriate stand structure must balance immediate economic outcomes with long-term benefits for stability and risk resilience.
Against the backdrop of the synthesis of expert knowledge, the increased risk of disturbances emerges as a factor determining the urgency of finding alternatives to monocultural forests. The economic results presented in this study are based on a five-year reference period (2020–2024) and should therefore be interpreted as a static, retrospective assessment of recent economic conditions rather than as a forecast in the strict sense of predicting future developments. This limitation is particularly relevant when contrasted with disturbance dynamics, which operate over longer temporal horizons. For disturbance risk forecasts (to ensure the methodology can be replicated across regions), the five-year time horizon is very limiting and may limit the level of argumentation regarding the accuracy of the results. However, in the case of the Czech Republic, this interval can be considered relatively reliable based on the latest disturbances that have affected the territory of the Czech Republic (Jeanett 10/2002; Kiryll 1/2007; Emma 3/2008; frost 12/2014; drought—78% of normal precipitation in 2015; Herwart 10/2017; drought—66% of normal precipitation in 2018). These disturbances demonstrate the short-term randomness of undesirable climate change effects; therefore, the 5-year time trend can be considered reliable for ex-post assessment of changes in impacts and prospects, using the example of the Czech Republic. The development and stochastic nature of disturbances under Central European conditions have been analyzed both within the regional context [103] and across broader European and international frameworks [39,101,102,104,105,106,107]. Of course, integrating disturbance recurrence intervals and their uncertainty into economic projections would yield more reliable estimates of expected returns rather than deterministic results, which is key to assessing the long-term viability of monocultures compared to mixed and structurally differentiated stands. In the Czech and Central European forestry context, recent disturbance events have contributed to reduced production reliability and market instability in disturbance-prone monocultures. However, the present stand-level analysis does not estimate a temporal decline in economic performance; rather, it provides a static comparison of cost–revenue relationships under recent market conditions.
In addition to the uncertainty associated with disruptions, long-term economic forecasts should also account for the stochastic variability of timber prices. Although five-year averages smooth out short-term fluctuations, they do not fully reflect cyclical or shock-induced market volatility. The inclusion of price distribution or scenario-based sensitivity analyses would clarify the extent to which price uncertainty affects expected returns, particularly when comparing monocultures with structurally diverse stands. However, in the context of the results presented in this article, these are partial research results, which need to be further developed into a more comprehensive approach to data analysis, which will also be based on interval changes in economic results based on real accounting information on management in selected areas (e.g., depending on the real costs of forest restoration, cultivation activities, thinning, timber harvesting (including skidding and transport), and taking into account the impact of time, e.g., through the net present value of future revenues.
Economic uncertainty associated with higher upfront costs and variable yields provides justification for adaptive management, scenario-based planning, and sensitivity analyses [1,27,28,84]. These approaches are highlighted in the introduction as essential for mitigating risks associated with diversification, allowing short-term economic impacts to be balanced against long-term gains in stability and resilience. In the context of our findings, this means that the short-term economic advantage of monocultures under current input conditions does not argue against diversification; rather, it emphasizes the need to design low-diversity mixed stands, mixed stands, and structurally differentiated stands in a way that maximizes the share of assortment classes I–III while also strengthening ecological resilience.
The interpretation of ratio-based indicators (Kn, Ke) is predicated on unit-based five-year averages and therefore provides a static view of efficiency. Future extensions incorporating dynamic economic methods—such as time value of money indicators (NPV/IRR), price volatility modeling, risk management tools, and the inclusion of carbon payments and credits—would allow for a more accurate assessment of the long-term economic performance of different stand structures.
In the context of the obtained results, more diverse stands cannot be regarded as economically superior to monocultures in terms of immediate cost–revenue efficiency. Their relevance lies rather in a broader management perspective: if disturbance risks, restoration costs, carbon-related benefits, and ecosystem services are considered, diversified and structurally differentiated stands may provide an important complement to economically efficient monocultures, particularly under increasing climatic and market uncertainty. Structurally differentiated stands show a more even distribution of monetization across assortments I–VI (typically 1550–1650 CZK/m3; 55.7–59.4 EUR/m3), while mixed stands display a broader yet still balanced monetization range (approximately 1680–2050 CZK/m3; 60.4–73.8 EUR/m3). Both groups simultaneously exhibit medium cost intensity (Kn ≈ 0.54–0.62) and corresponding economic efficiency (Ke ≈ 1.60–1.85). Similarly, broader replication of findings for structurally differentiated stands across a larger number of diversified stands and regions would enable more robust conclusions regarding their potential long-term economic and ecological role [11,39].
Across scientific and analytical studies, these approaches are consistently identified as crucial for balancing short-term economic impacts with long-term benefits for stability and resilience. In light of our findings, two key implications arise:
(i)
operationally (short- to medium-term), the targeted strengthening of the share of assortment classes I–III across stands through improved assortment optimization and cost management leads to improved Kn and Ke values regardless of stand category;
(ii)
strategically (long-term), economic evaluations should systematically incorporate disturbance risks, carbon flows, and protective functions.
Within this expanded perspective, mixed and structurally differentiated stands may achieve higher overall returns and improved resilience, and increase the temporal stability of wood production [9,12,13,14,75,99]. Future research should integrate ratio-based indicators (Kn/Ke) with dynamic metrics, such as NPV/IRR, price and discount scenarios, sensitivity analyses, explicit consideration of carbon payments, and modeling of management-change risks in favor of mixed stands over 20–50-year horizons. Testing combinations of species and spatial arrangements that maintain a high share of assortment classes I–III, while simultaneously enhancing resilience could substantially strengthen the case for diversified forests as fully competitive alternatives to current monocultures [6,8,43].

5. Conclusions

The analysis of 24 forest stands revealed that the economic efficiency of forest management depends heavily on the share of assortment classes I–III. These classes account for an average of 78.6% of total volume, yet generate 88.7% of the total revenues, confirming their essential influence on economic performance.
The aggregated coefficients for the entire portfolio reach Kn ≈ 0.457 and Ke ≈ 2.186, with monocultures exhibiting the lowest cost intensity (Kn ≈ 0.409) and the highest efficiency (Ke ≈ 2.443). Low-diversity mixed stands and mixed stands show higher cost coefficients (Kn ≈ 0.487–0.560) and poorer efficiency (Ke ≈ 1.75–2.05), while structurally differentiated stands achieve Kn ≈ 0.612 and Ke ≈ 1.635. This difference is driven by the increased proportion of lower-priced assortments (IV–VI) in stands with greater species and structural differentiation.
The most economically efficient stands were those achieving the highest Ke values and the lowest Kn values, with M_PO_A_DB reaching the best performance (Ke = 5.19; Kn = 0.19). Other highly efficient stands included M_KR_A_SM, SD_BE_II_C, LDM_BE_I_B, M_BE_II_A, and M_HK_A_DB, indicating that the highest economic efficiency was concentrated mainly among monocultures, although selected low-diversity mixed and structurally differentiated stands also achieved favourable results. These stands were generally characterized by a high contribution of assortment classes I–III to total revenues. Conversely, stands with lower revenue shares from these classes tended to show higher cost coefficients and lower economic efficiency. A central practical conclusion is that increasing the proportion and monetization of high-quality assortment classes I–III is associated with improved Kn/Ke values across stand categories defined by the degree of species and structural differentiation. The results indicate that monocultures achieved the highest immediate economic efficiency within the applied static cost–revenue framework, mainly due to their higher concentration of valuable assortment classes I–III. Species-diverse and structurally differentiated stands did not outperform monocultures in immediate cost–revenue efficiency, but they broadened the assortment structure and created a less concentrated revenue profile across quality classes. Their long-term economic role should be evaluated in a broader framework that also incorporates disturbance probability, restoration costs, carbon-related benefits, ecosystem services, and full-rotation cash flows. In the context of the growing importance of carbon payments and ecosystem services, their economic viability is becoming a central pillar of sustainable forest management.

Author Contributions

Conceptualization, J.M. and J.Č.; methodology, D.B.; software, M.K.; validation, J.Č. and D.B.; formal analysis, M.K.; investigation, J.Č.; resources, J.Č.; data curation, J.M. and M.K.; writing—original draft preparation, J.M.; writing—review and editing, D.B.; visualization, J.M.; supervision, J.Č.; project administration, J.Č.; funding acquisition, J.Č. All authors have read and agreed to the published version of the manuscript.

Funding

This research was funded by the National Agency of Agricultural Research Project No. QL26010393 (Sustainable forestry: The influence of forest stand structure on growth, natural regeneration, soil biodiversity, and long-term ecosystem stability).

Data Availability Statement

The data presented in this study are available on request from the corresponding author.

Acknowledgments

We would like to thank Richard Lee Manore, a native speaker, and Jitka Šišáková, an expert in the field, for checking the English of this manuscript.

Conflicts of Interest

The authors declare no conflicts of interest.

References

  1. Bont, L.G.; Blattert, C.; Rath, L.; Schweier, J. Automatic detection of forest management units to optimally coordinate planning and operations in forest enterprises. J. Environ. Manag. 2024, 372, 123276. [Google Scholar] [CrossRef] [Scilit] [PubMed]
  2. Mathys, A.S.; Bottero, A.; Stadelmann, G.; Thürig, E.; Ferretti, M.; Temperli, C. Presenting a climate-smart forestry evaluation framework based on national forest inventories. Ecol. Indic. 2021, 133, 108459. [Google Scholar] [CrossRef] [Scilit]
  3. Temperli, C.; Bugmann, H.; Elkin, C. Adaptive management for competing forest goods and services under climate change. Ecol. Appl. 2012, 22, 2065–2077. [Google Scholar] [CrossRef] [Scilit] [PubMed]
  4. Kilpeläinen, A.; Peltola, H. Carbon Sequestration and Storage in European Forests. In Forest Bioeconomy and Climate Change, 2nd ed.; Managing Forest Ecosystems; Springer: Cham, Switzerland, 2022; Volume 42, pp. 113–128. [Google Scholar] [CrossRef] [Scilit]
  5. Teben’kOva, D.N.; Lukina, N.V.; Chumachenko, S.I.; Danilova, M.A.; Kuznetsova, A.I.; Gornov, A.V.; Gagarin, Y.N. Multifunctionality and Biodiversity of Forest Ecosystems. Contemp. Probl. Ecol. 2020, 13, 709–719. [Google Scholar] [CrossRef] [Scilit]
  6. Brang, P.; Spathelf, P.; Larsen, J.B.; Bauhus, J.; Bončina, A.; Chauvin, C.; Drössler, L.; García-Güemes, C.; Heiri, C.; Kerr, G.; et al. Suitability of close-to-nature silviculture for adapting temperate European forests to climate change. Forestry 2014, 87, 492–503. [Google Scholar] [CrossRef] [Scilit]
  7. Larsen, J.B.; Angelstam, P.; Bauhus, J.; Carvalho, J.F.; Diaci, J.; Dobrowolska, D.; Gazda, A.; Gustafsson, L.; Krumm, F.; Knoke, T.; et al. Closer-to-Nature Forest Management. In From Science to Policy 12; European Forest Institute: Joensuu, Finland, 2022; 54p. [Google Scholar] [CrossRef]
  8. Mason, B. Encouraging Greater Use of Continuous Cover Forestry. Part 2: Wider Considerations. Q. J. For. 2021, 115, 46–54. Available online: https://www.prosilva.org/fileadmin/prosilva/4_News_Information/03_Articles_Presentations/01_articles_2017_2022/Mason_2021_ContinuousCoverForestry_part2_QJF_sm.pdf (accessed on 7 February 2026).
  9. Bugmann, H.; Seidl, R. The evolution, complexity and diversity of models of long-term forest dynamics. J. Ecol. 2022, 110, 2288–2307. [Google Scholar] [CrossRef] [Scilit] [PubMed]
  10. Maréchaux, I.; Langerwisch, F.; Huth, A.; Bugmann, H.; Morin, X.; Reyer, C.P.O.; Seidl, R.; Collalti, A.; Dantas de Paula, M.; Fischer, R.; et al. Tackling unresolved questions in forest ecology: The past and future role of simulation models. Ecol. Evol. 2021, 11, 3746–3770. [Google Scholar] [CrossRef] [Scilit] [PubMed]
  11. Nordström, E.-M.; Nieuwenhuis, M.; Başkent, E.Z.; Biber, P.; Black, K.; Borges, J.G.; Bugalho, M.N.; Corradini, G.; Corrigan, E.; Eriksson, L.O.; et al. Forest decision support systems for the analysis of ecosystem services provisioning at the landscape scale under global climate and market change scenarios. Eur. J. For. Res. 2019, 138, 561–581. [Google Scholar] [CrossRef] [Scilit]
  12. Felton, A.; Nilsson, U.; Sonesson, J.; Felton, A.M.; Roberge, J.-M.; Ranius, T.; Ahlström, M.; Bergh, J.; Björkman, C.; Boberg, J.; et al. Replacing monocultures with mixed-species stands: Ecosystem service implications of two production forest alternatives in Sweden. Ambio 2016, 45, 124–139. [Google Scholar] [CrossRef] [Scilit] [PubMed]
  13. Verheyen, K.; Vanhellemont, M.; Auge, H.; Baeten, L.; Baraloto, C.; Barsoum, N.; Bilodeau-Gauthier, S.; Bruelheide, H.; Castagneyrol, B.; Godbold, D.; et al. Contributions of a global network of tree diversity experiments to sustainable forest management and biodiversity conservation. Ambio 2016, 45, 29–41. [Google Scholar] [CrossRef] [Scilit] [PubMed]
  14. Biber, P.; Felton, A.; Nieuwenhuis, M.; Lindbladh, M.; Black, K.; Bahýl’, J.; Bingöl, Ö.; Borges, J.G.; Botequim, B.; Brukas, V.; et al. Forest Biodiversity, Carbon Sequestration, and Wood Production: Modeling Synergies and Trade-Offs for Ten Forest Landscapes Across Europe. Front. Ecol. Evol. 2020, 8, 547696. [Google Scholar] [CrossRef] [Scilit]
  15. Brockerhoff, E.G.; Jactel, H.; Parrotta, J.A.; Quine, C.P.; Sayer, J. Forest biodiversity, ecosystem functioning and the provision of ecosystem services. Biodivers. Conserv. 2017, 26, 30053033. [Google Scholar] [CrossRef] [Scilit]
  16. Blattert, C.; Lemm, R.; Thürig, E.; Stadelmann, G.; Brändli, U.-B.; Temperli, C. Long-term impacts of increased timber harvests on ecosystem services and biodiversity: A scenario study based on national forest inventory data. Ecosyst. Serv. 2020, 45, 101150. [Google Scholar] [CrossRef] [Scilit]
  17. Berger, F.; Dorren, L.K.A. Principles of the tool Rockfor.net for quantifying the rockfall hazard below a protection forest. Schweiz. Z. Forstwes. 2007, 158, 157–165. [Google Scholar] [CrossRef] [Scilit]
  18. Yousefpour, R.; Temperli, C.; Jacobsen, J.B.; Thorsen, B.J.; Meilby, H.; Lexer, M.J.; Lindner, M.; Bugmann, H.; Borges, J.G.; Palma, J.H.N.; et al. A framework for modeling adaptive forest management and decision making under climate change. Ecol. Soc. 2017, 22, 40. [Google Scholar] [CrossRef] [Scilit]
  19. Mina, M.; Bugmann, H.; Klopčič, M.; Cailleret, M. Accurate modeling of harvesting is key for projecting future forest dynamics: A case study in the Slovenian mountains. Reg. Environ. Change 2017, 17, 49–64. [Google Scholar] [CrossRef] [Scilit]
  20. Bottero, A.; Forrester, D.I.; Cailleret, M.; Kohnle, U.; Gessler, A.; Michel, D.; Bose, A.K.; Bauhus, J.; Bugmann, H.; Lévesque, M.; et al. Growth resistance and resilience of mixed silver fir and Norway spruce forests in central Europe: Contrasting responses to mild and severe droughts. Glob. Change Biol. 2021, 27, 4403–4419. [Google Scholar] [CrossRef] [Scilit]
  21. Vacek, S.; Prokůpková, A.; Vacek, S.; Bulušek, D.; Šimůnek, V.; Hájek, V.; Králíček, I. Mixed vs. monospecific mountain forests in response to climate change: Structural and growth perspectives of Norway spruce and European beech. For. Ecol. Manag. 2021, 488, 119019. [Google Scholar] [CrossRef] [Scilit]
  22. Eyvindson, K.; Repo, A.; Mönkkönen, M. Mitigating forest biodiversity and ecosystem service losses in the era of bio-based economy. For. Policy Econ. 2018, 92, 119–127. [Google Scholar] [CrossRef] [Scilit]
  23. Grassi, G.; House, J.; Dentener, F.; Federici, S.; den Elzen, M.; Penman, J. The key role of forests in meeting climate targets requires science for credible mitigation. Nat. Clim. Change 2017, 9, 220–226. [Google Scholar] [CrossRef] [Scilit]
  24. Härtl, F.H.; Höllerl, S.; Knoke, T. A new way of carbon accounting emphasises the crucial role of sustainable timber use for successful carbon mitigation strategies. Mitig. Adapt Strateg Glob. Change 2017, 22, 1163–1192. [Google Scholar] [CrossRef] [Scilit]
  25. Verkerk, P.J.; Delacote, P.; Hurmekoski, E.; Kunttu, J.; Matthews, R.; Mäkipää, R.; Mosley, F.; Perugini, L.; Reyer, C.P.O.; Roe, S.; et al. Forest-based climate change mitigation and adaptation in Europe. From Science to Policy 14. Eur. For. Inst. 2022. [Google Scholar] [CrossRef]
  26. Mazziotta, A.; Podkopaev, D.; Triviño, M.; Miettinen, K.; Pohjanmies, T.; Mönkkönen, M. Quantifying and resolving conservation conflicts in forest landscapes via multiobjective optimization. Silva Fenn. 2017, 51, 1778. [Google Scholar] [CrossRef] [Scilit]
  27. Thrippleton, T.; Blattert, C.; Bont, L.G.; Mey, R.; Zell, J.; Thürig, E.; Schweier, J. A multi-criteria decision support system for strategic planning at the Swiss forest enterprise level: Coping with climate change and shifting demands in ecosystem service provisioning. Front. For. Glob. Change 2021, 4, 693020. [Google Scholar] [CrossRef] [Scilit]
  28. Zhao, J.; Wang, H.; Zhang, S.; Cui, X.; Yang, Y. Reframing Adaptive Forest Management to Sustain Ecosystem Services Under Climate Change. Forests 2025, 16, 1377. [Google Scholar] [CrossRef] [Scilit]
  29. Lewis, S.L.; Wheeler, C.E.; Mitchard, E.T.A.; Koch, A. Regenerate natural forests to store carbon. Nature 2019, 568, 25–28. [Google Scholar] [CrossRef] [Scilit] [PubMed]
  30. Blattert, C.; Mutterer, S.; Thrippleton, T.; Diaci, J.; Fidej, G.; Bont, L.G.; Schweier, J. Managing European Alpine forests with close-to-nature forestry to improve climate change mitigation and multifunctionality. Ecol. Indic. 2024, 165, 112154. [Google Scholar] [CrossRef] [Scilit]
  31. Bolte, A.; Ammer, C.; Löf, M.; Madsen, P.; Nabuurs, G.J.; Schall, P.; Spathelf, P. Adaptive forest management in central Europe: Climate change impacts, strategies and integrative concept. Scand. J. For. Res. 2009, 24, 473482. [Google Scholar] [CrossRef] [Scilit]
  32. Nothdurft, A.; Engel, M. Climate sensitivity and resistance under pure- and mixed-stand scenarios in Lower Austria evaluated with distributed lag models and penalized regression splines for tree-ring time series. Eur. J. For. Res. 2020, 139, 189–211. [Google Scholar] [CrossRef] [Scilit]
  33. Seidl, R.; Spies, T.A.; Peterson, D.L.; Stephens, S.L.; Hicke, J.A. Searching for resilience: Addressing the impacts of changing disturbance regimes on forest ecosystem services. J. Appl. Ecol. 2016, 53, 120–129. [Google Scholar] [CrossRef] [Scilit] [PubMed]
  34. Thom, D.; Seidl, R. Natural disturbance impacts on ecosystem services and biodiversity in temperate and boreal forests. Biol. Rev. 2016, 91, 760–781. [Google Scholar] [CrossRef] [Scilit] [PubMed]
  35. Thrippleton, T.; Temperli, C.; Krumm, F.; Mey, R.; Zell, J.; Stroheker, S.; Gossner, M.M.; Bebi, P.; Thürig, E.; Schweier, J. Balancing disturbance risk and ecosystem service provisioning in Swiss mountain forests: An increasing challenge under climate change. Reg. Environ. Change 2023, 23, 15. [Google Scholar] [CrossRef] [Scilit] [PubMed]
  36. Frehner, M.; Wasser, B.; Schwitter, R. Nachhaltigkeit und Erfolgskontrolle im Schutzwald. Wegleitung für die Pflege und Beurteilung. Vollzug Umwelt; Bundesamt für Umwelt, Wald und Landschaft (BUWAL): Bern, Switzerland, 2005; 564p. Available online: https://www.gebirgswald.ch/tl_files/gebirgswald/de/02_NaiS/00_Hauptteil/00_Gesamt/NaiS_D_A_Hauptteil.pdf (accessed on 22 February 2026).
  37. Moos, C.; Bebi, P.; Schwarz, M.; Stoffel, M.; Sudmeier-Rieux, K.; Dorren, L. Ecosystem-based disaster risk reduction in mountains. Earth-Sci. Rev. 2018, 177, 497–513. [Google Scholar] [CrossRef] [Scilit]
  38. Ray, D.; Fung, F.; Pirret, J.; Plenderleith, F.; Trotter, F.; Marchi, M. Risk of extreme climate impacts on European Norway spruce forest: Drought and frost in the climate emergency. Clim. Change 2025, 178, 114. [Google Scholar] [CrossRef] [Scilit]
  39. Seidl, R.; Rammer, W. Climate change amplifies the interactions between wind and bark beetle disturbances in forest landscapes. Landsc. Ecol. 2016, 32, 1485–1498. [Google Scholar] [CrossRef] [Scilit] [PubMed]
  40. Potterf, M.; Svitok, M.; Mezei, P.; Jarčuška, B.; Jakuš, R.; Blaženec, M.; Hlásny, T. Contrasting Norway spruce disturbance dynamics in managed forests and strict forest reserves in Slovakia. Forestry 2023, 96, 387–398. [Google Scholar] [CrossRef]
  41. Stritih, A.; Senf, C.; Marsoner, T.; Seidl, R. Mapping the natural disturbance risk to protective forests across the European Alps. J. Environ. Manag. 2024, 366, 121659. [Google Scholar] [CrossRef] [Scilit] [PubMed]
  42. Warner, E.; Cook-Patton, S.C.; Lewis, O.T.; Brown, N.; Koricheva, J.; Eisenhauer, N.; Ferlian, O.; Gravel, D.; Hall, J.S.; Jactel, H.; et al. Young mixed planted forests store more carbon than monocultures: A meta-analysis. Front. For. Glob. Change 2023, 6, 1226514. [Google Scholar] [CrossRef] [Scilit]
  43. Pretzsch, H.; Biber, P.; Uhl, E.; Dahlhausen, J.; Rötzer, T.; Calfapietra, C.; Grote, R. Forest stand growth dynamics in Central Europe have accelerated since 1870. Nat. Commun. 2014, 5, 4967. [Google Scholar] [CrossRef] [Scilit] [PubMed]
  44. Del Río, M.; Pretzsch, H.; Ruiz-Peinado, R.; Jactel, H.; Coll, L.; Löf, M.; Aldea, J.; Ammer, C.; Avdagić, A.; Barbeito, I.; et al. Emerging stability of forest productivity by mixing two species buffers temperature destabilizing effect. J. Appl. Ecol. 2022, 59, 2730–2741. [Google Scholar] [CrossRef] [Scilit]
  45. Huuskonen, S.; Domisch, T.; Finér, L.; Hantula, J.; Hynynen, J.; Matala, J.; Miina, J.; Neuvonen, S.; Nevalainen, S.; Niemistö, P.; et al. What is the potential for replacing monocultures with mixed forests? For. Ecol. Manag. 2021, 479, 118558. [Google Scholar] [CrossRef] [Scilit]
  46. Steckel, M.; del Río, M.; Heym, M.; Aldea, J.; Bielak, K.; Brazaitis, G.; Černý, J.; Coll, L.; Collet, C.; Ehbrecht, M.; et al. Species mixing reduces drought susceptibility of Scots pine (Pinus sylvestris L.) and oak (Quercus robur L., Quercus petraea (Matt.) Liebl.)—Site water supply and fertility modify the mixing effect. For. Ecol. Manag. 2020, 461, 117908. [Google Scholar] [CrossRef] [Scilit]
  47. Vospernik, S.; Heym, M.; Pretzsch, H.; Pach, M.; Steckel, M.; Aldea, J.; Brazaitis, G.; Bravo-Oviedo, A.; Del Rio, M.; Löf, M.; et al. Tree species growth response to climate in mixtures of Quercus robur/Quercus petraea and Pinus sylvestris across Europe—A dynamic, sensitive equilibrium. For. Ecol. Manag. 2023, 530, 120753. [Google Scholar] [CrossRef] [Scilit]
  48. Frivold, L.H.; Frank, J. Growth of Mixed Birch–Coniferous Stands in Relation to Pure Coniferous Stands at Similar Sites in South-eastern Norway. Scand. J. For. Res. 2002, 17, 139–149. [Google Scholar] [CrossRef] [Scilit]
  49. Lindén, M.; Agestam, E. Increment and yield in mixed and monoculture stands of Norway spruce and birch in Sweden. Scand. J. For. Res. 2003, 18, 155–162. Available online: https://api.semanticscholar.org/CorpusID:83804384 (accessed on 14 March 2026). [CrossRef] [Scilit]
  50. Bravo-Oviedo, A.; Pretzsch, H.; del Río, M. (Eds.) Dynamics, Silviculture and Management of Mixed Forests; Springer International Publishing: Berlin/Heidelberg, Germany, 2018. [Google Scholar] [CrossRef] [Scilit]
  51. Gamfeldt, L.; Snäll, T.; Bagchi, R.; Jonsson, M.; Gustafsson, L.; Kjellander, P.; Ruiz-Jaen, M.C.; Froberg, M.; Stendahl, J.; Philipson, C.D.; et al. Higher levels of multiple ecosystem services are found in forests with more tree species. Nat. Commun. 2013, 4, 1340. [Google Scholar] [CrossRef] [Scilit] [PubMed]
  52. Hegetschweiler, K.T.; Stride, C.B.; Fischer, C.; Ginzler, C.; Hunziker, M. Integrating recreation into National Forest Inventories—Results from a forest visitor survey in winter and summer. J. Outdoor Recreat. Tour. 2022, 39, 100489. [Google Scholar] [CrossRef] [Scilit]
  53. Knoke, T.; Messerer, K.; Paul, C. The Role of Economic Diversification in Forest Ecosystem Management. Curr. For. Rep. 2017, 3, 93–106. [Google Scholar] [CrossRef] [Scilit]
  54. Mey, R.; Zell, J.; Thürig, E.; Stadelmann, G.; Bugmann, H.; Temperli, C. Tree species admixture increases ecosystem service provision in simulated spruce and beech-dominated stands. Eur. J. For. Res. 2022, 141, 801–820. [Google Scholar] [CrossRef] [Scilit] [PubMed]
  55. Brabec, P.; Brichta, J.; Vacek, Z.; Vacek, S.; Šimůnek, V.; Hájek, V. Potential of mixed Picea abies (L.) Karst. and Pinus sylvestris L. forests in lowland areas of Central Bohemia. J. For. Sci. 2023, 69, 470–484. [Google Scholar] [CrossRef] [Scilit]
  56. Triviño, M.; Pohjanmies, T.; Mazziotta, A.; Juutinen, A.; Podkopaev, D.; Le Tortorec, E.; Mönkkönen, M. Optimizing management to enhance multifunctionality in a boreal forest landscape. J. Appl. Ecol. 2016, 54, 61–70. [Google Scholar] [CrossRef] [Scilit]
  57. Edwards, D.M.; Jay, M.; Jensen, F.S.; Lucas, B.; Marzano, M.; Montagné, C.; Peace, A.; Weiss, G. Public preferences across Europe for different forest stand types as sites for recreation. Ecol. Soc. 2012, 17, 27. [Google Scholar] [CrossRef] [Scilit]
  58. Bielak, K.; Dudzińska, M.; Pretzsch, H. Mixed stands of Scots pine (Pinus sylvestris L.) and Norway spruce [Picea abies (L.) Karst] can be more productive than monocultures. Evidence from over 100 years of observation of long-term experiments. For. Syst. 2014, 23, 573–589. [Google Scholar] [CrossRef] [Scilit]
  59. Pretzsch, H.; Schütze, G. Transgressive overyielding in mixed compared with pure stands of Norway spruce and European beech in Central Europe: Evidence on stand level and explanation on individual tree level. Eur. J. For. Res. 2009, 128, 183–204. [Google Scholar] [CrossRef] [Scilit]
  60. Fichtner, A.; Härdtle, W.; Bruelheide, H.; Kunz, M.; Li, Y.; von Oheimb, G. Neighbourhood interactions drive overyielding in mixed-species tree communities. Nat. Commun. 2018, 9, 1144. [Google Scholar] [CrossRef] [Scilit] [PubMed]
  61. Chakravorty, S.; Bergström, D.; Nilsson, U.; Subramanian, N.; Wetterlund, E. Comparison of the economic return of conventional and mixed forest stands. Scand. J. For. Res. 2025, 41, 155–172. [Google Scholar] [CrossRef] [Scilit]
  62. Drössler, L.; Övergaard, R.; Ekö, P.M.; Gemmel, P.; Böhlenius, H. Early development of pure and mixed tree species plantations in southern Sweden. Scand. J. For. Res. 2015, 30, 304–316. [Google Scholar] [CrossRef] [Scilit]
  63. Fahlvik, N.; Agestam, E.; Ekö, P.-M.; Lindén, M. Development of single-storied mixtures of Norway spruce and birch in southern Sweden. Scand. J. For. Res. 2011, 26, 36–45. [Google Scholar] [CrossRef] [Scilit]
  64. Castagneyrol, B.; Giffard, B.; Péré, C.; Jactel, H. Plant apparency, an overlooked driver of associational resistance to insect herbivory. J. Ecol. 2013, 101, 418–429. [Google Scholar] [CrossRef] [Scilit]
  65. Jactel, H.; Brockerhoff, E.G. Tree diversity reduces herbivory by forest insects. Ecol. Lett. 2007, 10, 835–848. [Google Scholar] [CrossRef] [Scilit] [PubMed]
  66. Keenan, R.J. Climate change impacts and adaptation in forest management: A review. Ann. For. Sci. 2015, 72, 145–167. [Google Scholar] [CrossRef] [Scilit]
  67. Pautasso, M.; Holdenrieder, O.; Stenlid, J. Susceptibility to Fungal Pathogens of Forests Differing in Tree Diversity. In Forest Diversity and Function; Scherer-Lorenzen, M., Körner, C., Schulze, E.D., Eds.; Ecological Studies; Springer: Berlin/Heidelberg, Germany, 2005; Volume 176. [Google Scholar] [CrossRef] [Scilit] [PubMed]
  68. Schelhaas, M.J.; Hengeveld, G.; Moriondo, M.; Reinds, G.J.; Kundzewicz, Z.W.; ter Maat, H.; Bindi, M. Assessing risk and adaptation options to fires and windstorms in European forestry. Mitig. Adapt Strateg Glob. Change 2010, 15, 681–701. [Google Scholar] [CrossRef] [Scilit]
  69. Tanskanen, H.; Venäläinen, A.; Puttonen, P.; Granström, A. Impact of stand structure on surface fire ignition potential in Picea abies and Pinus sylvestris forests in southern Finland. Can. J. For. Res. 2005, 35, 410–420. [Google Scholar] [CrossRef] [Scilit]
  70. Thor, M.; Ståhl, G.; Stenlid, J. Modelling root rot incidence in Sweden using tree, site and stand variables. Scand. J. For. Res. 2005, 20, 165–176. [Google Scholar] [CrossRef] [Scilit]
  71. Valinger, E.; Fridman, J. Factors affecting the probability of windthrow at stand level as a result of the Gudrun winter storm in southern Sweden. For. Ecol. Manag. 2011, 262, 398–403. [Google Scholar] [CrossRef] [Scilit]
  72. Paquette, A.; Messier, C. The effect of biodiversity on tree productivity: From temperate to boreal forests. Glob. Ecol. Biogeogr. 2011, 20, 170–180. [Google Scholar] [CrossRef] [Scilit]
  73. Pretzsch, H.; Steckel, M.; Heym, M.; Biber, P.; Ammer, C.; Bielak, K.; Bravo, F.; Ordóñez, C.; Collet, C.; Vast, F.; et al. Stand growth and structure of mixed-species and monospecific stands of Scots pine (Pinus sylvestris L.) and oak (Q. robur L., Q. petraea (Matt.) Liebl.) analysed along a productivity gradient through Europe. Eur. J. For. Res. 2020, 139, 349–367. [Google Scholar] [CrossRef] [Scilit]
  74. Giberti, G.S.; Wellstein, C.; Giovannelli, A.; Bielak, K.; Uhl, E.; Aguirre-Ráquira, W.; Giammarchi, F.; Tonon, G. Annual carbon sequestration patterns in trees: A case study from Scots pine monospecific stands and mixed stands with sessile oak in Central Poland. Forests 2022, 13, 582. [Google Scholar] [CrossRef] [Scilit]
  75. Hlásny, T.; Barcza, Z.; Fabrika, M.; Balázs, B.; Churkina, G.; Pajtík, J.; Sedmák, R.; Turcáni, M. Climate change impacts on growth and carbon balance of forests in Central Europe. Clim. Res. 2011, 47, 219–236. [Google Scholar] [CrossRef] [Scilit]
  76. Irauschek, F.; Rammer, W.; Lexer, M.J. Evaluating multifunctionality and adaptive capacity of mountain forest management alternatives under climate change in the Eastern Alps. Eur. J. For. Res. 2017, 136, 1051–1069. [Google Scholar] [CrossRef] [Scilit]
  77. Pinnschmidt, A.; Yousefpour, R.; Nölte, A.; Hanewinkel, M. Tropical mixed-species plantations can outperform monocultures in terms of carbon sequestration and economic return. Ecol. Econ. 2023, 211, 107885. [Google Scholar] [CrossRef] [Scilit]
  78. Piotto, D.; Craven, D.; Montagnini, F.; Alice, F.E. Silvicultural and economic aspects of pure and mixed native tree species plantations on degraded pasturelands in humid Costa Rica. New For. 2010, 39, 369–385. [Google Scholar] [CrossRef] [Scilit]
  79. Lafond, V.; Cordonnier, T.; Mao, Z.; Courbaud, B. Trade-offs and synergies between ecosystem services in uneven-aged mountain forests: Evidences using Pareto fronts. Eur. J. For. Res. 2017, 136, 997–1012. [Google Scholar] [CrossRef] [Scilit]
  80. Temperli, C.; Blattert, C.; Stadelmann, G.; Brändli, U.-B.; Thürig, E. Trade-offs between ecosystem service provision and the predisposition to disturbances: A NFI-based scenario analysis. For. Ecosyst. 2020, 7, 27. [Google Scholar] [CrossRef] [Scilit]
  81. Griess, V.C.; Knoke, T. Bioeconomic modeling of mixed Norway spruce—European beech stands: Economic consequences of considering ecological effects. Eur. J. For. Res. 2013, 132, 511–522. [Google Scholar] [CrossRef] [Scilit]
  82. Forzieri, G.; Jactel, H.; Bianchi, A.; Spinoni, J.; Somasundaram, D.; Feyen, L.; Cescatti, A. Ecosystem heterogeneity is key to limiting the increasing climate-driven risks to European forests. One Earth 2024, 7, 2149–2164. [Google Scholar] [CrossRef] [Scilit]
  83. Balla, A.; Silini, A.; Cherif Silini, H.; Chenari Bouket, A.; Moser, W.K.; Nowakowska, J.A.; Oszako, T.; Benia, F.; Belbahri, L. The threat of pests and pathogens and the potential for biological control in forest ecosystems. Forests 2021, 12, 1579. [Google Scholar] [CrossRef] [Scilit]
  84. Blattert, C.; Lemm, R.; Thees, O.; Hansen, J.; Lexer, M.J.; Hanewinkel, M. Segregated versus integrated biodiversity conservation: Value-based ecosystem service assessment under varying forest management strategies. Ecol. Indic. 2018, 95, 751–764. [Google Scholar] [CrossRef] [Scilit]
  85. Bont, L.G.; Hölscher, M.; Mutterer, S.; Beranek, M.; Schweier, J.; Buscher, U.; Scheffler, M.; Husmann, K.; Ottens, L.; Blattert, C. Optimizing sustainable and multifunctional management of Alpine Forests under climate change. Sci. Rep. 2025, 15, 29761. [Google Scholar] [CrossRef] [Scilit] [PubMed]
  86. Vyskot, I. Kvantifikace a Hodnocení Funkcí Lesů České Republiky; Ministerstvo životního prostředí: Praha, Czech Republic, 2003.
  87. Doporučená Pravidla pro Měření a Třídění Dříví v ČR 2008: Platnost od 1.1.2008; Lesnická práce: Praha, Czech Republic, 2007; Available online: https://katalog.mendelu.cz/#!/records/4d9ac5ca-3e31-40b1-adbd-e5ce5fad605c (accessed on 11 November 2025).
  88. Tahvonen, O.; Pukkala, T.; Laiho, O.; Lähde, E.; Niinimäki, S. Optimal management of uneven-aged Norway spruce stands. For. Ecol. Manag. 2010, 260, 106–115. [Google Scholar] [CrossRef] [Scilit]
  89. Rämö, J.; Tahvonen, O. Economics of harvesting uneven-aged forest stands in Fennoscandia. Scand. J. For. Res. 2014, 29, 777–792. [Google Scholar] [CrossRef] [Scilit]
  90. Dosumu, B.; Aldea, J.; Holmström, E.; Nilsson, U. Thinning strategies impact the productivity, perpetuity and profitability of mixed stands. Scand. J. For. Res. 2024, 39, 217–225. [Google Scholar] [CrossRef] [Scilit]
  91. Buongiorno, J. Generalization of Faustmann’s Formula for Stochastic Forest Growth and Prices with Markov Decision Process Models. For. Sci. 2001, 47, 466–474. [Google Scholar] [CrossRef] [Scilit]
  92. Chang, S.J. Twenty one years after the publication of the generalized Faustmann formula. For. Policy Econ. 2020, 118, 102238. [Google Scholar] [CrossRef] [Scilit]
  93. Österberg, N.; Parkatti, V.-P.; Tahvonen, O. Comparing stand growth models in optimizing mixed-species forest management. Scand. J. For. Res. 2023, 38, 353–366. [Google Scholar] [CrossRef] [Scilit]
  94. Di Fulvio, F.; Lessa, A. D4.4 Report on EU Forest Management Costing Module and Green Jobs Calculator. ForestNavigator Deliverable D4.4. 2025. Available online: https://www.forestnavigator.eu/wp-content/uploads/FN_D4.4-ForestManagement-costing.pdf (accessed on 8 July 2026).
  95. Vencurik, J.; Kucbel, S.; Saniga, M.; Jaloviar, P.; Sedmáková, D.; Pittner, J.; Parobeková, Z.; Bosela, M. Growth dynamics of the Norway spruce and silver fir understory in continuous cover forestry. iForest—Biogeosci. For. 2020, 13, 56–64. [Google Scholar] [CrossRef] [Scilit]
  96. Schattenberg, C.; Stritih, A.; Thom, D. More water, less light: How to improve silver fir seeding to convert Norway spruce monocultures into mixed stands in a drier region of Germany. Forestry 2024, 97, 615–624. [Google Scholar] [CrossRef] [Scilit]
  97. Bernard, M.; Boulanger, V.; Dupouey, J.-L.; Laurent, L.; Montpied, P.; Morin, X.; Picard, J.-F.; Saïd, S. Deer browsing promotes Norway spruce at the expense of silver fir in the forest regeneration phase. For. Ecol. Manag. 2017, 400, 269–277. [Google Scholar] [CrossRef] [Scilit]
  98. Konôpka, B.; Šebeň, V. Positive impact of large wild herbivore exclusion on silver fir regeneration: A case study from the Poľana Mountains, Central Slovakia. Cent. Eur. For. J. 2024, 70, 248–262. [Google Scholar] [CrossRef] [Scilit]
  99. Jucker, T.; Bouriaud, O.; Avacaritei, D.; Coomes, D.A. Stabilizing effects of diversity on aboveground wood production in forest ecosystems: Linking patterns and processes. Ecol. Lett. 2014, 17, 1560–1569. [Google Scholar] [CrossRef] [Scilit] [PubMed]
  100. Reyer, C.P.O.; Bugmann, H.; Nabuurs, G.-J.; Hanewinkel, M. Models for adaptive forest management. Reg. Environ. Change 2015, 15, 1483–1487. [Google Scholar] [CrossRef] [Scilit]
  101. Patacca, M.; Lindner, M.; Nabuurs, G.-J.; Schelhaas, M.-J. Significant increase in natural disturbance impacts on European forests since 1950. Glob. Change Biol. 2023, 29, 1359–1376. [Google Scholar] [CrossRef] [Scilit] [PubMed]
  102. Seidl, R.; Thom, D.; Kautz, M.; Martin-Benito, D.; Peltoniemi, M.; Vacchiano, G.; Wild, J.; Ascoli, D.; Petr, M.; Honkaniemi, J.; et al. Forest disturbances under climate change. Nat. Clim. Change 2017, 7, 395–402. [Google Scholar] [CrossRef] [Scilit] [PubMed]
  103. Březina, D.; Michal, J.; Hlaváčková, P. The Impact of Natural Disturbances on the Central European Timber Market—An Analytical Study. Forests 2024, 15, 592. [Google Scholar] [CrossRef] [Scilit]
  104. De Groot, M.; Ogris, N. Short-term forecasting of bark beetle outbreaks on two economically important conifer tree species. For. Ecol. Manag. 2019, 450, 117495. [Google Scholar] [CrossRef] [Scilit]
  105. Křivan, V.; Lewis, M.; Bentz, B.J.; Bewick, S.; Lenhart, S.M.; Liebhold, A. A dynamical model for bark beetle outbreaks. J. Theor. Biol. 2016, 407, 25–37. [Google Scholar] [CrossRef] [Scilit] [PubMed]
  106. Meyer, K.; Hoyer-Leitzel, A.; Iams, S.; Klasky, I.; Lee, V.; Ligtenberg, S.; Bussmann, E.; Zeeman, M.L. Quantifying resilience to recurrent ecosystem disturbances using flow-kick dynamics. arXiv 2018, arXiv:1803.07650. [Google Scholar] [CrossRef] [Scilit]
  107. Salehzadeh, M.; Stockie, J.M.; MacPherson, A. Aggregation unveiled: A sequential modelling approach to bark beetle outbreaks. Theor. Popul. Biol. 2024, 160, 62–69. [Google Scholar] [CrossRef] [Scilit] [PubMed]
Figure 1. Localization of the study sites (Author: Dominika Krausková).
Forests 17 00827 g001
Figure 2. Average realized timber prices by tree-species group and assortment class, expressed in CZK/m3 as five-year averages for 2020–2024. (a) Quality class I timber assortments. (b) Quality class II timber assortments. (c) Quality class III.A timber assortments. (d) Quality class III.B timber assortments. (e) Quality class III.C timber assortments. (f) Quality class III.D timber assortments. (g) Quality class IV timber assortments, i.e., wood for mechanical pulp production. (h) Quality class V timber assortments, i.e., pulpwood. (i) Quality class VI timber assortments, i.e., fuelwood. In each panel, the x-axis shows tree species or aggregated tree-species groups, and the y-axis shows the average realized timber price in CZK/m3. Numeric labels indicate the plotted average price values. Data sources: Green Reports of the Ministry of Agriculture of the Czech Republic and public tender data of Forests of the Czech Republic (state enterprise) authors’ calculations.
Forests 17 00827 g002aForests 17 00827 g002b
Figure 3. Cost coefficient (Kn = costs/revenues) by forest stand (in ascending order); five-year average (2020–2024).
Forests 17 00827 g003
Figure 4. Economic efficiency coefficient (Ke = revenues/costs) by forest stand (in descending order); five-year average (2020–2024).
Forests 17 00827 g004
Table 1. Characteristics of the study regions overview of sample plots, management units, typological units, and basic stand parameters: aspect, slope (°), basal area (BA/ha), standing volume (V/ha), stand density (n/ha), and age structure. PO—Polánky, HK—Hradec Králové, SU—Šumava, KR—Křtiny, BE—Beskydy, BO—Scots pine, SM—Norway spruce, JD—silver fir, MD—European larch, DG—Douglas fir, DB—oak, DBZ—sessile oak, DBC—Northern red oak, BK—European beech, HB—hornbeam, LP—lime/linden, BR—birch, JV—Norway maple, and KL—sycamore maple.
Stand Type IDStand CategoryAspect 1Slope (°)BA/haV/han/haAge 2
LDM_PO_A_BOlow-diversity mixed standW1.239.2444.049490–100
M_PO_A_DBmonocultureW3.440.1475.642090–100
MX_PO_Bmixed standW3.431.4335.835290–100
SD_PO_Cstructurally differentiated standW5.745.4489.769390–100
M_HK_A_BOmonocultureFlat031.0327.154291–95
M_HK_A_DBmonocultureFlat027.3225.554391–95
LDM_HK_Blow-diversity mixed standFlat036.8404.380091–95
SD_HK_Cstructurally differentiated standE1.250.3450.51 19191–95
M_SU_A_SMmonocultureSW5.744.5579.930590–100
MX_SU_B_BO_SMmixed standE11.346.2529.937090–100
MX_SU_B_SM_BKmixed standSW9.136.9436.932090–100
SD_SU_Cstructurally differentiated standE5.735.8371.630690–100
M_KR_A_BKmonocultureSE5.741.2662.045090–100
M_KR_A_SMmonocultureE9.155.6850.037585–95
MX_KR_Bmixed standSW3.440.7503.947285–95
SD_KR_Cstructurally differentiated standW5.731.8244.7578100–120
M_BE_I_AmonocultureSE16.761.5836.7200100–110
LDM_BE_I_Blow-diversity mixed standSE13.579.51216.3292100–110
SD_BE_I_Cstructurally differentiated standE15.678.11152.7325100–110
M_BE_II_AmonocultureE18.887.01464.5256120–130
M_BE_II_BmonocultureW19.851.4769.4264120–130
SD_BE_II_Cstructurally differentiated standW13.581.41304.0338120–130
M_BE_III_AmonocultureNW16.770.7928.5262130–140
SD_BE_III_Cstructurally differentiated standSW13.573.11141.8350130–140
1 Forest aspect expresses the orientation of a slope with respect to the cardinal directions. It significantly influences site-specific microclimatic conditions, particularly the solar radiation regime, moisture availability, and growth conditions of forest stands. Within the assessed area, the following aspects are represented: W (west), E (east), SW (southwest), SE (southeast), and NW (northwest). Flat terrain (no distinct aspect) is defined as a separate category, corresponding to specific forest areas in the Hradec Králové region within the lowland vegetation zone (forest site type group 1M). 2 For selected stands designated by the letter C, only the upper age limit of the stand was considered for the purposes of the analysis, even though these stands exhibited a wide age range, spanning approximately 1–120 years. Younger age classes were excluded from the evaluation due to their negligible proportional contribution to total stand volume and species composition and, therefore, their lack of statistically or production-relevant influence on the assessed indicators.
Table 2. Volumetric distribution of assortment classes and tree-species shares by stand.
Stand Type IDI_II_m3III_AB_m3III_CD_m3IV_m3V_VI_m3Σ in m3
LDM_PO_A_BO64.2223.5152.246.973.8560.5
Tree species compositionBO 100.0%BO 77.5%;
DB 22.5%
BO 76.8%;
DB 22.6%;
SM 0.6%
BO 84.4%;
DB 13.6%;
SM 2.0%
BO 65.4%;
DB 34.2%;
SM 0.3%
M_PO_A_DB79.4230.7197.054.484.2645.7
Tree species compositionDB 100.0%DB 96.6%;
LP 2.0%;
HB 0.9%;
SM 0.5%
DB 97.4%;
SM 1.5%;
HB 0.5%;
LP 0.5%
DB 80.1%;
SM 7.2%;
HB 6.4%;
LP 6.2%
DB 82.3%;
HB 9.4%;
LP 5.9%;
SM 2.4%
MX_PO_B24.5137.9128.440.273.6404.5
Tree species compositionBO 83.1%;
DB 14.1%;
LP 2.8%
BO 71.2%;
DB 27.6%;
SM 1.2%
DB 53.0%;
BO 45.7%;
LP 1.3%
BO 69.6%;
DB 26.3%;
SM 4.1%
DB 61.5%;
BO 34.7%;
LP 2.1%;
BR 1.1%;
SM 0.7%
SD_PO_C72.4204.2111.054.185.9527.5
Tree species compositionBO 100.0%BO 96.5%;
DB 3.5%
BO 87.6%;
DB 12.4%
BO 91.0%;
DB 9.0%
BO 53.2%;
SM 23.7%;
DB 23.1%
M_HK_A_BO21.8126.9155.831.712.5348.6
Tree species compositionBO 100.0%BO 100.0%BO 100%BO 99.3%;
SM 0.7%
BO 99.7%;
SM 0.3%
M_HK_A_DB3.425.7125.229.433.1216.7
Tree species compositionDB 100.0%DB 92.2%;
BO 7.8%
DB 97.5%;
BO 1.8%;
BR 0.7%
DB 93.6%;
BO 4.7%;
BR 1.7%
DB 98.1%;
BR 1.7%;
BO 0.3%
LDF_HK_B46.2135.4196.940.221.5440.2
Tree species compositionBO 81.2%;
BK 16.7%;
DB 2.1%
BO 90.4%;
DB 7.1%;
BK 2.5%
BO 91.0%;
DB 6.8%;
BK 2.2%
BO 72.2%;
DB 27.8%
BO 67.2%;
DB 28.9%;
BK 2.6%;
LP 1.3%
SD_HK_C39.0132.6257.552.331.9513.2
Tree species compositionBO 85.9%;
DB 9.7%;
DBC 4.5%
BO 97.8%; DBC 1.7%;
BR 0.5%
BO 87.8%;
SM 6.9%;
DBC 2.5%;
DB 2.2%;
BR 0.7%
BO 80.5%;
SM 13.8%; DBC 2.5%;
DB 2.1%;
BR 1.1%
BO 52.4%; DBC 33.3%; SM 7.7%;
DB 5.9%;
BR 0.7%
M_SU_A_SM077.2461.134.8114.6687.8
Tree species composition-SM 90.7%;
JD 9.3%
SM 98.4%;
JD 1.0%;
BK 0.6%
SM 96.3%;
JD 2.6%;
BK 1.1%
SM 88.5%;
BK 11.4%;
JD 0.1%
MX_SU_B_BO_SM0133.6291.041.985.7552.2
Tree species composition-SM 57.2%;
BO 42.8%
SM 85.9%;
BO 13.8%;
JD 0.3%
SM 75.0%;
BO 23.3%;
JD 1.7%
SM 93.3%;
BO 6.1%;
JD 0.6%
MX_SU_B_SM_BK12.839.4287.722.862.8425.4
Tree species compositionSM 100.0%SM 53.7%;
BK 41.5%;
BO 4.8%
SM 86.7%;
BK 12.1%;
BO 1.2%
BK 50.4%;
SM 43.6%;
JD 2.3%;
JV 2.0%;
BO 1.7%
SM 58.7%;
BK 39.5%;
JV 1.2%;
JD 0.5%;
BO 0.1%
SD_SU_C017.07366.154.688.6526.4
Tree species composition-SM 100.0%SM 84.5%;
BO 15.5%
SM 84.1%;
BO 15.9%
SM 80.0%;
BO 20.0%
M_KR_A_BK31.0211.7171.738.5179.1632.0
Tree species compositionBK 100.0%BK 91.4%;
MD 7.7%;
SM 1.0%
BK 91.1%;
MD 3.4%;
JD 2.7%;
SM 2.5%;
KL 0.4%
BK 85.7%;
MD 7.3%;
KL 3.2%;
JD 2.4%;
SM 1.4%
BK 97.0%;
SM 1.5%;
MD 1.1%;
KL 0.2%;
JD 0.2%
M_KR_A_SM168.2304.4164.0116.266.9819.6
Tree species compositionSM 85.6%; MD 10.0%;
BO 4.4%
SM 96.4%; MD 2.4%;
BO 1.2%
SM 92.1%;
BO 4.9%;
MD 3.0%
SM 95.8%; MD 2.4%;
BO 1.8%
SM 96.7%;
BO 2.8%;
MD 0.5%
MX_KR_B32.0130.5164.136.0116.0478.6
Tree species compositionSM 56.3%;
DG 34.0%;
BK 9.7%
SM 56.2%;
BK 30.0%;
JD 9.9%;
DG 2.1%;
BO 1.8%
SM 59.3%;
BK 28.4%;
JD 8.7%;
DG 2.6%;
BO 1.1%
SM 52.2%;
BK 42.1%;
BO 2.2%;
DG 1.8%;
JD 1.8%
BK 71.5%;
SM 24.4%; DBZ 2.1%;
JD 1.6%;
BO 0.3%;
DG 0.1%
SD_KR_C10.650.3137.841.660.6300.9
Tree species compositionJD 63.6%;
SM 36.4%
JD 56.1%;
SM 26.4%;
BK 17.4%
JD 50.0%;
SM 45.3%;
BK 4.3%;
DBZ 0.5%
SM 51.3%;
JD 38.8%;
BK 7.9%;
DBZ 1.4%;
BO 0.6%
SM 46.7%;
JD 33.5%;
BK 14.7%;
BR 2.6%;
DBZ 2.0%;
BO 0.5%
M_BE_I_A0289.3208.452.188.6638.4
Tree species composition-SM 96.8%;
JD 3.2%
SM 84.0%;
JD 14.0%;
BK 2.0%
SM 97.9%;
JD 2.1%
SM 94.8%;
JD 3.5%;
BK 1.8%
LDM_BE_I_B23.7383.2406.529.8136.1979.4
Tree species compositionSM 100.0%SM 98.7%;
BK 1.3%
SM 95.1%;
BK 4.9%
SM 95.5%;
BK 4.5%
SM 92.7%;
BK 7.3%
SD_BE_I_C22.1383.5273.733.5158.0870.8
Tree species compositionSM 100.0%SM 88.1%;
JD 7.5%;
BK 4.3%
SM 89.9%;
JD 6.7%;
BK 3.3%
SM 93.6%;
BK 6.4%
SM 79.8%;
BK 13.3%;
JD 7.0%
M_BE_II_A29.2433.6417.049.6164.51093.9
Tree species compositionSM 100.0%SM 100.0%SM 99.5%;
BK 0.5%
SM 100.0%SM 99.2%;
BK 0.8%
M_BE_II_B16.8219.6345.318.9102.7703.2
Tree species compositionSM 100.0%SM 90.2%;
BK 5.8%;
JD 4.0%
SM 93.1%;
BK 4.6%;
JD 2.3%
SM 91.9%;
BK 5.6%;
JD 2.6%
SM 84.6%;
BK 10.1%;
JD 5.3%
SD_BE_II_C10.5455.7363.836.4119.7986.1
Tree species compositionSM 100.0%SM 99.7%;
BK 0.3%
SM 98.9%;
BK 1.1%
SM 100.0%SM 99.0%;
BK 1.0%
M_BE_III_A3.5249.0309.134.392.9688.8
Tree species compositionJD 100.0%SM 92.5%;
JD 7.5%
SM 94.4%;
JD 5.6%
SM 89.3%;
JD 10.7%
SM 97.0%;
JD 3.0%
SD_BE_III_C30.9371.3297.540.5141.7881.8
Tree species compositionSM 100.0%SM 84.0%;
JD 12.2%;
BK 3.8%
SM 85.5%;
BK 7.4%;
JD 7.0%
SM 78.8%;
JD 16.3%;
BK 5.0%
SM 65.9%;
JD 24.9%;
BK 9.2%
Table 3. Stand-level overview of total revenues and average monetisation for assortments I–VI (coniferous × broadleaved)—values in CZK and converted to EUR.
Stand Type IDTotal Stand Revenues for Assortments I–VIAverage Revenue per m3 of Assortments I–III (Coniferous)Average Revenue per m3 of Assortments I–III (Broadleaved)Average Revenue per m3 (Assortments I–VI)
LDM_PO_A_BO1,132,428.2
(45,673.5)
1835.4
(74.0)
4138.4
(166.9)
2085.7
(84.1)
M_PO_A_DB3,006,720.4
(121 268.1)
2052.4
(82.8)
5690.0
(229.5)
2496.5
(100.7)
MX_PO_B909,485.2
(36,681.7)
1748.2
(70.5)
4138.5
(166.9)
2057.9
(83.0)
SD_PO_C906,269.6
(36,552.0)
1865.5
(75.2)
3749.1
(151.2)
1994.1
(80.4)
M_HK_A_BO540,594.3
(21,803.4)
1626.1
(65.6)
886.0
(35.7)
M_HK_A_DB668,372.5
(26,957.0)
1485.6
(59.9)
3835.1
(154.7)
1955.2
(78.9)
LDM_HK_B788,249.6
(31,791.9)
1700.2
(68.6)
3605.8
(145.4)
1930.8
(77.9)
SD_HK_C838,800.7
(33,830.8)
1666.6
(67.2)
3302.6
(133.2)
1767.5
(71.3)
M_SU_A_SM1,175,506.4
(47,410.9)
1918.5
(77.4)
1969.5
(79.4)
1545.8
(62.3)
MX_SU_B_BO_SM932,233.8
(37,599.2)
1914.9
(77.2)
712.1
(28.7)
MX_SU_B_SM_BK748,541.0
(30,190.4)
1899.0
(76.6)
2044.2
(82.4)
1560.1
(62.9)
SD_SU_C828,851.6
(33,429.5)
1810.8
(73.0)
688.3
(27.8)
M_KR_A_BK1,221,755.1
(49,276.2)
2470.4
(99.6)
2194.5
(88.5)
1776.6
(71.7)
M_KR_A_SM1,705,581.4
(68,790.1)
2388.9
(96.3)
1133.0
(45.7)
MX_KR_B860,480.9
(34,705.2)
2025.4
(81.7)
2108.3
(85.0)
1630.5
(65.8)
SD_KR_C470,444.8
(18,974.1)
1717.4
(69.3)
2106.2
(84.9)
1569.8
(63.3)
M_BE_I_A1,159,029.7
(46,746.4)
2057.5
(83.0)
1881.8
(75.9)
1579.0
(63.7)
LDM_BE_I_B1,867,328.3
(75,313.7)
2112.4
(85.2)
1934.3
(78.0)
1583.6
(63.9)
SD_BE_I_C1,611,497.1
(64,995.4)
2090.9
(84.3)
2140.3
(86.3)
1644.3
(66.3)
M_BE_II_A2,043,742.9
(82,428.9)
2103.6
(84.8)
1798.6
(72.5)
1554.4
(62.7)
M_BE_II_B1,325,895.8
(53,476.5)
2078.3
(83.8)
2073.5
(83.6)
1620.4
(65.4)
SD_BE_II_C1,897,148.7
(76,516.4)
2115.7
(85.3)
2056.2
(82.9)
1622.3
(65.4)
M_BE_III_A1,253,340.4
(50,550.1)
2019.4
(81.4)
739.2
(29.8)
SD_BE_III_C1,663,668.2
(67,099.6)
2096.1
(84.5)
2059.6
(83.1)
1656.3
(66.8)
Table 4. Average unit costs based on national statistical data for selected management operations (five-year average 2020–2024; values in CZK and converted to EUR).
Cost TypeUnitAmount in Thousand CZK/Unit
forest regenerationha108,388.4 (4371.6)
tending of forest cropsha14,304.4 (576.9)
cleaning operations (pre-commercial thinning)ha16,211.8 (653.9)
forest protectionha287.2 (11.6)
total silvicultural operationsha4282.4 (172.7)
timber harvestingm3309.0 (12.5)
timber extraction (skidding/forwarding)m3234.4 (9.5)
timber transportm3130.4 (5.3)
maintenance and repair of forest roadsha897.0 (36.2)
Disclaimer/Publisher’s Note: The statements, opinions and data contained in all publications are solely those of the individual author(s) and contributor(s) and not of MDPI and/or the editor(s). MDPI and/or the editor(s) disclaim responsibility for any injury to people or property resulting from any ideas, methods, instructions or products referred to in the content.