


Abstract
Mobile laser scanning (MLS) enables rapid, high-resolution measurement of forest structure, yet its reliability for estimating stem volume and aboveground biomass (AGB) in dense plantations and its sensitivity to tree height uncertainty remain insufficiently quantified. This study evaluates handheld MLS for tree-level stem volume and AGB estimation in a mature Sitka spruce (Picea sitchensis (Bong.) Carr.) plantation in Ireland, using destructive sampling (n = 12) as a reference. MLS-derived diameter measurements were used to reconstruct stem profiles, with merchantable volume calculated by frustum integration to a 7 cm top-end diameter. The central objective was to quantify how uncertainty in tree height propagates through MLS-derived stem reconstruction and affects volume and AGB estimates. On average, 68.2% of merchantable stem volume was directly measured before upper-stem reconstruction. Under ideal validation conditions using true felled-stem height, MLS-derived merchantable volume and total AGB were estimated with RMSE values of 5.6% and 10.9%, respectively. Across practical height-input scenarios, error increased moderately, indicating that direct measurement of the lower stem constrained the propagation of height uncertainty. Compared with the nationally applied spruce allometric benchmark, the MLS-based workflow showed lower sensitivity to height-input uncertainty under the conditions evaluated. These findings demonstrate the potential of handheld MLS as a tree-level validation and calibration tool for measurement-based biomass assessment while highlighting the need for broader testing across stand types, species and operational plot-level workflows.
1. Introduction
Light detection and ranging (LiDAR) has emerged as a key tool for monitoring forest resources. Technologies such as terrestrial (TLS), aerial (ALS) and mobile laser scanning (MLS) have significantly advanced forest measurement capabilities, with each approach exhibiting distinct strengths and limitations for characterising forest stands [1]. TLS can provide high-resolution measurements but is time-consuming to deploy [2,3,4]. ALS platforms enable landscape-scale coverage but struggle to capture lower-stem diameter measurements, a key requirement for accurate volume and carbon stock estimation [1,2]. In contrast, MLS, which uses simultaneous localisation and mapping (SLAM), offers rapid field data collection [5], high stem-detection rates [6,7] and accurate lower-stem measurement [8,9]. As a result, MLS has shown significant potential for operational forest inventories [5,7,10]. However, challenges such as occlusion still restrict the capture of accurate tree height and upper-stem measurements, particularly in closed-canopy forests [4].
Many studies have investigated the use of TLS for aboveground biomass (AGB) estimation [2,3,11,12,13]. In contrast, relatively few studies have assessed the capability of MLS to estimate AGB directly. Promising results have been reported in Larix gmelinii (R2 = 0.84) and Betula platyphylla (R2 = 0.86); however, this study did not include validation against destructive reference data [4]. Traditional approaches to AGB estimation have relied on manual field measurement and the use of allometric equations, statistical models defining relationships between tree biomass and commonly measured tree variables, e.g., diameter at breast height (DBH) and tree height [14,15], but these only provide indirect predictions of stem volume and AGB. Furthermore, errors can accumulate when equations are used in conditions which deviate from those in which they were developed [16,17]. As MLS can capture lower-stem diameters, the integration of these data with species-specific stem taper equations offers an opportunity to estimate full stem profiles and derive accurate volume estimates [8,18].
Comparative studies utilising destructive sampling further demonstrate the potential of MLS for accurate tree-level mensuration. MLS estimates were validated against 50 felled conifers, and DBH estimates (root mean square error (RMSE) 10.8%; 2.7 cm) and stem volume performance (RMSE 12.4%) were found to be unbiased and accurate. However, tree heights were systematically underestimated due to canopy occlusion [19].
Stem volume RMSE values of 9.7%–10.9% have also been reported across stands characterised as having easy and moderate structural complexity [8]. In boreal hardwood forests, it has been demonstrated that MLS is able to estimate merchantable stem volume (RMSE 8.3%) and capture accurate height information (uncertainty ≤ 2%), albeit under leaf-off conditions [20]. Collectively, these studies highlight both the ability of MLS to deliver high-quality mensuration of standing trees and reveal ongoing challenges with the technology, particularly regarding upper-stem occlusion and reliable height capture in dense forests. [10,19]. As a result, height information can be obtained from alternative sources, such as ALS-derived canopy metrics or site-specific DBH-height curves. However, the extent to which uncertainty in height estimation propagates into stem volume and AGB estimate errors has not been systematically quantified.
This knowledge gap is particularly important in Ireland, where Sitka spruce (Picea sitchensis (Bong.) Carr.) comprises c. 50% of the national forest estate [21]. This species is primarily managed under rotational forest management (RFM) consisting of single-species dense stands [21], conditions under which MLS is most challenged in capturing height information. Accurate characterisation of upper-stem measurements under these conditions is critical, as volume estimates form the basis of both operational forest inventory and carbon accounting in plantation forestry. As Ireland and Europe expand their forest carbon accounting frameworks with the forthcoming EU Carbon Removals and Carbon Farming (CRCF) Certification Regulation (EU/2024/3012) [22], there is growing interest in transparent, measurement-based approaches for estimating forest carbon stocks that can complement conventional inventory methods based on indirect allometric relationships [23,24]. In this context, validation of MLS-derived stem volume and biomass estimates against destructive reference data can help assess the potential of such approaches for more transparent and verifiable stock quantification.
The aim of this study is to evaluate the accuracy and methodological potential of handheld MLS for estimating tree-level stem volume and AGB in a commercial, mature Sitka spruce plantation. We hypothesised that: (i) MLS-derived lower-stem diameter measurements, combined with upper-stem reconstruction, would provide accurate tree-level merchantable stem volume estimates when benchmarked against destructive measurements; (ii) uncertainty in total tree height would increase stem volume and AGB error, but that this effect would remain bounded because a substantial proportion of merchantable stem volume is directly measured by MLS; and (iii) the MLS-derived reconstruction workflow would be less sensitive to height-input uncertainty than a conventional allometric biomass equation, because it explicitly reconstructs measured stem geometry rather than relying solely on DBH and height predictors.
Using destructive sampling as a benchmark, this study aimed to:
- Quantify the accuracy of MLS-derived estimates of stem volume and AGB at the tree level.
- Evaluate the accuracy of MLS-derived stem taper reconstruction along the full stem profile.
- Assess how uncertainty in height estimation influences stem taper reconstruction, estimation of stem volume and AGB, using alternative approaches to height estimation.
2. Materials and Methods
2.1. Study Area
The study was conducted in Dooary forest (52°56′57.5″ N 7°15′19.9″ W), located in the midlands of Ireland in Co. Laois. Dooary comprises a large state-owned property (managed by Coillte, Ireland’s semi-state forest company) containing multiple forest stands of varying ages and management histories, representative of intensively managed commercial plantations in Ireland. Sitka spruce is the predominant species, with productivity varying across the property. Soils in the study area are classified as surface-water gleys [25]. Additional stand and site characteristics are summarised in Table 1.
Table 1.
Stand and site characteristics of the study subcompartment at Dooary forest.
MLS data were acquired in September 2025 using a GeoSLAM ZEB Horizon handheld laser scanner (GeoSLAM Ltd., Nottingham, UK). The ZEB Horizon is a compact MLS platform incorporating a rotating multi-beam LiDAR sensor and an inertial measurement unit, operating within a simultaneous localisation and mapping (SLAM) framework to generate three-dimensional point clouds without the need for external positioning or reference targets. The system utilises a 16-channel LiDAR sensor operating at a wavelength of 903 nm, with a maximum measurement range of 100 m and a field of view of 360° horizontally and 270° vertically. The scanner records up to 300,000 points per second and is capable of providing a relative ranging accuracy of up to 6 mm under ideal conditions following post-processing.
Sample trees were selected to represent the range of diameters present at the site. Each tree was scanned individually to ensure identification during subsequent processing. Raw scan data were unpacked using FARO Connect (FARO Technologies Inc., Lake Mary, FL, USA) without applying any automatic cleaning routines and imported into CloudCompare (v2.13.1) [27]. Within CloudCompare, individual trees were manually segmented to isolate single-stem point clouds for analysis. Segmented point clouds were subsequently processed using the 3DFin plugin (v0.3.3) [28] to derive stem diameter measurements along the tree stems. Details of diameter extraction, filtering, and general workflow are described in Section 2.3. This study is framed as a controlled tree-level validation experiment conducted in a single mature, relatively uniform Sitka spruce plantation.
2.2. Destructive Sampling and Reference Measurements
2.2.1. AGB Reference
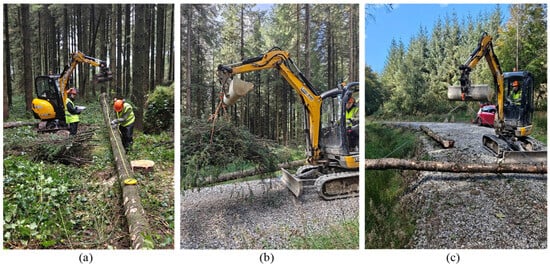
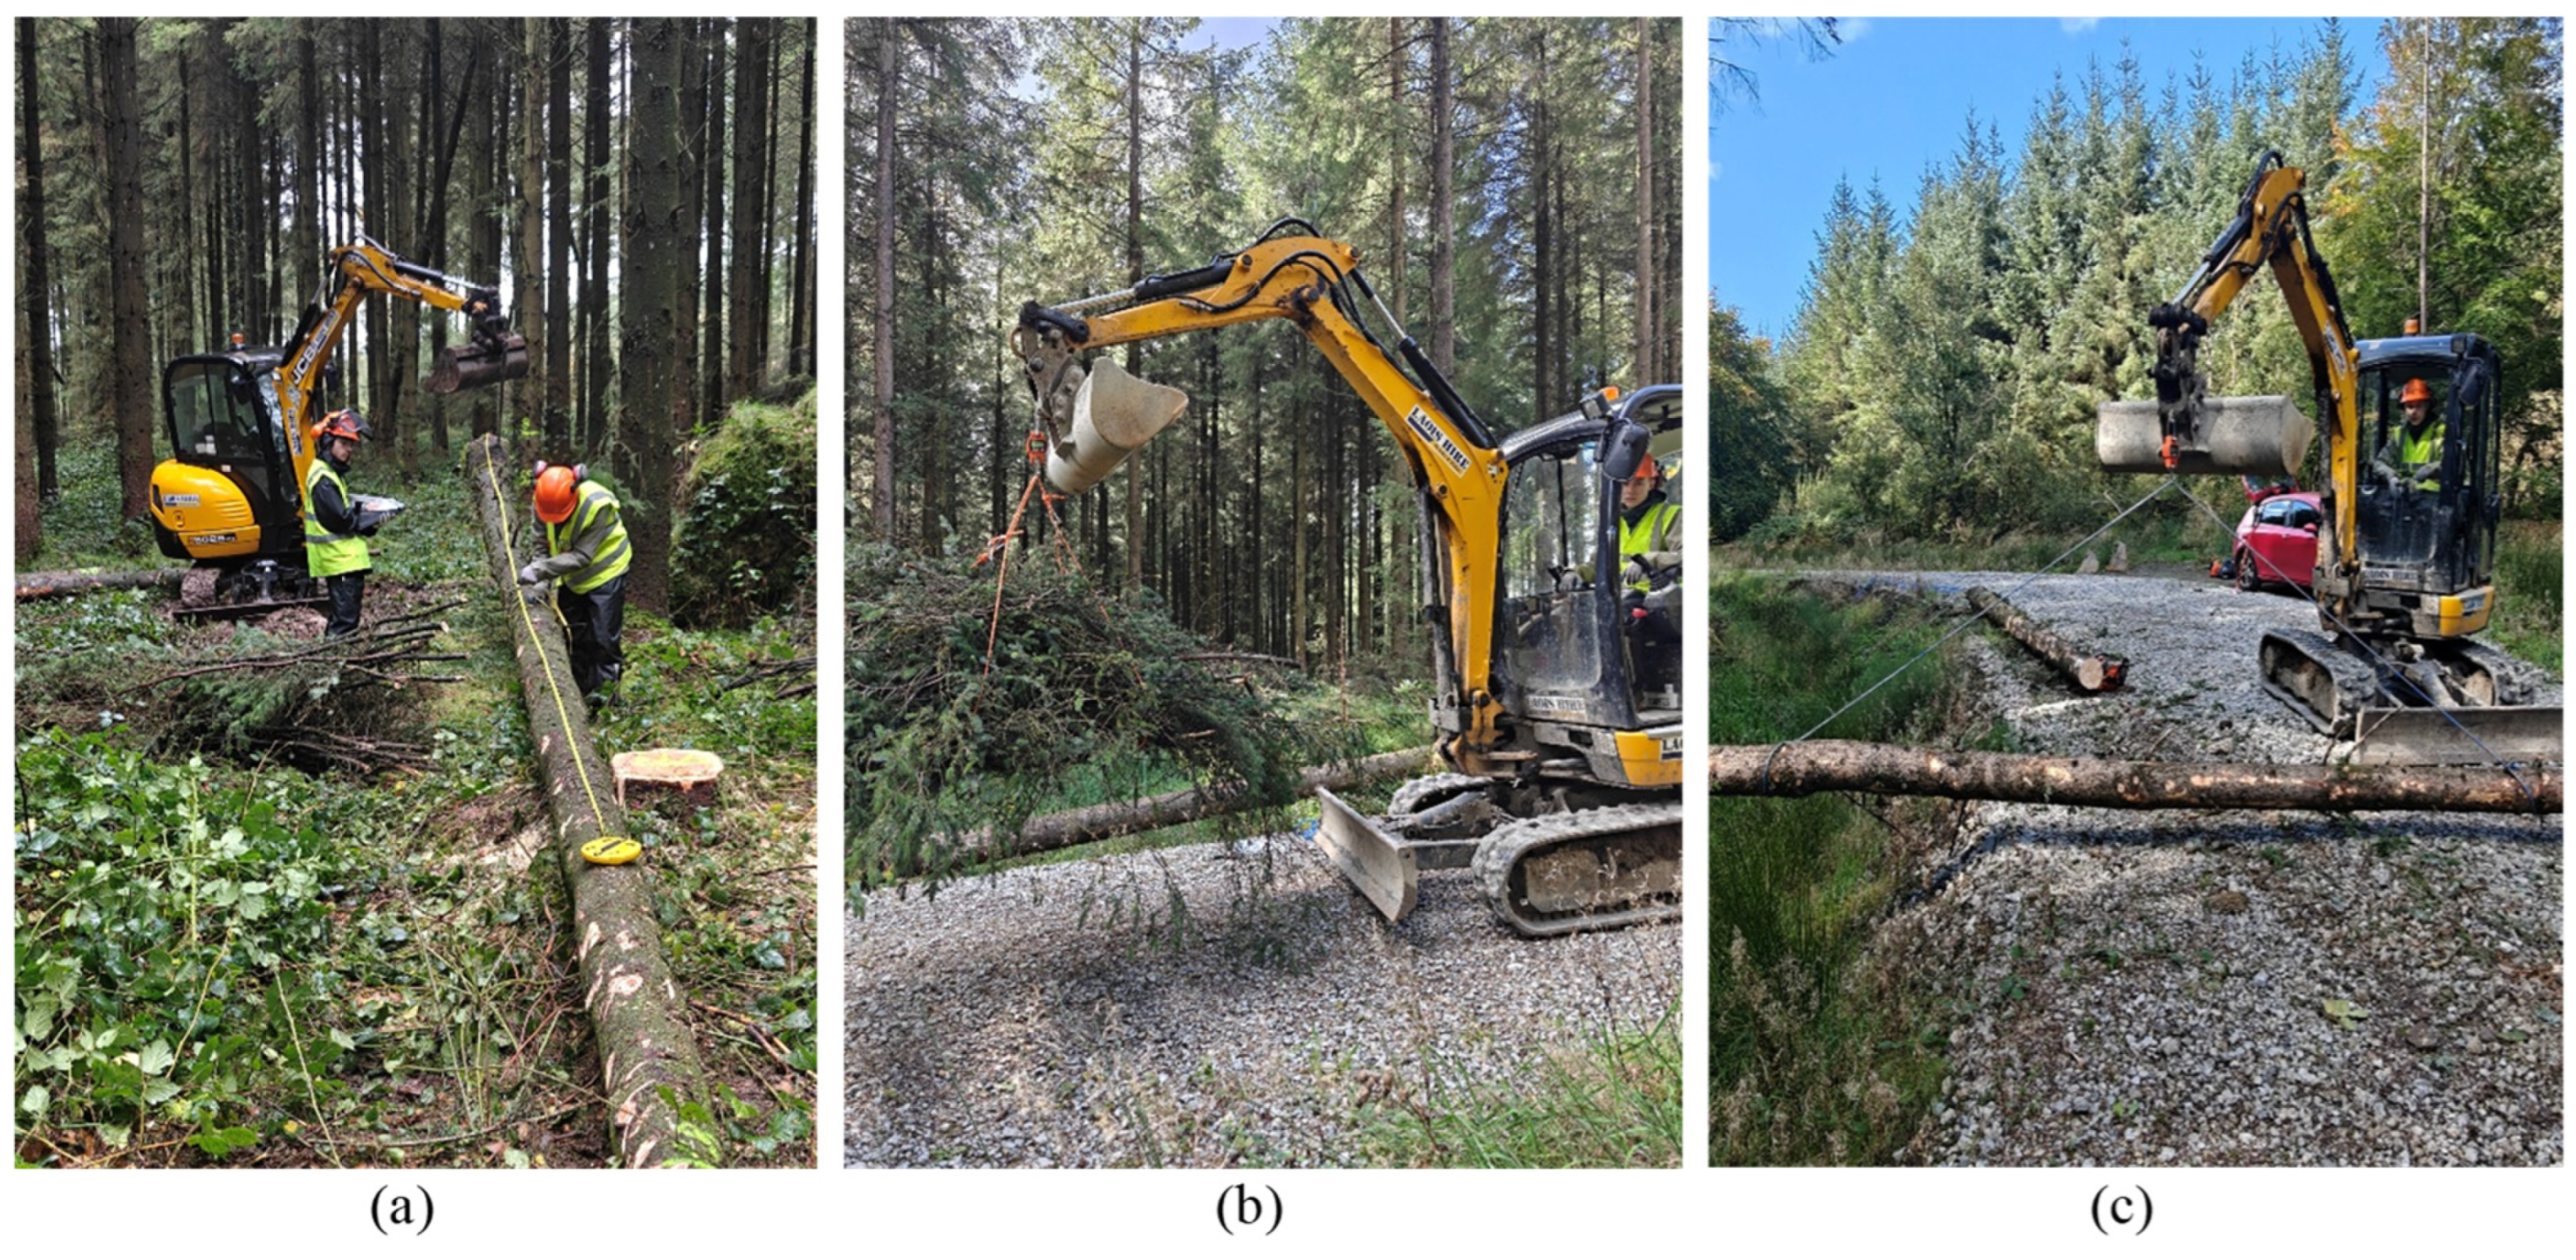
Destructive sampling was carried out in September–October 2025. Twelve trees were selected, ranging in diameter from 26.3 to 46.2 cm, with a mean of 33.3 cm. The selected trees span a representative range of diameters for the stand, enabling evaluation across typical commercial size classes. Procedures followed standard biomass partitioning methods [29] with protocol modifications to obtain stem measurements and basic density information. DBH was measured on the felled stem at 1.3 m above the stem base. After complete branch removal, total tree height was measured directly along the debranched stem using a measurement tape, running from the base to the top of the sample; this provided a true height measurement. Following this, over-bark stem diameters were recorded every 0.3 m from the base of the stem to the point where the stem diameter declined to below 7 cm (Figure 1a). All diameters were recorded to the nearest millimetre. A top-end diameter of 7 cm over bark was selected because it is the merchantable limit typically applied in Irish conifer harvesting.
Figure 1.
Destructive sampling conducted in autumn 2025. (a): Stem measurements gathered every 0.3 m along the stem profile. (b): Branch biomass was weighed fresh in the field; the crown was split into equal thirds. (c): Stem sections were weighed in the field; the merchantable stem was split into equal thirds.
Branches were classified into dead and live components, where the transition point was defined as the whorl at which >75% of branches were photosynthetically active [29]. The live crown was split into three equal sections, lower, middle and upper, and weighed in the field using spring balances with 0.1 kg precision (Figure 1b). Deadwood sections were also weighed in the field, and subsamples were collected from each crown section as well as from deadwood. The stem was also divided into three equal sections based on total stem length, from the base to 7 cm top-end diameter and weighed using spring balances with 0.5 kg precision (Figure 1c). Stem discs were collected at: (i) base of the stem, (ii) boundary between the lower and middle third, (iii) boundary between the middle and upper third, and (iv) top of the upper third. Additional discs were cut at DBH to determine sawlog density, while discs were also taken from stem sections representative of palletwood and pulpwood assortments. All branch and disc biomass samples were kept in cold storage until processing was conducted. Fresh weights for each subsample were recorded, and subsequently the subsamples were oven-dried at 70 °C to constant mass to determine dry-weight biomass and moisture content. These moisture contents were applied to the associated field fresh weights to record component-specific dry weight biomass information. The biomass of each component was summed to give the total branch, total stem and overall AGB weight biomass. These data served as the reference for all AGB comparisons; they also allowed for the creation of an allometric branch biomass equation. Discs taken from sawlog, pallet and pulpwood stem positions had their basic density determined using the water displacement method [30], defined as oven-dry mass divided by green volume.
2.2.2. Stem Volume Reference
To reduce the influence of stem profile measurements collected on or near whorls and to preserve the underlying stem taper, measured diameters were converted to radii (cm) and smoothed using a rolling-median filter. A 4-point window was selected, balancing suppression of whorl-related bulges with retention of a biologically realistic stem profile. The final measured radius was constrained to match the raw radius at the uppermost measurement to preserve the observed stem tip dimension. A LOESS smoother (span = 0.15) was subsequently fitted to the rolling-median radii as a function of height, producing a continuous and noise-reduced stem profile [31]. Any missing diameter measurements were replaced with median-filtered values. This produced smooth, biologically consistent stem profiles for all sample trees. Window sizes and LOESS spans were chosen following visual assessment of alternative smoothing settings, with the objective of reducing localised stem irregularities associated with branch whorls and bark roughness, which otherwise would have introduced artificial variability into volume estimates. All procedures were implemented in R (v4.4.1) (R Core Team, 2024).
Merchantable stem volume was calculated by numerical integration of the smoothed stem taper using a frustum-of-a-cone integration. Adjacent height intervals (e.g., 0.3–0.6 m, 0.6–0.9 m) defined individual stem segments, each represented as a truncated cone with radii at the lower and upper segment boundaries. Segment volume was calculated as:
where is the total merchantable stem volume (m3, over bark), is the length (m) of stem segment , and are the radii (m) at the lower and upper ends of segment respectively, and is the total number of stem segments. Segment volumes were summed from the stem base to the height at which the smoothed stem diameter reached 7 cm. The exact height corresponding to this threshold was determined by linear interpolation between the last segment with a diameter ≥7 cm and the first segment below this value. To ensure comparability across trees and avoid overestimation of volume at the butt end, the first measurement at 0.3 m was extended to 0 m, duplicating the first measured over-bark radius at the stem base. This approach treats the basal section as a short cylinder with a radius equal to the first reliable over-bark measurement, preventing unrealistic inflation of merchantable volume due to buttressing. The resulting merchantable stem volumes derived from destructive sampling were used as the reference dataset for evaluating the accuracy of MLS-derived stem volume estimates.
2.3. MLS-Derived Stem Reconstruction
MLS-derived stem reconstruction was performed using the segmented single-tree point clouds described in Section 2.1. Stem diameters were extracted from the point clouds using the 3DFin plugin [28]. Diameters were computed at 0.2 m vertical intervals along the stem, beginning at the recorded stump height (post-felling) and extending upward to the last reliable measurement. The last reliable measurement was defined as the highest stem diameter at which a closed circular cross-section could be robustly fitted without occlusion, while also passing 3DFin quality checks (binary 0–1) and an imposed outlier-probability threshold of ≤15%. Extracted diameters were converted to radii and smoothed to reduce the influence of localised stem irregularities and measurement noise. A six-point rolling median filter was first applied to suppress short-scale fluctuations, followed by fitting a LOESS smoother (span = 0.6) to the median-filtered radii as a function of height. This procedure yielded smooth, continuous lower-stem taper profiles derived directly from MLS measurements [31]. A larger smoothing window and LOESS span were used for MLS-derived profiles than for destructive reference profiles because MLS diameter estimates contained greater variability arising from point-cloud noise. Filtering and smoothing parameters were selected pragmatically through iterative comparison with destructively measured stem profiles. The objective was to suppress diameter fluctuations caused by whorls, branching and MLS fitting noise, while preserving the underlying biological stem taper. The 15% outlier-probability threshold was selected to remove visibly unreliable diameter measurements while retaining sufficient upper-stem observations for reconstruction. Once selected, these parameters were applied consistently across all sample trees and height scenarios.
Due to occlusion in the upper canopy, MLS-derived diameter measurements were limited to the visible, lower portion of the stem. The upper stem was reconstructed using a linear interpolation approach designed to preserve tree-specific stem form and minimise additional modelling assumptions. For each tree, the smoothed MLS-derived taper was extended upward from the last reliable diameter measurement toward the 7 cm top-end diameter. This top-end diameter was imposed at a fixed anchor height 2.65 m below the measured total tree height. This anchor point was selected based on analysis of an independent destructive sampling dataset comprising more than 110 Sitka spruce trees across ten Irish sites and spanning multiple developmental stages (17–31 years) and thinning conditions, from unthinned stands to stands thinned multiple times [32]. Analysis of the associated destructive sampling data showed that the height at which stem diameter declined to 7 cm occurred at a relatively consistent offset below total tree height, with an average offset of ~2.65 m, a range of 1.85–3.12 m and a standard deviation of 0.34 m.
The stem segment between the final reliable diameter measurement and the merchantable anchor point was reconstructed by linear interpolation of radii as a function of height, ensuring a smooth decline in stem diameter. This approach allowed the lower-stem profile to be determined entirely by MLS measurements, while the upper-stem profile was modelled using the last reliable diameter measurement and the enforced 7 cm top-end diameter point. The MLS-derived lower stem and modelled upper stem were merged to form a continuous stem profile for each tree.
The merchantable stem volume of scanned trees was calculated from reconstructed stem taper profiles using a frustum-of-a-cone approximation, consistent with the approach applied to the destructive reference data. However, for MLS-derived profiles, the smoothed taper was evaluated on a 0.1 m height grid. Because centred rolling windows omit edge values, the smoothened MLS taper did not extend to the stem base. To account for this, the first MLS diameter that passed both quality filtering (0–1) and outlier-probability threshold (<15%) was used as a bridging point. This diameter was assumed to apply from the stem base to the height of the first smoothed diameter, forming a “basal plug” prior to volume integration. This approach avoids systematic underestimation of basal stem volume resulting from the exclusion of lowermost stem measurements during MLS smoothing. Volumes were integrated from 0 m to the interpolated height corresponding to a merchantable 7 cm top-end diameter. Stem biomass was estimated by converting MLS-derived merchantable stem volume to dry mass using the mean basic density (385.8 kg/m3) derived from destructive sampling. Branch biomass was estimated using an allometric model relating destructively measured branch dry biomass to tree diameter at breast height (DBH, cm). Several candidate functional forms (linear, polynomial, exponential, and power models) were evaluated, and the log–log linear regression shown was selected
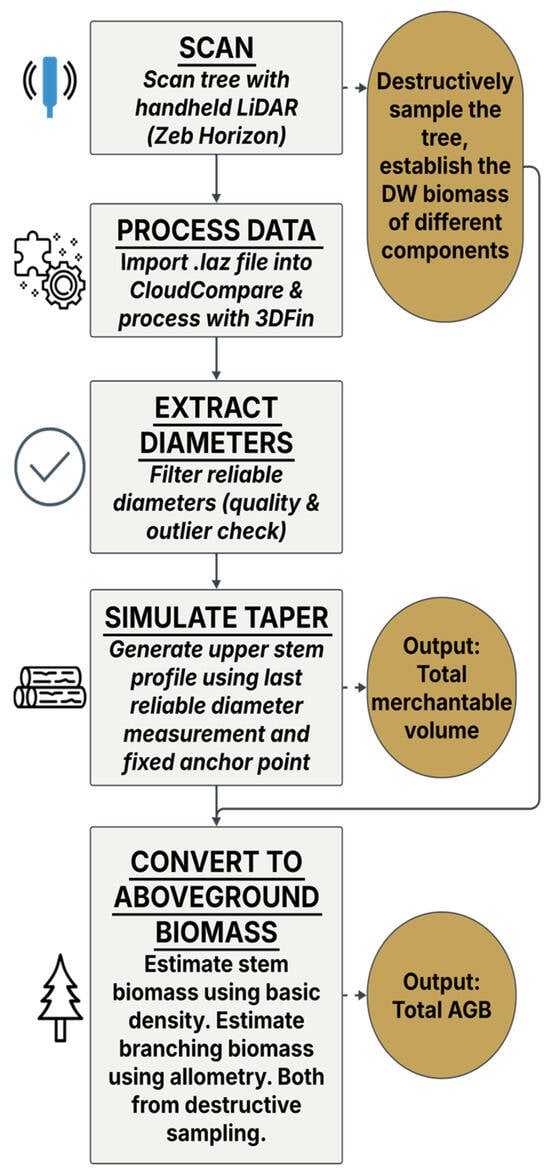
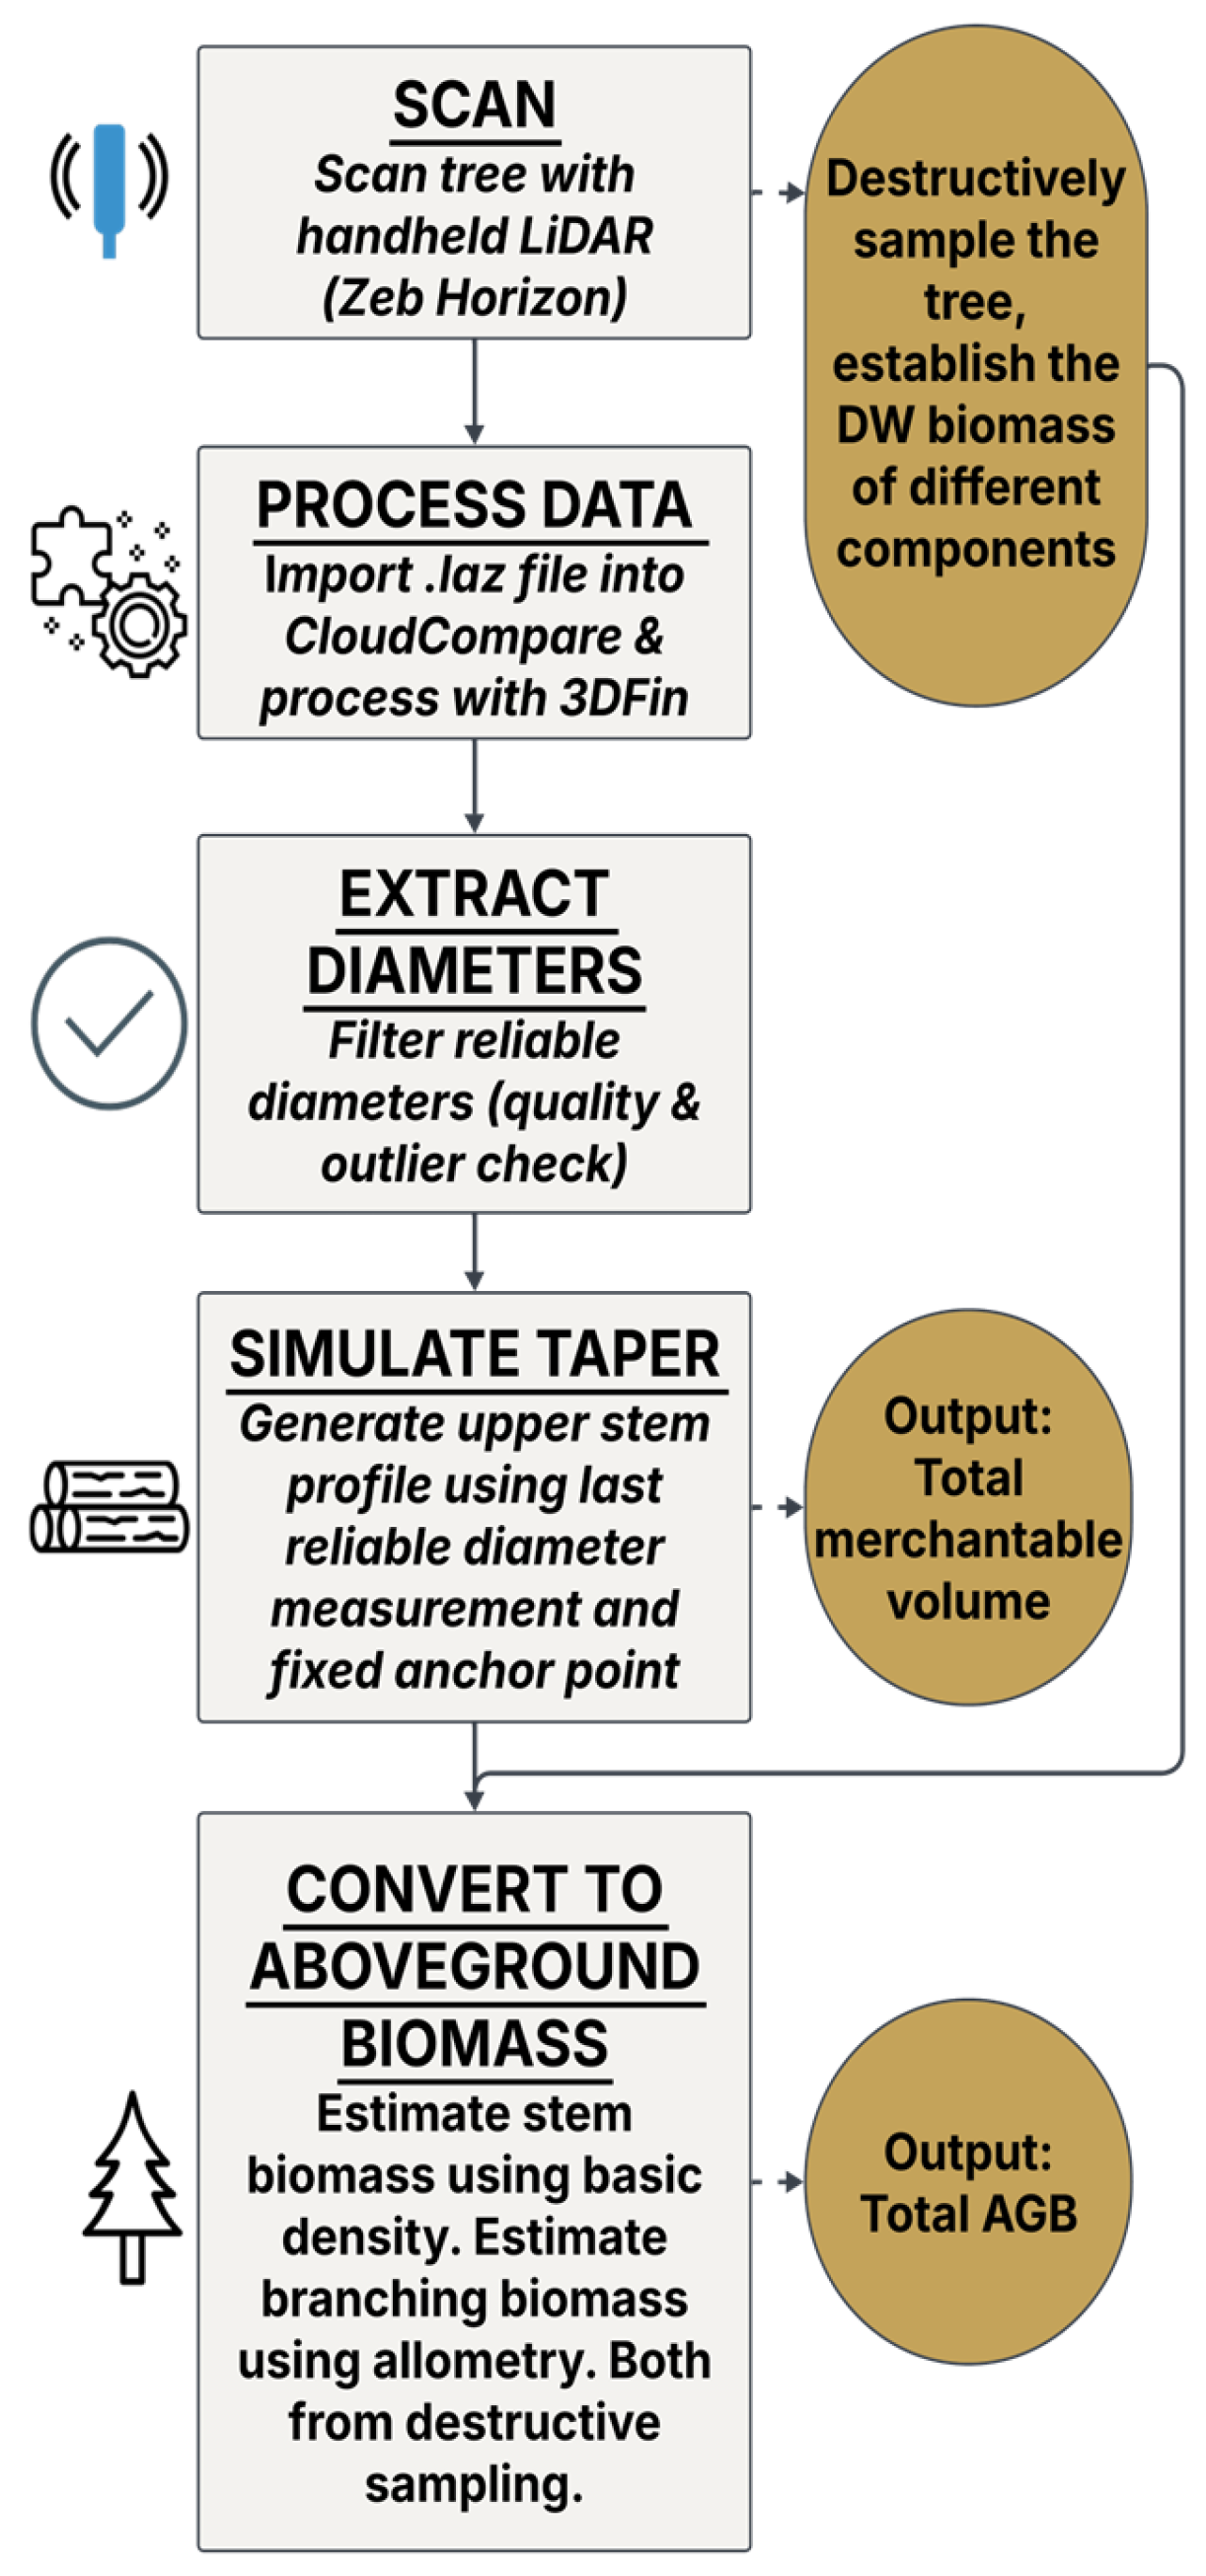
where log denotes the natural logarithm, is the branch dry biomass and and are fitted parameters. Model selection was based on Akaike’s Information Criterion (AIC) and predictive performance (RMSE). Predictions were bias-corrected using a smearing estimator (mean of exp-transformed residuals) to account for retransformation bias when converting from log scale back to biomass. The allometric model was calibrated using field-measured DBH from destructively sampled trees and subsequently applied to MLS-derived DBH measurements to estimate branch biomass for all trees. Total AGB was obtained as the sum of stem and branch biomass components (Figure 2).
Figure 2.
Schematic overview of the MLS-based workflow for estimating merchantable stem volume and AGB, combining handheld LiDAR measurements with destructive sampling for reference calibration.
2.4. Height Reconstruction
Height reconstruction was treated as an external input to the MLS workflow, reflecting the practical reality that handheld MLS systems often cannot reliably capture full tree height in dense evergreen stands. To explicitly quantify how uncertainty in height propagates into stem volume and AGB estimates, a controlled sensitivity analysis was conducted using multiple height scenarios. Each height scenario was applied independently while holding all other components of the MLS workflow constant, allowing the isolated effect of height uncertainty on volume and AGB estimates to be evaluated. These scenarios represent a spectrum from reference ground-truth measurements to DBH-height curves typical of operational inventory and scenarios designed to simulate systematic underestimation. DBH-height relationships were parameterised using subsamples of 3–12 trees derived from measured populations of 28 and 100 trees. Trees were selected to represent the DBH distribution (minimum, median, and maximum), and these scenarios were designed to reflect differing levels of operational sampling intensity (Table 2). Tree heights were recorded using a hypsometer (Impulse 200, Laser Technologies, CL, USA).
Table 2.
Summary of tree height estimation approaches used in the analysis.
2.5. Allometric Benchmark for AGB Estimation
To provide a benchmark for the MLS-based approach against current national-level reporting approaches, AGB was also estimated using the allometric equation for “spruce” currently used in Irish LULUCF reporting [33]. The equation is expressed as:
where is aboveground dry biomass (), DBH is the diameter at breast height (cm) collected in the field, is the total tree height (m), and , , , and are species-specific coefficients (, , , ). The equation was evaluated using the same set of height scenarios applied to the MLS-based stem reconstruction workflow to enable a direct comparison of accuracy and sensitivity to height and DBH uncertainty.
All data processing, statistical analyses, and visualisation were conducted in R (R Core Team, 2024). Model performance was assessed at the individual-tree level using RMSE (expressed as a percentage of the mean observed value), mean bias, and coefficient of determination (R2). Visual agreement between reconstructed and reference taper profiles was evaluated using overlaid stem profiles. Generative AI tools were used during manuscript preparation to assist with the development, debugging, and refinement of R scripts used for data processing, statistical analysis, and figure generation. The tools were also used to support manuscript editing for clarity, structure, grammar, and readability. All code, analytical workflows, outputs, figures, results, and interpretations were critically reviewed, verified, and approved by the authors.
3. Results
3.1. Stem Profile Reconstruction and Volume Accuracy
MLS captured accurate DBH information with an RMSE of 1.87 cm (5.6%) and a bias of −1.38 cm (−4.2%). The last reliable diameter measurement captured by MLS ranged from 7.86 to 11.82 m on the stem across the sampled trees. This corresponded to a mean of 68.2% of total merchantable stem volume being directly measured by MLS, with individual trees ranging from 58.4% to 79.7% (Table 3).
Table 3.
Tree-level comparison of MLS-derived stem capture and volume estimation accuracy. The last reliable MLS height represents the uppermost stem position at which the diameter passed quality checks. MLS height capture (%) indicates the proportion of total tree height directly measured prior to upper-stem reconstruction, while proportion of merchantable volume (%) represents the proportion of merchantable stem volume captured by MLS before reconstruction.
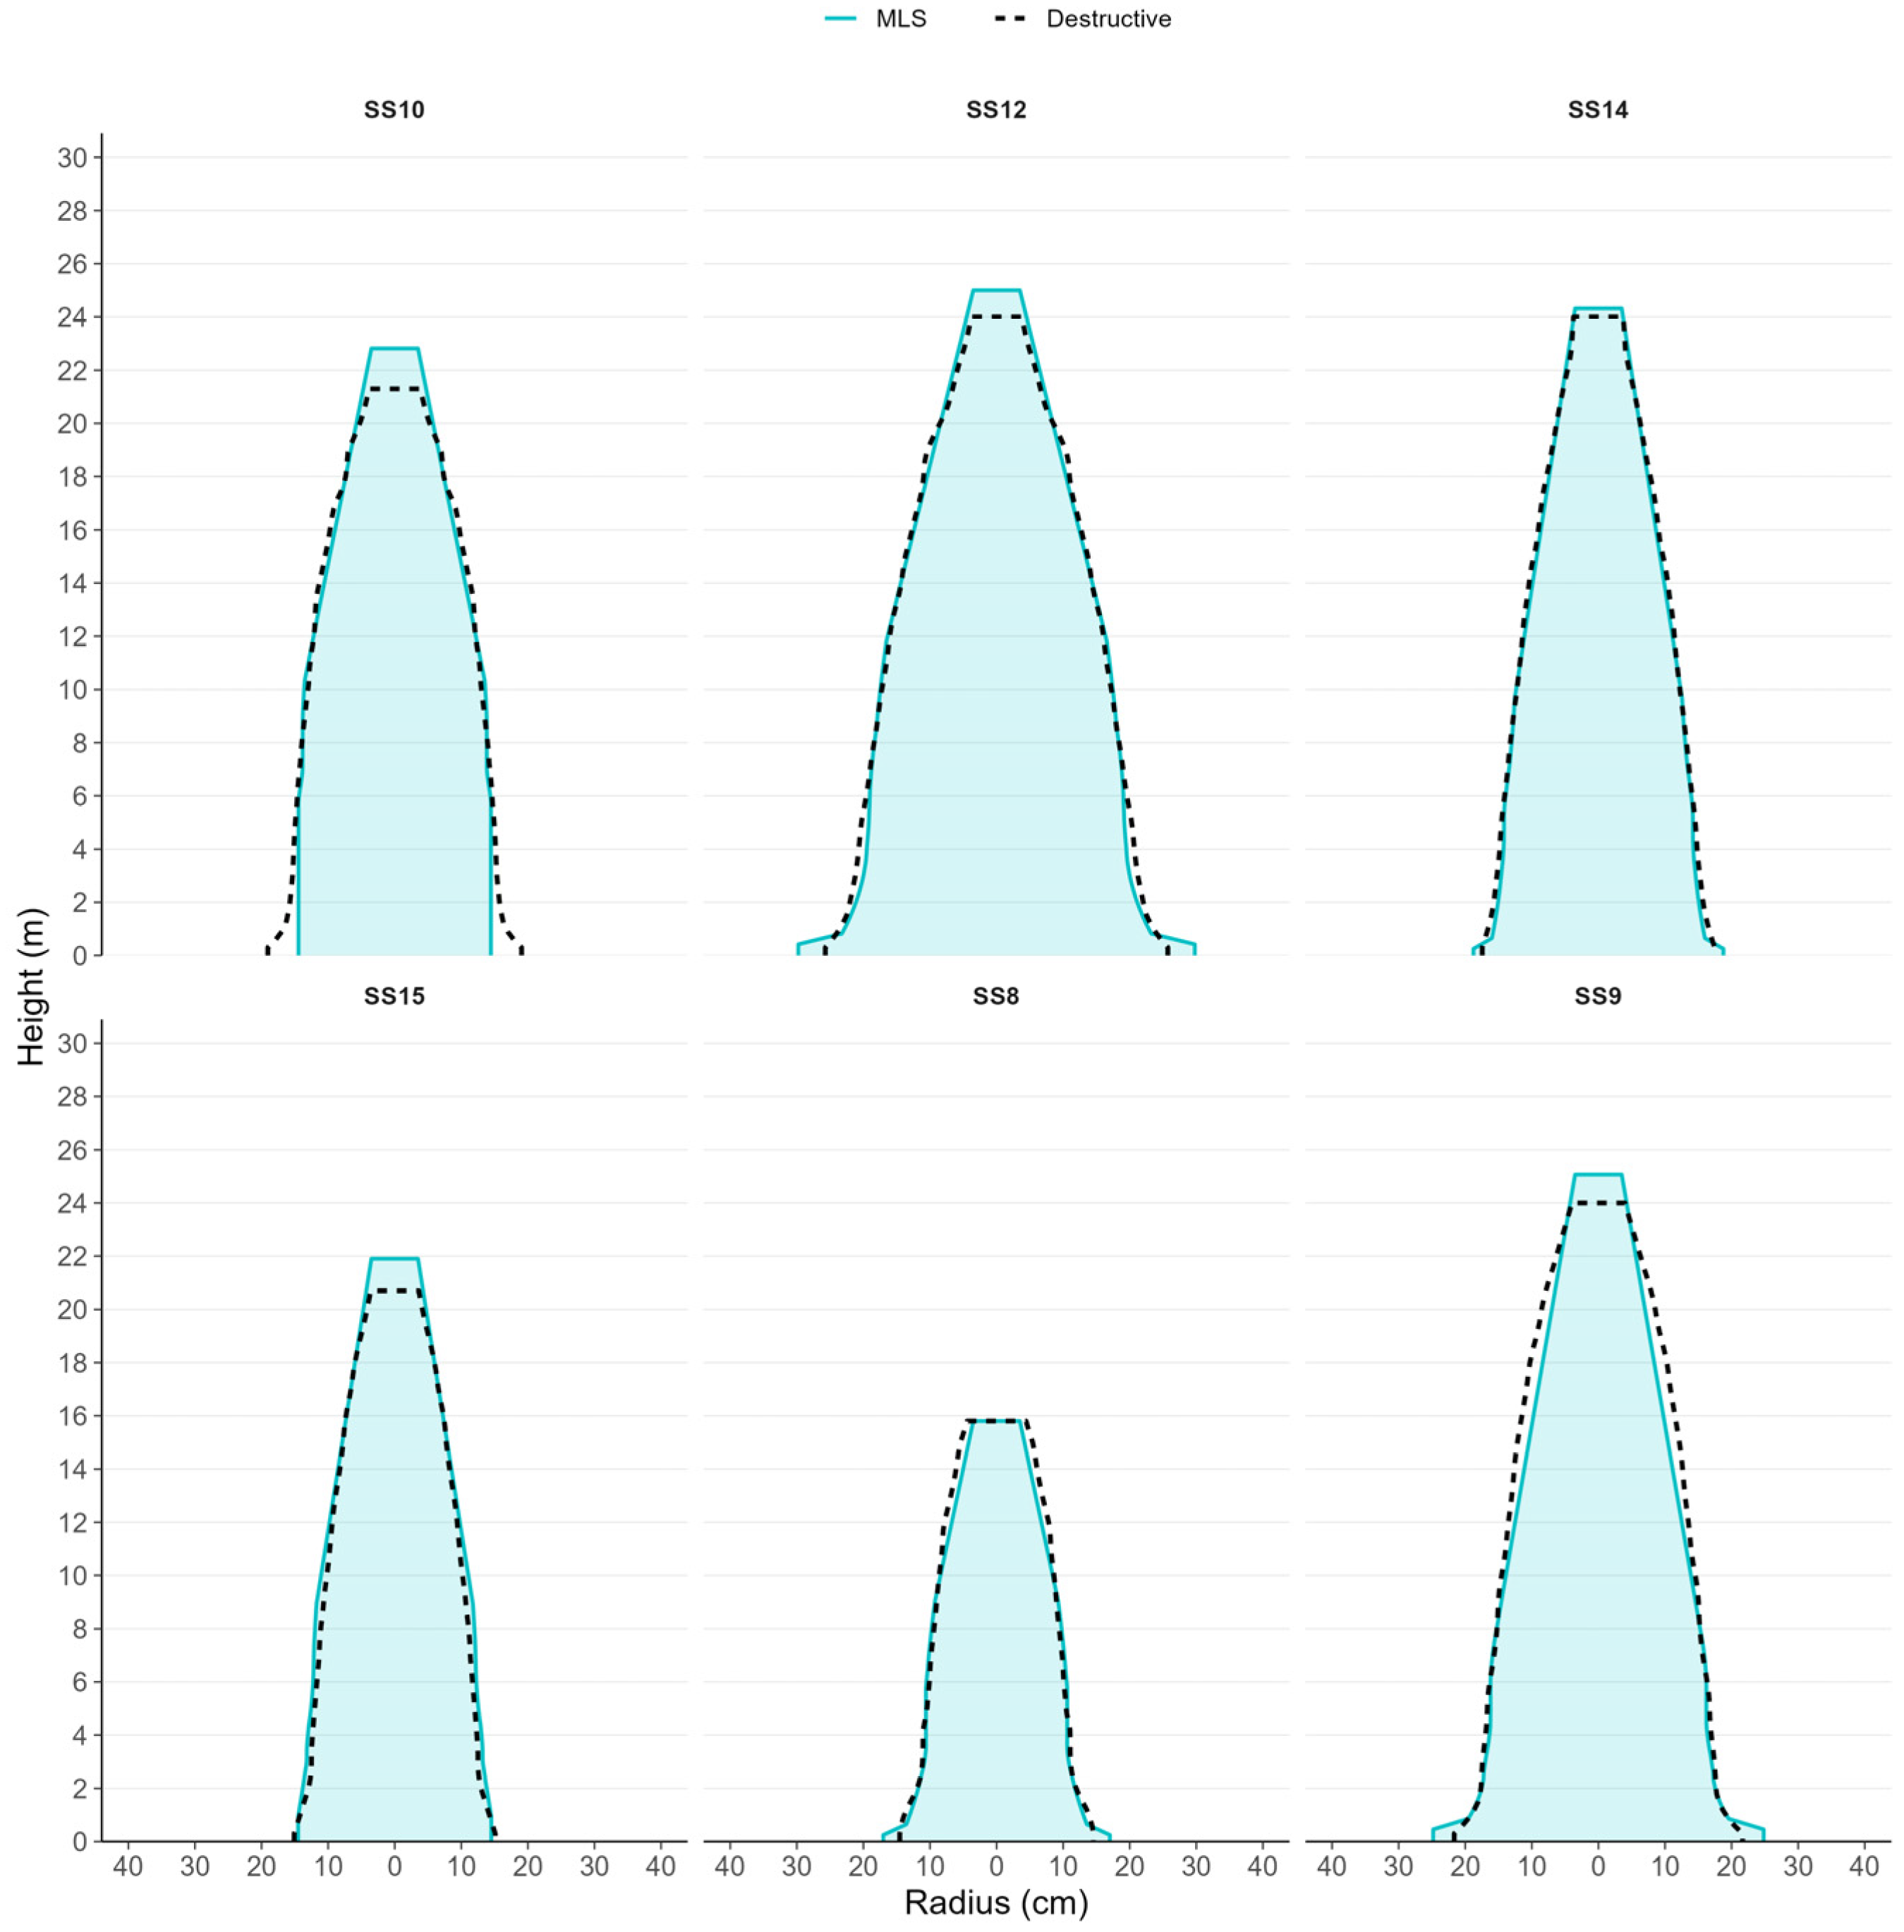
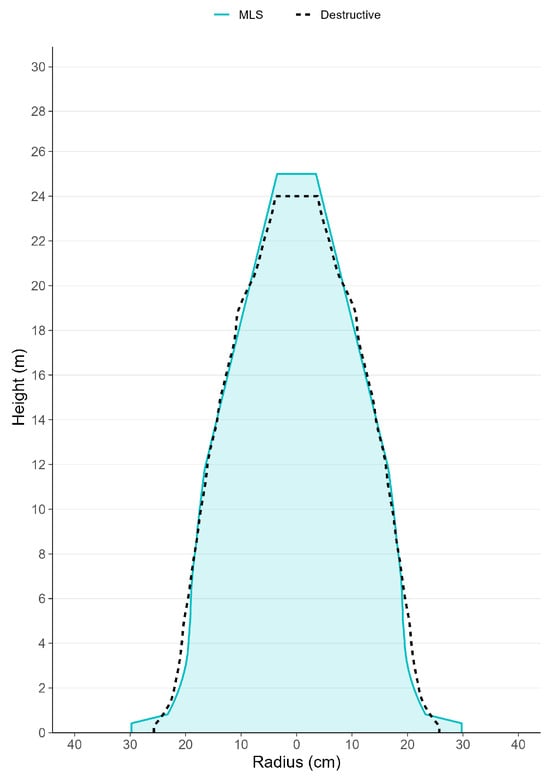
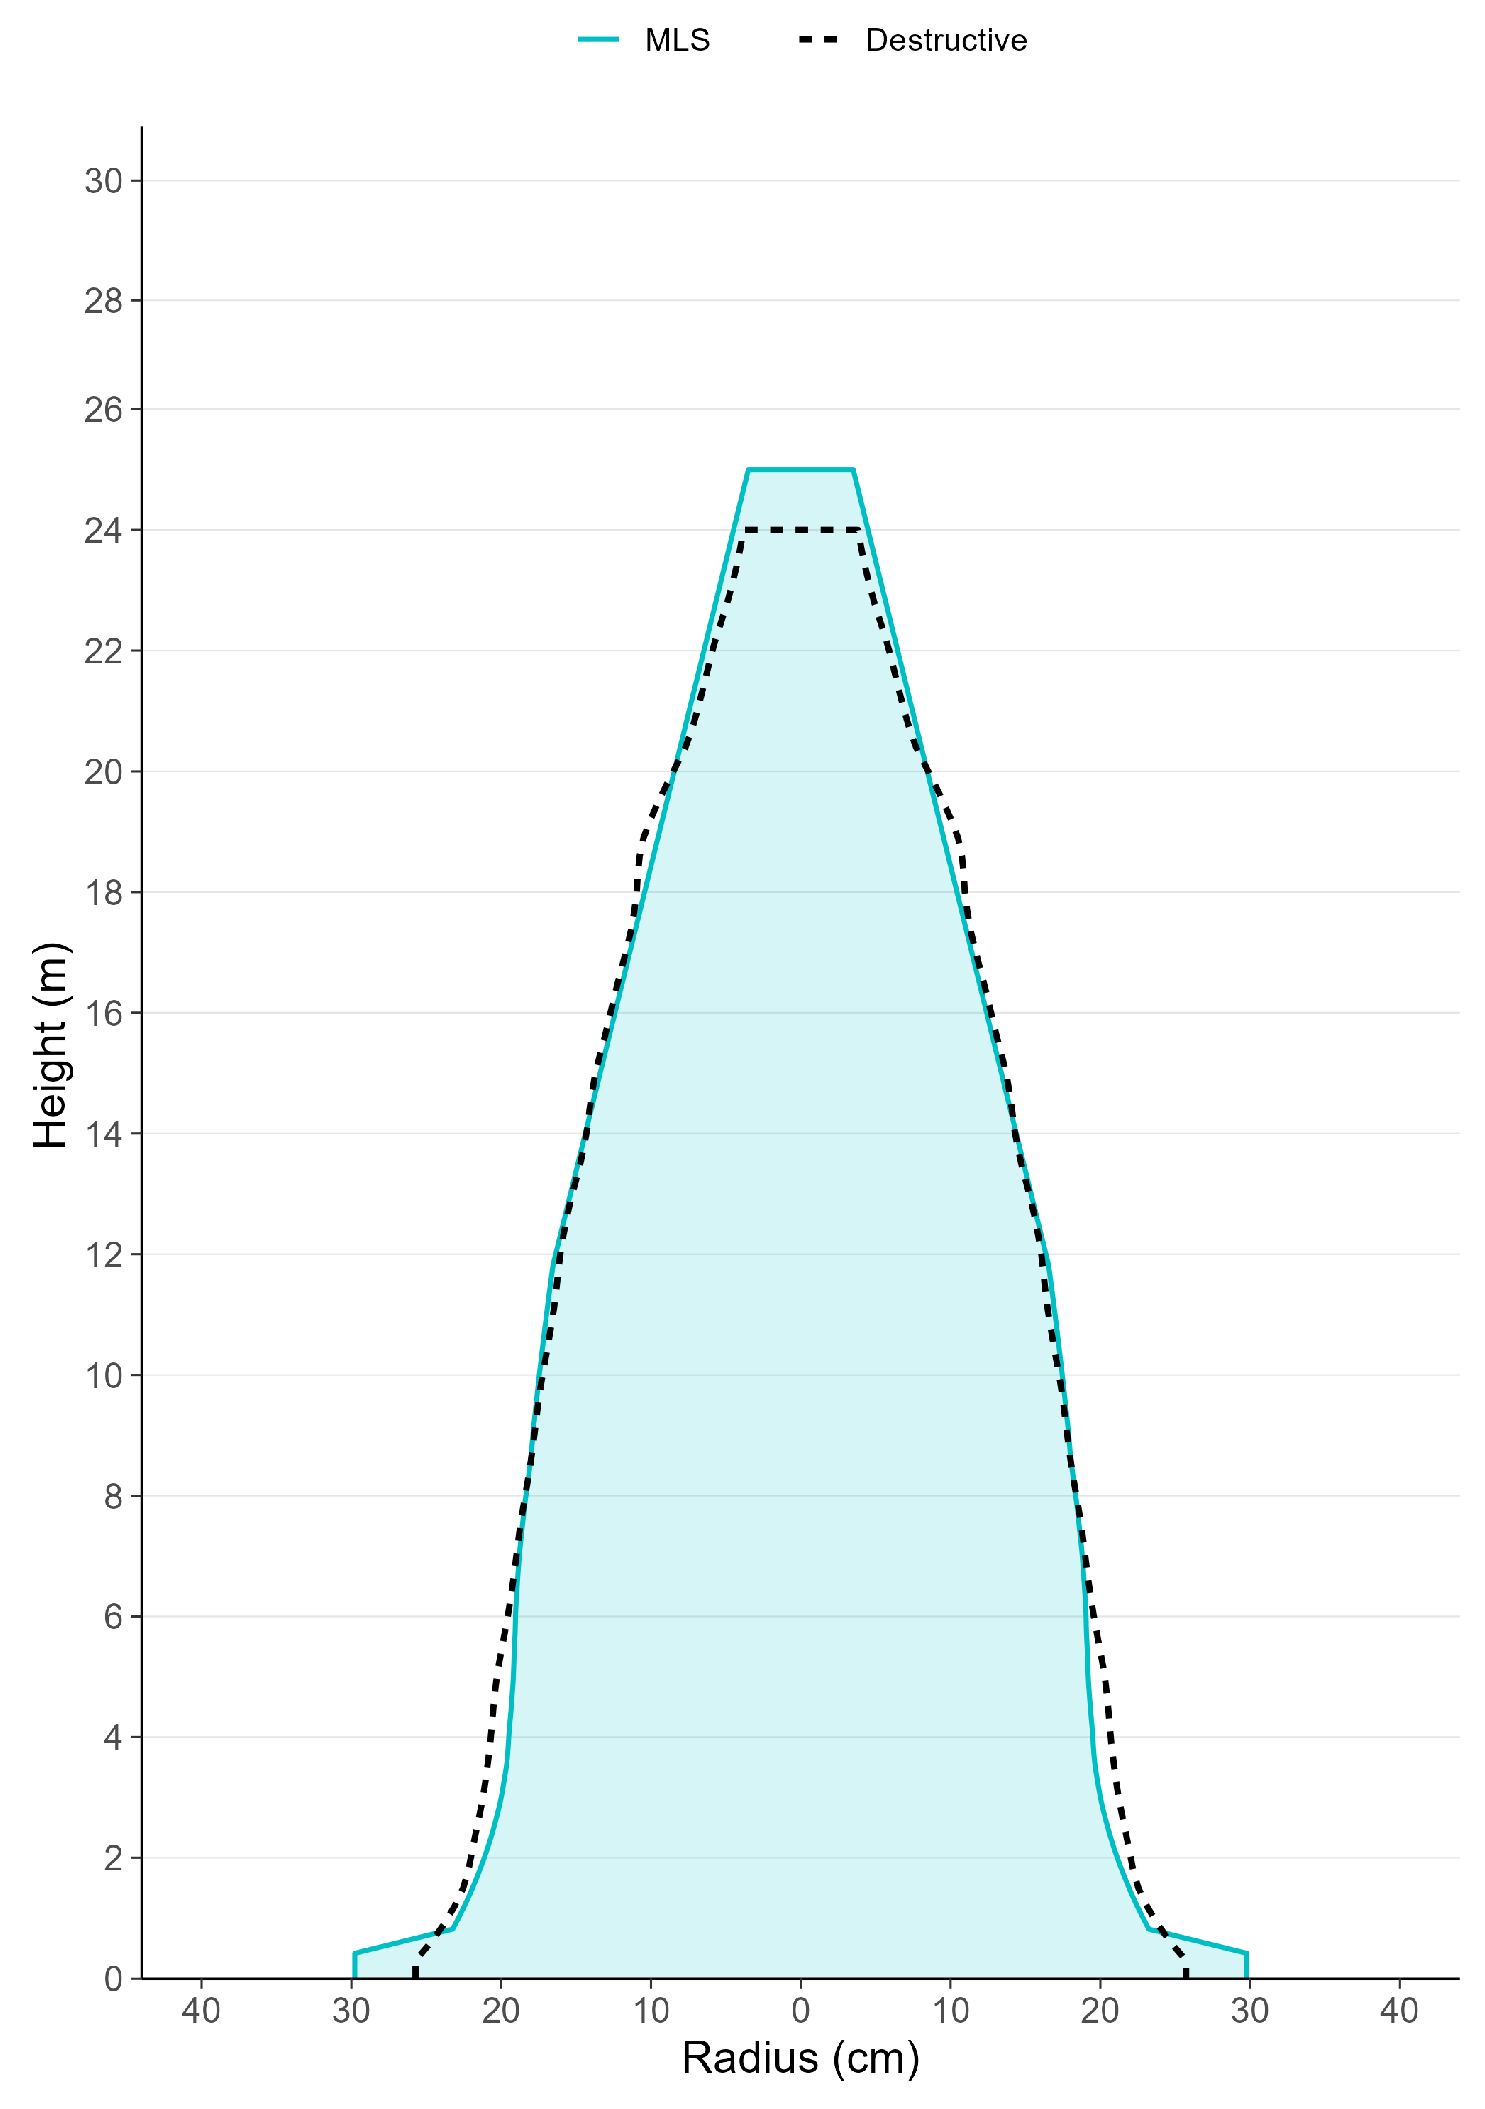
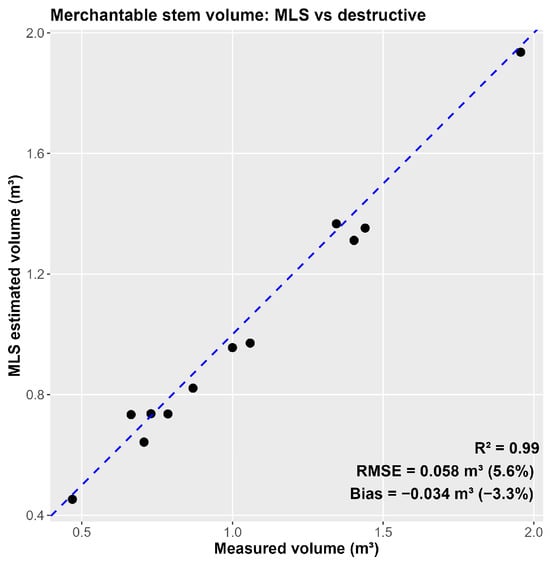
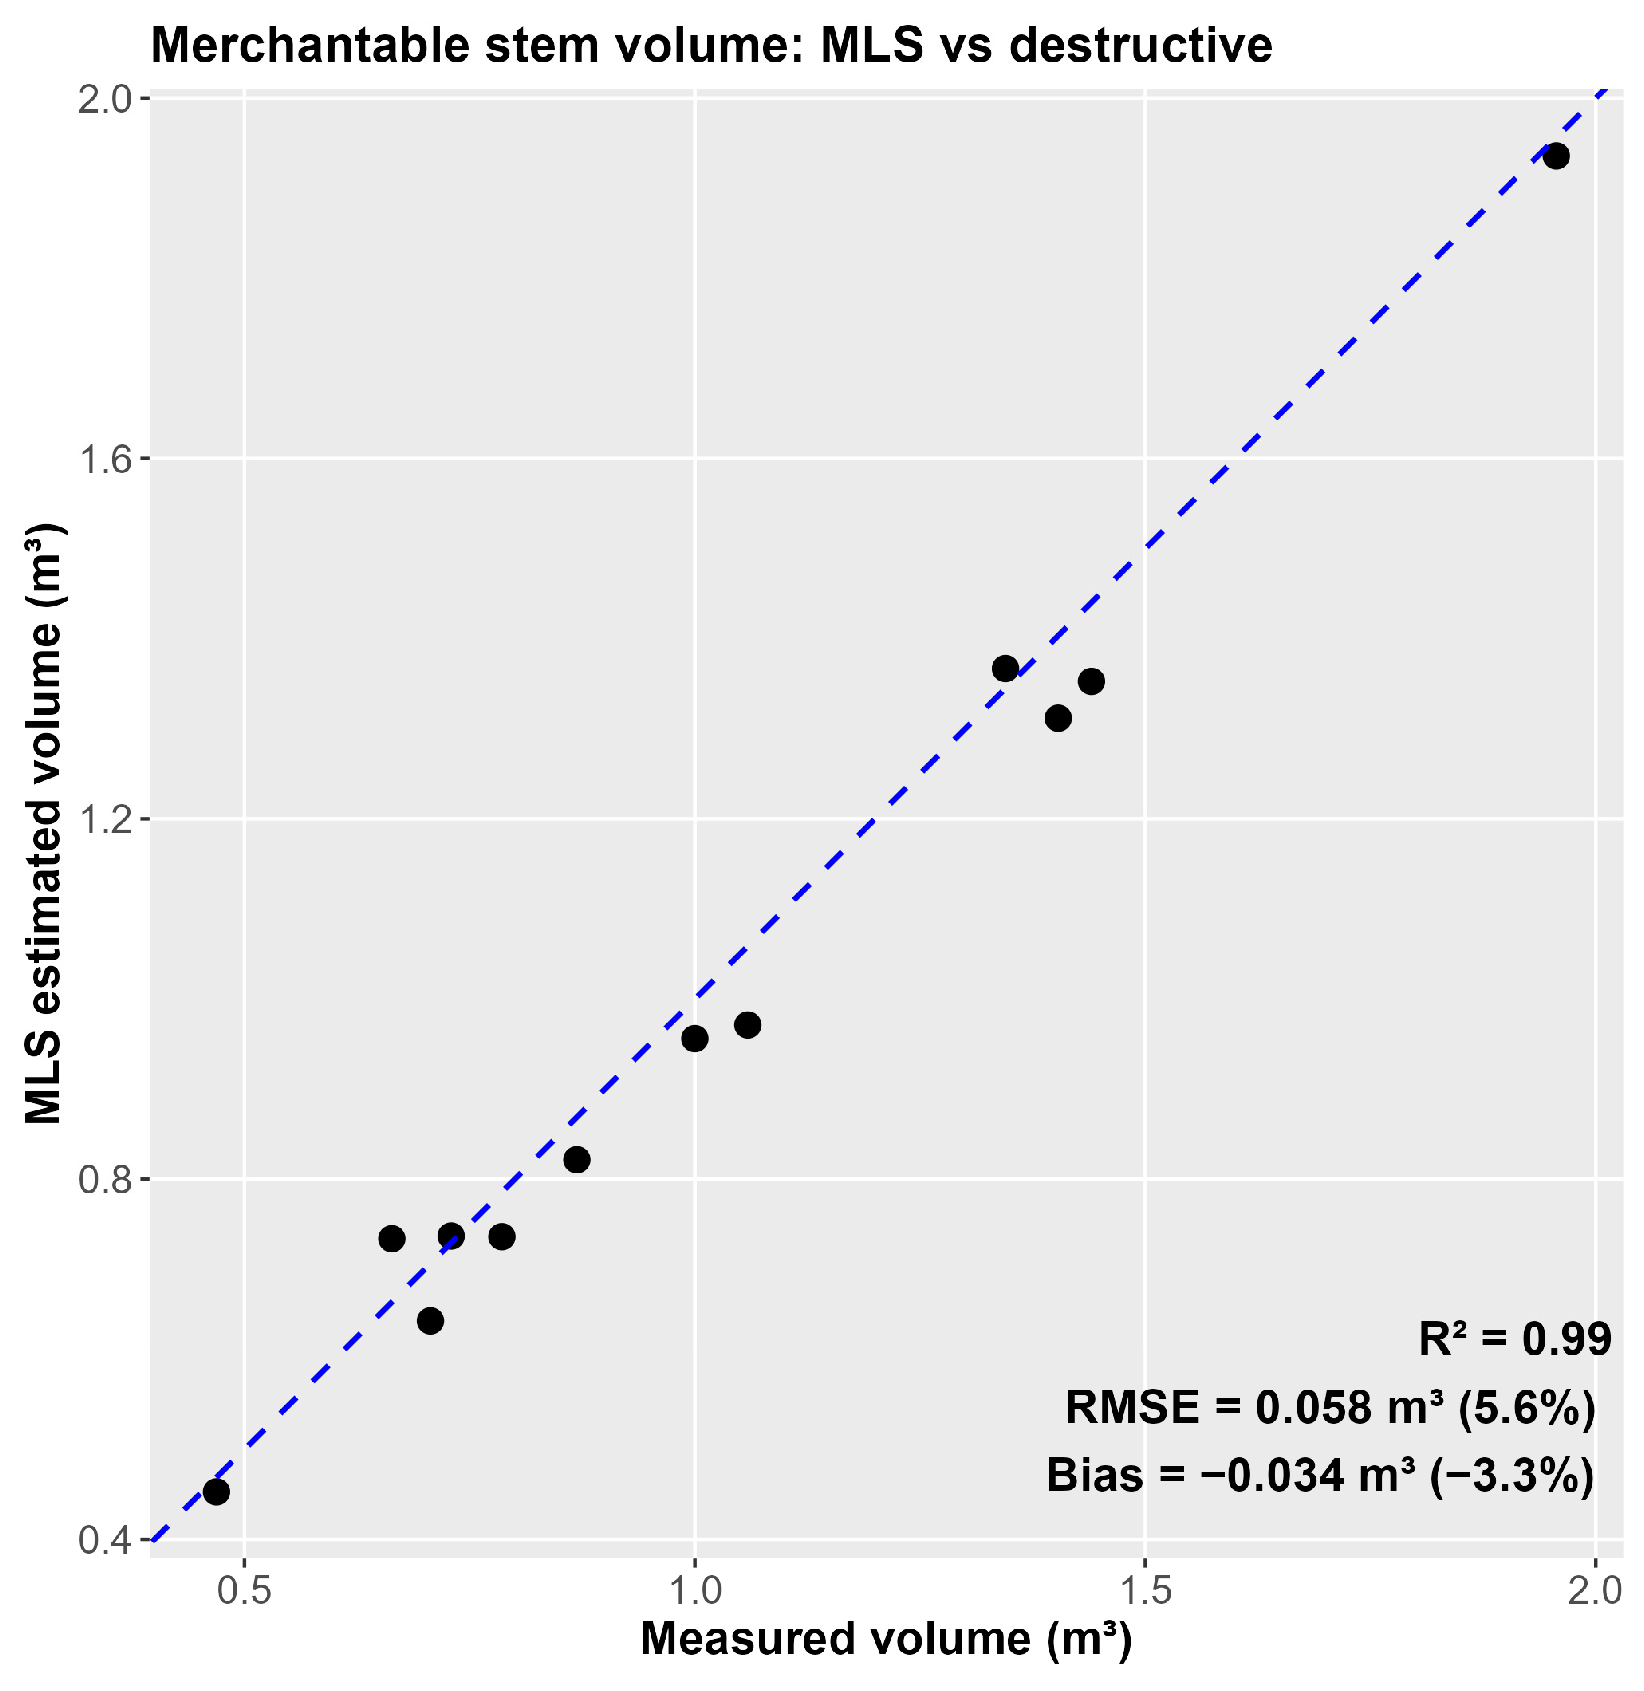
MLS-reconstructed stem profiles showed close agreement with destructively measured reference profiles across the sampled trees (Figure 3; Appendix B—Figure A1 and Figure A2). The overall RMSE between MLS-derived and destructively measured stem diameters was 1.52 cm (6.5%), demonstrating high agreement along the measured portion of the stem. Using the true height, MLS-derived merchantable stem volume showed strong agreement with destructive measurements (RMSE = 0.056 m3, corresponding to 5.6% of the mean observed volume), with a small systematic underestimation (mean bias = −0.034 m3; −3.3%). Relative volume errors across individual trees ranged from −9% to +10.6%. No pronounced dependence of volume error on tree size was observed, with errors remaining consistent across the sampled diameter range (Figure 4).
Figure 3.
Comparison of MLS-derived and destructively measured stem profiles for a representative tree. The MLS-derived profile (blue) closely matches the destructively measured profile (dashed line) along the full stem, demonstrating strong agreement between approaches and accurate reconstruction of a continuous stem profile.
Figure 4.
Parity plot comparing MLS-derived and destructively measured merchantable stem volume for individual trees. The dashed line represents the 1:1 relationship. Strong agreement between methods was observed across the full range of tree sizes. Model performance is summarised using R2, RMSE, and mean bias.
3.2. Aboveground Biomass Accuracy
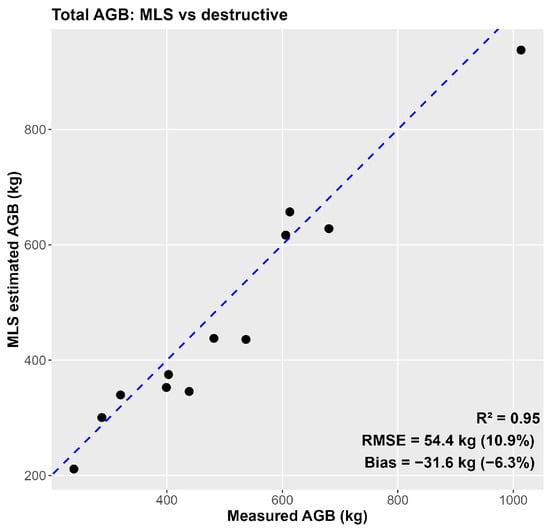
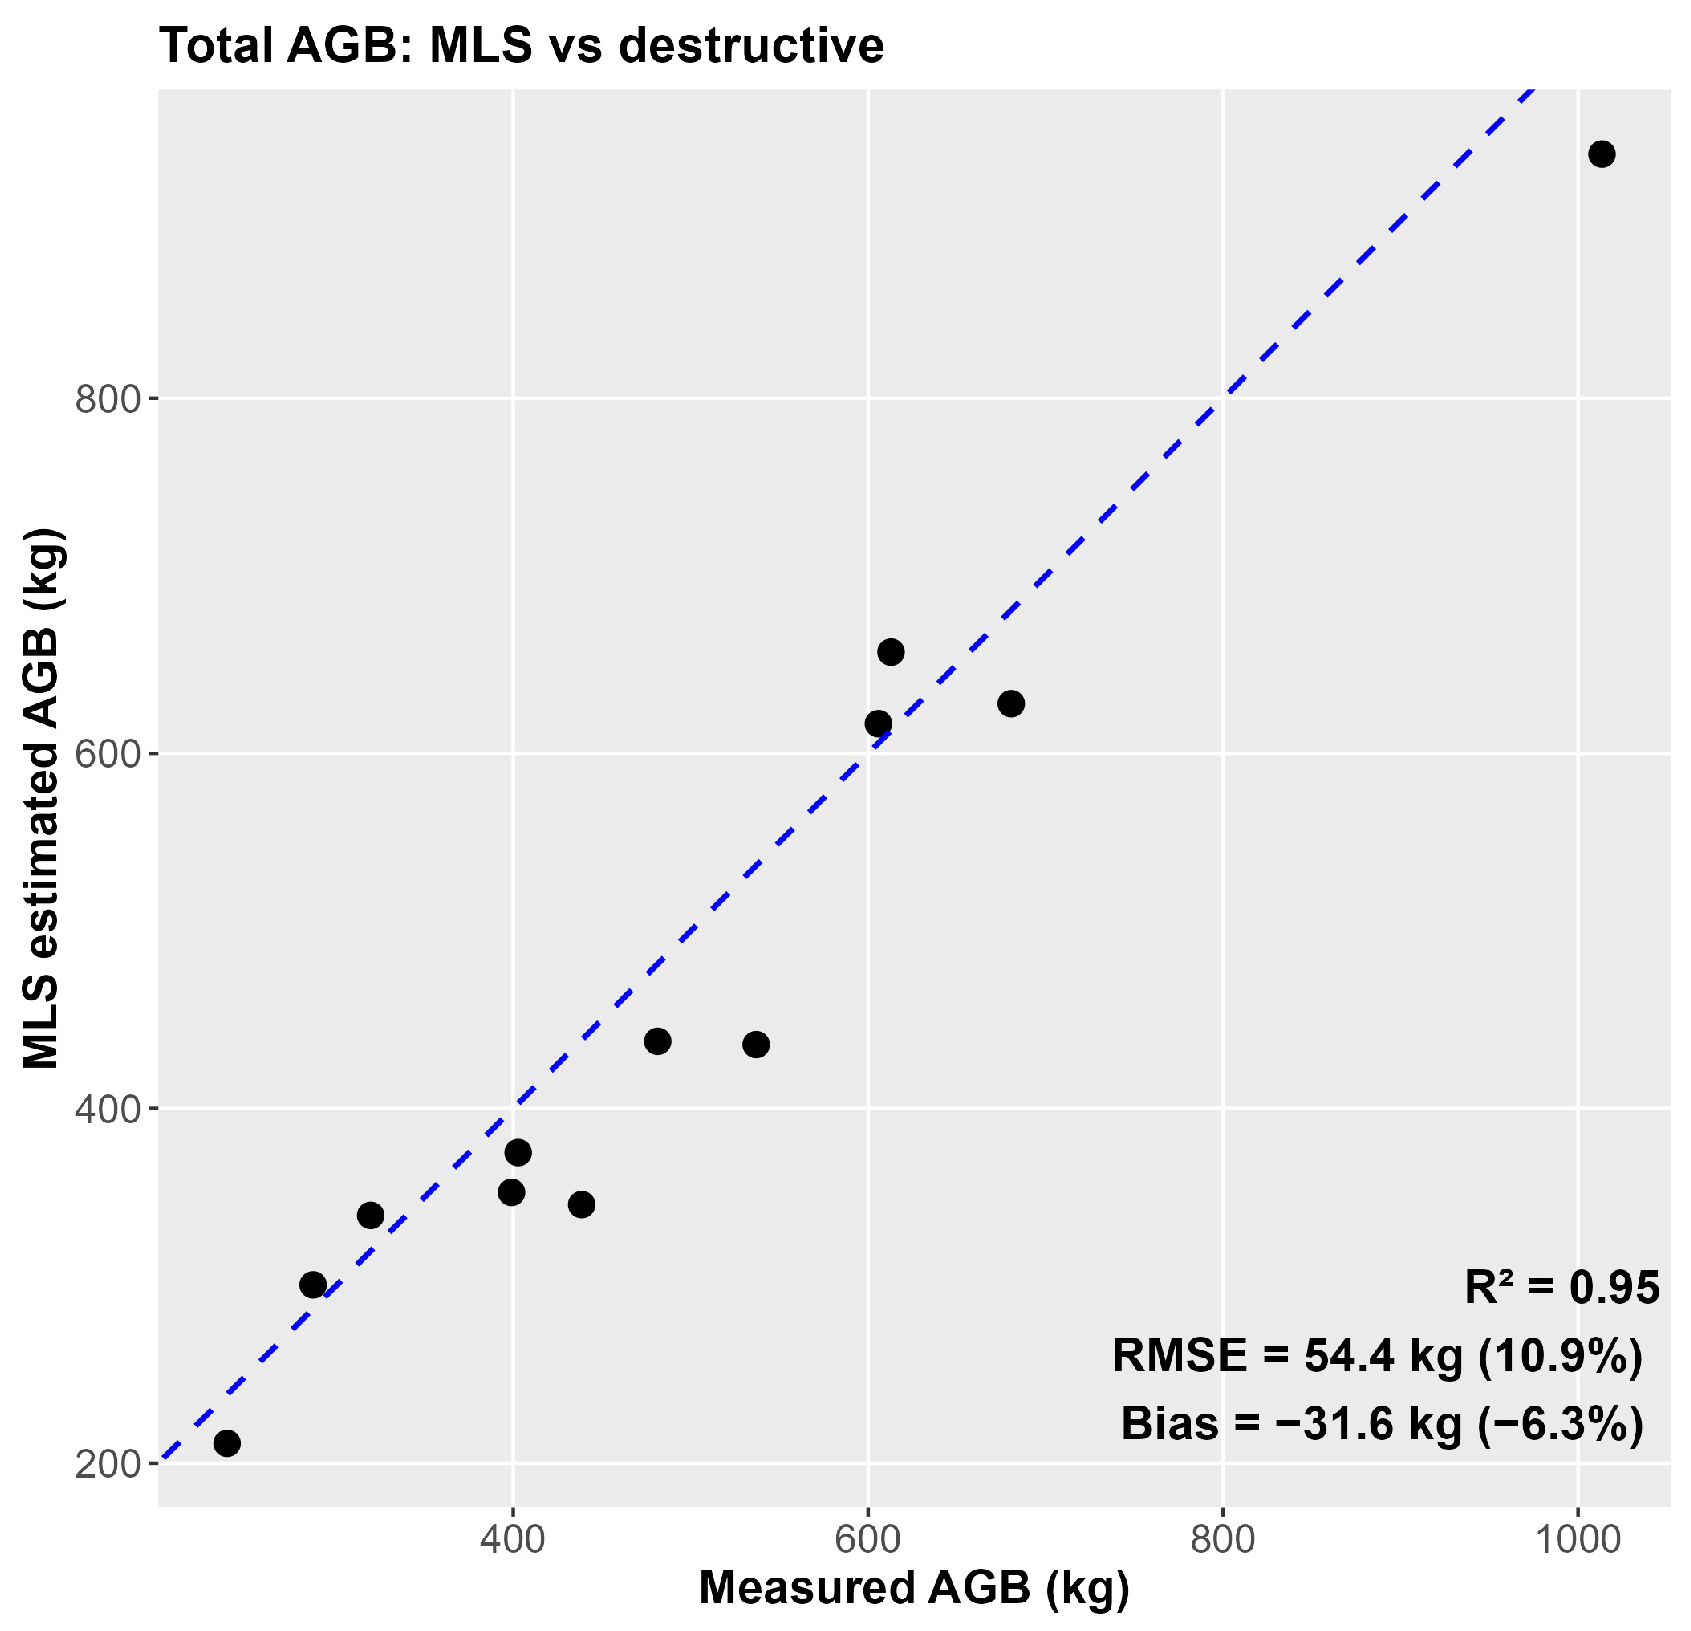
Using true height, MLS-derived estimates of AGB showed good agreement with destructively measured reference values (Figure 5). For total AGB, the RMSE was 54.4 kg, corresponding to 10.9% of the mean observed biomass stock, with a mean bias of −31.6 kg (−6.3%), indicating a small systematic underestimation. Stem biomass estimates exhibited slightly higher accuracy than total AGB, with an RMSE of 40.1 kg (9.8%) and a mean bias of −24.1 kg (−5.9%). Errors in stem biomass were closely mirrored in reconstructed stem volume, reflecting the direct relationship between stem biomass estimation and stem geometry.
Figure 5.
Parity plot comparing MLS-derived and destructively measured AGB for individual trees. The dashed line represents the 1:1 relationship. Strong agreement between methods was observed across the full range of tree sizes. Model performance is summarised using R2, RMSE, and mean bias.
The selected branch biomass model was a log–log allometric regression fitted to destructively sampled trees (n = 12; DBH = 26.3–46.2 cm):
(R2 = 0.703; adj. R2 = 0.674; residual SE = 0.285; F1,10 = 23.72, p < 0.001). The scaling exponent was 2.50 ± 0.51 SE (95% CI: 1.36–3.65). Following back-transformation (natural log) and application of a smearing correction factor (CF = 1.03) to account for retransformation bias, the model can be expressed as:
where is branch dry weight biomass (kg) and DBH is in cm. Branch biomass estimates showed greater relative uncertainty, with an RMSE of 19.8 kg (21.8%) and a mean bias of −7.5 kg (−8.2%). Despite this higher relative error, branch biomass contributed a smaller proportion of total AGB in comparison to stem components. On average, destructively measured branch biomass accounted for 17.9% of total destructive AGB across the sampled trees (range: 11.4%–24.8%), with the remaining 82.1% being stem biomass.
3.3. Sensitivity of Volume and AGB to Height Uncertainty
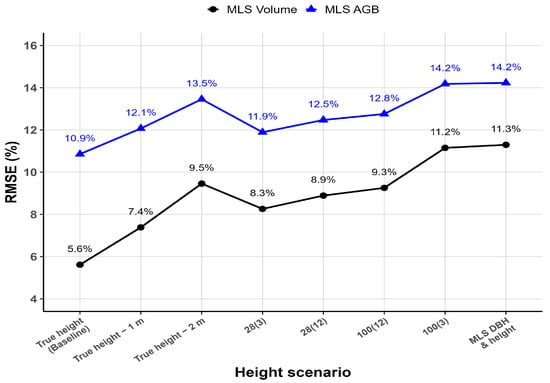
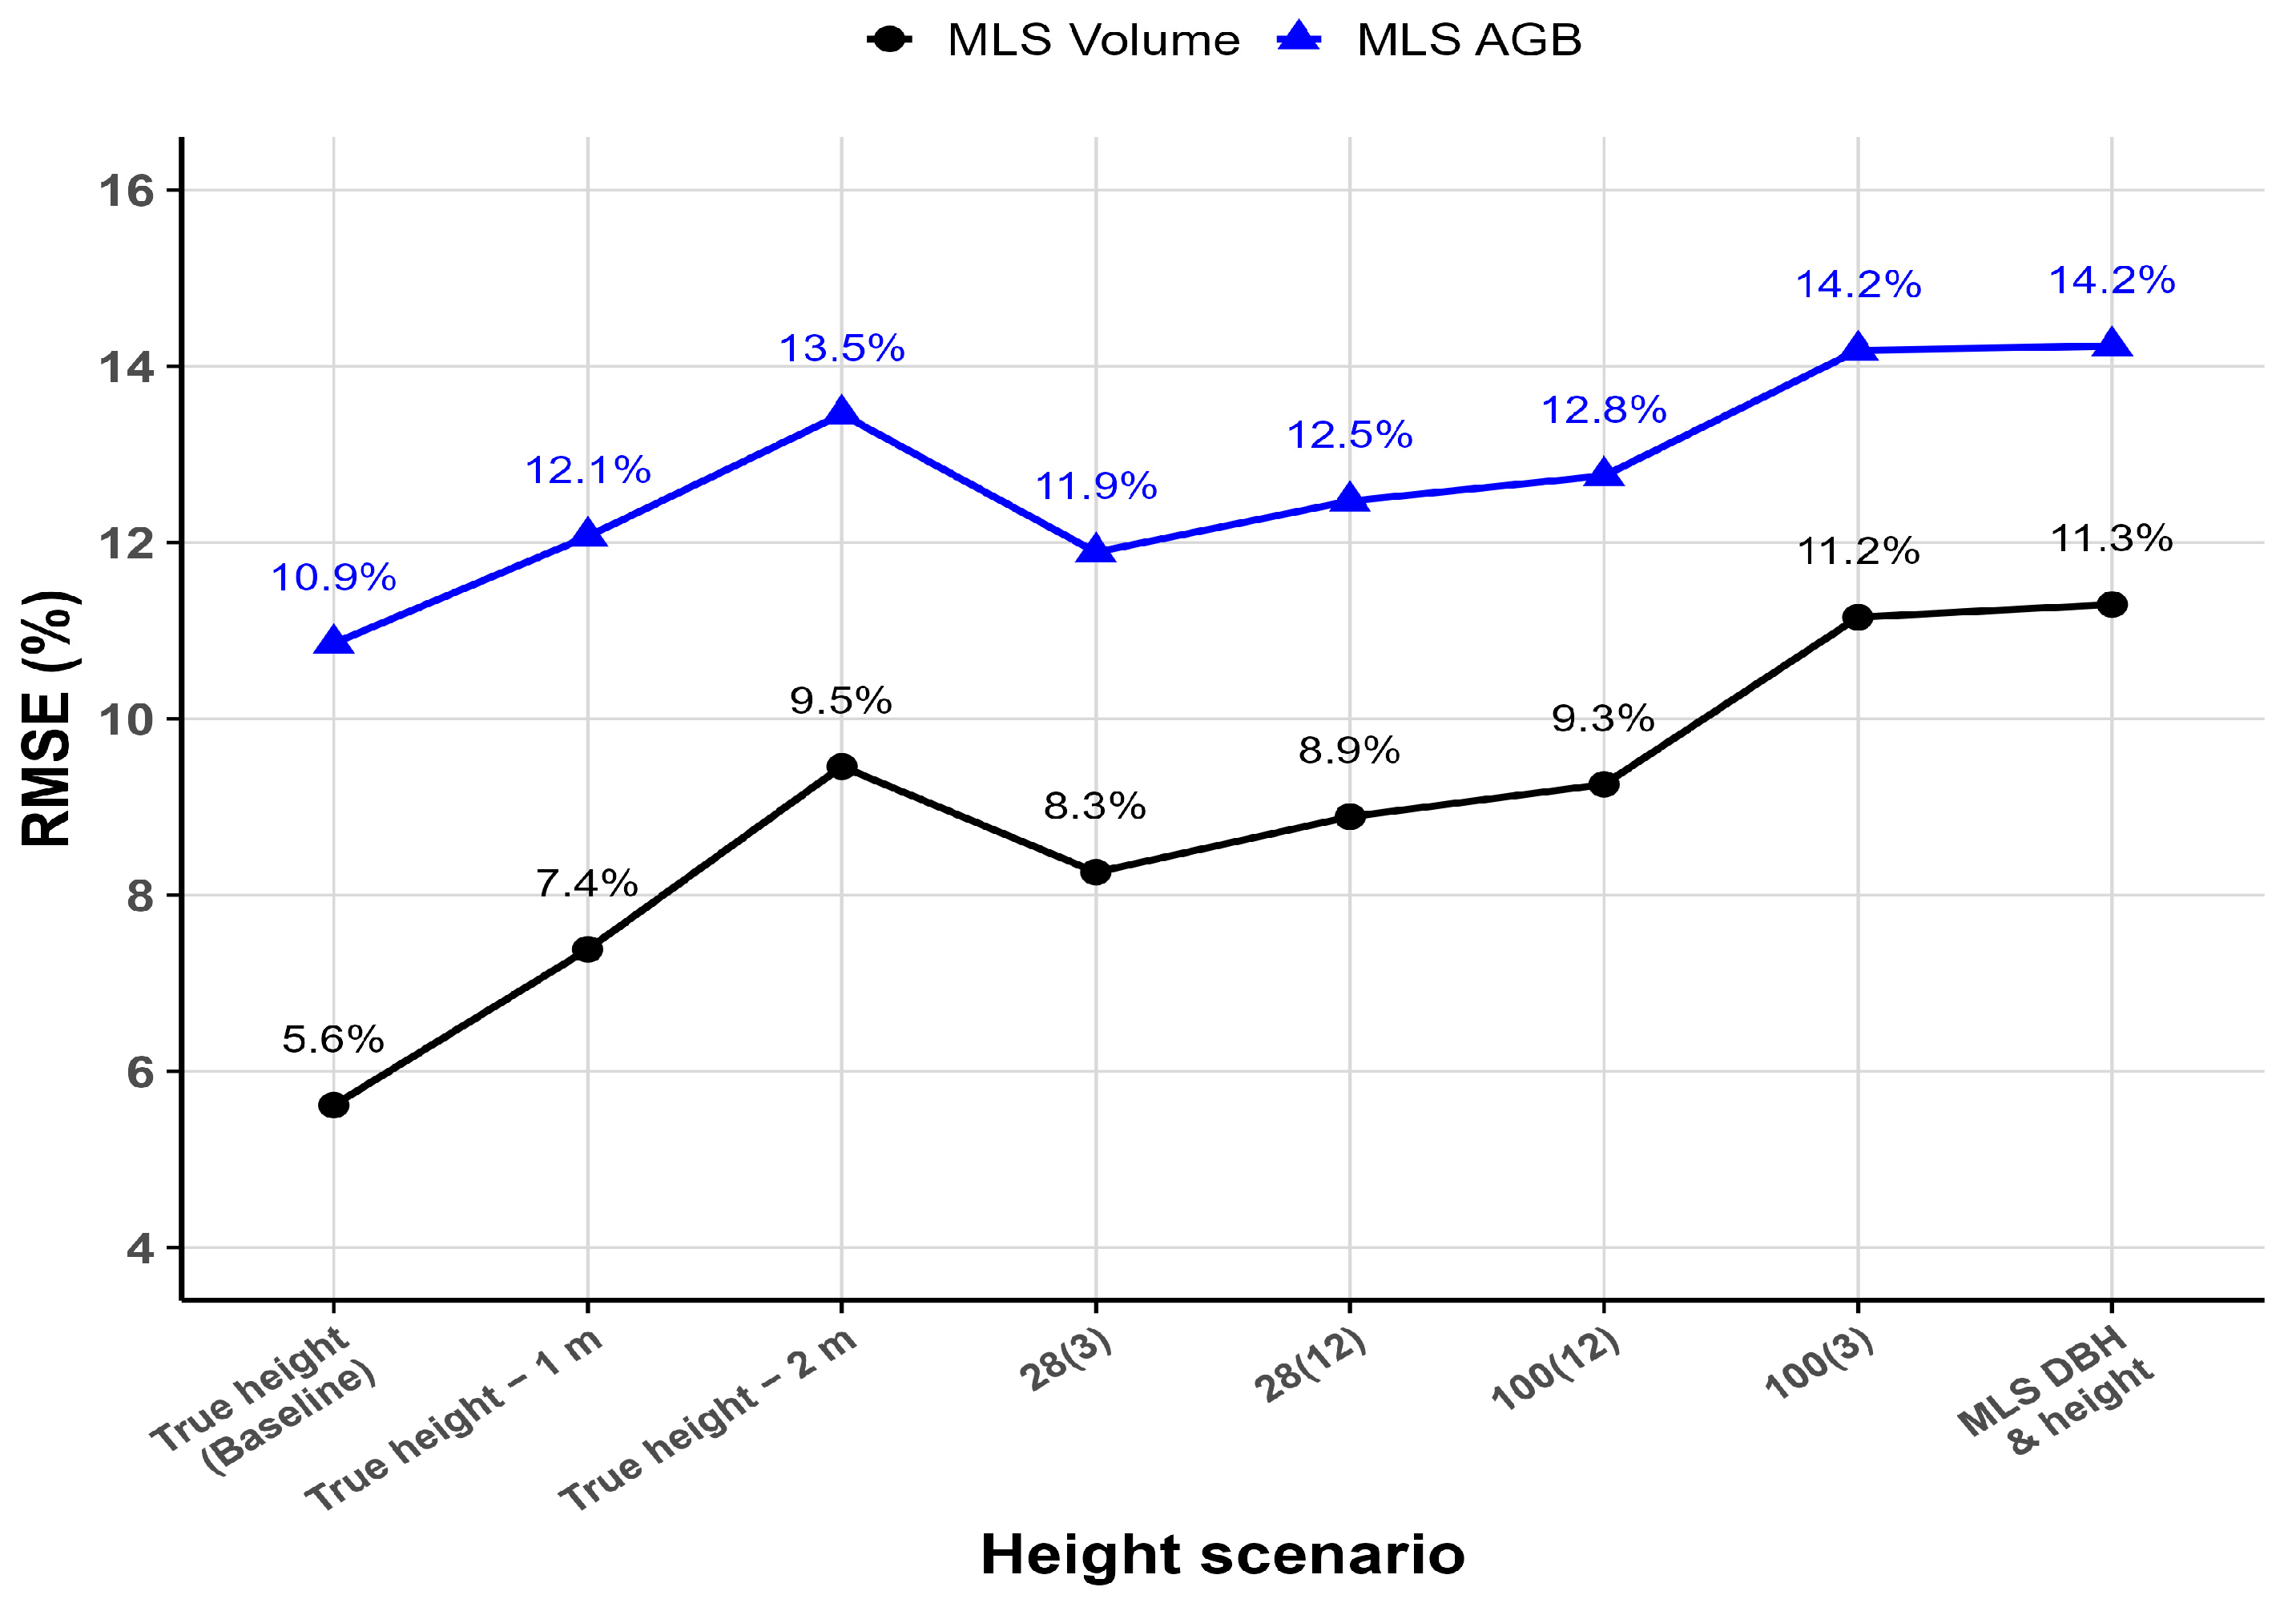
Height uncertainty had a systematic and quantifiable influence on MLS-derived stem volume and AGB estimates (Figure 6). Using true measured height as a baseline, the application of alternative height scenarios resulted in increased error for both volume and AGB, with the magnitude of this increase dependent on the source and degree of height uncertainty. Height error metrics for each scenario relative to true height are provided in Appendix A (Table A1), while summary performance metrics for stem volume and AGB across all scenarios are provided in Table A2 and Table A3, respectively. The full scenario-level breakdowns, including RMSE, bias, and component-specific biomass performance can be found in Supplementary Materials.
Figure 6.
Sensitivity of estimated stem volume and total aboveground biomass (AGB) to height uncertainty across alternative height scenarios. Points show scenario-level RMSE (%) for volume (black line) and total AGB (blue line), relative to destructive measurements, highlighting the influence of height source on estimation accuracy.
Among DBH-height curve scenarios, the curve derived from a population of 28 trees using only three corresponding heights 28(3) produced the lowest additional error relative to the true-height case, with volume RMSE increasing from 5.6% to 8.3% and total AGB RMSE increasing from 10.9% to 11.9%. Bias remained comparable to the reference case (−2.3% for volume and −5.5% for total AGB); this result is further explored in Section 4.1. Across DBH-height scenarios, increases in error relative to the true-height case remained bounded. Volume RMSE increased by a maximum of 5.6 percentage points, from 5.6% under true height to 11.2% under the most uncertain DBH-height scenario 100(3). Corresponding increases in total AGB RMSE were smaller, rising by 3.3 percentage points from 10.9% to 14.2%. Across all scenarios, errors in AGB mirrored errors in stem volume.
3.4. Comparison with Existing Allometric Equation
To provide a benchmark for the MLS-based approach, the Irish “Spruce” allometric equation used for national reporting [33] was applied to the field-measured DBH for each tree, while total height inputs followed the same set of height scenarios. The MLS-based scenario, in which both DBH and height were derived directly from MLS data, represents the application of the allometric equation using fully MLS-derived inputs. All AGB estimates were compared against destructively measured AGB reference values.
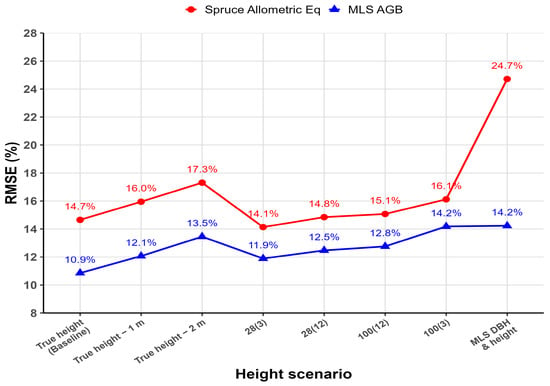
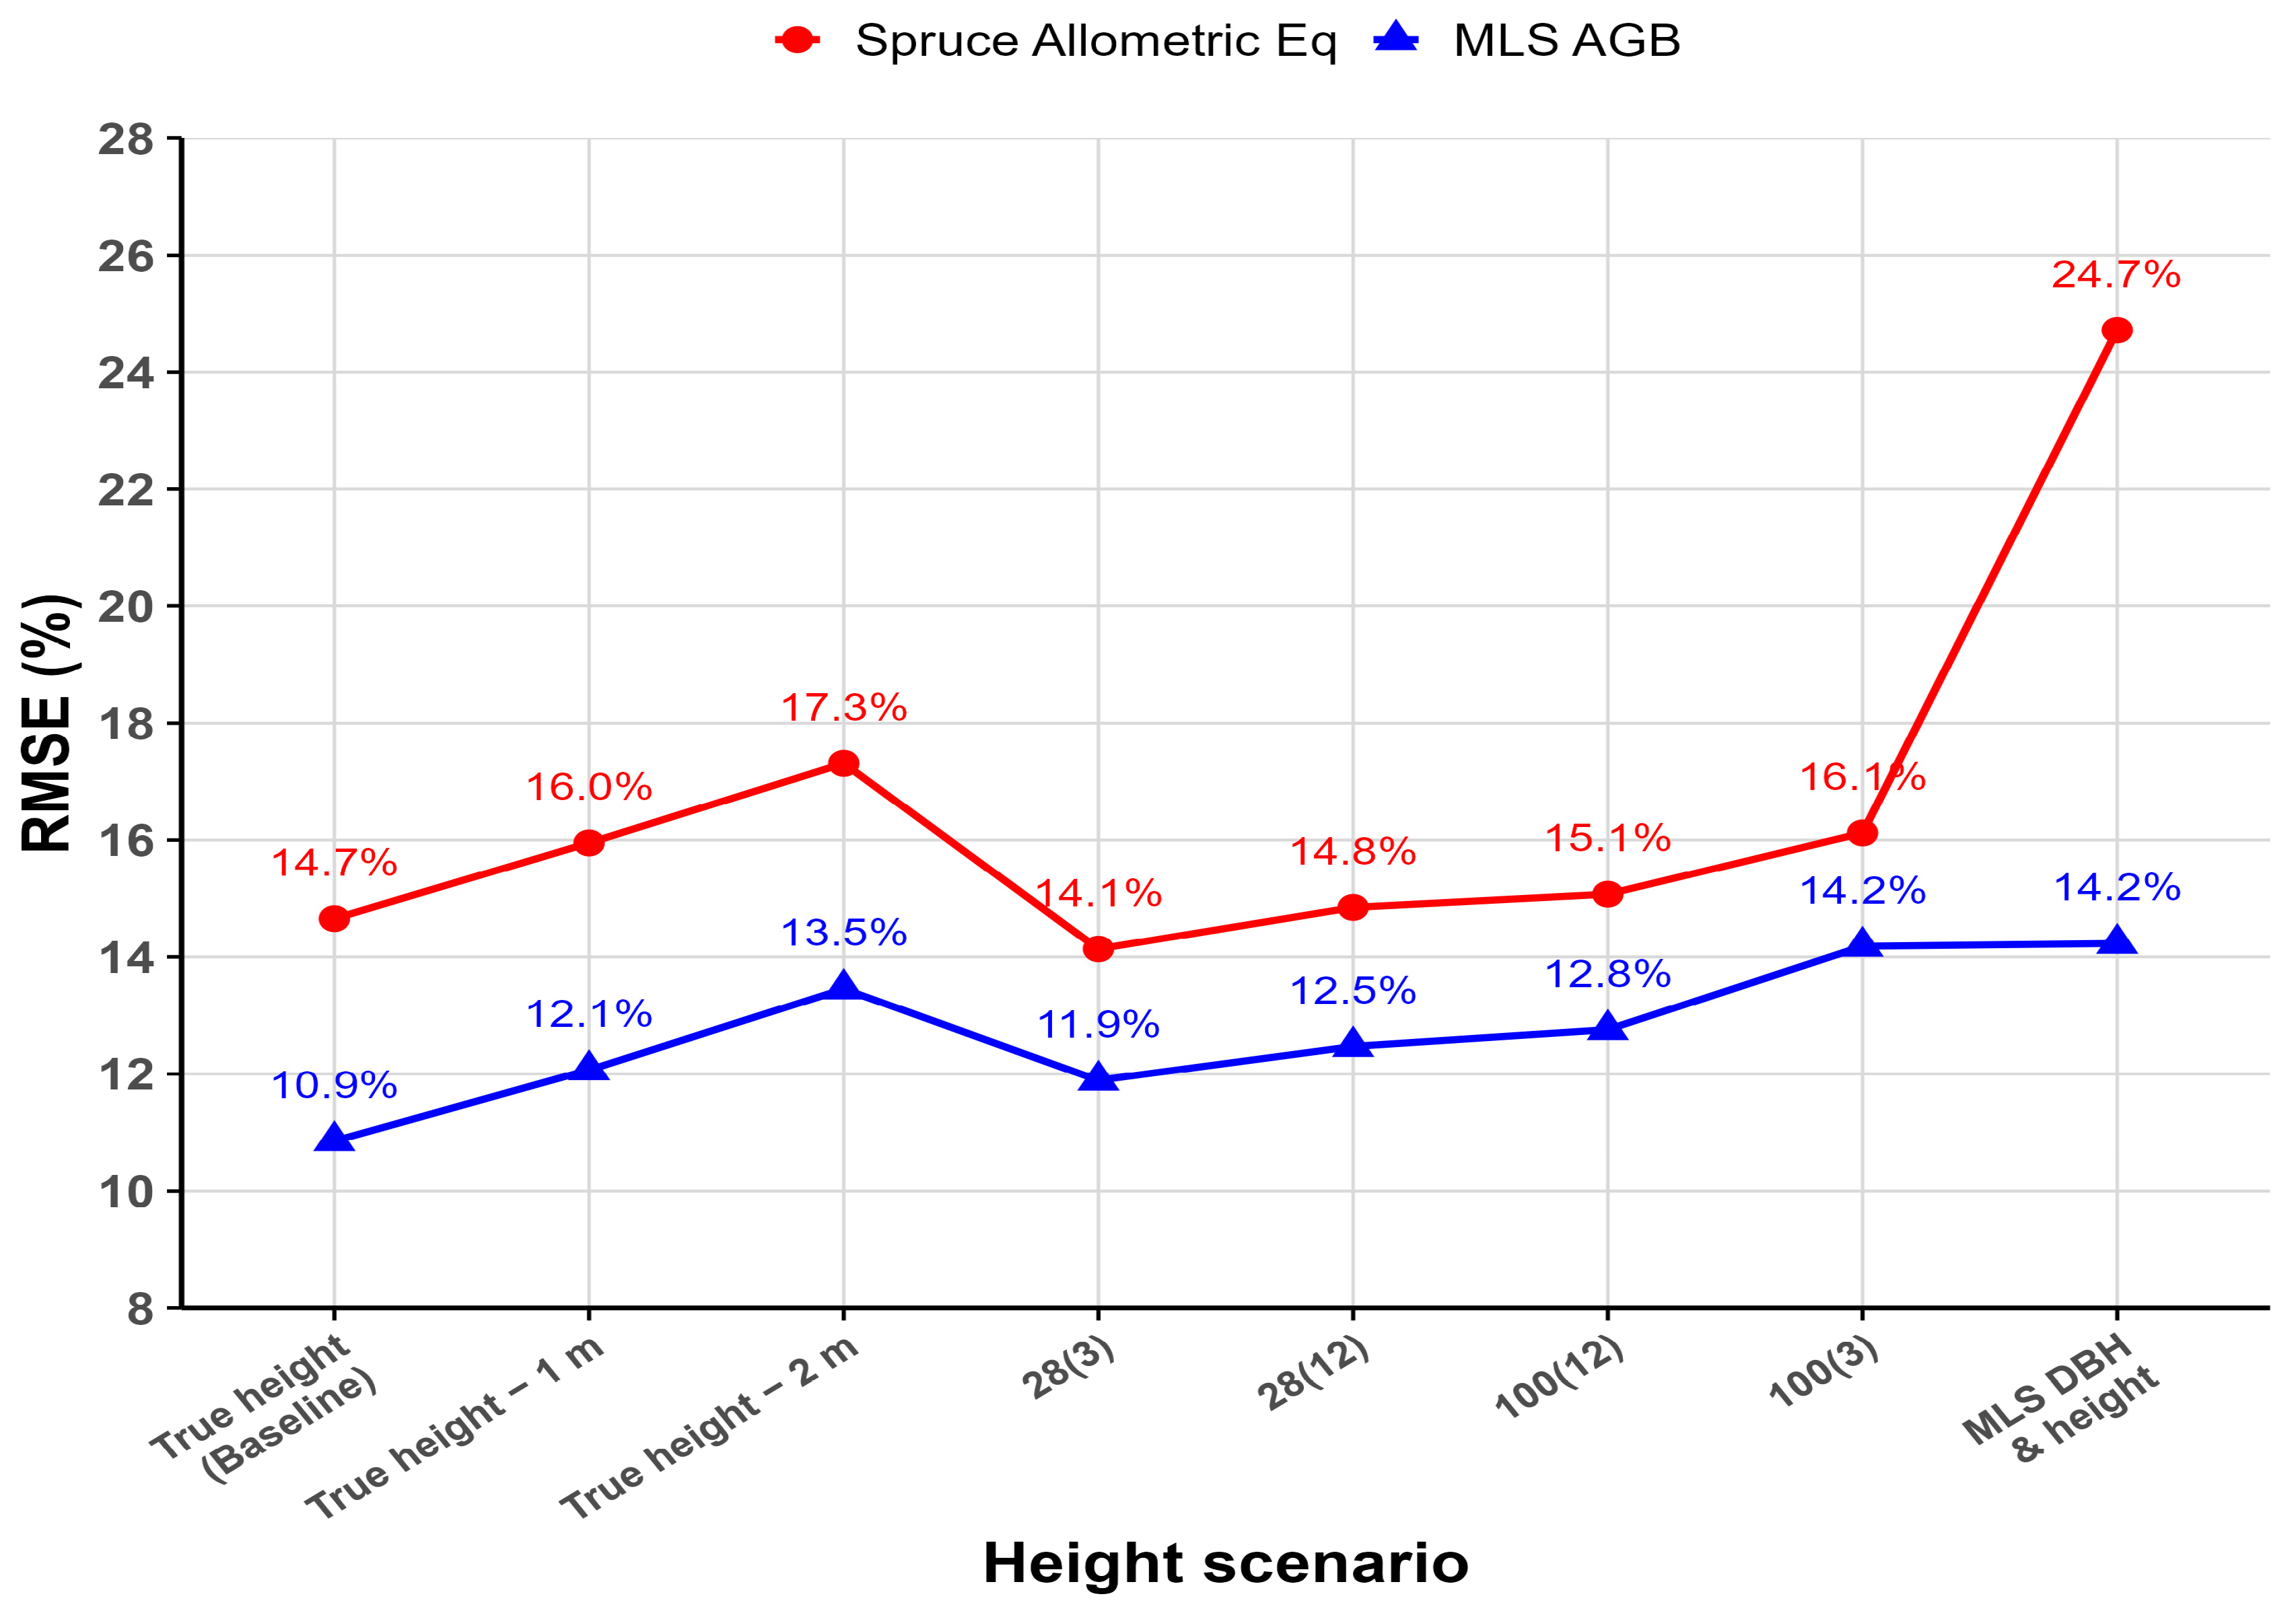
When true height was used, the allometric equation produced a total AGB RMSE of 14.7%. Across DBH-height scenarios, RMSE values ranged from 14.1% to 16.1% (Figure 7). The systematic one- and two-metre height underestimation scenarios produced RMSE values that were 3.9% and 3.8% higher, respectively, than those obtained using the MLS-based approach. The MLS-derived height and DBH scenario showed the largest difference in RMSE with 10.5 percentage points. Summary performance metrics for the general spruce allometric equation across all height scenarios are provided in Appendix A (Table A4).
Figure 7.
RMSE (%) of AGB estimates derived from the MLS approach (blue line) and the general spruce allometric equation (red line) across alternative height scenarios. Values are relative to destructively measured AGB.
4. Discussion
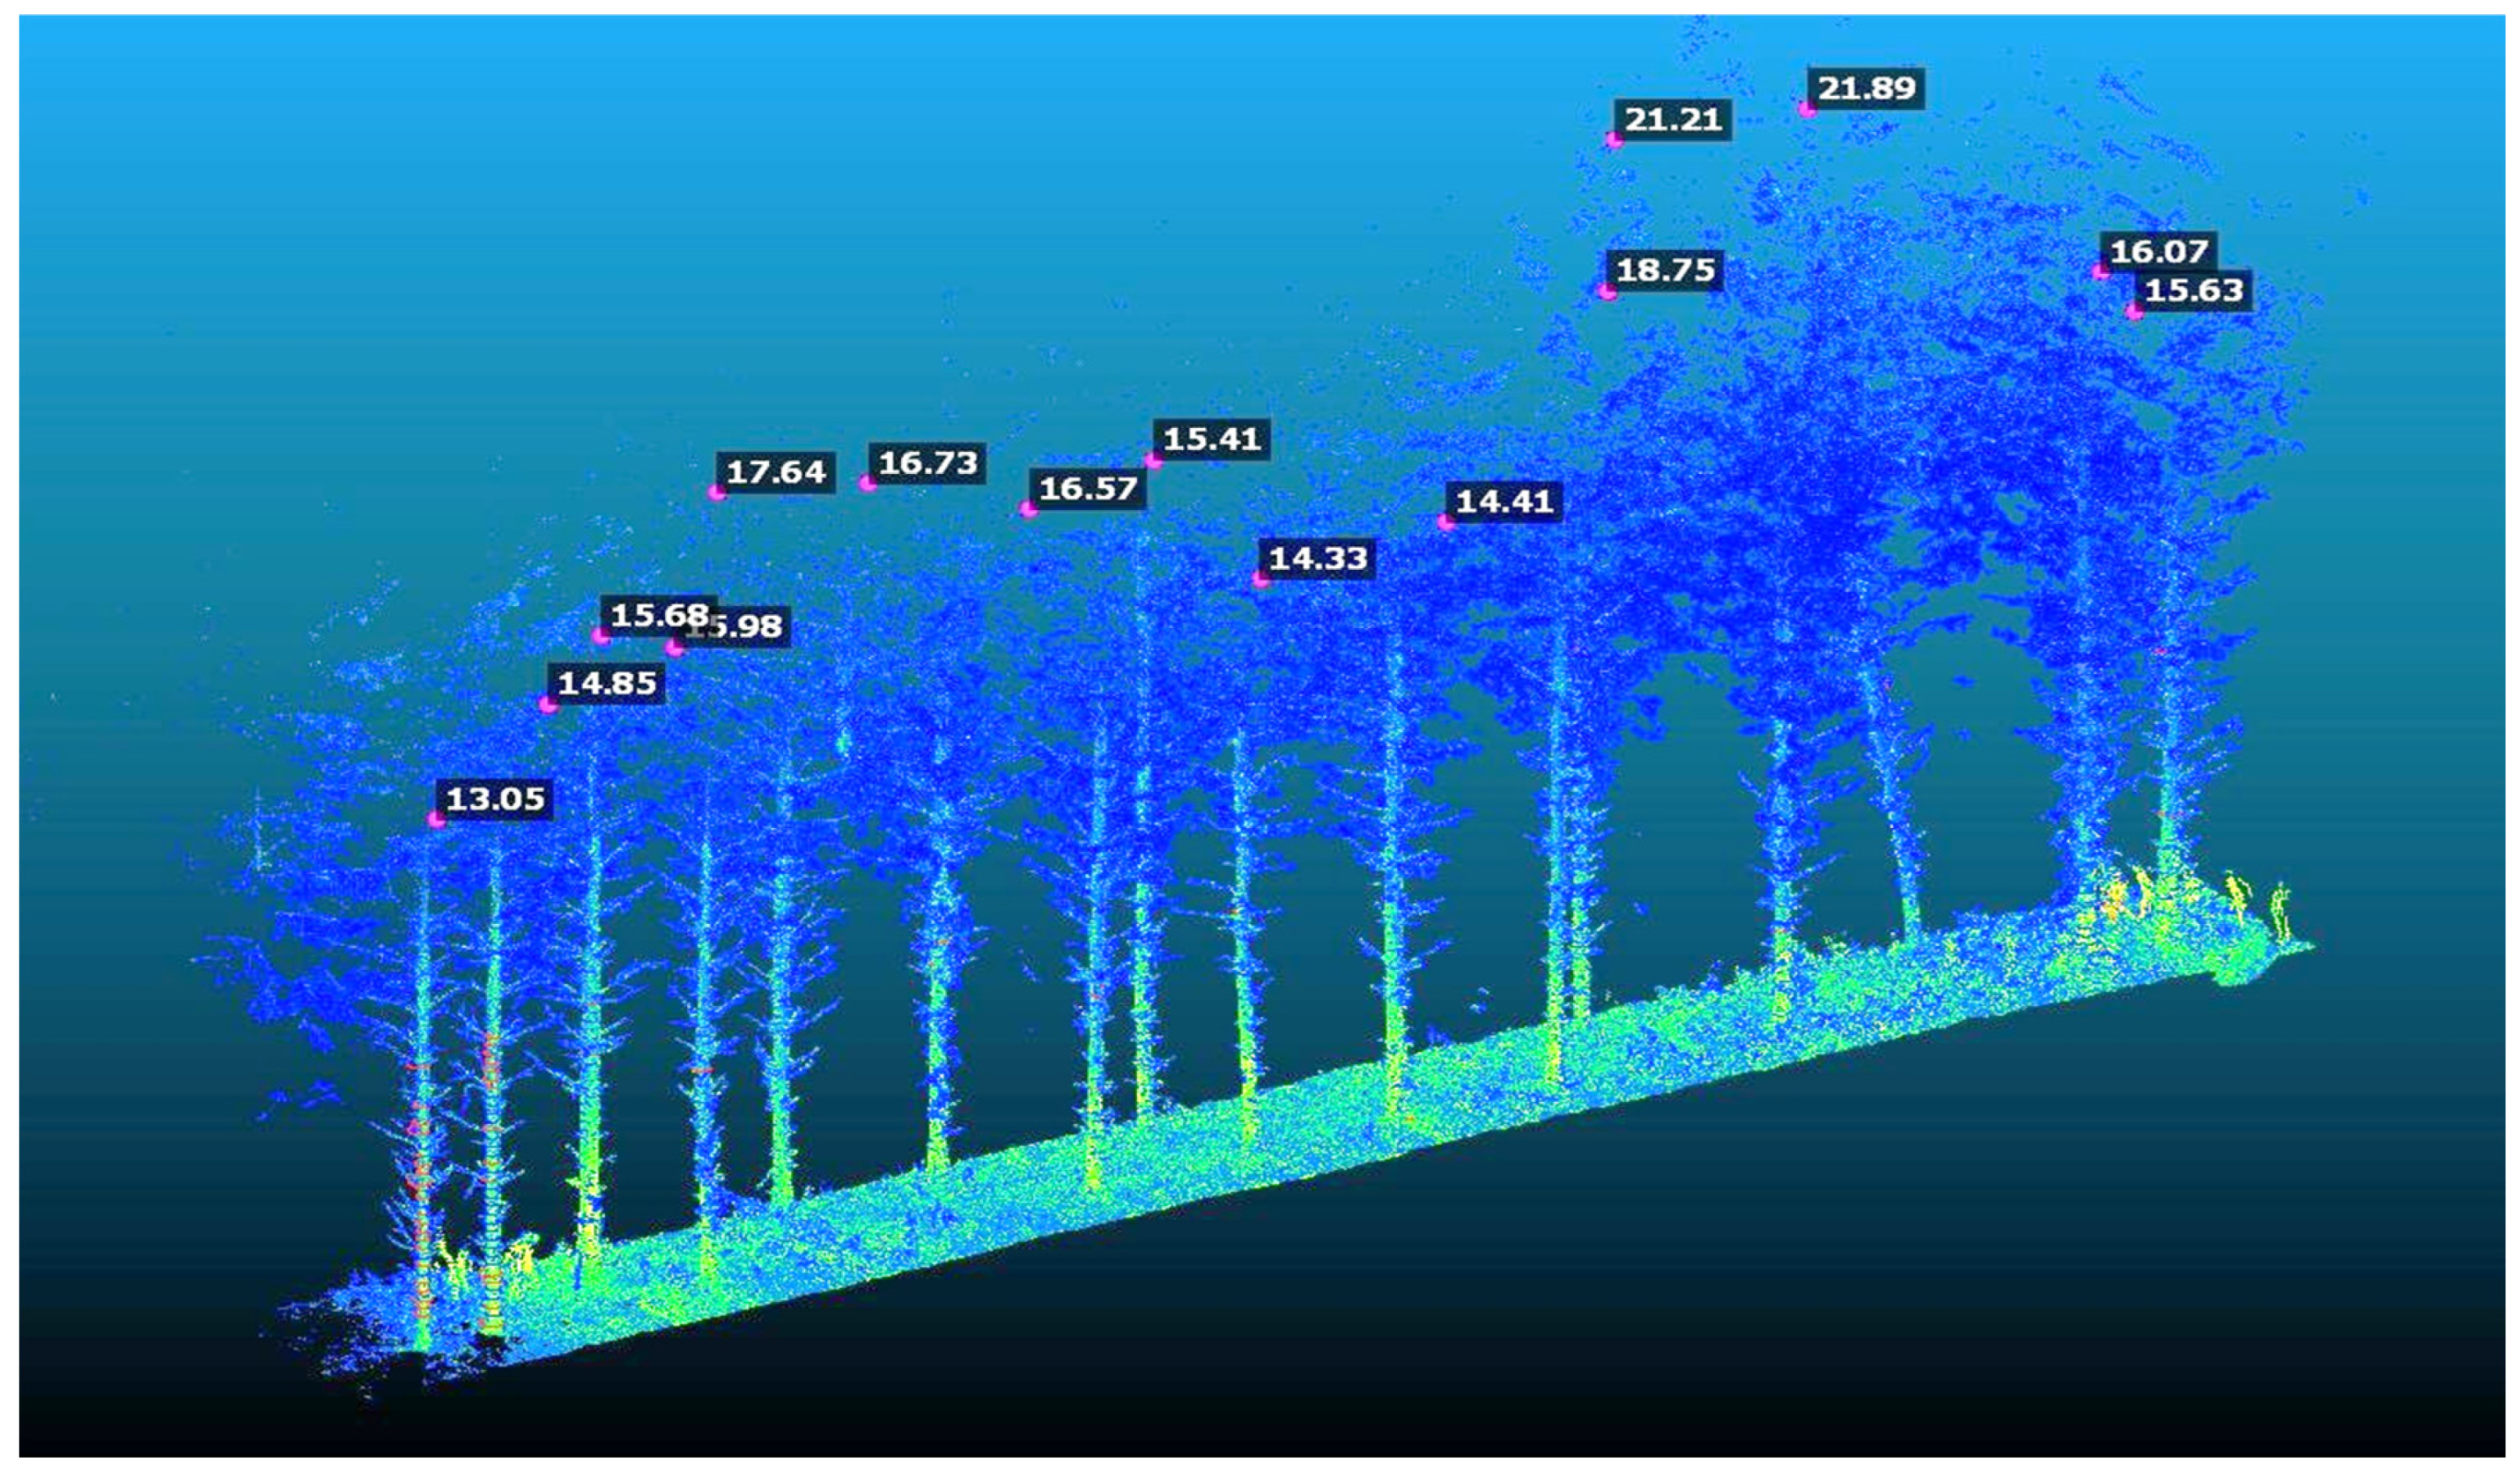
This study demonstrates that handheld MLS can provide accurate estimates of merchantable stem volume and promising estimates of total AGB in mature Sitka spruce plantations, while showing measurable but bounded sensitivity to uncertainty in total tree height. Under ideal validation conditions, where true tree height was measured directly from felled stems, MLS-derived merchantable stem volume was estimated with an RMSE of 5.6%, while total AGB was estimated with an RMSE of 10.9%. These values provided a benchmark for evaluating the stem reconstruction workflow when height uncertainty is introduced, rather than representing an operational height-input scenario. Under practical height-input scenarios, including DBH–height relationships and MLS-derived height (Figure 8), volume RMSE ranged from 7.4% to 11.3%, comparing favourably with reported ranges of 8%–13% in other MLS validation studies [8,19,20]. AGB RMSE ranged from 11.9% to 14.2% across the same height-input scenarios. This indicates that height uncertainty increased error, but that the effect remained moderate under the scenarios tested. On average, 68.2% of merchantable stem volume was directly measured by MLS, with only the upper stem requiring reconstruction. This high proportion of directly measured stem volume constrained uncertainty to the upper stem and limited the impact of height-related errors being introduced to total volume and AGB estimates. To our knowledge, few studies have explicitly quantified how height uncertainty propagates into MLS-derived stem volume and AGB estimates under mature plantation conditions.
Figure 8.
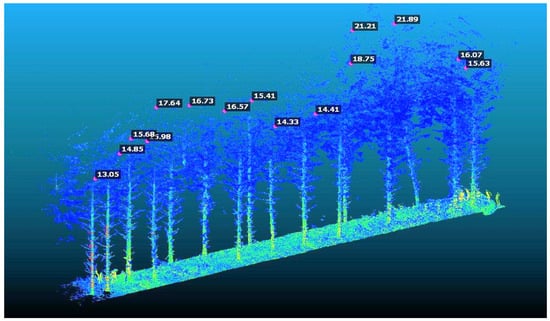
MLS point cloud acquired in a mature Sitka spruce stand at Dooary forest. The scan was captured by walking a transect between thinning lines. Mean stand height was c. 25 m; however, 11 of the 15 trees had extracted heights (included in black box labels) below 17 m, with some estimates as low as 13 m. This illustrates the challenge of capturing reliable total tree height in mature plantation forests, even under moderate stocking densities (625 stems ha−1), due to canopy occlusion and limited upper-stem visibility. This limitation supports the use of DBH–height relationships to estimate height for MLS-derived stem reconstruction.
In contrast, application of the nationally adopted “Spruce” allometric equation (developed for carbon reporting) resulted in higher AGB errors (Figure 7). Most notably, the MLS-derived DBH and height scenario (RMSE = 24.7%) highlights the sensitivity of the allometric equation to input uncertainty. In this scenario, DBH and height were both underestimated (bias: −4.2% and −9.2%, respectively), compounding the underlying −10.3% equation bias observed relative to destructive reference data (Appendix A, Table A4). While the allometric equation provides a practical and operational baseline, its reliance on DBH, height, and fitted coefficients makes it sensitive to uncertainty in height [16,17]. Within this limited dataset (n = 12), the MLS-based approach produced lower AGB errors than the generic allometric benchmark across all evaluated height scenarios. By directly measuring a substantial proportion of merchantable stem and limiting modelling assumptions to the upper-stem and branch biomass components, the MLS workflow appeared less sensitive to height uncertainty than the benchmark allometric approach evaluated here.
4.1. Uncertainty, Bias, and Model Behaviour
The findings of this study should be interpreted within the scope of the experimental design. The study was conducted in a single, mature, relatively uniform Sitka spruce plantation characterised by moderate stocking density (625 stems ha−1). Individual sample trees were scanned and manually segmented, allowing MLS-derived stem reconstruction to be benchmarked directly against destructive measurements under controlled validation conditions. However, this design does not capture all sources of uncertainty associated with operational plot-level MLS inventory, including automated stem detection, tree matching, scan-path design, occlusion, overlapping crowns, and segmentation errors. As such, the results demonstrate tree-level validation performance and provide insight into methodological behaviour and error structure, rather than a comprehensive assessment of operational performance across stands. Broader application to younger stands, alternative species, higher stocking densities, or structurally heterogeneous forests will require further calibration and validation. The relatively small sample size is also recognised as a limitation, and RMSE, bias and R2 values should be interpreted cautiously. However, the use of destructive reference data provides a solid validation basis in comparison with indirect allometric or inventory-derived estimates.
Across all height scenarios, the MLS-based approach exhibited a slight bias towards underestimation (volume: −3.3%–−9.4% and AGB: −5.5%–−11.1%). While this introduces a consistent bias, it also provides a useful lens to interpret the performance of alternative height scenarios. Scenarios with a small positive height bias partially compensated for this underlying MLS underestimation, resulting in improved overall accuracy. For example, the DBH-height scenario 28(3) produced a small positive bias (+0.44 m; +1.8%), which offset a portion of both the MLS-derived biomass and general spruce equation underestimation. In contrast, the DBH-height scenario 100(3) produced a negative bias (−1.68 m; −6.8%), compounding the MLS underestimation and leading to reduced overall performance. Similar behaviour was observed for the 28(12) and 100(12) scenarios as well as the general spruce equation, indicating that interactions between height accuracy and systematic bias play a critical role in determining final biomass error (Appendix A). The full scenario-level performance metrics, including RMSE, bias, and component-specific stem, branch, and total AGB estimates, are provided in the Supplementary Materials.
The branch biomass component represented a notable source of uncertainty within the MLS-based AGB workflow. In this study, the branch biomass model was developed and evaluated using the same 12 destructively sampled trees and should therefore be considered preliminary and potentially optimistic. Branch biomass exhibited higher error (RMSE = 21.8%; bias = −8.2%) than that observed for stem biomass (true-height: RMSE = 9.8%, bias = −5.9%). However, this disparity reflects recognised challenges in modelling branch allocation rather than a limitation unique to the MLS-based framework [14,15]. Branch biomass is inherently more variable than stem biomass, being strongly influenced by stand structure, competition, and management, and is not reliably predicted using DBH alone [14,34]. Despite higher relative uncertainty, branch biomass accounted for a relatively small proportion of total AGB (~18%), meaning overall AGB error (RMSE 10.9%) remained largely driven by stem estimation (RMSE 8.1%). This indicates that the accuracy of the MLS-based approach is primarily determined by stem reconstruction, with branch modelling representing a secondary source of uncertainty. Importantly, the branch biomass equation was held constant across all height scenarios and therefore does not influence the interpretation of height uncertainty effects, allowing the impact of height variation on volume and AGB estimates to be isolated. Further refinement of branch biomass would require expanded destructive sampling across a broader range of stand conditions and the inclusion of additional structural predictors.
For basic density, an overall mean value was used after no significant differences were detected among the different stem segments. The overall mean basic density of 385.8 kg/m3 was applied in the MLS workflow to estimate AGB. This value is 3.4% lower than the commonly applied value of 400 kg/m3 used for Sitka spruce in national reporting [35]. However, published values for Sitka spruce basic density vary considerably, ranging from 350 kg/m3 [36] to 447 kg/m3 [37]. As a simple sensitivity experiment, the true-height scenario was rerun using 400 kg/m3 as the mean basic density value. This reduced the total AGB RMSE for the true-height scenario from 10.9%, when using the sample-derived mean density, to 9.5%. This 1.4 percentage-point reduction indicates that uncertainty in basic density contributes to overall AGB error, highlighting that this is an important source of uncertainty when converting reconstructed stem volume into biomass. Given the reported association between higher productivity and reduced basic density [38], accounting for productivity-related variation in basic density could improve biomass estimation, particularly when applying MLS-derived volume estimates across a wider range of Sitka spruce stands.
Taken together, these findings emphasise the importance of understanding error propagation within MLS-based stem reconstruction workflows. Rather than being driven solely by height accuracy, overall biomass performance reflects the interaction between MLS bias, the proportion of stem directly measured, the basic density value, the branch biomass modelling approach, and the magnitude and direction of height error. Recognising these interactions is critical when applying MLS-derived estimates across alternative height scenarios or transferring the approach to new sites and stand conditions.
4.2. Potential Applications and Implications
Beyond tree-level validation, the MLS framework presented has potential for integration within multi-scale LiDAR inventory systems. High-resolution ground-based laser scanning is increasingly used as a reference layer for calibrating ALS models, improving the accuracy and robustness of large-scale forest attribute estimation [39,40]. In particular, multi-phase frameworks emphasise the importance of high-quality calibration data for controlling bias and reducing uncertainty in wall-to-wall predictions [41]. In this context, MLS-derived stem reconstruction could provide a calibration layer for merchantable volume and AGB estimation at targeted sampling locations. While ALS enables spatially continuous prediction, MLS can provide detailed information at the tree level, potentially reducing reliance on indirect allometric assumptions, which have been shown to introduce uncertainty and bias in biomass estimation under some conditions [42]. For Irish forestry—where c. 70% of the forest area [21] is dominated by intensively managed conifer plantations—and other conifer-intensive forestry jurisdictions, this integration may be particularly relevant.
A multi-phase inventory framework can therefore be envisaged in which strategically distributed MLS sampling captures structural variation across site types, productivities, and management regimes, while ALS supports spatially continuous prediction of volume, biomass and structural attributes. In this sense, the findings may have relevance for forest carbon accounting workflows, particularly under emerging monitoring, reporting and verification (MRV) requirements such as the Carbon Removal and Carbon Farming (CRCF) Framework, where transparency, reproducibility, and uncertainty quantification are critical. More broadly, recent review evidence indicates that, despite clear methodological progress in remote-sensing-assisted biomass assessment, major challenges remain regarding field calibration data, statistical rigour, and workflow transparency [24]. In addition, MLS may help address known limitations of TLS-based AGB estimation in conifer systems [11] while offering substantially greater acquisition efficiency across multiple site types.
5. Conclusions
This study shows that handheld MLS can provide accurate and transparent estimates of merchantable stem volume and promising estimates of total AGB in mature Sitka spruce plantations under the conditions evaluated here. When benchmarked against destructive sampling and driven by true height measurements, MLS-derived stem reconstruction achieved volume errors of 5.6% and total AGB errors of 10.9%. These values represent performance under ideal validation conditions, where height uncertainty was minimised. Across realistic scenarios involving height uncertainty, volume RMSE ranged from 7.4% to 11.3% and AGB RMSE from 11.9% to 14.2%, indicating measurable but bounded sensitivity to height uncertainty. The benchmark allometric approach, which embeds stem form and biomass allocation within fitted coefficients, produced AGB RMSE values of 14.1%–24.7% across the evaluated scenarios. While not intended to replace national allometric reporting frameworks, MLS-derived reconstruction provides a complementary, measurement-driven approach with potential to improve transparency in forest biomass estimation and to reduce reliance on indirect allometric assumptions. As regulatory and market-based carbon accounting frameworks emphasise verifiable, measurement-based approaches, MLS may provide a useful calibration and validation layer for biomass assessment in intensively managed plantation forestry, subject to broader testing across stand types, species, and operational plot-level sampling designs.
Supplementary Materials
The following supporting information can be downloaded at: https://www.mdpi.com/article/10.3390/f17060680/s1, Supplementary File containing tree-level outputs and scenario-specific performance metrics for MLS-derived stem volume, AGB, and general spruce allometric equation estimates across alternative height scenarios.
Author Contributions
Conceptualization, L.D.; methodology, L.D.; validation, L.D.; formal analysis, L.D.; investigation, L.D.; data curation, L.D.; writing—original draft preparation, L.D.; writing—review and editing, L.D. and B.T.; supervision, B.T.; funding acquisition, B.T. All authors have read and agreed to the published version of the manuscript.
Funding
This research was funded by the Department of Agriculture, Food and the Marine under the research project 2021RI302 (AdaptForRes).
Data Availability Statement
The destructively sampled tree measurements and corresponding mobile laser scanning (MLS) point clouds generated and analysed during this study are publicly available on Zenodo at https://zenodo.org/records/19555954 (accessed on 25 March 2026). Custom scripts used for data processing and analysis are not publicly released but may be made available by the corresponding author upon reasonable request for academic, non-commercial purposes.
Acknowledgments
This study was enabled by the kind collaboration of Dáire Walsh, Aiden Magee, Tim McCarthy and Rowan Fealy at Maynooth University. The authors want to thank Louis Boutin, Côme De Longeaux, Mathis Bourdais, Pierre Mahieu and Augustin Braem (intern students from Uni LaSalle Beauvais) for their assistance with fieldwork. The authors also thank Coillte for allowing access to their forests and the sampling required. During the preparation of this manuscript, the authors used ChatGPT (v5.1, 5.2 & 5.3), developed by OpenAI, as a generative AI support tool for language editing, text refinement, and assistance with R code development. All code, analytical workflows, outputs, figures, results, and interpretations were critically reviewed, verified, and approved by the authors, and they take full responsibility for the content of this publication.
Conflicts of Interest
The authors declare no conflicts of interest.
Abbreviations
The following abbreviations are used in this manuscript:
| MLS | Mobile laser scanning |
| AGB | Aboveground biomass |
| RMSE | Root mean square error |
| TLS | Terrestrial laser scanning |
| SLAM | Simultaneous localisation and mapping |
| ALS | Aerial laser scanning |
| CRCF | Carbon Removal and Carbon Farming |
| DBH | Diameter at breast height (1.3 m) |
| MRV | Monitoring, Reporting and Verification |
| LULUCF | Land use, land use change and forestry |
Appendix A
This section provides a summary of performance metrics across all height scenarios evaluated in this study for both MLS-derived workflows and the general spruce equation. Metrics include root mean square error (RMSE) and mean bias, reported in both absolute and relative (%) terms.
Table A1.
Summary metrics of height estimation scenarios compared to destructive sample data. RMSE and bias are reported in absolute and relative (%) terms.
Table A2.
Summary metrics for MLS-derived volume estimation, across height scenarios, compared to destructive sample data. RMSE and bias are reported in absolute and relative (%) terms.
Table A3.
Summary metrics for MLS-derived AGB estimation, across height scenarios, compared to destructive sample data. RMSE and bias are reported in absolute and relative (%) terms.
Table A4.
Summary of general spruce allometric equation performance for AGB estimation, across height scenarios, compared to destructive sample data. RMSE and bias are reported in absolute and relative (%) terms.
Appendix B
Figure A1.
Comparison of MLS-derived and destructively measured stem profiles for sample trees SS1–SS7. The MLS-derived profile is shown in blue, while the destructively measured profile is represented with a black dashed line. Close agreement between the profiles indicates that MLS-derived lower-stem measurements and upper-stem reconstruction captured the main taper pattern across individual trees, although local deviations remain visible.
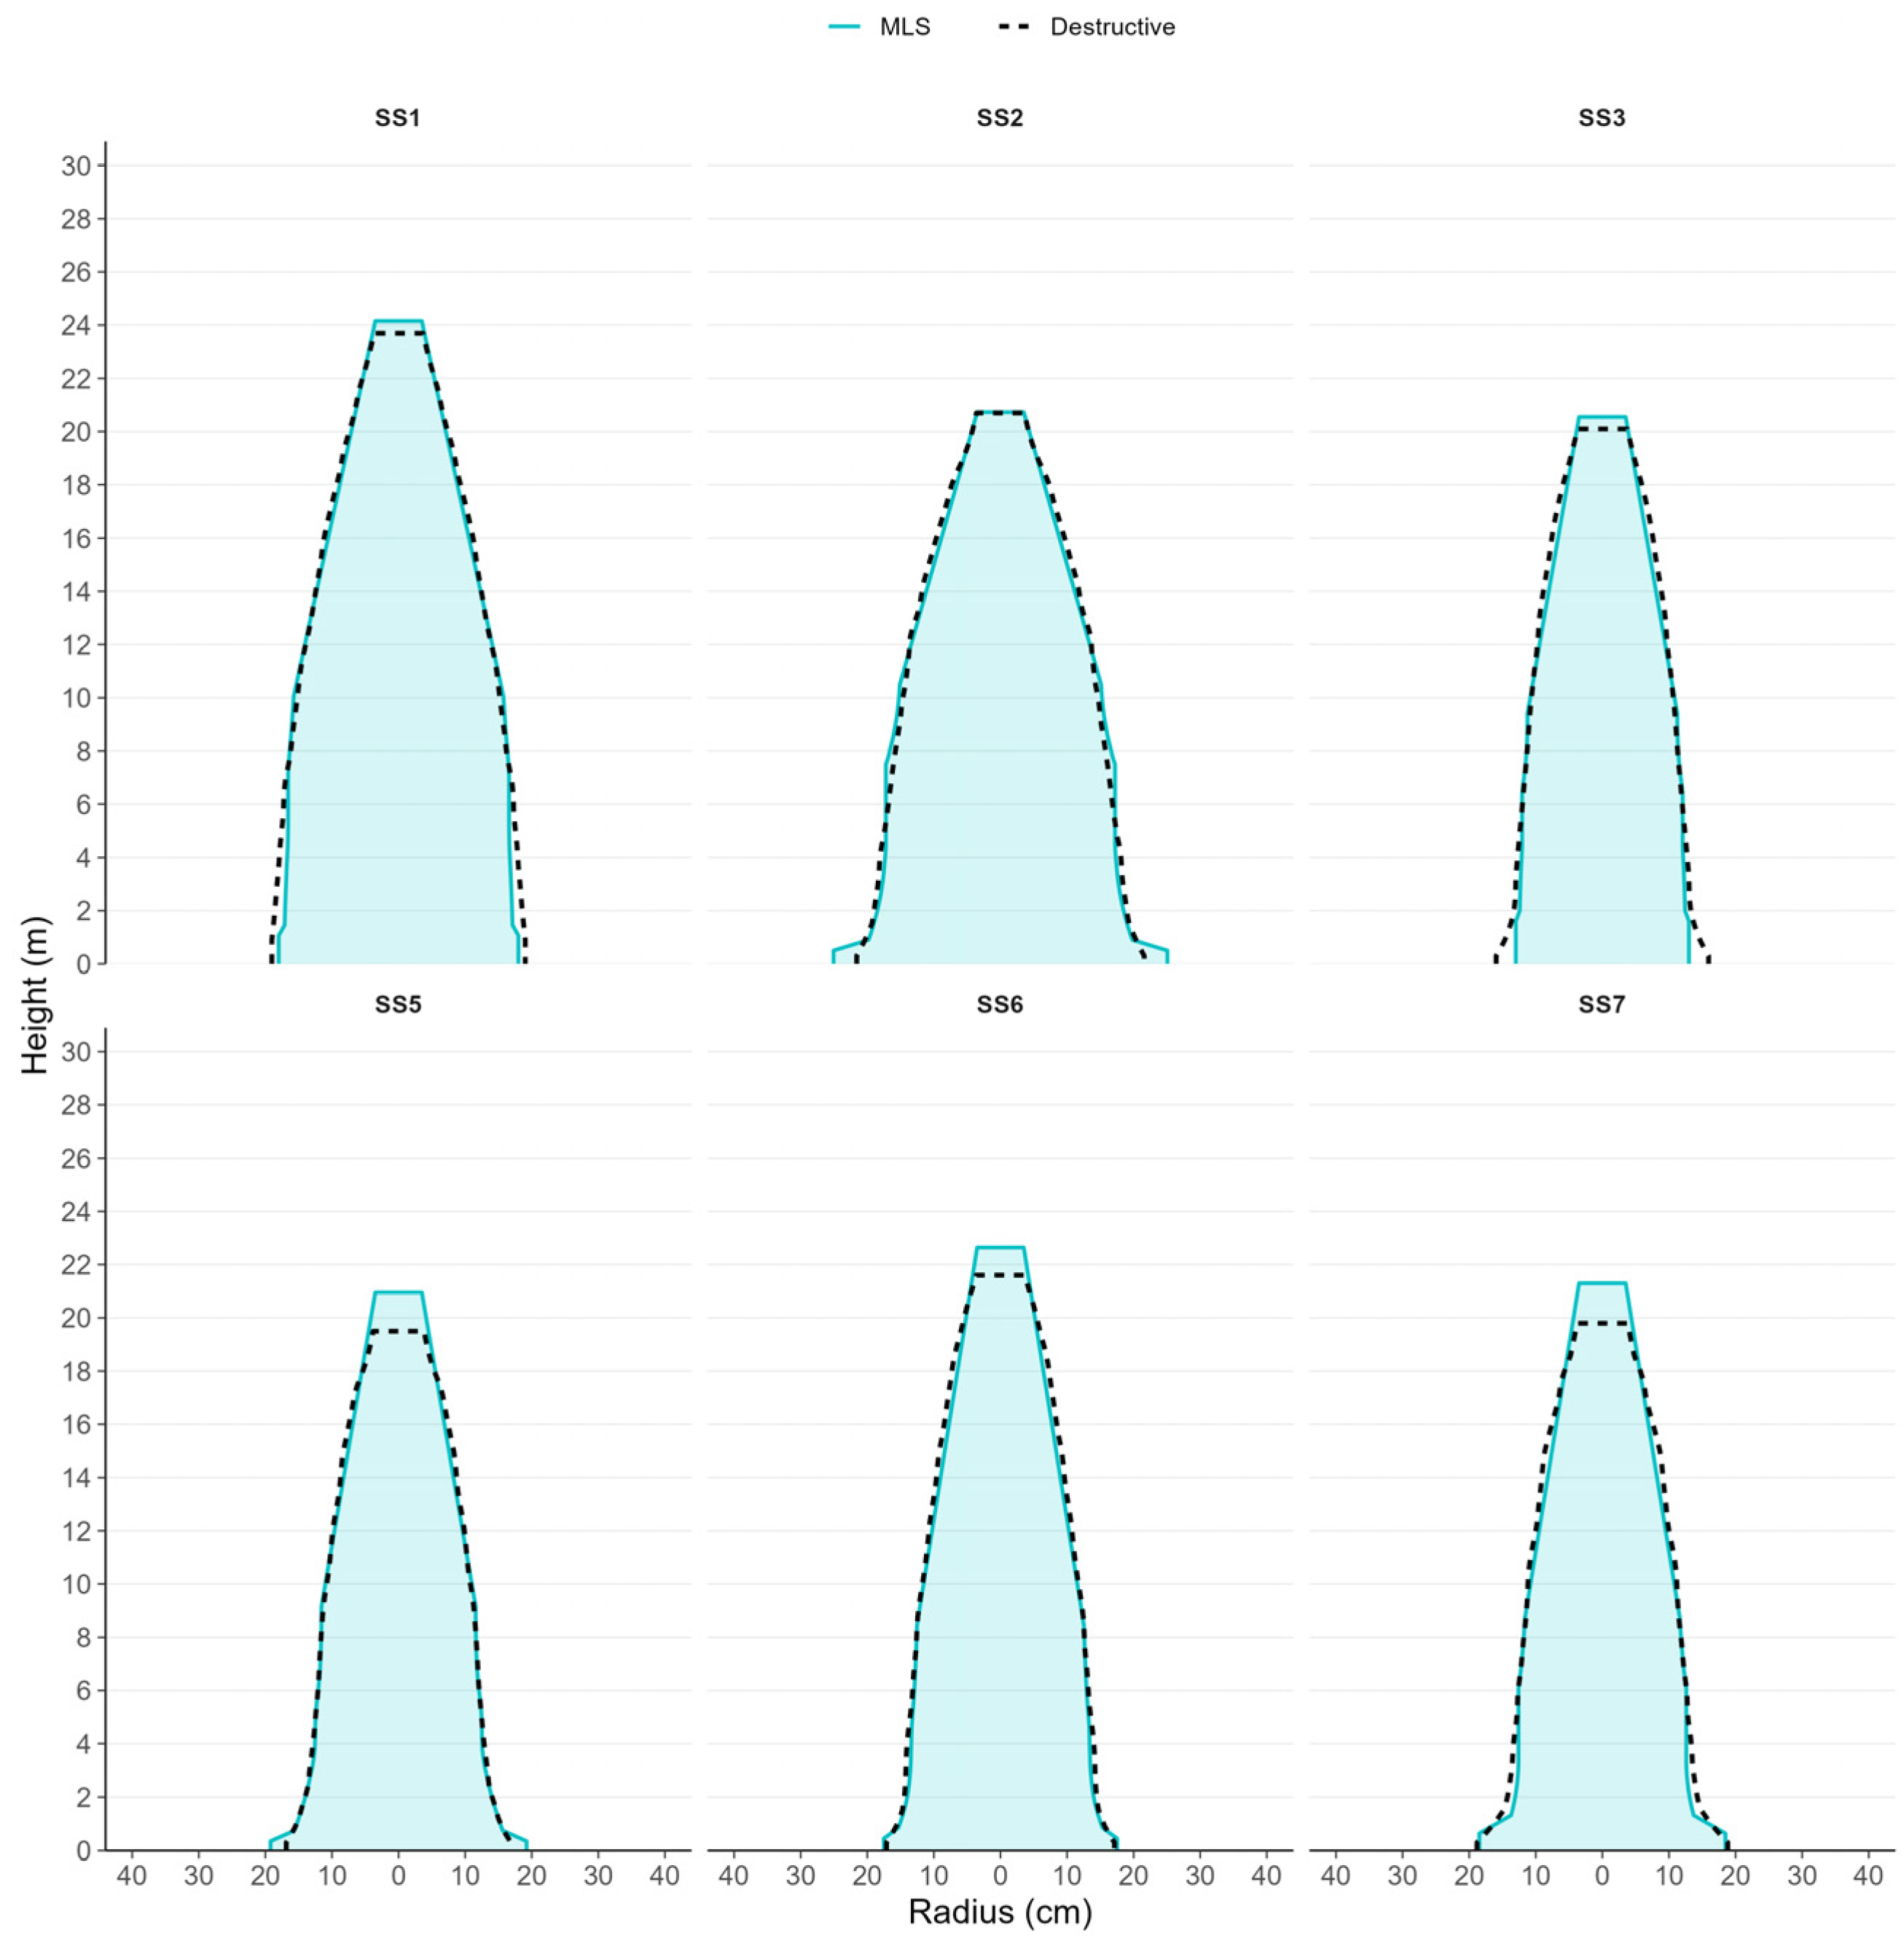
Figure A2.
Comparison of MLS-derived and destructively measured stem profiles for sample trees SS8–SS15. The MLS-derived profile is shown in blue, while the destructively measured profile is represented with a black dashed line. Close agreement between the profiles indicates that MLS-derived lower-stem measurements and upper-stem reconstruction captured the main taper pattern across individual trees, although local deviations remain visible.
References
- Balestra, M.; Marselis, S.; Sankey, T.T.; Cabo, C.; Liang, X.; Mokroš, M.; Peng, X.; Singh, A.; Stereńczak, K.; Vega, C.; et al. LiDAR Data Fusion to Improve Forest Attribute Estimates: A Review. Curr. For. Rep. 2024, 10, 281–297. [Google Scholar] [CrossRef] [Scilit]
- Brede, B.; Terryn, L.; Barbier, N.; Bartholomeus, H.M.; Bartolo, R.; Calders, K.; Derroire, G.; Krishna Moorthy, S.M.; Lau, A.; Levick, S.R.; et al. Non-destructive estimation of individual tree biomass: Allometric models, terrestrial and UAV laser scanning. Remote Sens. Environ. 2022, 280, 113180. [Google Scholar] [CrossRef] [Scilit]
- Calders, K.; Adams, J.; Armston, J.; Bartholomeus, H.; Bauwens, S.; Bentley, L.P.; Chave, J.; Danson, F.M.; Demol, M.; Disney, M.; et al. Terrestrial laser scanning in forest ecology: Expanding the horizon. Remote Sens. Environ. 2020, 251, 112102. [Google Scholar] [CrossRef] [Scilit]
- Ruhan, A.; Du, W.; Ying, H.; Wei, B.; Shan, Y.; Dai, H. Estimation of Aboveground Biomass of Individual Trees by Backpack LiDAR Based on Parameter-Optimized Quantitative Structural Models (AdQSM). Forests 2023, 14, 475. [Google Scholar] [CrossRef] [Scilit]
- Ryding, J.; Williams, E.; Smith, M.J.; Eichhorn, M.P. Assessing Handheld Mobile Laser Scanners for Forest Surveys. Remote Sens. 2015, 7, 1095. [Google Scholar] [CrossRef] [Scilit]
- Bauwens, S.; Bartholomeus, H.; Calders, K.; Lejeune, P. Forest Inventory with Terrestrial LiDAR: A Comparison of Static and Hand-Held Mobile Laser Scanning. Forests 2016, 7, 127. [Google Scholar] [CrossRef] [Scilit]
- Chen, S.; Liu, H.; Feng, Z.; Shen, C.; Chen, P. Applicability of personal laser scanning in forestry inventory. PLoS ONE 2019, 14, e0211392. [Google Scholar] [CrossRef] [Scilit]
- Hyyppä, E.; Kukko, A.; Kaijaluoto, R.; White, J.C.; Wulder, M.A.; Pyörälä, J.; Liang, X.; Yu, X.; Wang, Y.; Kaartinen, H.; et al. Accurate derivation of stem curve and volume using backpack mobile laser scanning. ISPRS J. Photogramm. Remote Sens. 2020, 161, 246–262. [Google Scholar] [CrossRef] [Scilit]
- Stovall, A.E.L.; MacFarlane, D.W.; Crawford, D.; Jovanovic, T.; Frank, J.; Brack, C. Comparing mobile and terrestrial laser scanning for measuring and modelling tree stem taper. For. Int. J. For. Res. 2023, 96, 705–717. [Google Scholar] [CrossRef] [Scilit]
- Holvoet, J.; Eichhorn, M.P.; Giannetti, F.; Kükenbrink, D.; Liang, X.; Mokroš, M.; Novotný, J.; Pitkänen, T.P.; Puliti, S.; Skudnik, M.; et al. Terrestrial and mobile laser scanning for national forest inventories: From theory to implementation. Remote Sens. Environ. 2025, 329, 114947. [Google Scholar] [CrossRef] [Scilit]
- Demol, M.; Verbeeck, H.; Gielen, B.; Armston, J.; Burt, A.; Disney, M.; Duncanson, L.; Hackenberg, J.; Kükenbrink, D.; Lau, A.; et al. Estimating forest above-ground biomass with terrestrial laser scanning: Current status and future directions. Methods Ecol. Evol. 2022, 13, 1628–1639. [Google Scholar] [CrossRef] [Scilit]
- Hackenberg, J.; Wassenberg, M.; Spiecker, H.; Sun, D. Non Destructive Method for Biomass Prediction Combining TLS Derived Tree Volume and Wood Density. Forests 2015, 6, 1274–1300. [Google Scholar] [CrossRef] [Scilit]
- Levick, S.R.; Whiteside, T.; Loewensteiner, D.A.; Rudge, M.; Bartolo, R. Leveraging TLS as a Calibration and Validation Tool for MLS and ULS Mapping of Savanna Structure and Biomass at Landscape-Scales. Remote Sens. 2021, 13, 257. [Google Scholar] [CrossRef] [Scilit]
- MacFarlane, D.W. A generalized tree component biomass model derived from principles of variable allometry. For. Ecol. Manag. 2015, 354, 43–55. [Google Scholar] [CrossRef] [Scilit]
- Parhizgar, L.; Pattnaik, N.; Yazdi, H.; Qiguan, S.; Pauleit, S.; Rahman, M.A.; Ludwig, F.; Pretzsch, H.; Rötzer, T. Branch biomass allometries for urban tree species based on terrestrial laser scanning (TLS) data. Trees 2025, 39, 57. [Google Scholar] [CrossRef] [Scilit]
- Molto, Q.; Rossi, V.; Blanc, L. Error propagation in biomass estimation in tropical forests. Methods Ecol. Evol. 2013, 4, 175–183. [Google Scholar] [CrossRef] [Scilit]
- Xing, D.; Bergeron, J.A.C.; Solarik, K.A.; Tomm, B.; Macdonald, S.E.; Spence, J.R.; He, F. Challenges in estimating forest biomass: Use of allometric equations for three boreal tree species. Can. J. For. Res. 2019, 49, 1613–1622. [Google Scholar] [CrossRef] [Scilit]
- Pitkänen, T.P.; Raumonen, P.; Liang, X.; Lehtomäki, M.; Kangas, A. Improving TLS-based stem volume estimates by field measurements. Comput. Electron. Agric. 2021, 180, 105882. [Google Scholar] [CrossRef] [Scilit]
- Chiappini, S.; Pierdicca, R.; Malandra, F.; Tonelli, E.; Malinverni, E.S.; Urbinati, C.; Vitali, A. Comparing Mobile Laser Scanner and manual measurements for dendrometric variables estimation in a black pine (Pinus nigra Arn.) plantation. Comput. Electron. Agric. 2022, 198, 107069. [Google Scholar] [CrossRef] [Scilit]
- Vandendaele, B.; Martin-Ducup, O.; Fournier, R.A.; Pelletier, G.; Lejeune, P. Mobile Laser Scanning for Estimating Tree Structural Attributes in a Temperate Hardwood Forest. Remote Sens. 2022, 14, 4522. [Google Scholar] [CrossRef] [Scilit]
- DAFM. Ireland’s National Forest Inventory 2022; Department of Agriculture, Food and the Marine: Wexford, Ireland, 2022. [Google Scholar]
- European Parliament and Council of the European Union Regulation (EU) 2024/3012 of the European Parliament and of the Council of 27 November 2024 Establishing a Union Certification Framework for Permanent Carbon Removals, Carbon Farming and Carbon Storage in Products. 2024. Available online: https://eur-lex.europa.eu/eli/reg/2024/3012/oj (accessed on 25 March 2026).
- Chiti, T.; Rey, A.; Abildtrup, J.; Böttcher, H.; Diaci, J.; Frings, O.; Lehtonen, A.; Schindlbacher, A.; Zavala, M.A. Carbon Farming in the European Forestry Sector; From Science to Policy; European Forest Institute: Bonn, Germany, 2024. [Google Scholar] [CrossRef] [Scilit]
- Papucci, E.; Valbuena, R.; Roberge, C.; Mensah, A.A.; Ståhl, G. A review of forest biomass assessments based on remote sensing reveals progress in methodological quality—But major challenges remain. For. Int. J. For. Res. 2026, 99, cpag007. [Google Scholar] [CrossRef] [Scilit]
- Zou, J.; Liu, X.; Kevitt, K.M.; Cacciotti, E.; Benanti, G.; Saunders, M.; Tobin, B.; Osborne, B. Decadal variation in soil respiration in a Sitka spruce plantation in central Ireland and its temperature sensitivity. Agric. For. Meteorol. 2025, 374, 110828. [Google Scholar] [CrossRef] [Scilit]
- Met Éireann. Birr: 1979–2008 Long-Term Averages. Available online: https://www.met.ie/cms/assets/uploads/2024/07/Birr-1979%E2%80%932008-averages.html (accessed on 24 November 2025).
- CloudCompare. 2025. Available online: http://www.Cloudcompare.Org/ (accessed on 24 November 2025).
- Laino, D.; Cabo, C.; Prendes, C.; Janvier, R.; Ordonez, C.; Nikonovas, T.; Doerr, S.; Santin, C. 3DFin: A software for automated 3D forest inventories from terrestrial point clouds. For. Int. J. For. Res. 2024, 97, 479–496. [Google Scholar] [CrossRef] [Scilit]
- Tobin, B.; Nieuwenhuis, M. Biomass expansion factors for Sitka spruce (Picea sitchensis (Bong.) Carr.) in Ireland. Eur. J. For. Res. 2007, 126, 189–196. [Google Scholar] [CrossRef] [Scilit]
- Olesen, P. Water Displacement Method; A Fast and Accurate Method of Determining the Green Volume of Wood Samples. 1971. Available online: https://www.semanticscholar.org/paper/water-displacement-method%3B-a-fast-and-accurate-of-Olesen/fdb2bba6a23a3b442ef15c12211227dbf02c62f2 (accessed on 25 March 2026).
- Kuželka, K.; Surový, P. Noise Analysis for Unbiased Tree Diameter Estimation from Personal Laser Scanning Data. Remote Sens. 2024, 16, 1261. [Google Scholar] [CrossRef] [Scilit]
- Dowd, L.; Nieuwenhuis, M. Assessing the accuracy of dynamic yield models (Growfor) in highly productive stands of Sitka spruce. Ir. For. 2024, 78, 54–72. [Google Scholar]
- EPA. Ireland’s National Inventory Report 2024; EPA: Wexford, Ireland, 2024. [Google Scholar]
- Tobin, B.; Black, K.; Osborne, B.; Reidy, B.; Bolger, T.; Nieuwenhuis, M. Assessment of allometric algorithms for estimating leaf biomass, leaf area index and litter fall in different-aged Sitka spruce forests. For. Int. J. For. Res. 2006, 79, 453–465. [Google Scholar] [CrossRef] [Scilit]
- IPCC. Chapter 4: Forest Land. In 2006 IPCC Guidelines for National Greenhouse Gas Inventories. Volume 4: Agriculture, Forestry and Other Land Use; IPCC: Geneva, Switzerland, 2006. [Google Scholar]
- Gallagher, G.; Hendrick, E.; Byrne, K.A. Preliminary estimates of biomass carbon stock changes in managed forests in the Republic of Ireland over the period 1990–2000. Ir. For. 2004, 61, 35–49. [Google Scholar]
- Kent, T.; Kofman, P.D.; Coates, E. Harvesting Wood for Energy; COFORD: Dublin, Ireland, 2011. [Google Scholar]
- Dolan, D.; O’Ceallaigh, C.; Gil-Moreno, D.; McGetrick, P.J.; Harte, A.M. Life cycle assessment of sitka spruce forest products grown in Ireland. Int. J. Life Cycle Assess 2024, 29, 132–151. [Google Scholar] [CrossRef] [Scilit]
- Persson, H.J.; Olofsson, K.; Holmgren, J. Two-phase forest inventory using very-high-resolution laser scanning. Remote Sens. Environ. 2022, 271, 112909. [Google Scholar] [CrossRef] [Scilit]
- de Paula Pires, R.; Lindberg, E.; Persson, H.J.; Olofsson, K.; Holmgren, J. Mobile laser scanning as reference for estimation of stem attributes from airborne laser scanning. Remote Sens. Environ. 2024, 315, 114414. [Google Scholar] [CrossRef] [Scilit]
- Soininen, V.; Yu, X.; Hyyppä, M.; Hyyppä, J. Transferability of country-wide airborne laser scanning-based models for individual-tree attributes. Sci. Remote Sens. 2025, 12, 100310. [Google Scholar] [CrossRef] [Scilit]
- Calders, K.; Verbeeck, H.; Burt, A.; Origo, N.; Nightingale, J.; Malhi, Y.; Wilkes, P.; Raumonen, P.; Bunce, R.G.H.; Disney, M. Laser scanning reveals potential underestimation of biomass carbon in temperate forest. Ecol. Solut. Evid. 2022, 3, e12197. [Google Scholar] [CrossRef] [Scilit]

Disclaimer/Publisher’s Note: The statements, opinions and data contained in all publications are solely those of the individual author(s) and contributor(s) and not of MDPI and/or the editor(s). MDPI and/or the editor(s) disclaim responsibility for any injury to people or property resulting from any ideas, methods, instructions or products referred to in the content. |
© 2026 by the authors. Licensee MDPI, Basel, Switzerland. This article is an open access article distributed under the terms and conditions of the Creative Commons Attribution (CC BY) license.