Article

Long-Term Dynamics and Driving Mechanisms of Forest Carbon Storage Under Ecological Restoration in Shaanxi Province, China

1
Shaanxi Institute of Forest Inventory and Planning, Xi’an 710082, China
2
College of Environmental Science and Engineering, Taiyuan University of Technology, Taiyuan 030024, China
3
State Key Laboratory of Eco-Hydraulics in Northwest Arid Region of China, Xi’an University of Technology, Xi’an 710048, China
*
Author to whom correspondence should be addressed.
Forests 2026, 17(6), 676; https://doi.org/10.3390/f17060676
Submission received: 9 April 2026 / Revised: 20 May 2026 / Accepted: 29 May 2026 / Published: 3 June 2026
(This article belongs to the Section Forest Soil)

Abstract

Understanding whether vegetation greening corresponds to changes in estimated forest carbon storage is important for evaluating ecological restoration under coupled climate change and human pressures. However, existing studies often rely on vegetation indices and have limited capacity to examine long-term forest carbon storage patterns or distinguish the roles of climatic and anthropogenic factors. This study integrates long-term remote sensing data with a two-way fixed effects model to examine forest ecosystem carbon storage in Shaanxi Province, China, from 1990 to 2023. Forest carbon storage was estimated by combining historical land-use data with static baseline carbon density coefficients derived from the 2012 field inventory, following an IPCC Tier 1-type approach. The carbon pools considered included aboveground biomass, belowground biomass, litter, and soil organic carbon. The results show that NDVI increased significantly, while estimated forest carbon storage increased by 4.27 × 10⁷ t (21.04%), with evident regional heterogeneity. A mismatch was observed between vegetation greenness and estimated forest carbon storage, and NDVI showed weak and unstable associations with carbon storage after controlling for fixed effects. Nighttime light exhibited a significant negative association with carbon storage, whereas climatic factors were generally insignificant. These findings suggest that vegetation indices alone may not reliably represent land-use-based carbon storage estimates. This study provides empirical evidence for understanding forest carbon storage patterns under ecological restoration and highlights the need for dynamic carbon density parameters in future assessments.

1. Introduction

Forests are among the most critical terrestrial ecosystems, playing essential roles in regulating the global carbon cycle, conserving biodiversity, and stabilizing the climate [1,2,3]. Acting as both carbon sinks and sources, they are indispensable for mitigating anthropogenic greenhouse gas emissions [4]. However, in recent decades, widespread deforestation, land degradation, and urban expansion have substantially altered forest carbon dynamics, accelerating climate change and undermining ecological security [5]. Assessing long-term variations in forest ecosystem carbon storage (including aboveground biomass, belowground biomass, litter, and soil organic carbon) and clarifying their driving mechanisms are thus fundamental for understanding terrestrial ecosystem responses to environmental and socioeconomic change.
Since the late 20th century, China has undergone profound land-use and ecological transitions driven by rapid industrialization and population growth [6,7]. Severe soil erosion, vegetation degradation, and ecosystem fragmentation have prompted the implementation of large-scale ecological restoration programs, especially in the Loess Plateau and its adjacent regions [8]. Among them, the Grain-for-Green Program (GGP), initiated in 1999, represents one of the world’s most extensive ecological engineering projects, converting steep cropland into forests and grasslands to reduce soil erosion and enhance carbon sequestration [9,10]. Numerous studies have confirmed that the GGP has significantly improved vegetation cover across northern China, evidenced by increasing NDVI trends and enhanced land surface greenness [11,12,13]. Nevertheless, the long-term carbon sequestration effects of these efforts, particularly at the provincial scale, remain uncertain and spatially heterogeneous.
Shaanxi Province, situated between the Loess Plateau in the north and the Qinling–Daba Mountains in the south, provides a unique ecological transition zone encompassing diverse climatic and topographic gradients [14]. This region bridges the Yellow River and Yangtze River basins and exhibits strong ecological contrasts—from arid loess hills to humid subtropical forests. Since the launch of the GGP, Shaanxi has become a priority area for afforestation, reforestation, and soil–water conservation projects, resulting in remarkable greening, especially in degraded northern areas [15,16]. Yet, whether vegetation recovery has translated into corresponding gains in forest carbon storage remains unclear, as do the relative roles of climatic and anthropogenic factors in shaping these processes.
Most existing studies have focused on vegetation greening using indices such as NDVI and EVI, which effectively indicate photosynthetic activity but fail to reflect estimated carbon storage patterns [17]. Forest carbon storage is influenced not only by vegetation growth but also by biomass structure, turnover rates, and management practices, leading to a temporal mismatch between greenness and carbon dynamics [18]. However, several important gaps remain. The relationship between vegetation greening and forest carbon storage estimates has not been sufficiently examined over long-term periods, limiting our understanding of the effectiveness of ecological restoration [19]. Existing studies also tend to rely on descriptive or correlation analyses, with limited use of econometric approaches that can disentangle the relative contributions of climatic and anthropogenic drivers while controlling for spatial and temporal heterogeneity [20]. At the same time, the potential mismatch between vegetation greenness and estimated carbon storage under large-scale ecological restoration has received relatively little attention, particularly at the provincial scale in ecologically fragile regions.
To address these gaps, this study examines the spatiotemporal evolution of forest NDVI and carbon storage in Shaanxi Province from 1990 to 2023 and explores their driving mechanisms using a two-way fixed effects model that accounts for both spatial and temporal heterogeneity. It provides a long-term assessment of forest greenness and carbon storage dynamics under extensive ecological restoration, and quantifies the relative contributions of climatic and socioeconomic factors to forest carbon changes. By examining the relationship between NDVI and estimated carbon storage, this study identifies a potential mismatch between vegetation greenness and carbon storage estimates under a static carbon-density accounting framework. The findings provide a cautious basis for evaluating ecological restoration effects and improving forest carbon assessment in ecologically fragile regions.

2. Materials and Methods

2.1. Study Area

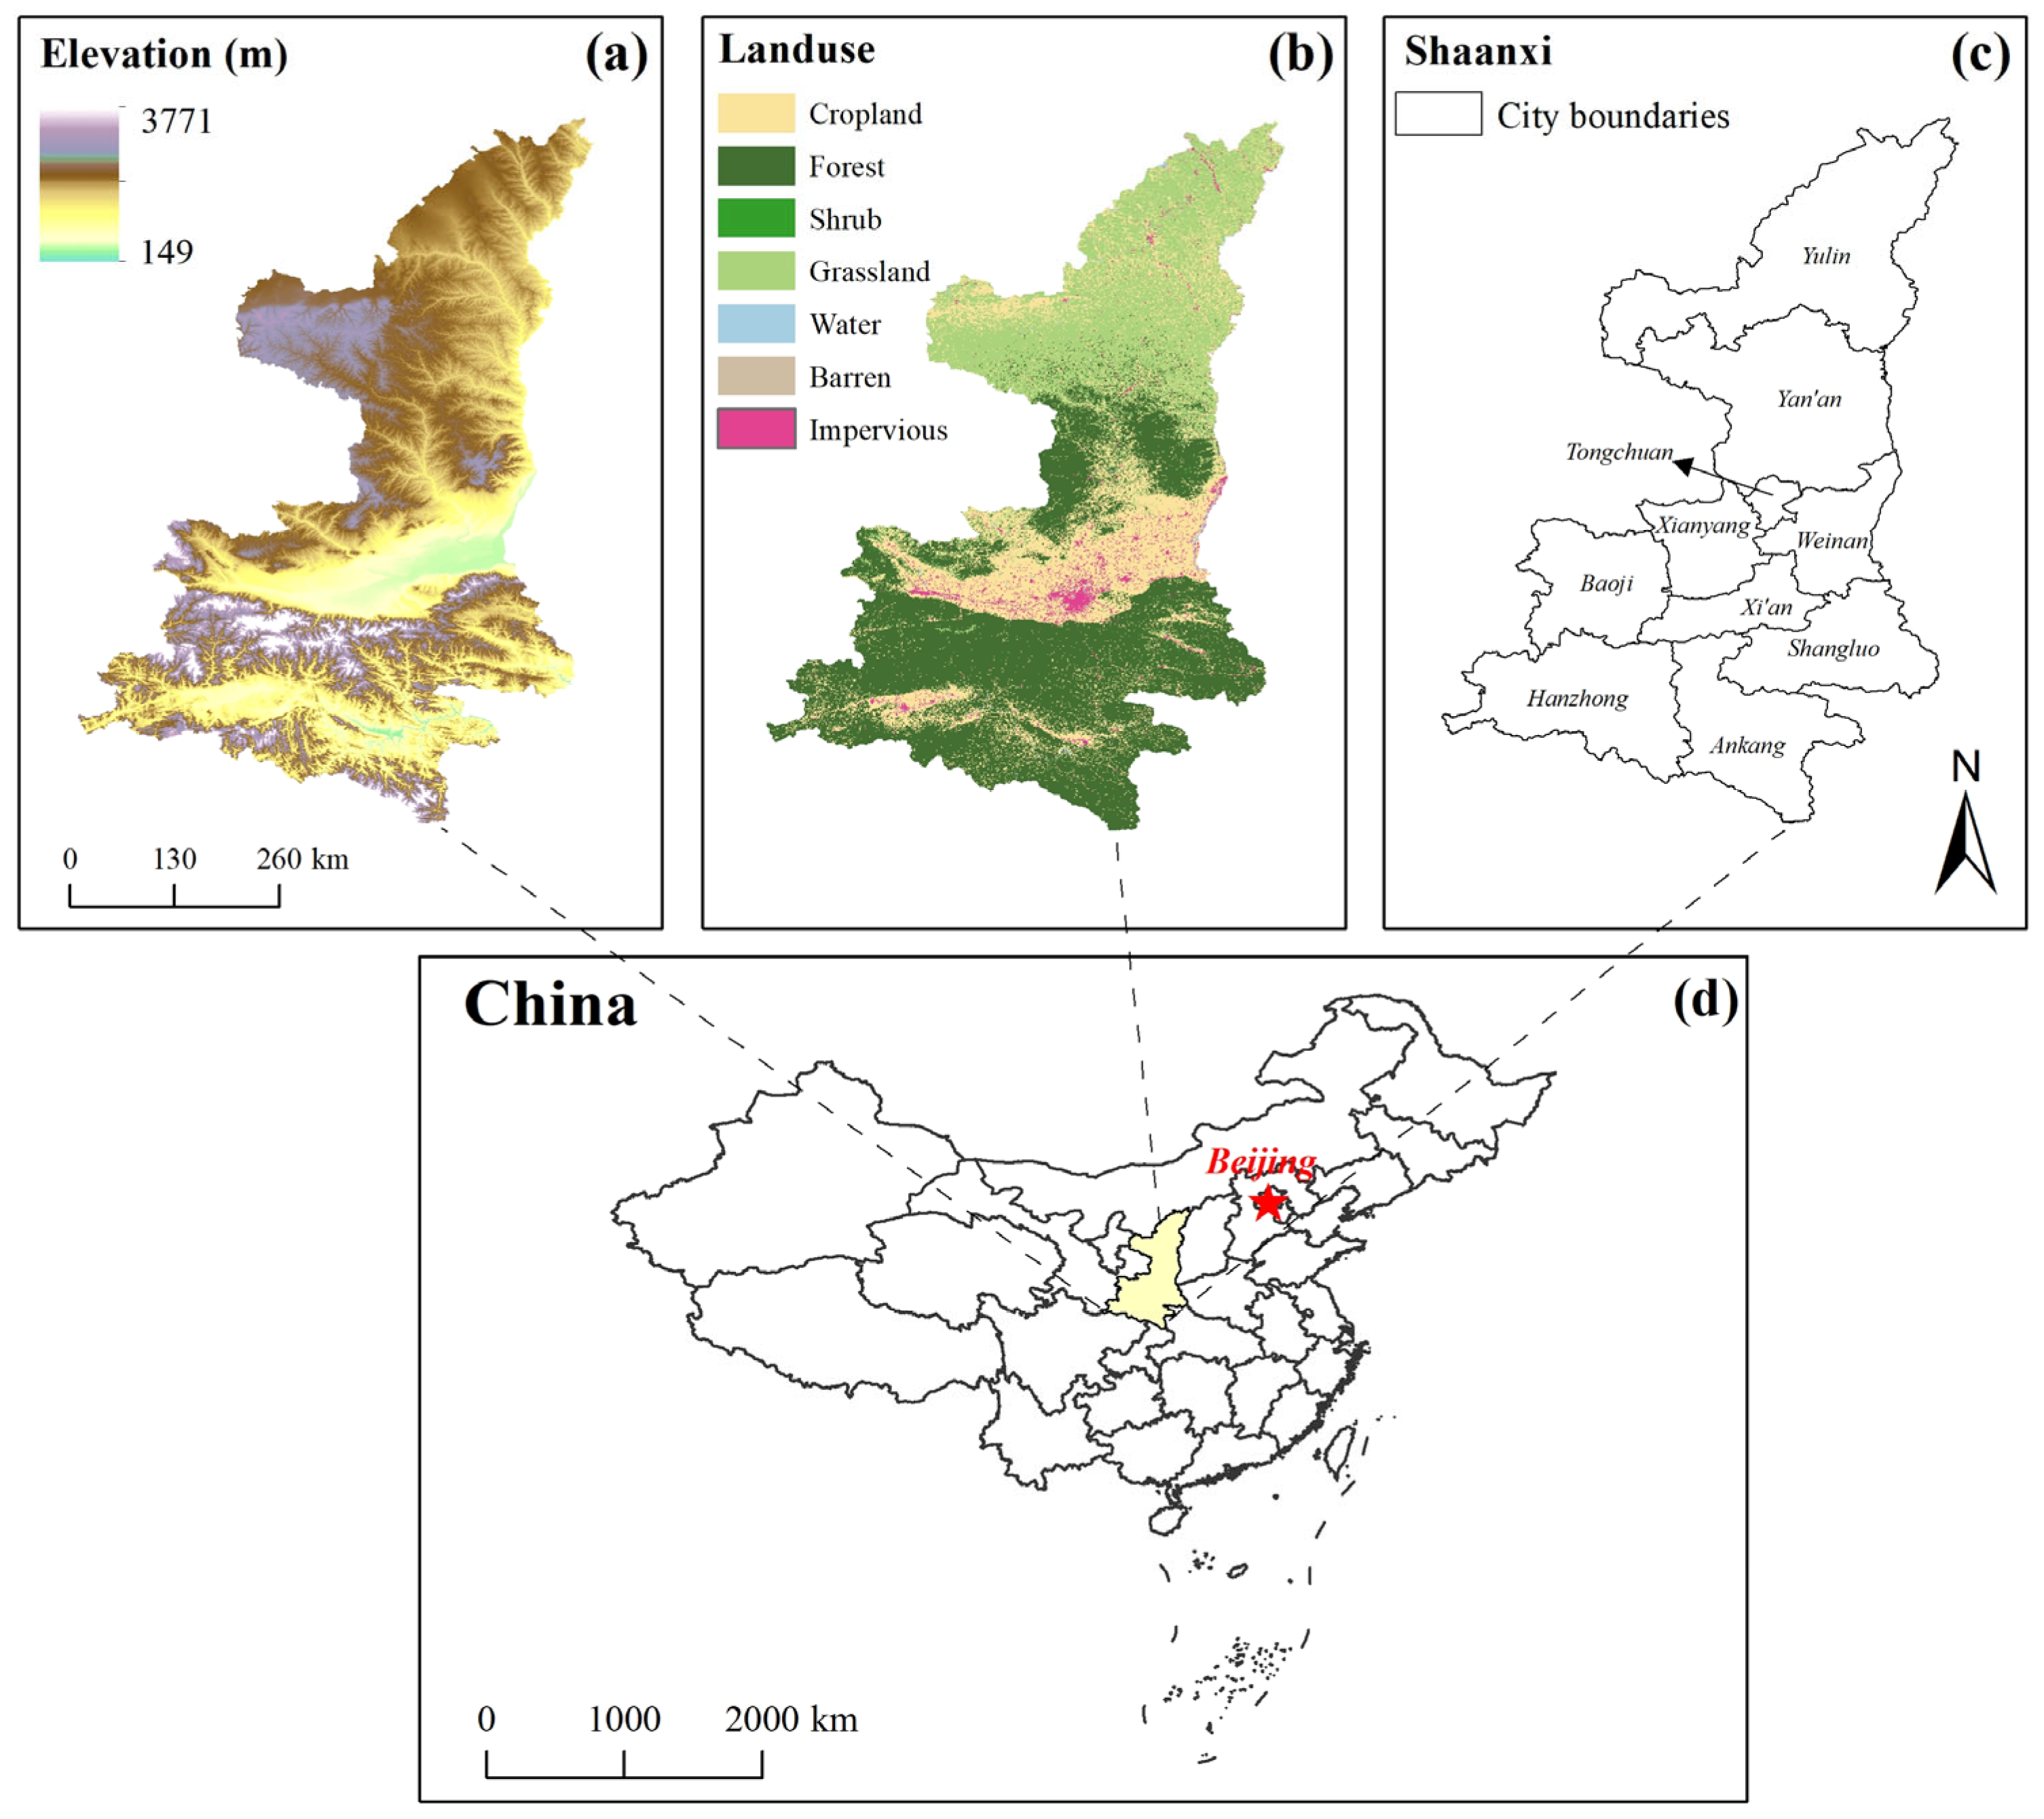
Shaanxi Province, located in north-central China (31°70′–39°59′ N, 105°47′–111°27′ E) (Figure 1), covers an area of 205,600 km2 [21]. The terrain is high in the north and south and low in the central plain, consisting of plateaus, mountains, basins, and plains. The Loess Plateau occupies about 40% of the province, with elevations ranging from 170 to 3780 m (Figure 1). The region spans the Yellow River and Yangtze River basins and includes three climatic zones: temperate monsoon (northern Shaanxi), warm temperate monsoon (Guanzhong and most of northern Shaanxi), and north subtropical monsoon (southern Shaanxi) [22]. Soil types in Shaanxi are diverse and exhibit clear zonal patterns, mainly including sandy and loessal soils in the north, fertile agricultural soils such as cinnamon and fluvo-aquic soils in the Guanzhong Plain, and paddy and mountain soils such as brown and yellow-brown soils in the south. Forests in the study area are mainly composed of deciduous broadleaf and mixed conifer–broadleaf forests, with typical species such as Pinus, Quercus, Betula, and Populus.

2.2. Methodology

2.2.1. Calculation of Carbon Storage

(1)
Plot Design and Field Sampling
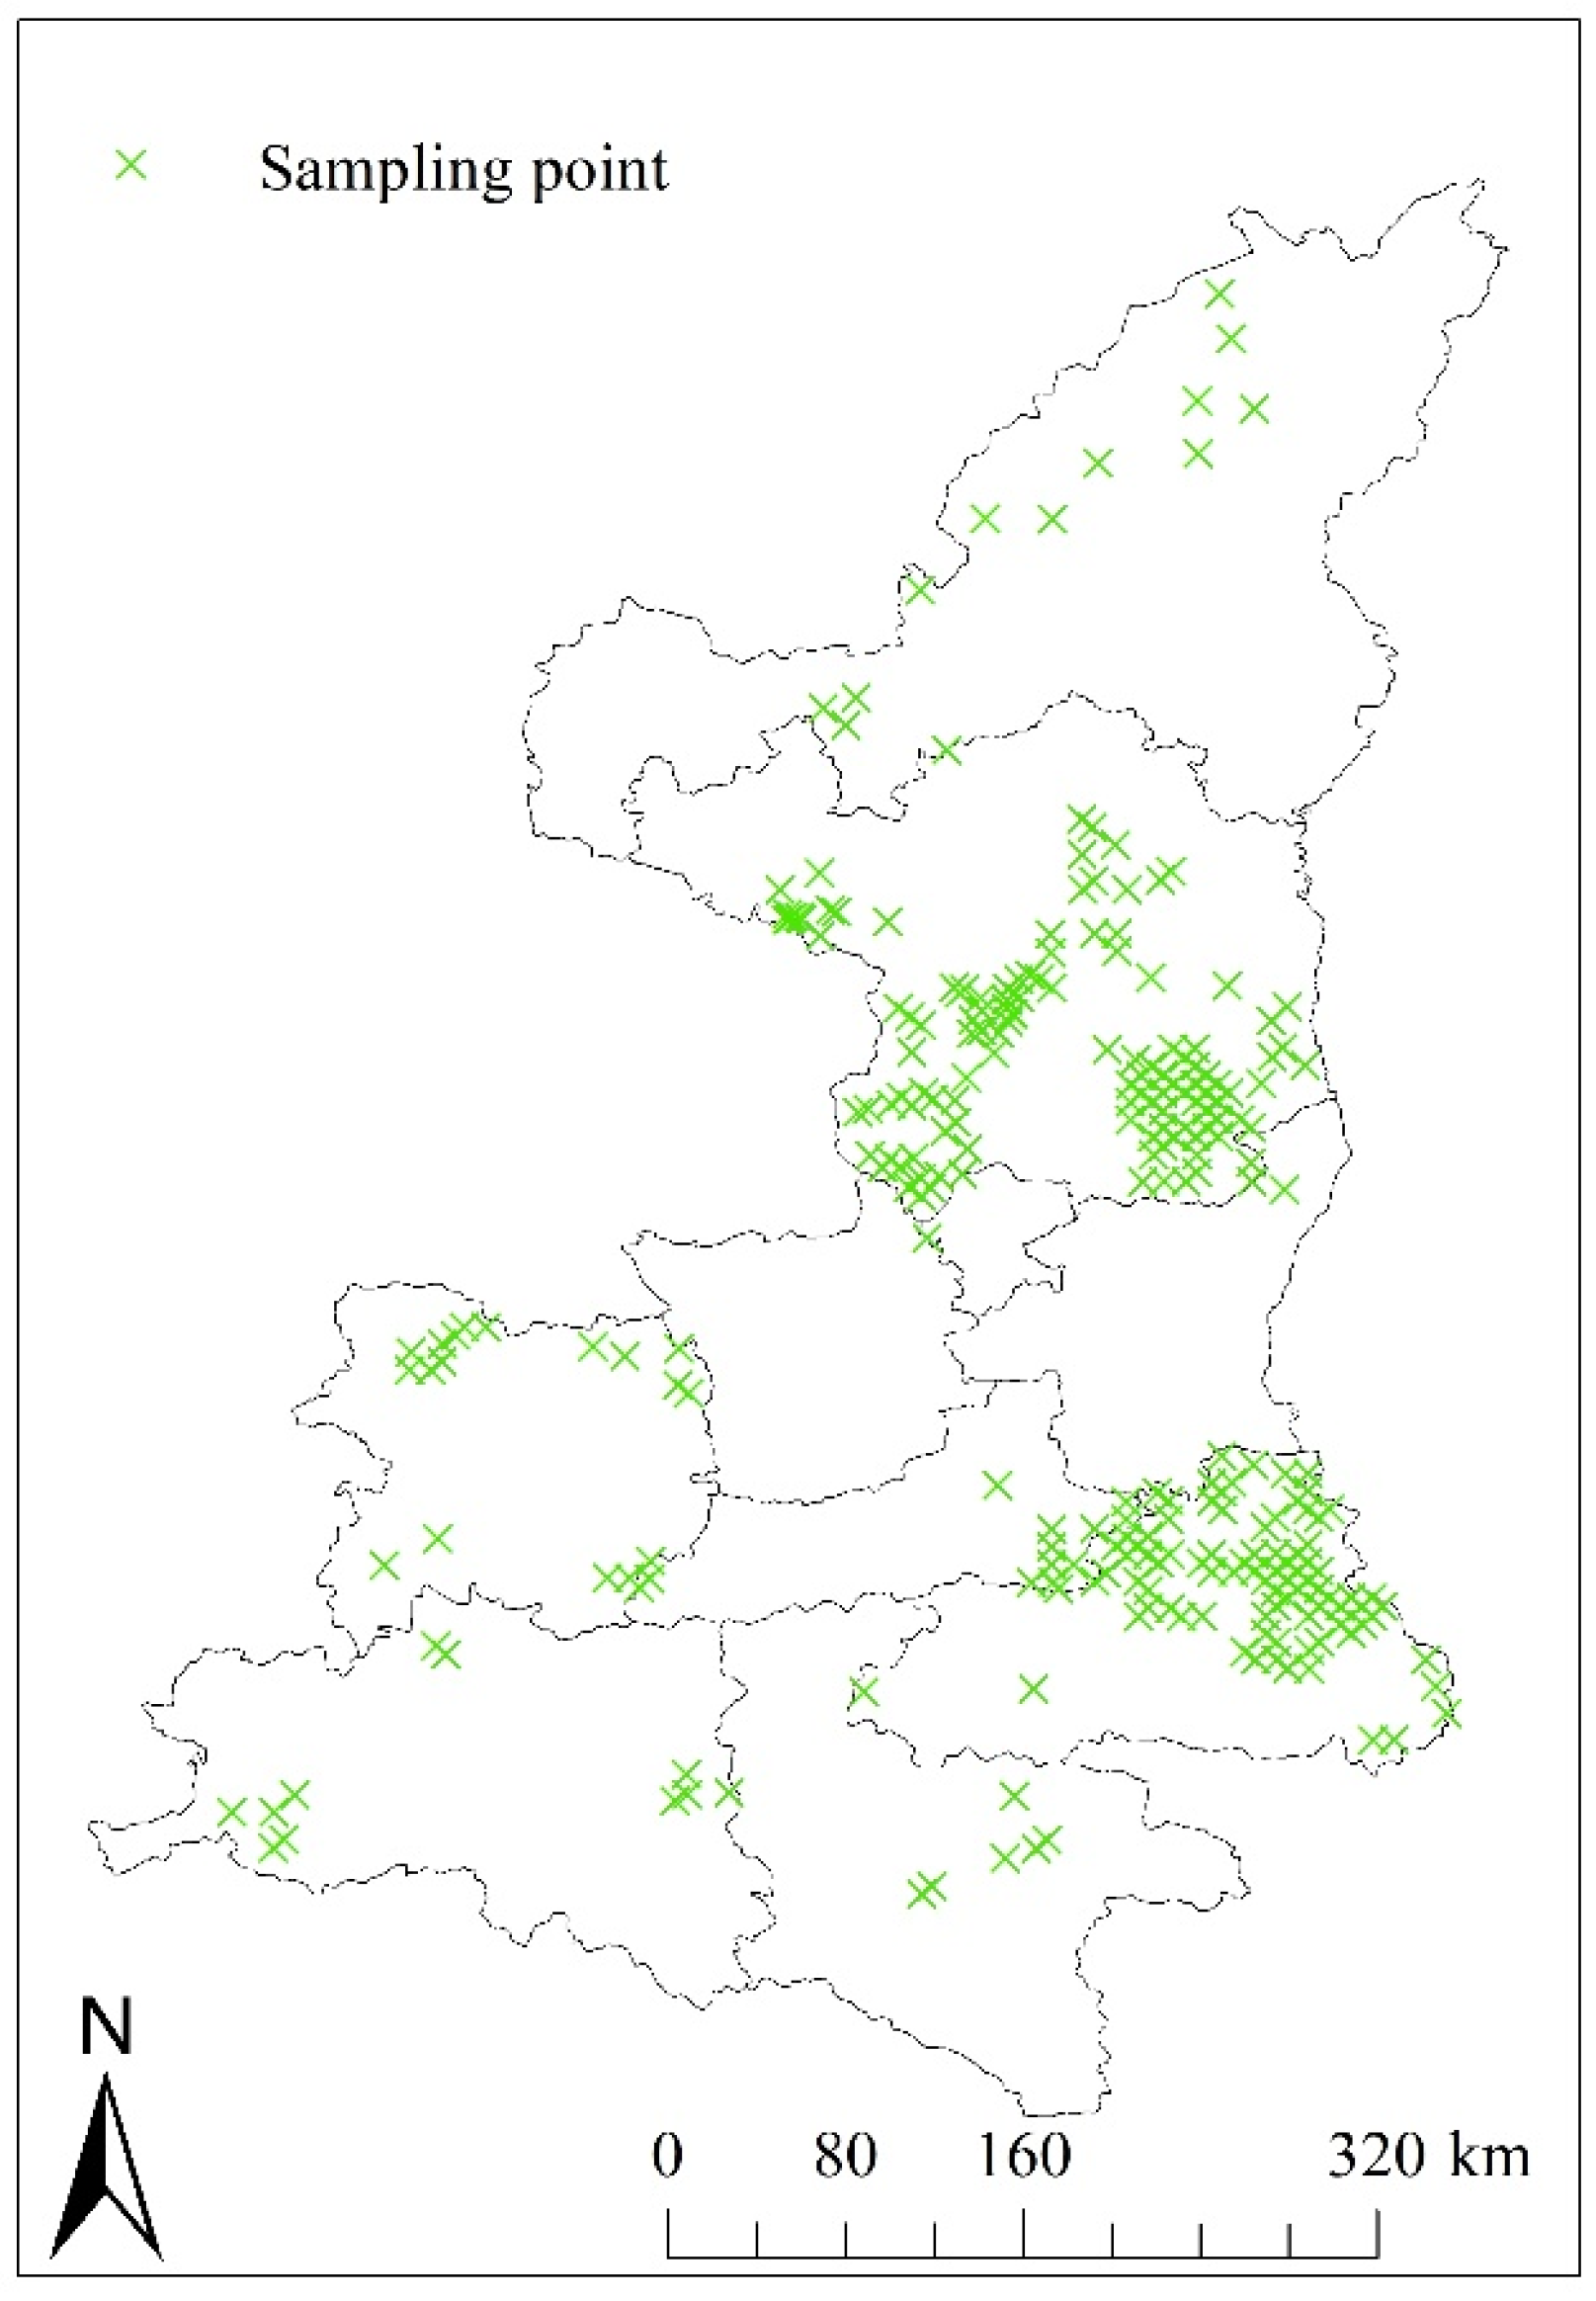
Field investigations of forest carbon sequestration in Shaanxi Province were conducted under the National Carbon Sink Assessment System, with 2012 as the baseline year (Figure 2). Sampling sites were selected from the National Forest Continuous Inventory and were designed to ensure representativeness across different forest types, climatic zones, and topographic conditions. The survey included aboveground biomass, belowground biomass, litter, and soil organic carbon (SOC) [23,24,25].
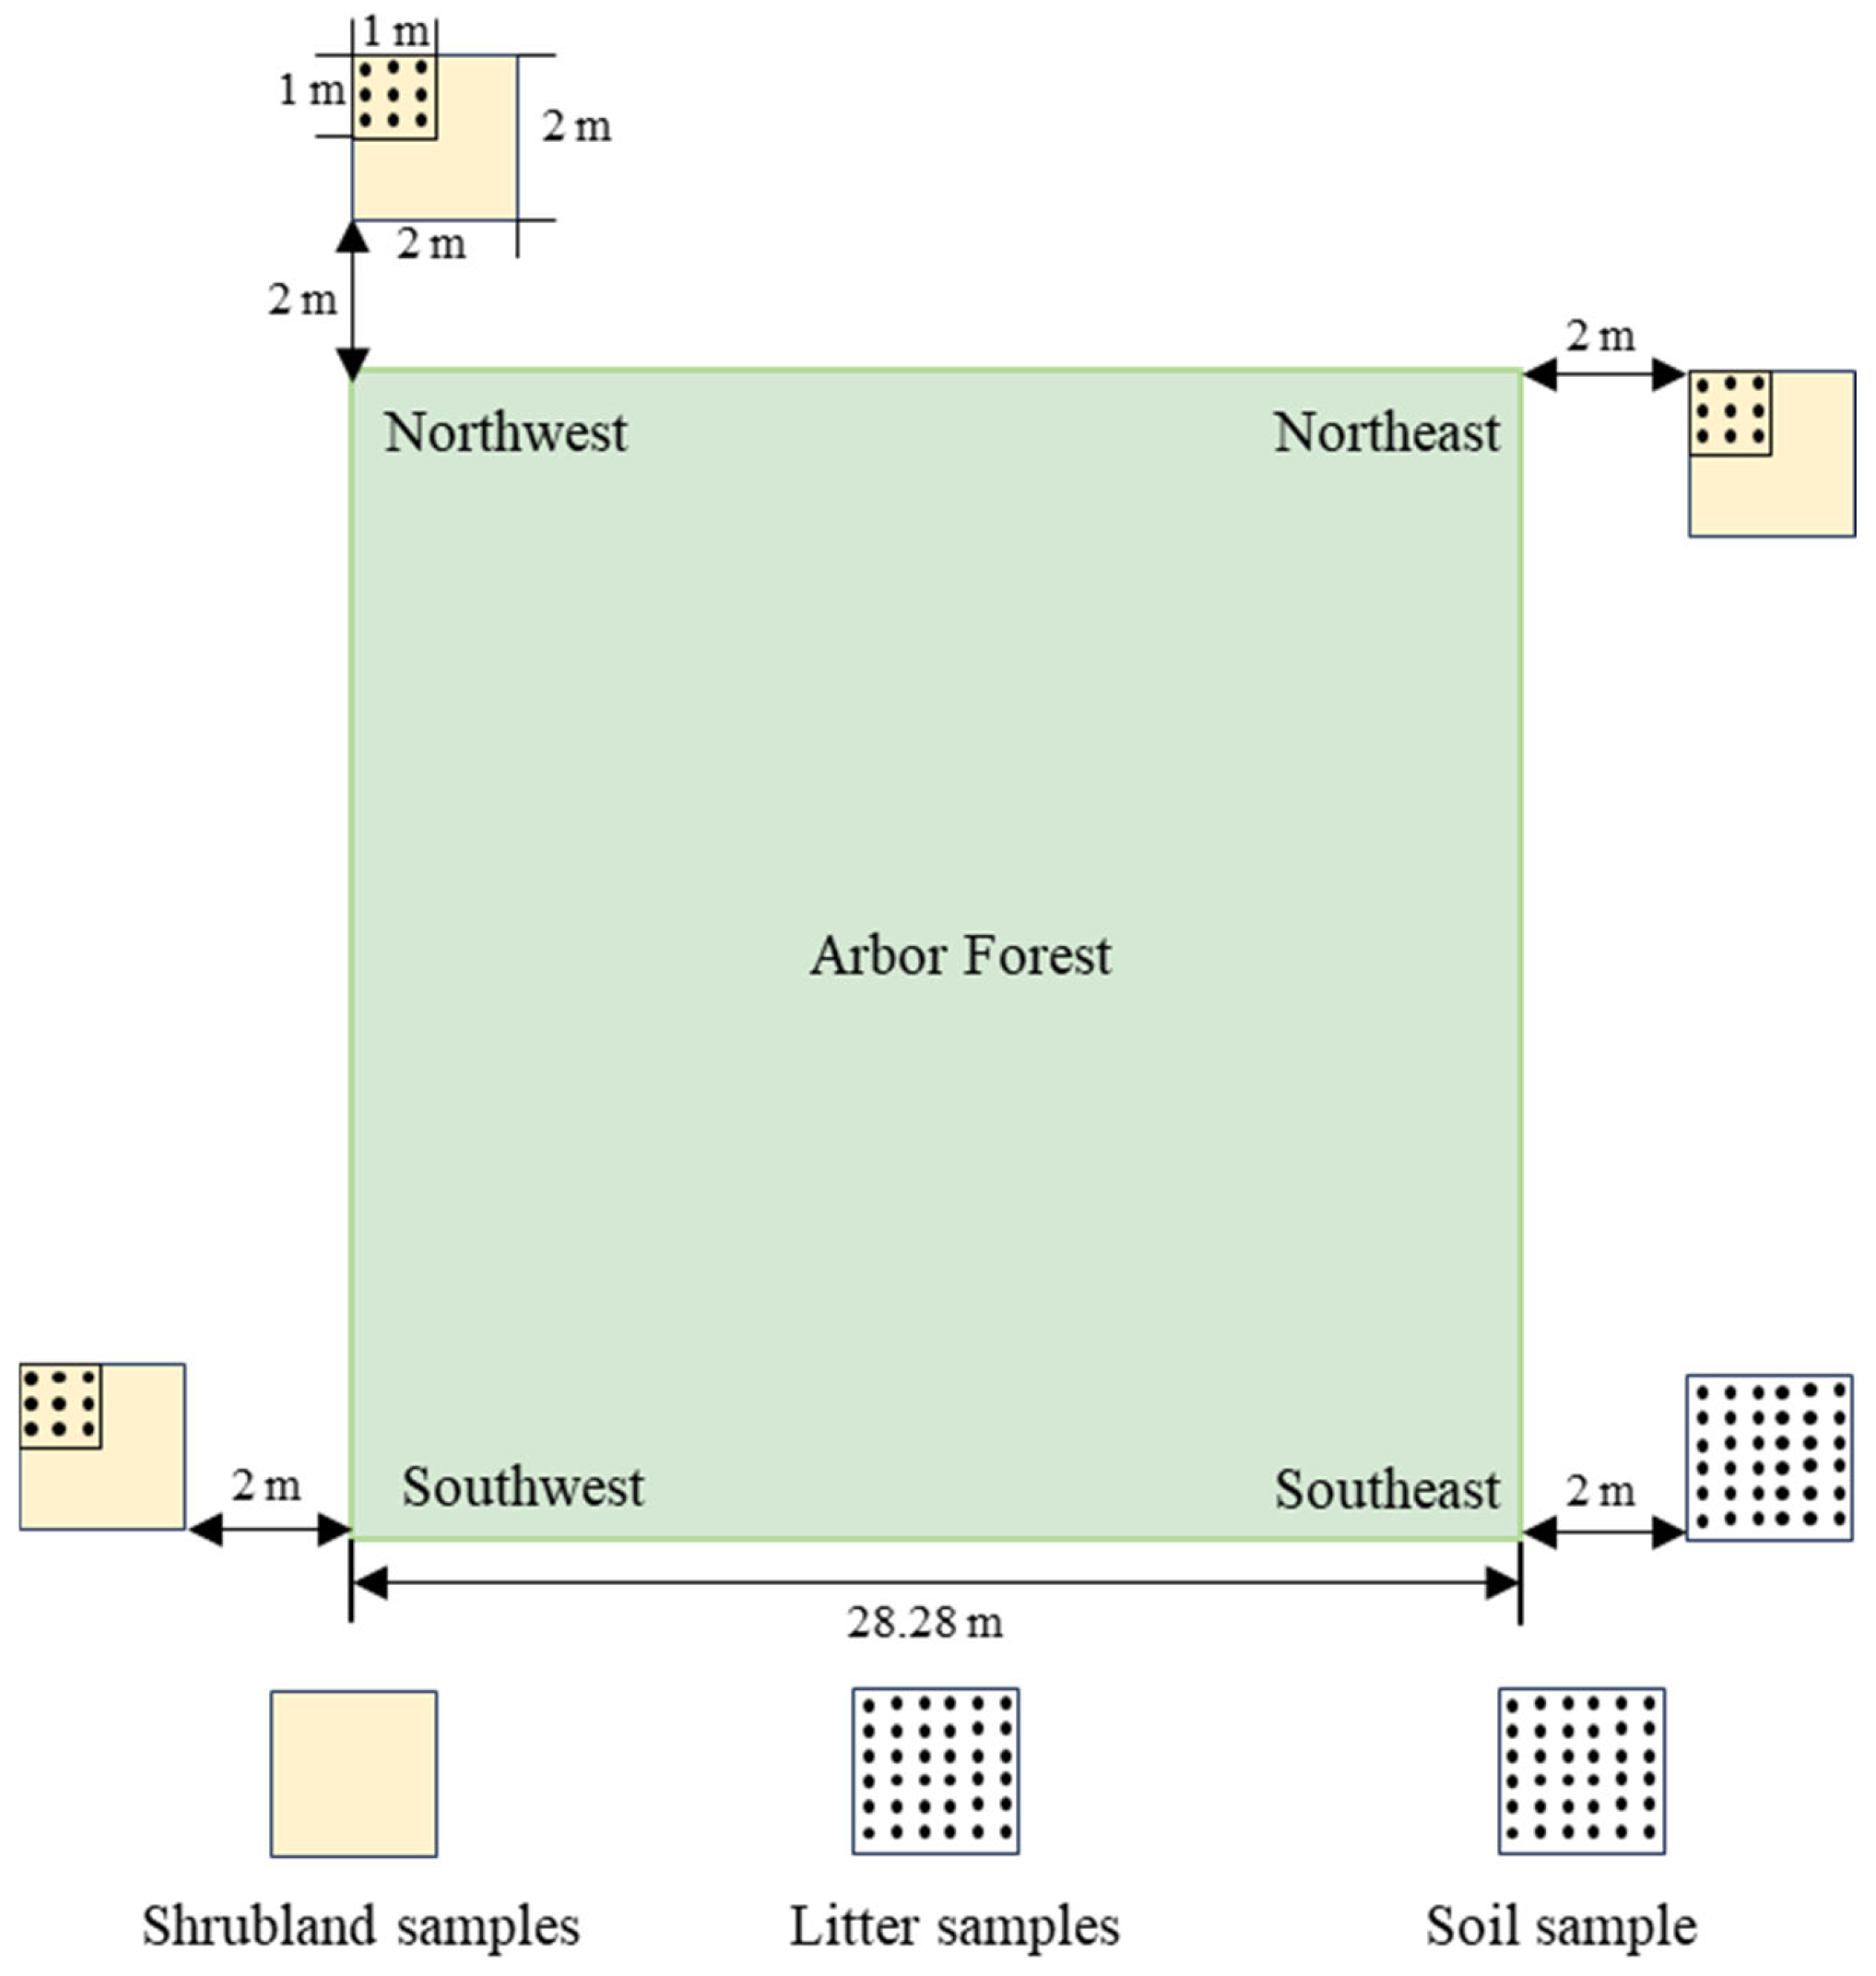
Arbor forest plots were defined as square areas of 28.28 m × 28.28 m (1.2 mu), with canopy cover ≥ 20% and tree height ≥ 2 m. Around each plot, three shrub subplots (2 m × 2 m) and corresponding soil plots were established, along with a litter subplot (1 m × 1 m) located within the shrub subplot (Figure 3).
Aboveground biomass included stems, branches, bark, leaves, and reproductive organs of trees and shrubs. Belowground biomass comprised all living roots, excluding fine roots (≤2 mm). Litter referred to dead organic matter (<5 cm diameter) above the soil surface and was classified into litter and humus based on decomposition stage. SOC included organic carbon in mineral and organic soils within the specified depth; fine roots (≤2 mm) were included when indistinguishable in the field.
All plots followed a square design consistent with the inventory system. Measurements were conducted clockwise from the southwest corner using a compass and tape, with a closure error <1/200. Site characteristics (e.g., geographic coordinates, slope, aspect, and elevation) and forest disturbance factors were recorded.
Shrub and litter biomass were measured using the harvest method. Subplots were established 2 m outside the plot boundary at the four corners in cardinal directions. If three valid subplots could not be established due to terrain constraints, at least two were required; otherwise, the plot was relocated.
(2)
Sampling Design and Recorded Variables
For each site, more than three sample plots were established for each plot type. When existing plots did not meet the requirements of the National Carbon Sink Assessment System, additional representative plots were established as needed.
The following variables were recorded:
(i)
Geographic information: geographic coordinates, elevation, aspect, slope gradient, and slope position.
(ii)
Soil properties: soil type, depth, gravel content, organic matter content, and bulk density. Soil samples were collected at 10 cm intervals using soil profile excavation and auger sampling.
(iii)
Arbor forest characteristics: forest origin (natural or planted), dominant species, diameter at breast height (DBH, measured at 1.3 m for trees with DBH > 5 cm), tree height, forest type (broadleaf, coniferous, mixed), and age class (young, middle-aged, near-mature, mature, and over-mature).
(iv)
Shrub layer: dominant species (including saplings with DBH < 5 cm), canopy cover, height, and plant density (excluding individuals < 50 cm in height). Three representative shrubs of average size were selected, and the harvest method was applied to measure fresh biomass of stems, branches, leaves, and roots. For clustered shrubs, one to two individuals with average crown size were selected for measurement.
(v)
Litter layer: litter thickness was measured, and all litter within the subplot was collected and weighed for fresh mass. A subsample (~200 g) was taken to the laboratory to determine moisture content.
(3)
Laboratory Analysis
All litter and soil samples were collected and analyzed under the National Carbon Sink Assessment System. The carbon density data used in this study were derived from the 2012 field survey, and the laboratory analyses followed the corresponding national and forestry standards.
Litter samples were oven-dried to determine the dry-to-fresh mass ratio, which was used to calculate litter biomass. Soil samples for bulk density determination were collected using the cutting-ring method and dried at 100 °C for 24 h following the Chinese agricultural standard NY/T 1121.4. Other soil samples were air-dried, ground, and sieved through a 100-mesh sieve. Soil organic carbon (SOC) content was determined using the potassium dichromate oxidation–external heating method in accordance with the forestry standard LY/T 1237 and previous studies [26].
The survey included 322 arbor forest plots and 322 shrubland plots. Litter samples were collected from all plots (N = 322), while soil samples for SOC analysis were obtained from a subset of plots (N = 84).
(4)
Biomass and Carbon Stock Estimation
(i)
Aboveground and Belowground Biomass and Carbon Stocks of Arbor Forests
B a f = B a f p l o t × α = B a f i × α
B a f i = B a f A G + B a f B G = V a f i × B E F a f i × D a f i + B a f A G × R a f i
C D a f = B a f × θ a f = B a f i × θ a f i × α
where: Baf denotes the biomass density of arbor forests (Mg ha−1), and Bafplotv represents the biomass density at the plot level (Mg m−2). α is the unit conversion coefficient. Bafi (dry matter mass, Mg DM) denotes the biomass of species i (the same notation applies hereafter). BafAG and BafBG represent aboveground and belowground biomass densities (Mg m−2), respectively. Vafi denotes stand volume (m3), BEFafi is the biomass expansion factor, Dafi represents wood density (Mg DM m−3), and Rafi is the root–shoot ratio (i.e., the ratio of belowground to aboveground biomass). CDaf denotes carbon density (Mg C ha−1), and θafi represents the carbon fraction. The values of BEF, D, R, and θ were obtained from the 2006 IPCC Guidelines for National Greenhouse Gas Inventories [24].
(ii)
Aboveground and Belowground Biomass and Carbon Stocks of Shrublands
B s l = B s l p l o t N s l p l o t × A s l p l o t × β
B s l p l o t = B s l A G + B s l B G = B s + B b + B l + B r
C D s l = B s l × θ s l
where: Bsl denotes the biomass density of shrublands (Mg ha−1), and Bslplot represents the biomass density at the plot level (Mg m−2). Nslplot is the number of subplots, and Aslplot is the area of each subplot (m2). β is the unit conversion coefficient. Bs, Bb, Bl, and Br represent the biomass (dry matter mass) of shrub stems, branches, leaves, and roots, respectively. CDsl denotes carbon density (Mg C ha−1), and θsl represents the carbon fraction, with a default value of 0.49.
(iii)
Litter Biomass and Carbon Stocks
B l i = B l i p l o t N l i p l o t × A l i p l o t × γ
B l i p l o t = D T F × W p l o t f r e s h
C D l i = B l i × θ l i
where: Bli denotes the biomass density of litter (Mg ha−1), and Bliplot represents the biomass density at the plot level (Mg m−2). Nliplot is the number of subplots, and Aliplot is the area of each subplot (m2). γ is the unit conversion coefficient. DTF represents the dry-to-fresh mass ratio of the sample, and Wplotfresh is the total fresh mass of litter collected within the subplot (g). CDli denotes carbon density (Mg C ha−1), and θli represents the carbon fraction, with values derived from the 2006 IPCC Guidelines for National Greenhouse Gas Inventories [24].
(iv)
Soil Organic Carbon Stocks
C D s o i l = C O T × B D × D E × 1 G / 10
where: CDsoil denotes soil organic carbon density (Mg C ha−1), COT represents soil organic carbon content (g C kg−1), BD is soil bulk density (g cm−3), DE is soil depth (cm), and G is the volumetric percentage of gravel with a diameter > 2 mm.
(5)
Carbon storage estimation
Given the scattered distribution of sampling sites, statistical analyses of carbon storage were conducted at the municipal scale for the period 1990–2023. The calculation formula is as follows:
C i = D i A i
where: Ci represents the carbon storage of type i (e.g., soil organic carbon storage) (kg), Di denotes the carbon density of type i (kg m−2), and Ai is the area of land use type i (m2).
To estimate carbon storage for the pre-baseline period (1990–2011), a backcasting approach was applied. Carbon density coefficients derived from the 2012 field survey were assumed to remain constant over time and combined with historical land-use data to reconstruct carbon storage dynamics. This approach follows IPCC Tier 1 methods and relies on a static carbon density assumption without explicitly incorporating temporal variations in forest structural attributes.

2.2.2. Two-Way Fixed Effects Model

The two-way fixed effects model is a core econometric method in panel data analysis [27]. It is mainly used to address situations where both individual heterogeneity (such as inherent differences among regions or sample units) and temporal heterogeneity (such as macro-environmental changes across years or periods) exist [28]. By controlling for these two types of unobserved fixed effects, the model can more accurately identify the causal relationship or the strength of association between independent and dependent variables [29]. Considering the specific characteristics of the carbon density data in this study, which contain both temporal and municipal dimensions, the two-way fixed effects model was applied to determine the influence of NDVI, precipitation, temperature, and the nighttime light index on changes in carbon storage. In addition, to verify the robustness of the effects of key explanatory variables, multiple regression specifications were conducted to compare the consistency of the results. The mathematical expression of the two-way fixed effects model is as follows:
Y i t = β 0 + β 1 X 1 i t + β 2 X 2 i t + + β k X k i t + α i + γ t + ε i t
where: Yit represents the value of the dependent variable for individual i at time t; β0 is the constant term, indicating the baseline level of carbon storage across all regions and years; Xkit denotes the value of the k-th explanatory variable for individual i at time t; βk reflects the marginal effect of X on Y; αi represents the individual fixed effect, which does not vary over time; γt represents the time fixed effect, which does not vary across individuals; and εit is the random error term.

2.2.3. Model Diagnostics and Validation

To ensure the robustness of the econometric model, several diagnostic tests were conducted. The Hausman test fails to reject the null hypothesis (χ2 = 1.254, p = 0.869), indicating that there is no systematic difference between the fixed effects and random effects estimators. Despite this result, a two-way fixed effects model is adopted in this study. This is because the analysis aims to control for unobserved heterogeneity across regions and over time, which may be correlated with the explanatory variables [30]. In the context of forest carbon dynamics, region-specific characteristics (such as topography and ecological conditions) and time-specific factors (such as climate variability and policy interventions) are difficult to fully observe but are likely to influence both carbon storage and its drivers. The fixed effects specification is therefore more appropriate for controlling such unobserved factors.
The Wooldridge test indicates significant serial correlation in the panel data (χ2 = 167.35, p < 0.001). To address this issue, cluster-robust standard errors are initially applied in all regression models. However, given the relatively small number of cross-sectional units at the municipal level (N ≈ 10), conventional cluster-robust inference may be unreliable [31]. Therefore, we additionally employ Driscoll–Kraay standard errors, which are robust to heteroskedasticity, serial correlation, and cross-sectional dependence, and are particularly suitable for panel datasets with a limited number of clusters. The consistency of results across different standard error estimators confirms the robustness of the empirical findings. Furthermore, Global Moran’s I was calculated using ArcGIS 10.8 (Esri, Redlands, CA, USA; https://www.esri.com/ (accessed on 9 April 2026)). to test for spatial autocorrelation in the data, based on a contiguity-based spatial weight matrix (Queen criterion).

2.3. Data Resources

The NDVI data for the period 1990–2023 were obtained from the Resource and Environmental Science Data Platform (https://www.resdc.cn/ (accessed on 9 April 2026)) with a spatial resolution of 30 m. The DEM data were sourced from the Geospatial Data Cloud Platform (https://www.gscloud.cn/ (accessed on 9 April 2026)) with a resolution of 30 m. Land use data from 1990 to 2022 were obtained from the ZENODO repository (https://zenodo.org/records/15853565 (accessed on 9 April 2026)), with a spatial resolution of 30 m [32]. Precipitation and temperature data were acquired from the National Tibetan Plateau Data Center (https://www.tpdc.ac.cn/ (accessed on 9 April 2026)) with a spatial resolution of 1 km, while the nighttime light index data were obtained from the National Earth System Science Data Center (https://www.geodata.cn/ (accessed on 9 April 2026)) with a resolution of 500 m. Before analysis, all datasets were resampled to a uniform spatial resolution of 1 km to ensure consistency in subsequent calculations. All climate variables (temperature and precipitation) were aggregated to annual values.

3. Results

3.1. The Changing Trend of Forest NDVI Since the Implementation of the Grain-for-Green Program

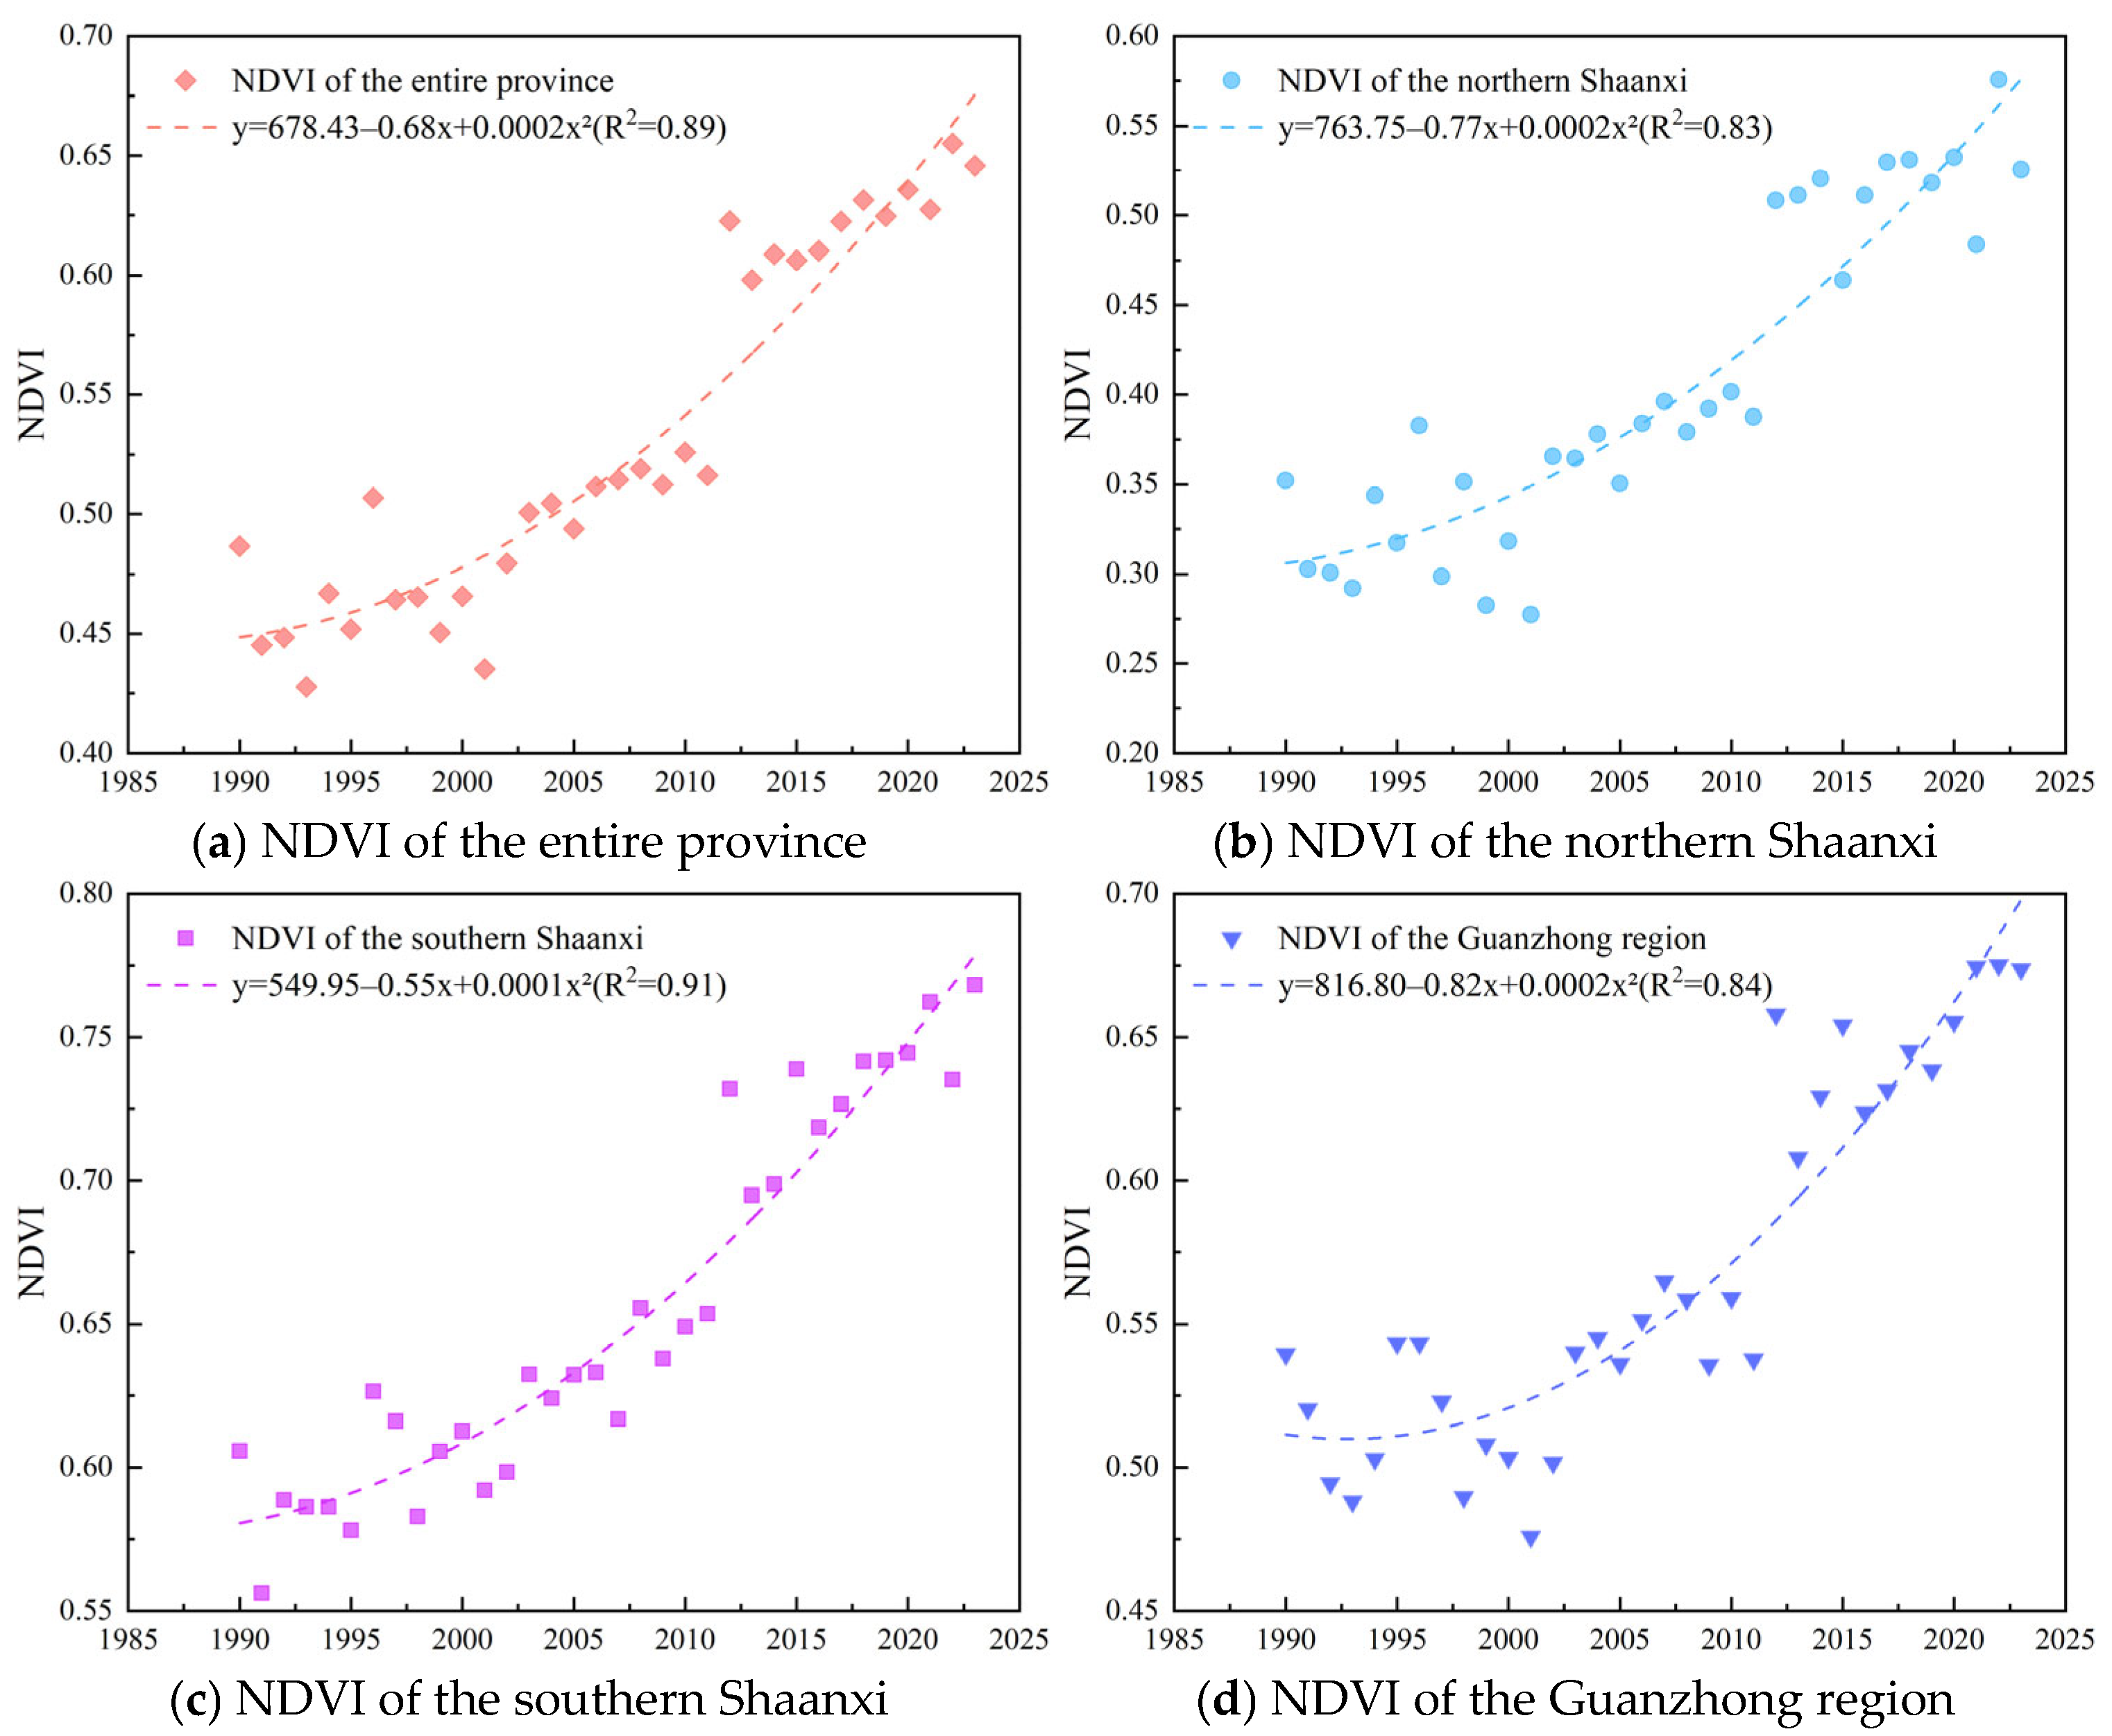
Figure 4 shows the temporal dynamics of NDVI in Shaanxi Province and its three subregions from 1990 to 2023. At the provincial scale, NDVI exhibited a significant increasing trend, suggesting continuous improvement in vegetation conditions. Among the subregions, southern Shaanxi maintained the highest NDVI values, with a multi-year mean of 0.66 and a marked upward trajectory, reflecting favorable climatic conditions and dense forest cover. Northern Shaanxi recorded the lowest NDVI values (mean = 0.41); however, it experienced the most substantial increase over time, indicating intensive vegetation restoration efforts in this ecologically fragile area. The Guanzhong Plain showed a moderate level (mean = 0.57) with a steady increase, positioned between the two extremes.
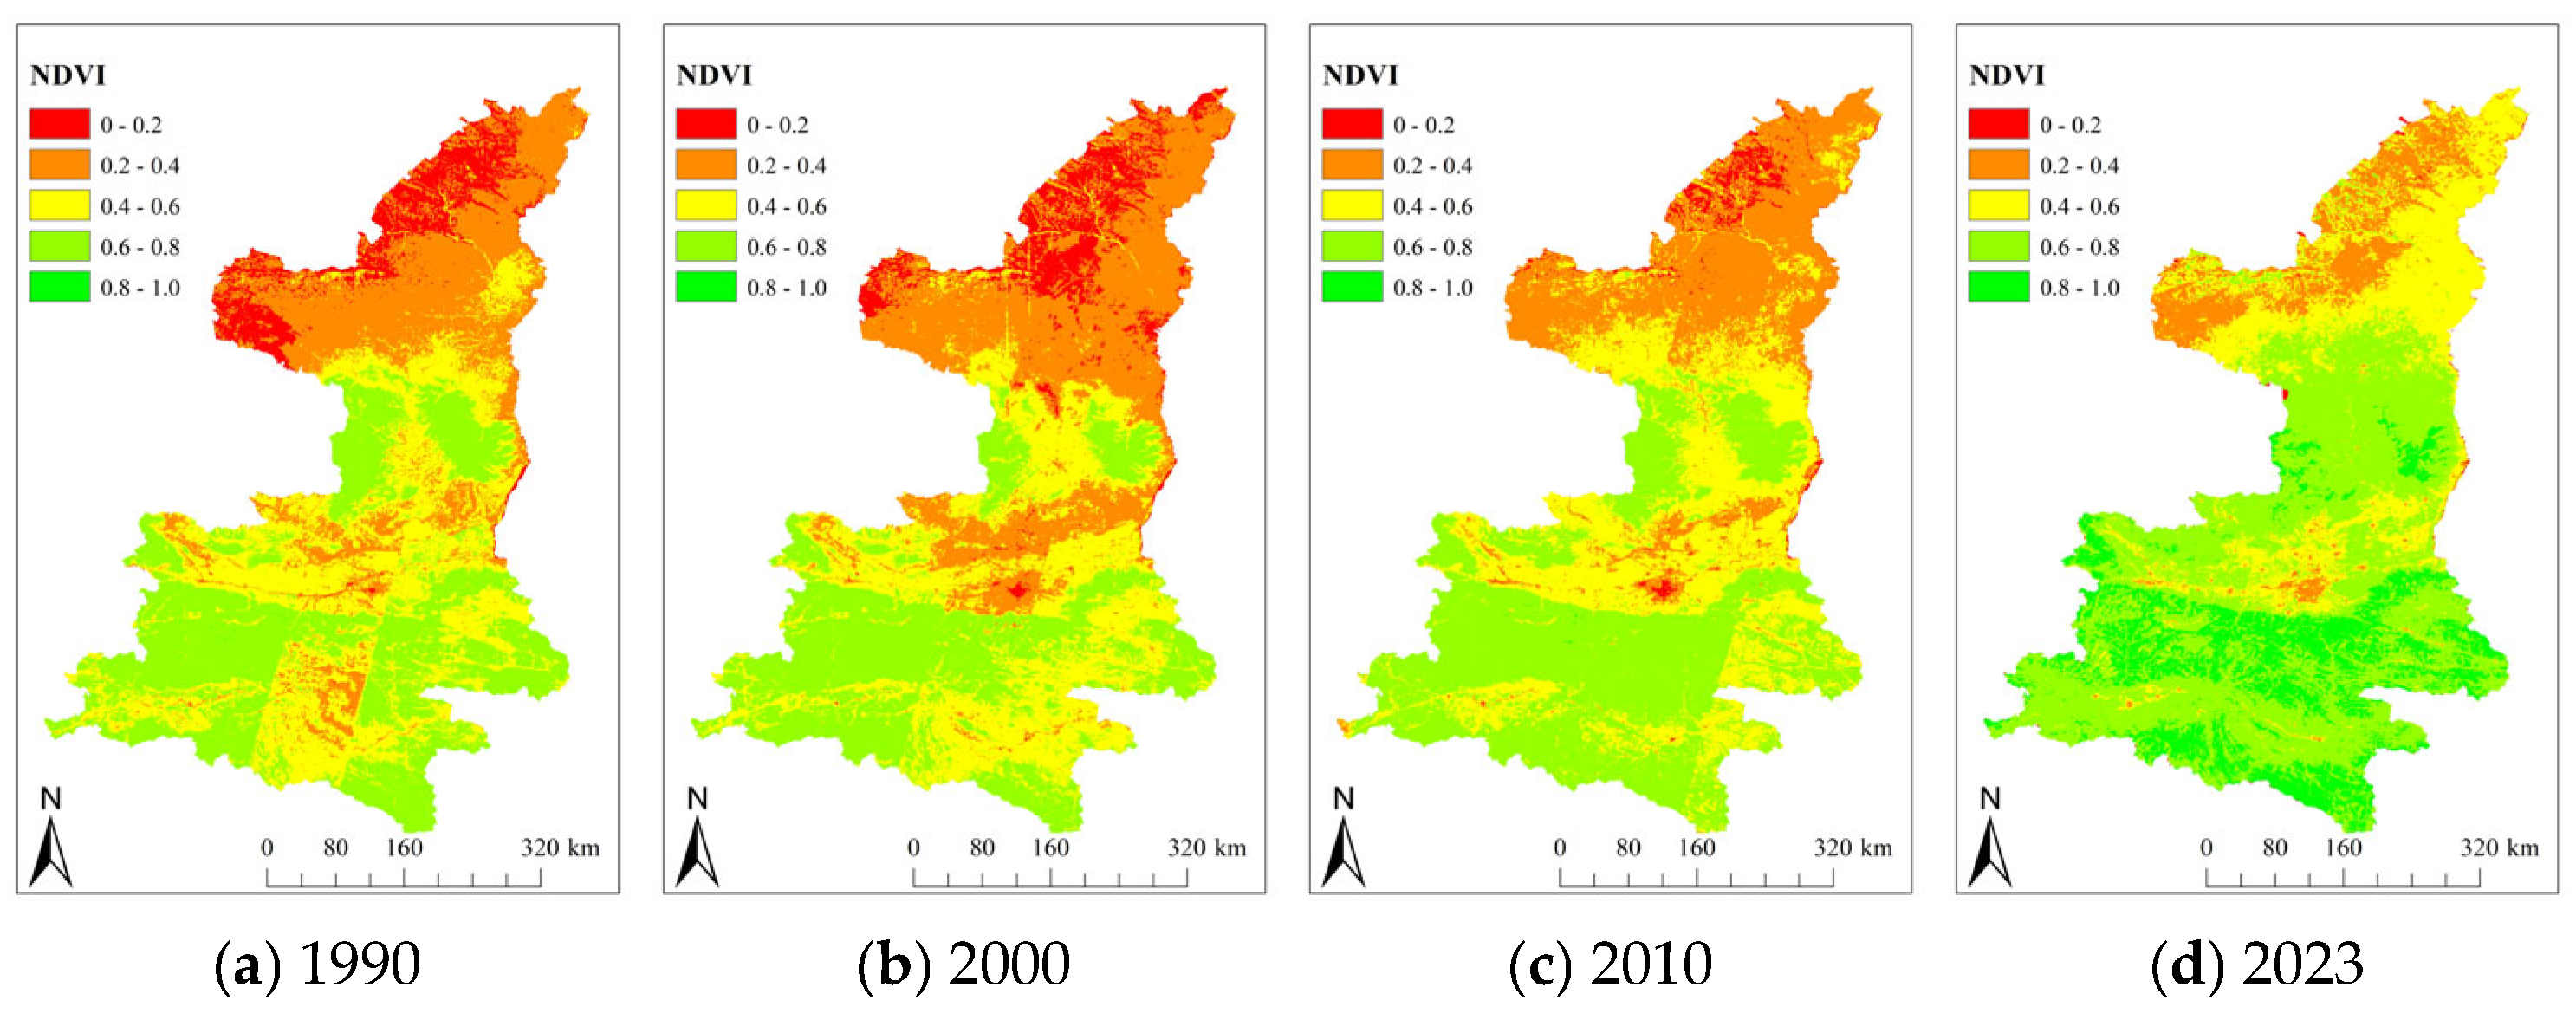
In addition to these temporal patterns, the spatial distribution of NDVI further reveals distinct regional heterogeneity (Figure 5). The Loess Plateau in the north was dominated by low NDVI values (0.2–0.4), the Guanzhong Plain exhibited moderate values (0.4–0.6), and the Qinba Mountains in the south consistently showed high values (>0.6), reflecting dense forest cover and relatively stable ecosystems. From Figure 4a–d, NDVI improved significantly over time, with high-value areas expanding and low-value areas contracting, particularly in northern Shaanxi, where vegetation recovery was most pronounced.

3.2. Variation Characteristics of Carbon Storage

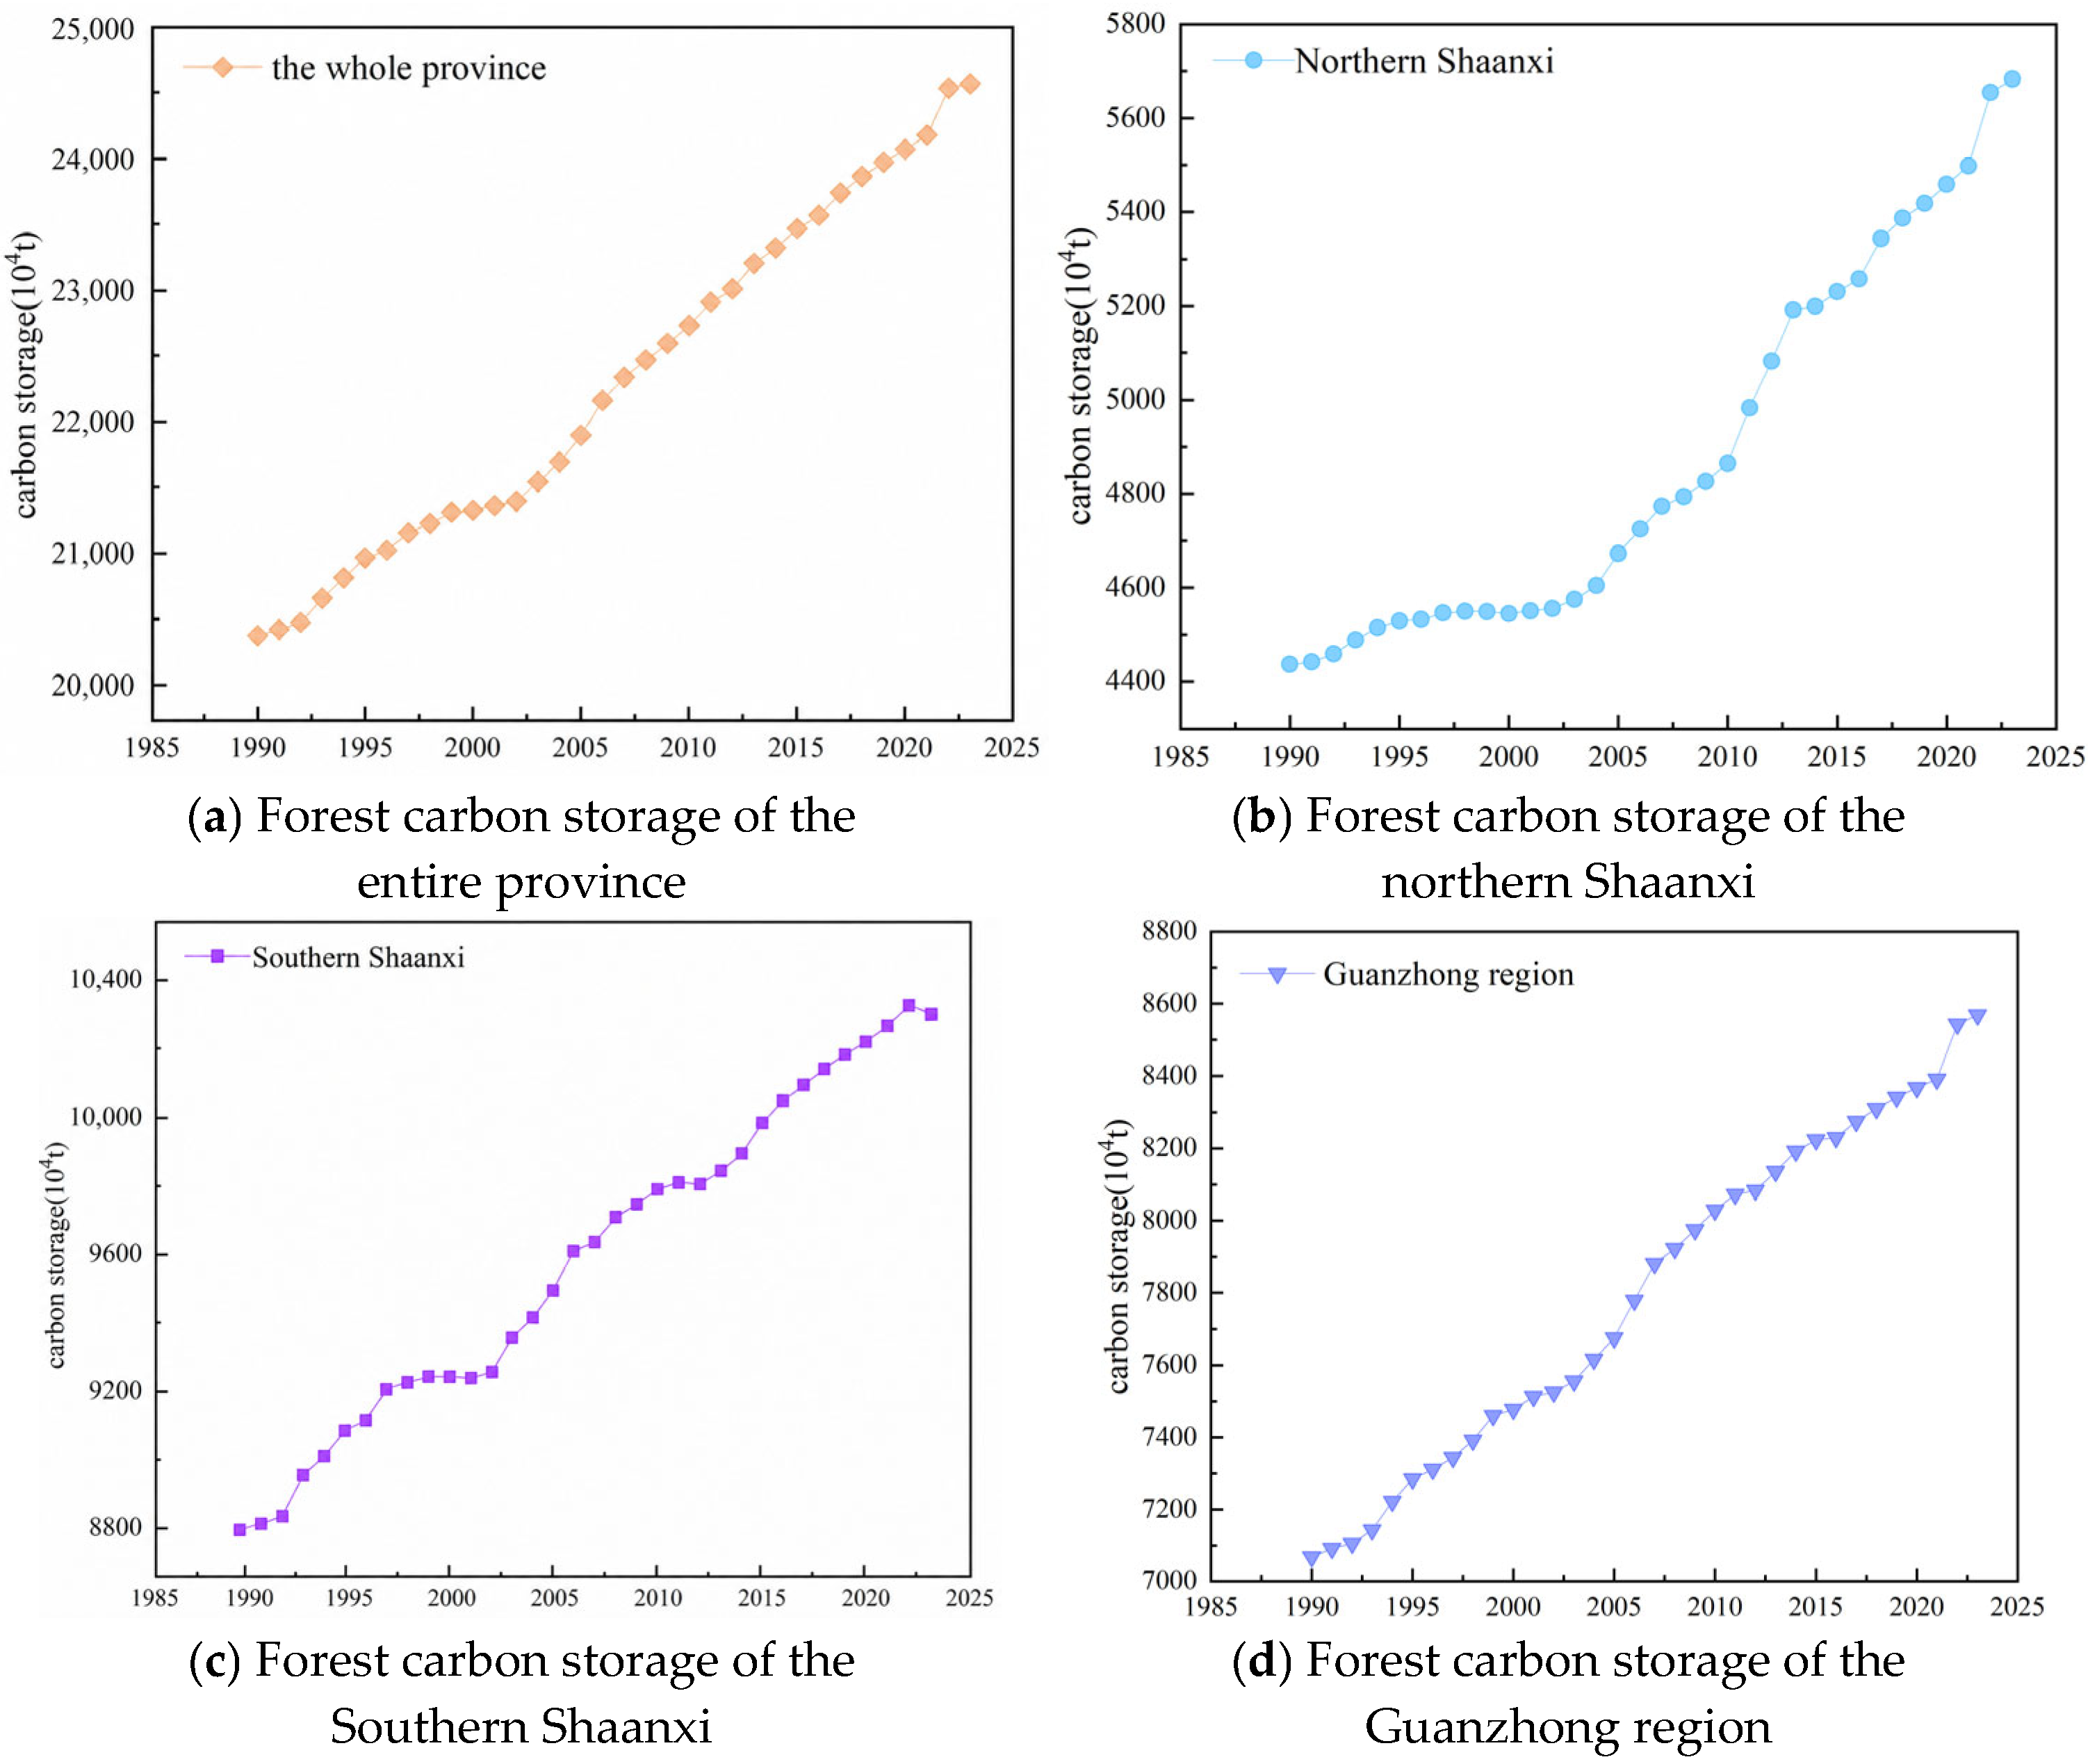
Forest carbon storage in this study refers to the total carbon pool, including aboveground biomass, belowground biomass, litter, and soil organic carbon (SOC). Figure 6 illustrates the temporal trends of forest carbon storage in Shaanxi Province and its three subregions from 1990 to 2023. Overall, the provincial forest carbon storage exhibited a significant upward trend, with an increase of 4.27 × 10⁷ t over the 34-year period, corresponding to a growth rate of 21.04%. At the subregional scale, Southern Shaanxi consistently maintained the highest carbon storage, with a multi-year average of 9.56 × 10⁷ t, and an increase of 1.52 × 10⁷ t during the study period. The Guanzhong region showed an intermediate level of carbon storage (multi-year average of 7.80 × 10⁷ t), also displaying a steady upward trend with a total increase of 1.50 × 10⁷ t. In northern Shaanxi, carbon storage increased more markedly before 2005, rising by 2.36 × 10⁶ t during 1990–2005, followed by an increase of 1.01 × 10⁷ t during 2005–2023, with a multi-year average of only 4.88 × 10⁷ t.

3.3. Analysis of the Driving Mechanism of Carbon Storage Change

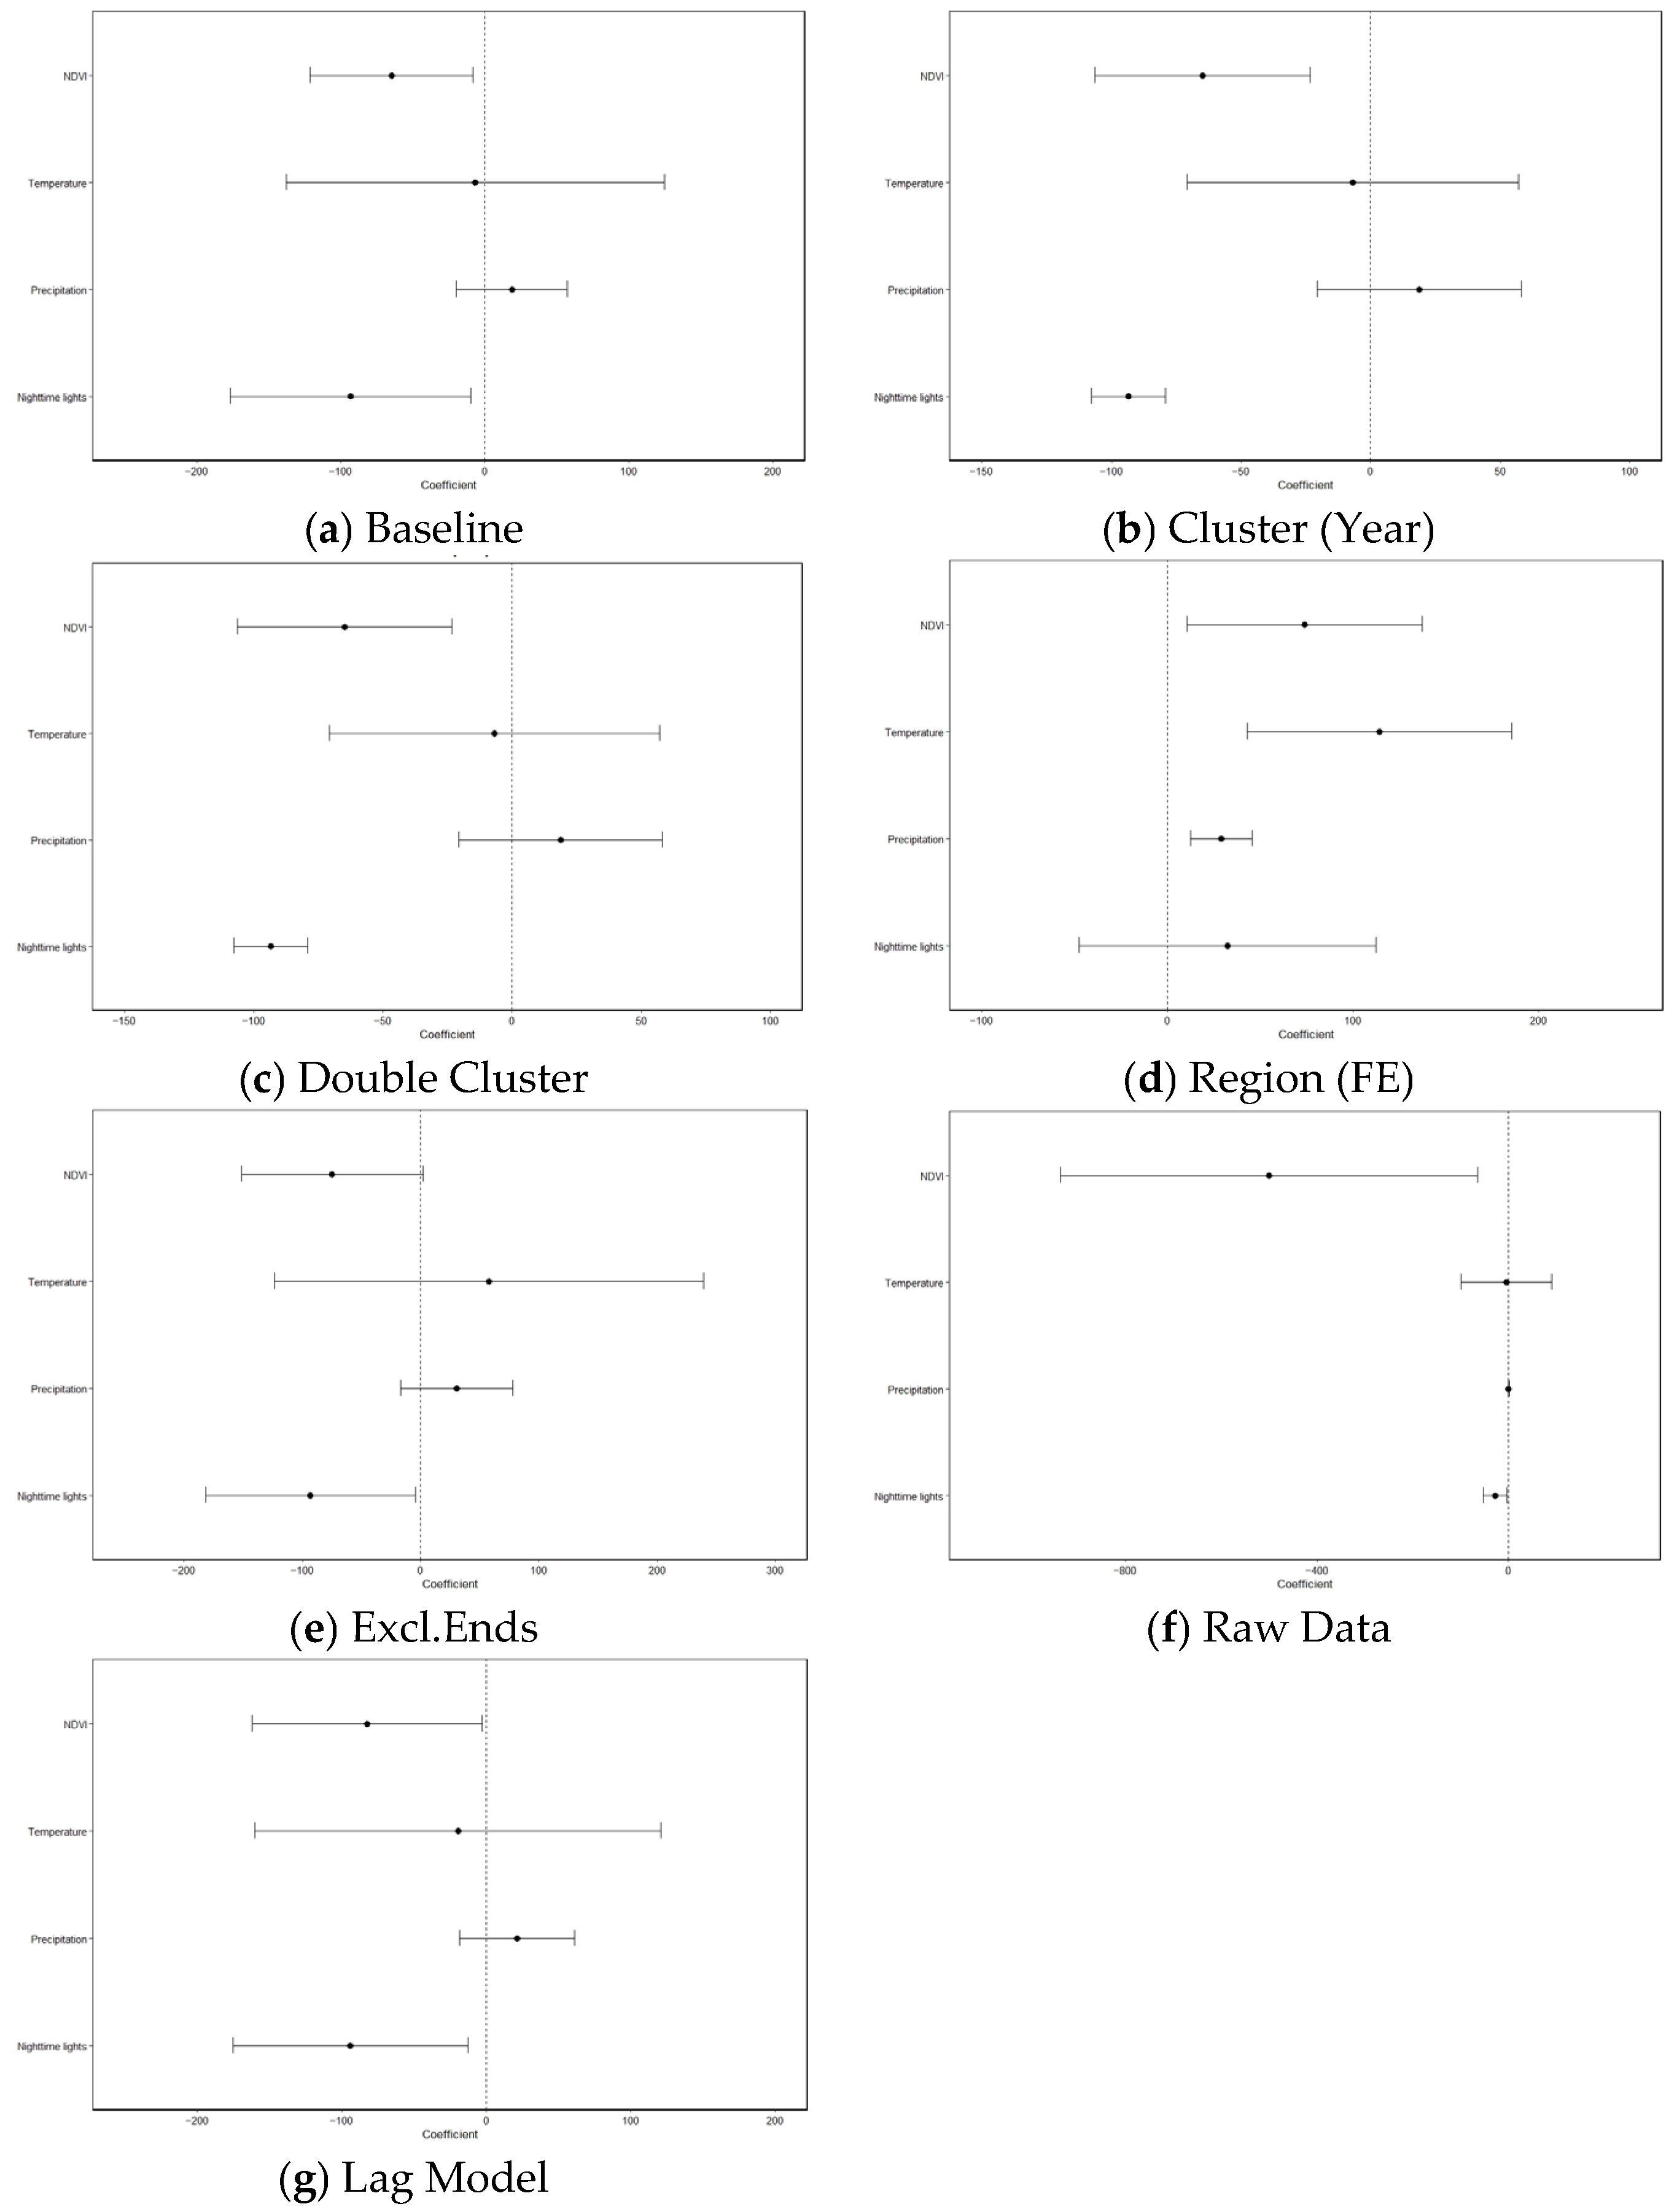
The estimation results of the two-way fixed effects model and a series of robustness checks are presented in Table 1, while Figure 7 provides a visual summary of the coefficient estimates across different model specifications using a coefficient plot. Regional carbon storage is used as the dependent variable, with NDVI, temperature, precipitation, and nighttime lights (night) as the main explanatory variables. Variance Inflation Factor (VIF) analysis indicates no serious multicollinearity (all VIF < 2). The slope variable is excluded due to perfect collinearity with the fixed effects. The benchmark model controls for both region and year fixed effects with cluster-robust standard errors. To further ensure the reliability of statistical inference given the limited number of cross-sectional units, Driscoll–Kraay standard errors are additionally applied, which are robust to heteroskedasticity, serial correlation, and cross-sectional dependence. The results remain consistent under this specification.
To further examine potential spatial dependence, a Global Moran’s I test was conducted. The results indicate no significant spatial autocorrelation (I = −0.333, Z = −1.25, p = 0.211), suggesting that the spatial distribution of carbon storage does not exhibit significant clustering or dispersion across municipalities.
Overall, the coefficient plot clearly illustrates the stability and variability of the estimated effects. Nighttime lights consistently exhibit a significantly negative effect on carbon storage (−29.69 to −98.83), confirming the robustness of this relationship across specifications. NDVI is generally negative and insignificant (−84.04 to −77.28), but becomes positive (106.8) and nearly significant when only regional fixed effects are included (Model 4), indicating sensitivity to model specification. This variation in coefficient sign and significance across model specifications suggests a degree of instability in the estimated relationships, particularly for NDVI and climatic variables.
Temperature and precipitation are insignificant in models with year fixed effects, yet both turn significantly positive in Model 4. This pattern is also evident in Figure 7, where their coefficients shift direction and significance when year effects are excluded, suggesting potential confounding effects related to temporal variation. The lagged NDVI (Model 7) is negative but insignificant (−30.17), implying limited persistence in vegetation effects on carbon storage.
All models exhibit high overall explanatory power (R2 > 0.99), while the within R2 remains relatively low (~0.09), except in Model 4 (0.322). This discrepancy arises from the nature of the two-way fixed effects specification. The high overall R2 largely reflects the strong explanatory power of the region and year fixed effects, which capture substantial cross-regional heterogeneity and common temporal trends in forest carbon storage.
In contrast, the within R2 measures the extent to which the explanatory variables account for variation within regions over time. Its relatively low value indicates that NDVI, climatic variables, and nighttime lights explain only a limited portion of the year-to-year variation in carbon storage. This is consistent with the ecological characteristics of forest carbon dynamics, which typically evolve gradually and are dominated by long-term processes rather than short-term fluctuations.

4. Discussion

4.1. Vegetation Restoration and Changes in Estimated Carbon Storage

Based on long-term NDVI and carbon storage observations from 1990 to 2023, forest ecosystems in Shaanxi Province have experienced significant vegetation recovery and a sustained increase in carbon storage, indicating the long-term effectiveness of the Grain-for-Green Program and associated ecological restoration initiatives [33]. The consistent upward trend in NDVI at the provincial scale confirms continuous improvement in vegetation cover and photosynthetic activity, which is consistent with previous findings for the Loess Plateau and other ecologically fragile regions of northern China [34,35,36].
Spatially, the magnitude of NDVI improvement exhibits pronounced regional heterogeneity. Northern Shaanxi, characterized by severe soil erosion, water scarcity, and historically low vegetation cover, experienced the most substantial NDVI increase despite maintaining the lowest absolute NDVI values. This pattern reflects the strong marginal response of degraded ecosystems to afforestation, grassland restoration, and soil conservation measures [37]. In contrast, southern Shaanxi, dominated by the Qinba Mountains with favorable hydrothermal conditions and mature forest ecosystems, maintained consistently high NDVI levels with a relatively moderate growth rate, suggesting that vegetation conditions in this region were already near their ecological potential.
Although estimated forest carbon storage increased during the study period, its growth rate was notably lower than that of NDVI, particularly in northern Shaanxi. This discrepancy highlights a fundamental difference in ecosystem response pathways: NDVI responds rapidly to vegetation greening and canopy closure, whereas changes in forest carbon storage are generally influenced by slower processes such as biomass increment, forest structural development, and soil organic carbon changes [38,39]. Similar time-lag effects between vegetation indices and carbon sinks have been reported across the Loess Plateau, reinforcing the notion that ecological restoration first manifests as surface greening before gradually translating into stable carbon sequestration.

4.2. Inconsistent Responses of NDVI and Forest Carbon Storage

Although NDVI is widely used as a proxy for vegetation productivity [40], the regression results indicate that NDVI does not exhibit a stable or significant positive relationship with forest carbon storage after controlling for regional and temporal fixed effects. In most model specifications, NDVI shows a negative and insignificant coefficient, and this pattern remains even when lagged NDVI is introduced. Only when year fixed effects are excluded does NDVI become marginally significant, suggesting that its apparent influence is sensitive to unobserved temporal variability. This instability indicates that the observed relationship should be interpreted as an association rather than a stable causal effect.
Several factors may explain this inconsistency. One key reason is that NDVI is subject to well-known saturation effects in dense vegetation, where increases in biomass are no longer effectively captured by spectral signals. Another explanation is that NDVI primarily reflects short-term vegetation greenness and photosynthetic activity, which can be strongly influenced by climatic variability and phenological dynamics [41]. In addition, forest carbon storage is a cumulative stock variable determined by forest age structure, species composition, and stand density [42]. For example, young plantations or recently restored forests may exhibit high NDVI but still store limited biomass carbon. Moreover, management practices such as thinning, harvesting, or ecological restoration interventions may further weaken the correspondence between NDVI signals and forest carbon storage estimates.
It should also be noted that the observed relationship between NDVI and carbon storage may be influenced by the carbon accounting framework adopted in this study. Specifically, carbon storage is estimated based on a static carbon density assumption combined with land-use area changes, which does not explicitly capture biological carbon accumulation processes. As a result, the apparent mismatch between vegetation greenness and carbon storage may partly reflect methodological constraints rather than a direct biophysical decoupling.
Taken together, both ecological factors and methodological constraints may contribute to the observed mismatch between NDVI and carbon storage. These findings suggest that relying solely on NDVI-based indicators to assess forest carbon sink capacity may lead to potentially biased interpretations, particularly in regions undergoing rapid ecological restoration. Integrating remote sensing indicators with inventory-based biomass estimates and soil carbon observations is therefore essential for accurately capturing long-term carbon dynamics [43,44].

4.3. Human Pressure Outweighs Climatic Controls on Forest Carbon Storage

The two-way fixed effects model reveals that climatic factors and human activities are associated with variations in forest carbon storage in Shaanxi Province, though their effects differ substantially in direction and robustness. Temperature and precipitation exhibit positive effects on carbon storage only in models without year fixed effects, indicating that favorable climatic conditions may support forest growth and biomass development at the spatial scale [45,46], but their explanatory power is largely absorbed by interannual variability when temporal fixed effects are included. This result implies that climate acts as a background constraint on forest carbon sequestration rather than a dominant driver of long-term spatial differences within the province.
In contrast, nighttime light intensity consistently shows a significant negative effect on forest carbon storage across most model specifications, highlighting the persistent inhibitory role of urbanization and intensified human activities [47,48]. Nighttime lights serve as an effective proxy for land-use intensity, infrastructure expansion, and socio-economic development, all of which tend to encroach upon forest land, fragment habitats, and affect forest carbon storage patterns. The robustness of this negative relationship underscores a clear spatial trade-off between economic development and forest carbon sink capacity.
To further assess the potential influence of spatial dependence, a Global Moran’s I test was conducted. The results indicate that spatial autocorrelation is not statistically significant, suggesting that the regression estimates are unlikely to be substantially biased by spatial dependence at the municipal scale.
Notably, the low within R2 values in most models suggest that short-term fluctuations in carbon storage are difficult to explain using conventional explanatory variables alone, reflecting the inherent inertia and path dependence of forest carbon dynamics. This further supports the argument that forest carbon storage changes are governed by long-term ecological processes rather than immediate vegetation greening or short-term socio-economic changes [49]. At the same time, it suggests that additional factors beyond the current model specification may also contribute to the temporal variation in carbon storage.

4.4. Limitations and Expectations

This study develops a land-use-based carbon accounting framework combined with long-term remote sensing data and a two-way fixed effects model to investigate forest carbon storage dynamics in Shaanxi Province from 1990 to 2023. By integrating field-based carbon measurements (baseline year: 2012) with time-series data, the study provides a consistent basis for examining the relationship between vegetation greening and carbon sequestration at the regional scale. Nevertheless, several limitations should be acknowledged.
One limitation lies in the assumption of constant carbon density parameters when reconstructing historical carbon storage. Although this assumption is consistent with widely adopted approaches in large-scale carbon accounting (e.g., IPCC Tier 1 methods), it does not explicitly capture temporal variations in forest structure, such as stand age, succession, and growth dynamics. This may introduce uncertainties in the estimation of long-term carbon storage changes, particularly when interpreting the observed mismatch between vegetation greenness and carbon storage. In addition, the soil organic carbon (SOC) dataset is derived from a relatively limited number of sampling points (N = 84) across a large spatial extent. Although the data follow standardized field and laboratory protocols, the spatial interpolation process may introduce considerable uncertainty that is not explicitly quantified in this study.
Another limitation concerns the relatively limited set of explanatory variables. Important factors, including forest type, stand age, local ecological policies, and silvicultural interventions, are not explicitly incorporated into the model. These variables are known to influence biomass accumulation and carbon dynamics and may partly explain the weak and unstable relationship observed between NDVI and carbon storage. Their exclusion is mainly due to the lack of consistent, long-term, and spatially explicit datasets at the regional scale.
In addition, the analysis is conducted at the municipal scale due to the constraints of the inventory-based carbon accounting framework. While this ensures consistency with IPCC guidelines, it limits the spatial resolution of the study. The relatively small number of cross-sectional units may affect the precision of statistical inference and obscure fine-scale heterogeneity in topography and climate. Therefore, the results should be interpreted as reflecting broad regional patterns rather than local-scale processes.
Despite these limitations, the proposed framework effectively captures the dominant drivers of carbon storage dynamics at the municipal scale, particularly land-use change and broad environmental conditions. The finding that vegetation greening does not necessarily correspond to proportional increases in estimated carbon storage should therefore be interpreted within these constraints. Future research could incorporate dynamic carbon density parameters, as well as more detailed information on forest structure and management practices, to better elucidate the mechanisms linking vegetation dynamics and forest carbon storage changes. In addition, the long-term carbon storage trajectories could be further validated using independent satellite-based biomass products (e.g., GEDI or ESA CCI), which may offer complementary insights into large-scale carbon dynamics.

5. Conclusions

This study developed an integrated framework combining long-term satellite monitoring and econometric modeling to investigate forest carbon dynamics in Shaanxi Province from 1990 to 2023. Using NDVI time series, climate data, and socioeconomic indicators, a two-way fixed effects model was applied to disentangle the relative influences of climatic and anthropogenic factors on forest carbon storage. The main conclusions are as follows:
(1)
Forest NDVI and carbon storage have both increased significantly over the past three decades, suggesting the long-term vegetation restoration effects of the Grain-for-Green Program and related restoration initiatives.
(2)
The weak correlation between NDVI and carbon storage suggests a potential mismatch between vegetation greenness and estimated carbon storage, which may reflect both ecological processes (e.g., temporal lags) and methodological constraints related to the static carbon density assumption.
(3)
Climatic conditions (temperature and precipitation) are positively associated with estimated carbon storage only under some model specifications, while human activities represented by nighttime light intensity are negatively associated with carbon storage, indicating trade-offs between economic growth and ecological function.

Author Contributions

Conceptualization, H.Q. and Y.X.; Methodology, B.W.; Software, J.P.; Validation, X.L. and W.W.; Data Curation, R.S.; Writing—Original Draft Preparation, H.Q.; Writing—Review & Editing, P.D.; Visualization, H.L. and X.W. All authors have read and agreed to the published version of the manuscript.

Funding

This research was supported by the Scientific Research Program of Shaanxi Provincial Education Department (Grant No. 24JP122).

Data Availability Statement

Dataset available on request from the authors.

Conflicts of Interest

The authors declare no conflicts of interest.

References

  1. Ofoegbu, C.; Speranza, C.I. Discourses on sustainable forest management and their integration into climate policies in South Africa. Int. For. Rev. 2021, 23, 168–181. [Google Scholar] [CrossRef]
  2. Tiemann, A.; Ring, I. Towards ecosystem service assessment: Developing biophysical indicators for forest ecosystem services. Ecol. Indic. 2022, 137, 108704. [Google Scholar] [CrossRef]
  3. Zhao, J.F.; Ai, J.L.; Zhu, Y.J.; Huang, R.X.; Peng, H.W.; Xie, H.F. Carbon budget of different forests in China estimated by an individual-based model and remote sensing. PLoS ONE 2023, 18, e0285790. [Google Scholar] [CrossRef]
  4. Zhu, M.; Zhou, Z.F.; Wu, X.P.; Wan, J.X.; Wang, J.L.; Zheng, J.J.; Liu, R.P.; Li, F.D. Prediction and spillover effects of forest expansion and management to increase carbon sinks in karst mountainous areas: A case study in Guizhou, China. Land Use Policy 2025, 151, 107491. [Google Scholar] [CrossRef]
  5. Yamamoto, Y.; Matsumoto, K.I. The effect of forest certification on conservation and sustainable forest management. J. Clean. Prod. 2022, 363, 132374. [Google Scholar] [CrossRef]
  6. Huang, Q.; Xie, Y.; Zhang, X.B. The Demographic Transition and Rural Industrialization in China. Econ. Dev. Cult. Change 2024, 72, 1863–1892. [Google Scholar] [CrossRef] [PubMed]
  7. Kong, X.L.; Kong, F.B.; Li, Y.L.; Sun, J.X.; Zhu, W.J.; Han, M. Assessment of coastal landscape fragmentation and its driving factors based on optimal scale: A case study of the Yellow River Delta, China. Ecol. Indic. 2024, 166, 112537. [Google Scholar] [CrossRef]
  8. Ge, L.B.; Mei, X.M.; Ping, J.H.; Liu, E.R.; Xie, J.W.; Feng, J.W. Identification of suitable vegetation restoration areas and carrying capacity thresholds on the Loess Plateau. J. Environ. Manag. 2025, 373, 123660. [Google Scholar] [CrossRef] [PubMed]
  9. Deng, L.; Liu, S.G.; Kim, D.G.; Peng, C.H.; Sweeney, S.; Shangguan, Z.P. Past and future carbon sequestration benefits of China’s grain for green program. Glob. Environ. Change Hum. Policy Dimens. 2017, 47, 13–20. [Google Scholar] [CrossRef]
  10. Wang, Y.F.; Liu, L.; Shangguan, Z.P. Carbon storage and carbon sequestration potential under the Grain for Green Program in Henan Province, China. Ecol. Eng. 2017, 100, 147–156. [Google Scholar] [CrossRef]
  11. Li, G.; Li, G.; Li, G.; Sun, S.; Sun, S.; Sun, S.; Han, J.; Han, J.; Han, J.; Yan, J. Impacts of Chinese Grain for Green program and climate change on vegetation in the Loess Plateau during 1982–2015. Sci. Total Environ. 2019, 660, 177–187. [Google Scholar] [CrossRef]
  12. Jian, S.Q.; Zhang, Q.K.; Wang, H.L. Spatial-Temporal Trends in and Attribution Analysis of Vegetation Change in the Yellow River Basin, China. Remote Sens. 2022, 14, 4607. [Google Scholar] [CrossRef]
  13. Wang, T.; Yang, M.H. Land Use and Land Cover Change in China’s Loess Plateau: The Impacts of Climate Change, Urban Expansion and Grain for Green Project Implementation. Appl. Ecol. Environ. Res. 2018, 16, 4145–4163. [Google Scholar] [CrossRef]
  14. Zhu, Z.Y.; Mei, Z.K.; Xu, X.Y.; Feng, Y.Z.; Ren, G.X. Landscape Ecological Risk Assessment Based on Land Use Change in the Yellow River Basin of Shaanxi, China. Int. J. Environ. Res. Public Health 2022, 19, 9547. [Google Scholar] [CrossRef]
  15. Li, K.; Zhang, B.Y. Spatial and Temporal Evolution of Ecosystem Service Value in Shaanxi Province against the Backdrop of Grain for Green. Forests 2022, 13, 1146. [Google Scholar] [CrossRef]
  16. Chen, X.J.; Gong, Z.W.; Huang, H.Y. The effect of the grain for green program on regional carbon sinks-empirical analysis based on PSM-DID model. Landsc. Ecol. Eng. 2025, 22, 19–35. [Google Scholar] [CrossRef]
  17. Wang, K.; She, D.Q.; Zhang, X.T.; Wang, Y.Y.; Wen, H.; Yu, J.H.; Wang, Q.G.; Han, S.J.; Wang, W.J. Tree richness increased biomass carbon sequestration and ecosystem stability of temperate forests in China: Interacted factors and implications. J. Environ. Manag. 2024, 368, 122214. [Google Scholar] [CrossRef] [PubMed]
  18. Wu, S.N.; Li, J.Q.; Zhou, W.M.; Lewis, B.J.; Yu, D.P.; Zhou, L.; Jiang, L.H.; Dai, L.M. A statistical analysis of spatiotemporal variations and determinant factors of forest carbon storage under China’s Natural Forest Protection Program. J. For. Res. 2018, 29, 415–424. [Google Scholar] [CrossRef]
  19. Wang, S.; Feng, H.; Zou, B.; Yang, Z.; Wang, S. Vegetation Greening Enhanced the Regional Terrestrial Carbon Uptake in the Dongting Lake Basin of China. Forests 2023, 14, 768. [Google Scholar] [CrossRef]
  20. He, Z.; Lei, L.; Zeng, Z.; Sheng, M.; Welp, L.R. Evidence of Carbon Uptake Associated with Vegetation Greening Trends in Eastern China. Remote Sens. 2020, 12, 718. [Google Scholar] [CrossRef]
  21. Li, Y.L.; He, Y.; Liu, W.Q.; Jia, L.P.; Zhang, Y.R. Evaluation and Prediction of Water Yield Services in Shaanxi Province, China. Forests 2023, 14, 229. [Google Scholar] [CrossRef]
  22. Wang, S.T.; Cao, Z.; Luo, P.P.; Zhu, W. Spatiotemporal Variations and Climatological Trends in Precipitation Indices in Shaanxi Province, China. Atmosphere 2022, 13, 744. [Google Scholar] [CrossRef]
  23. Guo, Z.; Hu, H.; Li, P.; Li, N.; Fang, J. Spatio-temporal changes in biomass carbon sinks in China’s forests from 1977 to 2008. Sci. China Life Sci. 2013, 56, 661–671. [Google Scholar] [CrossRef]
  24. IPCC. Guidelines for National Greenhouse Gas Inventories, Volume 4 Agriculture, Forestry and Other Land Use; IPCC: Geneva, Switzerland, 2006. [Google Scholar]
  25. Liu, Y.; Yu, G.; Wang, Q.; Zhang, Y.; Xu, Z. Carbon carry capacity and carbon sequestration potential in China based on an integrated analysis of mature forest biomass. Sci. China Life Sci. 2014, 57, 1218–1229. [Google Scholar] [CrossRef]
  26. Wang, B.; Xu, G.; Li, Z.; Cheng, Y.; Gu, F.; Xu, M.; Zhang, Y. Carbon pools in forest systems and new estimation based on an investigation of carbon sequestration. J. Environ. Manag. 2024, 360, 121124. [Google Scholar] [CrossRef] [PubMed]
  27. Baltagi, B.H. The two-way Mundlak estimator. Econ. Rev. 2023, 42, 240–246. [Google Scholar] [CrossRef]
  28. Valizadeh, P.; Issar, A.; Bryant, H. Heterogeneous effects of economic cycles across the income distribution: A common factor model approach. Econ. Lett. 2025, 251, 112302. [Google Scholar] [CrossRef]
  29. Halder, S.C.; Malikov, E. Smoothed LSDV estimation of functional-coefficient panel data models with two-way fixed effects. Econ. Lett. 2020, 192, 109239. [Google Scholar] [CrossRef]
  30. Wooldridge, J.M. Cluster-Sample Methods in Applied Econometrics. Am. Econ. Rev. 2003, 93, 133–138. [Google Scholar] [CrossRef]
  31. Colin Cameron, A.; Miller, D.L. A Practitioner’s Guide to Cluster-Robust Inference. J. Hum. Resour. 2015, 50, 317. [Google Scholar] [CrossRef]
  32. Yang, J.; Huang, X. The 30 m annual land cover datasets and its dynamics in China from 1985 to 2024. Earth Syst. Sci. Data 2025, 13, 3907–3925. [Google Scholar] [CrossRef]
  33. You, Z.; Wu, T.; Gong, M.Q.; Zhen, S.Q.; Cheng, J.H. The Impact of the Grain for Green Program on Farmers’ Well-Being and Its Mechanism-Empirical Analysis Based on CLDS Data. Front. Ecol. Evol. 2022, 10, 771490. [Google Scholar] [CrossRef]
  34. Kou, P.L.; Xu, Q.; Jin, Z.; Yunus, A.P.; Luo, X.B.; Liu, M.H. Complex anthropogenic interaction on vegetation greening in the Chinese Loess Plateau. Sci. Total Environ. 2021, 778, 146065. [Google Scholar] [CrossRef]
  35. Yao, Z.H.; Huang, Y.C.; Zhang, Y.W.; Yang, Q.K.; Jiao, P.; Yang, M.H. Analysis of the Spatial-Temporal Characteristics of Vegetation Cover Changes in the Loess Plateau from 1995 to 2020. Land 2025, 14, 303. [Google Scholar] [CrossRef]
  36. Yang, X.H.; Zhang, X.P.; Lv, D.; Yin, S.Q.; Zhang, M.X.; Zhu, Q.; Yu, Q.; Liu, B.Y. Remote sensing estimation of the soil erosion cover-management factor for China’s Loess Plateau. Land Degrad. Dev. 2020, 31, 1942–1955. [Google Scholar] [CrossRef]
  37. Liu, S.; Ward, S.E.; Wilby, A.; Manning, P.; Gong, M.; Davies, J.; Killick, R.; Quinton, J.N.; Bardgett, R.D. Multiple targeted grassland restoration interventions enhance ecosystem service multifunctionality. Nat. Commun. 2025, 16, 3971. [Google Scholar] [CrossRef]
  38. Chen, X.; Taylor, A.R.; Reich, P.B.; Hisano, M.; Chen, H.Y.H.; Chang, S.X. Tree diversity increases decadal forest soil carbon and nitrogen accrual. Nature 2023, 618, 94–101. [Google Scholar] [CrossRef] [PubMed]
  39. Wang, H.; Li, Z.; Cao, L.; Feng, R.; Pan, Y. Response of NDVI of Natural Vegetation to Climate Changes and Drought in China. Land 2021, 10, 966. [Google Scholar] [CrossRef]
  40. Ju, Y.; Dronova, I.; Ma, Q.; Lin, J.; Moran, M.R.; Gouveia, N.; Hu, H.; Yin, H.W.; Shang, H.Y. Assessing Normalized Difference Vegetation Index as a proxy of urban greenspace exposure. Urban For. Urban Green. 2024, 99, 128454. [Google Scholar] [CrossRef]
  41. Martinez, A.D.; Labib, S.M. Demystifying normalized difference vegetation index (NDVI) for greenness exposure assessments and policy interventions in urban greening. Environ. Res. 2023, 220, 115155. [Google Scholar] [CrossRef] [PubMed]
  42. Qiu, Z.X.; Feng, Z.K.; Song, Y.N.; Li, M.L.; Zhang, P.P. Carbon sequestration potential of forest vegetation in China from 2003 to 2050: Predicting forest vegetation growth based on climate and the environment. J. Clean. Prod. 2020, 252, 119715. [Google Scholar] [CrossRef]
  43. Lamahewage, S.H.G.; Witharana, C.; Riemann, R.; Fahey, R.; Worthley, T. Aboveground biomass estimation using multimodal remote sensing observations and machine learning in mixed temperate forest. Sci. Rep. 2025, 15, 31120. [Google Scholar] [CrossRef] [PubMed]
  44. Su, Y.; Wu, Z.F.; Zheng, X.M.; Qiu, Y.; Ma, Z.; Ren, Y.; Bai, Y.F. Harmonizing remote sensing and ground data for forest aboveground biomass estimation. Ecol. Inform. 2025, 86, 103002. [Google Scholar] [CrossRef]
  45. Wang, F.M.; Sanders, C.J.; Santos, I.R.; Tang, J.W.; Schuerch, M.; Kirwan, M.L.; Kopp, R.E.; Zhu, K.; Li, X.Z.; Yuan, J.C.; et al. Global blue carbon accumulation in tidal wetlands increases with climate change. Natl. Sci. Rev. 2021, 8, nwaa296. [Google Scholar] [CrossRef]
  46. Shen, X.J.; Liu, Y.W.; Zhang, J.Q.; Wang, Y.J.; Ma, R.; Liu, B.H.; Lu, X.G.; Jiang, M. Asymmetric Impacts of Diurnal Warming on Vegetation Carbon Sequestration of Marshes in the Qinghai Tibet Plateau. Glob. Biogeochem. Cycle 2022, 36, e2022GB007396. [Google Scholar] [CrossRef]
  47. Xu, J.J.; Wang, J.C.; Li, R.; Yang, X.J. Spatio-temporal effects of urbanization on CO2 emissions: Evidences from 268 Chinese cities. Energy Policy 2023, 177, 113569. [Google Scholar] [CrossRef]
  48. Fang, G.C.; Gao, Z.Y.; Tian, L.X.; Fu, M. What drives urban carbon emission efficiency?—Spatial analysis based on nighttime light data. Appl. Energy 2022, 312, 118772. [Google Scholar] [CrossRef]
  49. Gorain, S.; Dutta, S.; Balo, S.; Malakar, A.; Roy Choudhury, M.; Das, S. Harnessing green wealth: A two-decade global assessment of forest carbon sequestration and credits and the economic implications of sustainable forest management practices. J. Environ. Manag. 2025, 393, 126987. [Google Scholar] [CrossRef]
Figure 1. Overview map of the study area. (a) Elevation distribution of the study area; (b) spatial distribution of land use in Shaanxi Province in 2023; (c) spatial distribution of municipalities in Shaanxi Province; (d) location of Shaanxi Province within China.
Forests 17 00676 g001
Figure 2. The spatial distribution of sampling points.
Forests 17 00676 g002
Figure 3. Arbor plot and subplot design.
Forests 17 00676 g003
Figure 4. Trends of NDVI in Shaanxi Province and different sub–regions from 1990 to 2023.
Forests 17 00676 g004
Figure 5. Spatial distribution and variation of NDVI in Shaanxi Province.
Forests 17 00676 g005
Figure 6. Trend of forest carbon storage in Shaanxi Province from 1990 to 2023.
Forests 17 00676 g006
Figure 7. Coefficient plot of regression estimates across model specifications.
Forests 17 00676 g007
Table 1. Regression results of NDVI, temperature, precipitation and nighttime light on forest.
VariablesBaselineCluster by YearDouble ClusterRegion FE OnlyExcl. First/Last YearRaw DataLag Model
NDVI−64.81 (28.77)−64.81 ** (21.22)−64.81 * (26.20)73.95 * (32.31)−74.91
(39.22)
−500.40 (222.2)−82.47 (40.59)
Temperature−6.79 (66.98)−6.79
(32.60)
−6.79 (18.25)114.50 * (36.44)57.89
(92.56)
−4.90
(48.31)
−19.70 (71.80)
Precipitation18.73 (19.75)18.73
(20.10)
18.73 (11.69)29.02 ** (8.475)30.33
(24.24)
0.0790 (0.0833)21.21 (20.35)
Nighttime light−93.28 (42.49)−93.28 *** (7.292)−93.28 * (35.93)32.41 (40.83)−93.22
(45.30)
−28.02 (12.76)−94.15 * (41.48)
NDVI (lag 1) −25.35 (33.25)
RegionYesYesYesYesYesYesYes
YearYesYesYesNoYesYesYes
R20.993640.993640.993640.991100.993930.993640.99374
Within R20.084000.084000.084000.310850.082530.084000.08815
Notes: Standard errors are reported in parentheses. All models include region and year fixed effects unless otherwise specified. Cluster-robust standard errors are applied at the regional level. Driscoll–Kraay standard errors are additionally used as a robustness check. (* p < 0.1, ** p < 0.05, *** p < 0.01). “Within R2” represents the explanatory power of the model for within-region (over time) variation.
Disclaimer/Publisher’s Note: The statements, opinions and data contained in all publications are solely those of the individual author(s) and contributor(s) and not of MDPI and/or the editor(s). MDPI and/or the editor(s) disclaim responsibility for any injury to people or property resulting from any ideas, methods, instructions or products referred to in the content.