


Abstract
Plant diversity plays a fundamental role in ecosystem functioning and is essential for sustaining ecosystem services. National forest inventories are key instruments for assessing floristic diversity. However, their measurement protocols may introduce bias by omitting smaller individuals because of the stem diameter criterion used or the minimum plant size threshold applied. Such bias is exacerbated in dryland ecosystems where small-statured plants with low-branching stems are particularly abundant. In this study, we evaluated the effects of using basal diameter (BD) instead of diameter at breast height, and of sampling small individuals (BD ≥ 2.5 cm), on the estimation of abundance, alpha and gamma diversity and community composition in different vegetation types in NW Mexico. We found substantial underestimation due to the omission of smaller individuals in xeric shrubland and tropical dry forest, where gamma diversity may be underestimated by up to 209% and 139%, respectively. Broadleaf forest also showed strong underestimation (133%), whereas mixed conifer–broadleaf forests were unaffected. We discuss these differential effects and propose a methodology to attenuate this underestimation and achieve more accurate floristic diversity estimates from national forest inventories in dryland vegetation, which encompasses roughly one-third of the Earth’s surface and more than half of Mexico’s territory.
1. Introduction
Plants play a key role in various ecosystem processes such as primary production, respiration, and evapotranspiration. Therefore, they are indispensable for maintaining the provision of ecosystem services that are essential for society [1,2,3]. However, over the last century, human activities have caused the loss of natural vegetation cover at alarming rates [4], which threatens the continuity of these services [5]. In this context, assessing the current status and dynamics of plant communities is an essential requirement for the design of ecological restoration and conservation strategies [6]. Both species richness (number of species present at a given site) and community composition (organization and distribution of species in terms of abundance, dominance, and stratification) are closely linked to ecosystem functioning [2,7]; therefore, these attributes have been a central focus of ecological research [1,6].
National forest inventories (NFIs), though originally designed to assess forest resources, are a useful instrument to study plant diversity and allow, among other things, the elaboration of national reports for international conventions such as the United Nations Convention on Biological Diversity [8], as well as the implementation of assessments at national [9] and regional [10] scales. Although floristic surveys can be conducted using a variety of methodological approaches, NFIs, in many cases coordinated by governmental institutions, offer the advantage of being carried out periodically and systematically at a national scale. In contrast, local floristic surveys are typically restricted to smaller areas and may employ methodologies that vary from site to site. The Mexican NFI, coordinated by the National Forestry Commission (CONAFOR), has enabled, among other things, the estimation of tree diversity at the national scale [9], and the regional mapping of species richness [10] in the Yucatan Peninsula.
Forest inventories have been conducted in Mexico in different forms and with varying spatial coverage since the 1960s. However, the current design and methodological framework of the NFI were established in 2004, when a systematic nationwide monitoring program based on standardized sampling procedures was implemented [9]. The NFI is based on a network of sampling plots distributed across all forested regions, which allows the periodic evaluation of forest resources and other vegetation attributes, including biodiversity indicators. This standardized methodology facilitates large-scale comparisons and long-term monitoring; however, the sampling methodology of the NFI may introduce biases in the estimation of floristic diversity by omitting smaller individuals for two related reasons. First, the NFI only uses DBH (diameter at breast height: 1.3 m above the ground) as a measure of stem diameter, potentially omitting individuals whose stems branch below this height. This is particularly problematic in dryland ecosystems, where there is a high abundance of shrub species and small trees with thick stems that branch a few centimeters above the ground [11]. Second, the NFI excludes small plants (DBH ≤ 7.5 cm), which may be particularly abundant in tropical dry forests, secondary vegetation, and dryland ecosystems [11,12]. Other studies have already reported the effect of these sources of error on estimates of aboveground biomass density in tropical dry forests and dryland ecosystems [11,12]. However, as far as we know, their effect on estimates of species richness and community composition has not been evaluated. Considering the predominance of dryland ecosystems, which cover approximately one-third of the Earth’s terrestrial surface [13] and more than half of Mexico’s territory [14], it is essential to improve estimates of floristic diversity attributes derived from NFIs in order to conduct broad-scale assessments and inform conservation and restoration programs.
In this study, we evaluated the effect of two related sources of error or bias on the estimation of abundance, species richness (gamma diversity), species density (alpha diversity), and community composition in the Cape Region, located in the state of Baja California Sur, NW Mexico. The Cape Region constitutes a transition zone between xeric shrubland, tropical dry forest, and temperate forests. Although this study focuses on dryland vegetation types, in this case, xeric shrubland and tropical dry forest, data from temperate forests were also obtained for comparative purposes. Using a dataset of sampled plots, we estimated the effect of using basal diameter (BD) instead of DBH (both ≥7.5 cm) as a measure of stem diameter, as well as the effect of including smaller individuals (BD ≥ 2.5 cm) in the estimation of floristic diversity. Subsequently, alpha and gamma diversity and community composition estimated from the sampling were compared with values estimated using NFI data. Based on the structural differences among vegetation types and the potential effects of plant size inclusion criteria on diversity estimates, we formulated the following hypotheses:
H1.
Because shrubs and trees with stems that branch below DBH are more abundant in xeric shrubland and tropical dry forest compared to broadleaf forests and mixed conifer–broadleaf forests [15,16], we hypothesize that the effect of modifying the minimum plant size inclusion criteria on alpha and gamma diversity will be greater in the former than in the latter forest types.
H2.
Because species diversity depends fundamentally on the number of individuals sampled [17], we expect that the magnitude of the effect of the modification will be proportional to the increase in the number of individuals recorded when smaller plants are included.
H3.
Because the evaluated modifications to the inclusion criteria affect both the relative abundance of species at the community level and their relative dominance (i.e., contribution to aboveground biomass), we hypothesize that these modifications will produce shifts in species’ relative importance in xeric shrubland and tropical dry forest compared with the size inclusion criterion used by the NFI.
2. Materials and Methods
2.1. Study Area
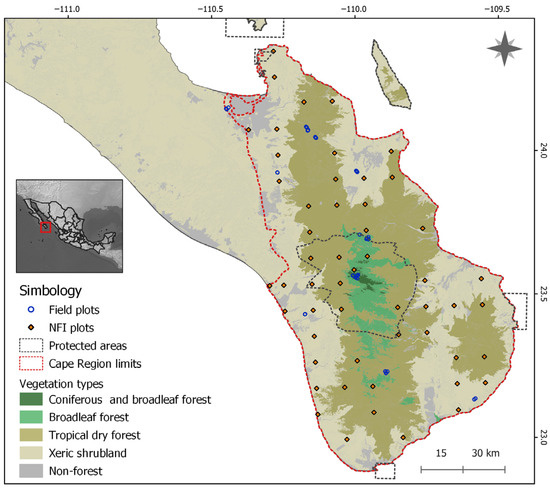
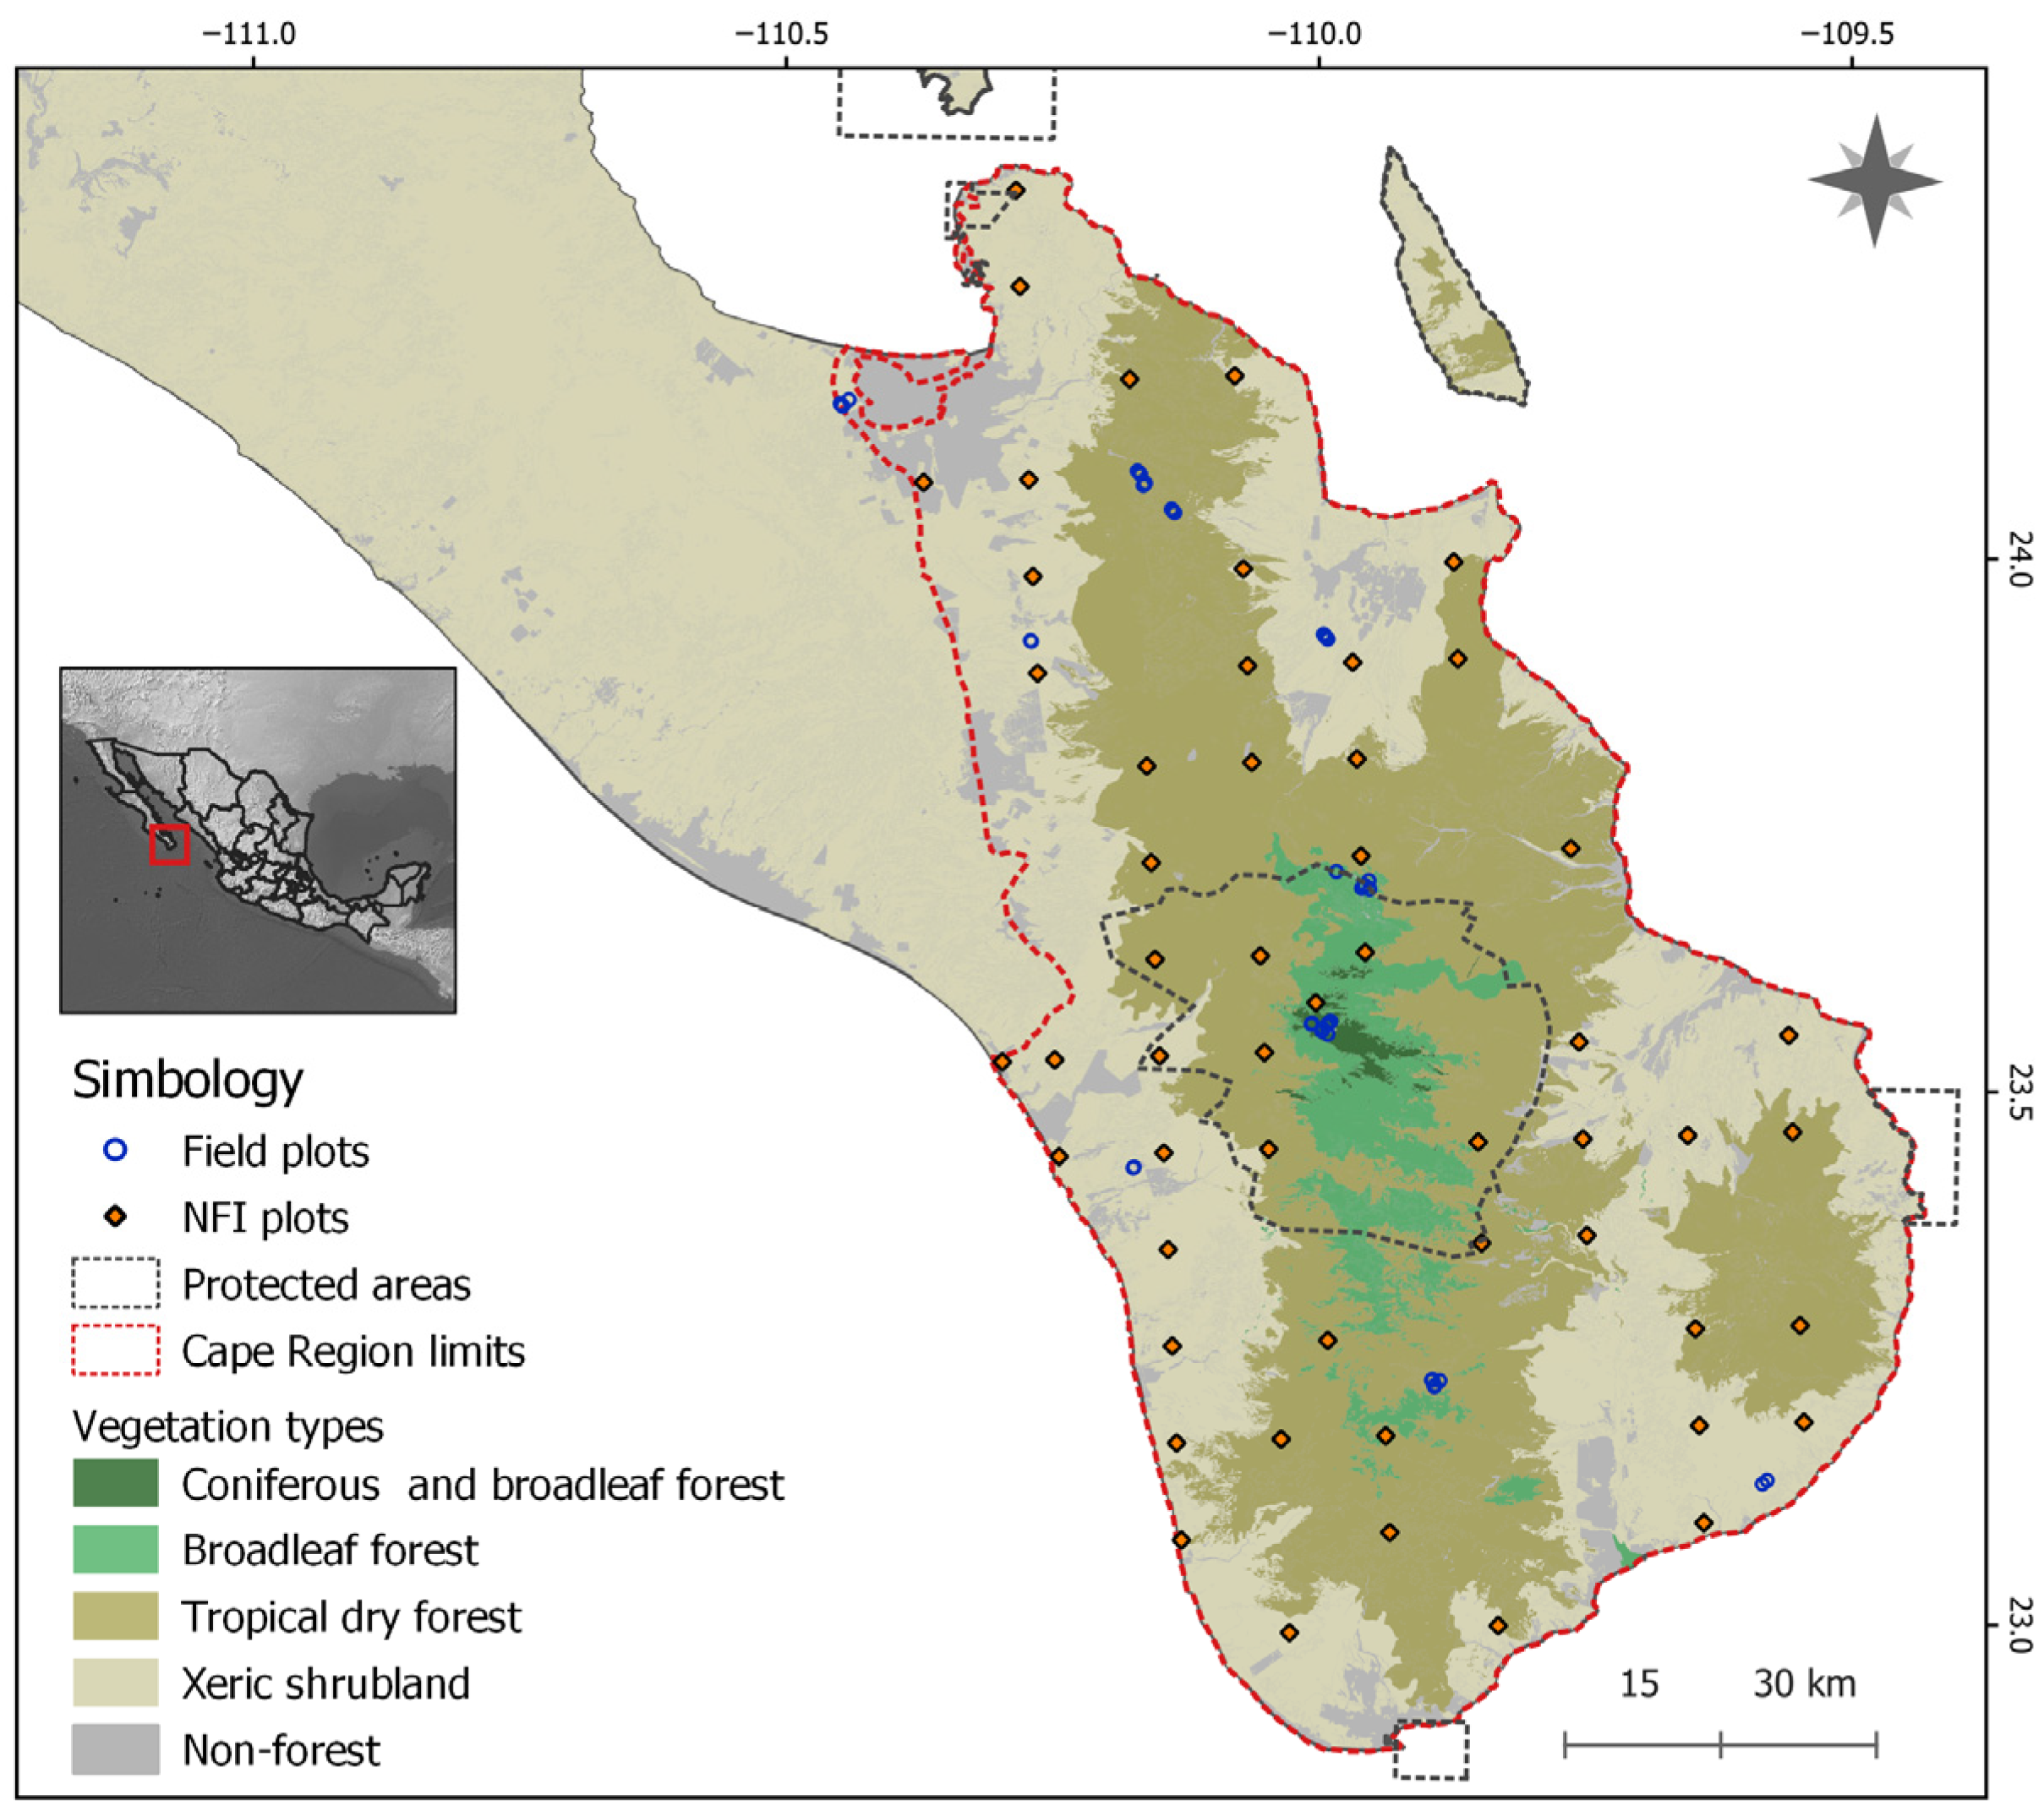
The study area is located in the Cape Region of Baja California Sur, northwestern Mexico (Figure 1), between 22–25° N and −108–−111° W. Lowland areas are characterized by warm and dry conditions, with mean annual temperatures of about 22–24 °C and average precipitation close to 200 mm. Along the elevational gradient of the Sierra de la Laguna, environmental conditions become cooler and more humid. Annual rainfall may reach nearly 700 mm at the highest elevations, which rise to approximately 2090 m a.s.l. [15,16]. Most precipitation occurs between July and January and is frequently influenced by tropical cyclones from the Pacific Ocean, particularly from September to November. Vegetation distribution follows this gradient: xeric shrublands dominate below 500 m a.s.l., tropical dry forest occurs between 500 and 1000 m a.s.l., and elevations above 1000 m a.s.l. are mainly covered by broadleaf and mixed conifer–broadleaf forests [15].
Figure 1.
Geolocation of the Cape Region in Baja California Sur, Mexico (red square in the inset map), showing the field samples (blue circles) and the National Forest Inventory samples (orange diamonds).
2.2. Field Data
2.2.1. Vegetation Sampling and Evaluation of the Effect of NFI Minimum Plant Size Inclusion Criteria
Field measurements were carried out between September and December 2022, during the rainy season. The study encompassed four vegetation types: xeric shrubland, tropical dry forest, broadleaf forest, and mixed conifer–broadleaf forest. Although the analysis primarily targets the two driest vegetation types (xeric shrubland and tropical dry forest), the remaining forest types were incorporated to support cross-system comparisons. The sampling scheme was based on the framework of the National Forest Inventory (NFI) [18]. Each sampling unit consisted of a circular area of 1 ha (radius of 56.42 m), within which four plots of 400 m2 (radius of 11.28 m) were delineated. One plot was positioned at the center, while the other three were distributed around it in an inverted Y arrangement. These four plots were treated jointly as a single composite sampling unit (hereafter referred to as a “sample”). Within each 400 m2 plot, individuals meeting the NFI inclusion threshold (diameter at breast height, DBH ≥ 7.5 cm, measured at 1.3 m above ground) were recorded. To better represent vegetation structural variability—particularly in systems where stem architecture deviates from standard tree forms—basal diameter (BD) was also measured. Additionally, to capture smaller size classes not included under the standard NFI criteria, a nested circular subplot of 80 m2 (radius of 5.04 m) was established concentrically within each main plot. All individuals with BD ≥ 2.5 cm were measured within these subplots.
In total, 46 sampling units were surveyed, yielding measurements for 5025 individuals. The distribution of samples included 14 in xeric shrubland, 14 in tropical dry forest, 6 in broadleaf forest, and 12 in mixed conifer–broadleaf forest. Species identification was conducted in situ whenever possible by trained personnel. When field identification was uncertain, photographic documentation was obtained and later examined by specialists at the Annetta Mary Carter Herbarium of the Northwestern Center for Biological Research (CIBNOR).
To evaluate the effect of the NFI stem diameter measurement criterion (DBH instead of BD) and the exclusion of smaller individuals (2.5 cm ≤ BD < 7.5 cm), we used data from the samples measured in this study to produce three estimates of abundance, plant density (number of individuals per ha), gamma diversity (total number of species per vegetation type), alpha diversity (mean number of species per sample), and community composition: (1) considering only individuals with DBH ≥ 7.5 cm (as in the NFI); (2) using BD instead of DBH (BD ≥ 7.5 cm); and (3) including small trees and shrubs (2.5 cm ≤ BD < 7.5 cm). Community composition was characterized for each vegetation type using species-level relative importance based on two complementary metrics: relative abundance (RA), representing the proportional contribution of each species to the total number of individuals recorded, and relative dominance (RD), representing the proportional contribution of each species to total aboveground biomass (AGB). Relative abundance (RA) was calculated as
where Ni is the number of individuals of species i. Relative dominance (RD) was calculated as
where AGBi is the total aboveground biomass of species i. Details on the estimation of individual-level AGB can be found in Hernández-Martínez et al. [11].
2.2.2. NFI Data
We used the database of the NFI conducted between 2015 and 2019, which is the most recent inventory available. This database includes 54 1-ha samples distributed throughout the study area (Figure 1). The NFI provides taxonomic identity and estimated AGB for each individual. Following a thorough revision and taxonomic correction by experts at the Annetta Mary Carter Herbarium of CIBNOR (see Table S1), alpha and gamma diversity and species-level values of RA and RD of the NFI dataset were estimated.
2.3. Comparison of Plant Density, Alpha and Gamma Diversity, and Community Composition
To compare gamma diversity (species richness) estimated from both datasets (samples measured, including small plants and NFI samples), rarefaction curves were constructed based on the number of censused individuals, and sample coverage was estimated to assess the completeness and comparability of the different samples. These analyses followed the methodology of Chao et al. [19] implemented in the iNEXT version 3.0.1 package in R version 4.2.1 [20] (see Figures S1–S4). For the analysis of differences in plant density (number of individuals per ha) and alpha diversity (species density), the assumptions of normality and homogeneity of variances were first evaluated using the Shapiro–Wilk and Levene tests, respectively. Differences in both variables among samples were then assessed using a one-way ANOVA followed by Tukey’s honestly significant difference (HSD) post hoc test (p < 0.05).
To evaluate the effect of excluding small plants (BD ≥ 2.5 cm and DBH < 7.5 cm) on the estimation of species-level RA and RD, these two components of relative importance were compared between both datasets: the NFI dataset, which did not include these individuals, and the field data measured in this study, which did include them. This analysis allowed an indirect assessment of potential shifts in the relative importance of species in terms of their abundance and AGB storage when shrubs and small trees are omitted during measurement, as is done in the NFI.
3. Results
3.1. Alpha and Gamma Diversity
3.1.1. Evaluation of the Effect of NFI Minimum Plant Size Inclusion Criteria
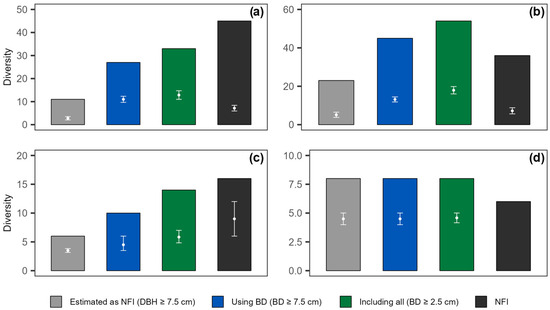
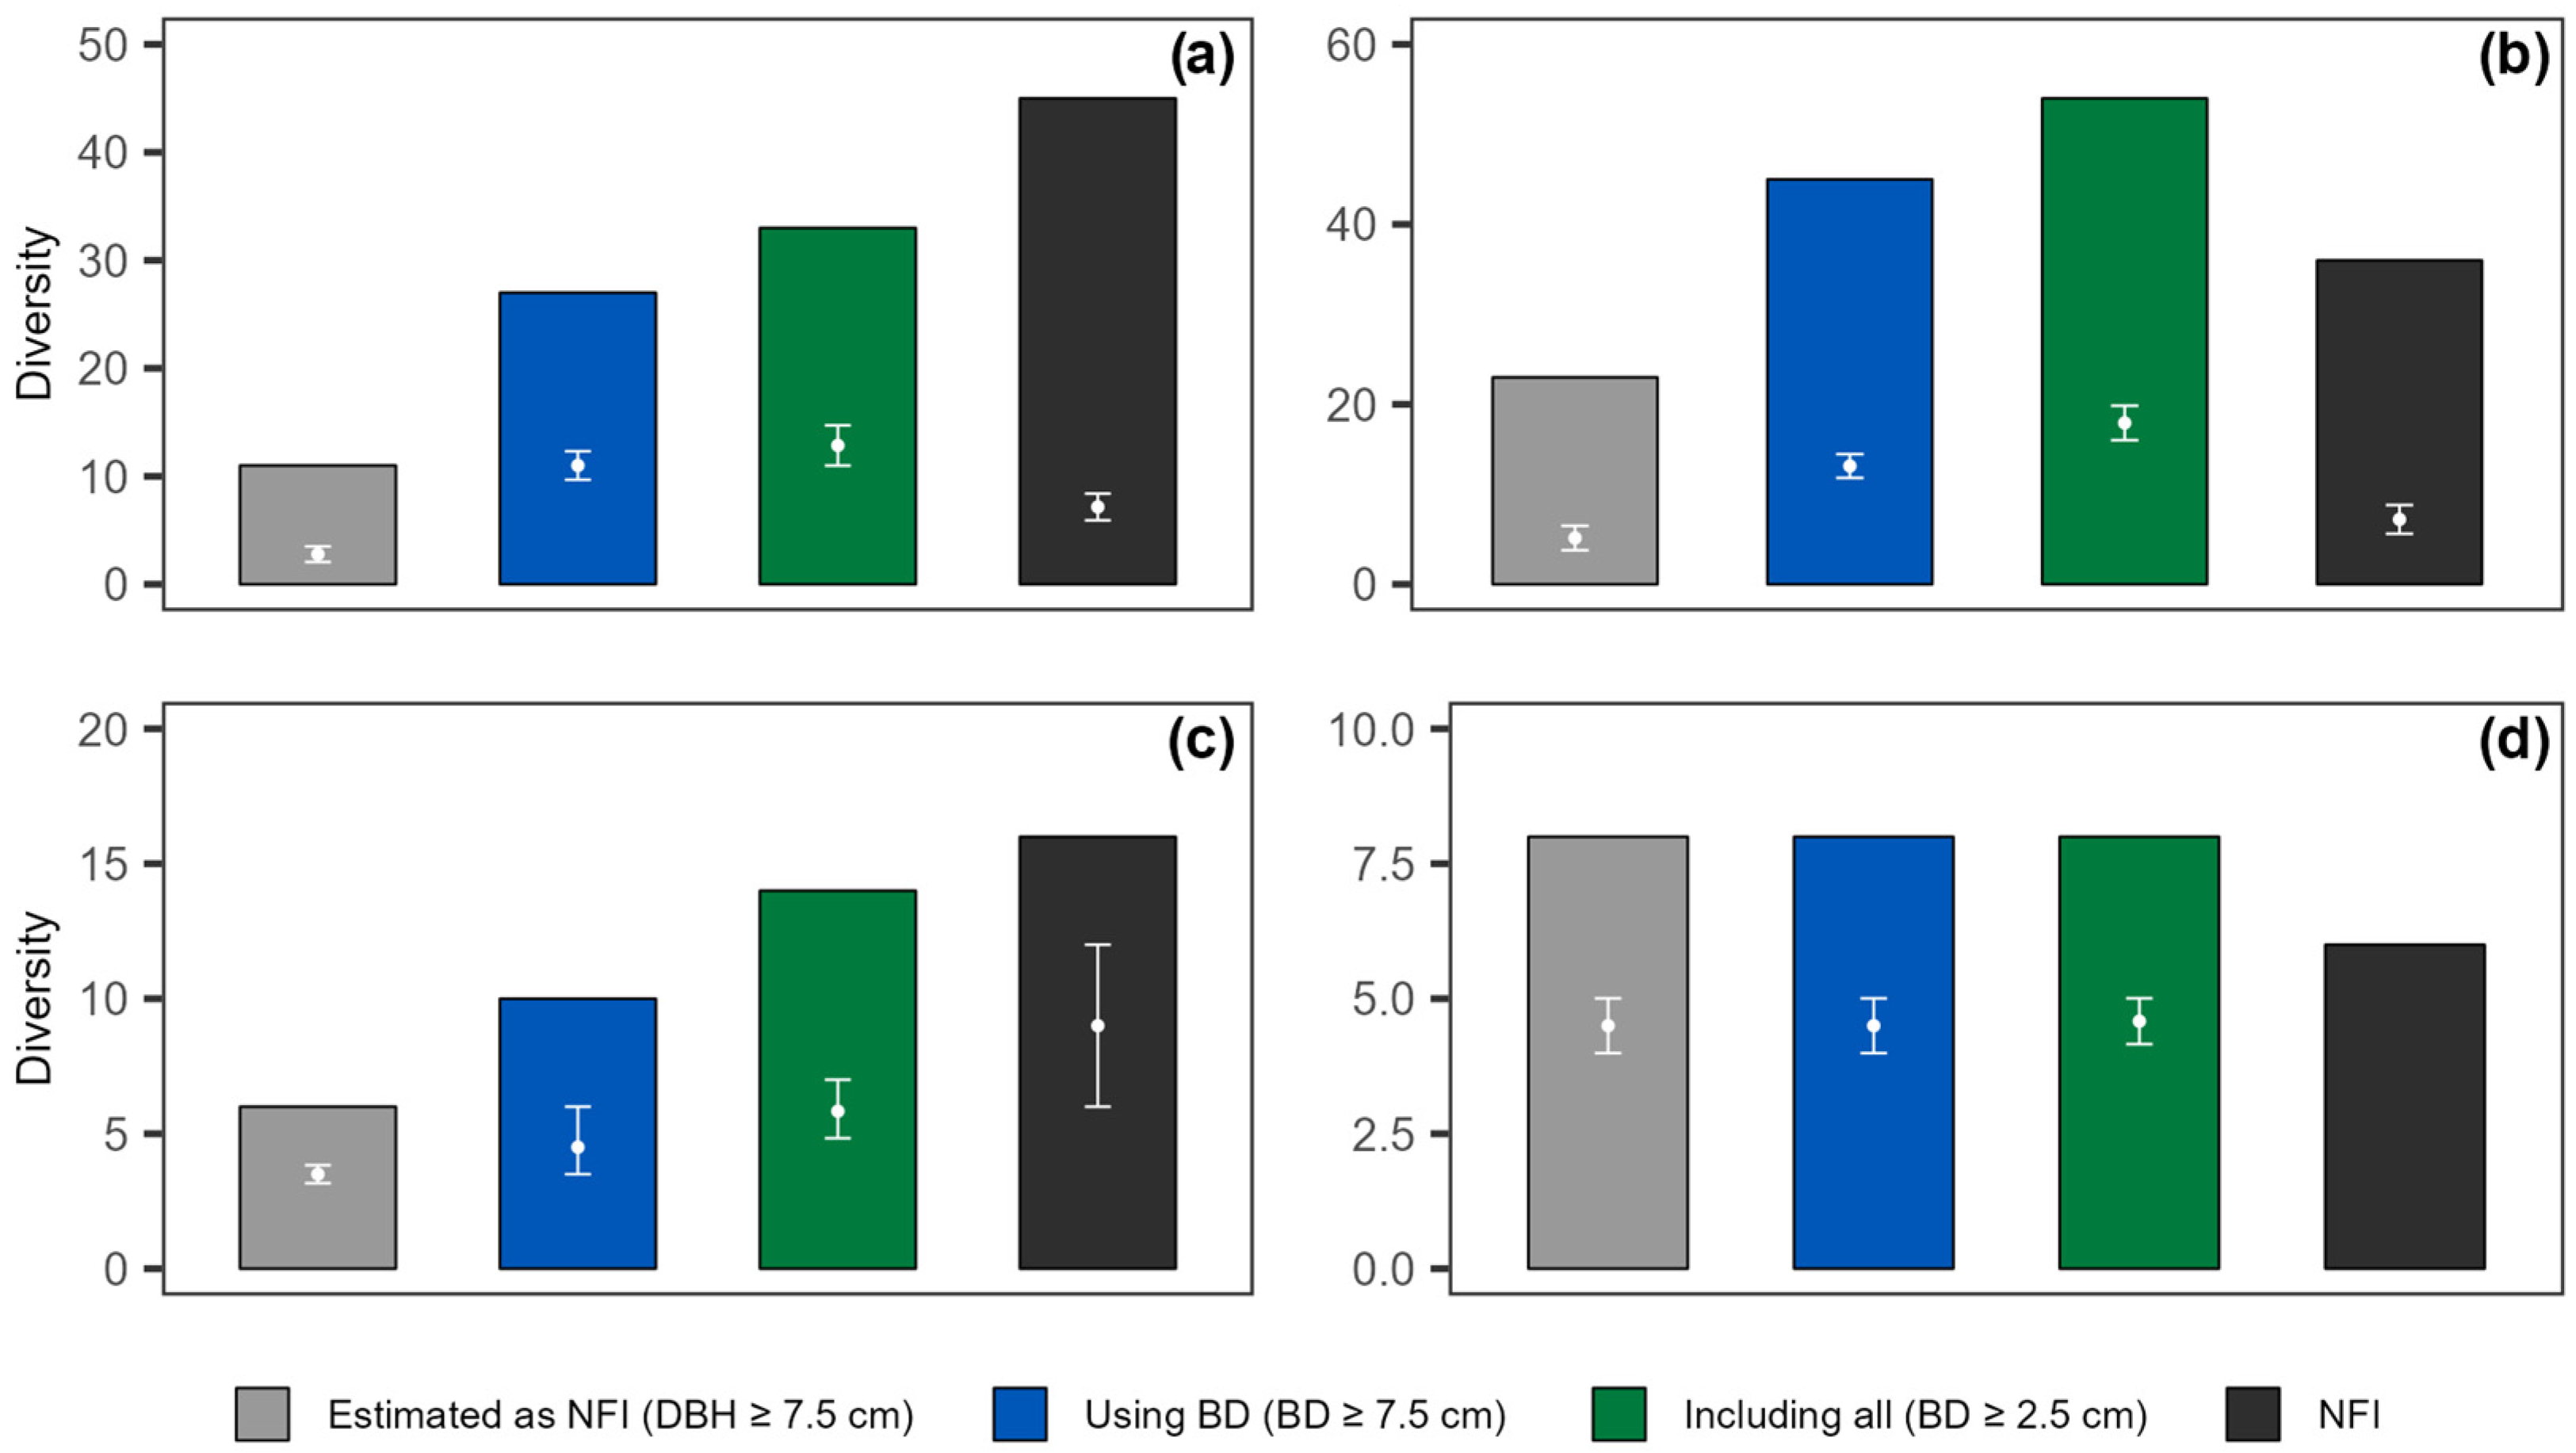
The criteria used for stem diameter measurement (BD vs. DBH) and minimum plant size (BD ≥ 2.5 cm vs. BD ≥ 7.5 cm) had a significant effect on the estimation of gamma diversity (species richness) in the measured samples. When BD was used instead of DBH, increases of 145%, 96%, and 67% were observed in xeric shrubland, tropical dry forest, and broadleaf forest, respectively. A smaller effect was observed when individuals with BD ≥ 2.5 cm (instead of BD ≥ 7.5 cm) were included, with further increases of 26%, 22%, and 40% in xeric shrubland, tropical dry forest, and broadleaf forest, respectively. It is worth noting that, when small individuals (BD ≥ 2.5 cm) were included, gamma diversity increased relative to the NFI-like estimate by 209%, 139%, and 133% in xeric shrubland, tropical dry forests, and broadleaf forests, respectively. Alpha diversity (species density) showed results similar to those of gamma diversity, with a marked increase in xeric shrubland and tropical dry forest when BD was used instead of DBH as the stem diameter measurement criterion (294% and 155%, respectively) and a smaller further increase when small individuals were included (20% and 40%, respectively). In broadleaf forest, a much smaller increase was observed for alpha diversity (≤30% for both criteria), and in no case was there an effect on alpha or gamma diversity in the mixed conifer–broadleaf forest (Table 1; Figure 2). Abundance (number of individuals) and plant density showed patterns similar to those of alpha and gamma diversity, but with much larger percentage increases –except in broadleaf forest (Table 2).
Table 1.
Gamma diversity (species richness) and alpha diversity (species density) for three estimates based on the measured samples and for the National Forest Inventory (NFI). Estimates were obtained from the samples measured in this study using three minimum plant size inclusion criteria: NFI-like criteria (DBH ≥ 7.5 cm), basal diameter instead of DBH (BD ≥ 7.5 cm), and inclusion of small individuals (BD ≥ 2.5 cm).
Figure 2.
Gamma diversity (bars) and alpha diversity (points and whiskers: mean and 95% confidence interval) estimated from the measured samples and from National Forest Inventory (NFI) data for (a) xeric shrubland, (b) tropical dry forest, (c) broadleaf forest, and (d) mixed conifer–broadleaf forest. The NFI mixed conifer–broadleaf forest (d) shows no mean or confidence interval because it corresponds to a single sample; Note the different scales of the Y axes.
Table 2.
Total abundance and plant density for three estimates based on the measured samples and for the National Forest Inventory (NFI). Estimates were obtained from the samples measured in this study using three minimum plant size inclusion criteria: NFI-like criteria (DBH ≥ 7.5 cm), basal diameter instead of DBH (BD ≥ 7.5 cm), and inclusion of small individuals (BD ≥ 2.5 cm).
3.1.2. Comparison Between the Measured Samples and the NFI
Differences were observed between the measured samples and the NFI in the estimation of gamma diversity. In the measured samples (which included small plants), the highest gamma diversity corresponded to tropical dry forest (55 species), followed by xeric shrubland (34), broadleaf forest (14), and mixed conifer–broadleaf forest (8). In the NFI, the highest gamma diversity corresponded to xeric shrubland (45), followed by tropical dry forest (36), broadleaf forest (16), and mixed conifer–broadleaf forest (6) (Table 1). Rarefaction curves revealed that both datasets had adequate sample coverage (>97%) across the four vegetation types (see Figures S1–S4), and in each vegetation type, observed species richness (gamma diversity) was very similar to richness rarefied at a common sample coverage (see Table S2). Therefore, for simplicity of presentation, comparisons between both datasets were conducted using observed gamma diversity. Comparisons of observed gamma diversity for each vegetation type yielded mixed results. In xeric shrubland, the NFI showed higher gamma diversity (richness) than the field samples (45 vs. 34 species), whereas in tropical dry forest, the field samples showed substantially higher gamma diversity than the NFI (55 vs. 36 species). Finally, in broadleaf forests and mixed conifer–broadleaf forests, gamma diversity values were similar between both datasets (Table 1; Figure 2). It should be noted that the NFI sample size for broadleaf forests and mixed conifer–broadleaf forests was minimal (only three and one samples, respectively).
Alpha diversity in the measured samples (including small individuals) showed a pattern very similar to that observed for gamma diversity; tropical dry forest showed the highest values (18.4 species per sample), followed by xeric shrubland (13.2), broadleaf forest (5.83), and finally mixed conifer–broadleaf forest (4.58) (Table 1). In contrast, the alpha diversity pattern in the NFI differed from that of gamma diversity; broadleaf forest had the highest alpha diversity (10.5), while xeric shrubland and tropical dry forest showed similar values (7.19 and 7.21, respectively). Alpha diversity in the measured xeric shrubland and tropical dry forest samples was significantly higher than the NFI values (p < 0.05), despite the latter having a larger number of samples in both vegetation types (Table 1; Figure 2). However, it should be noted that, as a result of the taxonomic revision of the NFI data, the number of species registered for xeric shrubland decreased from 60 to 46 species, equivalent to a reduction of 23%. In most cases, this decrease was due to the presence of taxa that do not occur in Baja California Sur, in which case records were retained at the genus level. Thus, both gamma and alpha diversity of xeric shrubland are likely underestimated in the NFI. In the tropical dry forest, the taxonomic revision did not substantially reduce the number of species, with only two species affected (0.5%). For both vegetation types, results are reported based on gamma diversity values obtained after taxonomic correction. In broadleaf forests and mixed conifer–broadleaf forests, species reported by the NFI did not undergo changes that reduced gamma diversity. Details of the taxonomic corrections are provided in Table S1.
3.2. Community Composition
3.2.1. Evaluation of the Effect of NFI Minimum Plant Size Inclusion Criteria
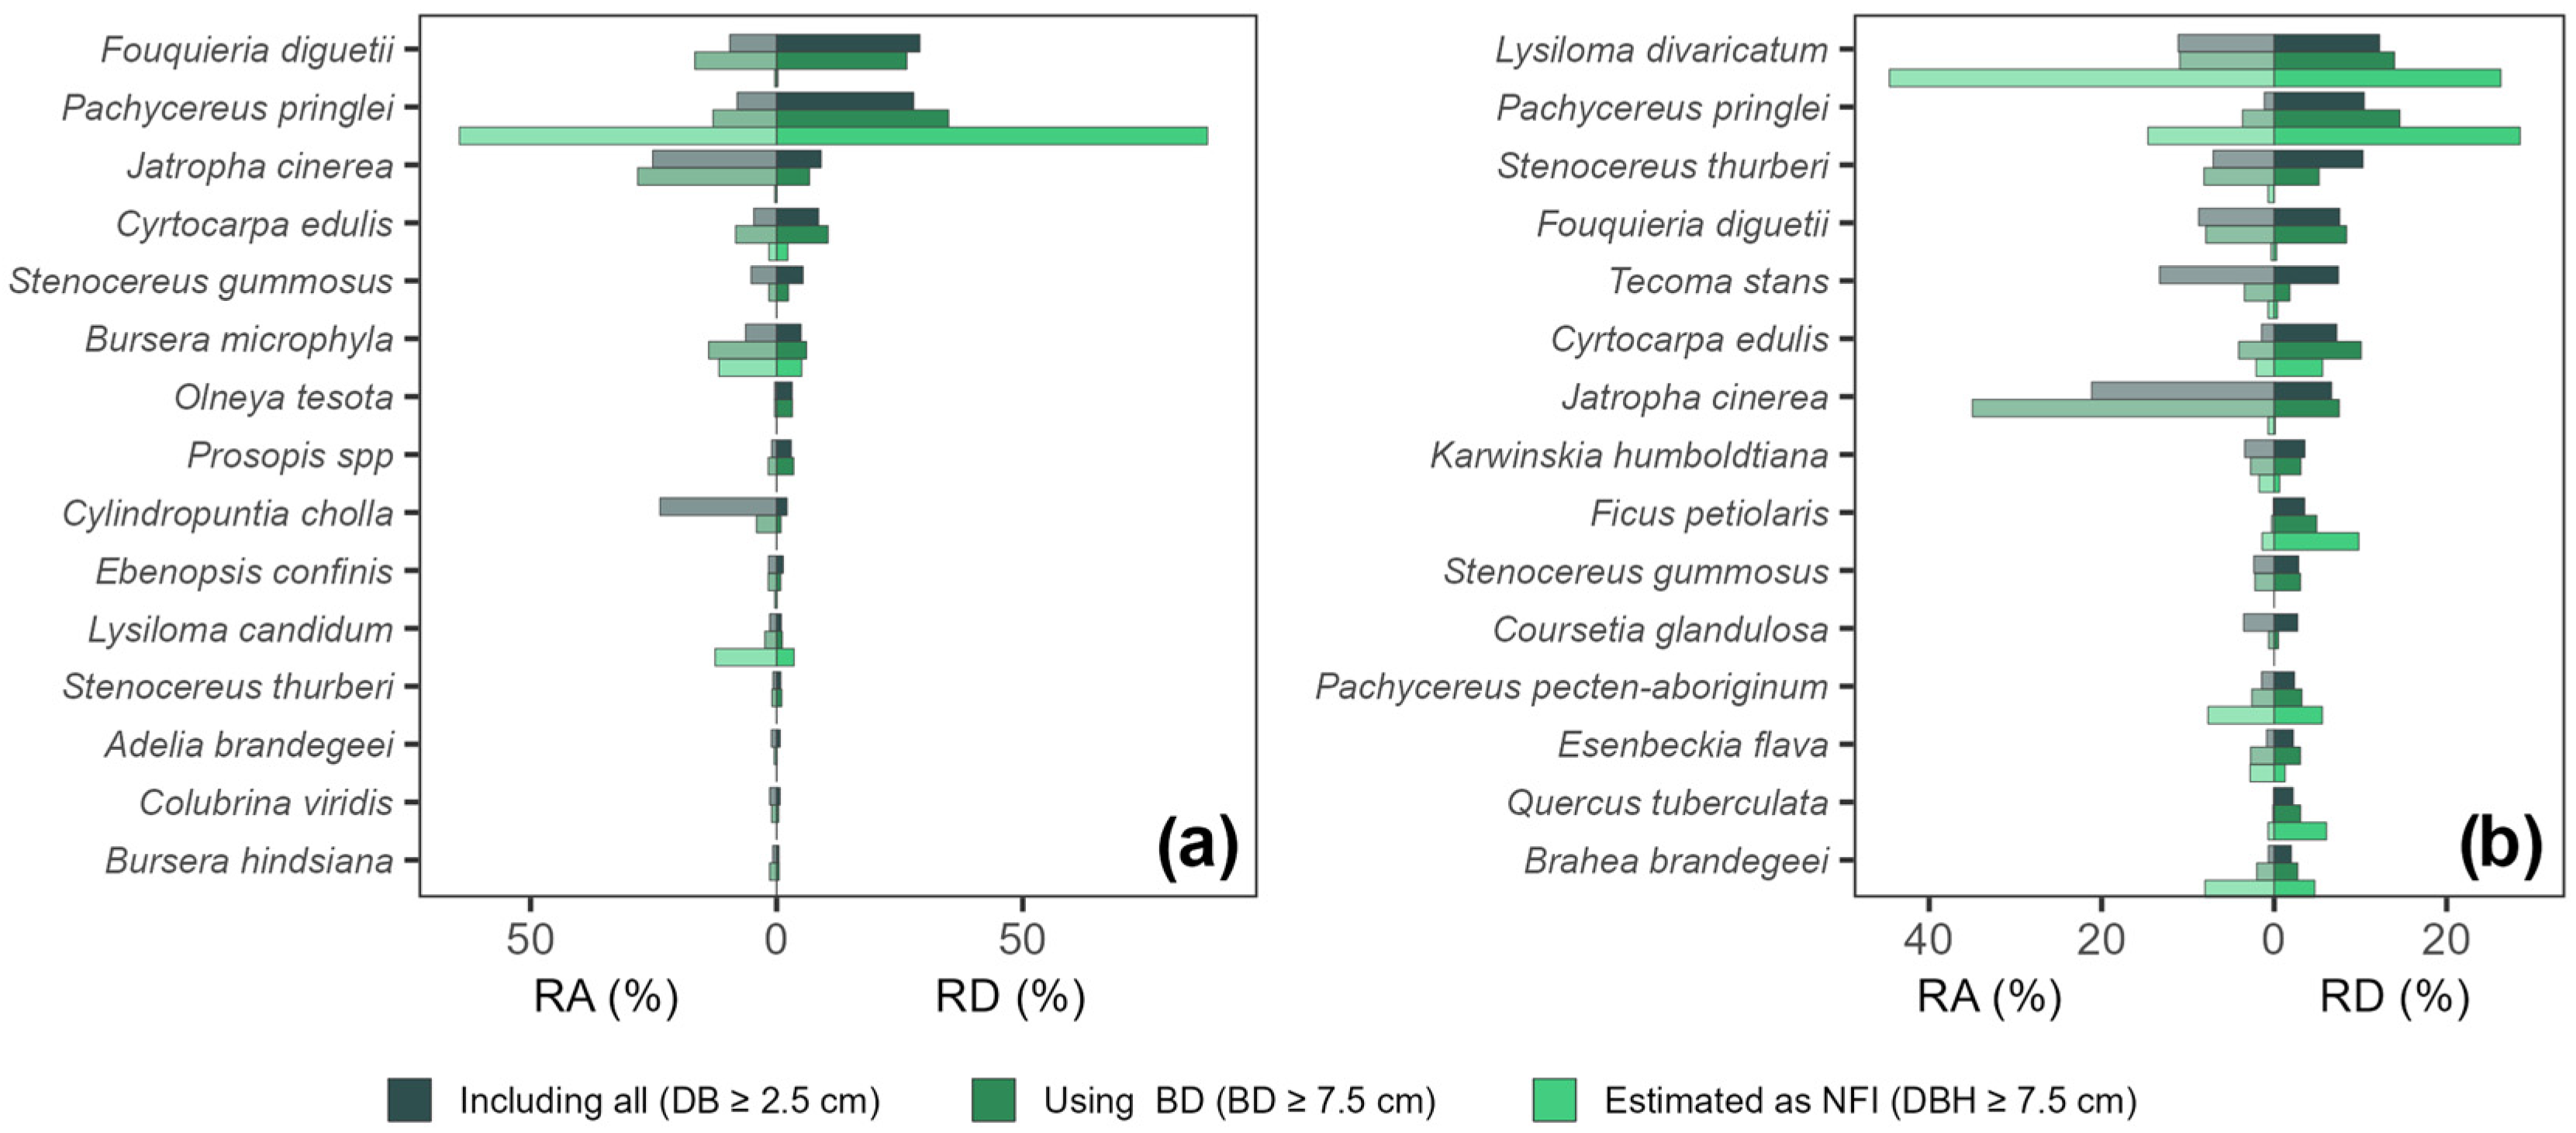
Stem diameter measurement criterion and the inclusion of small individuals greatly modified species-level values of relative dominance (RD) in the measured samples. In xeric shrubland, two contrasting cases stand out: the shrub Fouquieria diguetii (Tiegh.) I.M.Johnst., whose RD increased from 0.23% to 26.44% when BD was used instead of DBH, and to 29.10% when small individuals were included. In contrast, the giant cactus Pachycereus pringlei (S.Watson) Britton & Rose showed a decrease in RD from 87.55% to 34.92% when BD was used instead of DBH, and then to 27.84% when small individuals were included. Other shrub species, such as Jatropha cinerea (Ortega) Müll. Arg., and Cirtocarpa edulis Standl., increased their RD values when BD was used instead of DBH, followed by a less pronounced increase when small individuals were included. Changes in relative abundance (RA) values were also notable for the small cactus Cylindropuntia cholla (F.A.C.Weber) F.M.Knuth, which increased from 0% to 4.10% when BD was used instead of DBH, and then to 23.70% when small individuals were included. This indicates that this species may be overlooked during measurements when individuals with DBH < 7.5 cm are omitted (Figure 3a).
Figure 3.
Relative importance at the species level in terms of relative abundance (RA) and relative dominance (RD) in (a) xeric shrubland and (b) tropical dry forest. Estimates were obtained from the samples measured in this study using three plant inclusion criteria: NFI-like criteria (DBH ≥ 7.5 cm; bright green), basal diameter instead of DBH (BD ≥ 7.5 cm; light green), and inclusion of small individuals (BD ≥ 2.5 cm; dark green).
In tropical dry forest, there were also important changes in RD values for the tree Lysiloma candidum Brandegee and P. pringlei, the two most important species, whose RD values decreased markedly with the modifications to the NFI stem diameter and minimum plant size inclusion criteria. In contrast, RD values of other species, such as the columnar cactus Stenocereus thurberi (Engelm.) Buxb. and shrub species such as F. diguetii, Tecoma stans (L.) Juss. ex Kunth, and J. cinerea, which were close to zero, increased when NFI criteria were modified (Figure 3b).
3.2.2. Comparison Between the Measured Samples and the NFI
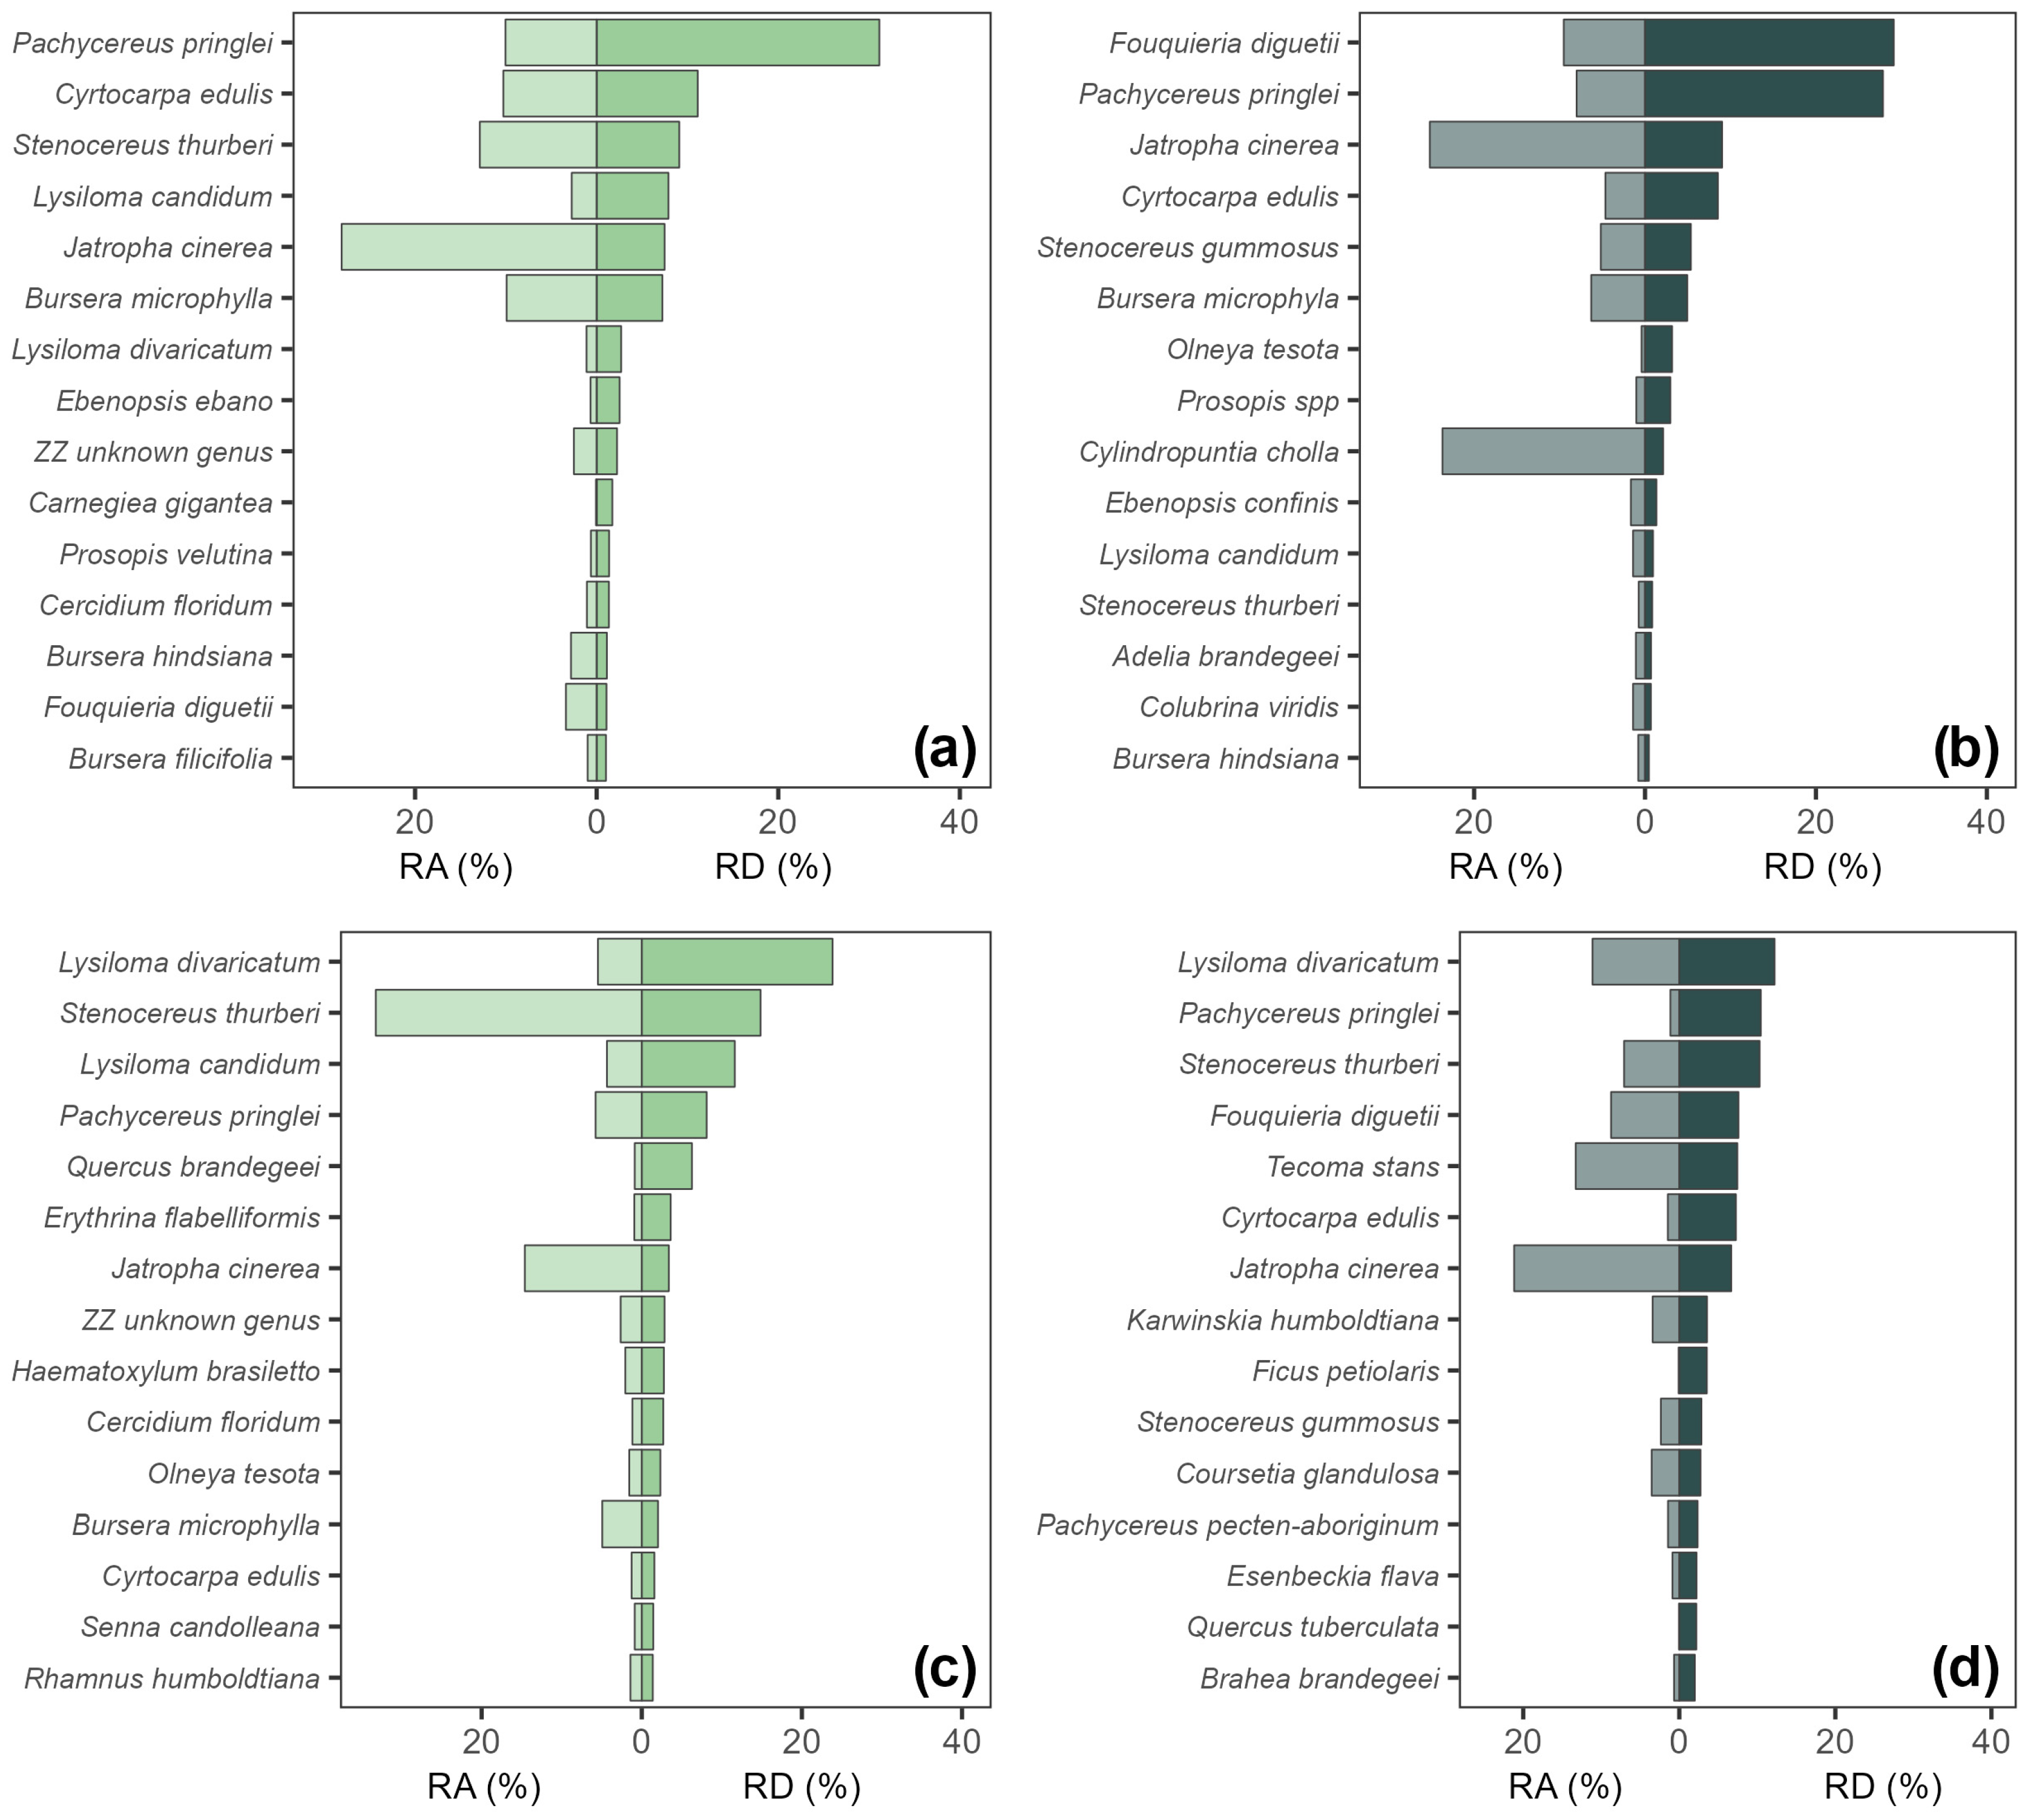
When comparing the relative importance of xeric shrubland species estimated from the measured samples (including small individuals) with those from the NFI, both agreements and discrepancies were found. Three of the five most dominant species (highest RD values) coincided in both datasets, although in a different order of dominance (Figure 4a,b). In the NFI, the most important species was Pachycereus pringlei (31.13%), followed by Cyrtocarpa edulis (11.13%) and Stenocereus thurberi (9.09%) (Figure 4a), whereas in the measured samples the most important species was Fouquieria diguetii (29.10%), followed by P. pringlei (27.84%) and Jatropha cinerea (9.09%) (Figure 4b). It is worth noting that, in both cases, two of the five most dominant species were columnar cacti (P. pringlei and S. thurberi in the NFI; P. pringlei and S. gummosus (Engelm.) A.C.Gibson & K.E.Horak. in the measured samples).
Figure 4.
Relative dominance (RD) in terms of aboveground biomass contribution and relative abundance (RA) at the species level in (a,b) xeric shrubland and (c,d) tropical dry forest. Estimates were obtained from (a,c) National Forest Inventory (NFI) data (green) and from (b,d) the samples measured in this study, which included small individuals (gray).
Among the discrepancies, F. diguetii, the most dominant species in the measured samples of this study, showed a markedly lower importance in the NFI data (ranked 14th) and a much lower RA in both samples (3.38% in the NFI and 9.5% in the measured samples) (Figure 4a,b). In the NFI, an abundance of 85 individuals of F. diguetii was reported, whereas a total of 373 individuals were recorded in the measured samples. Another notable difference is that Cylindropuntia cholla ranked ninth in importance in the measured samples (2.12%), whereas in the NFI it ranked 52nd (0.03%), with an abundance of 930 individuals in our samples (RA = 23.70%) and 4 individuals in the NFI (RA = 0.15%). This suggests that this small cactus species was almost omitted during NFI measurements, leading to an underestimation of its importance. By contrast, a similarity between the two datasets was that the shrub J. cinerea ranked among the five most dominant species in both cases, with similar relative abundance (28.08% in the NFI and 25.18% in the measured samples).
In the case of the tropical dry forest, similarities were also found among the most dominant species, with Lysiloma divaricatum (Jacq.) J.F.Macbr. ranking first in both datasets (Figure 4c,d). S. thurberi was the second most important species in the NFI and the third in the measured samples, although it showed a considerably higher RA in the NFI (33.21%) compared with the samples of this study (7.07%). A notable difference is that in the NFI Lysiloma candidum ranked third in RD (11.62%) (Figure 4c), whereas in the samples of this study, it ranked 39th (0.17%). F. diguetii again ranked among the most important species in the measured samples of this study, contributing 7.58% (rank 4), whereas in the NFI, it contributed only marginally to AGB (0.32%, rank 30). It is worth noting that the NFI data showed high relative dominance, as the first three species (L. divaricatum, S. thurberi, and L. candidum) accounted for 50.26% of the AGB, in contrast to what the measured samples of this study showed, where six species (L. divaricatum, P. pringlei, S. thurberi, F. diguetii, Tecoma stans, and C. edulis) accounted for 55.20%.
It should be noted that inconsistencies in taxonomic identification were found in the NFI for both xeric shrubland and tropical dry forest. For example, in xeric shrubland, the presence of the columnar cactus Carnegiea gigantea (Engelm.) Britton & Rose is reported, even though this species does not occur in the study area. A possible explanation is that individuals of the genus Pachycereus sp. were misidentified. Likewise, the NFI reports unidentified individuals as “ZZ unknown genus,” which appear among the top ten species in terms of RD in both xeric shrubland and tropical dry forest. We inferred the potential identity of these genera from the common names reported in the NFI (Table S1).
4. Discussion
Studies addressing biases in forest inventories have focused mainly on variables such as tree height [21,22] or aboveground biomass and forest carbon density [23,24,25,26]. However, little is known about the sources of error or bias that prevail in the estimation of different components of floristic diversity, particularly in inventories conducted in dryland ecosystems. In this study, we evaluated two related sources of error affecting the estimation of gamma diversity (species richness), alpha diversity (species density), and community composition (species relative importance) across vegetation types: (1) the use of DBH instead of BD, which excludes many trees with stems bifurcated below 1.3 m; and (2) the omission of shrubs and small trees (BD < 7.5 cm). We found strong effects of both sources of error, especially the first one, and below we discuss in detail the results in terms of the magnitude of the estimation bias of species diversity and composition, which are closely linked to ecosystem functioning [2,7].
4.1. Alpha and Gamma Diversity
Other studies have reported that smaller individuals contribute more to species richness (gamma diversity) than larger trees [27,28]. In this study, we hypothesized that the effect of modifications to the NFI minimum plant size inclusion criteria on alpha and gamma diversity would be greater in xeric shrubland and tropical dry forests, because these vegetation types have a higher abundance of small individuals with thick, branched stems below DBH compared to broadleaf forests and mixed conifer–broadleaf forests (H1). Our results partially supported this hypothesis, particularly in the case of alpha diversity. When small plants (DBH < 7.5 cm and BD > 2.5 cm) were included, alpha diversity increased markedly in xeric shrubland and tropical dry forests, compared to broadleaf forests and mixed conifer–broadleaf forests (Table 1). However, gamma diversity showed contrasting patterns in the latter forest types. In broadleaf forests, gamma diversity increased by a percentage comparable to that observed in tropical dry forests, whereas in mixed conifer–broadleaf forests, gamma diversity did not increase when smaller plants were included. The number of small plants added by modifying the inclusion criteria was higher in mixed conifer–broadleaf forests (61) than in broadleaf forests (49). Since species richness depends fundamentally on the number of individuals sampled [17], which, in this case showed the opposite pattern, this difference suggests that the sapling and juvenile community in mixed conifer–broadleaf forests is strongly dominated by a few species, whereas in broadleaf forests it is much more diverse, as these forests occur in a transition zone and even share some species with tropical dry forests, such as Bursera sp., Lysiloma sp. or columnar cacti species. This pattern may also explain the mixed support for H2, which posited that the magnitude of the effect of modifying the NFI inclusion criteria on alpha and gamma diversity would be proportional to the magnitude of its effect on abundance (the number of individuals). In other words, we expected patterns of alpha and gamma diversity to reflect abundance patterns. As expected, modifications to NFI inclusion criteria produced a greater percentage increase in plant abundance, and hence in alpha and gamma diversity in tropical dry forests and xeric shrubland than in temperate forests. However, temperate forests showed contrasting patterns and mixed support for H2. In line with this hypothesis, broadleaf forests had a greater increase in both percent plant abundance and percent alpha and gamma diversity than mixed conifer-broadleaf forest. On the other hand, broadleaf forests showed a higher percentage increase in plant abundance than in alpha and gamma diversity, whereas in mixed conifer–broadleaf forests, the percentage increase in alpha and gamma diversity was negligible despite a sizable increase in absolute and percent plant abundance (Table 2). These results suggest that, in vegetation types with high dominance by a few species—such as in mixed conifer–broadleaf forests—modifying NFI inclusion criteria increases the abundance, but this does not necessarily lead to an increase in alpha and gamma diversity.
Our results indicate that NFI inclusion criteria can lead to a substantial underestimation of alpha and gamma diversity, especially in tropical dry forests, where the measured samples (including small individuals) showed much higher alpha and gamma diversity than the NFI, despite having a smaller sample size. In contrast, in xeric shrubland, the NFI had a much larger sample size and higher gamma diversity. Nevertheless, in both tropical dry forests and xeric shrubland, measured samples showed higher alpha diversity, demonstrating the positive effect of modifying the minimum plant size inclusion criteria at the sample level (see Table 1). However, it should be noted that alpha and gamma diversity estimates derived from NFI data for xeric shrubland may have been underestimated due to the taxonomic corrections, which reduced the number of species. In most cases, these corrections were necessary because species without confirmed records in floristic checklists for the study area appeared in the NFI dataset.
It is important to emphasize that, despite the high degree of diversity sampling completeness (sample coverage ≥ 97%), both the NFI database and the measured samples exhibited considerably lower gamma diversity than that reported in more exhaustive floristic surveys conducted in the Cape Region. León-de la Luz et al. [29,30] reported 150 tree and shrub species for xeric shrubland in the Cape Region, 158 for tropical dry forests, 32 for broadleaf forests, and 45 for mixed conifer–broadleaf forests. These values are much higher than those observed in our results (see Table 1), which may largely be explained by the presence of rare or range-restricted species in the Cape Region [31], which would require much larger sample sizes (stratified by vegetation type and local conditions) to be recorded. Other factors, such as differences in survey timing (seasonality) or the taxonomic resolution of plant identification, may also contribute to these differences.
Our results show that gamma diversity may be severely underestimated in forest inventories conducted in drylands, which is concerning, considering that biodiversity is a key component of ecosystem functioning and the provision of ecosystem services [2], including carbon capture and storage, both of which are highly relevant in the context of climate change [32]. However, given the current crisis of species loss and ecosystem degradation, these and other services are increasingly at risk [33,34]. Therefore, reliable information on the current status and dynamics of key biodiversity attributes—such as alpha and gamma diversity and species composition—is essential. National Forest Inventories represent an ideal tool for generating such information at the regional to national scale, as they are conducted systematically across whole countries with standardized methodologies, generally provide open access to data, and in many cases are coordinated by governmental organizations, which ensures, to some extent, their long-term funding. Nevertheless, as demonstrated in this study, methodological biases still need to be addressed to ensure that NFIs provide more accurate information on species diversity and composition in dryland ecosystems, where sources of error are potentially large and have been poorly studied. A major challenge remaining concerns the correction of these biases in NFI data obtained using the standard protocols. This is relatively straightforward for aboveground biomass estimates [11], but much more complex for species diversity, as the latter involves extrapolating from individual-based rarefaction curves derived from field samples of smaller plants and applying such extrapolations to a different data set −sampled over much larger and heterogeneous areas−, which introduces considerable uncertainty [35]. Consequently, comparisons among studies using different sampling criteria should be interpreted with caution.
4.2. Community Composition
As expected based on H3, modifying the NFI minimum plant size inclusion criteria resulted in marked shifts in community composition. In xeric shrubland, Pachycereus pringlei, a columnar cactus that can achieve large sizes, was the most important species when NFI criteria were applied (DBH ≥ 7.5 cm). However, its importance decreased considerably when BD was used instead of DBH and when small individuals were included. This decrease was caused by the increased importance of other shrub species that generally have thick stems that branch below 1.3 m, such as Fouquieria diguetii, Jatropha cinerea, and Cyrtocarpa edulis. We found the same trend in tropical dry forests, where the tree Lysiloma divaricatum and P. pringlei (both species of considerably larger size than most shrubs) decreased in importance, whereas smaller-sized species, such as Stenocereus thurberi, F. diguetii, Tecoma stans, and J. cinerea increased in importance. Given that we used species AGB as an indicator of their relative dominance, the stronger effect of using BD instead of DBH, compared with the inclusion of small individuals, highlights the disproportionately larger effect of bigger individuals for AGB storage, as previously reported for plant communities in general [27,36] and for drylands in particular [37].
We found some discrepancies in RD values when comparing measured samples (including small individuals) with those from the NFI. In xeric shrubland, the most pronounced difference was observed for F. diguetii, which was the most important species in the measured samples, whereas it ranked 14th in RD in the NFI. Fouquieria diguetii is an abundant shrub in many sites [30,38], but it generally presents thick stems that branch close to the ground, often resulting in DBH < 7.5 cm, and, therefore, it may have been omitted in many NFI samples. In tropical dry forests, a similar RD pattern was observed, as F. diguetii ranked as the fourth most important species in the measured samples but occupied the 30th position in the NFI. This same situation may occur for other species with thick stems that branch below DBH, such as J. cinerea and C. edulis. These results highlight the need to reevaluate the minimum size inclusion and stem diameter measurement criteria used in NFIs in dryland ecosystems. The criterion of including only individuals with DBH ≥ 7.5 cm may be appropriate for temperate forests (especially mixed broadleaf-conifer forests) in the Cape Region, but it leads to the underrepresentation or omission of several species in xeric shrubland and tropical dry forests due to their structural characteristics (shorter and multi-stemmed or highly branched vegetation). Additionally, a thorough revision of the taxonomic identity of species (including some with the highest relative importance) reported in the NFI revealed several errors (Table S1). These species identification issues in the NFI, though understandable considering that the original and main purpose of NFIs is to assess forest resources, not species diversity, undermine the reliability of NFI data for guiding management, conservation, and species restoration plans in these ecosystems.
Finally, columnar cacti have received little attention in terms of AGB and carbon quantification [14]. However, they are an extremely abundant group in some xeric shrublands and tropical dry forests of Mexico [16,39,40]. In this study, we found that columnar cacti are dominant species that store large amounts of AGB in xeric shrublands of the study area (RD > 40% in both the NFI and measured samples), with values far exceeding those reported for the state of Sonora (11%) [41]. Likewise, they were among the most important species in tropical dry forests (cumulative RD > 20% and > 30% in the NFI and measured samples, respectively).
5. Conclusions
Drylands occupy about a third of the global land surface [13] and more than half of Mexico’s land surface [14]. Therefore, improving the quality of estimates of their floristic diversity and community composition is essential. In this study, we demonstrated that alpha and gamma diversity are underestimated and that the relative importance of species changes considerably when NFI minimum plant size inclusion criteria are modified, particularly in xeric shrubland and tropical dry forests. These results suggest that including smaller trees and shrubs in sampling protocols could improve estimates of species diversity in these vegetation types. Using BD instead of DBH had a marked effect on gamma diversity, with increases of 145%, 95%, and 67% in xeric shrubland, tropical dry forests, and broadleaf forests, respectively. When small individuals were included, the increase in gamma diversity relative to the NFI-like estimate reached 209%, 139%, and 133% in xeric shrubland, tropical dry forests, and broadleaf forests, respectively. These results suggest that the use of BD as the stem diameter measurement criterion could provide a more adequate estimation of plant diversity for dryland ecosystems. Admittedly, this would involve an increase in sampling time, effort and cost, so alternatively, BD (and smaller plants) could be measured only in smaller concentric subplots (80 m2), which may require less sampling effort. However, our results should be interpreted with caution because the study was conducted in a single region. Additional studies in other dryland areas would be necessary to evaluate the broader applicability and operational feasibility of these methodological adjustments.
Supplementary Materials
The following supporting information can be downloaded at https://www.mdpi.com/article/10.3390/f17040465/s1: Table S1. Taxonomic corrections applied to the NFI species identifications in xeric shrubland (XS) and tropical dry forest (TDF). No taxonomic corrections were required for broadleaf forest and conifer-broadleaf forest. Table S2. Observed and rarefied species richness for measured samples (including small individuals) and for the National Forest Inventory (NFI). Figure S1. Sample coverage curve based on the number of individuals for xeric shrubland. Figure S2. Sample coverage curve based on the number of individuals for tropical dry forest. Figure S3. Sample coverage curve based on the number of individuals for broadleaf forest. Figure S4. Sample coverage curve based on the number of individuals for coniferous–broadleaf forest.
Author Contributions
Conceptualization, L.A.H.-M., J.L.H.-S. and J.M.D.-R.; methodology, L.A.H.-M., J.L.H.-S., J.M.D.-R., A.M.-N. and C.L.-V.; formal analysis, L.A.H.-M.; investigation, L.A.H.-M.; data curation, L.A.H.-M. and C.L.-V.; writing—original draft preparation, L.A.H.-M., J.L.H.-S. and J.M.D.-R.; writing—review and editing, L.A.H.-M., J.L.H.-S., J.M.D.-R., A.M.-N., C.P.-Q. and C.L.-V.; supervision, J.L.H.-S. and J.M.D.-R.; funding acquisition, L.A.H.-M. All authors have read and agreed to the published version of the manuscript.
Funding
The first author received a scholarship from Consejo Nacional de Humanidades, Ciencias y Tecnología (CONAHCYT), México [grant numbers: 828068].
Data Availability Statement
The datasets used during the current study are available from the corresponding author on reasonable request.
Acknowledgments
We would like to thank Pilar Cota Ruiz for his valuable assistance in field data collection. The authors express their gratitude to the Mexican National Forestry Commission (CONAFOR) for generously supplying the forest inventory data.
Conflicts of Interest
The authors declare no conflicts of interest.
References
- Harrison, P.A.; Berry, P.M.; Simpson, G.; Haslett, J.R.; Blicharska, M.; Bucur, M.; Dunford, R.; Egoh, B.; Garcia-Llorente, M.; Geamănă, N.; et al. Linkages between Biodiversity Attributes and Ecosystem Services: A Systematic Review. Ecosyst. Serv. 2014, 9, 191–203. [Google Scholar] [CrossRef] [Scilit]
- Pettorelli, N.; Schulte to Bühne, H.; Tulloch, A.; Dubois, G.; Macinnis-Ng, C.; Queirós, A.M.; Keith, D.A.; Wegmann, M.; Schrodt, F.; Stellmes, M.; et al. Satellite Remote Sensing of Ecosystem Functions: Opportunities, Challenges and Way Forward. Remote Sens. Ecol. Conserv. 2018, 4, 71–93. [Google Scholar] [CrossRef] [Scilit]
- Le Provost, G.; Schenk, N.V.; Penone, C.; Thiele, J.; Westphal, C.; Allan, E.; Ayasse, M.; Blüthgen, N.; Boeddinghaus, R.S.; Boesing, A.L.; et al. The Supply of Multiple Ecosystem Services Requires Biodiversity across Spatial Scales. Nat. Ecol. Evol. 2022, 7, 236–249. [Google Scholar] [CrossRef] [Scilit]
- Sims, M.J.; Stanimirova, R.; Raichuk, A.; Neumann, M.; Richter, J.; Follett, F.; MacCarthy, J.; Lister, K.; Randle, C.; Sloat, L.; et al. Global Drivers of Forest Loss at 1 Km Resolution. Environ. Res. Lett. 2025, 20, 074027. [Google Scholar] [CrossRef] [Scilit]
- Isbell, F.; Tilman, D.; Polasky, S.; Loreau, M. The Biodiversity-Dependent Ecosystem Service Debt. Ecol. Lett. 2015, 18, 119–134. [Google Scholar] [CrossRef] [Scilit] [PubMed]
- Marshall, E.; Wintle, B.A.; Southwell, D.; Kujala, H. What Are We Measuring? A Review of Metrics Used to Describe Biodiversity in Offsets Exchanges. Biol. Conserv. 2020, 241, 108250. [Google Scholar] [CrossRef] [Scilit]
- Poorter, L.; van der Sande, M.T.; Arets, E.J.M.M.; Ascarrunz, N.; Enquist, B.; Finegan, B.; Licona, J.C.; Martínez-Ramos, M.; Mazzei, L.; Meave, J.A.; et al. Biodiversity and Climate Determine the Functioning of Neotropical Forests. Glob. Ecol. Biogeogr. 2017, 26, 1423–1434. [Google Scholar] [CrossRef] [Scilit]
- Vidal, C.; Alberdi, I.; Redmond, J.; Vestman, M.; Lanz, A.; Schadauer, K. The Role of European National Forest Inventories for International Forestry Reporting. Ann. For. Sci. 2016, 73, 793–806. [Google Scholar] [CrossRef] [Scilit]
- Ricker, M.; Calónico, J.; Castillo-Santiago, M.; Galicia, A.; Kleinn, C.; Martínez-Salas, E.M.; Mondragón, E.; Mora, M.A.; Ramos, L.J.; Ramos, C.H.; et al. Mexico’s Forest Diversity: Common Tree Species and Proposed Forest-Vegetation Provinces. Forests 2022, 13, 1598. [Google Scholar] [CrossRef] [Scilit]
- Hernández-Stefanoni, J.L.; Castillo-Santiago, M.Á.; Andres-Mauricio, J.; Portillo-Quintero, C.A.; Tun-Dzul, F.; Dupuy, J.M. Carbon Stocks, Species Diversity and Their Spatial Relationships in the Yucatán Peninsula, Mexico. Remote Sens. 2021, 13, 3179. [Google Scholar] [CrossRef] [Scilit]
- Hernández-Martínez, L.A.; Dupuy-Rada, J.M.; Medel-Narváez, A.; Portillo-Quintero, C.; Hernández-Stefanoni, J.L. Improving Aboveground Biomass Density Mapping of Arid and Semi-Arid Vegetation by Combining GEDI LiDAR, Sentinel-1/2 Imagery and Field Data. Sci. Remote Sens. 2025, 11, 100204. [Google Scholar] [CrossRef] [Scilit]
- Rodríguez-Veiga, P.; Saatchi, S.; Tansey, K.; Balzter, H. Magnitude, Spatial Distribution and Uncertainty of Forest Biomass Stocks in Mexico. Remote Sens. Environ. 2016, 183, 265–281. [Google Scholar] [CrossRef] [Scilit]
- Zhang, Y.; Tariq, A.; Hughes, A.C.; Hong, D.; Wei, F.; Sun, H.; Sardans, J.; Peñuelas, J.; Perry, G.; Qiao, J.; et al. Challenges and Solutions to Biodiversity Conservation in Arid Lands. Sci. Total Environ. 2023, 857, 159695. [Google Scholar] [CrossRef] [Scilit] [PubMed]
- Briones, O.; Búrquez, A.; Martínez-Yrízar, A.; Pavón, N.; Perroni, Y. Biomass and Productivity in Mexican Arid Lands. Madera Bosques 2018, 24, e2401898. [Google Scholar] [CrossRef] [Scilit]
- González-Abraham, C.E.; Garcillán, P.P.; Ezcurra, E.; Grupo de Trabajo de Ecorregiones. Ecorregiones de La Península de Baja California: Una Síntesis. Bot. Sci. 2010, 87, 69. [Google Scholar] [CrossRef] [Scilit]
- León-de la Luz, J.L.; Pérez Navarro, J.J.; Breceda, A. A Transitional Xerophytic Tropical Plant Community of the Cape Region, Baja California. J. Veg. Sci. 2000, 11, 555–564. [Google Scholar] [CrossRef] [Scilit]
- Gotelli, N.J.; Colwell, R.K. Estimating species richness. In Biological Diversity, Frontiers in Measurement and Assessment; Magurran, A.E., Mcgill, B.J., Eds.; Oxford University Press: Oxford, UK, 2011; pp. 39–54. [Google Scholar]
- CONAFOR Comisión Nacional Forestal. Inventario Nacional Forestal y de Suelos. Procedimientos de Muestreo; CONAFOR: Zapopan, Mexico, 2017. [Google Scholar]
- Chao, A.; Gotelli, N.J.; Hsieh, T.C.; Sander, E.L.; Ma, K.H.; Colwell, R.K.; Ellison, A.M. Rarefaction and Extrapolation with Hill Numbers: A Framework for Sampling and Estimation in Species Diversity Studies. Ecol. Monogr. 2014, 84, 45–67. [Google Scholar] [CrossRef] [Scilit]
- Hsieh, T.C.; Ma, K.H.; Chao, A. INEXT: An R Package for Rarefaction and Extrapolation of Species Diversity (Hill Numbers). Methods Ecol. Evol. 2016, 7, 1451–1456. [Google Scholar] [CrossRef] [Scilit]
- Hill, T.C.; Williams, M.; Bloom, A.A.; Mitchard, E.T.A.; Ryan, C.M. Are Inventory Based and Remotely Sensed Above-Ground Biomass Estimates Consistent? PLoS ONE 2013, 8, e74170. [Google Scholar] [CrossRef] [Scilit]
- Yanai, R.D.; Young, A.R.; Campbell, J.L.; Westfall, J.A.; Barnett, C.J.; Dillon, G.A.; Green, M.B.; Woodall, C.W. Measurement Uncertainty in a National Forest Inventory: Results from the Northern Region of the USA. Can. J. For. Res. 2023, 53, 163–177. [Google Scholar] [CrossRef] [Scilit]
- Chen, Q.; Vaglio Laurin, G.; Valentini, R. Uncertainty of Remotely Sensed Aboveground Biomass over an African Tropical Forest: Propagating Errors from Trees to Plots to Pixels. Remote Sens. Environ. 2015, 160, 134–143. [Google Scholar] [CrossRef] [Scilit]
- Urbazaev, M.; Thiel, C.; Cremer, F.; Dubayah, R.; Migliavacca, M.; Reichstein, M.; Schmullius, C. Estimation of Forest Aboveground Biomass and Uncertainties by Integration of Field Measurements, Airborne LiDAR, and SAR and Optical Satellite Data in Mexico. Carbon Balance Manag. 2018, 13, 5. [Google Scholar] [CrossRef] [Scilit]
- Yanai, R.D.; Wayson, C.; Lee, D.; Espejo, A.B.; Campbell, J.L.; Green, M.B.; Zukswert, J.M.; Yoffe, S.B.; Aukema, J.E.; Lister, A.J.; et al. Improving Uncertainty in Forest Carbon Accounting for REDD+ Mitigation Efforts. Environ. Res. Lett. 2020, 15, 124002. [Google Scholar] [CrossRef] [Scilit]
- Guerra-Hernández, J.; Botequim, B.; Bujan, S.; Jurado-Varela, A.; Molina-Valero, J.A.; Martínez-Calvo, A.; Pérez-Cruzado, C. Interpreting the Uncertainty of Model-Based and Design-Based Estimation in Downscaling Estimates from NFI Data: A Case-Study in Extremadura (Spain). GIScience Remote Sens. 2022, 59, 686–704. [Google Scholar] [CrossRef] [Scilit]
- Lutz, J.A.; Furniss, T.J.; Johnson, D.J.; Davies, S.J.; Allen, D.; Alonso, A.; Anderson-Teixeira, K.J.; Andrade, A.; Baltzer, J.; Becker, K.M.L.; et al. Global Importance of Large-Diameter Trees. Glob. Ecol. Biogeogr. 2018, 27, 849–864. [Google Scholar] [CrossRef] [Scilit]
- Dupuy, J.M.; Hernández-Stefanoni, J.L.; Hernández-Juárez, R.A.; Tetetla-Rangel, E.; López-Martínez, J.O.; Leyequién-Abarca, E.; Tun-Dzul, F.J.; May-Pat, F. Patterns and Correlates of Tropical Dry Forest Structure and Composition in a Highly Replicated Chronosequence in Yucatan, Mexico. Biotropica 2012, 44, 151–162. [Google Scholar] [CrossRef] [Scilit]
- León de la Luz, J.L.; Pérez Navarro, J.; Domínguez, M. La Región Del Cabo de Baja California. In Listados Florísticos de México; Instituto de Biología, Universidad Nacional Autónoma de México: Mexico City, Mexico, 1999. [Google Scholar]
- León de la Luz, J.L.; Domínguez-Cadena, R.; Medel-Narváez, A. Florística de La Selva Baja Caducifolia de La Península de Baja California, México. Bot. Sci. 2012, 90, 143. [Google Scholar] [CrossRef] [Scilit]
- Arriaga, L.; León, J.L. The Mexican Tropical Deciduous Forest of Baja California Sur: A Floristic and Structural Approach. Vegetatio 1989, 84, 45–52. [Google Scholar] [CrossRef] [Scilit]
- Poorter, L.; van der Sande, M.T.; Thompson, J.; Arets, E.J.M.M.; Alarcón, A.; Álvarez-Sánchez, J.; Ascarrunz, N.; Balvanera, P.; Barajas-Guzmán, G.; Boit, A.; et al. Diversity Enhances Carbon Storage in Tropical Forests. Glob. Ecol. Biogeogr. 2015, 24, 1314–1328. [Google Scholar] [CrossRef] [Scilit]
- Pereira, H.M.; Leadley, P.W.; Proença, V.; Alkemade, R.; Scharlemann, J.P.W.; Fernandez-Manjarrés, J.F.; Araújo, M.B.; Balvanera, P.; Biggs, R.; Cheung, W.W.L.; et al. Scenarios for Global Biodiversity in the 21st Century. Science 2010, 330, 1496–1501. [Google Scholar] [CrossRef] [Scilit]
- Leclère, D.; Obersteiner, M.; Barrett, M.; Butchart, S.H.M.; Chaudhary, A.; De Palma, A.; DeClerck, F.A.J.; Di Marco, M.; Doelman, J.C.; Dürauer, M.; et al. Bending the Curve of Terrestrial Biodiversity Needs an Integrated Strategy. Nature 2020, 585, 551–556. [Google Scholar] [CrossRef] [Scilit] [PubMed]
- Gamboa-Blanco, E.A.; Dupuy, J.M.; Portillo-Quintero, C.A.; Caughlin, T.; Hernández-Stefanoni, J.L. Effects of Successional Age, Plot Size, and Tree Size on the Relationship between Diversity and Aboveground Biomass in Tropical Dry Forests. Plant Ecol. 2024, 225, 803–817. [Google Scholar] [CrossRef] [Scilit]
- Ali, A.; Wang, L.Q. Big-Sized Trees and Forest Functioning: Current Knowledge and Future Perspectives. Ecol. Indic. 2021, 127, 107760. [Google Scholar] [CrossRef] [Scilit]
- Yang, B.Y.; Ali, A.; Xu, M.S.; Guan, M.S.; Li, Y.; Zhang, X.N.; He, X.M.; Yang, X.D. Large Plants Enhance Aboveground Biomass in Arid Natural Forest and Plantation along Differential Abiotic and Biotic Conditions. Front. Plant Sci. 2022, 13, 999793. [Google Scholar] [CrossRef] [Scilit] [PubMed]
- Montaño, N.; Ayala, F.; Bullock, S.; Briones, O.; Oliva, F.; Sánchez, R.; Maya, Y.; Perroni, Y.; Siebe, C.; Torres, Y.; et al. Almacenes y Flujos de Carbono En Ecosistemas Áridos y Semiáridos de México: Síntesis y Perpectivas. Carbon Stocks and Fluxes in Arid and Semiarid Ecosystems of Mexico: Synthesis and Prospects. Terra Latinoam. 2016, 34, 39–59. [Google Scholar]
- Martinez-Yrizar, A.; Sarukhan, J.; Perez-Jimenez, A.; Rincon, E.; Maass, J.M.; Solis-Magallanes, A.; Cervantes, L.; Sarukhan, J.; Alfredo, A.; Perez-Jimenez, P.J.; et al. Above-Ground Phytomass of a Tropical Deciduous Forest on the Coast of Jalisco, Mexico. J. Trop. Ecol. 1992, 8, 87–96. [Google Scholar] [CrossRef] [Scilit]
- Rascón-Ayala, J.M.; Alanís-Rodríguez, E.; Mora-Olivo, A.; Buendía-Rodríguez, E.; Sánchez-Castillo, L.; Silva-García, J.E. Differences in Vegetation Structure and Diversity of a Forest in an Altitudinal Gradient of the Sierra La Laguna Biosphere Reserve, Mexico. Bot. Sci. 2018, 96, 598–608. [Google Scholar] [CrossRef] [Scilit]
- Búrquez, A.; Martínez-Yrízar, A.; Núñez, S.; Quintero, T.; Aparicio, A. Aboveground Biomass in Three Sonoran Desert Communities: Variability within and among Sites Using Replicated Plot Harvesting. J. Arid Environ. 2010, 74, 1240–1247. [Google Scholar] [CrossRef] [Scilit]

Disclaimer/Publisher’s Note: The statements, opinions and data contained in all publications are solely those of the individual author(s) and contributor(s) and not of MDPI and/or the editor(s). MDPI and/or the editor(s) disclaim responsibility for any injury to people or property resulting from any ideas, methods, instructions or products referred to in the content. |
© 2026 by the authors. Licensee MDPI, Basel, Switzerland. This article is an open access article distributed under the terms and conditions of the Creative Commons Attribution (CC BY) license.