


Abstract
Cunninghamia lanceolata Lamb. occupies a significant role in artificial forests globally, making its sustainable management crucial for terrestrial forest ecology. We experimentally determined soil physicochemical properties and the shrub and herb diversity of different age classes of Cunninghamia lanceolata plantations in Southwest China in 2023. The Mantel tests, RDA, and PLS-SEM were used to analyze the effects of stand factors on soil fertility and shrub and herb diversity. Shrub and herb diversity, as well as soil physicochemical properties, vary significantly across age classes in Cunninghamia lanceolata plantations. The maximum values of organic carbon, total nitrogen, total phosphorus, and available silicon were observed in the mature forest (36.62 g/kg, 1.90 g/kg, 0.53 g/kg, and 84.33 mg/kg, respectively), while the minimum values were found in the middle-aged forest (17.77 g/kg, 0.81 g/kg, 0.34 g/kg, and 53.70 mg/kg). TPH was the most influential stand factor. TBH was strongly correlated with RDA1 (r = 0.821, p < 0.001); soil organic carbon, total nitrogen, total phosphorus, and available silicon were negatively correlated with stand density. In this study, we propose a detailed age class-based thinning plan with strong implementability: cultivating large-diameter timber, maintaining soil fertility and understory plant diversity, and being friendly to forest farm management personnel. This approach could enhance biodiversity and ecosystem stability in Cunninghamia lanceolata plantations and serves as a reference for the sustainable management and operation of the Cunninghamia lanceolata forest ecosystem.
1. Introduction
The worldwide habitats for Cunninghamia lanceolata Lamb. span Asia, Europe, and North America, predominantly in China’s subtropical areas. This rapidly expanding coniferous forest species in the subtropical region is China’s largest man-made forest, ranking highly among global artificial forests [1,2]. The expanse of China’s fir plantation covers 990.20 × 10⁴ hm2 and a stand volume of 7.55 × 10⁸ m3. Cunninghamia lanceolata stands at 17.33% and 22.30%, making it the most significant species of artificial forest in China [3].
Understory soil forms the essential substrate of the forest ecosystem, underpinning its growth and overall functionality. As the primary source of essential nutrients, soil physicochemical properties govern plant growth and the circulation of matter and energy within the ecosystem. This material circulation involves plant roots absorbing nutrients and water from the soil, utilizing them for growth, and ultimately returning them to the soil via litterfall. Throughout this process, soil nutrient content, texture, and moisture significantly influence tree growth. Conversely, the growth of trees at different developmental stages also affects soil nutrients, properties, and understory plant species richness [4,5,6,7,8,9,10,11,12,13,14,15,16,17,18]. The majority of Cunninghamia lanceolata in China consists of pure plantations, characterized by continuous cropping and high initial planting densities. This results in a simple community composition, diminished biodiversity, and stunted understory vegetation growth. Such elements have exacerbated soil deterioration, reduced soil fertility, and decreased sustained productivity, posing a significant risk to the sustainable stewardship of these forests [19,20,21,22,23,24].
Age class, stand factors, and management strategies greatly affect the evolving diversity of undergrowth species and characteristics of soil [25]. In diverse age classes, the diversity of undergrowth species in Cunninghamia lanceolata forests exhibits a marked shift. During the 3–5-year phase of a young forest, vegetation beneath the forest is abundant, but its formations are comparatively uncomplicated. As the forest gradually develops, the space beneath it, blanketed by vegetation, is also slowly diminishing. With age class increases and thinning, the vegetation beneath forests regains its richness, creating a diverse and multi-tiered ecological community [26].
Stand density serves as a key controllable element in plantation management, profoundly affecting the Cunninghamia lanceolata plantation ecosystem. Changes in stand density alter the growth environment and lead to adjustments in stand structure [27,28,29,30]. Such changes greatly influence a tree’s initial growth stages, individual competition and differentiation, and the stand’s ability to utilize sunlight, soil nutrients, and water resources. An optimal stand density can guide its development toward a robust structure, sustaining forest land fertility over time, enhancing tree productivity, and maximizing the ecological advantages of forests [24,31,32,33,34,35]. Concurrently, it creates an environment conducive to enhancing the understory [36]; effective understory growth can significantly increase soil organic matter levels, accelerate nutrient recycling, and improve soil physical and chemical traits [37,38,39,40,41]. Thinning management significantly improved soil aeration, nutrient content, and the vertical distribution pattern of understory vegetation [20,42], thereby promoting understory vegetation growth. The greater the intensity of thinning, the higher the diversity of understory vegetation. However, excessive thinning can lead to soil erosion and nutrient loss. Reasonable thinning is conducive to maintaining plant stability and diversity and can also ensure soil fertility. Reasonable thinning is an important management measure to enhance the ecological benefits of Cunninghamia lanceolata plantations [43,44,45]. Current studies have linked thinning to soil properties or understory diversity; these studies have qualitatively described the impacts of stand density management or thinning on soil fertility and plant diversity. However, few studies use models to clearly and intuitively reflect the influence of stand density on soil and shrub and grass diversity and have translated such relationships into a practical, age-class-based thinning schedule for Cunninghamia lanceolata planting areas.
Our research suggested a couple of hypotheses, the first being that soil physicochemical properties and understory plant diversity differ significantly among age classes. The second hypothesis is that stand density is the main stand factor driving these changes. Thinning plans based on age class can equilibrate forest growth, soil fertility, and understorey vegetation diversity. To confirm these hypotheses, we experimentally determined the physicochemical properties of soil samples from the 0–10, 10–20, and 20–30 cm soil layers. An investigation of Cunninghamia lanceolata plantations in different age classes was carried out. We calculated species diversity indicators for the shrub and herbaceous layers in Cunninghamia lanceolata plantations of different ages. The aim was to explore the variation laws of understorey plant diversity and soil physicochemical properties with age class; to put forward corresponding thinning suggestions that influence understorey vegetation diversity and soil physicochemical properties; and to provide scientific support for the scientific planting, tending management, and sustainable management of Cunninghamia lanceolata plantations.
2. Materials and Methods
2.1. Introduction to Study Area
Located in Chishui City, Guizhou Province, China, the study area is situated within a mid-subtropical region characterized by a moist monsoon climate. This region is characterized by an average annual temperature of 18.1 °C and an average annual precipitation of 1292.3 mm, with the soil predominantly composed of purple soil. The study area features exposed Mesozoic (Jurassic, Cretaceous) and Cenozoic (Quaternary) strata [46,47], with purple-red fine sandy (mud) rock residual slope deposits serving as the primary soil parent material. Consequently, purple soils are the predominant soil type in the region. The soil thickness is approximately 70 cm. According to WRB, the purple soil was classified as Cambisol [48]. The region is predominantly characterized by the presence of evergreen oak. The landscape features a diverse mix of evergreen–deciduous forest, extensive pine forest, Cunninghamia lanceolata forest, and Phyllostachys edulis forest [49]. We selected a pure Cunninghamia lanceolata plantation within the forest farm as our sampling area. The primary shrubs in questions are Camellia japonica, Smilax lanceifolia Roxb, and Rubus hunanensis in this sample region. The primary herbaceous plant species are Rubus hunanensis, Athyrium filix-femina, Cyclosorus interruptus and Cyclosorus parasiticus, dicranopteris pedata, diplopterygium chinense, Lophatherum gracile, Rubus buergeri, and Pteridium aquilinum.
2.2. Choosing Sampling Areas and Collecting Samples
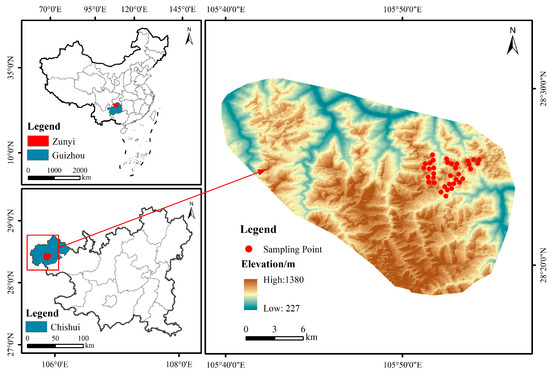
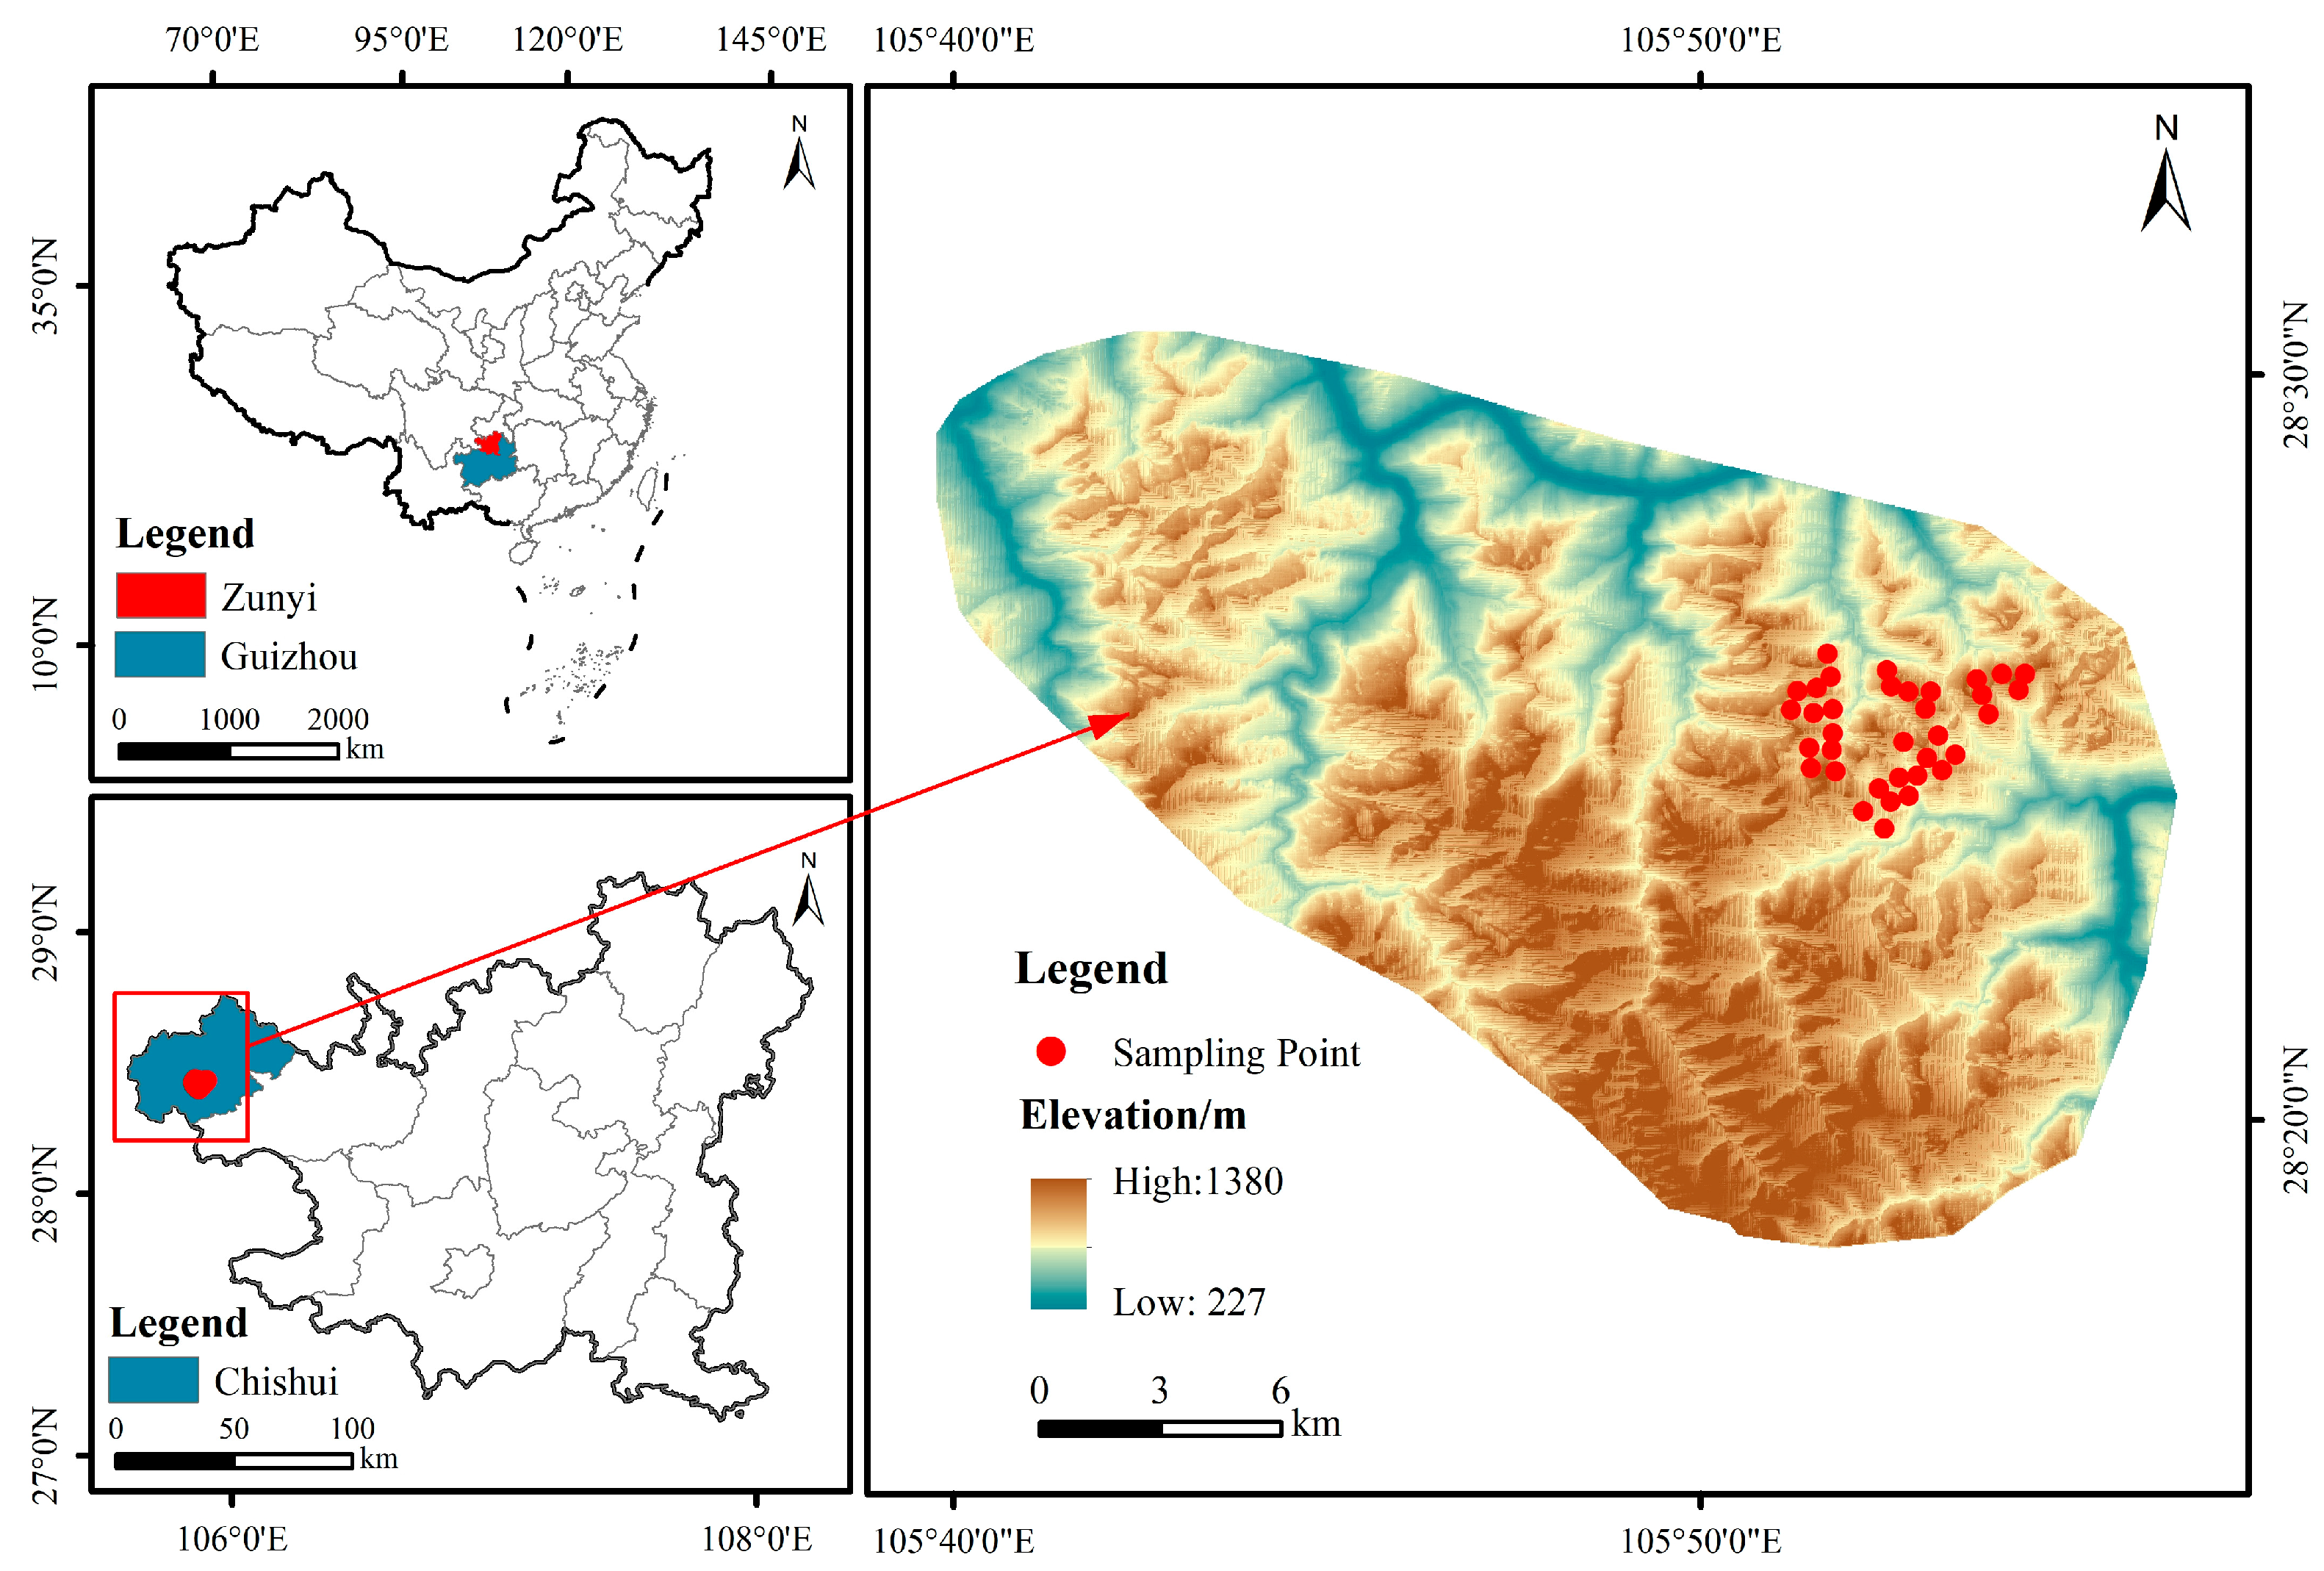
We collected samples in July 2023. We selected young forest 1 (Age Class I, 2 years), young forest 2 (Age Class II, 10 years), a middle-aged forest (Age Class IV, 17 years), and a mature forest (Age Class VI, 28 years) [50]. In the following text, young forest 1 is represented by YYF1, young forest 2 is represented by YYF2, the middle-aged forest is represented by MAF, and the mature forest is represented by MMF. We conducted extensive field investigations and selected sampling areas with similar site conditions; shrub and herb types and soil types were relatively consistent to ensure uniformity across the sampling areas. The sampling areas are all located in state-owned forest farms where Cunninghamia lanceolata trees are continuously planted. The initial density was set to a uniform standard, with an initial planting density of 3086 trees·hm−2. We used 36 quadrats (Figure 1, Table 1), and the size of our sample square was 20 by 20. In each quadrat, we counted the number of Cunninghamia lanceolata trees in each sample plot, measured the diameter at breast height and tree height of each tree; calculated the canopy closure and stand density of Cunninghamia lanceolata forests in the sample plots; and recorded environmental factors—altitude, slope position, and slope. Three 5 m × 5 m plots were randomly set up in the sample plots for shrub investigation, and three 1 m × 1 m plots were set up for herb investigation. We selected Cunninghamia lanceolata wood with an average diameter at breast height and at tree height near the sample square as the standard wood, and collected rhizosphere soil. We collected soil samples from three depths: the first layer (0–10 cm), the second layer (10–20 cm), and the third layer (20–30 cm), resulting in a total of 108 samples. For each age class, twenty-seven soil samples were collected.
Figure 1.
The geographical location of sampling quadrats.
Table 1.
Basic information on the Cunninghamia lanceolata Lamb.
2.3. Measurement Method of Soil Physicochemical Properties and Understorey Vegetation Diversity
The process of analyzing soil samples required removing plants, animal remains, and gravel, followed by natural air drying at room temperature and then grinding. Afterwards, the collected soil samples were filtered for future use and stored in sterile, sealed containers to evaluate their physicochemical properties.
2.3.1. Physical Properties Determination
We employed the soil ring knife technique to determine the bulk density (BD), capillary porosity (CP), field capacity (FC), and gravimetric water content (GWC) [51,52,53]. Total porosity and non-capillary porosity were calculated using Formulas (1) and (2).
Total porosity (STP) = 93.947 − 32.995 × bulk density (BD)
Non capillary (NCP) = total porosity (STP) − capillary porosity (CP)
2.3.2. Determination of Chemical Properties
The determination methods of soil chemical properties are described in detail in Table 2.
Table 2.
Determination methods of soil Chemical properties.
Understory Vegetation Survey and Diversity Analysis
A survey on the understory vegetation diversity was conducted within each sample plot. Five 1 m × 1 m quadrats were set at the four corners and the center of each plot. Within each quadrat, all understory species (including herbaceous plants and shrubs with a height < 1 m) were identified. Species identification was performed by experienced botanists, primarily based on morphological characteristics. For uncertain specimens, voucher samples were collected and verified by comparison with herbarium specimens or by consulting regional floras.
Species diversity was characterized using the following indices based on abundance: the Simpson index (R), Shannon–Wiener index (H′), Pielou evenness index (E), and Margalef index (F) [57] were utilized to assess species diversity according to Formulas (3)–(6).
In the formulas, S represents the total number of species in the community, Pi is the proportion of the i-th species in the sample plot to the total number of individuals of all species, and N is the total number of individuals of all species in the sample plots.
2.3.3. Litter Biomass Monitoring
We set up 1 m × 1 m litter collection nets in each sampling area. Every month, we collected the litter of the Cunninghamia lanceolata, removed impurities, and dried and weighed them. The total monitoring period was two years, and then we obtained the litter biomass data of the Cunninghamia lanceolata.
2.4. Statistical Analysis
We evaluated differences among variables using one-way ANOVA and the LSR analysis method. The creation of graphs was conducted using Origin 7.5 (OriginLab Corp., Northampton, MA, USA) and R software (version 4.3.0; R Foundation for Statistical Computing, Vienna, Austria). Using Spearman’s correlation coefficients, the relationships among understorey vegetation diversity, soil physicochemical properties, and stand factors were examined using the R ggplot package. Redundancy analysis (RDA) was conducted, and the results were graphed using the vegan package in R. We set the stand factors as the explanatory variables, with soil physicochemical properties and the shrub and grass diversity indices as the response variables. We conducted standardized, centralized, and multivariate transformation tests (Permanova). PLS-SEM (The graph was conducted using SmartPLS version 4.1.1.7 (SmartPLS GmbH, Bönningstedt, Germany)) was employed to analyze the path relationships among stand density, soil physicochemical properties, and shrub and herb diversity. The measurement model was evaluated by examining indicator loadings (all > 0.70), composite reliability (CR > 0.70), and average variance extracted (AVE < 0.50) [58]. A threshold of VIF < 5 was adopted to indicate the absence of multicollinearity issues [59]. The path coefficients (β) with their corresponding standard errors (SE), t-values, and significance levels (p-values) were reported for all hypothesized paths. The R2 values for key endogenous variables and the GOODNESS-OF-FIT are also provided to indicate the model’s explanatory power.
3. Results
3.1. Soil Physical Properties
3.1.1. Soil Bulk Density
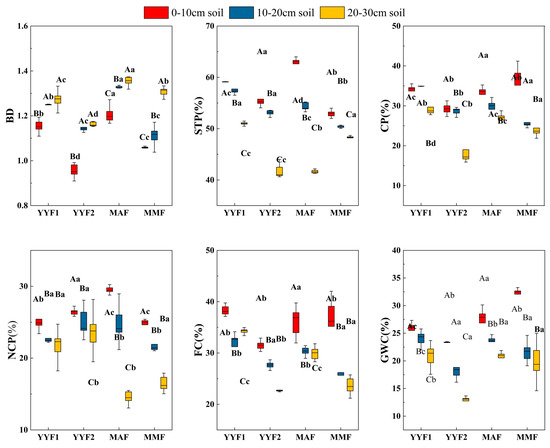
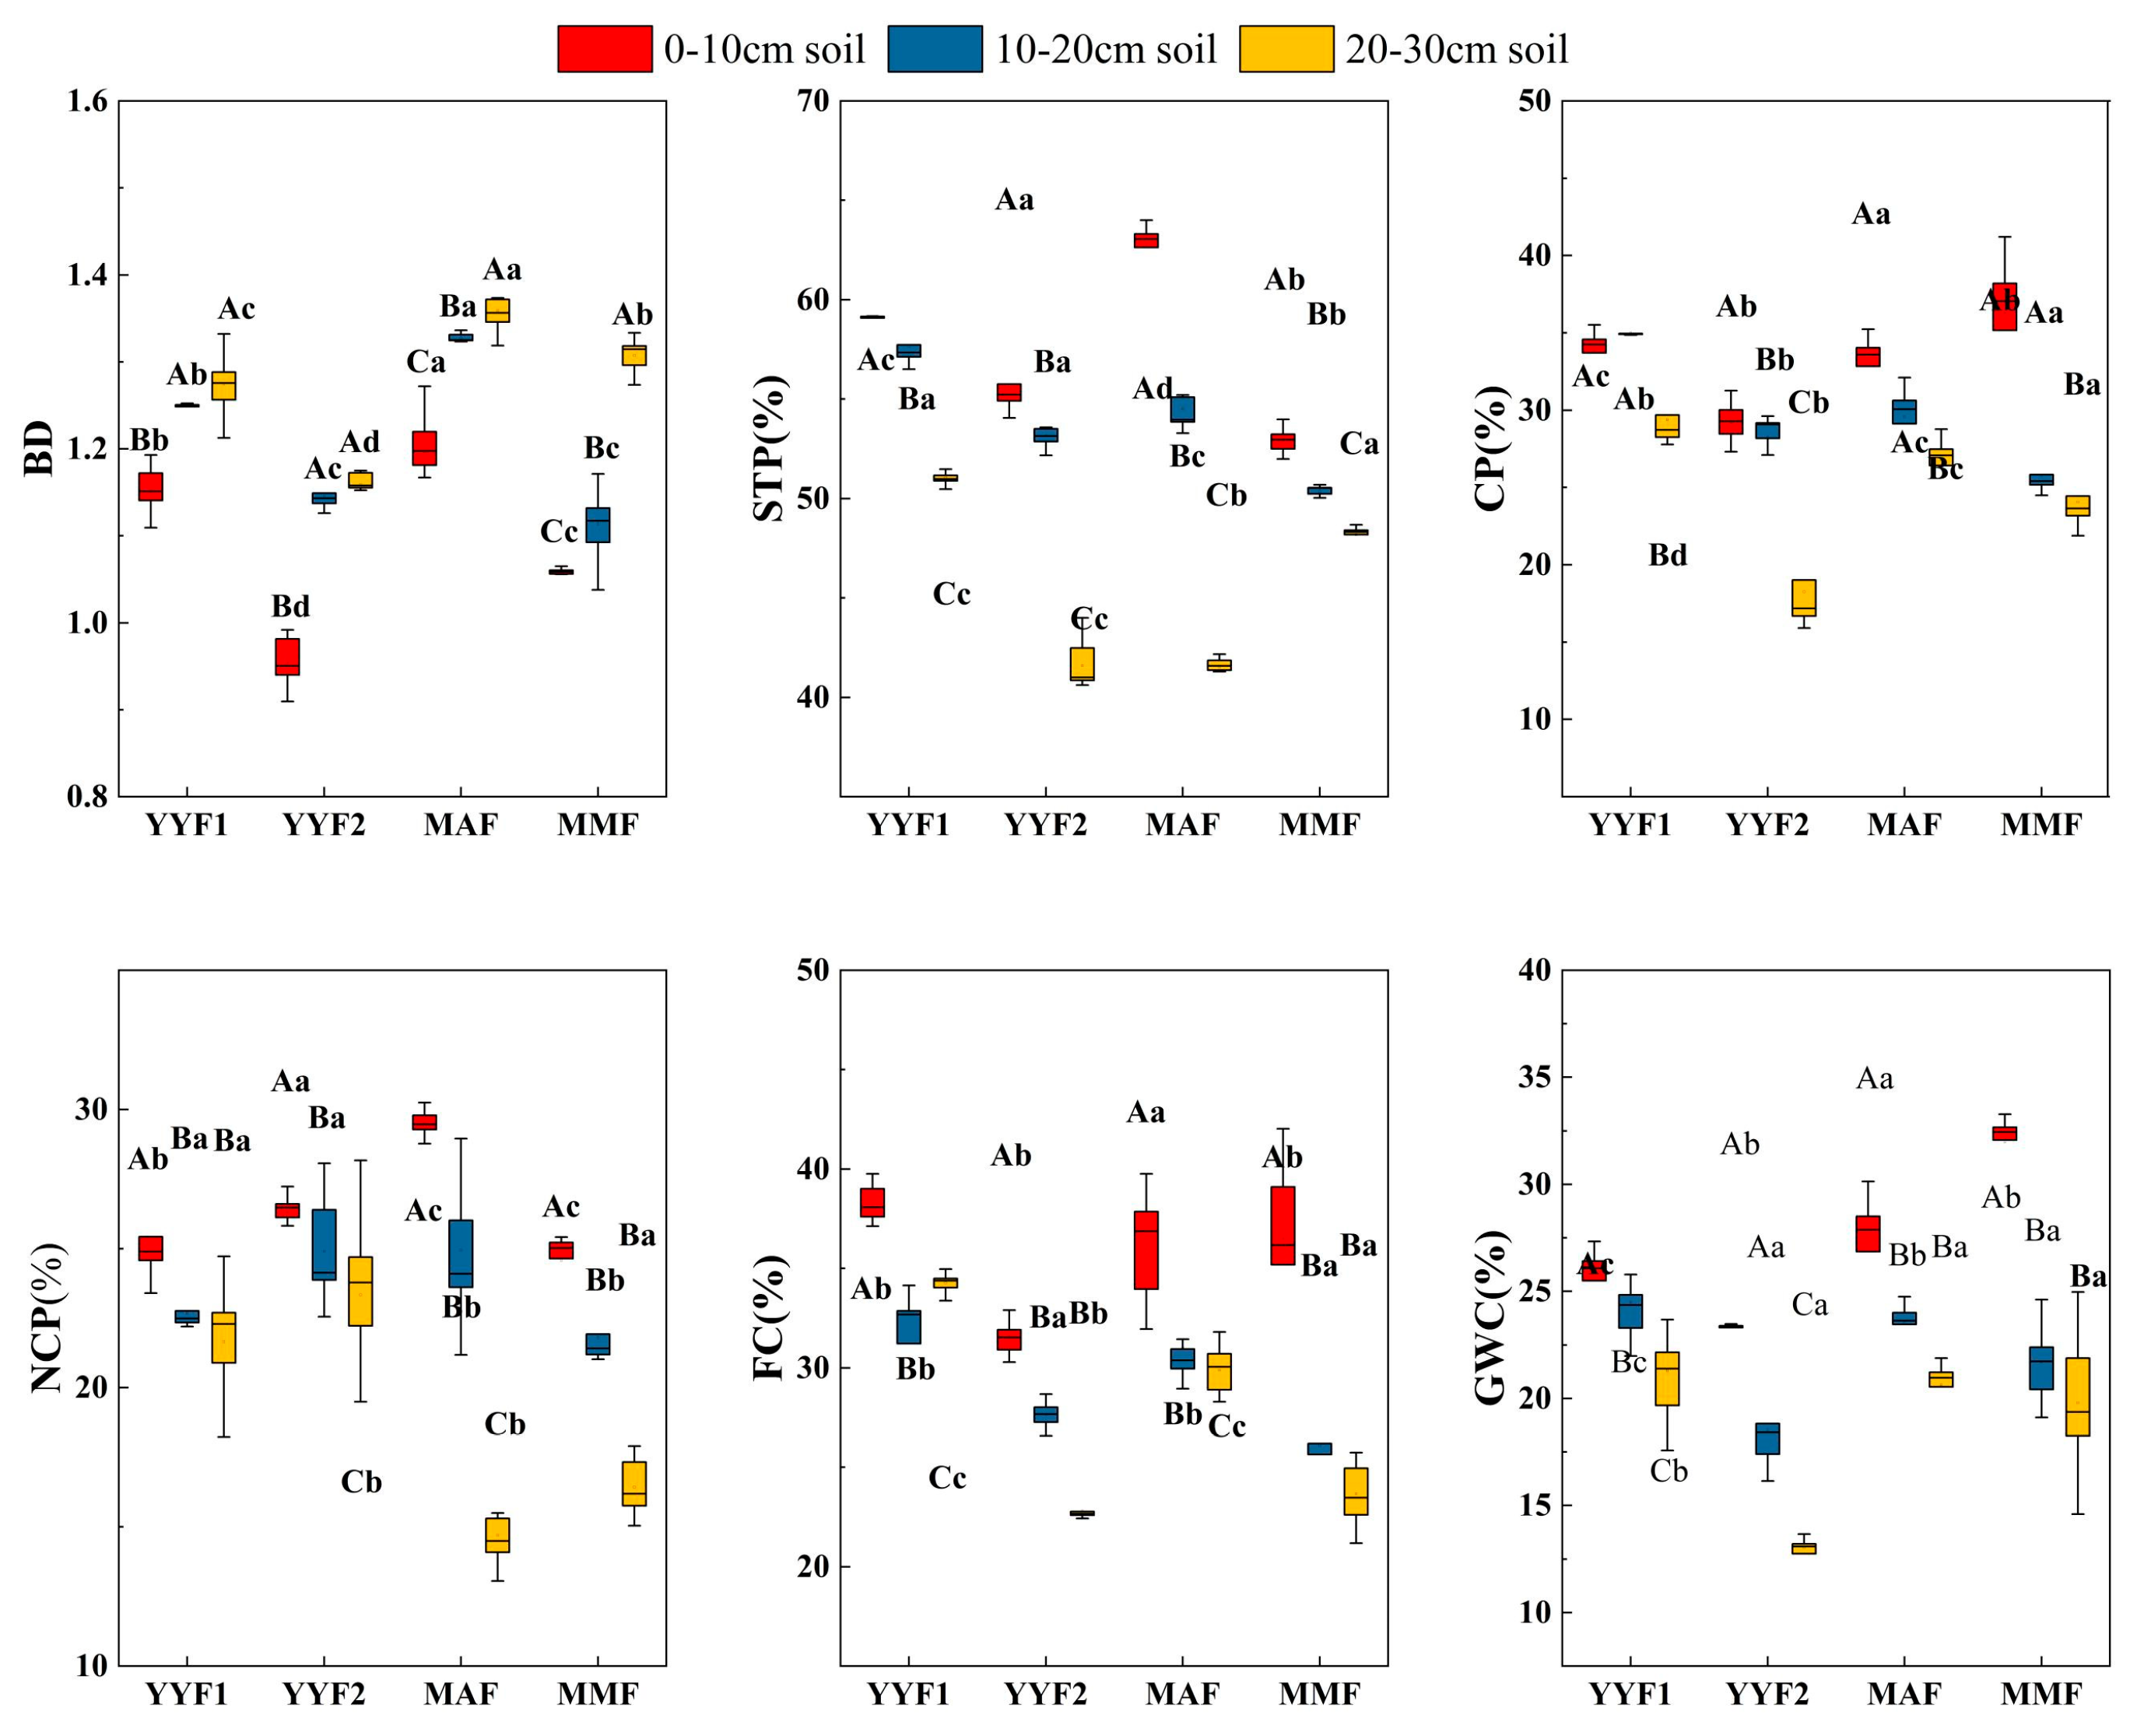
Soil bulk density ranged from 0.96 to 1.36 g·cm−3, with the highest values in MMF and the lowest in MAF (Figure 2). Bulk density consistently increased with soil depth across all age classes. In the first layer, bulk density differed significantly among all age classes. In the second and third layers, MAF and MMF were higher than in the young forests (YYF1, YYF2), and all age classes differed significantly from each other in the third layer. YYF1, YYF2, and MAF exhibited significant differences only between the first and second layers, while MMF differed significantly across all three layers.
Figure 2.
The soil physical properties of Cunninghamia lanceolata plantations of different age classes. Note: significance among different soil layers of the same age class is indicated by distinct capital letters. The significance of different age classes in the same soil layer is indicated by different lowercase letters. The abbreviations in the figure are detailed at the end of this paper.
3.1.2. Soil Total Porosity
Total porosity in the Cunninghamia lanceolata plantations ranged from 41.54% to 62.84% across all age classes (Figure 2). Across all age classes, the first soil layer had the highest content, while notable differences were observed among the soil layers. Porosity decreased consistently with soil depth, with the first layer exhibiting the highest values across all age classes. In the first and second layers, total porosity varied significantly among age classes. In the third layer, porosity remained significantly different across most age classes, except for YYF2 and MAF, for which no significant difference was detected. The variation patterns of soil depth in different forest ages are consistent. There are significant differences between the first and second layers, and between the first and third layers, but no significant differences between the second and third layers.
3.1.3. Soil Capillary Porosity
Soil capillary porosity in the Cunninghamia lanceolata plantations ranged from 18.26% to 36.30% across all samples, with the highest values consistently observed in the first layer of all age classes (Figure 2). In the first layer, capillary porosity was highest in MMF and lowest in YYF1, following the order MMF > MAF > YYF2 > YYF1. No significant difference was detected between the two young forests (YYF1 and YYF2), but both differed significantly from MAF and MMF. In the second layer, YYF2 and MAF showed similar values (no significant difference), while both differed significantly from MMF and YYF1. In the third layer, significant differences were observed across all age classes, with MMF remaining the highest and YYF1 the lowest. In YYF2, capillary porosity decreased progressively with depth: the first layer was significantly higher than the second layer, and the second layer was significantly higher than the third layer. In MAF, all three layers differed significantly from one another, with the surface layer exhibiting the highest values. In MMF, the surface layer was significantly higher than both subsurface layers, but no significant difference was found between the second and third layers. In YYF1, the first layer did not differ significantly from the second and third layers, although both differed significantly from the first layer.
3.1.4. Soil Non-Capillary Porosity
Soil non-capillary porosity in Cunninghamia lanceolata plantations ranged from 14.71% to 29.48%, with the surface layer exhibiting the highest values in all age classes (Figure 2). In the first layer, non-capillary porosity was highest in MMF and YYF1, with no significant difference detected between these two age classes. However, both MMF and YYF1 differed significantly from YYF2 to MAF. In the second layer, no significant differences were observed between MMF and YYF1, nor between YYF2 and MAF.
In the third layer, the pattern was more complex: YYF2 and MMF showed similar values (no significant difference), while both differed significantly from MAF and YYF1. MAF and YYF1 also differed significantly from each other in this layer. Vertical variation patterns differed by age classes. In YYF2, non-capillary porosity decreased progressively with depth: the first layer was significantly higher than the other layers, but no significant difference was found between the second and third layers. In MAF, all three layers differed significantly from one another, with the surface layer exhibiting the highest values. In MMF, the surface layer was significantly higher than the other layers, while the second and third layers did not differ significantly. In YYF1, a similar pattern to YYF2 was observed: the surface layer was significantly higher than the deeper layers, with no significant difference between the second and third layers.
3.1.5. Soil Field Capacity
Soil field capacity in Cunninghamia lanceolata plantations ranged from 22.79% to 38.25%, with the first layer exhibiting the highest values in all age classes (Figure 2). In the first layer, no significant differences were detected among MMF, YYF1, and YYF2, indicating similar field capacity in the topsoil of these age classes. However, all three differed significantly from MAF, which showed lower values. At 10–20 cm and 20–30 cm, a different pattern emerged: MAF and MMF showed similar values (no significant difference), while both differed significantly from YYF2 and YYF1. This suggests that the MAF and MMF share a similar field capacity in deeper soils, distinct from the YYF2 and YYF1. Vertical variation patterns differed by forest type. In YYF2, field capacity decreased progressively with depth, with all three layers differing significantly from one another. In MAF, the first layer was significantly higher than both deeper layers, but no significant difference was found between the second and third layers. In MMF, all three layers differed significantly from one another, similar to the pattern observed in YYF2. In YYF1, the surface layer was significantly higher than the deeper layers, while the second and third layers did not differ significantly, resembling the pattern observed in MAF.
3.1.6. Soil Gravimetric Water Content
Soil gravimetric water content in the Cunninghamia lanceolata plantations ranged from 13% to 32% across all samples, with the first layer exhibiting the highest values in all age classes (Figure 2). In the first and second layers, no significant differences were detected between the two young forests (YYF1 and YYF2), indicating similar gravimetric water content in the upper soils of these age classes. However, both YYF1 and YYF2 differed significantly from MAF and MMF in these layers. In the third layer, a different pattern emerged: YYF1, YYF2, and MMF showed similar values (no significant difference), while all three differed significantly from MAF. This suggests that MAF has a distinct gravimetric water content in the third layer compared to the other age classes. In YYF2, gravimetric water content decreased progressively with depth, with all three layers differing significantly from one another. In MAF, all three layers also differed significantly from one another, as observed in YYF2. In MMF, the surface layer was significantly higher than both deeper layers, but no significant difference was found between the second and third layers. In YYF1, the surface and subsurface layers showed similar values (no significant difference), while both differed significantly from the deepest layer.
3.2. Soil Chemical Properties
3.2.1. Soil pH
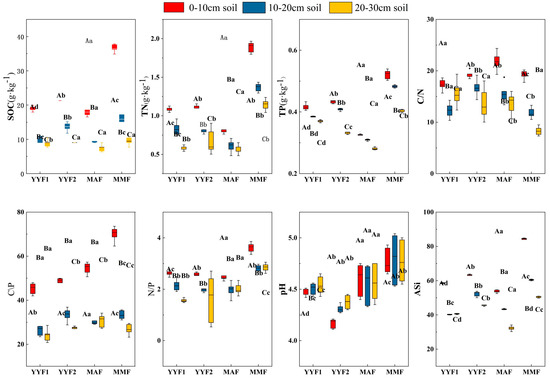
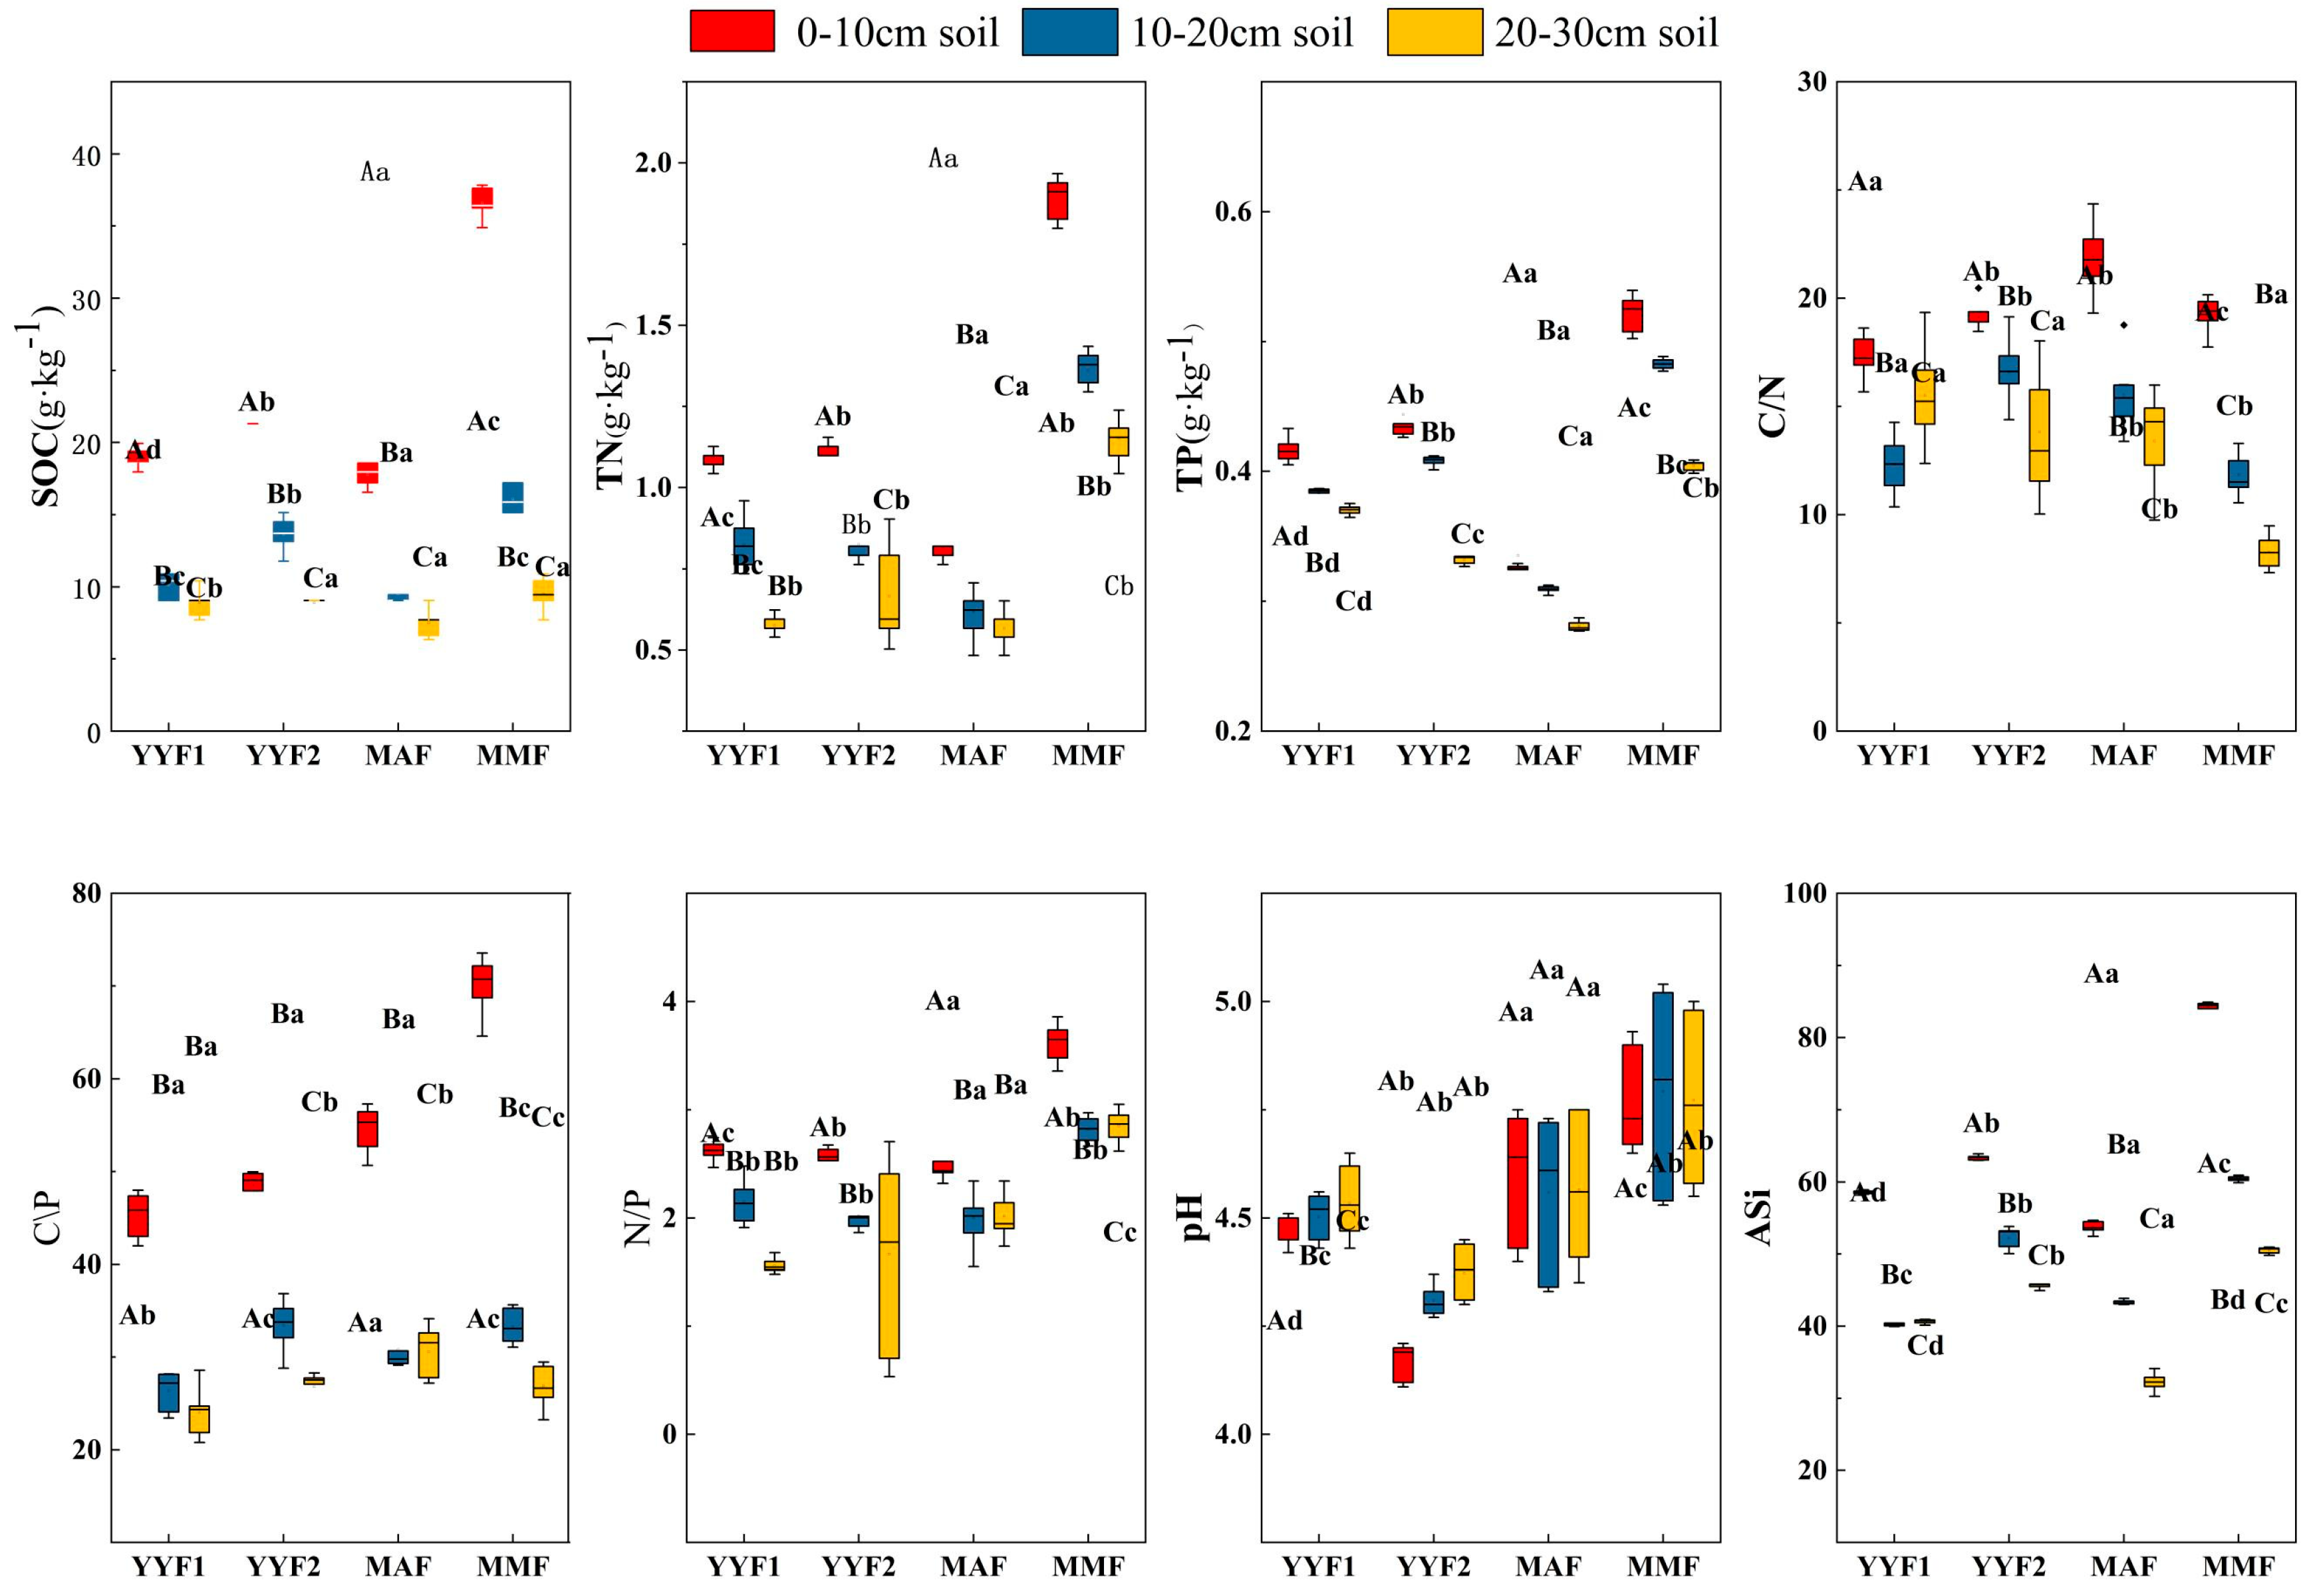
Soil pH in Cunninghamia lanceolata plantations ranged from 4.11 to 5.04 across all samples (Figure 3). In the first layer (0–10 cm), pH values differed significantly among all age classes, with MMF exhibiting the highest value, and YYF1 exhibiting the lowest value. In the second and third layers, a consistent pattern emerged: the two young forests (YYF1 and YYF2) showed similar pH values (no significant difference), while both differed significantly from the mature stands (MAF and MMF). This suggests that the pH distinction between young and mature forests persists throughout the soil profile, with mature stands exhibiting higher pH. In MAF, pH decreased progressively with depth, with all three layers differing significantly from one another. In contrast, YYF1, YYF2, and MMF showed no significant differences in pH across soil layers, indicating uniform pH conditions throughout the profile in these age classes.
Figure 3.
The characteristics of soil chemical properties in Cunninghamia lanceolata plantations of different age classes. Note: significance among different soil layers of the same age class is indicated by distinct capital letters. The significance of different age classes in the same soil layer is indicated by different lowercase letters. The abbreviations in the figure are detailed at the end of the paper.
3.2.2. Soil Available Silicon
The available silicon varied in the range of 40.62–58.57 mg·kg−1 in YYF1, 45.69–63.36 mg·kg−1 in YYF2, 35.01–53.70 mg·kg−1 in MAF, and 50.52–84.33 mg·kg−1 in MMF (Figure 3). The average available silicon value declined with increasing soil depth, indicating a notable accumulation in the uppermost layer. Across the three layers, MMF exhibited the highest available silicon levels, with notable variations among other age classes. Across all age classes, the available silicon in the first soil layer exhibited the highest concentration, with notable variations among soil layers.
3.2.3. Soil Organic Carbon
The soil organic carbon content ranged from 7.50 to 36.62 g per kilogram (Figure 3). Significant variations were noted in the first soil layer across all age classes. In the second soil layer, no significant difference was observed between MAF and YYF1, but notable distinctions were observed between them and YYF2 and MMF. In the third soil layer, distinct variations were observed between MAF and other forests. However, no notable distinction was observed among YYF1, YYF2, and MMF. Across age classes, the organic carbon in the first soil layer was highest, and there was notable variation among all soil layers.
3.2.4. Soil Total Nitrogen
The total nitrogen varied between 0.55 and 1.90 g per kilogram (Figure 3). The nitrogen content in the first soil layer was the highest among all the tested layers. In the first soil layer and the second soil layer, there was no notable variation in the total nitrogen between YYF1 and YYF2. However, notable distinctions were identified between them and MAF and MMF. In the third soil layer, there was no significant difference in total nitrogen between MMF and other forests. No notable distinctions were observed among YYF1, YYF2, and MAF. In MAF, the total nitrogen in the first soil layer was at its peak. A notable distinction was observed between the first and second soil layers. There were also differences in the first and third soil layers. However, no significant difference was detected between the second and third soil layers. In YYF2, MMF, and YYF1, the first soil layer had the highest content, with notable differences observed among various soil layers.
3.2.5. Soil Total Phosphorus
The total phosphorus content fluctuated between 0.28 and 0.53 g per kilogram across all soil layers (Figure 3). The average total phosphorus content was highest in MMF, with significant variation observed across all age classes. Across age groups, for MMF, the highest total phosphorus was observed in the first soil layer, with notable variations among all soil layers.
3.2.6. SOC:TN
The average value of the C:N ratio fluctuated between 8.26 and 51.86 (Figure 3). In the first soil layer, there was no notable distinction found between YYF2 and MMF. However, there were notable distinctions between them and YYF1 and MAF. In the second soil layer, no discernible difference was observed between MMF and YYF1. However, there were notable distinctions between them and YYF2 and MAF. In the third soil layer, a notable distinction was observed between YYF2 and other forest types. However, no substantial variations were observed among YYF1, MAF, and MMF. In MAF, SOC:TN in the first soil layer was the highest, while notable variations were observed across all soil layers. In YYF2, there were no notable variations observed in all soil layers. In MMF, SOC:TN in the first soil layer peaked, with notable variations across soil layers. The study revealed that SOC:TN in the first soil layer within the YYF1 was significantly higher than in other layers, with statistical significance observed among all soil layers.
3.2.7. SOC:TP
The mean value of C:P exhibited variation within the range of 24.00 to 105.56 (Figure 3). In the first soil layer, no significant variation was observed between YYF1 and YYF2. However, notable distinctions were noted between them and MAF and MMF. In the second soil layer, no significant variation was observed between MMF and YYF2, but notable distinctions were observed between them and YYF1 and MAF. In the third soil layer, there was no significant variation observed between YYF2 and MMF, but notable distinctions existed between them and YYF1 and MAF. In MAF, C:P in the first soil layer was the highest. There were notable distinctions between C:P in the first and second soil layers, as well as between the first and third soil layers. However, the compositional disparity between the second and third soil layers was not substantial. In YYF2, C:P in the first layer was the highest. There were no notable variations in all soil layers. In MMF, C:P in the first layer was the highest. There were no notable variations in all soil layers. In YYF1, the highest content was found in the first layer, with notable variations in all soil layers.
3.2.8. TN:TP
The average ratio of N:P fluctuated within the range of 2.45 to 2.78 (Figure 3). In the first and second soil layers, no notable distinction was found between YYF2 and MAF. However, notable distinctions were present between them and YYF1 as well as MMF. In the third soil layer, no significant distinction was observed between YYF1 and YYF2, but notable distinctions arose between them and MAF and MMF. In MAF, TN:TP in the first layer peaked. There were notable variations between the first and second soil layers, as well as between the first and third soil layers. Nevertheless, there was no substantial distinction between the second and third layers. In YYF2, N:P in the first soil layer was the highest. N:P in the soil layers varied significantly, with distinct differences observed between the first and second layer, as well as between the first and third layers. However, there was no notable distinction between the second and third layers. In MMF, N:P ratios in the first soil layer were at their peak. There were notable variations compared to both the second and third layers. Nevertheless, N:P variation between the second and third soil layers was not substantial. In YYF1, N:P in the first layer was the highest, and distinct variations in its levels were noted in different soil layers.
3.3. Understorey Vegetation Diversity
Both shrub and herb layer diversity followed the same order across age classes: MMF > MAF > YYF2 > YYF1. For shrubs, the Shannon–Wiener index, representing overall diversity, was highest in MMF and lowest in YYF1. The Margalef index followed a similar pattern. Compared with YYF2, the diversity indices of MMF increased, with the Simpson index increasing by 36.73% and the Margalef index increasing by 31.79%. Compared to MAF, the diversity indices of MMF increased, with the Simpson index increasing by 7.94% and the Margalef index increasing by 10.17%. Compared to YYF2, the diversity index of MAF increased, with the Simpson index increasing by 26.68% and the Margalef index increasing by 19.62%.
Herbs exhibited a wider range of variation than shrubs. For instance, compared to YYF1, MMF showed increases of over 300% in the Shannon–Wiener and Margalef indices, while differences between MMF and MAF were more moderate (e.g., a 142.5% increase in the Shannon-Wiener index). The mean value of the herb diversity index of MMF was the highest, while the mean value of YYF1 was the lowest, manifesting as MMF > MAF > YYF2 > YYF1. Compared to YYF2, MMF’s diversity index increased, with the Simpson index increasing by 275.76% and the Margalef index increasing by 445.09%. Compared to MAF, the diversity index of MMF increased, with the Simpson index increasing by 103.20% and the Margalef index increasing by 189.07%. Compared to YYF2, the diversity index of MAF increased, with the Simpson index increasing by 84.92% and the Margalef index increasing by 88.56%.
3.4. Correlation Analysis
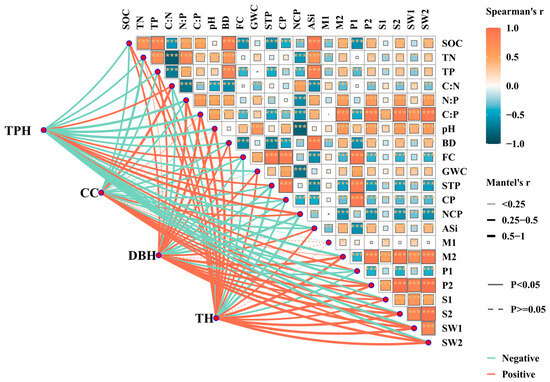
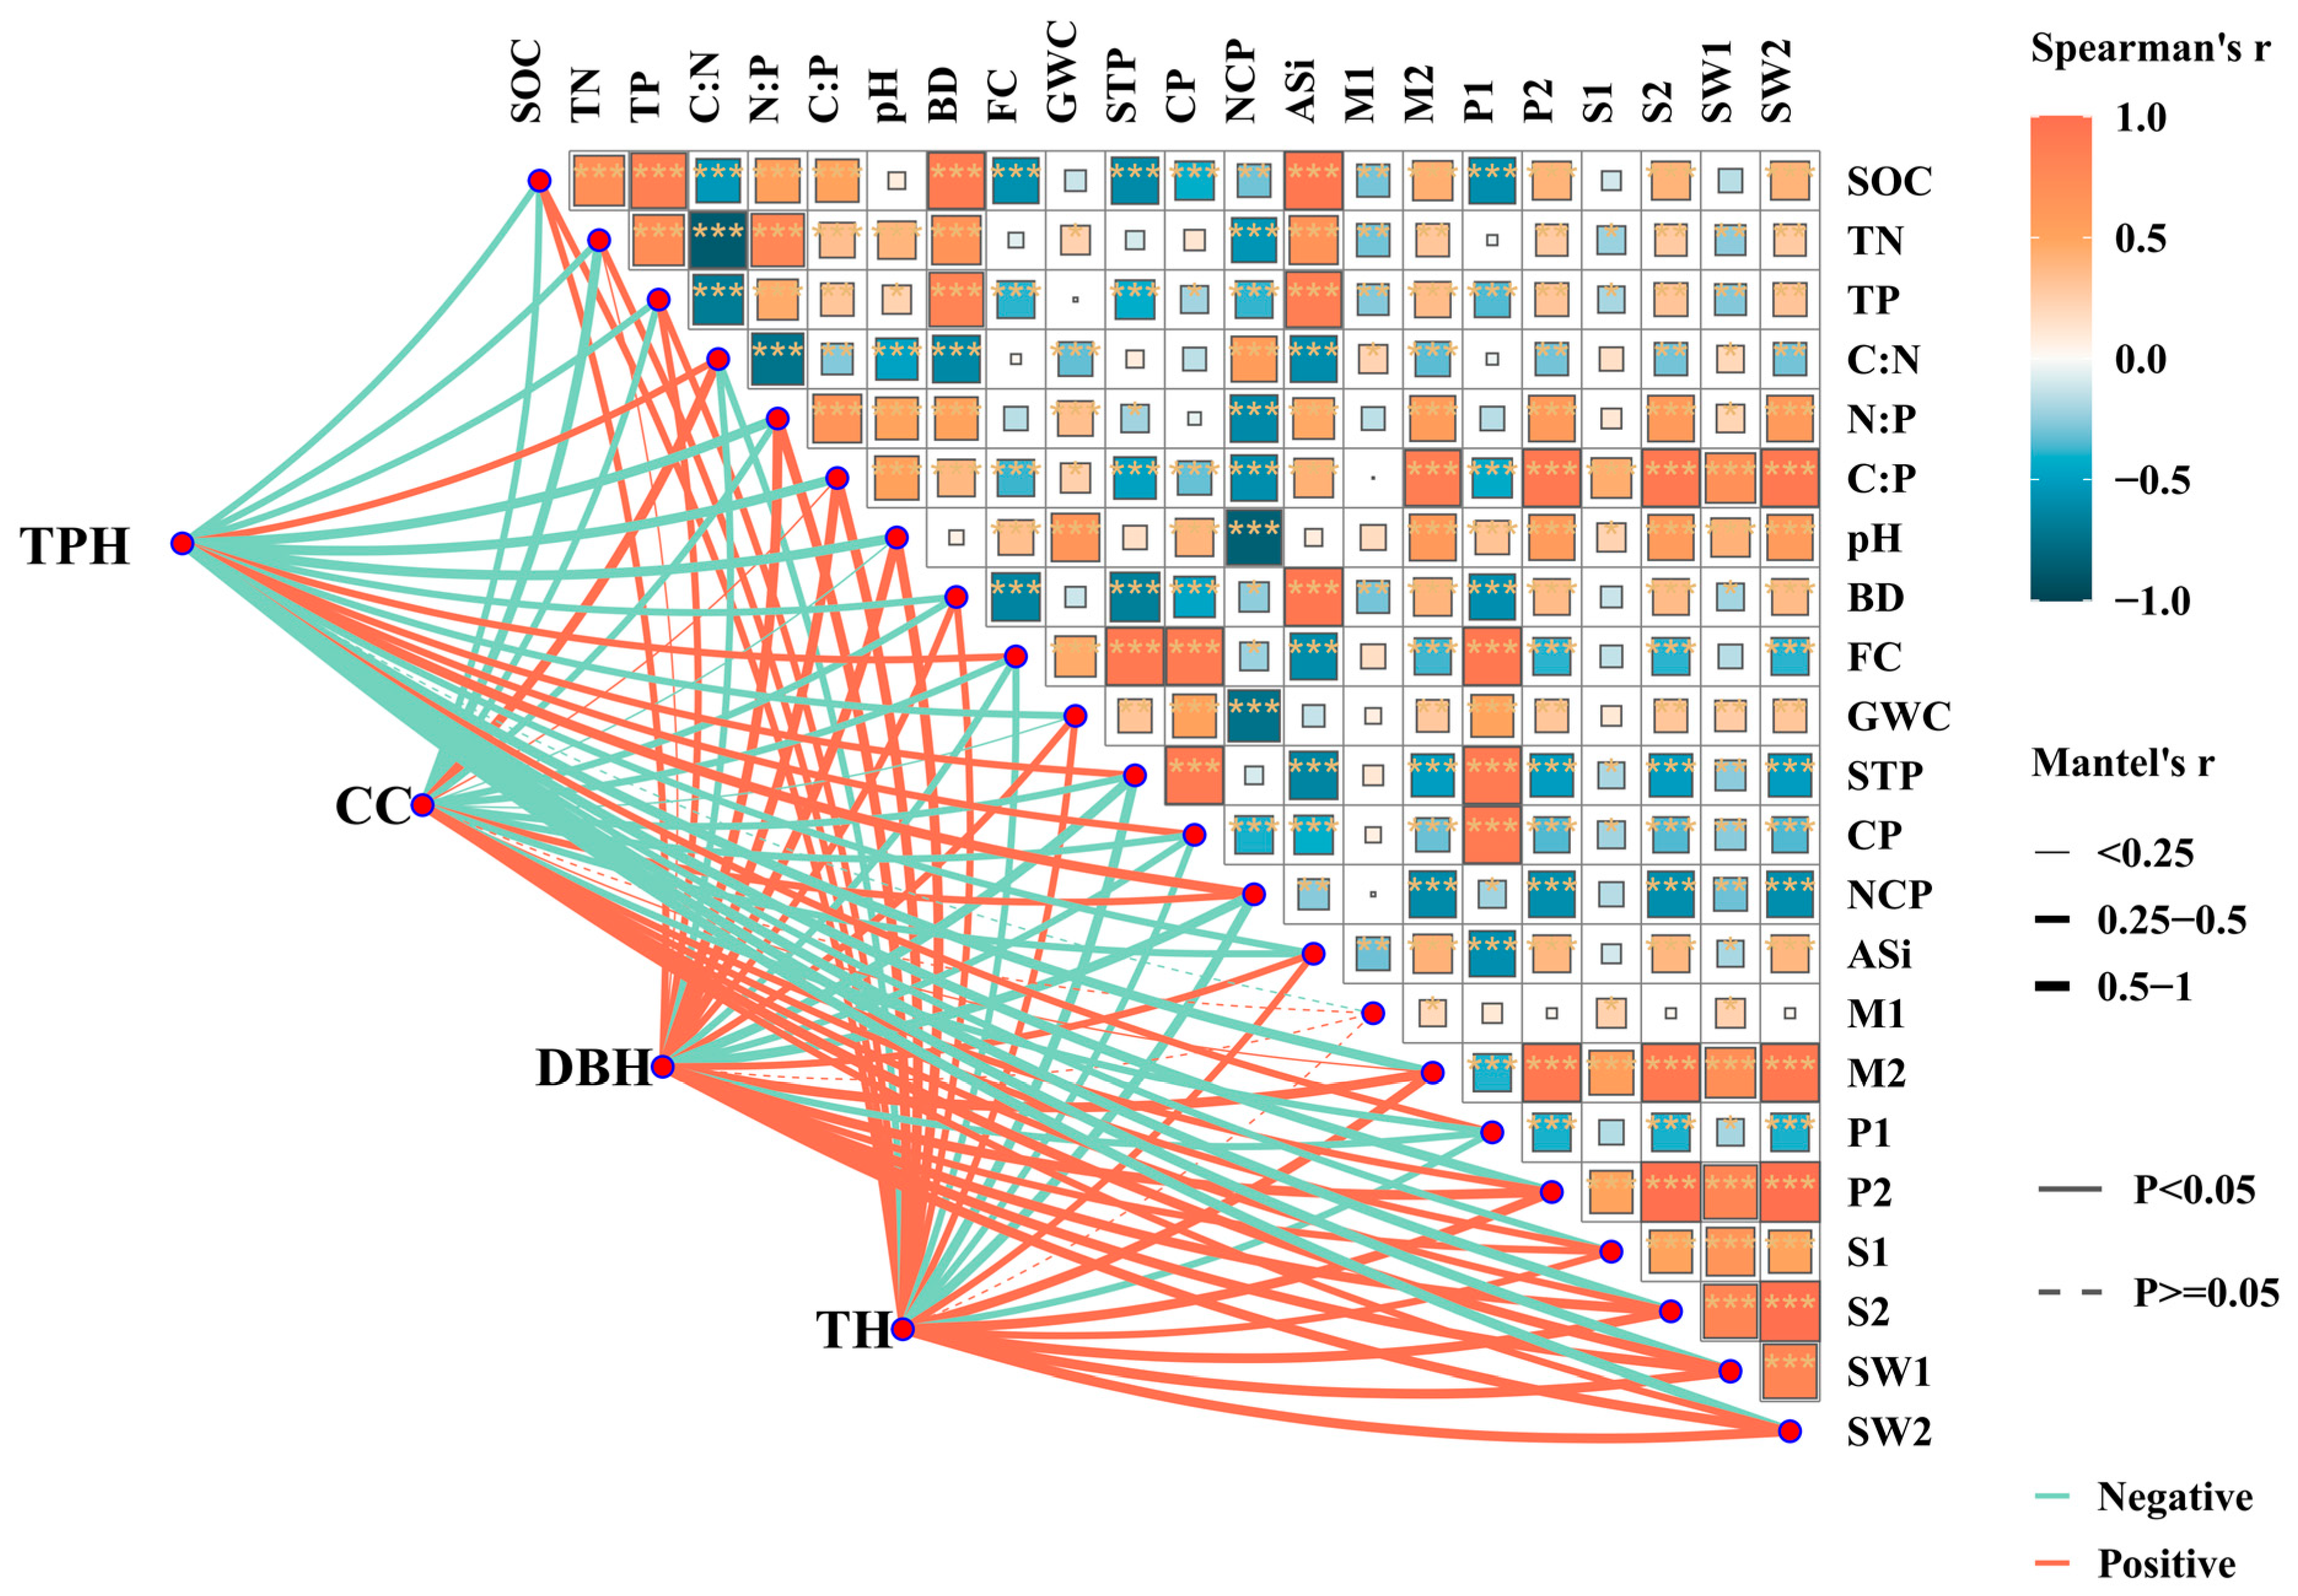
We analyzed the relationships among stand factors, soil physicochemical properties, and shrub and herb diversity (Figure 4). We found that soil physicochemical properties were more strongly correlated with stand density and canopy closure. The diversity of shrubs and herbs was significantly correlated with tree height and diameter at breast height, and the diversity of herbs showed a more significant correlation with tree height and diameter at breast height, except that the correlations between canopy closure and soil bulk density, between canopy closure and herb Margalef index, and between shrub Margalef index and diameter at breast height were not significant (p > 0.05). The correlations between other indices and stand factors were significant (p < 0.05). SOC, TN, TP, and ASi were strongly negatively correlated with stand density (p < 0.05). C:N and NCP were significantly positively correlated with stand density. The Herb Margalef index, herb Pielou evenness index, herb Simpson index, herb Shannon–Wiener index, and shrub Shannon–Wiener index were strongly positively correlated with tree height and diameter at breast height. Weak correlations were observed between the shrub Margalef and Pielou indices and stand factors, while a moderate correlation was observed with the Shannon–Wiener index.
Figure 4.
Correlational analysis of shrub and herb diversity, physicochemical properties, and stand factors in Cunninghamia lanceolata plantations of different age classes. Note: * p < 0.05, ** p < 0.01, *** p < 0.001. The abbreviations in the figure are detailed at the end of the paper.
3.5. RDA
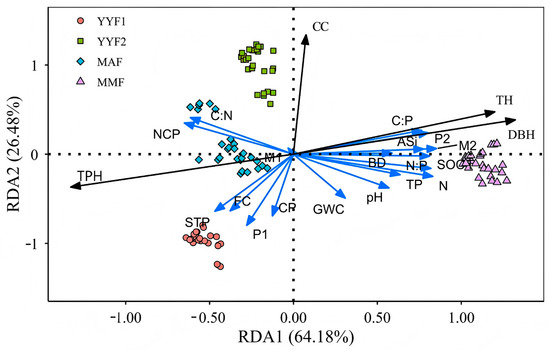
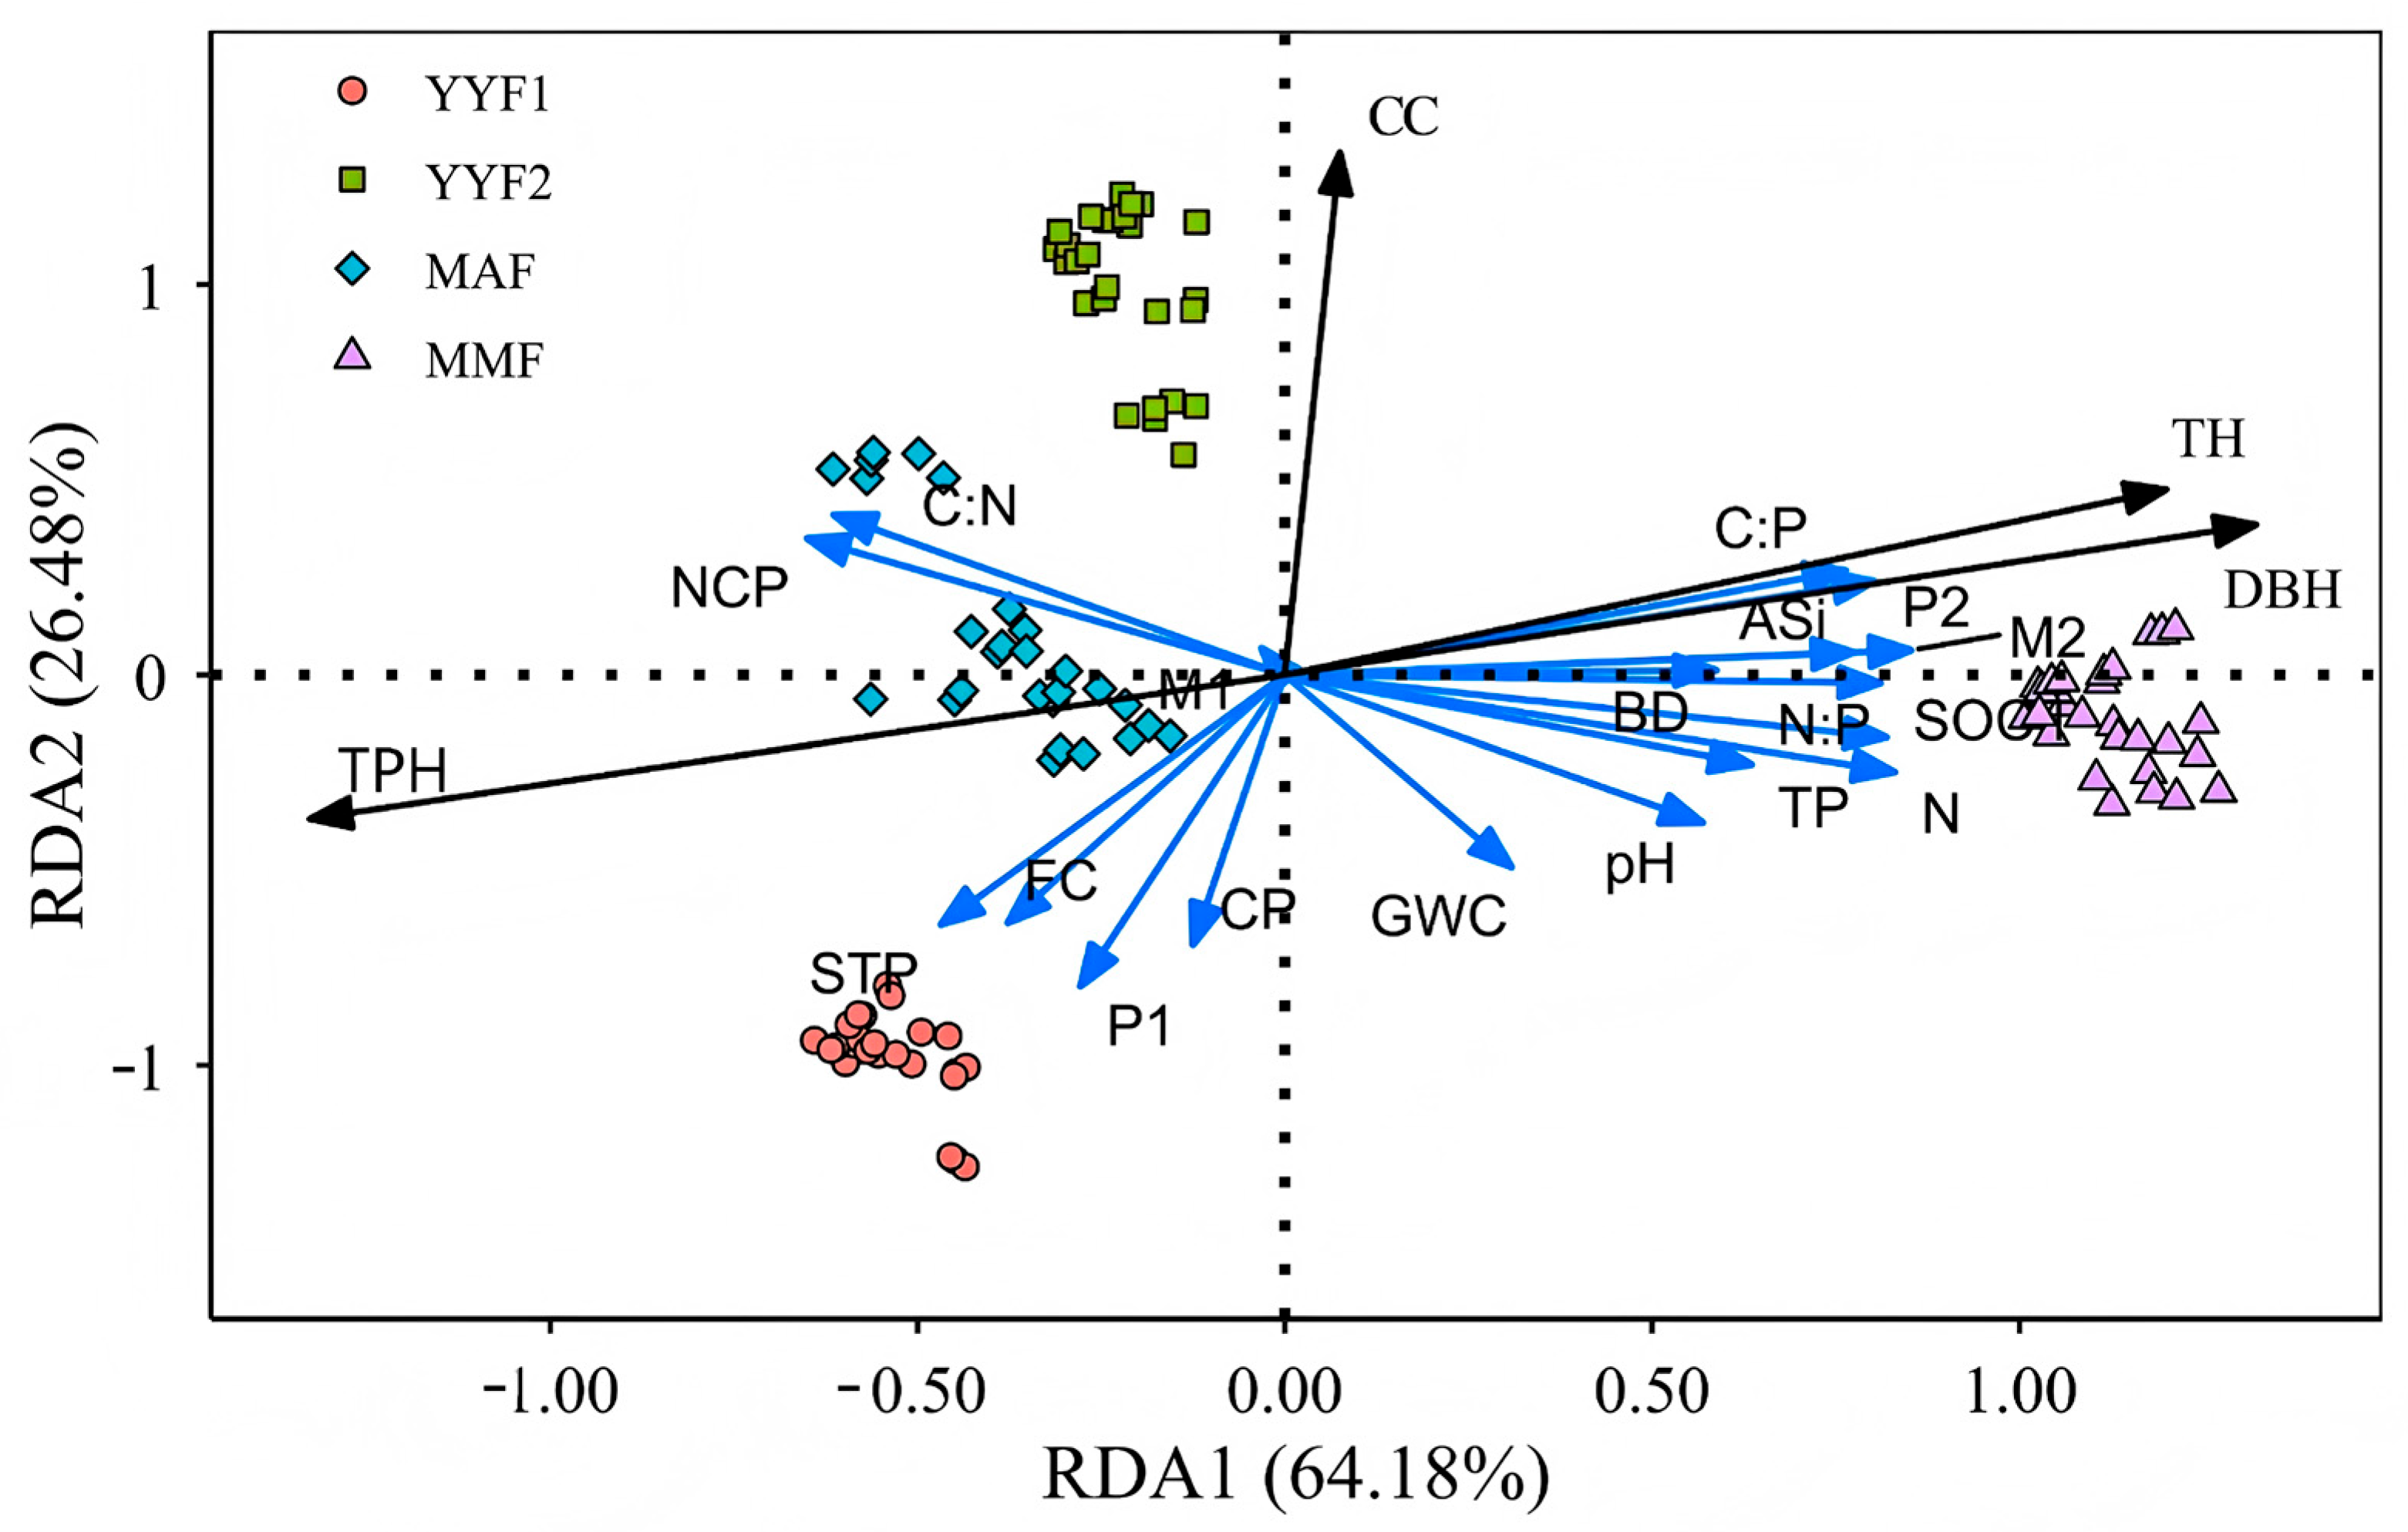
This study conducted a redundancy analysis (RDA) to investigate how stand factors influence the physicochemical properties of soil and the diversity of understorey vegetation in Cunninghamia lanceolata plantations of different age classes. The initial two axes adequately capture the influence of stand factors on soil physicochemical properties and the variety of understorey vegetation. Cumulatively, these axes account for 90.66%, indicating that they encompass the majority of the data related to four stand factors in Cunninghamia lanceolata (Figure 5, Table 3). Monte Carlo simulations revealed that four stand factors notably influenced soil physicochemical properties and understory vegetation diversity. The sequence of significance affecting the physical and chemical characteristics of soil was determined to be TPH, DBH, TH, and CC.TBH (r = 0.821, p < 0.001); DBH (r = 0.743, p < 0.001) and TH (r = 0.741, p < 0.001) were strongly correlated with RDA1; CC was strongly correlated with RDA2 (r = 0.623, p < 0.001). Most soil physicochemical properties formed acute angles with the arrows that represent DBH and TH. The analysis demonstrated that the presence of DBH and TH positively impacted physicochemical properties. The arrows for TPH and CC, which formed obtuse angles with most soil physicochemical properties, were suggested to be negative factors for these properties. It was evident that stand factors had a significant impact on SOC, ASi, and TP, whereas CP, FC, and STP were unaffected. The Simpson index, Shannon–Wiener index, Margalef index, and Pielou evenness index were undeniably influenced by stand factors. The arrows symbolizing DBH and TH created acute angles with the diversity of understorey vegetation. This study found that the presence of certain factors, namely DBH and TH, positively influenced understory vegetation diversity. The arrows representing TPH and CC, which formed obtuse angles with the understorey vegetation, indicated that these factors negatively impacted the diversity of the understorey vegetation.
Figure 5.
RDA of the effect of stand factors on shrub and herb diversity and physicochemical properties. Note: The abbreviations in the figure are detailed at the end of the paper.
Table 3.
RDA and Monte Carlo test of stand factors on shrub and herb diversity and physicochemical properties. Note: *** p < 0.001. The abbreviations in the figure are detailed at the end of the paper.
3.6. PLS-SEM Analysis
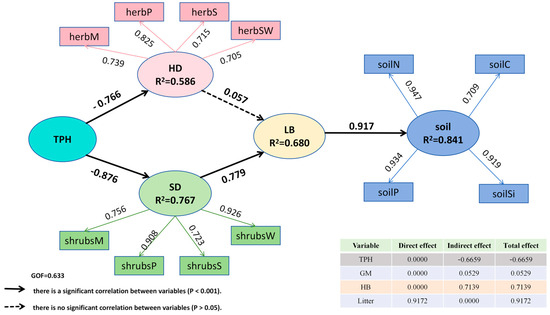
Based on the partial least squares structural equation model (PLS-SEM) analysis method, the measurement model evaluation, structural model, hypothesis testing, and robustness test were first conducted. The coefficient of determination (R2) of the model ranges from 0.586 to 0.841, indicating medium-to-high explanatory power. The Stone–Geitz Q2 values are all greater than 0 (ranging from 0.08 to 0.75), indicating that the model has good predictive correlation. To ensure the reliability of the conclusion, multiple robustness tests were conducted: multiple regression analysis after controlling for variables showed that the direction and significance of the coefficients of the core variables remained unchanged; in the PLSpredict test, the f2 values of the endogenous variables were all greater than 0 (ranging from 0.04 to 5.296), confirming that the model has large explanatory validity for the latent variables. The variance inflation factor (VIF) ranges from 1 to 4.726, all below the critical value of 5, indicating that common method bias is not a serious threat. The fitting coefficient GOF is 0.633. In conclusion, the research results are robust and reliable. The fitting coefficient GOF is 0.633.
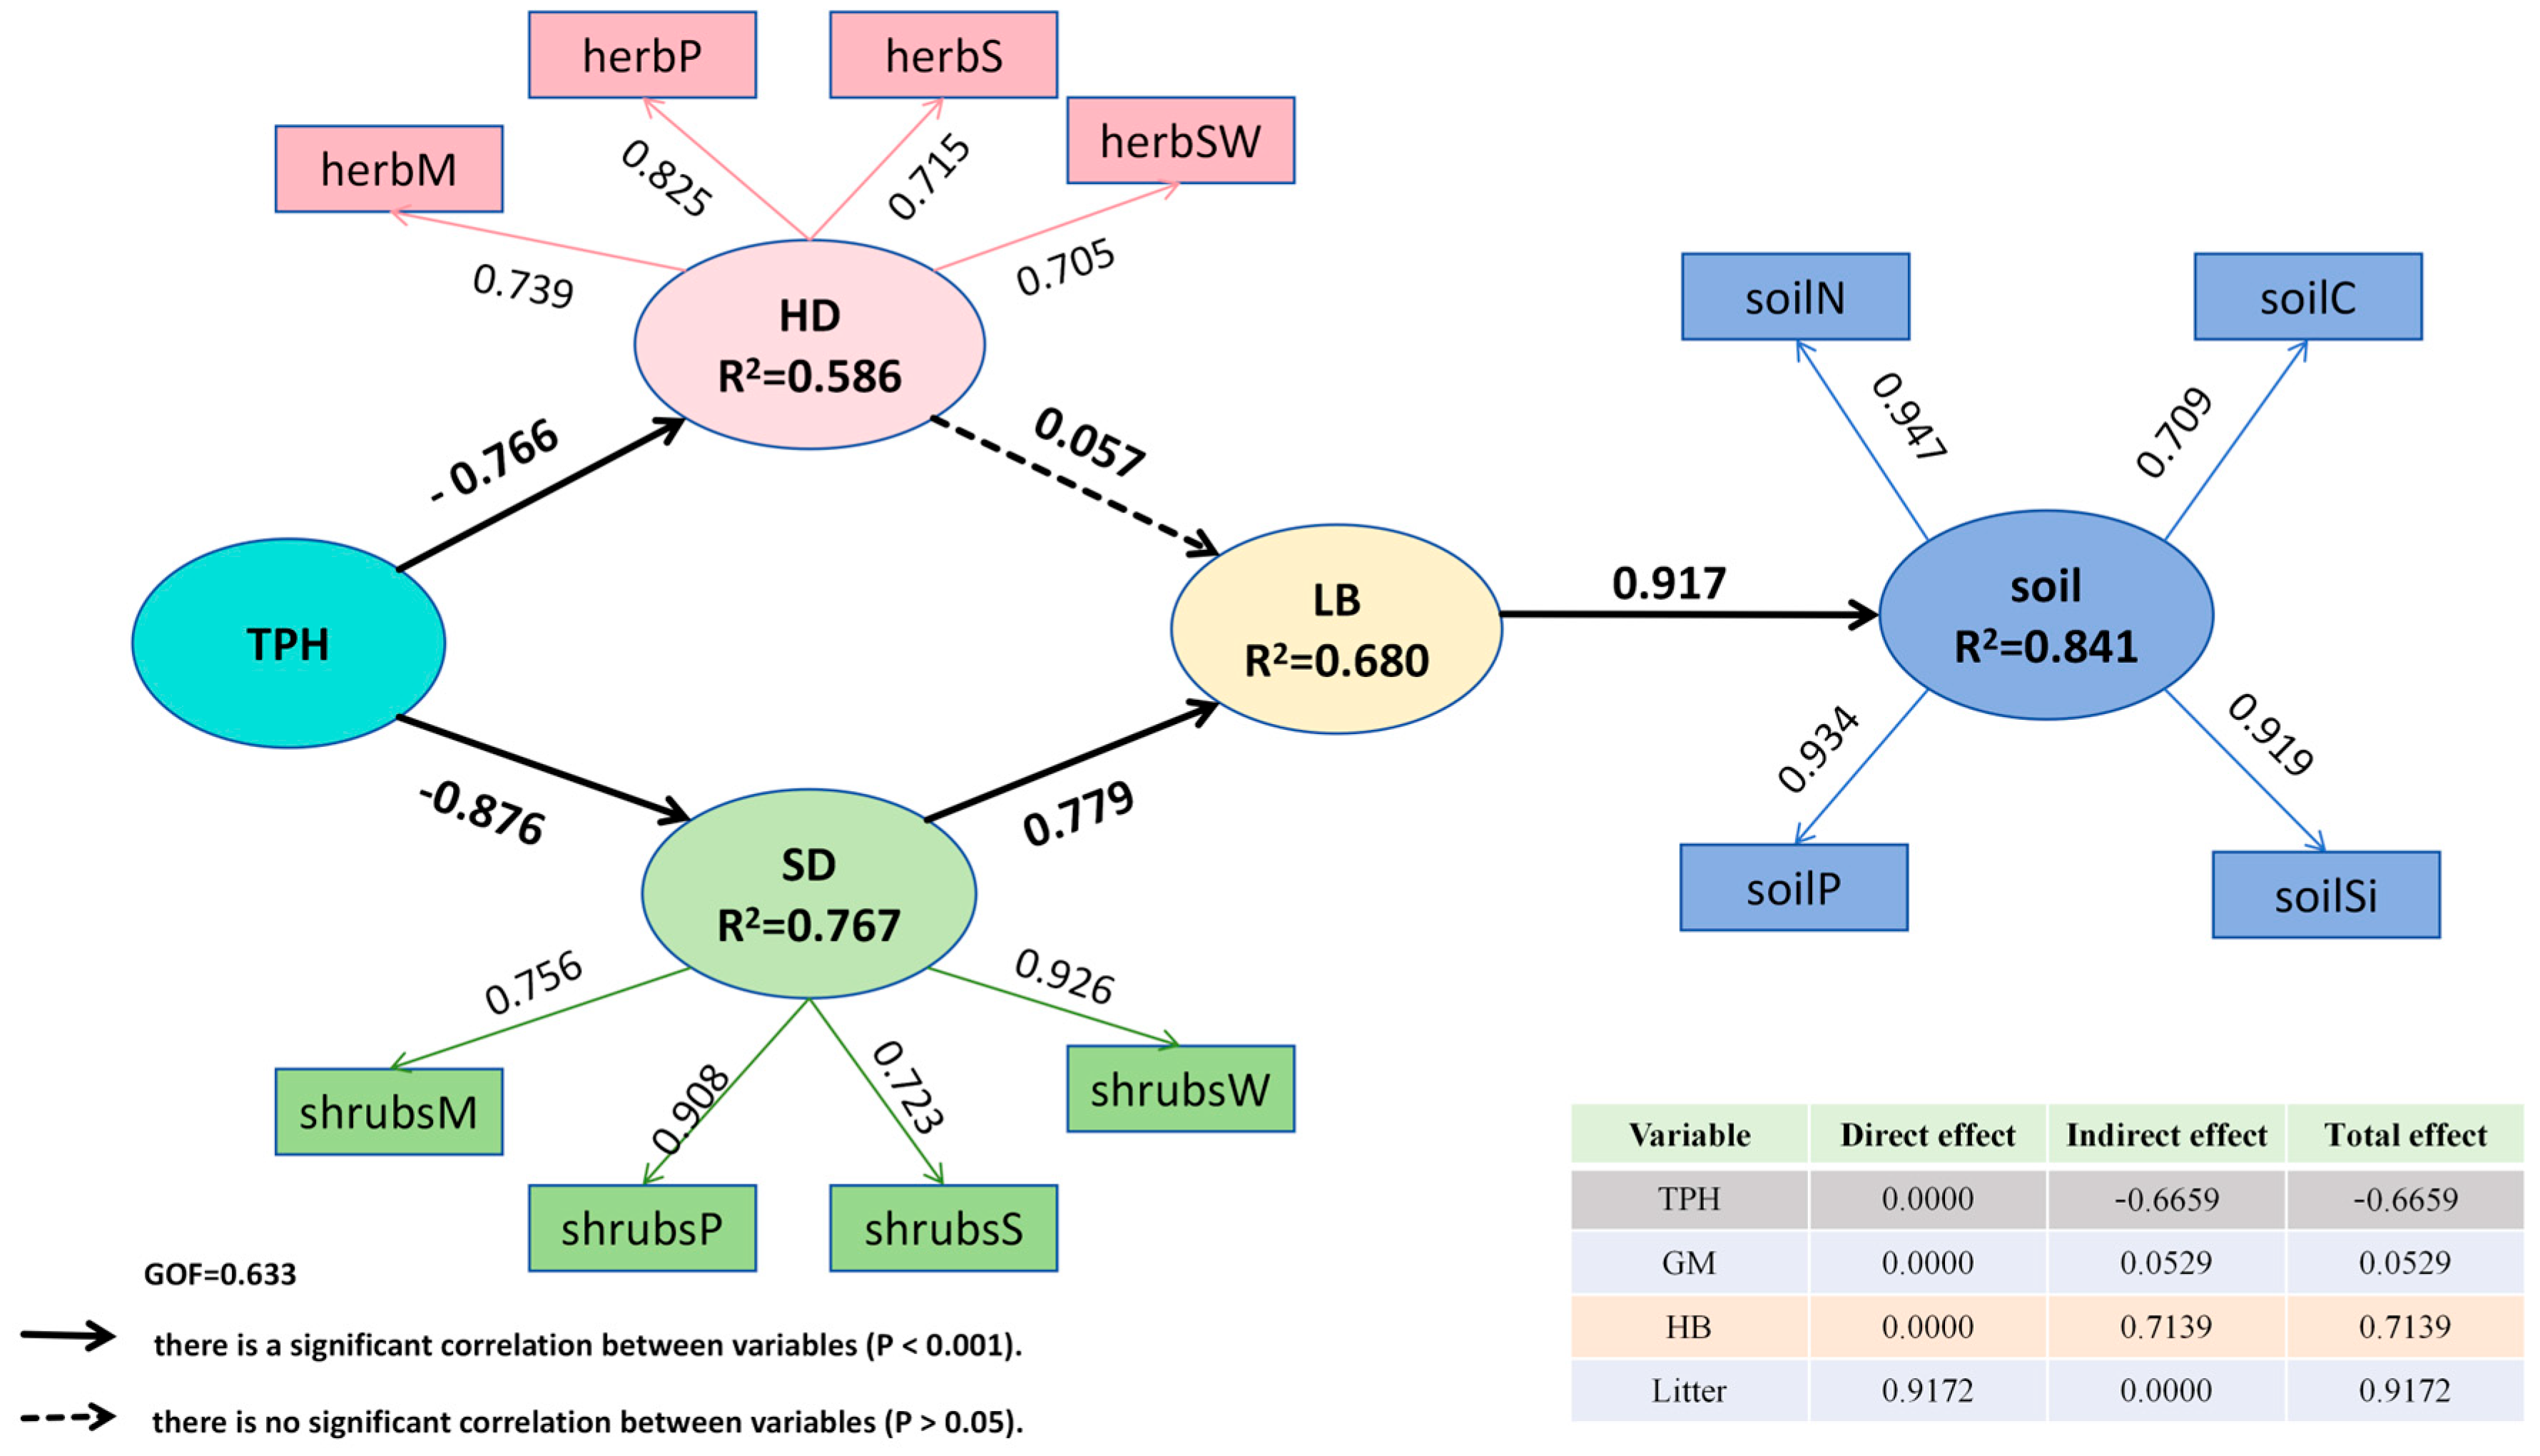
According to the results of the partial least squares–structural equation model (Figure 6), stand density has a very strong negative impact on herbaceous diversity (β = −0.766, SE = 0.056, t = 13.647, p < 0.001). The higher the density, the less light reaches the forest floor, and herbaceous plants are strongly inhibited by the tree layer. Stand density also has a significant negative impact on shrub diversity (β = −0.876, SE = 0.035, t = 25.143, p < 0.001). Shrubs are also suppressed by high stand density, but the degree of suppression is higher than that of herbaceous plants. Herbaceous diversity has a positive impact on litter biomass (β = 0.056, SE = 0.164, t = 3.45, p < 0.001). In the current study area, the coverage of the herbaceous layer is relatively low, and the amount of litter is much less than that of trees and shrubs. Therefore, its contribution to the total litter burden is insignificant. Shrub diversity has a significantly positive effect on the litter biomass (β = 0.779, SE = 0.139, t = 5.614, p < 0.001). The more developed the shrub layer is, the more litter it produces itself (dead stems and leaves) and the more litter it may retain, thereby significantly increasing the total amount of surface litter. The biomass of litter has a very strong positive impact on soil nutrients (β = 0.917, SE = 0.139, t = 5.614, p < 0.01). The litter–soil pathway shows that litter production is the main source of soil nutrients. The more litter there is, the more carbon, nitrogen, and phosphorus will be returned to the soil after decomposition, which directly determines the fertility of the soil.
Figure 6.
PLS-SEM of stand density, shrub and herb diversity, and physicochemical properties. Note: TPH, stand density; HD, herb diversity; SD, shrub diversity; LB, litter biomass.
4. Discussion
4.1. Understorey Vegetation Diversity and Soil Fertility in Cunninghamia lanceolata Plantations of Different Age Classes
Cunninghamia lanceolata plantations exhibit clear variations in soil physicochemical properties and plant diversity across different age classes, being closely linked to stand development (Figure 2 and Figure 3). The results align with those observed in artificial broad-leaved forests, such as Eucalyptus urophylla × grandis, Casuarina equisetifolia, and Acacia mangium; they also correspond with coniferous forests, including Pinus tabuliformis, Larix kaempferi, and Pinus massoniana [4,5,6,7,8,9,10,11,12,13,14,15,16,17,18]. Consequently, the changes in soil physicochemical properties and understorey vegetation diversity of Cunninghamia lanceolata plantations with age grades were significantly different, corroborating hypothesis 1 in this study. The growth characteristics of Cunninghamia lanceolata indicate that it starts to grow rapidly at 5 years, and the period from 5 to 15 years is the rapid growth period. After rapid growth, the tree absorbs a large amount of soil nutrients.
According to PLS-SEM results, litter biomass directly affects soil nutrients, and litter decomposition is the main source of soil nutrient supplementation. The dead branches and leaves of a Cunninghamia lanceolata forest remain on the trunk for several years without falling off. This characteristic, which differs from that of other tree species, leads to a large amount of litter being produced in Cunninghamia lanceolata forests after 14 to 15 years. Therefore, the litter can return a large amount of nutrients after 14 to 15 years [60]. Due to the delayed return of nutrients from the litter, the soil nutrients of the middle-aged forest (with a forest age of 17 years) in this study had not been replenished in time by the litter, so they were reduced compared with those of the young and mature forests. Under identical climatic and topographic conditions, variations in litter quantity inevitably have a significant effect on forest soil fertility [57,61].
Shrub and herb diversity increased with age class. PLS-SEM showed that stand density had a negative impact on shrubs and herbaceous plants, with lower stand density associated with higher shrub and grass diversity. Understory vegetation in the young forest stage is dominated by herbaceous plants. In the middle-aged forest stage, shrubs and small trees begin to appear. In the near-mature forest stage, vegetation structure tends to stabilize [62,63]. The sampled Cunninghamia lanceolata plantations were 2 years for the young forest 1, 10 years for the young forest 2, 17 years for the middle-aged forest, and 28 years for the mature forest. The initial afforestation density of the Cunninghamia lanceolata plantations in the study area was high. During the seedling stage from 1 to 4 years old, tending was carried out 1–2 times a year. The main tending measures were the removal of shrubs and herbs, which led to the destruction and a sharp reduction in vegetation under the forest. After 15 years, thinning was carried out, leaving only the larger ones. The thinning measures expanded the space within the forest; improved the sunlight, water, and heat conditions within the forest; and enabled the rapid growth of the forest and vegetation beneath it. After 25 years, mature forests began to be felled. The stand density further decreased, and the vegetation under the forest became increasingly rich [64]. Both shrubs and herbaceous plants flourished, and the plant diversity naturally increased. Due to changes in stand density, the understorey vegetation diversity of Cunninghamia lanceolata plantations increases with age class. This conclusion is consistent with the second research hypothesis.
4.2. Age Classes-Based Thinning Management Profoundly Influences Understorey Vegetation Diversity and Soil Fertility
Soil physicochemical properties and understory vegetation diversity in Cunninghamia lanceolata plantations changed with increasing age class; stand density was identified as the primary factor driving these changes. In our study area, the initial planting density exceeded 2500 trees/hm2, with some exceeding 2778 trees/hm2. If thinning was delayed until year 15, the Cunninghamia lanceolata forest would have already reached full canopy closure. By that time, intense competition would have led to the development of dead trees (snags) or poorly formed individuals. Thinning was initiated when the Cunninghamia lanceolata plantations were 15 years old, and poorly growing and maldeveloped trees were removed. The second thinning or clear-cutting was initiated when the stand age reached 25. Simply stipulating that thinning or clear-cutting should be carried out when the stand age reached 15 and 25 years was a very rough management approach. It could not ensure the best growth of Cunninghamia lanceolata and was not conducive to the recovery and maintenance of soil fertility and plant diversity in Cunninghamia lanceolata forests. Delayed tending of seedlings and postponed thinning also negatively affected soil properties and plant growth. Conversely, thinning too early or too intensively could lead to deterioration of both soil conditions and the overall ecosystem. Based on the age class (every five years), combined with the cultivation goals, site conditions, and the growth volume of Cunninghamia lanceolata trees (by monitoring the diameter at breast height of the sample trees every year, which is different from methods such as modelling prediction and drawing density control charts, the data is simple and easy to obtain for forest rangers or forest farm managers), detailed age class-based thinning measures can be formulated, which can better guide the management of Cunninghamia lanceolata forests.
5. Conclusions
A particularly notable finding is the low nutrient status observed in middle-aged stands (MAF) [31,65,66,67]. We attribute this phenomenon to a combination of delayed thinning history and the unique litterfall characteristics of Cunninghamia lanceolata, whose dead branches and leaves tend to remain attached to the trunk for extended periods rather than falling to the forest floor. This retention of branches and leaves reduces litter input to the soil during critical developmental stages, thereby limiting organic matter accumulation and nutrient cycling. When coupled with high stand density and prolonged canopy closure, this mechanism can lead to temporary declines in soil organic carbon, total nitrogen, and other key nutrients—even as the stand continues to accumulate aboveground biomass.
Based on the summary and analysis of previous research [60,68,69,70,71,72,73], we have proposed our novelty (Table 4). This study lies in translating the complex, multidimensional relationships among stand structure, soil properties, and understory vegetation into a simple, operational method based on age classes. Rather than requiring detailed, time-consuming soil surveys or complex vegetation assessments, forest managers can use stand age as a practical proxy to anticipate soil nutrient dynamics and understory recovery patterns, and to schedule thinning interventions accordingly. In conclusion, based on the growth characteristics, we have described the existing problems in current thinning management, formed precise thinning guidelines based on age classes and monitoring the diameter at breast height, and proposed a simple and practical method, which would provide a scientific basis for the sustainable management of Cunninghamia lanceolata plantations.
Table 4.
Age-class-based thinning measures for Cunninghamia lanceolata plantations.
Author Contributions
Q.H.: writing—original draft, writing—review and editing, validation, software, investigation, formal analysis, and data curation. Z.C.: software, investigation, data curation, and conceptualization. Y.L.: supervision, project administration, and methodology. All authors have read and agreed to the published version of the manuscript.
Funding
Financial support for this study was provided by the Postgraduate Research Fund Project of Guizhou Province (2024YJSKYJJ158).
Data Availability Statement
The data will be available upon request.
Acknowledgments
We greatly appreciate the help from Li Liu, Mengxia Luo, Lukang Song, and Changxu Chen in soil sample collection. We would also like to thank the anonymous reviewers for their constructive comments and suggestions.
Conflicts of Interest
The authors declare no competing interests.
Abbreviations
The following abbreviations are used in this manuscript:
| Asi | Available silicon |
| BD | Bulk density |
| CC | Canopy closure |
| C:N | SOC:TN |
| CP | Capillary porosity |
| C:P | SOC:TP |
| DBH | Diameter at breast height |
| FC | Field moisture capacity |
| GWC | Gravimetric water content |
| M1 | Shrub Margalef index |
| M2 | Herb Margalef index |
| MAF | Middle-aged forest |
| MMF | Mature forest |
| NCP | Non-capillary porosity |
| N:P | TN:TP |
| P1 | Shrub Pielou evenness index |
| P2 | Herb Pielou evenness index |
| S1 | Shrub Simpson index |
| S2 | Herb Simpson index |
| SW1 | Shrub Shannon–Wiener index |
| SW2 | Herb Shannon–Wiener index |
| TPH | Stand density |
| SOC | Total soil organic carbon |
| STP | Total porosity |
| TH | Tree height |
| TN | Total soil nitrogen |
| TP | Total soil phosphorus |
| YYF1 | Young forest 1 |
| YYF2 | Young forest 2 |
References
- Feng, Z.W. Biomass and Productivity of Forest Ecosystems in China; Science Press: Beijing, China, 1999. [Google Scholar]
- Messier, C.; Jürgen, B.; Sousa-Silva, R.; Auge, H.; Baeten, L.; Barsoum, N. For the sake of resilience and multifunctionality, let’s diversify planted forests! Conserv. Lett. 2021, 15, e12829. [Google Scholar] [CrossRef] [Scilit]
- State Forestry Administration. China Forest Resources Report; China Forestry Publishing House: Beijing, China, 2019. [Google Scholar]
- Lu, H.; Xu, J.; Li, G.; Ma, N.; Su, G.; Zhang, Y. Soil Physicochemical Properties and Dynamic Changes of Understory Plant Diversity at Different Growth and Development Stages of Eucalyptus urophylla × Eucalyptus grandis Plantation. SW China J. Soils Sediments 2024, 37, 82–91. [Google Scholar]
- Li, X.R.; Bai, L.J.; Chen, B.L.; Lan, H.K.; Fu, C.D.; Li, L. Analysis of soil physicochemical properties and biological activity of the Casuarina equisetifolia forests with different ages. J. Northwest Univ. 2014, 29, 37–41. [Google Scholar]
- Nazeri, A.; Jusoh, I.; Wasli, M.E. Growth of Acacia mangium at different age classes and soil physicochemical properties in Sarawak, Malaysia. Pertanika J. Trop. Agric. Sci. 2021, 44, 773–793. [Google Scholar] [CrossRef] [Scilit]
- Pérez-Sato, M.; Gómez-Gutiérrez, Á.; López-Valdez, F.; Ayala-Niño, F.; Soni-Guillermo, E.; González-Graillet, M.; Pérez-Hernández, H. Soil physicochemical properties change by age of the oil palm crop. Heliyon 2023, 9, e16302. [Google Scholar] [CrossRef] [Scilit]
- Fan, G.H.; Liu, C.; Li, Y.; Dong, Y.J.; Ge, B.; Li, J.X.; Song, J.K.; Zhuang, J.Y. Changes of Soil Physical and Chemical Properties of Camellia oleifera Forest at Different Ages. J. Northeast. For. Univ. 2019, 47, 38–42. [Google Scholar]
- Li, L.; Wu, Y.H.; Xiao, Z.X.; Ji, Y.L.; Lin, W.H.; Zhu, X.W.; Fan, Z.Z. Characterization of Soil Ecological Stoichiometry in Plantation Forests of Different age classes of Sonneratia apetala. For. Grassl. Resour. Res. 2023, 6, 113–119. [Google Scholar]
- Zhao, L.L.; Wu, Z.X.; Sun, R.; Yang, C.; Fu, Q.M.; Tang, M.Q. Soil Organic Carbon Components and Influencing Factors of Rub-ber Plantations of Different Ages in Qiongzhong, Hainan. J. Yunnan Agric. Univ. Nat. Sci. 2023, 38, 886–893. [Google Scholar]
- Qiu, X.; Peng, D.; Li, W.; Jiang, H. Soil physicochemical properties of Pinus tabuliformis plantations of different ages in Yanqing, Beijing. Chin. J. Appl. Environ. Biol. 2018, 24, 221–231. [Google Scholar]
- Dang, P.; Wang, N.J.; Wang, J.T.; Zhang, W.J.; Huang, Y. Changes of soil physical-chemical properties of Pinus tabuliformis plantations at different developmental stages in Ziwuling region of Loess Plateau. J. Northwest A F Univ. Nat. Sci. Ed. 2014, 42, 115–121. [Google Scholar]
- Wang, H.X.; Sun, X.M.; Chen, D.S.; Shen, Y.Z.; Ma, J.W. Changes of Soil Physical and Chemical Properties at Different Developmental Stages of Larix kaempferi Plantations in Xiaolongshan, Gansu Province. For. Res. 2012, 25, 294–301. [Google Scholar]
- Wang, H.X. Nutrient Traits in Different Developmental Stages of Larix kaempferi Plantation; Chinese Academy of Forestry: Beijing, China, 2012. [Google Scholar]
- He, B.; Wei, X.M.; Feng, J.Q.; Yang, J.Q.; Huang, C.B.; Zhang, R.S. Soil Physicochemical Properties in Different age classes of Taiwania flousiana in Northwestern Guangxi. J. Northeast Foreastry Univ. 2023, 51, 77–82+89. [Google Scholar]
- Wu, Y.; Huang, Q.; Liu, X.; Zheng, R.; Cen, J.B.; Ding, B.; Zhang, Y.L.; Fu, Y.H. Effects of Pinus massoniana plantation age on soil physical and chemical properties in Karst areas in southwest China. J. Nanjing For. Univ. Nat. Sci. Ed. 2024, 48, 99–107. [Google Scholar]
- Tang, W.D.; Wei, L.Y.; Kang, C.Z.; Wang, D.Z.; Qiu, X.N.; Zhang, W.X.; Zhang, X.J. Soil Physicochemical Properties of Pinus sylvestris var. mongolica Plantations of Different Ages in Minqin. Bull. Chin. Agric. Sci. 2023, 39, 93–98. [Google Scholar]
- Guo, R. Analysis of Soil Physicochemical Properties and Ground Cover of Larix principis-rupprechti Forest at Different Forest Ages; Shanxi Agricultural University: Taiyuan, China, 2022. [Google Scholar]
- Tian, D.; Xiang, W.; Chen, X. A long-term evaluation of biomass production in first and second rotations of Cunninghamia lanceolata plantations atthe same site. Forestry 2011, 84, 411–418. [Google Scholar] [CrossRef] [Scilit]
- Sheng, W.T. A study on stand density management and long-term productive of Cunninghamia lanceolata (Cunninghamiac lanceolata) plantation. Sci. Silvae Sin. 2001, 5, 2–9. [Google Scholar]
- Sheng, W.T. Studies on density management and long–term productivity of Cunninghamia lanceolata plantations. Sci. Silvae Sin. 2001, 37, 2–9. [Google Scholar]
- Sheng, W.T.; Yang, C.D. Research on effect of ameliorating soil properties by undergrowth vegetation of Cunninghamia lanceolata. Acta Ecol. 1997, 17, 377–385. [Google Scholar]
- Sheng, W.T.; Yang, D.; Fan, S.H. Changes on soil properties in Cunninghamia lanceolata plantations. For. Res. 2003, 16, 377–385. [Google Scholar]
- Xu, X.L.; Sun, Y.J.; Zhou, H. Effects of thinning intensity on understory growth and soil properties in Cunninghamia lanceolata plantation. Sci. Silvae Sin. 2003, 55, 1–12. [Google Scholar]
- Sheil, D.; Burslem, D.F.R.P. Disturbing hypotheses in tropical forests. Trends Ecol. Evol. 2003, 18, 18–26. [Google Scholar] [CrossRef] [Scilit]
- Lin, K.; Yu, X.; Huang, B.; He, Z. Dynamical Traits of undergrowth plant diversity in Cunninghamia lanceolata plantations. Chin. J. Appl. Environ. Biol. 2001, 7, 13–19. [Google Scholar]
- Lomina, S.; Wang, C.X.; Li, W.N.; Liu, Z.L.; Yang, M. Characteristics of Soil Physicochemistry and Understory Vegetation in Young Plantation of Erythrophleum fordii Under Different Densities. J. Trop. Subtrop. Bot. 2023, 31, 305–314. [Google Scholar]
- Zou, X.D.; Wang, X.X.; Xu, Z.Y.; Zheng, H.; Cao, G.Q.; Cao, S.J. Effects of Different Densities on Soil Properties and Understory Vegetationin Cunninghamia lanceolata Plantation. J. Guangxi Norm. Univ. (Nat. Sci. Ed.) 2025, 43, 201–212. [Google Scholar] [CrossRef]
- Wang, X.X.; Liao, W.H.; Meng, F.F.; Jiang, Z.; Cao, G.Q.; Cao, S.J. Effect of stand density on soil physicochemical properties andenzyme activities of Cunninghamia lanceolata plantations. J. Fujian Agric. For. Univ. Nat. Sci. Ed. 2023, 52, 329–336. [Google Scholar]
- Hong, M.Z.; Gao, J.H.; Wang, X. Effects of Thinning and Pruning on the Growth and Timber Structure of Cunninghamia lanceolata Plantations. For. Res. 2025, 38, 82–92. [Google Scholar]
- Chen, K.M.; Lan, W.L.; Ma, D.X. Effects of Thinning Retention Density on the Growth and Biomass Allocation of Cunninghamia lanceolata Plantations. Subtrop. Agric. Res. 2024, 20, 155–164. [Google Scholar]
- Jiao, Z.A. Effects of Tending Thinning on Stand Growth and Soil Fertility of Chinese Fir Plantations. Master’s Thesis, Central South University of Forestry and Technology, Changsha, China, 2025. [Google Scholar]
- Du, M.Y.; Feng, H.Y.; Pei, S.X.; Zhang, L.J.; Fa, L.; Guo, J.; Xin, X.B. Soil Hydro-physical Properties in Pinus tabuliformis Plantations with Different Stand Densities in Southern Shanxi. J. Northeast For. Univ. 2021, 49, 72–76. [Google Scholar]
- Wang, X.X.; Liao Wen, H.; Zuo, X.D. Effect of Soil Physicochemical Properties of Fir Plantation under Density Regulation. J. Northeast For. Univ. 2023, 51, 82–87. [Google Scholar]
- Wang, D.; Wang, Y.P.; Chen, X.L.; Guan, Q.W. Seasonal Dynamics of Soil Physical and Chemical Properties after Thinning in Cunninghamia lanceolata Plantation. Res. Soil Water Conserv. 2015, 22, 69–73. [Google Scholar]
- Li, R.C.; Xu, J.Y.; Li, T.H.; You, M.; Qian, Y.; Zhang, X.Y. Effects of different densities on growth, soil physicochemical propertiesand microorganisms of long-period management Cunninghamia lanceolata forest. J. Cent. South Univ. For. Technol. 2025, 45, 165–174. [Google Scholar]
- Lu, D.H.; Feng, M.C.; Qiu, Z.P. Effects of Thinning Retention Density on Litter and Soil Water Holding Characteristics of Cunninghamia lanceolata Plantations. J. Southwest For. Univ. Nat. Sci. 2025, 45, 141–149. [Google Scholar]
- Feng, J.; Wang, Q.C.; Zheng, Y.; Lu, A.J.; Yu, S.H.; Wang, Y.C.; Chen, D.S. Effect of Strip Tending Thinning on the Growth and Some Soil Nutrient Indexes of Larch Plantation in Eastern Liaoning Province. J. Southwest For. Univ. 2021, 41, 11–17. [Google Scholar]
- Liu, K.L. Effect Analysis of Thinning of Cryptomeria fortunei Plantation in-Mid-Mountain of Western Sichuan. Master’s Thesis, Central South University of Forestry & Technology, Changsha, China, 2019. [Google Scholar]
- Mao, L.L.; Dong, X.B.; Qu, H.F.; Zhang, B.S.; Liu, H.; Gao, R.; Gao, T. Effects of Thinning on Soil Nutrients at Different Depths of Natural Conifer and Broadleaved Mixed Forest in Xi-aoxing’an Mountains. J. Northeast. For. Univ. 2022, 50, 66–71. [Google Scholar]
- Zhang, X.; Chen, L.; Wang, Y. Plantations thinning: A meta-analysis of consequences for soil properties and microbial functions. Sci. Total Environ. 2023, 877, 162894. [Google Scholar] [CrossRef] [Scilit]
- Lin, K.M.; Wang, R.H.; Liu, K.L. Decomposition Interaction of Mixed Litter Between Cunninghamia lanceolata and Various Accompanying Plant Species and Other Ecological Studies. Appl. Ecol. 2001, 12, 123–130. [Google Scholar]
- Jiao, Z.N.; Wang, R.H.; Liu, K.L.; Zhang, B.; Jiang, Y.G.; Liu, Y.Q.; Zou, T. Effect of thinning on ground cover of Cunninghamia lanceolata plantation. J. Cent. South Univ. For. Technol. 2025, 45, 113–122. [Google Scholar]
- Chen, H.; Guo, H.T.; Chen, R.; Xue, G.H.; Wang, L.Y.; Jiang, J. Understory plant diversity of Cunninghamia lanceolata plantations and its short- term environmental response to different thinning intensities. Acta Ecol. Sin. 2023, 43, 10274–10284. [Google Scholar]
- Cheng, X.R.; Xu, J.L.; Liu, J.; Yu, M.K. Effect of thinning on understory vegetation diversity and its nutrient stocks in Cunninghamia lanceolata plantation. Ecol. Environ. Sci. 2014, 23, 30–34. [Google Scholar]
- Cheng, B. Research on Optimization of Protection Material Ratio of Red Sand Mudstone Admixture Slope in Chishui; Guizhou University: Guiyang, China, 2022. [Google Scholar]
- Wang, D.J. Research on Weathering Characteristics of Red Layer in Danxia Landform Area of Chishui; Guizhou University: Guiyang, China, 2020. [Google Scholar]
- Li, S. Classification and Comparison of Purple Soil in ST and WRB. Master’s Thesis, Southwest University, Chongqing, China, 2021. [Google Scholar]
- Huang, W.L.; Tu, Y.L.; Yang, L. Vegetation in Guizhou; Guizhou People’s Publishing House: Guizhou, China, 1988. [Google Scholar]
- LY/T2908-2017; Diviision of Age Classes and Age Groups of Major Tree Species. State Forestry Administration: Beijing, China, 2017.
- Li, K.; Li, Z.J. Soil Chemical Analysis; China Agricultural Science and Technology Press: Beijing, China, 2019; pp. 86–88. [Google Scholar]
- Zhang, Y. Study on Carbon Sequestration Traits of Phytopsilites in Underforest System (Root and Soil) of Masson pine in Karst Area of Guizhou Province; Guizhou Normal University: Guiyang, China, 2024. [Google Scholar]
- Ma, X.H. Methodological Guidelines for Forest Ecosystem Location Research; Chinese Science and Technology Press: Beijing, China, 1994. [Google Scholar]
- Nelson, D.W.; Sommers, L.E. Total carbon, organic carbon, and organic matter. Methods Soil Anal. Part 2 Chem. Microbiol. Prop. 1982, 9, 539–579. [Google Scholar]
- Walkey Black, C.A. An examination of Digtiareff method for determining soil organic matter and proposed modification for the chromic acid titration method. Soil Sci 1934, 37, 29–38. [Google Scholar] [CrossRef] [Scilit]
- Lu, R.K. Methods for Agricultural Chemical Analysis of Soil; China Agricultural Science and Technology Press: Beijing, China, 2000. [Google Scholar]
- Ma, K.P.; Huang, J.H.; Yu, S.L. Plant community diversity in Dongling Mountain, Beijing, China (II) species richness, evenness, and species diversity. Acta Ecol. Sin. 1995, 15, 268–277. [Google Scholar]
- Hair, J.F.; Hult, G.T.M.; Ringle, C.M.; Sarstedt, M. A Primer on Partial Least Squares Structural Equation Modeling (PLS-SEM); SAGE Publications: Los Angeles, CA, USA, 2014. [Google Scholar] [CrossRef] [Scilit]
- Hair, J.F.; Ringle, C.M.; Sarstedt, M. PLS-SEM: Indeed a silver bullet. J. Mark. Theory Pract. 2011, 19, 139–152. [Google Scholar] [CrossRef] [Scilit]
- Sheng, W.T.; Fan, S.H. Long Term Productivity of Cunninghamia lanceolata Plantations; Science Press: Beijing, China, 2005. [Google Scholar]
- Ma, X.Q.; Liu, C.J.; Hannu, I.; Westman, C.; Liu, A.Q. Biomass, litter and nutrient distribution of Cunninghamia lanceolata forests at different developmental stages in subtropical regions of China. J. For. Res. 2002, 13, 165–170. [Google Scholar]
- Jia, Y.Y. Characterization of Understory Community of Cunninghamia lanceolata Plantations at Different Developmental Stages. J. For. Environ. 2016, 36, 36–41. [Google Scholar]
- Wu, X.H. Response of Understory Plant Diversity to Different Thinning Years in Cunninghamia lanceolata Plantation. J. Fujian Acad. Agric. Sci. 2024, 6, 35–42. [Google Scholar]
- Zhao, S.Y.; Wang, R.H.; Liu, K.L. Thinning Improves Understory Diversity and Biomass and Enhances Soil Properties in Cunninghamia lanceolata Plantations in Southern China. Environ. Sci. Pollut. Res. 2016, 23, 24135–24150. [Google Scholar] [CrossRef] [Scilit]
- Li, H.T.; Zhang, Y.; Wei, Z.C.; Jia, D.D.; Liu, Y.H.; Liu, A.Q. Evaluation on soil fertility of Cunninghamia lanceolata plantations in different development stages. For. Res. 2017, 30, 322–328. [Google Scholar]
- Ma, X.Q.; Fan, S.H.; Wang, S.G.; Lin, J.L. A comparison on soil fertilities of Cunninghamia lanceolata plantations of different generations. For. Res. 2000, 13, 577–582. [Google Scholar]
- Chen, J.C.; Jiang, Z.; Wu, X.H.; Cao, G.Q.; Cao, S.J. Effects of thinning on hydrological characteristics of litter in Chinese fir plantation in mountainous area of Fujian Province. Chin. J. Ecol. 2024, 43, 1057–1064. [Google Scholar]
- DB51/T 2732-2025; Technical Regulations for Cultivation of Timber Forests: Cunninghamia lanceolata. Sichuan Standards Press: Chengdu, China, 2025.
- DB36/T 422-2024; Technical Regulations for Large-Diameter Timber Cultivation of Cunninghamia lanceolata. Jiangxi Standards Press: Nanchang, China, 2024.
- DB44/T 778-2010; Technical Regulations for High-Yield Plantation Cultivation of Cunninghamia lanceolata. Guangdong Standards Press: Guangzhou, China, 2010.
- DB45/T 470-2015; Technical Regulations for Fast-Growing and High-Yield Plantation Cultivation of Cunninghamia lanceolata. Guangxi Standards Press: Nanning, China, 2015.
- DB35/T 2166-2024; Technical Regulations for Knot-Free Timber Cultivation of Cunninghamia lanceolata. Fujian Standards Press: Fuzhou, China, 2024.
- DB43/T 2542-2023; Fast-Growing and High-Yield Plantation of Cunninghamia lanceolata. Hunan Standards Press: Changsha, China, 2023.

Disclaimer/Publisher’s Note: The statements, opinions and data contained in all publications are solely those of the individual author(s) and contributor(s) and not of MDPI and/or the editor(s). MDPI and/or the editor(s) disclaim responsibility for any injury to people or property resulting from any ideas, methods, instructions or products referred to in the content. |
© 2026 by the authors. Licensee MDPI, Basel, Switzerland. This article is an open access article distributed under the terms and conditions of the Creative Commons Attribution (CC BY) license.