


Abstract
For the western Patagonia region (Argentina), climate change models predict a 1–3 °C increase in temperature and a 10%–30% reduction in precipitation. Patagonia native forests are home to a variety of soil fungi, including ectomycorrhizal fungi (EcM), which play a crucial role in drought-tolerant trees. However, the responses of soil fungi to changes in rainfall remain poorly understood. To evaluate shifts in soil fungal communities’ response under reduced precipitation scenarios and identify potentially drought-tolerant EcM species, we took 144 composite soil samples associated with Nothofagus forests along an east–west rainfall gradient. We used environmental DNA to estimate alpha and beta diversity of soil fungi and EcM. Soil fungal richness did not differ across precipitation treatments, whereas EcM richness declined with decreasing precipitation. Shannon and inverse Simpson indices of EcM decreased under reduced precipitation, whereas no significant effects were observed on soil fungi, highlighting the EcM vulnerability to water limitation. Soil fungi community composition changes along the rainfall gradient due to species replacement. Tarzetta sp., Cortinarius sp., and Russula sp. were found in drier plots, indicating a potential association with drought tolerance. Selecting native drought-tolerant EcM for forest management and restoration can improve seedling establishment and ecosystem resilience under climate change.
1. Introduction
Climate change models predict significant alterations in Patagonia, including a 10%–30% decrease in precipitation and a 1–3 °C increase in temperature by the end of the century [1,2]. Despite the capacity of ecosystems to adapt, anthropogenic climate change is occurring at a rate that exceeds the adaptive capacity of natural environments [2]. This has resulted in phenological shifts, increased tree mortality, forest decline, and risks to biodiversity, carbon storage, and ecosystem services [2]. These changes could imply a significant threat to the natural regeneration capacity of native forests, particularly those dominated by Nothofagaceae.
Western Argentine Patagonia presents a natural rainfall gradient ranging from approximately 800 mm per year in the eastern regions to approximately 4000 mm in the westernmost areas, over a mere 50 km, being one of the steepest on the planet [3]. Nothofagus Blume species occupy contrasting microsites depending on the precipitation levels [4]. For instance, the drought-resistant Nothofagus antarctica (G. Forst.) Oerst. dominates the forest-steppe ecotone, whereas the evergreen N. dombeyi (Mirb.) Oerst. thrives in more humid areas, forming pure or mixed stands with other Nothofagus species [4].
The volcanic soils of these forests act as a “water sponge” capable of retaining more than their own weight in water during the rainfall period (May–September) and releasing it during the growing season (November–March), thus sustaining ecosystem functioning [5,6]. Within these forests, soil harbors a diverse consortium of fungi, including mutualists, saprophytes, pathogens, endophytes, and parasites [7]. Among them, ectomycorrhizal fungi (EcM) are dominant mutualists that colonize fine root tips of Nothofagaceae, playing a central role in tree establishment and development [8,9]. In addition, by improving water uptake and nutrient acquisition, EcM enhances plant drought tolerance, thereby helping to maintain key physiological processes under stressful conditions [10,11,12,13].
Water stress has been shown to broadly affect soil fungal communities, including EcM, leading to reductions in diversity, relative abundance, sporocarp production, and biomass [14,15,16,17,18] as well as inducing shifts in the community composition, such as turnover, referring to the replacement of species across areas, or nestedness, where species assemblage that is a subset of taxa-rich community [15,19,20,21]. However, certain EcM species appear to tolerate drought conditions better than others. For example, the cosmopolitan fungus Cenococcum geophilum Fr. enhances plant water relations during dry periods in Mediterranean forests [22], whereas Descolea antarctica Singer has been reported to persist under conditions of limited water availability in Patagonian forests [10]. However, some studies suggest that EcM fungi are generally less tolerant to drought than other fungi, underscoring their vulnerability in future climate scenarios [23,24]. In addition to climate, host plant identity plays a key role in shaping EcM communities [25]. In Patagonia, different Nothofagus species are associated with distinct EcM assemblages [8]. Despite these advances, important knowledge gaps remain regarding EcM diversity and function under water stress. Addressing these gaps is critical not only for advancing ecological theory but also for practical applications, as inoculations with selected drought-tolerant EcM species may enhance forest restoration success in ecosystems with low natural regeneration capacity under drought conditions [26].
Environmental gradients are powerful natural laboratories to evaluate community responses to climate variability, providing insights not always captured through traditional approaches [27]. The steep rainfall gradient in western Patagonia has been widely used to assess the sensitivity of plants, insects, and soil organisms to environmental change [28,29,30], providing an unique opportunity to anticipate the effects of climate change on soil fungal communities associated with Nothofagus forests, and especially the role of EcM as key facilitators of associated tree adaptation to a changing environment. Currently, the Next Generation Sequencing (NGS) approach based on environmental DNA (eDNA) metabarcoding technique [31] allows the identification of taxa from field samples (e.g., soil, water, or air), without prior isolation of organisms. This methodology facilitates the detection of fungal groups that lack visible fruiting bodies or produce inconspicuous structures, which are frequently missed during field studies [7,32]. This technique is a suitable tool for studying fungal responses to precipitation gradients, as these responses are heterogeneous due to the complexity of environmental changes [33,34]. The gap of knowledge in public databases may limit eDNA- based identification of fungi in Patagonian Nothofagus forests [32]. Nevertheless, recent studies in EcM fungi diversity [8,35,36,37,38,39] offer an important framework for research on the ecological function in soil and their resistance or sensitivity to reduced rainfall.
Hence, we study the taxonomic and functional diversity of soil Funga and EcM communities using eDNA in N. antarctica and N. dombeyi forests from central-western Andean Patagonian across an east–west precipitation gradient. We hypothesized that: (H1) alpha diversity of soil fungi would decrease with a reduction in precipitation; (H2) soil fungal communities would differ in structure and composition along the rainfall gradient; and (H3) certain EcM species would be associated with drier plots, indicating potential drought tolerance.
2. Materials and Methods
2.1. Study Sites
Our study was conducted in October and November 2021 in N. antarctica and N. dombeyi forests covering Lago Steffen (Río Negro province, 41.51° S, 71.53° W), Cholila (Chubut province, 42.45° S, 71.57° W), and Corcovado (Chubut province, 43.50° S, 71.42° W) (Table 1). We established three transects along the east–west precipitation gradient (Figure 1, Table 1), ensuring that selected sites fell within a narrow range of elevation, temperature, and forest composition, to minimize the influence of multiple environmental variables. To avoid potential interactions or biases caused by exotic EcM species, we excluded sites with neighboring conifer plantations [40]. Along each transect, three plots were established (i.e., treatments) and classified according to precipitation as wet (westernmost), intermediate, and dry (easternmost) (Figure 1, Table 1). We used a categorical classification of precipitation levels (treatments) based on an isohyets map of Argentina obtained from Argentina Energy Secretariat’s GIS platform (https://sig.energia.gob.ar/visor/visorsig.php [accessed on 12 August 2025]). This approach was adopted due to the limited availability of meteorological stations for accurately measuring site-level precipitation, and because global climate model estimates show a strong mismatch with observed precipitation values in the region [41].
Table 1.
Characteristics of the sampling areas.
Figure 1.
Location of the nine sampling areas (black triangles), identified by plot code, within Nothofagus forests in the western regions of Río Negro and Chubut provinces, Argentina. The distribution of Nothofagus dombeyi is shown in green and Nothofagus antarctica in yellow. Isohyets (blue lines, mm/year) show the mean annual precipitation based on historical records (Secretaría de Energía—Dirección de Información Energética, https://sig.energia.gob.ar/visor/visorsig.php [accessed on 12 August 2025]).
2.2. Sampling
For soil eDNA, we delineated 60 × 60 m plots following the methodology already applied in Nothofagaceae forests [42]. Within each plot, 16 points were located every 20 m to avoid spatial autocorrelation [43], cover a regular grid, and ensure a maximum species coverage at each plot [44]. This sampling resulted in 144 points for this study. At each sampling point, we collected a 500 g composite soil sample by pooling five 100 g soil cores of 10 cm depth, within a 3.5 m radius, all placed in the same polyethylene bag. A 15 g subsample from each composite sample was then transferred to an airtight bag and stored at −20 °C for molecular analysis (for up to 7 months). The rest of the sample was kept for physico-chemical analyses. Sampling tools were sterilized with 2% bleach between each plot to prevent cross-contamination. Prior to collecting each core, the shovel was first inserted into the adjacent soil without collecting material to perform a tool wash, and the actual soil sample was then collected.
2.3. Soil Fungal DNA Extraction and Amplification
We extracted soil eDNA from each composite sample using the NucleoSpin® Soil Kit (Macherey-Nagel, Düren, Germany), following the protocol described by Mennicken et al. [45]. We included negative controls throughout the procedure and stored DNA extracts in a freezer until amplification. We amplified the fungal ITS1 region using ITS5 primers (Fwd: ITS5 GGAAGTAAAAGTCGTAACAAGG from [46]) and a modified version of 5.8S_Fungi (Rev: 5.8S_Fungi CAAGAGATCCGTTGTTGAAAGTK from [47]), with a specific index combination that allows for post-sequencing identification [48]. We conducted high-throughput sequencing on the GENOTOUL platform (http://www.Genotoul.fr/en/, Toulouse, France) using Illumina MiSeq (2 × 250 bp), including negative controls for extraction, amplification, and sequencing.
2.4. Bioinformatics and Sequence Analysis
We used the OBITools pipeline (version 1.2.11) [49] on the GenoToul cluster to process the bioinformatic analyses. Raw sequences were pair-ended, filtered to remove low-quality sequences, sequences shorter than 60 bp, and singletons. We performed a clustering at 97% identity [50] to delineate Operational Taxonomic Units (OTU) using Sumaclust (version 1.0.36), measuring sequence dissimilarity based on mismatches (including deletions). We conducted taxonomic identification via ecotag [49] using a database extracted from GenBank ([51], genbank.com) as of April 2023. We then converted the dataset into an abundance dataframe in R and aggregated sequences per Operational Taxonomic Unit (OTU). Sequences detected as contaminants based on comparisons to negative controls were removed using the MetabaR package [52]. We assigned OTUs to a trophic status based on the FungalTraits database [53], Barroetaveña et al. [8], and our knowledge regarding the ecology of EcM fungi. Clavaria L., Helvella L., and Tremella Pers. were not considered as EcM in our analysis because their mycorrhizal status is still debated [54].
2.5. Soil Physicochemical Analysis
We used the remaining soil from each composite sample (see Section 2.2) to carry out physical and chemical analysis: texture [55], pH [56], pH in sodium fluoride (FNa, [57]), total nitrogen content (N, %, [58]), organic carbon content (OC, %, [59]), exchangeable bases: Ca, Mg, Na, and K (cmol/kg, [60]), cation exchange capacity (CEC, cmol/kg, [61]), electrical conductivity (EC, dS/m, [62]), sulfur (SO4=, mg/Kg, [63]), and available phosphorus (P, mg/Kg, [64]) (Table S1). We kept those variables that presented significant differences from a biological approach and influenced the diversity and development of soil fungi [65]. We grouped composite samples into 2, 3, or up to 4 major groups to account for the topography within each plot. All analyses were conducted at the CIEFAP Soil Laboratory.
2.6. Statistical Analysis
To characterize overall fungal diversity, we summarized OTU frequencies and read abundances from the OTU table across treatments, considering both taxonomic groups and functional guilds. Frequency was defined as the number of OTUs assigned to each taxonomic group and functional guild, whereas abundance was the total number of reads of each OTU. Completeness and species accumulation curves were estimated as a function of sampling effort to capture community diversity using the iNEXT package [66], and Chao’s estimator was used to infer the expected total OTU richness for each treatment.
Distribution of functional fungal traits [53] in each treatment was calculated with a Pearson’s chi-squared test (χ2) to evaluate whether the frequency and abundance of functional guilds differed among precipitation treatments, using the chisq.test function (stat package, [67]).
To analyze soil variables, we applied a PERMANOVA test [68] to evaluate the significant differences between soil variables of wet, intermediate, and dry treatments. We also performed a Principal Component Analysis (PCA) with the stat package, using standardized variables for soil variables. The analysis included Ca (cmol/Kg), Mg (cmol/Kg), K (cmol/Kg), P (mg/Kg), N (%), EC (dS/m), pH, and OC (%).
In order to test our first hypothesis -how reductions in precipitation affected alpha diversity-, we quantified alpha diversity using Hill’s numbers [69], which enable comparisons across diversity indices by modulating the influence of species abundances. Specifically, q = 0 corresponds to species richness (equal weighted OTUs), q = 1 is equivalent to Shannon’s index (weighted by OTUs abundance), and q = 2 to the inverse of Simpson’s index (strongly weighted by the most abundant OTUs) [70]. This approach is particularly suited for metabarcoding data, as it integrates relative abundances and allows estimates of diversity to progressively shift from rare to dominant taxa as the parameter q increases [70,71]. We estimated diversity indices for all soil fungi OTUs found (including EcM OTUs) and EcM OTUs separately using the iNEXT package [66]. We developed generalized linear mixed models (GLMMs), using Hill’s numbers as response variables. Treatment, mean annual temperature (WorldClim 2 [72]), forest species, elevation, and the first two principal components were included as explanatory variables, and sites were included as a random effect. Models for species richness (q0) were fitted with a normal distribution, while models for Shannon’s index (q1) and the inverse Simpson’s index (q2) were fitted with a gamma distribution. Explained variables were standardized before fitting models. All models were implemented using the glmmTMB function (glmmTMB package, [73]). Model selection was performed using the Akaike Information Criterion (AIC [74]). The significance of the selected models was confirmed via ANOVA, and post hoc comparisons were conducted using Tukey’s honest significant difference (HSD) test with the emmeans package [75]. Model fit was evaluated by calculating R2, and the contribution of the random factor (site) to alpha diversity metrics was assessed by comparing the marginal and conditional R2 values. Model assumptions were evaluated using the DHARMa package [76].
To test our second hypothesis—how reductions in precipitation affect beta diversity—we performed PERMANOVA [68] on Bray–Curtis dissimilarity matrices for both soil fungal and EcM communities. Treatment, mean annual temperature, forest species, elevation, and the first two principal components of the soil PCA were included as explanatory variables using the adonis2 function (vegan package [77]). Sites were included as random effects. Model selection guided by AICc. We also evaluated whether the precipitation treatment effects on soil fungal and EcM communities varied as a function of forest species. To do so, separate PERMANOVAs were conducted for soil fungal and EcM communities of Nothofagus dombeyi (TLSA, TLSB, and TChA) and N. antarctica (TLSC, TChB, TChC, TCA, TCB, and TCC). Community composition was visualized using non-metric multidimensional scaling (NMDS) based on Bray–Curtis dissimilarities. Environmental variables were fitted to the NMDS ordinations using the envfit function (vegan package). Differences in community dispersion among treatments were assessed using Levene’s test via the betadisper function (vegan package). To further evaluate community similarity among wet, intermediate, and dry plots, we calculated Jaccard similarity for presence–absence data (jaccard package [78]) and Morisita–Horn similarity for abundance data and visualized this similarity with Venn diagrams.
In line with our third hypothesis, assuming that certain EcM OTUs associated with dry plots would indicate drought tolerance, we calculated the Phi coefficient [79,80], which evaluates the association of taxa with predefined groups by occurrence and relative abundance across sites. Analyses were performed using EcM OTUs identified at the species level [81] with ≥10 observations [82] implementing the multipatt (func = “r.g”) (indicspecies package [83]). All statistical analyses were performed within R (R Core Team, version 4.3.3, 2025).
3. Results
3.1. An Overview of Fungal Diversity
After bioinformatic filtering, taxonomic assignment was performed on 8158 OTUs, comprising 1,925,882 reads obtained from 144 soil sampling points across the nine sampling plots. Species accumulation curves as a function of sampling effort indicated relatively complete sampling (0.99), suggesting adequate representation of fungal communities at each sampling plot (Figure S1a). Chao’s estimator suggested that 6236 OTUs (SD ± 73) could be observed in wet plots, 6395 OTUs (SD ± 81) in intermediate plots, and 6338 OTUs (SD ± 71) in dry plots.
Based on the comparison with public databases, 1358 OTUs (516,806 reads) were identified at the species level, and 1406 OTUs (557,106 reads) were assigned at the genus level. Additionally, 444 OTUs (92,510 reads) were assigned to the family level, 301 OTUs (16,784 reads) to the order, 311 OTUs (52,689 reads) to the class, and 665 OTUs (192,806 reads) to the phylum. A total of 3672 OTUs (497,181 reads) could only be assigned at the kingdom level (Fungi). At the phylum level, Ascomycota was the most frequent OTU, whereas Basidiomycota was more abundant in terms of reads. At the order level, Agaricales were both frequent and abundant, while at the family level, Inocybaceae were frequent, but Cortinariaceae were more abundant. At the genus level, Inocybe (Fr.) Fr. was the more frequent genus, whereas Cortinarius (Pers.) Gray was more abundant. At the species level, Achaeorhizomyces borealis Menkis, T. James, and Rosling was both the most frequent and abundant.
Functional assignments were possible for 2831 OTUs (1,471,009 reads) out of the 8158 total OTUs (Figure 2). Among these, 900 OTUs were identified as EcM, of which 723 have been previously reported in South American Nothofagaceae forests. Additionally, 66 OTUs matched with records from Nothofagaceae and Kunzea Rchb.—Leptospermum J.R. Forst. and G. Forst. forests in New Zealand and Australia. In contrast, 111 OTUs were associated with Northern Hemisphere Pinus L., Quercus L, Eucalyptus L’Hér., Picea A. Dietr., and Castanea Mill. Forests. Chao’s estimator suggested that 595 OTUs (SD ± 24) could be observed in wet plots, 575 OTUs (SD ± 23) in intermediate plots, and 617 OTUs (SD ± 22) in dry plots (Figure S1b).
Figure 2.
Proportion of OTUs (Operational Taxonomic Units) and reads for each functional guild across treatments based on 8158 fungal OTUs detected in Nothofagus forests.
We found differences in the abundance of fungal functional groups among treatments, but not in the number of OTUs. All functional groups differed significantly in abundance (χ2 test) except moss symbionts (χ2 = 0.426, p = ns), lichen parasites (χ2 = 5.69, p = 0.178), and animal endosymbionts (χ2 = 2.8, p = ns). Regarding EcM, the most abundant plots were the drier ones (229,883 reads), followed by wetter plots (223,597 reads), whereas intermediate plots were less abundant (151,390 reads). In contrast, saprotrophic fungi were most abundant in intermediate plots, followed by wet and dry plots (Figure 2).
3.2. Soil Physicochemical Characteristics
PERMANOVA showed significant differences among all treatments (wet and intermediate: F = 9.43, p = 0.001; wet and dry: F = 14.5, p = 0.001, and intermediate and dry: F = 3.99, p = 0.018). The first two principal components (PC) accounted for 71.36% of the variance (Figure 3). The first principal component (PC1) reflected the variation in OC, N, and EC, while the second component (PC2) was determined by variations in P (Table S2). Wet plots were strongly associated with higher fertility and nutrient availability. In contrast, the dry plots had higher pH and P availability. The intermediate plots, representing a transition zone, showed no strong association with any particular set of soil characteristics.
Figure 3.
Principal Component Analysis (PCA) of soil variables included pH, organic matter (OC), N, electrical conductivity (EC), P, K, Ca, and Mg across wet (blue, square), intermediate (pink, triangle), and dry (orange, circle) plots. Vectors indicated the direction and relative contribution of each variable in the ordination space. Ellipses represent group dispersion (0.5 level), and points inside each ellipse correspond to group centroids.
3.3. Reduced Annual Rainfall and Plot Variables Effects: Alpha Diversity
Both climatic conditions and their interactions with soil variables significantly influenced fungal biodiversity, with treatment emerging as the strongest driver (Figure 4 and Figure 5).
Figure 4.
Predictions of the best generalized linear mixed models explaining the species richness, Shannon’s index, and inverse of Simpson’s index of soil fungi. Principal Component 1 and temperature are shown as standardized values. Different letters (a, b) indicate statistically significant differences among treatments (p < 0.05). Blue right indicates wet treatment, pink indicates intermediate treatment, and orange indicates dry treatment.
Figure 5.
Predictions of the best generalized linear mixed models explaining the species richness, Shannon’s index, and inverse of Simpson’s index of ectomycorrhizal fungi (EcM) OTUs. Principal Component (PC) 1, PC 2, temperature, and elevation show standardized values. Different letters (a, b, c) indicate statistically significant differences among treatments (p < 0.05). Blue right indicates wet treatment, pink indicates intermediate treatment, and orange indicates dry treatment.
For soil fungi, models including interactions provided the best fit (species richness: R2 = 38%, dispersion test p = 0.95, AIC = 1681.1; Shannon’s index: R2 = 30%, dispersion test p = 0.58, AIC = 1380.6; inverse of Simpson’s index: R2 = 22%, dispersion test p = 0.86, AIC = 1107.7). The interaction between treatment (i.e., wet, intermediate, and dry) and mean annual temperature negatively affected species richness at wet plots, significantly differing from dry and intermediate plots. Shannon’s index decreased significantly in wet and intermediate plots as temperature increased, but increased in dry ones. Simpson’s inverse diversity significantly decreased with temperature only in intermediate plots (Figure 4). These results indicate that soil fungi in wet and intermediate plots are more sensitive to temperature changes, whereas OTUs in dry plots appear more tolerant. Regarding soil conditions, higher concentrations of OC, N, and EC (PC1) decreased the inverse of Simpson’s index in intermediate plots, suggesting that increased resource availability favored only a few dominant species.
For EcM species richness, the model including interaction explained 35% of the variance (dispersion test p = 0.96, AIC = 1132.9) (Figure 5). The interaction between treatment and mean temperature tended to increase richness in both dry and wet plots. Across all treatments, elevation was positively correlated with richness. When interactions were not considered, treatment alone showed significantly higher OTU richness in wet plots compared to intermediate and dry plots. Shannon’s and inverse Simpson’s indices were best explained by models without interaction terms (Shannon’s index: R2 = 18.6%, dispersion test p = 0.30, AIC = 846.7; inverse of Simpson’s index: R2 = 14.8%, dispersion test p = 0.06, AIC = 999.5) (Figure 5). For Shannon’s index, significant differences were observed across all treatments, with higher values in wet plots and lower values in dry ones (Figure 5). For the inverse of Simpson’s index, only wet plots differed significantly from intermediate and dry plots, showing higher diversity (Figure 5). Temperature, elevation, and phosphorus (PC2) were all significantly correlated with both indices (Figure 5), suggesting that these environmental factors consistently promote higher evenness across treatments.
3.4. Dissimilarity Between Communities Under Reduced Rainfall: Beta Diversity
For both soil fungal and EcM communities, we found evidence of turnover rather than nestedness in communities’ composition (turnover: F = 6.24, p = 0.001 and F = 4.947, p = 0.001; nestedness: F = −3.7286, p = 1 and F = 2.202, p = 0.161 for soil fungal and EcM communities, respectively). The correlation between environmental variables and NMDS ordination showed patterns consistent with the PERMANOVA results, except for PC2, which was not significant for EcM communities (Figure 6 and Figure 7, Table S3), suggesting a weaker influence of this variable compared to the others.
Figure 6.
Three-dimensional non-metric multidimensional scaling (NMDS) based on Bray–Curtis dissimilarity of soil fungal communities. (a) Significant environmental variables for soil fungal community by treatment and tree species. Soil fungal community by treatment for (b) Nothofagus dombeyi and (c) Nothofagus antarctica.
Figure 7.
Three-dimensional non-metric multidimensional scaling (NMDS) based on Bray–Curtis dissimilarity of EcM communities. (a) Significant environmental variables for the ectomycorrhizal fungi (EcM) community by treatment and tree species. EcM community by treatment for (b) Nothofagus dombeyi and (c) Nothofagus antarctica.
Nothofagus species had a significant effect on the complete soil fungal community (F = 9.85, p = 0.001) but not on the EcM community alone (F = 4.12, p = 0.087), although a slight trend was observed (Figure 6a and Figure 7a, respectively). Analyses within each forest species revealed significant treatment effects for both soil fungal (N. dombeyi: F = 7.108, p = 0.001; N. antarctica: F = 3.379, p = 0.001, Figure 6b,c) and EcM communities (N. dombeyi: F = 6.223, p = 0.001; N. antarctica: F = 2.882, p = 0.006, Figure 7b,c). These results reinforce the dominant role of soil moisture and temperature as key determinants shaping both soil fungal and EcM communities, although the magnitude of their influence differed between host species (Table S3).
We found significant effects of treatment, mean annual temperature, and soil physicochemical characteristics on both soil fungal (R2 = 22%, p = 0.001) and EcM communities (R2 = 19%, p = 0.001) (Table S3). In both cases, treatment was the main contributor to community differences (7.2% and 6.0%, respectively), followed by PC1 (associated with OC, N, and EC), which explained 5.0% and 4.6% of the variation, respectively. Phosphorus (PC2), annual temperature, and elevation contributed less to dissimilarity (2%, 2.4%, and 2% for soil fungal community; 2.2%, 2%, and 1.8% for EcM communities, respectively).
A substantial core of OTUs was shared among all treatments (Figure 8a,b). However, pairwise comparisons revealed greater overlap between dry and intermediate treatments than between either of them and wet treatments. Jaccard’s similarity indicated that dry and intermediate treatments shared a greater proportion of OTUs (48%) than wet and intermediate (47%) or wet and dry (44%). Morisita–Horn similarity showed the same pattern, with a high overlap in community composition between dry and intermediate treatments (65%), compared to wet and intermediate (36%) and wet and dry treatments (28%).
Figure 8.
Venn diagrams show shared and unique OTUs for (a) soil fungal and (b) ectomycorrhizal fungi (EcM) communities across treatments. Numbers represent OTUs, and percentages in parentheses indicate their relative contribution to the total OTUs. Wet plots are shown in blue, intermediate plots in pink, and dry plots in orange.
For EcM communities, Jaccard’s similarity revealed a comparable pattern to that observed for soil fungal communities, with dry and intermediate treatments being the most similar OTUs composition (49%), followed by wet and intermediate (47%) and wet and dry (45%) communities. Morisita–Horn similarity yielded the same results, with 60% overlap in community composition between dry and intermediate treatments, 47% between wet and dry, and 34% between wet and intermediate communities, indicating that dry and intermediate plots share a set of high abundance OTUs, whereas wet plots show lower similarity in terms of abundant taxa, suggesting a greater contribution of low-abundance or treatment-specific OTUs.
3.5. Ectomycorrhizal OTUs’ Ecological Preferences
231 were found in 10 or more sampling points, considering the 789 EcM species OTUs (Figure 9, Table S4). Dry plots were significantly associated with Tarzetta (Cooke) Lambotte sp. (OTU 2498, IndVal = 0.843, p = 0.044) and Cortinarius (Pers.) Gray sp. (OTU 724, IndVal = 0.782, p = 0.044). Although Russula Pers. sp. (OTU 2298) was the most abundant OTU in dry plots and it was also the second most abundant in intermediate ones (although with not significant IndVal = 0.427, p = 0.636), indicating also a potential tolerance to reduced water availability. Consistently, its abundance in wet plots was markedly lower, being approximately sevenfold lower than in dry plots and fourfold lower than in intermediate plots.
Figure 9.
Heatmap of the twenty most abundant ectomycorrhizal fungi (EcM) OTUs based on standardized relative abundance across treatments. The top dendrogram shows the similarity in fungal composition between treatments (wet, intermediate, and dry). The scale bar indicates the distribution of standardized relative abundance values.
In contrast, wet plots were significantly associated with three species of Cortinarius —Cortinarius vaginatus E. Horak and M.M. Moser (OTU 738, IndVal = 0.978, p = 0.039), Cortinarius coleopus M.M. Moser and E. Horak (OTU 721, IndVal = 0.932, p = 0.039), and Cortinarius sp. (OTU 765, IndVal = 0.564, p = 0.039)—two species of Sebacina Tul. and C. Tul.— Sebacina sp. (OTU 2349, IndVal = 0.894, p = 0.039) and Sebacina sp. (OTU 2352, IndVal = 0.862, p = 0.039)—and Tomentella Pers. ex Pat. (OTU 2538, IndVal = 0.752, p = 0.039) (Table S4).
4. Discussion
4.1. Diversity of Soil Fungi Under Reduced Rainfall
The effects of a reduction in precipitation on Nothofagus species have been previously documented [27,84,85]; however, our results offer new insights to understand how precipitation affected soil fungal and EcM communities in native Nothofagus forests. Our findings indicated that lower precipitation conditions markedly decrease the diversity of EcM fungi but not the overall soil fungal diversity. These outcomes highlight the vulnerability of EcM fungi to water limitation, partially supporting our first hypothesis (H1), which predicted that the alpha diversity of both total soil fungi and EcM fungi would decrease under reduced precipitation.
This pattern likely reflects functional differences among fungal guilds, as non-ectomycorrhizal fungi may exhibit greater tolerance to water limitation or compensate functionally under drier conditions (Figure 4). Accordingly, saprotrophic and arbuscular mycorrhizal fungi have been reported to remain stable under drought [15], whereas EcM fungal diversity and richness decline markedly during dry conditions in Mediterranean forests [22,86,87]. Similar responses have been observed in temperate forests, where EcM communities are more sensitive to changes in precipitation and temperature than other fungal groups [21,88,89]. Consequently, precipitation effects do not result in a uniform decline in total soil fungal alpha diversity, but instead reveal guild-specific sensitivities, underscoring the importance of considering fungal functional groups separately when assessing precipitation effects on soil fungal diversity.
Despite this general sensitivity of EcM fungi to water limitation, the relationship between precipitation and EcM diversity remains debated [33,90,91,92]. For example, Floriani et al. [92] found that although species richness did not differ between wet–dry sites in temperate Nothofagaceae forests, the evenness decreased under drier conditions. However, within the range of conditions examined in our study (Table 1), wetter, higher, and warmer sites generally tended to show increased EcM diversity (Figure 5). Such patterns may arise because under these conditions, Nothofagus forests harbor higher biomass and microclimatic variability [92,93,94], providing a wider range of ecological niches for fungi [33,95]. Importantly, the altitudinal gradient included in this study was relatively narrow (approximately 400 m.a.s.l), which resulted in low temperature differences among plots. Consequently, the known negative relationship between elevation and temperature [96] was not evident in our sampling, thus did not generate the expected pattern on EcM diversity [33,97].
Furthermore, the broader thermal tolerance range observed in some EcM taxa could allow them to persist under fluctuating conditions, acting as a compensatory mechanism in response to water deficit, as suggested by patterns observed in mature mixed forests dominated by Castanopsis sp., Quercus sp., and Pinus sp. in Japan [98]. This finding underscores the importance of considering EcM fungi as bioindicators in the context of climate change, and these areas could serve as potential reservoirs of EcM fungal diversity in Nothofagus forests, highlighting their potential role in buffering forest ecosystems against future climate variability.
4.2. Composition of Soil Fungi Under Reduced Rainfall
The main pattern observed of soil fungal communities in dryer conditions was the turnover of OTUs (Figure 6a and Figure 7a). This pattern supports our second hypothesis (H2), which predicted changes in the composition of soil fungal and EcM communities in response to reduced precipitation. These findings are consistent with reports of the temperate forest [98,99,100], Mediterranean forest [15,24,100,101], and Amazon rain forest [102]. As turnover is a major component of community resilience [103,104], these findings highlight the response of soil fungal communities to environmental fluctuations in Nothofagus forests. Species turnover could have important implications for forest ecosystem functioning by altering nutrient cycling, organic matter decomposition rates, and interactions with symbiotic partners, which may ultimately influence vegetation recovery and ecosystem vulnerability [19,102].
Additionally, we found that community similarity driven by soil fungi dominant species was higher in sites with reduced precipitation, indicating that common and abundant taxa prevail under drier conditions. This pattern suggests that these taxa are better adapted to water limitations and potentially more resistant to drier conditions. In contrast, communities under more precipitation showed a greater representation of rare species, implying a higher contribution of low-abundance and turnover-prone OTUs, possibly reflecting increased niche availability in wetter environments [33]. This pattern could suggest that, as wet sites become drier under climate change, taxa that are currently abundant in dry sites—yet already present in wet sites—may increase in dominance in these communities.
For EcM fungi, similar patterns have been reported in other temperate forests, where the change in EcM fungal colonization has been attributed both to the direct effects of drought and to plants’ adaptive strategies aimed at minimizing carbon costs [105]. Furthermore, common EcM fungi have been shown to persist during dry seasons through hydraulic lift [24,89], although their interaction networks may become simpler under drought conditions [99]. In contrast, the number of rare species tends to decrease with the increase in drought [89]. Moreover, some studies indicate that associated tree species identity is an important shaping of EcM community composition [25,54]. In Nothofagaceae forests, it has been recently reported that beta diversity could have a host tree effect, but only at drier conditions [92]. Despite these host trees’ effects, we found that approximately 30% of the EcM OTUs were shared across all treatments, indicating a substantial common core among the EcM communities associated with different tree species (Figure 8). Barroetaveña et al. [8] reported that N. antarctica and N. dombeyi shared 50% of their EcM species. However, consistent with Nouhra et al. [88], our results indicated that the identity of host species did not significantly influence EcM community composition, suggesting that EcM communities may be relatively stable across different Nothofagus hosts in this region (Figure 6 and Figure 7). Under climate change projections for Argentine Patagonia, we could expect a soil fungal consortium, composed primarily of common OTUs, to persist despite reduced precipitation, potentially maintaining key ecosystem functions.
4.3. Soil Composition Effect on Fungal Community
The high OC and allophanic microstructure of the Patagonian Andisol soils promote infiltration without waterlogging, regulating the soil water cycle and shaping soil fungal community structure [5]. Additionally, changes in soil nutrient status affect the soil fungal community structure [106,107]. Intermediate plots, with higher contents of OC and N, together with higher EC, were associated with higher abundance of soil fungi, suggesting that increased nutrient availability may enhance decomposer activity and may lead to more diverse soil fungi communities [21,33,108]. On the other hand, P—a limiting nutrient in Andean-Patagonian forests [6]—drives EcM fungal diversity, as increases in P led to more even communities (Shannon’s index and inverse of Simpson’s index, Figure 5), likely due to the enhanced abundance of extramatrical mycelium [107].
These patterns highlight the fundamental role played by physicochemical properties in the composition of soil fungal communities, which mediate nutrient cycling and ecosystem processes [109,110]. In this context, intermediate sites may represent functional hotspots, where the balance between soil moisture and nutrient availability could maximize soil fungal diversity. However, under future climate change scenarios, shifts in nutrient availability and stoichiometric balance are expected [2], potentially leading to changes in the composition and ecological functioning of fungal communities [111,112]. Consequently, long-term monitoring of soil nutrient dynamics in Andean–Patagonian forests dominated by Nothofagus species is key to predicting ecosystem responses and managing impacts on soil biodiversity.
4.4. Implications of EcM for Nothofagus Forest Restoration
Restoration of Nothofagus forests has been facilitated by shading and reduced competition with grass; however, the availability of EcM has been largely overlooked [26]. Ectomycorrhizal inoculation could enhance restoration success by improving seedlings’ nutrient and water uptake, highlighting the need to develop effective inoculation strategies [26]. In this context, we found OTUs assigned to the genera Tarzetta, Russula, and some species of Cortinarius were relatively more abundant in plots with lower precipitation, supporting our third hypothesis (H3) and indicating they could have potential drought tolerance.
It has been proposed that EcM taxa associated with dry environments may share functional/morphological traits related to drought tolerance, such as melanized sclerotia, rhizomorphs, and secotioid form [113,114,115,116]. In particular, the transitions toward hypogeous or sequestrate habits would represent adaptive strategies under environmentally restrictive conditions, as enclosed basidiomes may reduce desiccation and tolerate higher temperatures during periods of water stress [113,115,116]. In Patagonian Nothofagus forests, Barroetaveña et al. [8] reported 34 taxa of hypogeous EcM fungi and nine taxa of subhypogeous fungi. In our work, genera associated with lower precipitation include lineages with hypogeous or subhypogeous habits. Within the/tarzetta–geopyxis lineage, hypogeous or truffle-like genera, such as Densocarpa Gilkey, Hydnocystis Tul., C. Tul., and Paurocotylis Berk. [117], have been reported, suggesting that they have formed as adaptations to restrictive environmental conditions like drought or seasonality [117,118]. Similarly, Russula includes lineages related to sequestrate forms, such as Cystangium, which have been reported in association with Nothofagus forests [119]. In the case of Cortinarius, a high degree of ecological diversity has been documented, including several hypogeous species such as C. albocanus (Horak and Moser) Peintner and Moser, C. infrequens Pastor and Nouhra, C. lavopurpureus Pastor and Nouhra, C. lazoi M.M. Moser, C. sclerospermus Peintner and M.M. Moser, C. singerianus Peintner, C. translucidus Pastor and Nouhra and C. tympanicus (E. Horak) Peintner and M.M. Moser [8] and also some species particularly adapted to dry environments, possibly due to the persistence and hydrophobic properties of their mycelium [120,121]. In addition, Thaxterogaster Siger genus, which has since been shown to be phylogenetically nested within Cortinarius and is now a sister group of them, also presents all subhypogeous species [122]. In this study, we found that Cortinarius subrufus San-Frans and Liimat. was positively associated with intermediate and dry plots. This species has been recorded in N. antarctica and N. pumilio (Poepp. and Endl.) Krasser forests [123], which experience environmentally stressful conditions [94], suggesting a possible tolerance to water stress.
Although previous studies have reported increased abundance of drought-tolerant EcM species such as Cenococcum geophilum and Xerocomus chrysenteron [21,100,116,124], as well as species of Tuber, Wilcoxina, Hebeloma, Laccaria, and Inocybe during dry periods [99,125] and have even identified Descolea antarctica as drought-tolerant in Nothofagus forests [10], we did not observe higher abundance of those taxa associated with our dry study sites. This discrepancy may be related to sampling seasonal variations, forest developmental stage, or the regional fungal communities composition [8,10,116]. Identifying native species with evolutionary relationships that have promoted their specialization to survive under reduced precipitation or drought is crucial to effectively select target species for inoculation management of seedlings to restore forests under these conditions [113]. Seedlings inoculated with native EcM species have shown better performance and survival under stressful conditions [126]. For instance, in European pine forests, inoculation with Rhizopogon spp. Fr. has increased the development and growth of associate species and has also proven tolerant to a wider range of adverse environmental conditions [127]. Nevertheless, the appropriate selection of candidate EcM species for inoculum formulation is a critical aspect, as it depends on the technology available for production, including the need for pure cultures and costly infrastructure, prior knowledge of the colonization effectiveness of different species under various inoculum formulations, and the ease and speed of cultivation of the species in question [126,128,129]. For these reasons, spores are frequently used in inoculation programs, since their use is based on criteria such as the abundance and ease of collection of sporocarps, the fruiting period, and spore density, factors that contribute to maximizing the effectiveness of inoculation [130]. Therefore, in the context of future restoration programs under climate change, the selection of EcM fungi should consider both their potential tolerance to drought, such as Tarzetta, Russula, and some Cortinarius species, and the feasibility of inoculum production, to enhance the resilience of Nothofagus forests under increasingly arid conditions. In practical restoration programs, seedlings produced in nurseries can be pre-inoculated with these fungi; however, further trials and collaborative experiments are still needed to optimize these approaches.
4.5. Challenges and Perspectives
Taxonomic classification of the community revealed a high number of unidentified sequences, suggesting the presence of many fungi yet undescribed for the region [32,42,131]. These limitations can be partly attributed to the incompleteness of public reference databases (e.g., UNITE, NCBI) [132], a common issue in metabarcoding studies [31], as next-generation sequencing (NGS) technologies uncover hidden diversity that often lacks adequate reference sequences. Expanding and curating public databases, including species associated with Nothofagaceae forests, is therefore needed to maximize the potential of NGS in further studies [133].
Additionally, Illumina MiSeq sequencing generates short reads, limiting the taxonomic resolution for many OTUs [31]. This issue is particularly evident in diverse genera such as Cortinarius, which exhibits high intraspecific ITS variability [134], or Russula, where taxonomic delimitation remains challenging [135]. OTU-based approaches remain widely used in fungal metabarcoding studies and facilitate comparisons across datasets and with previously published studies [45,97,136]. Alternatively, amplicon sequence variants (ASV)—based approaches may detect intraspecific ITS variability and distinguish it from PCR variants [137,138]. Our molecular methods overestimated PCR errors, and we therefore retained OTU delineation rather than attempting to assign OTUs based on reference databases. Recent advances in long-read sequencing technologies also offer an alternative approach by enabling the recovery of longer genomic regions and improving taxonomic assignment [139]. All these approaches could be explored in future studies.
At the regional scale, genomic studies of fungi in northwestern Patagonia remain scarce [140], making comparisons of diversity measures difficult. Previous reports suggest that mixed forests exhibit intermediate diversity [140], while Nothofagus forests generally display high diversity values [7]. The regular application of standardized metrics, such as Hill’s numbers, could improve comparability among eDNA metabarcoding studies [141], notably to monitor in the long-term the consequences of precipitation reduction.
Deepening the understanding of the functional roles of EcM fungi is also crucial. Different EcM species possess traits, such as spore resistance or soil storage structures, which may confer greater drought tolerance [120,142]. However, confirming these roles requires more extensive experimental studies, including sporocarp sampling [143], root morphotyping that allows direct observation of ectomycorrhizal vitality [144], and greenhouse or physiological assays [145]. Together, these methodological challenges underscore the need for integrative studies that combine technical improvements and functional approaches to better understand the diversity and ecological role of EcM fungi under climate change scenarios.
5. Conclusions
Our study showed that reduced rainfall influenced soil fungal communities in Patagonian Nothofagus forests. Ectomycorrhizal fungi are particularly vulnerable to reduced water availability, showing declines in richness and evenness under drier conditions, whereas overall soil fungal diversity responds more moderately. Species turnover was the main driver of soil fungal community composition in response to reduced rainfall, while associated plant identity also plays a key role; however, this was not observed for EcM communities. Environmental factors such as soil OC, N, EC, and P significantly influence the structure of both soil fungal and EcM communities. Long-term shifts in fungal community composition may have wide-ranging ecosystem implications, from altered nutrient cycling and organic matter decomposition rates to changes in symbiotic interactions that affect vegetation recovery and pathogen susceptibility [142].
Our findings highlight the importance of considering both biotic and abiotic drivers in forest restoration, emphasizing the selection of native, drought-tolerant EcM species to enhance seedling establishment and ecosystem resilience. Finally, the high proportion of unclassified OTUs underscores the need for expanded reference databases and integrative approaches combining taxonomic, functional, and experimental studies to better understand the ecological role of soil fungi and EcM under increasingly arid conditions expected under climate change.
Supplementary Materials
The following supporting information can be downloaded at: https://www.mdpi.com/article/10.3390/f17040424/s1, Figure S1: The rarefaction-extrapolation curves of species richness (q = 0), Shannon’s index (q = 1), the inverse of Simpson’s index (q = 2) and sample coverage of soil fungi (a) and EcM (b) based on the relative abundance of reads are presented here. Extrapolation was indicated up to double the sample size (default). The solid lines in the graph represent rarefaction, while the dotted lines represent extrapolation. The demarcation of the plots is as follows: orange lines indicate dry plots, blue intermediate plots, and pink wet ones, Table S1: Mean (±SD) value of soil variables for each plot wet, intermediate, and dry, Table S2: Variable contributions to the first two axes of the Principal Component Analysis of site descriptors. Variables that significantly contribute to the explanation of each component are highlighted in bold, Table S3: Results of the selection of PERMANOVA models based on the Corrected Akaike Information Criterion (AICc) for soil fungal and for EcM communities. For each model, the value of AICc and the number of parameters (k) are given, Table S4: Results for EcM OTUs with more than ten observations based on the Correlation Index used to evaluate species preference for wet, intermediate, and dry plots. OTUs are ordered by the strength of their association, first with wet plots, then intermediate plots, and finally dry plots.
Author Contributions
C.A.: Conceptualization, Data curation, Formal analysis, Investigation, Methodology, Writing—original draft, Visualization. M.E.S.S.: Conceptualization, Methodology, Writing—review and editing, Supervision, Project administration, Funding acquisition, Resources. C.B.: Conceptualization, Methodology, Writing—review and editing, Supervision, Project administration, Funding acquisition, Resources. M.R.: Methodology, Data curation, Writing—review and editing, Resources, Funding acquisition. All authors have read and agreed to the published version of the manuscript.
Funding
This research was funded by PICT Grupo en Formación Nº PICT 2020-SERIE A-02235 (PI María Eugenia Salgado Salomón), Regional Program CLIMAT-AmSud 2021 Project Proposal The Andes: co-constructing an e-DNA observatory of biodiversity changes in response to climate change (PI Mélanie Roy) and International Emerging Action RACINE (Resilience in Action: Changing Interaction Networks at Ecotones, CNRS, PI Mélanie Roy).
Data Availability Statement
The dataset was deposited in the CONICET Digital Institutional Repository. URI: http://hdl.handle.net/11336/274993, accessed on 10 October 2025.
Acknowledgments
We thank the owners of the establishments and Fauna and Flora Management of Chubut province (DFyFS-MAGIyC Research Permit N° 55/2021 and SsCyAP Research Permit N° 47/2021) and the Administración de Parques Nacionales-Delegación Patagonia (APN Research Permit N°1728) for allowing us to carry out the field work. We also thank François De Vleeschouwer, Brig. Benjamin Gonzales (Delegacion de Cholila), the staff of the Delegacion Principal de Bosques de Corcovado, and Rodrigo Galme for their help and good predisposition during sampling trips, Lic. Virginia Alonso also helped with soil analysis. Paula Giles (CIEFAP), Coralie Roy-Camille, and Antoine Brin (Ecole d’Ingénieurs de Purpan) contributed to molecular biology and welcomed C. Arguiano in their lab. The sequencing was produced on the GeT-PlaGe platform, and the bioinformatic analyses were handled through the cluster of GenoToul. CA is a fellow, MESS and CB are researchers for CONICET, and MR is a researcher for IFAECI and the University of Toulouse.
Conflicts of Interest
The authors declare no conflicts of interest.
Abbreviations
The following abbreviations are used in this manuscript:
| EcM | Ectomycorrhizal fungi |
| eDNA | Environmental DNA |
| NGS | Next Generation Sequencing |
| TLSA | Lago Steffen wet transect |
| TLSB | Lago Steffen intermediate transect |
| TLSC | Lago Steffen dry transect |
| TChA | Cholila wet transect |
| TChB | Cholila intermediate transect |
| TChC | Cholila dry transect |
| TCA | Corcovado wet transect |
| TCB | Corcovado intermediate transect |
| TCC | Corcovado dry transect |
| OUT | Operational Taxonomic Units |
| N | Total nitrogen content |
| OC | Organic carbon content |
| Ca | Calcium |
| Mg | Magnesium |
| Na | Sodium |
| K | Potasium |
| CEC | Cation exchange capacity |
| EC | Electrical conductivity |
| SO4= | Sulfur |
| P | Available phosphorus |
| PC1 | Principal component 1 |
| PC2 | Principal component 2 |
References
- Agosta, E.; Araneo, D.; Camilloni, I.; Carril, A.F.; Doyle, M.; Frumento, O.; Nuñez, M.; Ortiz de Zarate, M.I.; Penalba, O.; Rusticucci, M.; et al. Cambio climático en Argentina: Tendencias y proyecciones. In Tercera Comunicación Nacional de la República Argentina a la Convención Marco de las Naciones Unidas Sobre el Cambio Climático; Centro de Investigaciones del Mar y la Atmósfera (CIMA): Buenos Aires, Argentina, 2015. [Google Scholar]
- Calvin, K.; Dasgupta, D.; Krinner, G.; Mukherji, A.; Thorne, P.W.; Trisos, C.; Romero, J.; Aldunce, P.; Barrett, K.; Blanco, G.; et al. IPCC, 2023: Climate Change 2023: Synthesis Report. Contribution of Working Groups I, II and III to the Sixth Assessment Report of the Intergovernmental Panel on Climate Change; Core Writing Team; Lee, H., Romero, J., Eds.; IPCC: Geneva, Switzerland, 2023. [Google Scholar]
- Consejo de Planificación y Acción para el Desarrollo (COPADE). Cartas de Precipitación de la Zona Oeste de las Provincias de Río Negro y Neuquén; Gobierno de la Provincia del Neuquén: Neuquén, Argentina, 1983; Available online: https://copade.neuquen.gob.ar/Publicaciones/Docs/3869/3869.pdf (accessed on 10 October 2025).
- Las Especies Arbóreas de los Bosques Templados de Chile y Argentina: Autoecología; Donoso Zegers, C., Ed.; Primera Edición.; Marisa Cuneo Ediciones: Valdivia, Chile, 2006; ISBN 978-956-7173-27-3. [Google Scholar]
- Buduba, C.G.; La Manna, L.; Irisarri, J.A. El suelo y el bosque en la Región Andino Patagónica. In Suelos y Vulcanismo Argentina; Asociación Argentina de la Ciencia del Suelo: Buenos Aires, Argentina, 2020; pp. 361–390. [Google Scholar]
- La Manna, L.; Buduba, C.G.; Irisarri, J.A. Suelos volcánicos de la provincia del Chubut. In Suelos y Vulcanismo Argentina; Asociación Argentina de la Ciencia del Suelo: Buenos Aires, Argentina, 2020; pp. 333–360. [Google Scholar]
- Schön, M.E.; Zuern, S.; Vera, M.; Garnica, S. High Diversity of Fungal Ecological Groups in Andean–Patagonian Nothofagus Forests. PLoS ONE 2023, 18, e0290398. [Google Scholar] [CrossRef] [Scilit] [PubMed]
- Barroetaveña, C.; Salomón, M.E.S.; Bassani, V. Rescuing the Ectomycorrhizal Biodiversity Associated with South American Nothofagaceae Forest, from the 19th Century Naturalists up to Molecular Biogeography. For. Int. J. For. Res. 2019, 92, 500–511. [Google Scholar] [CrossRef] [Scilit]
- Singer, R.; Morello, J.H. Ectotrophic Forest Tree Mycorrhizae and Forest Communities. Ecology 1960, 41, 549–551. [Google Scholar] [CrossRef] [Scilit]
- Alberdi, M.; Álvarez, M.; Valenzuela, E.; Godoy, R.; Olivares, E.; Barrientos, M. Response to Water Deficit of Nothofagus Dombeyi Plants Inoculated with a Specific (Descolea Antárctica Sing) and Non-Specific (Pisolithus Tinctorious (Pers.) Coker & Couch) Ectomycorrhizal Fungi. Rev. Chil. Hist. Nat. 2007, 80, 479–491. [Google Scholar] [CrossRef] [Scilit]
- Jany, J.-L.; Martin, F.; Garbaye, J. Respiration Activity of Ectomycorrhizas from Cenococcum Geophilum and Lactarius Sp. in Relation to Soil Water Potential in Five Beech Forests. Plant Soil 2003, 255, 487–494. [Google Scholar] [CrossRef] [Scilit]
- Li, L.; Zhang, H.; Tang, M.; Chen, H. Nutrient Uptake and Distribution in Mycorrhizal Cuttings of Populus × Canadensis ‘Neva’ Under Drought Stress. J. Soil Sci. Plant Nutr. 2021, 21, 2310–2324. [Google Scholar] [CrossRef] [Scilit]
- Smith, S.E.; Read, D.J. Mycorrhizal Symbiosis; Academic Press: Cambridge, MA, USA, 2010; ISBN 978-0-08-055934-6. [Google Scholar]
- Bittlingmaier, M.; Séjalon-Delmas, N.; Goldmann, K.; Johnson, D.; Huys, R.; Freschet, G.T. Plant and Soil Biodiversity Sustain Root Mycorrhizal Fungal Richness under Drought Stress. ISME J. 2025, 19, wraf102. [Google Scholar] [CrossRef] [Scilit]
- Hopkins, A.J.M.; Ruthrof, K.X.; Fontaine, J.B.; Matusick, G.; Dundas, S.J.; Hardy, G.E. Forest Die-off Following Global-Change-Type Drought Alters Rhizosphere Fungal Communities. Environ. Res. Lett. 2018, 13, 095006. [Google Scholar] [CrossRef] [Scilit]
- McLean, M.A.; Huhta, V. Temporal and Spatial Fluctuations in Moisture Affect Humus Microfungal Community Structure in Microcosms. Biol. Fertil. Soils 2000, 32, 114–119. [Google Scholar] [CrossRef] [Scilit]
- Osono, T.; Ono, Y.; Takeda, H. Fungal Ingrowth on Forest Floor and Decomposing Needle Litter of Chamaecyparis Obtusa in Relation to Resource Availability and Moisture Condition. Soil Biol. Biochem. 2003, 35, 1423–1431. [Google Scholar] [CrossRef] [Scilit]
- Büntgen, U.; Egli, S.; Galván, J.D.; Diez, J.M.; Aldea, J.; Latorre, J.; Martínez-Peña, F. Drought-Induced Changes in the Phenology, Productivity and Diversity of Spanish Fungi. Fungal Ecol. 2015, 16, 6–18. [Google Scholar] [CrossRef] [Scilit]
- Baselga, A. Partitioning the Turnover and Nestedness Components of Beta Diversity. Glob. Ecol. Biogeogr. 2010, 19, 134–143. [Google Scholar] [CrossRef] [Scilit]
- Soininen, J.; Heino, J.; Wang, J. A Meta-analysis of Nestedness and Turnover Components of Beta Diversity across Organisms and Ecosystems. Glob. Ecol. Biogeogr. 2018, 27, 96–109. [Google Scholar] [CrossRef] [Scilit]
- Fracchia, F.; Dauphin, B.; Walthert, L.; Graf, R.; Köchli, R.; Pfister, S.; Baltensweiler, A.; Kohler, A.; Peter, M. Relative Importance of Water Stress and Host Vitality in Structuring Root Fungal Communities in Beech Forests. Plant Soil 2025, 517, 1495–1515. [Google Scholar] [CrossRef] [Scilit]
- Reis, F.; Valdiviesso, T.; Varela, C.; Tavares, R.M.; Baptista, P.; Lino-Neto, T. Ectomycorrhizal Fungal Diversity and Community Structure Associated with Cork Oak in Different Landscapes. Mycorrhiza 2018, 28, 357–368. [Google Scholar] [CrossRef] [Scilit]
- Gehring, C.A.; Sthultz, C.M.; Flores-Rentería, L.; Whipple, A.V.; Whitham, T.G. Tree Genetics Defines Fungal Partner Communities That May Confer Drought Tolerance. Proc. Natl. Acad. Sci. USA 2017, 114, 11169–11174. [Google Scholar] [CrossRef] [Scilit]
- Querejeta, J.I.; Egerton-Warburton, L.M.; Allen, M.F. Topographic Position Modulates the Mycorrhizal Response of Oak Trees to Interannual Rainfall Variability. Ecology 2009, 90, 649–662. [Google Scholar] [CrossRef] [Scilit]
- Van Der Linde, S.; Suz, L.M.; Orme, C.D.L.; Cox, F.; Andreae, H.; Asi, E.; Atkinson, B.; Benham, S.; Carroll, C.; Cools, N.; et al. Environment and Host as Large-Scale Controls of Ectomycorrhizal Fungi. Nature 2018, 558, 243–248. [Google Scholar] [CrossRef] [Scilit]
- Van Galen, L.G.; Lord, J.M.; Orlovich, D.A.; Larcombe, M.J. Restoration of Southern Hemisphere Beech (Nothofagaceae) Forests: A Meta-analysis. Restor. Ecol. 2021, 29, e13333. [Google Scholar] [CrossRef] [Scilit]
- Suarez, M.L.; Villalba, R.; Mundo, I.A.; Schroeder, N. Sensitivity of Nothofagus Dombeyi Tree Growth to Climate Changes along a Precipitation Gradient in Northern Patagonia, Argentina. Trees 2015, 29, 1053–1067. [Google Scholar] [CrossRef] [Scilit]
- Brewer, C.A.; Nuñez, C.I. Patterns of Leaf Wettability along an Extreme Moisture Gradient in Western Patagonia, Argentina. Int. J. Plant Sci. 2007, 168, 555–562. [Google Scholar] [CrossRef] [Scilit]
- Lavergne, A.; Daux, V.; Villalba, R.; Barichivich, J. Temporal Changes in Climatic Limitation of Tree-Growth at Upper Treeline Forests: Contrasted Responses along the West-to-East Humidity Gradient in Northern Patagonia. Dendrochronologia 2015, 36, 49–59. [Google Scholar] [CrossRef] [Scilit]
- Suarez, M.L.; Kitzberger, T. Recruitment Patterns Following a Severe Drought: Long-Term Compositional Shifts in Patagonian Forests. Can. J. For. Res. 2008, 38, 3002–3010. [Google Scholar] [CrossRef] [Scilit]
- Taberlet, P.; Coissac, E.; Pompanon, F.; Brochmann, C.; Willerslev, E. Towards Next-generation Biodiversity Assessment Using DNA Metabarcoding. Mol. Ecol. 2012, 21, 2045–2050. [Google Scholar] [CrossRef] [Scilit] [PubMed]
- Truong, C.; Sánchez-Ramírez, S.; Kuhar, F.; Kaplan, Z.; Smith, M.E. The Gondwanan Connection—Southern Temperate Amanita Lineages and the Description of the First Sequestrate Species from the Americas. Fungal Biol. 2017, 121, 638–651. [Google Scholar] [CrossRef] [Scilit]
- Peay, K.G.; Von Sperber, C.; Cardarelli, E.; Toju, H.; Francis, C.A.; Chadwick, O.A.; Vitousek, P.M. Convergence and Contrast in the Community Structure of Bacteria, Fungi and Archaea along a Tropical Elevation–Climate Gradient. FEMS Microbiol. Ecol. 2017, 93, fix045. [Google Scholar] [CrossRef] [Scilit]
- Zimmerman, N.B.; Vitousek, P.M. Fungal Endophyte Communities Reflect Environmental Structuring across a Hawaiian Landscape. Proc. Natl. Acad. Sci. USA 2012, 109, 13022–13027. [Google Scholar] [CrossRef] [Scilit]
- González, G.C.; Barroetaveña, C.; Visnovsky, S.B.; Rajchenberg, M.; Pildain, M.B. Ramaria Species in Nothofagus Forests of Patagonia, with the Description of Two New Species. Mycol. Prog. 2023, 22, 60. [Google Scholar] [CrossRef] [Scilit]
- Nouhra, E.; Kuhar, F.; Truong, C.; Pastor, N.; Crespo, E.; Mujic, A.; Caiafa, M.V.; Smith, M.E. Thaxterogaster Revisited: A Phylogenetic and Taxonomic Overview of Sequestrate Cortinarius from Patagonia. Mycologia 2021, 113, 1022–1055. [Google Scholar] [CrossRef] [Scilit]
- Pfister, D.H.; Healy, R.; Furci, G.; Mujic, A.; Nouhra, E.; Truong, C.; Caiafa, M.V.; Smith, M.E. A Reexamination and Realignment of Peziza Sensu Lato (Pezizomycetes) Species in Southern South America. Darwiniana Nueva Ser. 2022, 10, 148–177. [Google Scholar] [CrossRef] [Scilit]
- Salgado Salomón, M.E.; Barroetaveña, C.; Niskanen, T.; Liimatainen, K.; Smith, M.E.; Peintner, U. Loose Ends in the Cortinarius Phylogeny: Five New Myxotelamonoid Species Indicate a High Diversity of These Ectomycorrhizal Fungi with South American Nothofagaceae. Life 2021, 11, 420. [Google Scholar] [CrossRef] [Scilit] [PubMed]
- Salgado Salomón, M.E.; Dresch, P.; Horak, E.; Galleguillos, F.; Barroetaveña, C.; Peintner, U. The Enigmatic Cortinarius Magellanicus Complex Occurring in Nothofagaceae Forests of the Southern Hemisphere. Fungal Biol. 2018, 122, 1077–1097. [Google Scholar] [CrossRef] [Scilit] [PubMed]
- Salgado Salomón, M.E.; Barroetaveña, C.; Pildain, M.B.; Williams, E.A.; Rajchenberg, M. What Happens to the Mycorrhizal Communities of Native and Exotic Seedlings When Pseudotsuga Menziesii Invades Nothofagaceae Forests in Patagonia, Argentina? Acta Oecologica 2018, 91, 108–119. [Google Scholar] [CrossRef] [Scilit]
- Carril, A.F.; Flombaum, P.; Menéndez, C.G. Datos climáticos y prácticas recomendadas para proyectar cambios en la distribución de especies. Darwiniana Nueva Ser. 2023, 11, 367–389. [Google Scholar] [CrossRef] [Scilit]
- Arguiano, C.; Salgado Salomón, M.E.; Barroetaveña, C.; Roy, M. Wildfire Impact on the Soil Funga Associated to Nothofagus Forests from Central-Western Patagonia, Argentina. Fire Ecol. 2025, 21, 70. [Google Scholar] [CrossRef] [Scilit]
- Bahram, M.; Kõljalg, U.; Courty, P.-E.; Diédhiou, A.G.; Kjøller, R.; Põlme, S.; Ryberg, M.; Veldre, V.; Tedersoo, L. The Distance Decay of Similarity in Communities of Ectomycorrhizal Fungi in Different Ecosystems and Scales. J. Ecol. 2013, 101, 1335–1344. [Google Scholar] [CrossRef] [Scilit]
- Chen, M.; Dulya, O.; Mikryukov, V.; Copot, O.; Metsoja, M.; Tedersoo, L. Sampling Design and Sample Processing Affect Soil Biodiversity Assessments. Mol. Ecol. Resour. 2026, 26, e70113. [Google Scholar] [CrossRef] [Scilit]
- Mennicken, S.; Kondratow, F.; Buralli, F.; Manzi, S.; Andrieu, E.; Roy, M.; Brin, A. Effects of Past and Present-Day Landscape Structure on Forest Soil Microorganisms. Front. Ecol. Evol. 2020, 8, 118. [Google Scholar] [CrossRef] [Scilit]
- Epp, L.S.; Boessenkool, S.; Bellemain, E.P.; Haile, J.; Esposito, A.; Riaz, T.; Erséus, C.; Gusarov, V.I.; Edwards, M.E.; Johnsen, A.; et al. New Environmental Metabarcodes for Analysing Soil DNA: Potential for Studying Past and Present Ecosystems. Mol. Ecol. 2012, 21, 1821–1833. [Google Scholar] [CrossRef] [Scilit]
- Taberlet, P.; Bonin, A.; Zinger, L.; Coissac, E. Environmental DNA: For Biodiversity Research and Monitoring; Oxford University Press: Oxford, UK, 2018; ISBN 978-0-19-876722-0. [Google Scholar]
- Donald, J.; Murienne, J.; Chave, J.; Iribar, A.; Louisanna, E.; Manzi, S.; Roy, M.; Tao, S.; Orivel, J.; Schimann, H.; et al. Multi-Taxa Environmental DNA Inventories Reveal Distinct Taxonomic and Functional Diversity in Urban Tropical Forest Fragments. Glob. Ecol. Conserv. 2021, 29, e01724. [Google Scholar] [CrossRef] [Scilit]
- Boyer, F.; Mercier, C.; Bonin, A.; Le Bras, Y.; Taberlet, P.; Coissac, E. Obitools: A Unix-Inspired Software Package for DNA Metabarcoding. Mol. Ecol. Resour. 2016, 16, 176–182. [Google Scholar] [CrossRef] [Scilit] [PubMed]
- Nilsson, R.H.; Kristiansson, E.; Ryberg, M.; Hallenberg, N.; Larsson, K.-H. Intraspecific ITS Variability in the Kingdom Fungi as Expressed in the International Sequence Databases and Its Implications for Molecular Species Identification. Evol. Bioinform. Online 2008, 4, EBO.S653. [Google Scholar] [CrossRef] [Scilit] [PubMed]
- Benson, D.A.; Cavanaugh, M.; Clark, K.; Karsch-Mizrachi, I.; Lipman, D.J.; Ostell, J.; Sayers, E.W. GenBank. Nucleic Acids Res. 2013, 41, D36–D42. [Google Scholar] [CrossRef] [Scilit] [PubMed]
- Zinger, L.; Lionnet, C.; Benoiston, A.; Donald, J.; Mercier, C.; Boyer, F. metabaR: An R Package for the Evaluation and Improvement of DNA Metabarcoding Data Quality. Methods Ecol. Evol. 2021, 12, 586–592. [Google Scholar] [CrossRef] [Scilit]
- Põlme, S.; Abarenkov, K.; Henrik Nilsson, R.; Lindahl, B.D.; Clemmensen, K.E.; Kauserud, H.; Nguyen, N.; Kjøller, R.; Bates, S.T.; Baldrian, P.; et al. FungalTraits: A User-Friendly Traits Database of Fungi and Fungus-like Stramenopiles. Fungal Divers. 2020, 105, 1–16. [Google Scholar] [CrossRef] [Scilit]
- Biogeography of Mycorrhizal Symbiosis; Tedersoo, L., Ed.; Ecological Studies; Springer International Publishing: Cham, Switzerland, 2017; Volume 230, ISBN 978-3-319-56362-6. [Google Scholar]
- Bouyoucos, G.J. Hydrometer Method Improved for Making Particle Size Analyses of Soils. Agron. J. 1962, 54, 464–465. [Google Scholar] [CrossRef] [Scilit]
- IRAM-SAGyP Instituto Argentino de Normalización y Certificación (IRAM). Calidad Del Suelo Determinación de pH En Suelo Para Uso Agropecuario; IRAM-SAGyP 29574:2021; IRAM-SAGyP Instituto Argentino de Normalización y Certificación (IRAM): Buenos Aires, Argentina, 2021. [Google Scholar]
- Fields, M.; Parrot, K.W. The Nature of Allophane in Soils. III. Rapid Field and Laboratory Test for Allophane. N. Z. J. Sci. 1966, 9, 623–629. [Google Scholar]
- Bremner, J.M. Determination of Nitrogen in Soil by the Kjeldahl Method. J. Agric. Sci. 1960, 55, 11–33. [Google Scholar] [CrossRef] [Scilit]
- Davies, B.E. Loss-on-Ignition as an Estimate of Soil Organic Matter. Soil Sci. Soc. Am. J. 1974, 38, 150–151. [Google Scholar] [CrossRef] [Scilit]
- Schollenberger, C.J.; Simon, R.H. Determination of Exchange Capacity and Exchangeable Bases in Soil—Ammonium Acetate Method. Soil Sci. 1945, 59, 13. [Google Scholar] [CrossRef] [Scilit]
- Rhoades, J.D. Cation Exchange Capacity. In Methods of Soil Analysis; John Wiley & Sons, Ltd.: Hoboken, NJ, USA, 1982; pp. 149–157. ISBN 978-0-89118-977-0. [Google Scholar]
- Blakemore, L.C.; Searle, P.L.; Daly, B.K. Methods for Chemical Analysis of Soils; Department of Scientific and Industrial Research: New Delhi, India, 1987. [Google Scholar]
- Anderson, G.C.; Lefroy, R.D.B.; Blair, G.J. Soil-Extractable Sulfur and Pasture Response to Applied Sulfur. Aust. J. Exp. Agric. 1998, 38, 567–574. [Google Scholar] [CrossRef] [Scilit]
- Bray, R.H.; Kurtz, L.T. Determination of Total, Organic, and Available Forms of Phosphorus in Soils. Soil Sci. 1945, 59, 39. [Google Scholar] [CrossRef] [Scilit]
- Tedersoo, L.; Bahram, M.; Põlme, S.; Kõljalg, U.; Yorou, N.S.; Wijesundera, R.; Ruiz, L.V.; Vasco-Palacios, A.M.; Thu, P.Q.; Suija, A.; et al. Global Diversity and Geography of Soil Fungi. Science 2014, 346, 1256688. [Google Scholar] [CrossRef] [Scilit] [PubMed]
- Hsieh, T.C.; Ma, K.H.; Chao, A. iNEXT: An R Package for Rarefaction and Extrapolation of Species Diversity (Hill Numbers). Methods Ecol. Evol. 2016, 7, 1451–1456. [Google Scholar] [CrossRef] [Scilit]
- Bolar, K.; Bolar, M.K. STAT: Interactive Document for Working with Basic Statistical Analysis. 2019. Available online: https://cran.r-project.org/package=STAT (accessed on 10 October 2025).
- Anderson, M.J. A New Method for Non-Parametric Multivariate Analysis of Variance. Austral Ecol. 2001, 26, 32–46. [Google Scholar] [CrossRef] [Scilit]
- Hill, M.O. Diversity and Evenness: A Unifying Notation and Its Consequences. Ecology 1973, 54, 427–432. [Google Scholar] [CrossRef] [Scilit]
- Chao, A.; Gotelli, N.J.; Hsieh, T.C.; Sander, E.L.; Ma, K.H.; Colwell, R.K.; Ellison, A.M. Rarefaction and Extrapolation with Hill Numbers: A Framework for Sampling and Estimation in Species Diversity Studies. Ecol. Monogr. 2014, 84, 45–67. [Google Scholar] [CrossRef] [Scilit]
- Alberdi, A.; Gilbert, M.T.P. A Guide to the Application of Hill Numbers to DNA-based Diversity Analyses. Mol. Ecol. Resour. 2019, 19, 804–817. [Google Scholar] [CrossRef] [Scilit]
- Fick, S.E.; Hijmans, R.J. WorldClim 2: New 1-Km Spatial Resolution Climate Surfaces for Global Land Areas. Int. J. Climatol. 2017, 37, 4302–4315. [Google Scholar] [CrossRef] [Scilit]
- Brooks, M.; Kristensen, K.; van Benthem, K.; Magnusson, A.; Berg, C.; Nielsen, A.; Skaug, H.; Mächler, M.; Bolker, B. glmmTMB Balances Speed and Flexibility Among Packages for Zero-Inflated Generalized Linear Mixed Modeling. R J. 2017, 9, 378–400. [Google Scholar] [CrossRef] [Scilit]
- Burnham, K.P.; Anderson, D.R. Model Selection and Inference: A Practical Information-Theoretic Approach; Springer Science & Business Media: Berlin/Heidelberg, Germany, 2013; ISBN 978-1-4757-2917-7. [Google Scholar]
- Lenth, R. Emmeans: Estimated Marginal Means, Aka Least-Squares Means; R Package Version 1.8.5; R Foundation for Statistical Computing: Vienna, Austria, 2023; Available online: https://CRAN.R-project.org/package=emmeans (accessed on 10 October 2025).
- Hartig, F.; Lohse, L.; de Souza leite, M. DHARMa: Residual Diagnostics for Hierarchical (Multi-Level/Mixed) Regression Models. 2024. Available online: https://cran.r-project.org/package=DHARMa (accessed on 10 October 2025).
- Oksanen, J. Vegan: Community Ecology Package; R package Version 2.3; Foundation for Statistical Computing: Vienna, Austria, 2015; Available online: https://CRAN.R-project.org/package=vegan (accessed on 10 October 2025).
- Chung, N.C.; Miasojedow, B.; Startek, M.; Gambin, A. Jaccard/Tanimoto Similarity Test and Estimation Methods for Biological Presence-Absence Data. BMC Bioinform. 2019, 20, 644. [Google Scholar] [CrossRef] [Scilit]
- De Cáceres, M.; Legendre, P.; Moretti, M. Improving Indicator Species Analysis by Combining Groups of Sites. Oikos 2010, 119, 1674–1684. [Google Scholar] [CrossRef] [Scilit]
- Tichy, L.; Chytry, M. Statistical Determination of Diagnostic Species for Site Groups of Unequal Size. J. Veg. Sci. 2006, 17, 809–818. [Google Scholar] [CrossRef] [Scilit]
- Krah, F.-S.; March-Salas, M. eDNA Metabarcoding Reveals High Soil Fungal Diversity and Variation in Community Composition among Spanish Cliffs. Ecol. Evol. 2022, 12, e9594. [Google Scholar] [CrossRef] [Scilit] [PubMed]
- Küffer, N.; Gillet, F.; Senn-Irlet, B.; Job, D.; Aragno, M. Ecological Determinants of Fungal Diversity on Dead Wood in European Forests. Fungal Divers. 2008, 30, 83–95. [Google Scholar]
- De Cáceres, M.D.; Jansen, F.; Endicott, S.; Dell, N. Indicspecies: Relationship Between Species and Groups of Sites; R Package Version 1.8.0; R Foundation for Statistical Computing: Vienna, Austria, 2025; Available online: https://CRAN.R-project.org/package=indicspecies (accessed on 10 October 2025).
- Diaz, D.G.; Ignazi, G.; Mathiasen, P.; Premoli, A.C. Climate-Driven Adaptive Responses to Drought of Dominant Tree Species from Patagonia. New For. 2022, 53, 57–80. [Google Scholar] [CrossRef] [Scilit]
- Rodríguez-Catón, M.; Villalba, R.; Morales, M.; Srur, A. Influence of Droughts on Nothofagus Pumilio Forest Decline across Northern Patagonia, Argentina. Ecosphere 2016, 7, e01390. [Google Scholar] [CrossRef] [Scilit]
- Swaty, R.L.; Gehring, C.A.; Van Ert, M.; Theimer, T.C.; Keim, P.; Whitham, T.G. Temporal Variation in Temperature and Rainfall Differentially Affects Ectomycorrhizal Colonization at Two Contrasting Sites. New Phytol. 1998, 139, 733–739. [Google Scholar] [CrossRef] [Scilit]
- Gehring, C.; Sevanto, S.; Patterson, A.; Ulrich, D.E.M.; Kuske, C.R. Ectomycorrhizal and Dark Septate Fungal Associations of Pinyon Pine Are Differentially Affected by Experimental Drought and Warming. Front. Plant Sci. 2020, 11, 582574. [Google Scholar] [CrossRef] [Scilit]
- Nouhra, E.R.; Urcelay, C.; Longo, M.S.; Fontenla, S. Differential Hypogeous Sporocarp Production from Nothofagus Dombeyi and N. Pumilio Forests in Southern Argentina. Mycologia 2012, 104, 45–52. [Google Scholar] [CrossRef] [Scilit]
- Taniguchi, T.; Kitajima, K.; Douhan, G.W.; Yamanaka, N.; Allen, M.F. A Pulse of Summer Precipitation after the Dry Season Triggers Changes in Ectomycorrhizal Formation, Diversity, and Community Composition in a Mediterranean Forest in California, USA. Mycorrhiza 2018, 28, 665–677. [Google Scholar] [CrossRef] [Scilit] [PubMed]
- Richard, F.; Roy, M.; Shahin, O.; Sthultz, C.; Duchemin, M.; Joffre, R.; Selosse, M.-A. Ectomycorrhizal Communities in a Mediterranean Forest Ecosystem Dominated by Quercus Ilex: Seasonal Dynamics and Response to Drought in the Surface Organic Horizon. Ann. For. Sci. 2011, 68, 57–68. [Google Scholar] [CrossRef] [Scilit]
- Hendershot, J.N.; Read, Q.D.; Henning, J.A.; Sanders, N.J.; Classen, A.T. Consistently Inconsistent Drivers of Microbial Diversity and Abundance at Macroecological Scales. Ecology 2017, 98, 1757–1763. [Google Scholar] [CrossRef] [Scilit] [PubMed]
- Floriani, F.D.; Mujtar, V.A.E.; Sbrancia, R.; Peñalba, M.G.; Marchelli, P.; Fernández, N.V. Variability of Ectomycorrhizal Fungal Community Traits in Mixed Nothofagus Forests: Insights into Host Plant and Environmental Context. Plant Soil 2026, in press. [Google Scholar] [CrossRef] [Scilit]
- Donoso, S.R.; Peña-Rojas, K.; Delgado-Flores, C.; Riquelme, A.; Paratori, M. Above-Ground Biomass Accumulation and Growth in a Marginal Nothofagus macrocarpa Forest in Central Chile. Interciencia 2010, 35, 65–69. [Google Scholar]
- Veblen, T.T.; Hill, R.S.; Read, J. The Ecology and Biogeography of Nothofagus Forests; Yale University Press: New Haven, CT, USA, 1996; ISBN 978-0-300-06423-0. [Google Scholar]
- Qin, C.; Pellitier, P.T.; Van Nuland, M.E.; Peay, K.G.; Zhu, K. Niche Modelling Predicts That Soil Fungi Occupy a Precarious Climate in Boreal Forests. Global Ecol. Biogeogr. 2023, 32, 1127–1139. [Google Scholar] [CrossRef] [Scilit]
- Barry, R.G.; Chorley, R.J. Atmosphere, Weather and Climate; Routledge: London, UK, 2009; ISBN 978-0-203-87102-7. [Google Scholar]
- Truong, C.; Gabbarini, L.A.; Corrales, A.; Mujic, A.B.; Escobar, J.A.; Moretto, A.; Smith, M.E. Ectomycorrhizal Fungi and Soil Enzymes Exhibit Contrasting Patterns along Elevation Gradients in Southern Patagonia. New Phytol. 2019, 222, 1936–1950. [Google Scholar] [CrossRef] [Scilit]
- Miyamoto, Y.; Terashima, Y.; Nara, K. Temperature Niche Position and Breadth of Ectomycorrhizal Fungi: Reduced Diversity under Warming Predicted by a Nested Community Structure. Glob. Change Biol. 2018, 24, 5724–5737. [Google Scholar] [CrossRef] [Scilit]
- Fernandez, C.W.; Mielke, L.; Stefanski, A.; Bermudez, R.; Hobbie, S.E.; Montgomery, R.A.; Reich, P.B.; Kennedy, P.G. Climate Change–Induced Stress Disrupts Ectomycorrhizal Interaction Networks at the Boreal–Temperate Ecotone. Proc. Natl. Acad. Sci. USA 2023, 120, e2221619120. [Google Scholar] [CrossRef] [Scilit]
- Shi, L.; Guttenberger, M.; Kottke, I.; Hampp, R. The Effect of Drought on Mycorrhizas of Beech (Fagus sylvatica L.): Changes in Community Structure, and the Content of Carbohydrates and Nitrogen Storage Bodies of the Fungi. Mycorrhiza 2002, 12, 303–311. [Google Scholar] [CrossRef] [Scilit]
- Royer, P.D.; Breshears, D.D.; Zou, C.B.; Cobb, N.S.; Kurc, S.A. Ecohydrological Energy Inputs in Semiarid Coniferous Gradients: Responses to Management- and Drought-Induced Tree Reductions. For. Ecol. Manag. 2010, 260, 1646–1655. [Google Scholar] [CrossRef] [Scilit]
- Buscardo, E.; Souza, R.C.; Meir, P.; Geml, J.; Schmidt, S.K.; Da Costa, A.C.L.; Nagy, L. Effects of Natural and Experimental Drought on Soil Fungi and Biogeochemistry in an Amazon Rain Forest. Commun. Earth Environ. 2021, 2, 55. [Google Scholar] [CrossRef] [Scilit]
- Oliver, T.H.; Heard, M.S.; Isaac, N.J.B.; Roy, D.B.; Procter, D.; Eigenbrod, F.; Freckleton, R.; Hector, A.; Orme, C.D.L.; Petchey, O.L.; et al. Biodiversity and Resilience of Ecosystem Functions. Trends Ecol. Evol. 2015, 30, 673–684. [Google Scholar] [CrossRef] [Scilit] [PubMed]
- Van Looy, K.; Lejeune, M.; Verbeke, W. Indicators and Mechanisms of Stability and Resilience to Climatic and Landscape Changes in a Remnant Calcareous Grassland. Ecol. Indic. 2016, 70, 498–506. [Google Scholar] [CrossRef] [Scilit]
- Swaty, R.L.; Deckert, R.J.; Whitham, T.G.; Gehring, C.A. Ectomycorrhizal Abundance and Community Composition Shifts with Drought: Predictions from Tree Rings. Ecology 2004, 85, 1072–1084. [Google Scholar] [CrossRef] [Scilit]
- Adamo, I.; Castaño, C.; Bonet, J.A.; Colinas, C.; Martínez De Aragón, J.; Alday, J.G. Soil Physico-Chemical Properties Have a Greater Effect on Soil Fungi than Host Species in Mediterranean Pure and Mixed Pine Forests. Soil Biol. Biochem. 2021, 160, 108320. [Google Scholar] [CrossRef] [Scilit]
- Lauber, C.L.; Strickland, M.S.; Bradford, M.A.; Fierer, N. The Influence of Soil Properties on the Structure of Bacterial and Fungal Communities across Land-Use Types. Soil Biol. Biochem. 2008, 40, 2407–2415. [Google Scholar] [CrossRef] [Scilit]
- Štursová, M.; Šnajdr, J.; Cajthaml, T.; Bárta, J.; Šantrůčková, H.; Baldrian, P. When the Forest Dies: The Response of Forest Soil Fungi to a Bark Beetle-Induced Tree Dieback. ISME J. 2014, 8, 1920–1931. [Google Scholar] [CrossRef] [Scilit]
- Read, D.J.; Perez-Moreno, J. Mycorrhizas and Nutrient Cycling in Ecosystems—a Journey towards Relevance? New Phytol. 2003, 157, 475–492. [Google Scholar] [CrossRef] [Scilit]
- Jiao, S.; Peng, Z.; Qi, J.; Gao, J.; Wei, G. Linking Bacterial-Fungal Relationships to Microbial Diversity and Soil Nutrient Cycling. mSystems 2021, 6, 10–1128. [Google Scholar] [CrossRef] [Scilit]
- Weber, C.F.; Vilgalys, R.; Kuske, C.R. Changes in Fungal Community Composition in Response to Elevated Atmospheric CO2 and Nitrogen Fertilization Varies with Soil Horizon. Front. Microbiol. 2013, 4, 78. [Google Scholar] [CrossRef] [Scilit] [PubMed]
- Zheng, J.; Cui, M.; Wang, C.; Wang, J.; Wang, S.; Sun, Z.; Ren, F.; Wan, S.; Han, S. Elevated CO2, Warming, N Addition, and Increased Precipitation Affect Different Aspects of the Arbuscular Mycorrhizal Fungal Community. Sci. Total Environ. 2022, 806, 150522. [Google Scholar] [CrossRef] [Scilit] [PubMed]
- Caiafa, M.V.; Sandoval-Leiva, P.; Matheny, P.B.; Calle, A.; Smith, M.E. Four New Species of Sequestrate Inocybe from Chilean Nothofagaceae Forests. Mycologia 2021, 113, 629–642. [Google Scholar] [CrossRef] [Scilit] [PubMed]
- Castaño, C.; Suarez-Vidal, E.; Zas, R.; Bonet, J.A.; Oliva, J.; Sampedro, L. Ectomycorrhizal Fungi with Hydrophobic Mycelia and Rhizomorphs Dominate in Young Pine Trees Surviving Experimental Drought Stress. Soil Biol. Biochem. 2023, 178, 108932. [Google Scholar] [CrossRef] [Scilit]
- Thiers, H.D. The Secotioid Syndrome: Mycologia: Vol 76, No 1-Get Access. Mycologia 1984, 76, 1–8. [Google Scholar] [CrossRef] [Scilit]
- Wang, H.; Kohler, A.; Martin, F.M. Biology, Genetics, and Ecology of the Cosmopolitan Ectomycorrhizal Ascomycete Cenococcum Geophilum. Front. Microbiol. 2025, 16, 1502977. [Google Scholar] [CrossRef] [Scilit]
- Kumar, L.M.; Smith, M.E.; Nouhra, E.R.; Orihara, T.; Sandoval Leiva, P.; Pfister, D.H.; McLaughlin, D.J.; Trappe, J.M.; Healy, R.A. A Molecular and Morphological Re-Examination of the Generic Limits of Truffles in the Tarzetta-Geopyxis Lineage—Densocarpa, Hydnocystis, and Paurocotylis. Fungal Biol. 2017, 121, 264–284. [Google Scholar] [CrossRef] [Scilit]
- Van Vooren, N.; Carbone, M.; Sammut, C.; Grupe, A.C. Preliminary Notes on the Genus Tarzetta (Pezizales) with Typifications of Some Species and Description of Six New Species. Available online: https://ascomycete.org/Journal/Article/art-0288 (accessed on 12 February 2026).
- Trierveiler-Pereira, L.; Smith, M.E.; Trappe, J.M.; Nouhra, E.R. Sequestrate Fungi from Patagonian Nothofagus Forests: Cystangium (Russulaceae, Basidiomycota). Mycologia 2015, 107, 90–103. [Google Scholar] [CrossRef] [Scilit]
- Boczoń, A.; Hilszczańska, D.; Wrzosek, M.; Szczepkowski, A.; Sierota, Z. Drought in the Forest Breaks Plant–Fungi Interactions. Eur. J. Forest Res. 2021, 140, 1301–1321. [Google Scholar] [CrossRef] [Scilit]
- Pastor, N.; Chiapella, J.; Kuhar, F.; Mujic, A.B.; Crespo, E.M.; Nouhra, E.R. Unveiling New Sequestrate Cortinarius Species from Northern Patagonian Nothofagaceae Forests Based on Molecular and Morphological Data. Mycologia 2019, 111, 103–117. [Google Scholar] [CrossRef] [Scilit]
- Liimatainen, K.; Kim, J.T.; Pokorny, L.; Kirk, P.M.; Dentinger, B.; Niskanen, T. Taming the Beast: A Revised Classification of Cortinariaceae Based on Genomic Data. Fungal Divers. 2022, 112, 89–170. [Google Scholar] [CrossRef] [Scilit]
- San-Fabian, B.; Niskanen, T.; Liimatainen, K.; Kooij, P.W.; Mujic, A.B.; Truong, C.; Peintner, U.; Dresch, P.; Nouhra, E.; Matheny, P.B.; et al. New Species of Cortinarius Sect. Austroamericani, Sect. Nov., from South American Nothofagaceae Forests. Mycologia 2018, 110, 1127–1144. [Google Scholar] [CrossRef] [Scilit]
- Pigott, C.D. Survival of Mycorrhiza Formed by Cenococcum geophilum fr. in Dry Soils. New Phytol. 1982, 92, 513–517. [Google Scholar] [CrossRef] [Scilit]
- Nieves, D.J.; Reich, P.B.; Stefanski, A.; Bermudez, R.; Beidler, K.V.; Kennedy, P.G. Ectomycorrhizal Fungal Community Response to Warming and Rainfall Reduction Differs between Co-Occurring Temperate-Boreal Ecotonal Pinus Saplings. Mycorrhiza 2024, 34, 403–416. [Google Scholar] [CrossRef] [Scilit] [PubMed]
- Trappe, J.M. Selection of Fungi for Ectomycorrhizal Inoculation in Nurseries. Annu. Rev. Phytopathol. 1977, 15, 203–222. [Google Scholar] [CrossRef] [Scilit]
- Duñabeitia, M.K.; Hormilla, S.; Garcia-Plazaola, J.I.; Txarterina, K.; Arteche, U.; Becerril, J.M. Differential Responses of Three Fungal Species to Environmental Factors and Their Role in the Mycorrhization of Pinus Radiata D. Don. Mycorrhiza 2004, 14, 11–18. [Google Scholar] [CrossRef] [Scilit] [PubMed]
- Brundrett, M.; Malajczuk, N.; Mingqin, G.; Daping, X.; Snelling, S.; Dell, B. Nursery Inoculation of Eucalyptus Seedlings in Western Australia and Southern China Using Spores and Mycelial Inoculum of Diverse Ectomycorrhizal Fungi from Different Climatic Regions. For. Ecol. Manag. 2005, 209, 193–205. [Google Scholar] [CrossRef] [Scilit]
- Rincón, A.; de Felipe, M.R.; Fernández-Pascual, M. Inoculation of Pinus Halepensis Mill. with Selected Ectomycorrhizal Fungi Improves Seedling Establishment 2 Years after Planting in a Degraded Gypsum Soil. Mycorrhiza 2007, 18, 23–32. [Google Scholar] [CrossRef] [Scilit]
- Bassani, V.N.; Barroetaveña, C.; Rajchenberg, M. Spores of Ectomycorrhizal Fungi as Inoculants for Nothofagus Pumilio and Exotic Conifer Seedlings in Patagonia, Argentina: Their Activity and Conservation. New Forests 2013, 44, 471–485. [Google Scholar] [CrossRef] [Scilit]
- Molina, L.; Rajchenberg, M.; De Errasti, A.; Aime, M.C.; Pildain, M.B. Sapwood-Inhabiting Mycobiota and Nothofagus Tree Mortality in Patagonia: Diversity Patterns According to Tree Species, Plant Compartment and Health Condition. For. Ecol. Manag. 2020, 462, 117997. [Google Scholar] [CrossRef] [Scilit]
- Halwachs, B.; Madhusudhan, N.; Krause, R.; Nilsson, R.H.; Moissl-Eichinger, C.; Högenauer, C.; Thallinger, G.G.; Gorkiewicz, G. Critical Issues in Mycobiota Analysis. Front. Microbiol. 2017, 8, 180. [Google Scholar] [CrossRef] [Scilit] [PubMed]
- Fernández, N.; Fontenla, S.; Fioroni, F.; Soto-Mancilla, M.; Carron, A.; Moguilevsky, D.; Marchelli, P.; Marín, C.; Mestre, M.C. Mycorrhizas in Nothofagus from South America: What Do We Know from Nursery and Field Experiences? In Mycorrhizal Fungi in South America: Biodiversity, Conservation, and Sustainable Food Production; Lugo, M.A., Pagano, M.C., Eds.; Springer International Publishing: Cham, Switzerland, 2022; pp. 281–304. ISBN 978-3-031-12994-0. [Google Scholar]
- Garnica, S.; Schön, M.E.; Abarenkov, K.; Riess, K.; Liimatainen, K.; Niskanen, T.; Dima, B.; Soop, K.; Frøslev, T.G.; Jeppesen, T.S.; et al. Determining Threshold Values for Barcoding Fungi: Lessons from Cortinarius (Basidiomycota), a Highly Diverse and Widespread Ectomycorrhizal Genus. FEMS Microbiol. Ecol. 2016, 92, fiw045. [Google Scholar] [CrossRef] [Scilit] [PubMed]
- Buyck, B.; Hofstetter, V.; Eberhardt, U.; Verbeken, A.; Kauff, F. Walking the Thin Line between Russula and Lactarius: The Dilemma of Russula Subsect. Ochricompactae. Fungal Divers. 2008, 28, 15–40. [Google Scholar]
- Raimbault, A.; Brin, A.; Manzi, S.; Savoie, J.M.; Gandois, L.; Oliva, P.; Fogliani, O.; Roy-Camille, C.; Gratacap, L.; Roy, M. Influence of Habitat Fragmentation and Habitat Amount on Soil Fungi Communities in Ancient Forests. Landsc. Ecol. 2024, 39, 19. [Google Scholar] [CrossRef] [Scilit]
- Fasolo, A.; Deb, S.; Stevanato, P.; Concheri, G.; Squartini, A. ASV vs. OTUs Clustering: Effects on Alpha, Beta, and Gamma Diversities in Microbiome Metabarcoding Studies. PLoS ONE 2024, 19, e0309065. [Google Scholar] [CrossRef] [Scilit] [PubMed]
- Jeske, J.T.; Gallert, C. Microbiome Analysis via OTU and ASV-Based Pipelines—A Comparative Interpretation of Ecological Data in WWTP Systems. Bioengineering 2022, 9, 146. [Google Scholar] [CrossRef] [Scilit]
- Tedersoo, L.; Bahram, M.; Zinger, L.; Nilsson, H.; Kennedy, P.; Yang, T.; Anslan, S.; Mikryukov, V. Best Practices in Metabarcoding of Fungi: From Experimental Design to Results. Mol. Ecol. 2021, 31, 2769–2795. [Google Scholar] [CrossRef] [Scilit]
- Carron, A.I.; Garibaldi, L.A.; Marquez, S.; Fontenla, S. The Soil Fungal Community of Native Woodland in Andean Patagonian Forest: A Case Study Considering Experimental Forest Management and Seasonal Effects. For. Ecol. Manag. 2020, 461, 117955. [Google Scholar] [CrossRef] [Scilit]
- Mächler, E.; Walser, J.-C.; Altermatt, F. Decision Making and Best Practices for Taxonomy-Free eDNA Metabarcoding in Biomonitoring Using Hill Numbers. Mol. Ecol. 2020, 30, 3326–3339. [Google Scholar] [CrossRef] [Scilit]
- Willing, C.E.; Pellitier, P.T.; Van Nuland, M.E.; Alvarez-Manjarrez, J.; Berrios, L.; Chin, K.N.; Villa, L.M.; Yeam, J.J.; Bourque, S.D.; Tripp, W.; et al. A Risk Assessment Framework for the Future of Forest Microbiomes in a Changing Climate. Nat. Clim. Chang. 2024, 14, 448–461. [Google Scholar] [CrossRef] [Scilit]
- Cazabonne, J.; Bartrop, L.; Dierickx, G.; Gafforov, Y.; Hofmann, T.A.; Martin, T.; Piepenbring, M.; Rivas-Ferreiro, M.; Haelewaters, D. Molecular-Based Diversity Studies and Field Surveys Are Not Mutually Exclusive: On the Importance of Integrated Methodologies in Mycological Research. Front. Fungal Biol. 2022, 3, 860777. [Google Scholar] [CrossRef] [Scilit]
- Nickel, U.T.; Weikl, F.; Kerner, R.; Schäfer, C.; Kallenbach, C.; Munch, J.C.; Pritsch, K. Quantitative Losses vs. Qualitative Stability of Ectomycorrhizal Community Responses to 3 Years of Experimental Summer Drought in a Beech–Spruce Forest. Glob. Change Biol. 2018, 24, e560–e576. [Google Scholar] [CrossRef] [Scilit]
- Lehto, T.; Zwiazek, J.J. Ectomycorrhizas and Water Relations of Trees: A Review. Mycorrhiza 2011, 21, 71–90. [Google Scholar] [CrossRef] [Scilit]
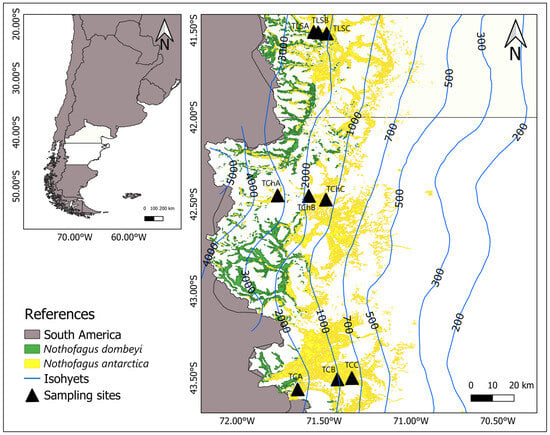
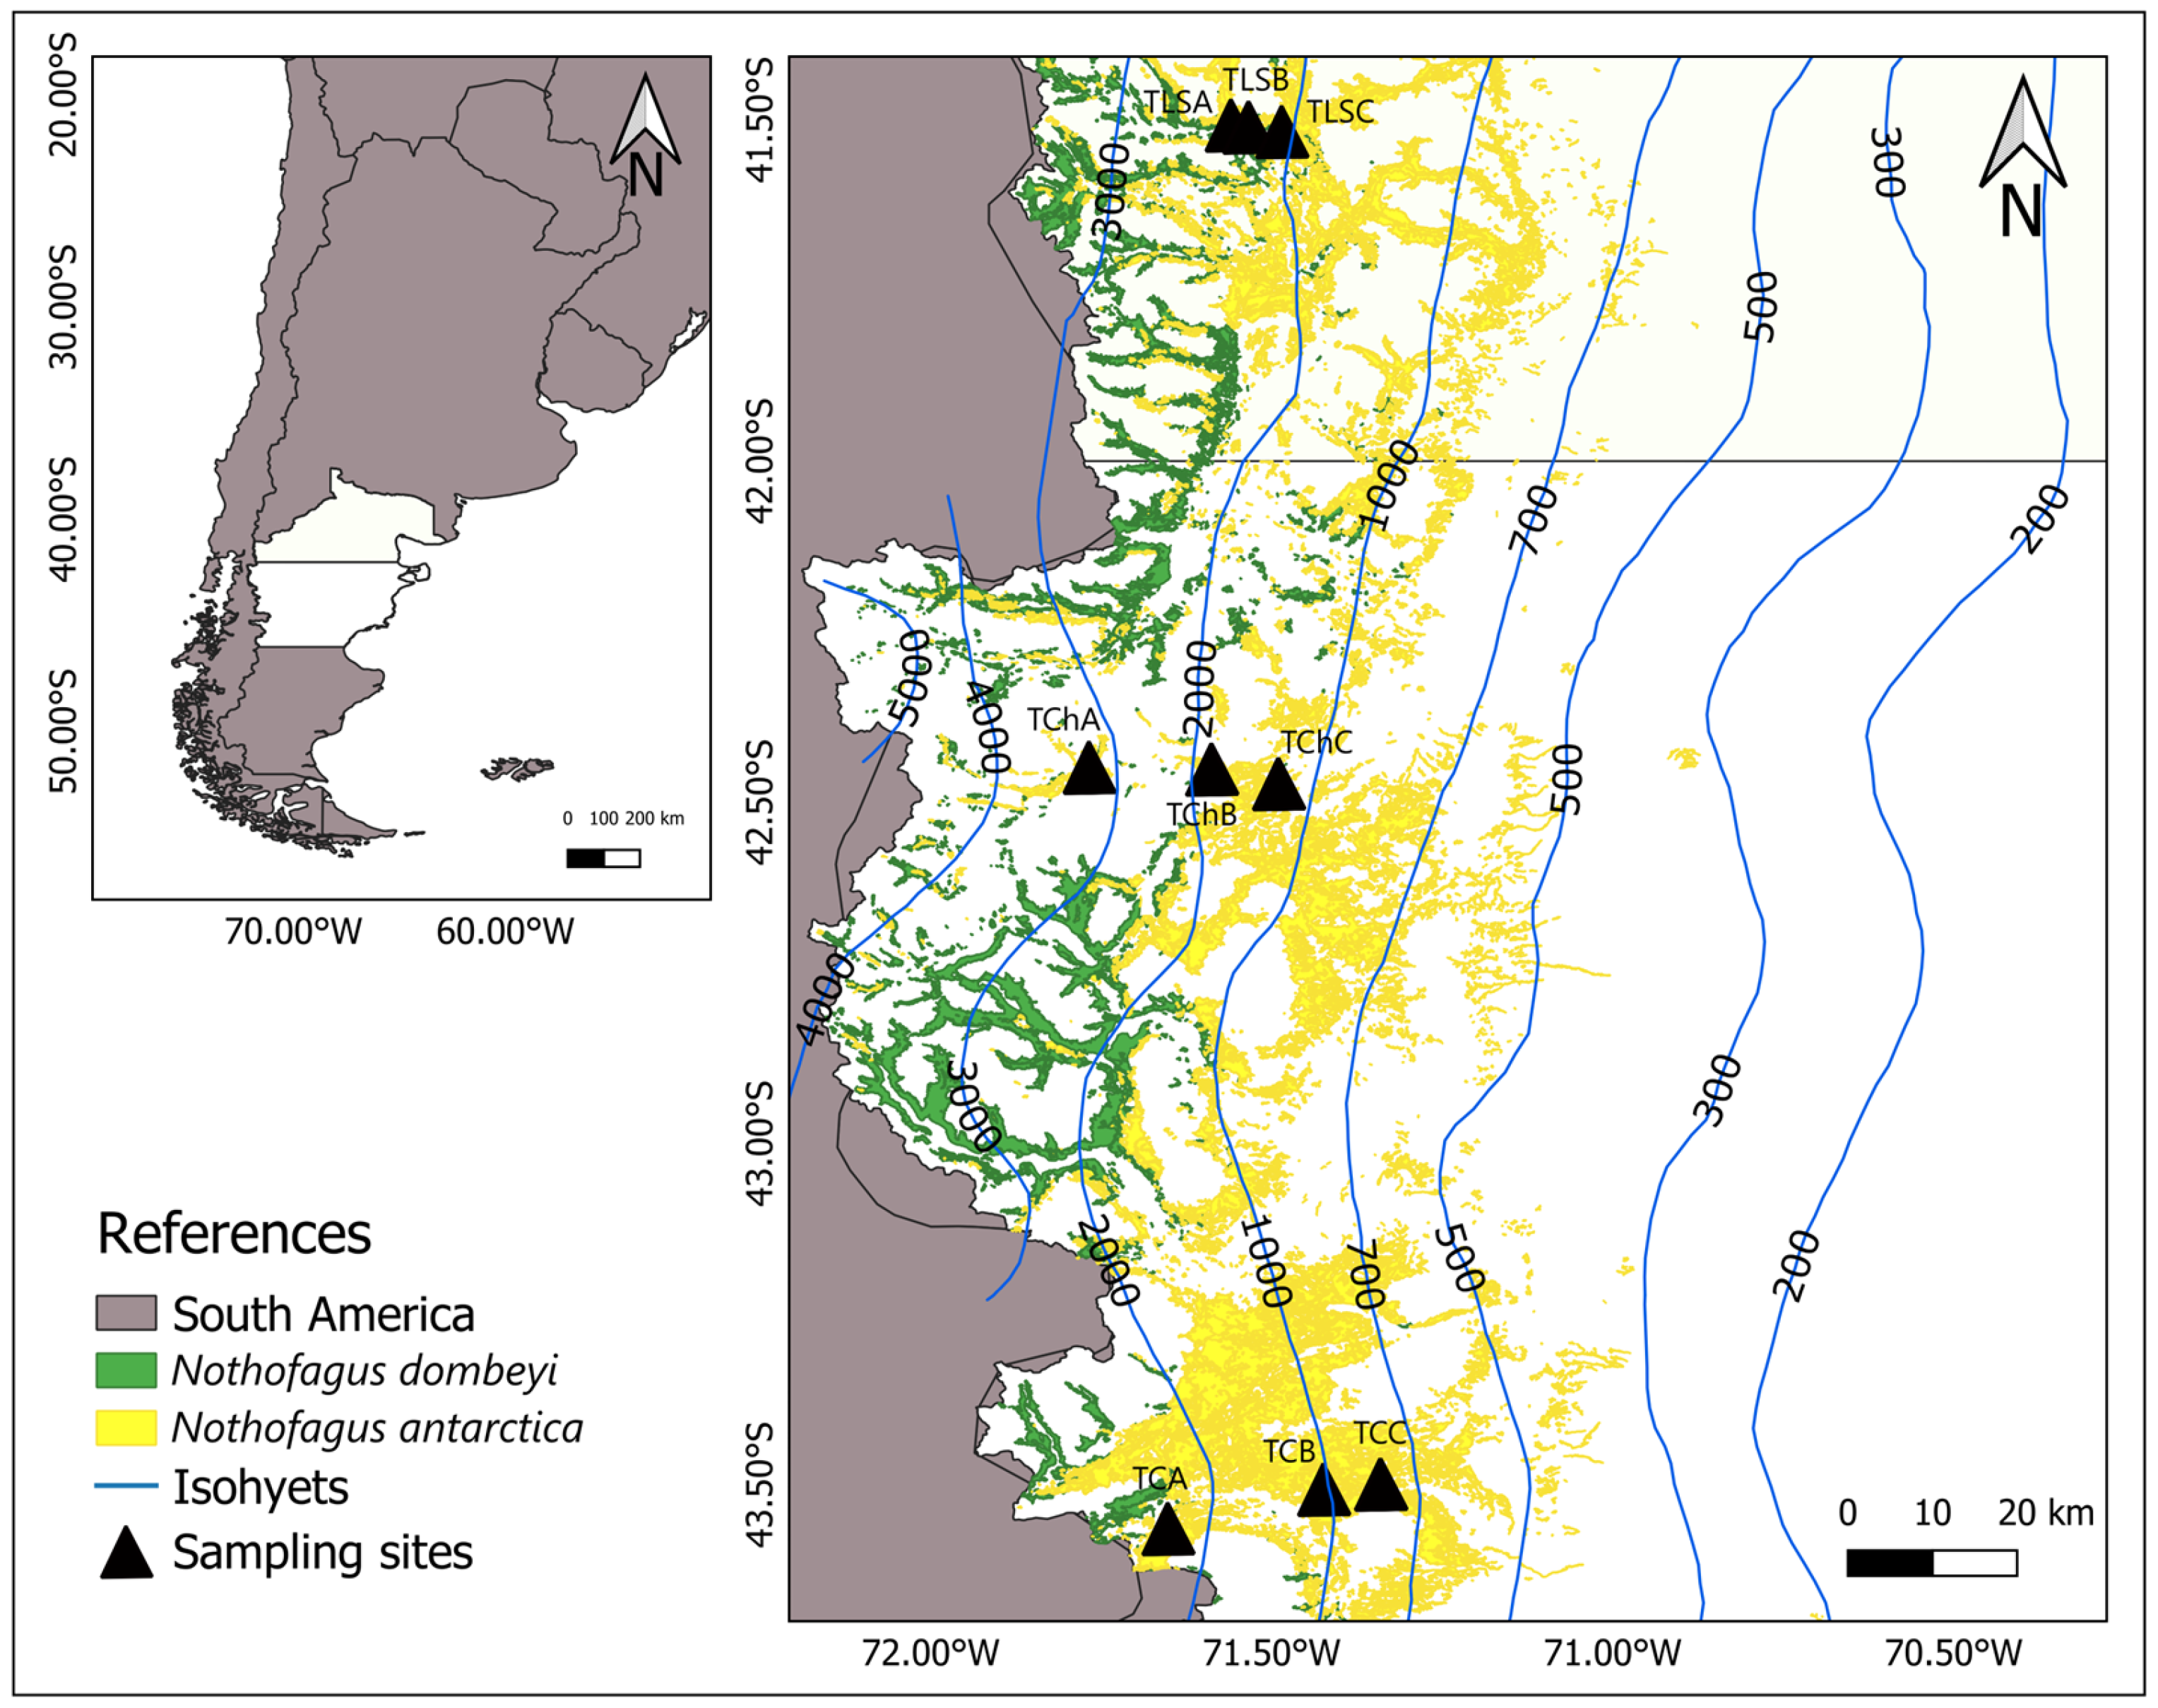
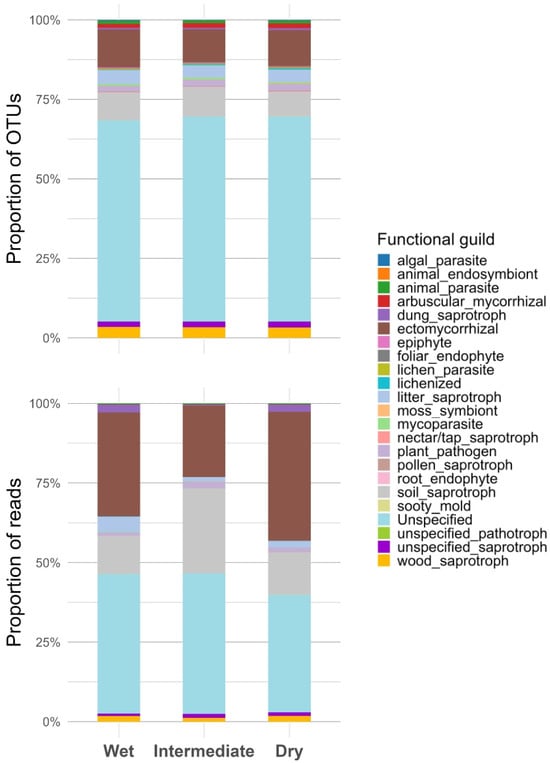
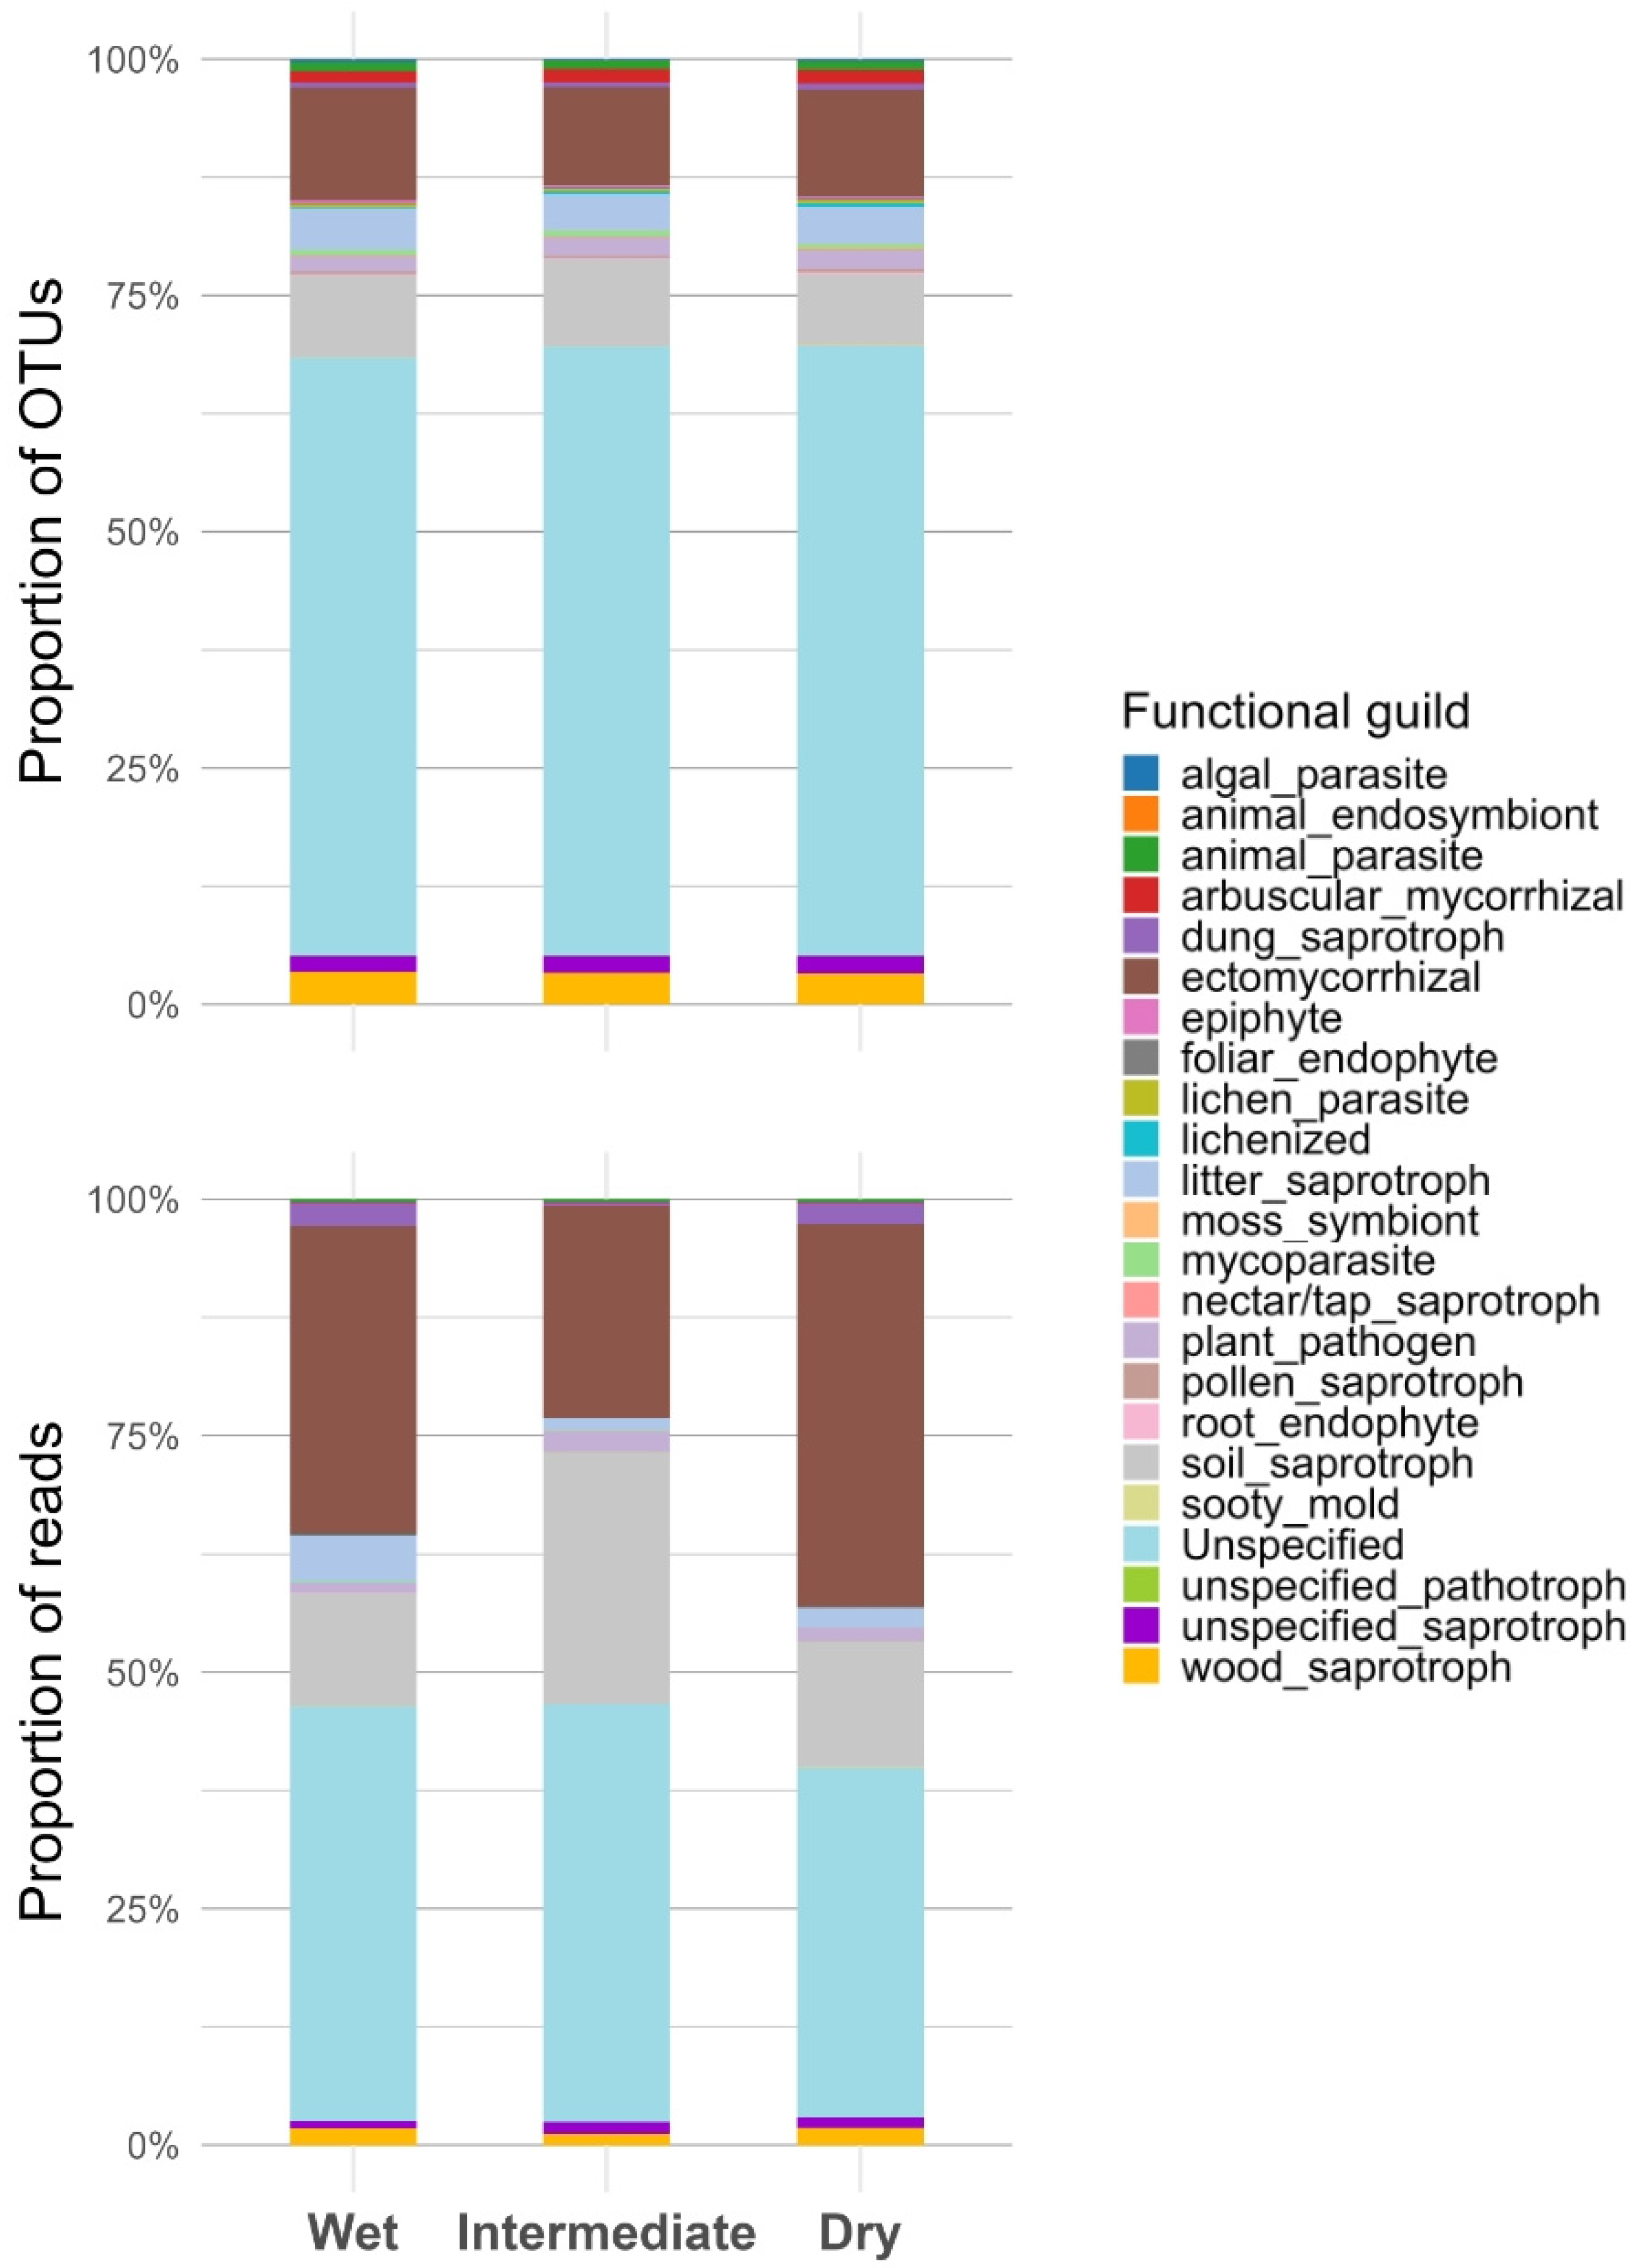
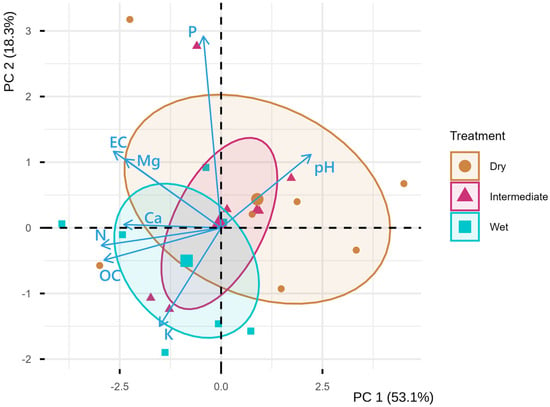
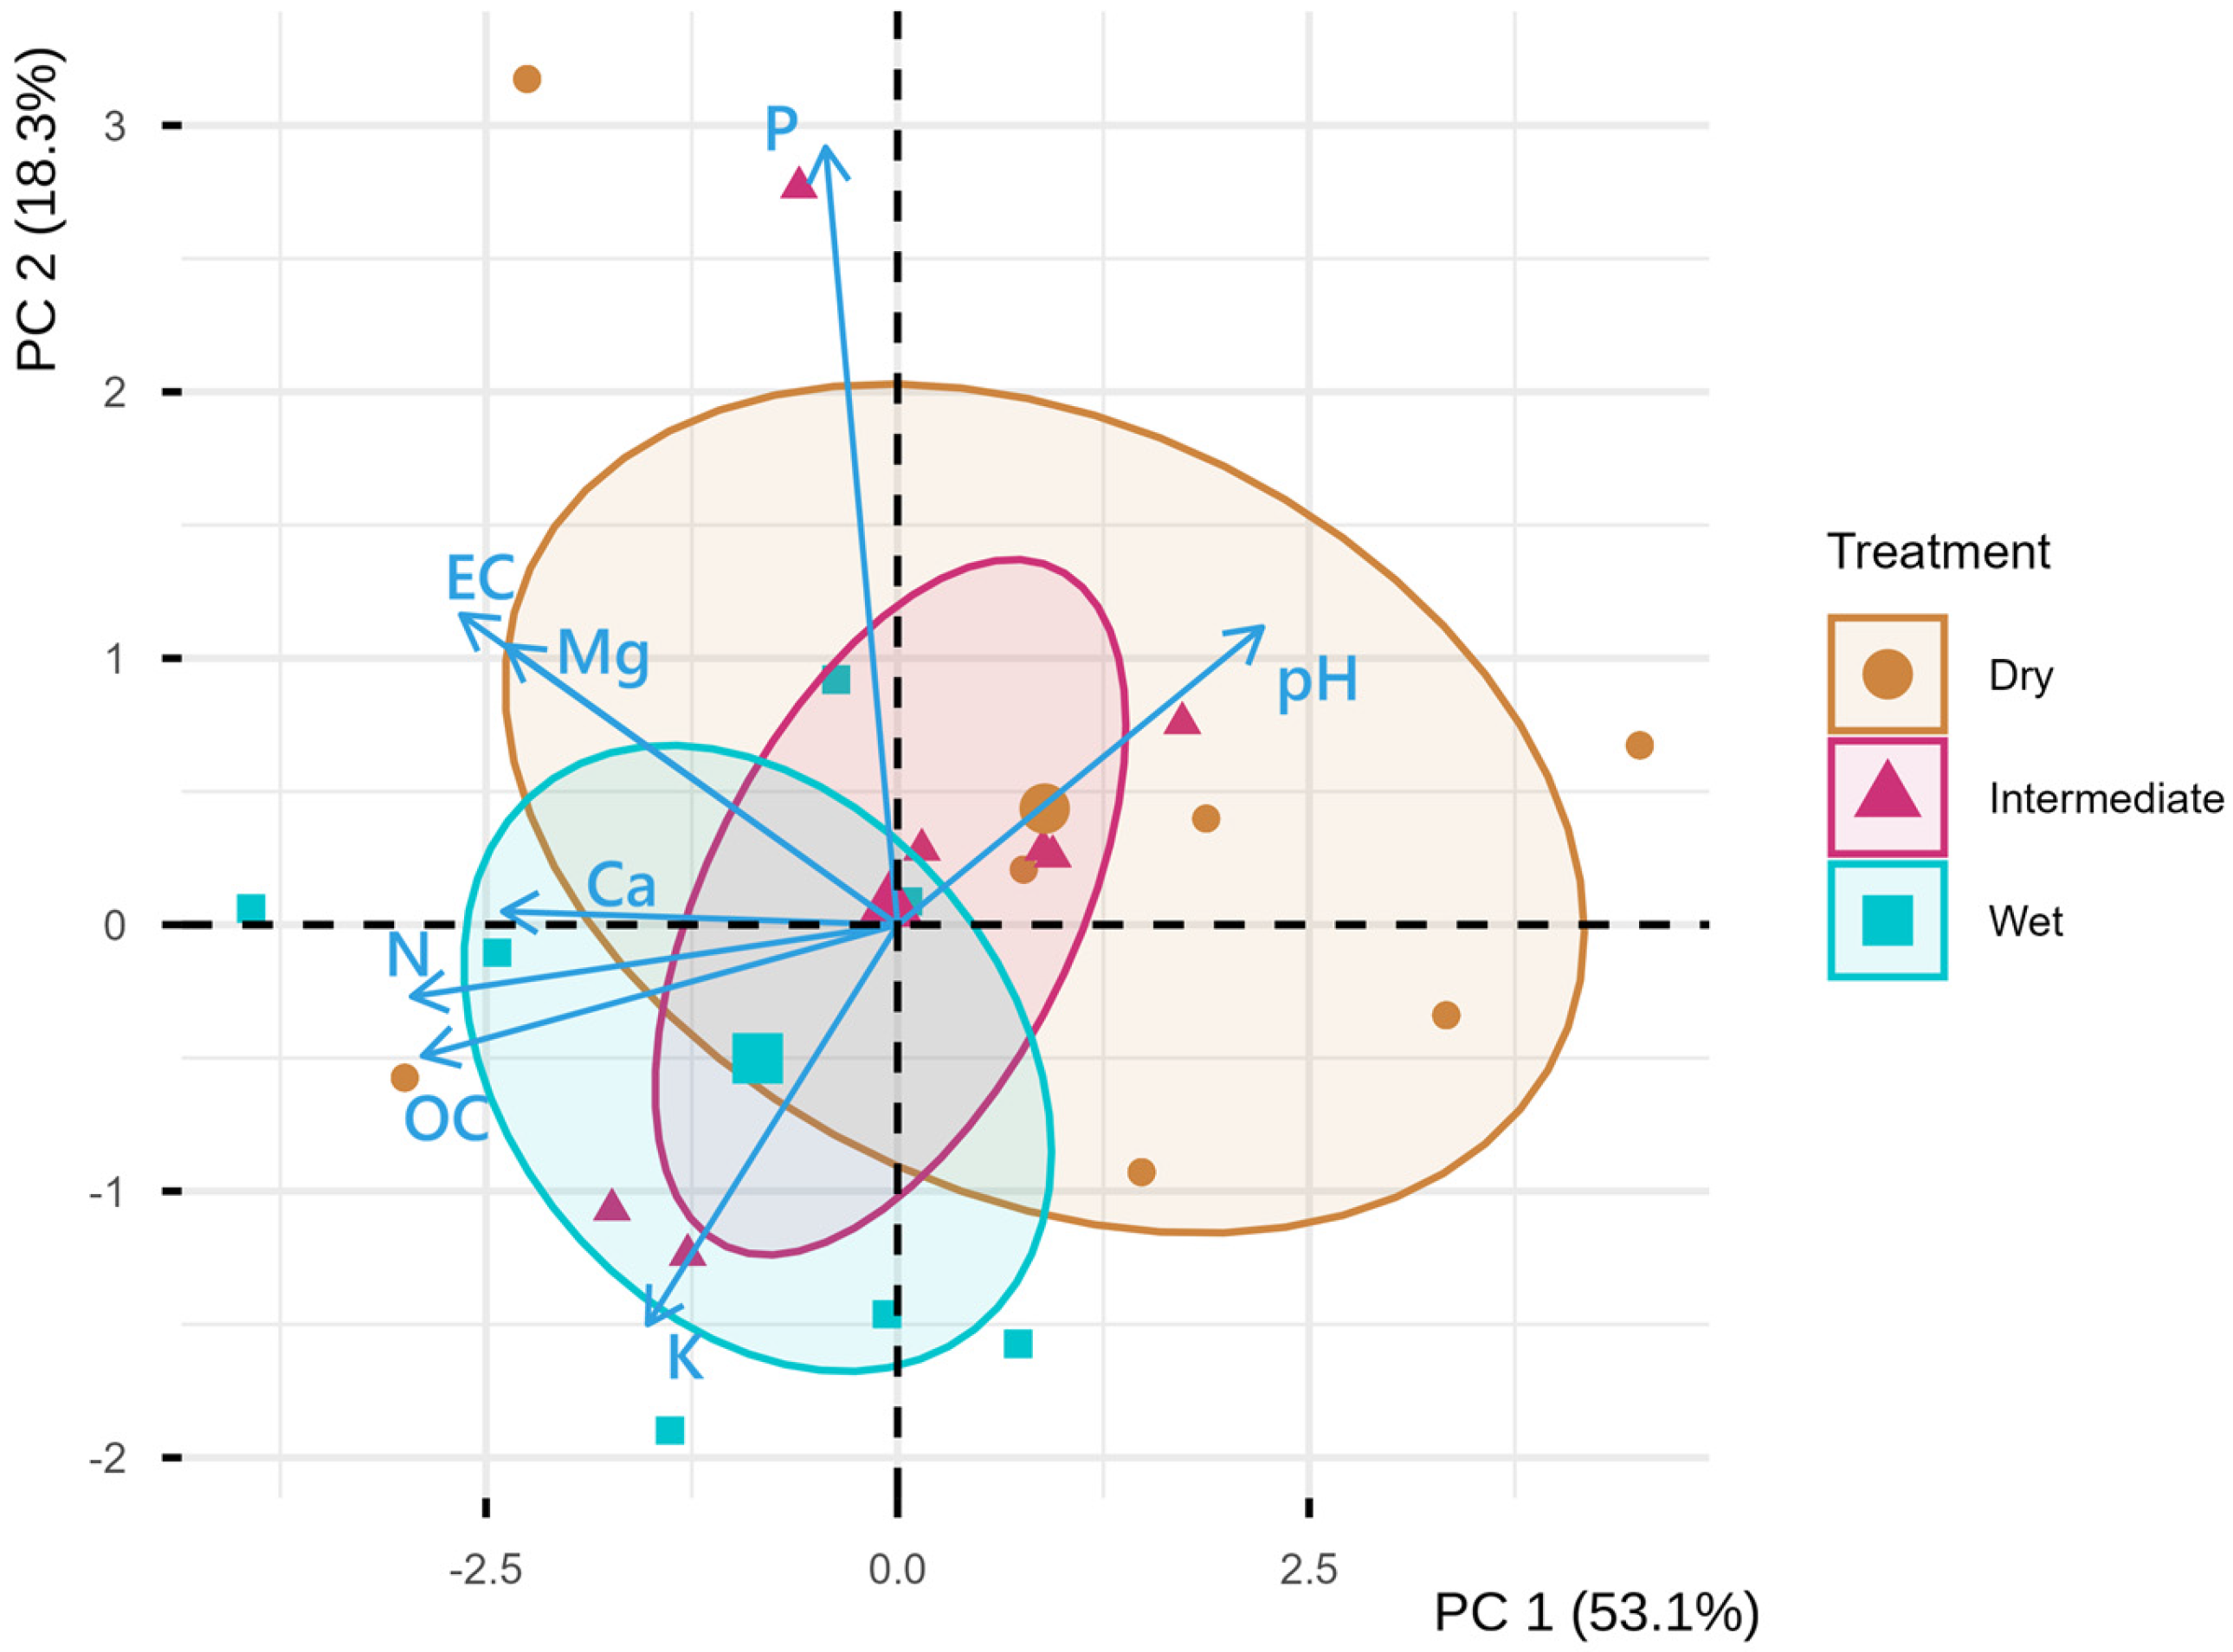
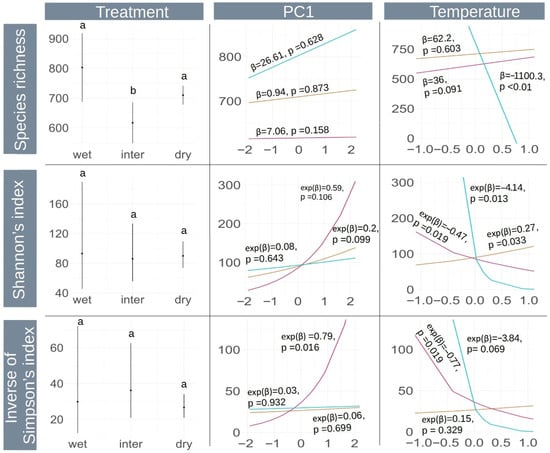
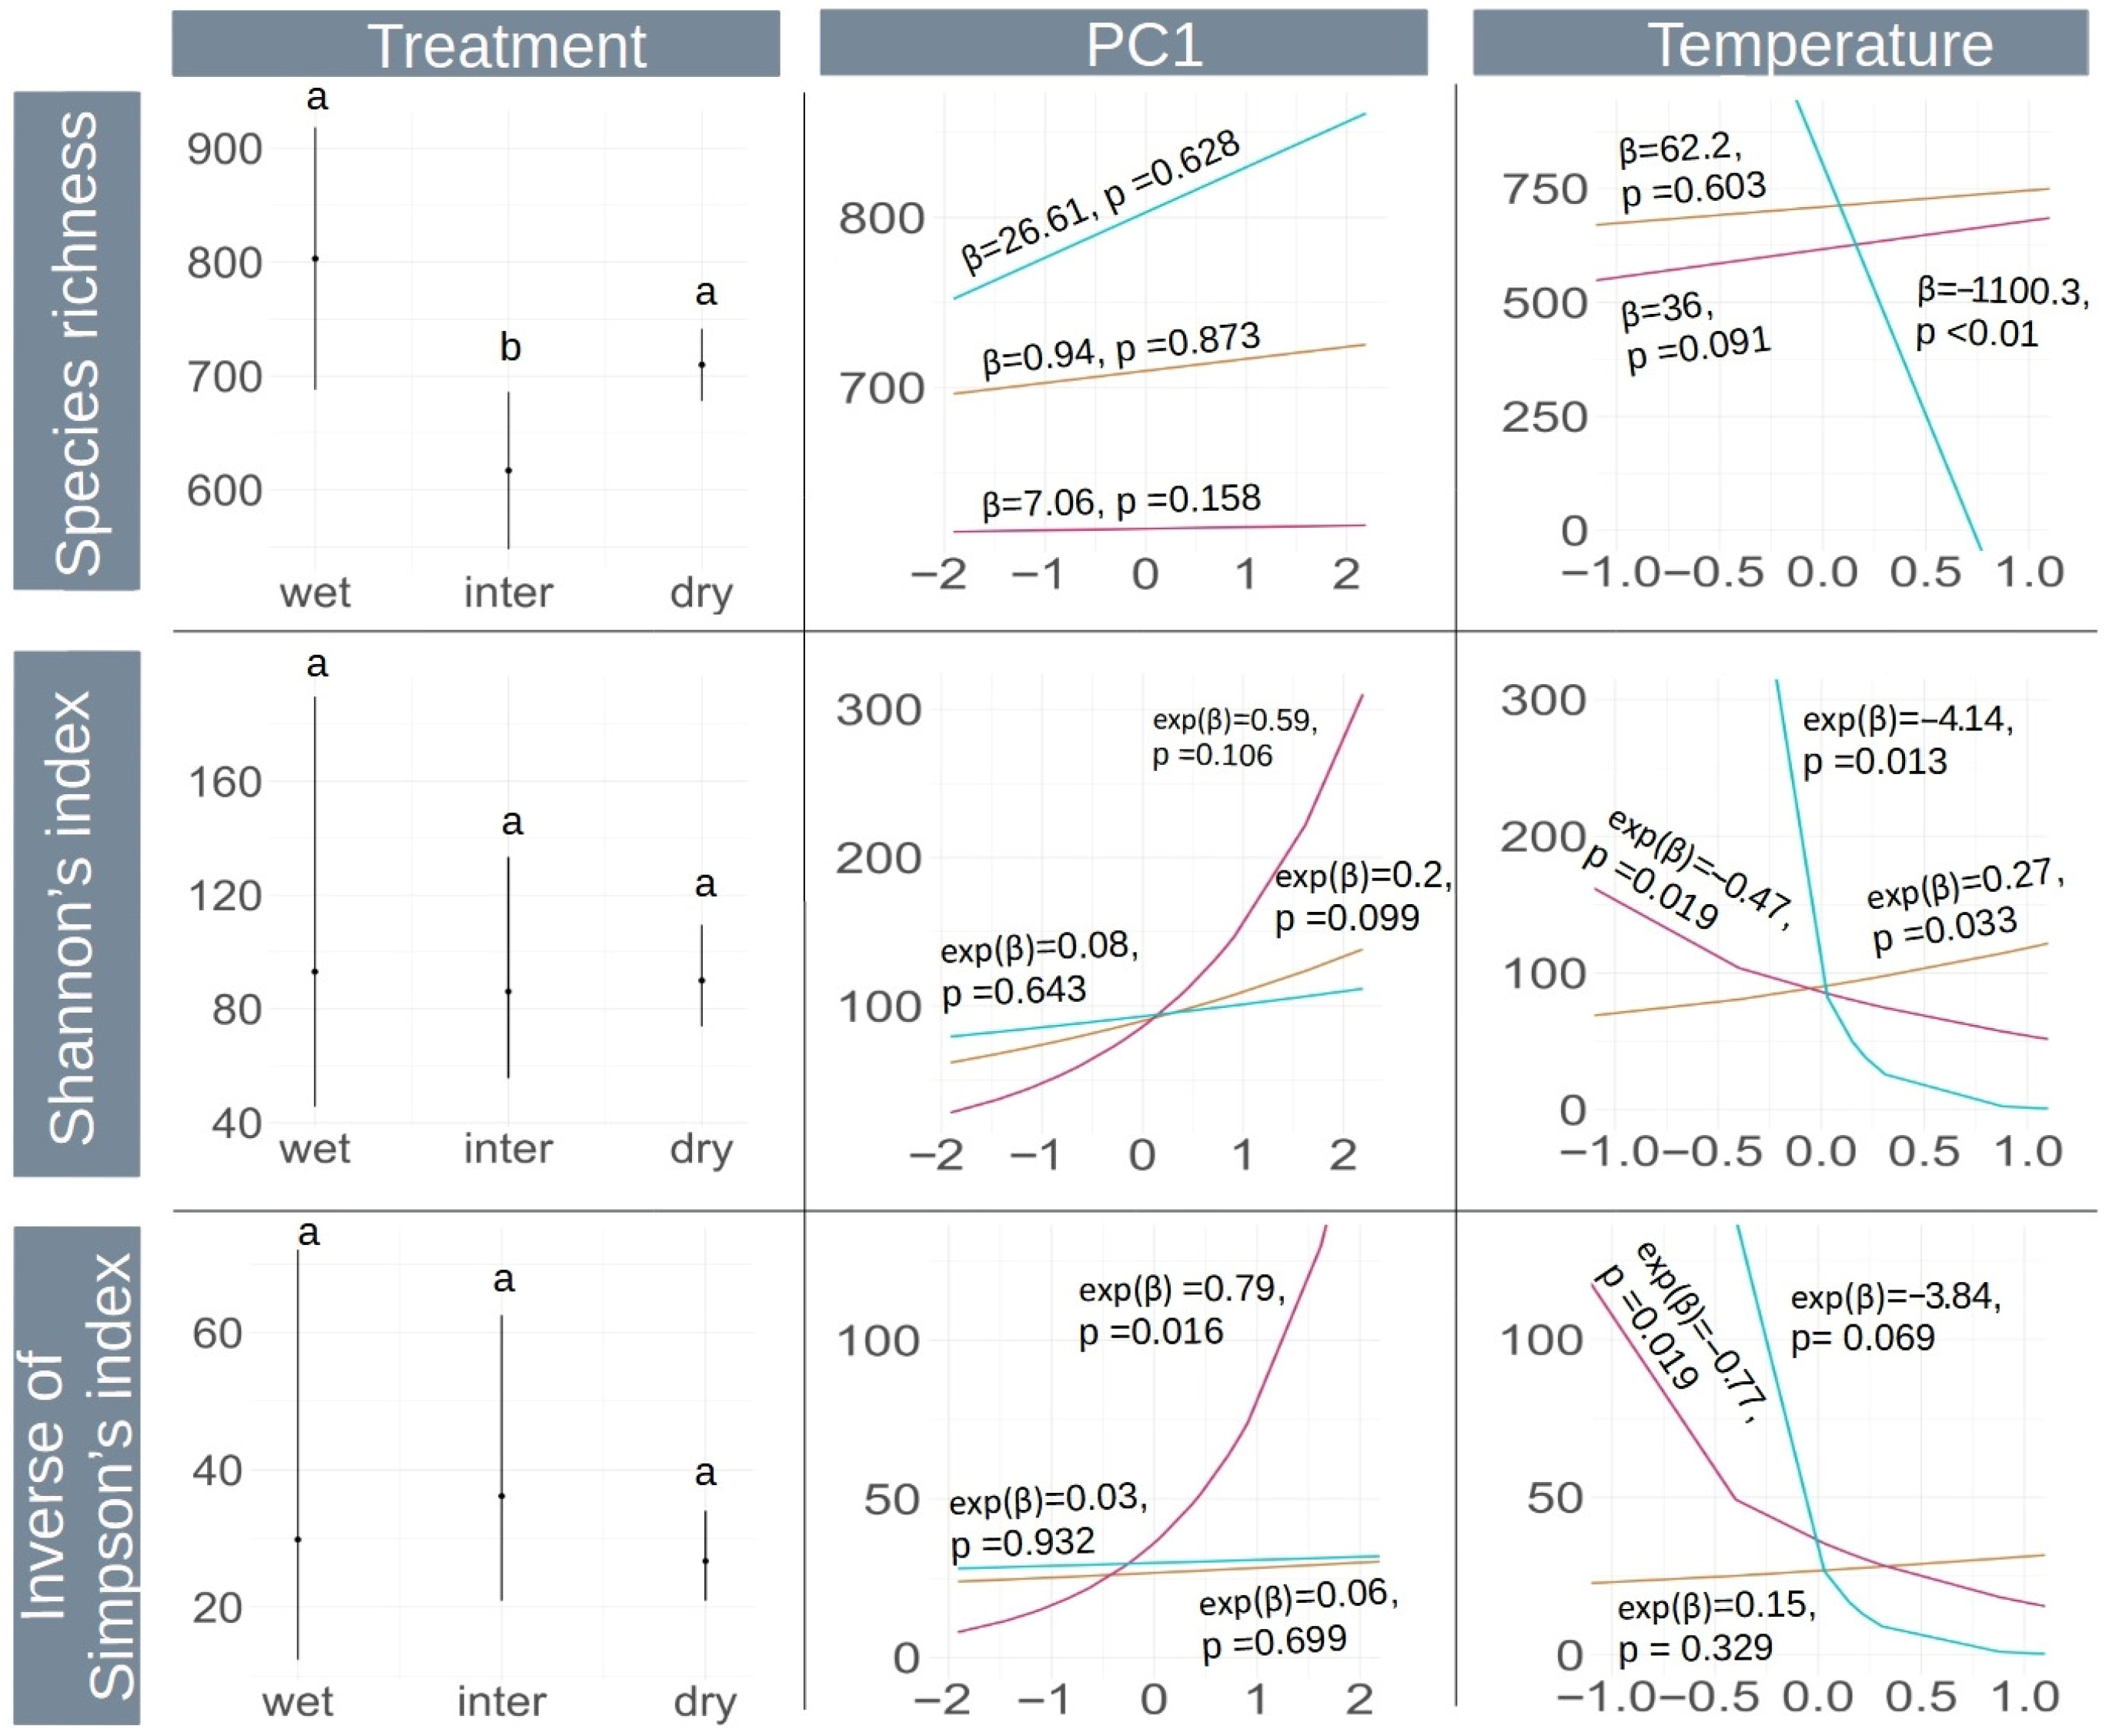
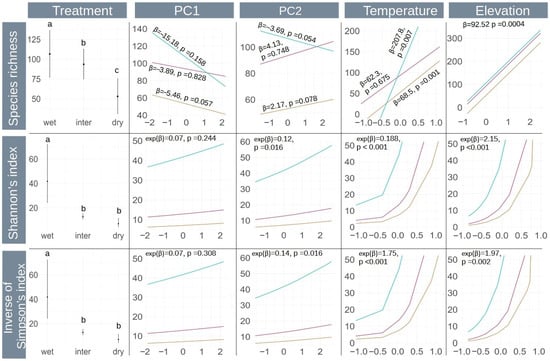
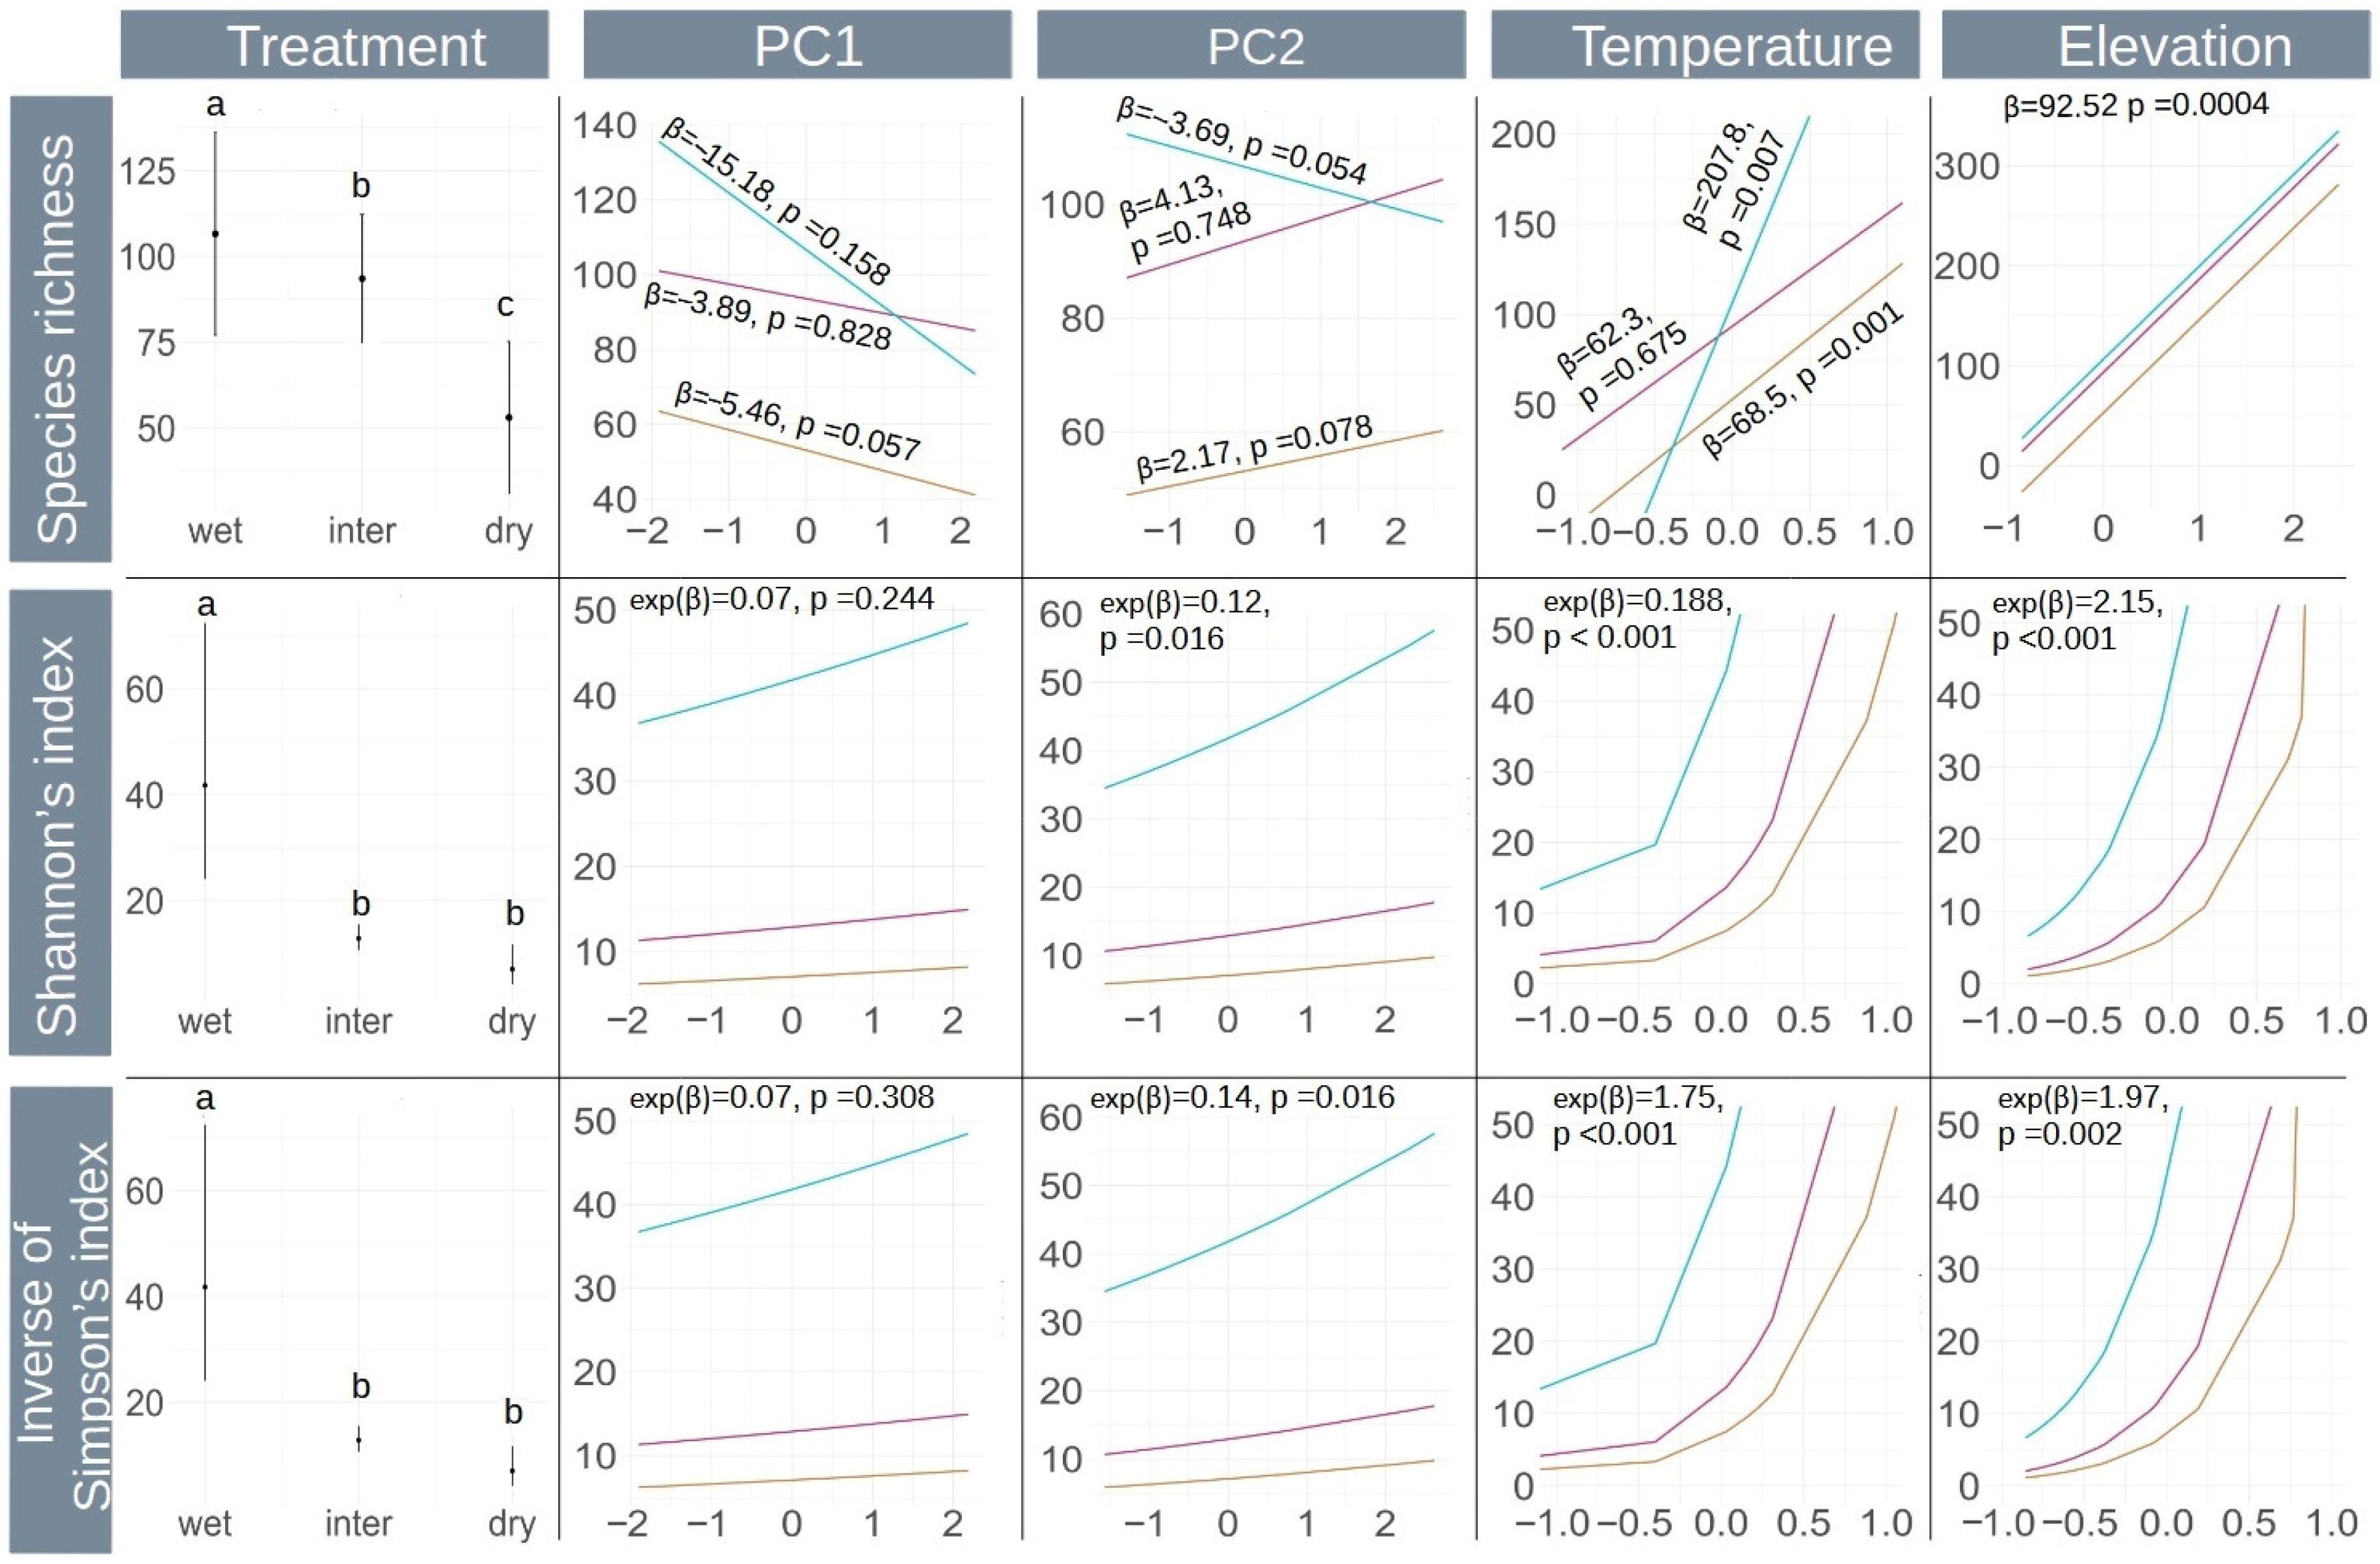
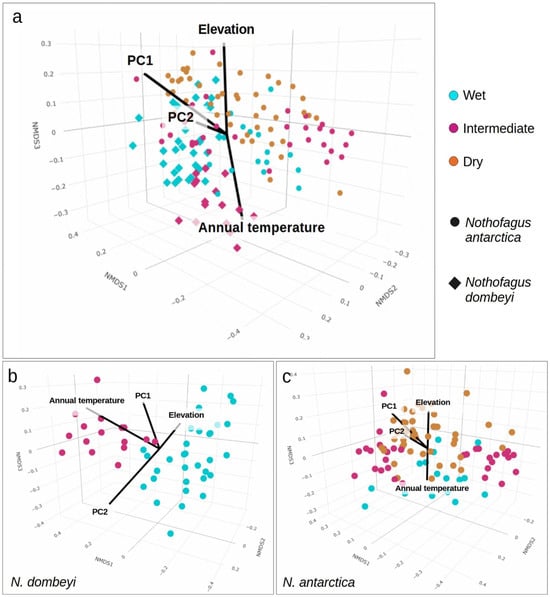
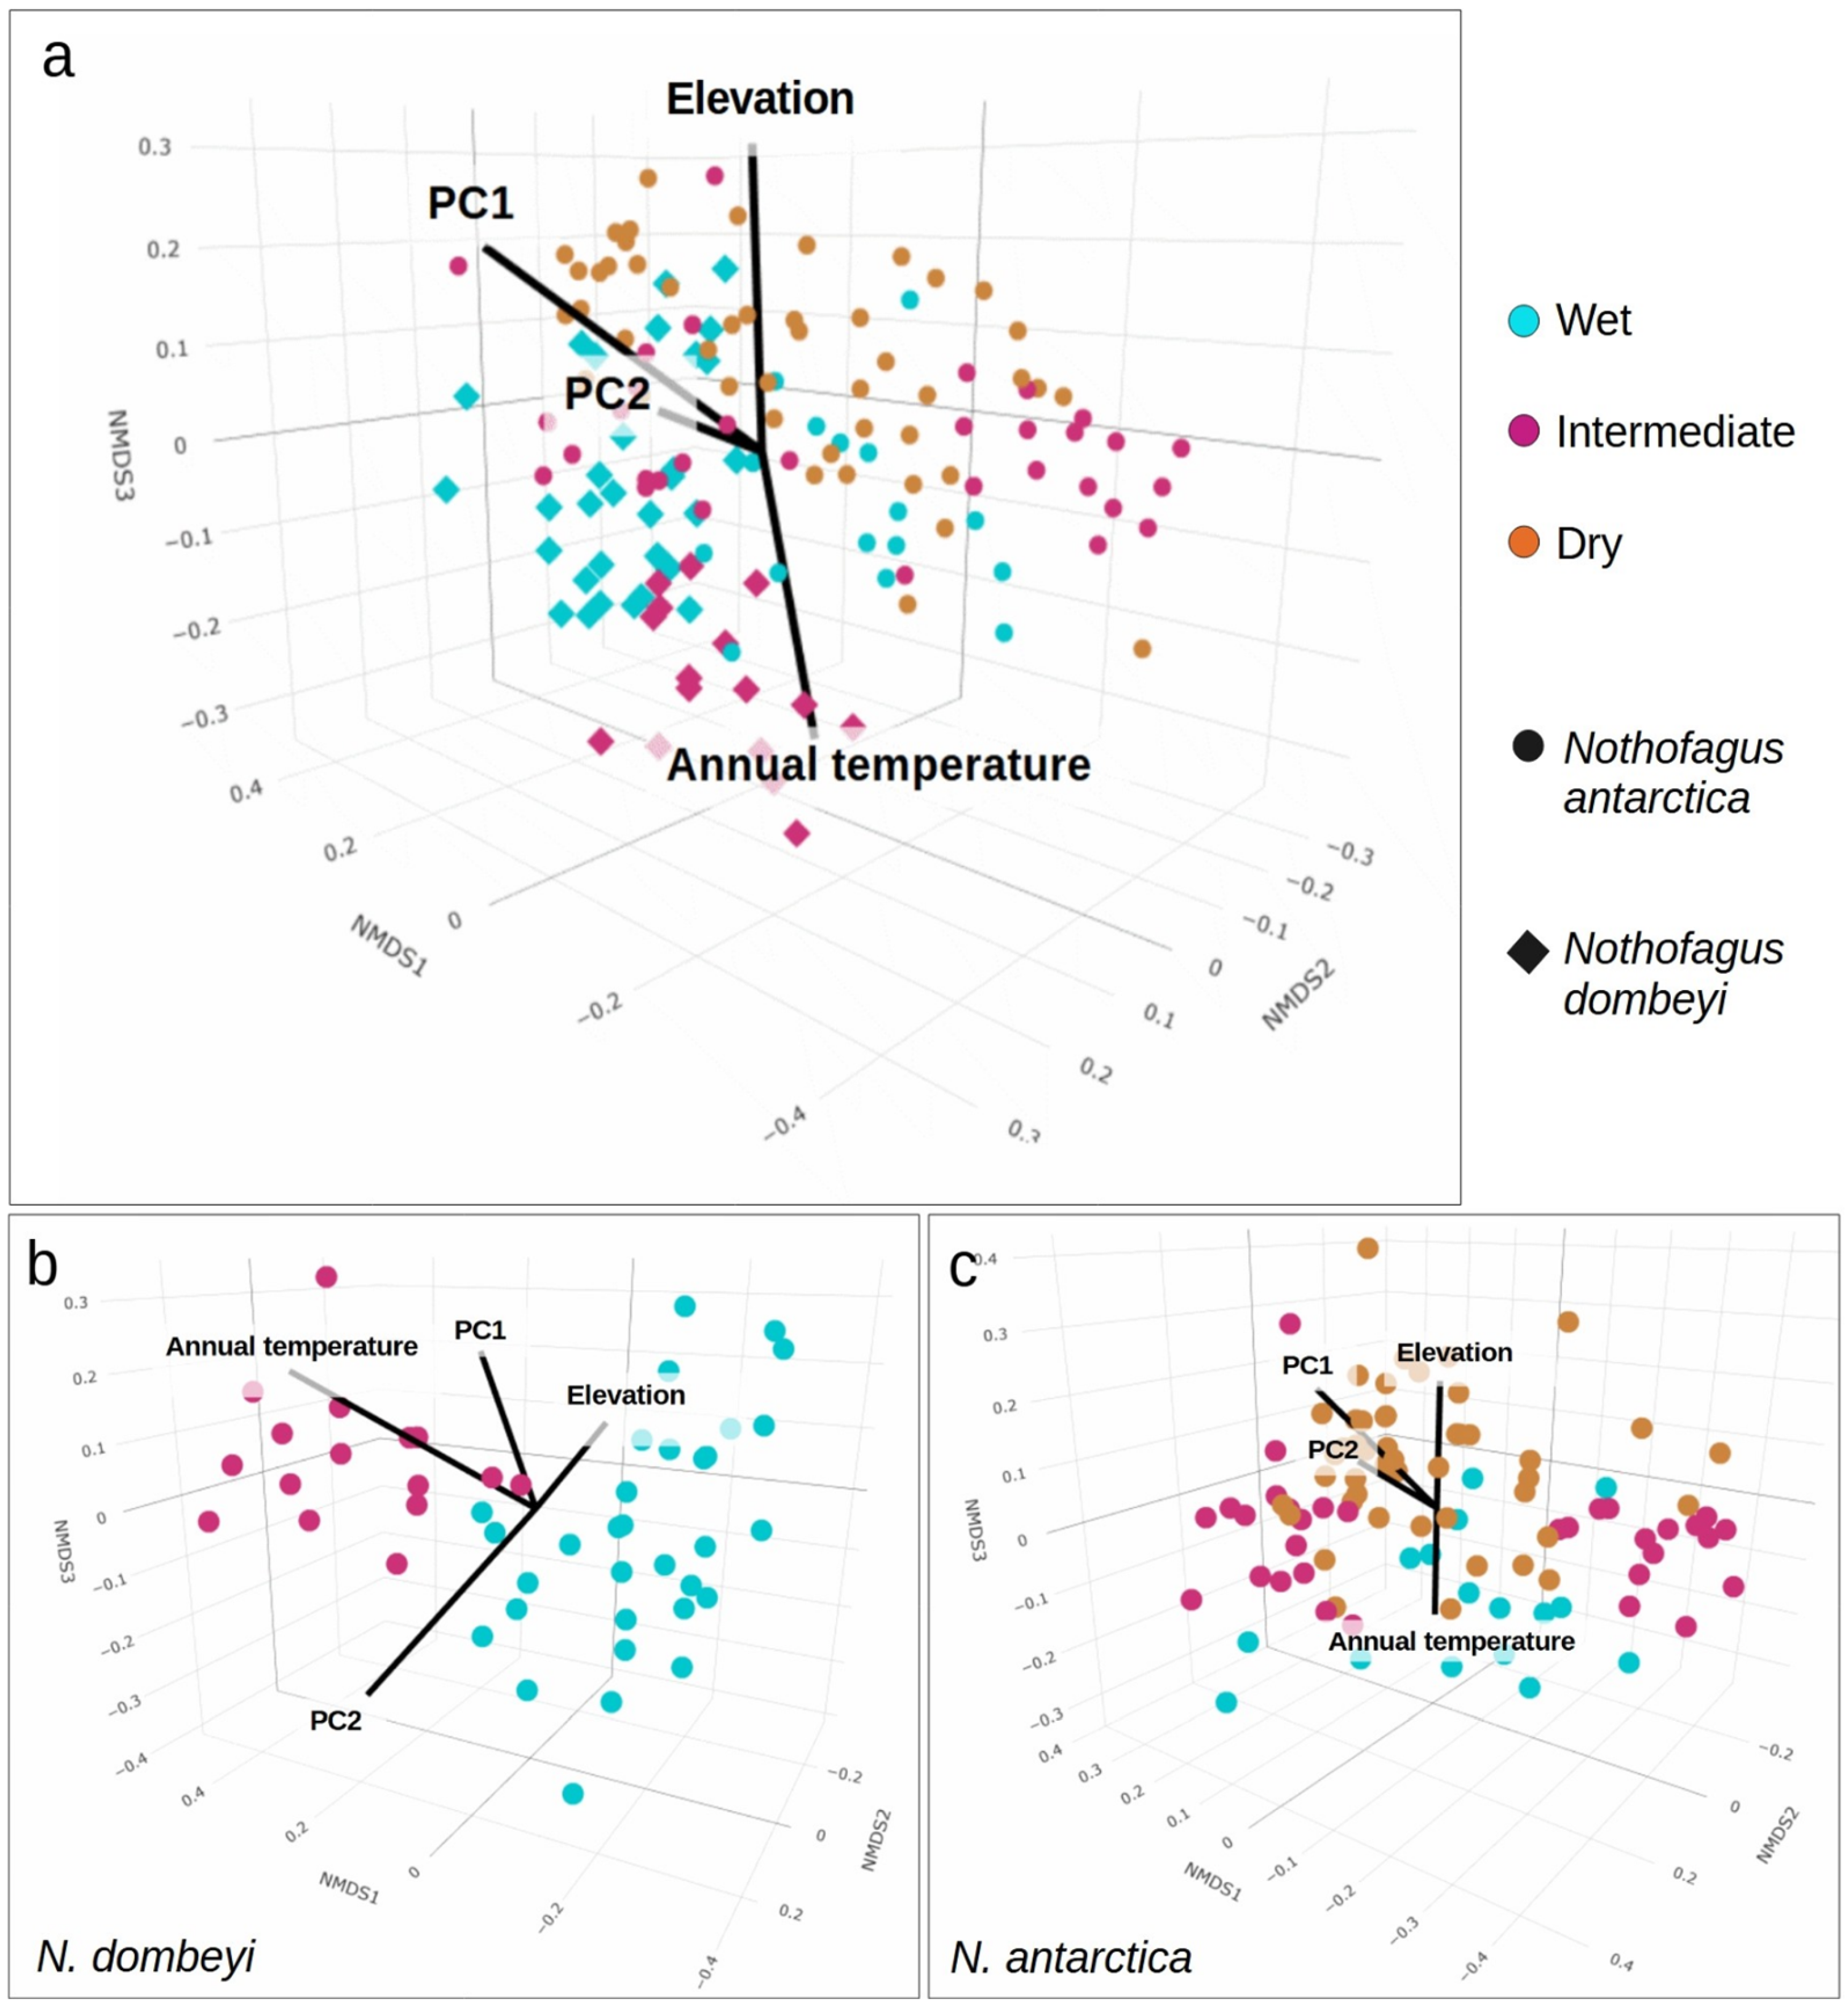
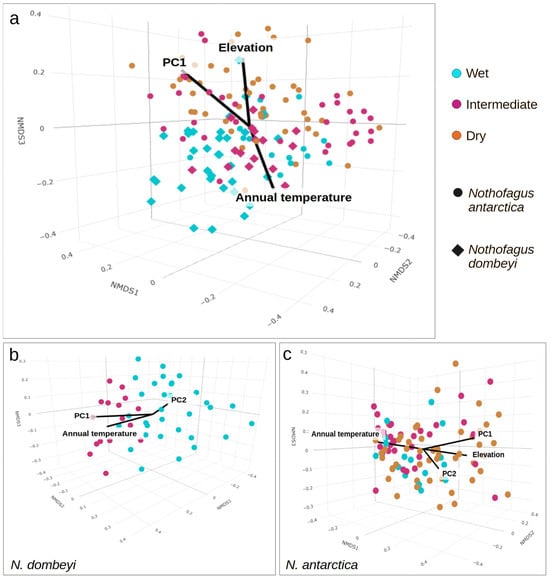
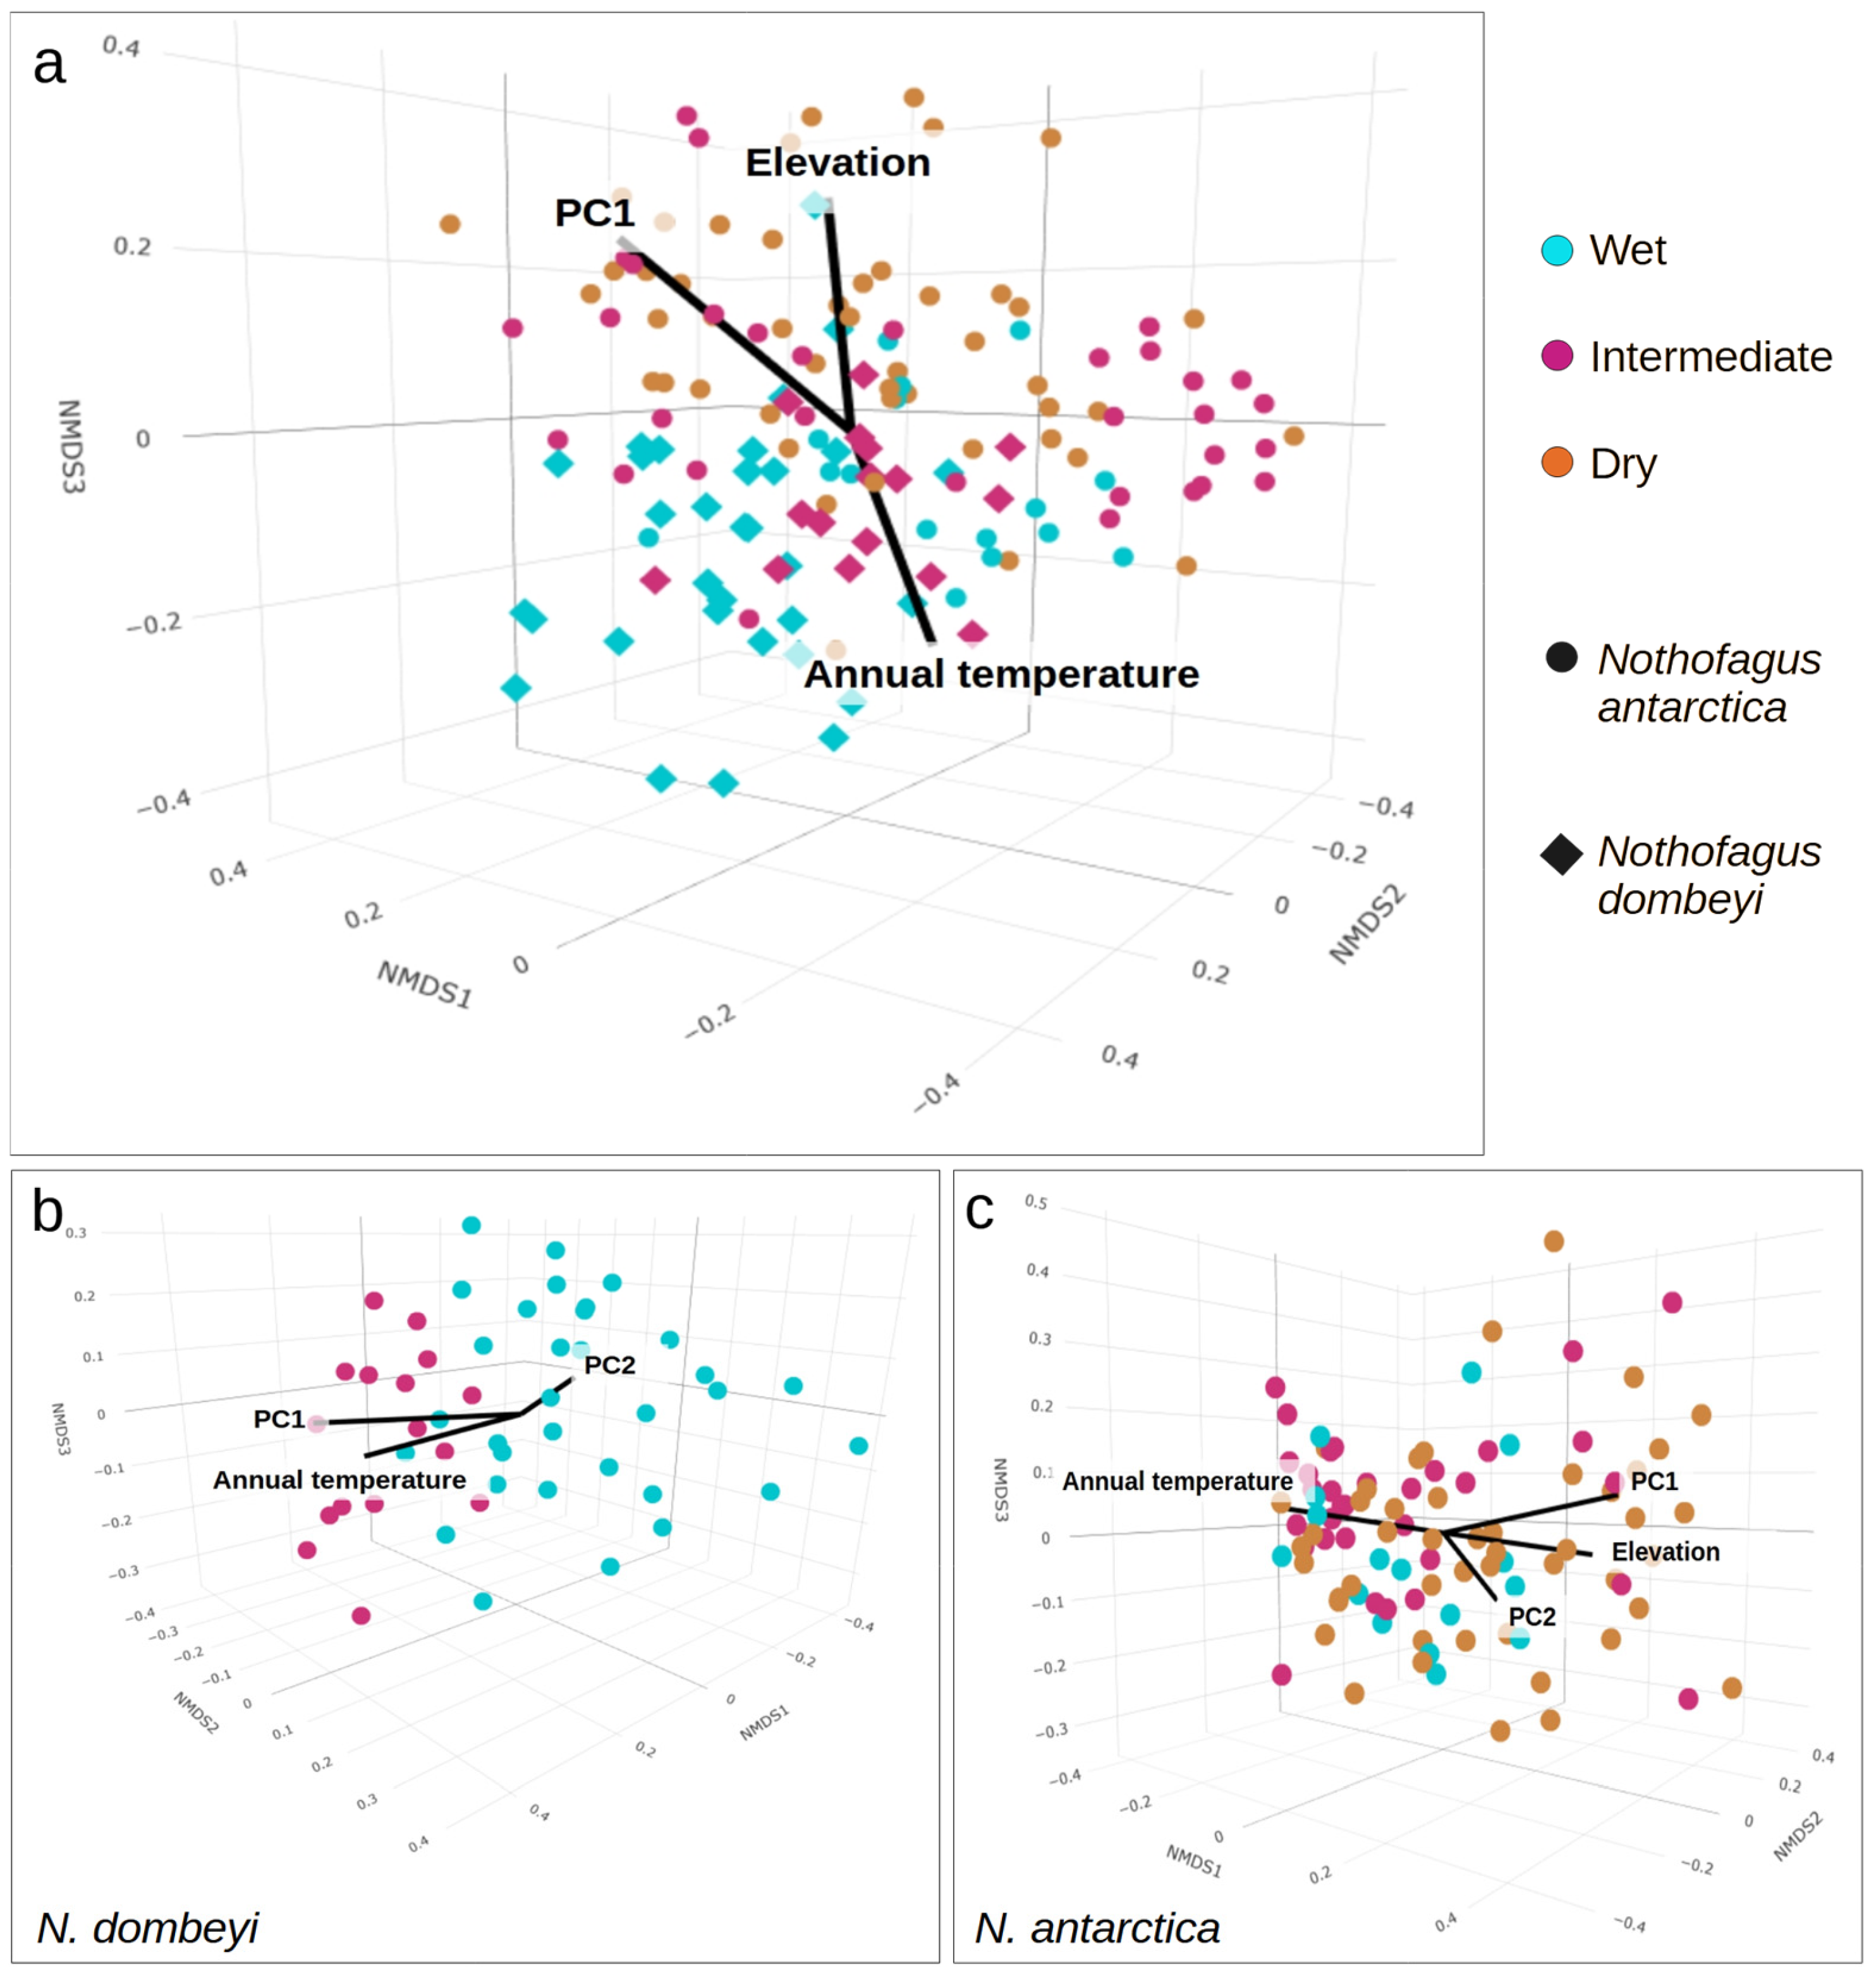
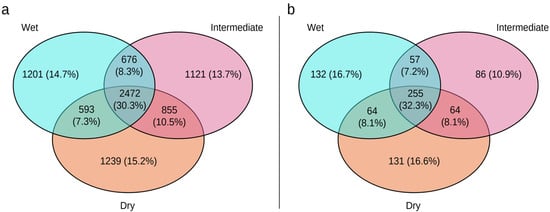
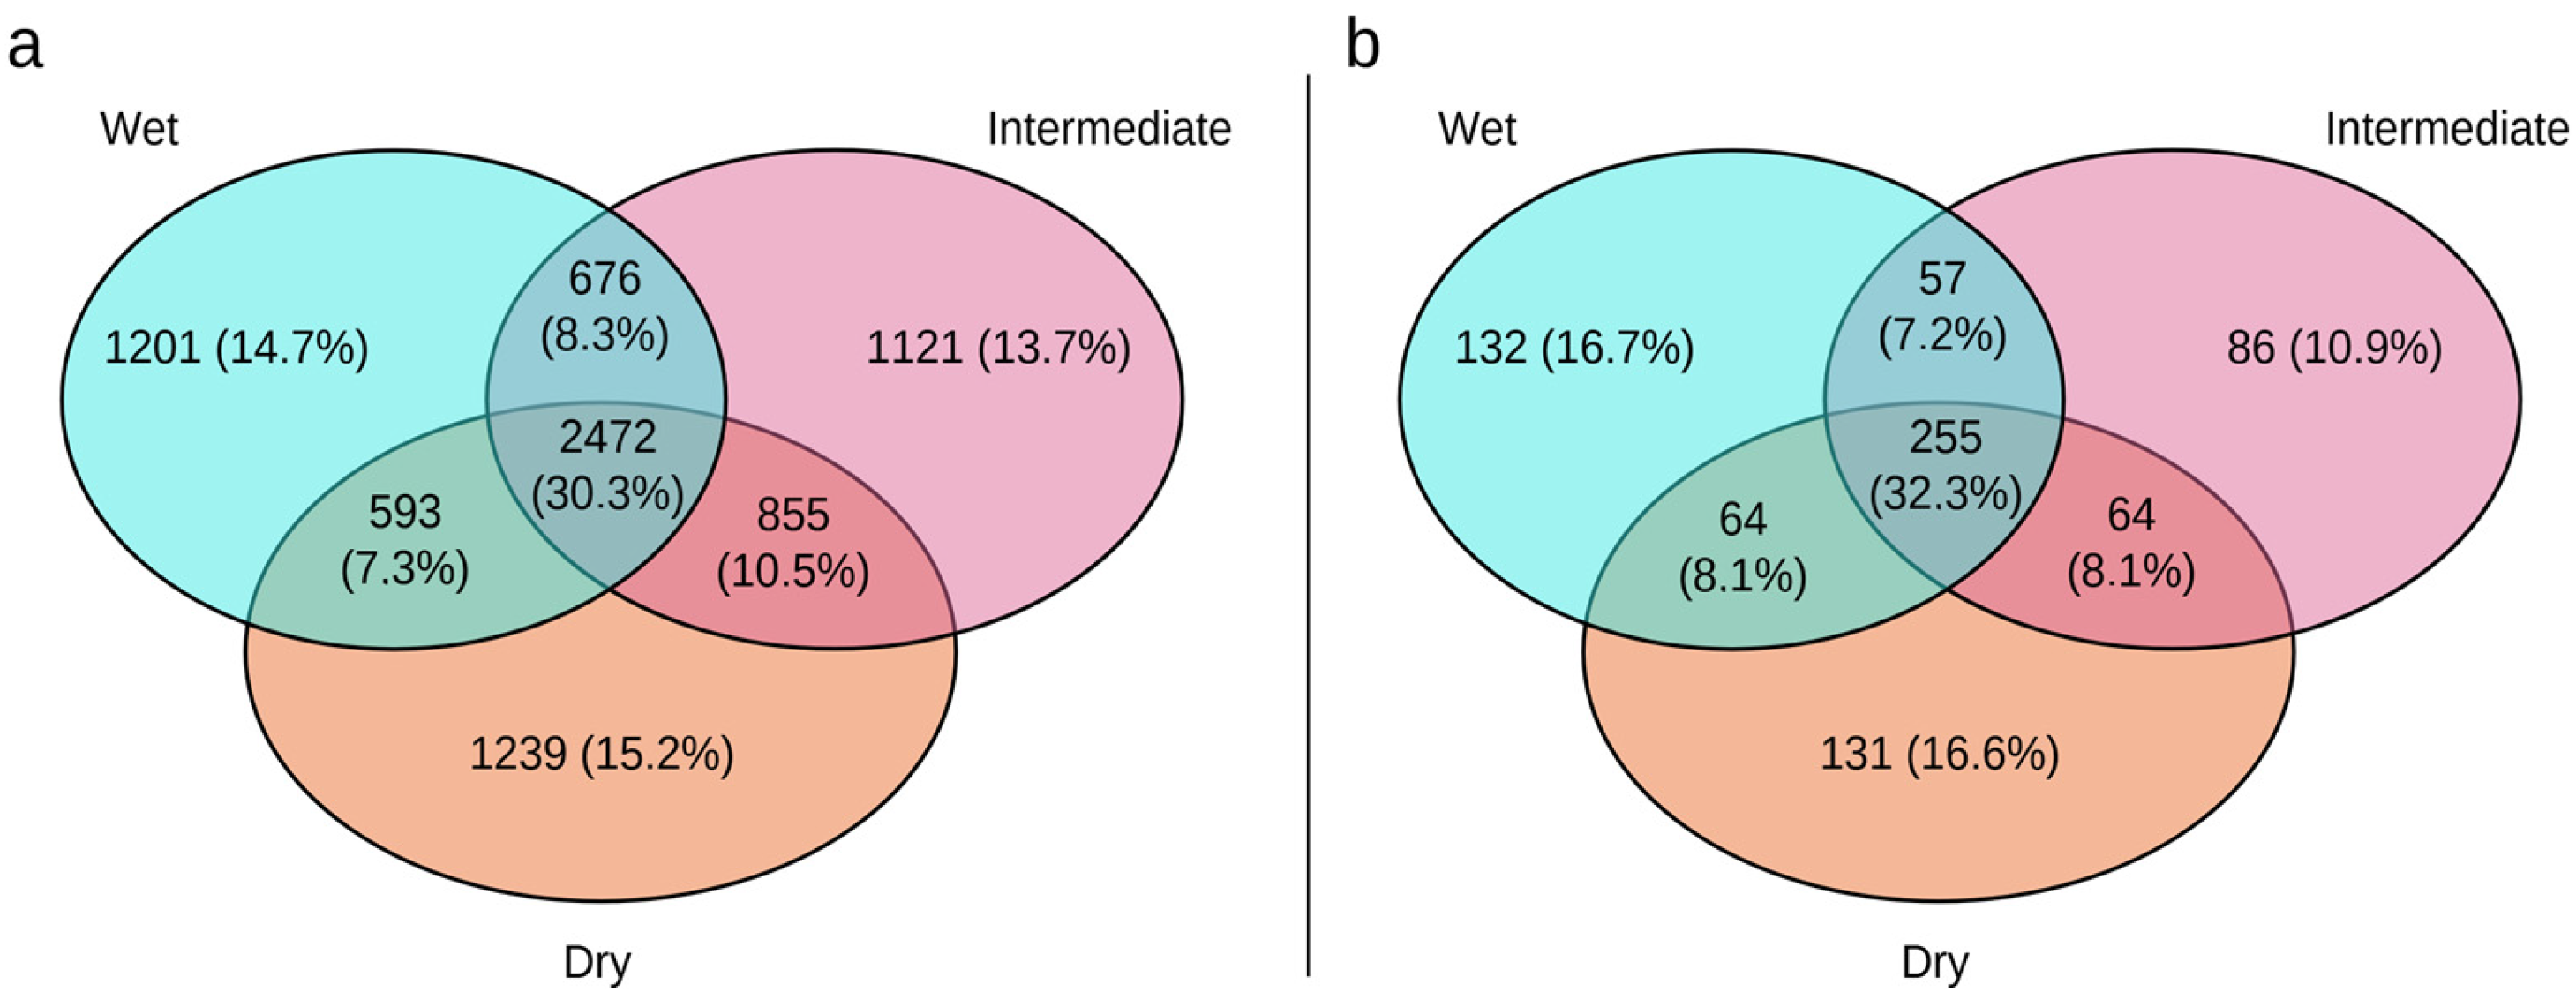
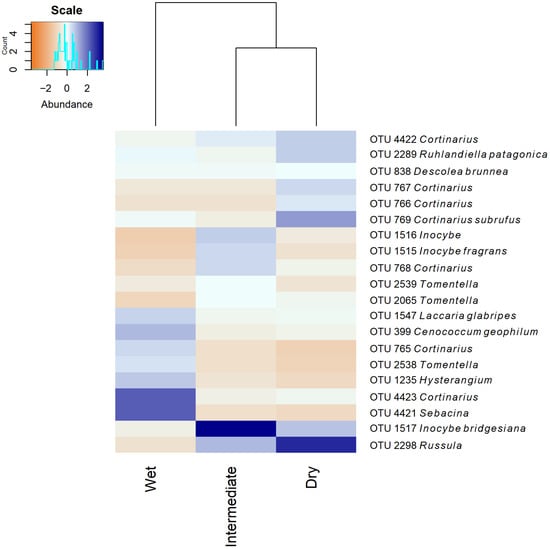
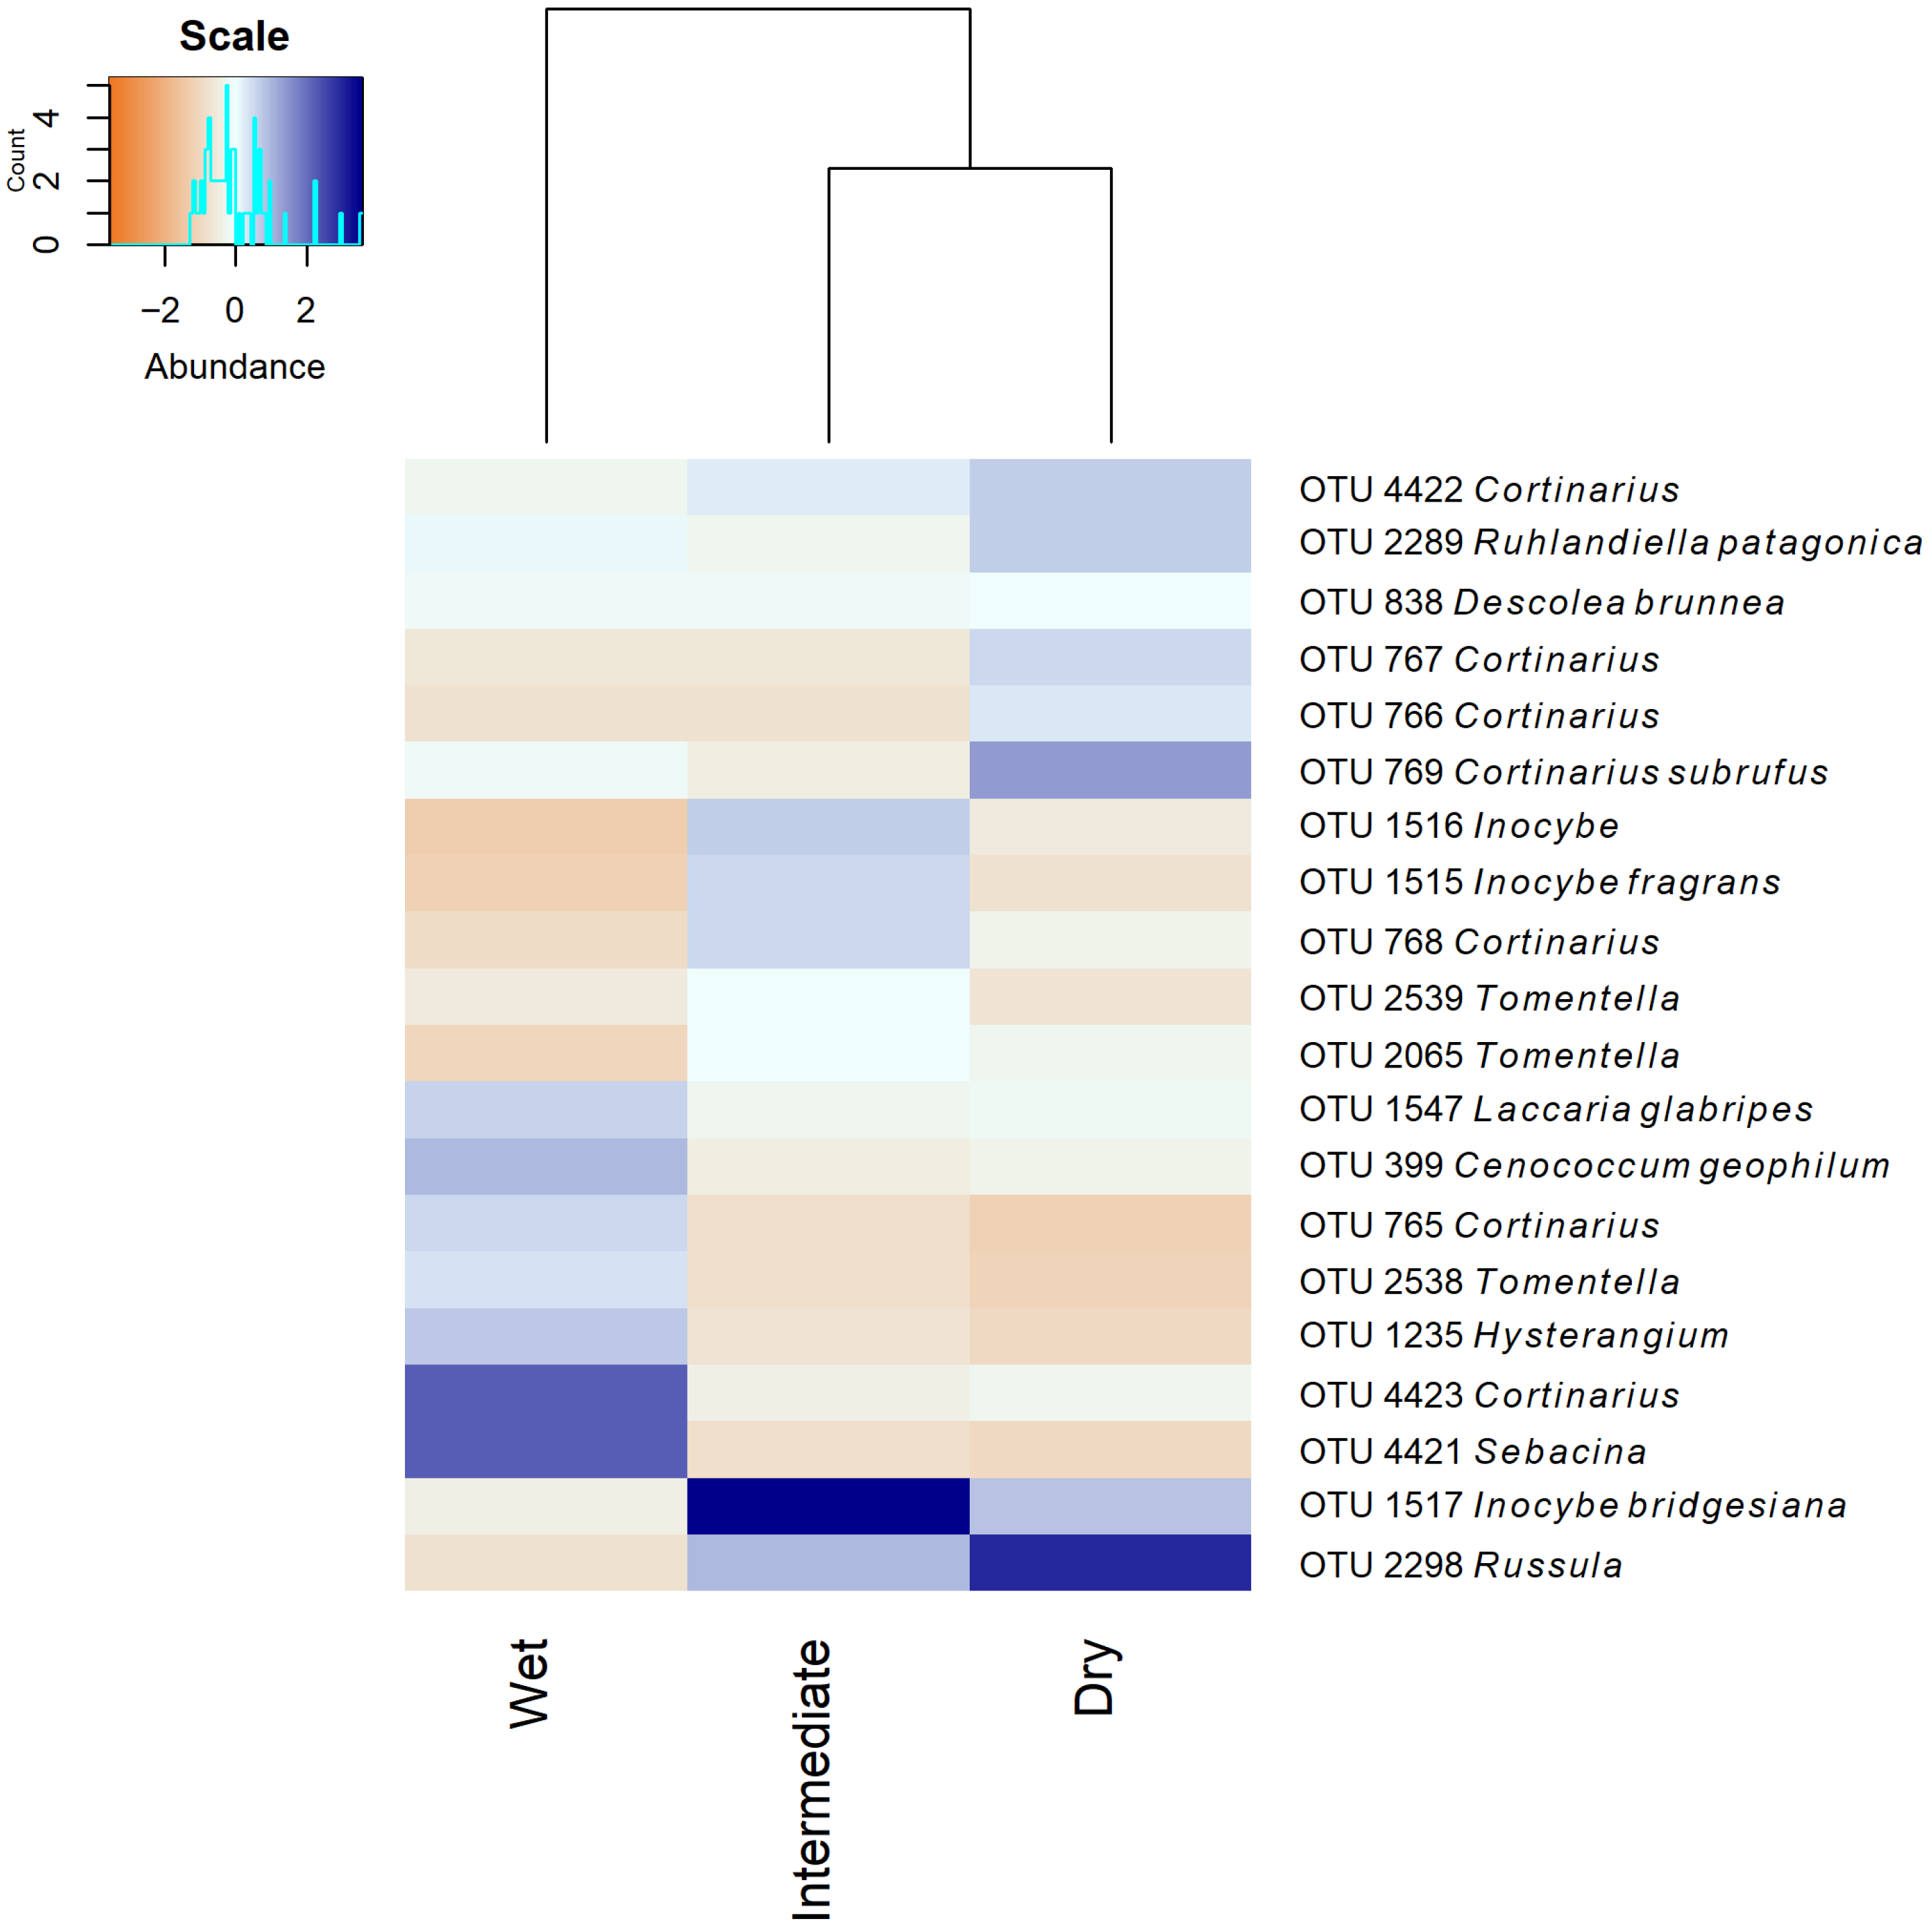

Disclaimer/Publisher’s Note: The statements, opinions and data contained in all publications are solely those of the individual author(s) and contributor(s) and not of MDPI and/or the editor(s). MDPI and/or the editor(s) disclaim responsibility for any injury to people or property resulting from any ideas, methods, instructions or products referred to in the content. |
© 2026 by the authors. Licensee MDPI, Basel, Switzerland. This article is an open access article distributed under the terms and conditions of the Creative Commons Attribution (CC BY) license.