


Abstract
Increasing the carbon sink function of forests is critical for achieving carbon (C) neutrality in the context of global climate change. Past studies have focused on the estimation of forest biomass or C storage, while those on forest C sink potential remain limited. In particular, there remain few systematic investigations to define the forest C sink, to characterize the synergistic influencing factors, and to develop related quantitative analysis methods. The development of scientific C enhancement strategies requires the construction of C density-age models integrating multiple stand factors. These models allow accurate quantification of the gap (∆C) between actual and maximum C sequestration capacity. This study used permanent sample plot data to develop and validate a novel multi-model assessment approach for quantifying the C sink potential of Larix olgensis plantations in Heilongjiang Province, China, and to translate the results into precise management tools. An Average-Level Model (ALM) was established to define baseline C sequestration. Three innovative potential assessment models were then proposed: (1) the Empirical Upper Boundary Model (PLM1); (2) the Dummy Variable Model (PLM2); and (3) the Quantile Regression Model (PLM3). These models define the maximum C sequestration capacity from distinct perspectives. PLM1 (R2 = 0.7910) characterized the theoretical upper limit of C sink potential (79.86 Mg·ha−1), making it suitable for macro-strategic goal setting, though it is somewhat dependent on extreme data points. PLM2 (R2 = 0.7943) achieved the best fit, and when combined with measurable stand conditions (site class index [SCI] > 16 m, stand density index [SDI] > 800 trees·ha−1), it provides clear guidance for management practices. Although PLM3 showed a lower goodness-of-fit (R2 = 0.1056), it provided reasonable parameter estimates and robust predictions, offering a reliable upper-bound reference for C sink project planning and risk control. At a stand age of 60 years (yr), the C sink enhancement potentials (“∆” C) corresponding to the three models were 15.73, 14.48, and 13.26 Mg·ha−1, representing increases of 24.53%, 22.58%, and 20.68%, respectively, over the average level (64.13 Mg·ha−1); the peak C sequestration rates of the models were 104.3%, 82.7%, and 60.5% higher than that of the ALM, with peak times occurring earlier at 9, 7, and 11 yr, respectively, underscoring the importance of the early management. The multi-model assessment approach developed here facilitates “precision carbon enhancement” by quantifying C sink potential across its theoretical, achievable, and robust upper-bound dimensions. This quantification provides both mechanistic insights into C sequestration processes and a critical link between theoretical understanding and practical forest management. This work holds significant value for advancing forestry C sinks in service of national strategies.
1. Introduction
Forests are the largest terrestrial ecosystem [1,2] and play an irreplaceable role in mitigating climate change through natural carbon (C) sequestration [3,4,5]. China has responded to the global climate crisis by committing to the “Dual Carbon” goals, under which enhancing forest C sink capacity has been identified as a key pathway to achieving C neutrality [6,7]. Larix olgensis plantations are widely distributed in Heilongjiang Province, a key forestry region in China, and are characterized by rapid growth and high timber yield, making them important contributors to regional and national C sequestration [1,8,9]. However, the assessment of forest “C sink potential”, defined as the gap (C) between actual C sequestration capacity and the maximum achievable under ideal conditions, still lacks a consensus approach. Past studies have proposed various methods for estimating forest C sink potential from theoretical, practical, and upper-bound perspectives [10,11,12,13,14], but these methods differ considerably in their definitions and in how they incorporate interacting stand factors [15]. Accurately assessing forest C sink potential is crucial for formulating scientific and rational C enhancement management measures.
Recent studies have made significant progress in simulating forest biomass and C stocks [16]. These studies have applied various linear and nonlinear models [17,18,19,20] to estimate C density and storage [21,22,23]. The developed models are important for predicting C dynamics, evaluating management effects, and formulating strategies [4,5,21,24]. However, to date, there have been no systematic investigations into the C sink potential of plantations. While most past research has focused on developing biomass or C storage growth models, significantly less attention has been paid to the systematic simulation and comparative analysis of C sink potential itself. Furthermore, many of the developed models to date fail to incorporate key stand factors, such as the stand density index (SDI), which quantifies the degree of tree crowding and competition within a stand, and Site Quality, often denoted by the site class index (SCI), which incorporates soil, climatic, and topographic parameters into a single measure of inherent productivity potential. These oversights greatly limited their explanatory power and practical application. Notably, stand density and site conditions are recognized as two key drivers of C storage variation [25,26]. In this study, a C density-age model refers to a model that describes how stand carbon density changes with stand age; by incorporating stand factors such as SDI and SCI, it can reflect differences in carbon accumulation trajectories under different stand conditions. Therefore, the accurate assessment of the C sink potential of regional plantations requires the development of C density-age models that integrate multiple stand factors [14,27].
Modern statistical methods can contribute to the improvement of C sink potential models. For instance, the Dummy Variable Model is effective in handling categorical variables and group differences [28], and is often combined with mixed-effects models or quantile regression to increase model accuracy. Notably, quantile regression can capture the conditional distribution of response variables [29], especially the upper quantile points [30], making it a powerful tool for defining the potential of “superior stands”, which has been widely used in predictions of stand growth [31,32,33,34,35,36]. However, the application of these modern statistical methods in assessing the C sink potential of specific tree species (e.g., Larix olgensis) in regional plantations remains underexplored [37].
Larch (Larix olgensis) is a tree species found in Northeast China. It is recognized to have rapid growth and a strong capacity for accumulating biomass. The total area of larch forests in Heilongjiang Province is 3.275 million hectares, of which larch plantations account for 1.0656 million hectares [38]. Therefore, larch plantations have significant potential as carbon sinks that should be considered in strategies for achieving regional and even national C neutrality goals. Past studies have shown the value of establishing plantations of native tree species with high C sink capacity for achieving China’s C neutrality goal [9].
This study aimed to develop a multi-model framework for quantifying the C sink potential of larch plantations. Specifically, it sought to: (1) construct a baseline C density model to define the average C sequestration level (ALM); (2) develop three potential-level models—the Empirical Upper Boundary Model (PLM1), the High-Site High-Density Dummy Variable Model (PLM2), and the Quantile Regression Model (PLM3, τ = 0.85)—to simulate potential C sequestration levels; and (3) compare their performance in evaluating C sink enhancement potential (ΔC) and clarify their respective applications. This framework provides tiered estimates of C sink potential and practical support for estimating the C sink potential of larch plantations in Heilongjiang Province.
2. Materials and Methods
2.1. Study Area
Heilongjiang Province (121°11′–135°05′ E, 43°25′–53°33′ N), northeastern China, borders Russia to the north and east, the Inner Mongolia Autonomous Region to the west, and Jilin Province to the south. This province has an area of 473,000 km2 and a temperate continental monsoon climate, with a mean annual temperature ranging from −5 °C to 5 °C, decreasing from south to north. Annual sunshine duration of the province is 2400 to 2800 h, and annual precipitation ranges from 400 to 650 mm.
The elevation of the province generally decreases from northwest to southeast, with the former dominated by the Greater Khingan Range and the latter including the Zhangguangcai Range and the Wanda Mountains. The Sanjiang and Nenjiang plains occur in the northeast and western parts of the province, respectively. The diverse terrain of Heilongjiang Province supports abundant forest resources covering 19.9046 million hectares (43.78% of the total province area), constituting a standing timber volume of 1.8470 billion m3. The complex topography and extensive forests of Heilongjiang Province highlight its importance for ecological conservation and forestry development.
2.2. Data Preparation
The present study used data collected from permanent sample plots of larch plantations in Heilongjiang Province, with each sample plot having an area of 0.06 ha. After removing outliers using the three-standard-deviation criterion, 750 plots were retained for analysis. The geographical location, topography, and spatial distribution of the permanent sampling plots in the study area are shown in Figure 1. All calculations and variable derivations were undertaken at the plot level. All trees in each plot with a diameter at breast height (DBH) exceeding 5 cm were measured. Other key observations included tree species (SP), geographical coordinates (longitude and latitude), elevation, slope, and aspect. Stand-level measures included stand age (Age), mean stand DBH (Dg), mean stand height (TH), and mean stand basal area (BA). Using the above variables, SDI, stand SCI, and stand carbon density (C) were subsequently calculated. Table 1 provides a statistical summary of the collected sample plot data.
Figure 1.
Location of the study area and the distribution of permanent sample plots in Larix olgensis plantations.
Table 1.
Statistical summary of data collected from permanent plantation sample plots of Larix olgensis in Heilongjiang Province.
The SDI was calculated as [39]:
where N is the number of trees per hectare (stems·ha−1) and Dg is the mean diameter at breast height (cm).
SCI establishes a logistic model between stand age and mean stand height and acts as a guide curve for the site index, and it was calculated as [40]:
where H is mean stand height (m), t is stand age, t0 is base age (set to 30 yr for larch plantations), and b and c are model parameters.
Various steps were required to calculate C density. First, larch C stock was estimated using an empirical biomass model. Individual tree biomass was calculated based on the within-plot larch and associated tree species DBH data by applying the compatible biomass model [41]:
where is the biomass (kg), D is the diameter at breast height (cm), and a and b are model parameters. The C storage of each tree was then calculated by incorporating species-specific average C concentration factors [42], specifically 0.4674 for planted larch. Summation was then applied to obtain the total C stock for each plot. Finally, C density (Mg·ha−1) was derived by dividing the total plot C stock by the plot area (0.06 ha).
2.3. Method
2.3.1. Selection of the Average-Level Carbon Density Model
The present study applied five commonly used stand growth models to simulate average C sequestration level, namely the Korf, Logistic, Richards, modified Weibull, and Mitscherlich equations [40]. After comparative evaluation based on goodness-of-fit statistics (R2, RMSE, rRMSE, MAE, AIC, BIC), the modified Weibull equation (Equation (4)) demonstrated the best fit and was consequently adopted as the average-level model (ALM):
where Y is the C density (Mg·ha−1), t is the stand age (yr), and , , and are parameters.
2.3.2. Development of Potential-Level Carbon Density Models
Three potential-level models were constructed to quantify the carbon density potential of larch plantations under optimal conditions from different conceptual perspectives: the Empirical Upper Boundary Potential Model (PLM1), representing the biological potential as the theoretical maximum under optimal growth; the Dummy Variable Potential Model (PLM2), representing the manageable potential achievable through silvicultural practices under favorable stand conditions; and the Quantile Potential Model (PLM3), representing the statistical potential as a robust upper bound derived from quantile regression for risk-averse applications. The carbon sequestration rate curves of the three models were derived by differentiating the carbon density models with respect to stand age.
PLM1 is a potential model developed by constructing a modeling dataset that includes the three sample plots with the highest carbon density from each stand age class, resulting in a total of 122 plots. The modified Weibull model (Equation (4)) was fitted to this dataset to represent the maximum C sink potential under superior site conditions and optimized growth. To test the robustness of the threshold selection, a sensitivity analysis was conducted to compare the effects of using the “top 5%” and “top 10%” of plots as alternative thresholds on the model outcomes.
PLM2 is a potential model developed based on previous studies and the growth characteristics of Larix olgensis plantations in Northeast China [43], in which both SDI and SCI were categorized into three grades; for SDI, Grade I (SDI1 ≤ 400 trees·ha−1), Grade II (400 < SDI2 ≤ 800 trees·ha−1), Grade III (SDI3 > 800 trees·ha−1); for SCI, Grade I (SCI1 ≤ 12 m), Grade II (12 < SCI2 ≤ 16 m), Grade III (SCI3 > 16 m). Then, using Equation (5), C density-age models incorporating single and double dummy variables were constructed. A sub model used in PLM2 represents a combination of high site quality and high density (i.e., SCI3 > 16 m and SDI3 > 800 trees·ha−1). This sub-model yields the highest predicted C density and the most rapid growth rate, effectively characterizing the maximum achievable C sink potential under these optimal stand conditions. The high site-quality threshold (SCI3 > 16 m) was based on the understanding that stands with predominant heights of over 16 m at the base age (30 yr) are typically located in areas with deep soil layers and favorable water and nutrient conditions, resulting in significantly higher potential biomass production. The selection of 800 trees·ha−1 as the high-density threshold was based on the effects of species density: SDI values above this threshold are associated with intensified competition among individuals, potentially resulting in reduced growth [44]. This value can, thus, be regarded as a management threshold approaching the natural saturation point.
where Y is C density (Mg·ha−1), t is the stand age (yr), , , , and are dummy variables representing different grades of SCI and SDI, respectively, and , , , , , , are parameters.
PLM3 is a potential model developed using quantile regression to simulate the potential performance of C density. Sensitivity analysis of the models testing τ = 0.83, 0.85, and 0.87 was used to identify the quantile point (τ) best representing the potential of “superior stands” [33,36]. The model at τ = 0.85 was ultimately selected and defined as the potential-level model PLM3 (Equation (6)).
where , , and are the parameters of the τ-th quantile regression model, and is the predicted C density (Mg·ha−1) at the τ-th quantile.
The model parameters were estimated by minimizing an asymmetric loss function of the absolute residuals:
where is the chosen quantile, is the predicted quantile function of the dependent variable, R is the entire population of the dependent variable, is the deterministic prediction from the model, and i is an integer index.
Parameters a, b, and c in the modified Weibull function (Equation (4)) represent the asymptotic maximum, growth rate, and shape, respectively. These parameters are estimated independently for each model (ALM, PLM1, PLM2, PLM3). Therefore, while sharing the same mathematical role, their numerical values differ across models (Table 2).
Table 2.
Parameter estimates for the carbon density models of Larix olgensis plantations in Heilongjiang Province, northeastern China.
2.3.3. Calculation of Carbon Sink Enhancement Potential
C sink enhancement potential (C) was defined as the difference between the potential-level C density (CPLM) and the average-level C density (CALM):
The C sequestration rate curve was defined as the first derivative of the C density model with respect to stand age. Using the modified Weibull model as an example, the sequestration rate function is given as:
2.3.4. Model Testing and Evaluation
Stratified sampling based on the C density distribution was conducted for 10-fold cross-validation, with 90% of the data used for model training and 10% for validation in each fold. The model accuracy was assessed using the coefficient of determination (R2), root mean square error (RMSE), relative root mean square error (rRMSE), mean absolute error (MAE), Akaike Information Criterion (AIC), and Bayesian Information Criterion (BIC) [30,31,36,40,45,46]. In addition, the Delta method was adopted to quantify parameter uncertainty and estimate the 95% empirical confidence intervals of the predicted C density values at the key stand age of 60 yr. Moreover, the stability of the cross-validation was assessed by determination of the standard deviation and range of the predicted ΔC values from the 10-fold cross-validation, thereby providing a systematic evaluation of the robustness of the model predictions.
3. Results
3.1. Evaluation of the Fitting Accuracy of Carbon Density Models
The present study applied a square root transformation to C density data prior to model fitting to address heteroscedasticity.
The ALM achieved R2, RMSE, and MAE metrics of 0.5048, 1.4807 Mg·ha−1, and 1.2178 Mg·ha−1, respectively (Table 3), demonstrating a slightly improved performance relative to the other candidate models.
Table 3.
Goodness-of-fit statistics for the carbon density models of Larix olgensis plantations in Heilongjiang Province, northeastern China.
The goodness-of-fit statistics for the PLM1 model indicated it to have high accuracy, with an R2 of 0.7910 (Table 3) and lowest RMSE, rRMSE, and MAE among the evaluated models of 0.8022 Mg·ha−1, 10.8330%, and 0.5989 Mg·ha−1, respectively. The AIC and BIC values achieved by the model of 307.0308 and 318.3120, respectively, indicated the model to have a good balance between model complexity and goodness-of-fit. Sensitivity analysis of the PLM1 model revealed that changing the threshold led to a moderate and steady increase in the predicted C density of the mature stands (60 yr), rising from 79.86 Mg·ha−1 (top three plots) to 81.84 Mg·ha−1 (top 5%) and 83.16 Mg·ha−1 (top 10%), with a maximum relative difference of only +4.1%.
The 95% confidence intervals of the prediction curves for the three thresholds at 60 yr were (75.30, 91.02), (72.88, 90.80), and (73.36, 86.35) Mg·ha−1, respectively. These intervals overlapped broadly across all age classes and exhibited comparable widths of 15.72, 17.92, and 12.99 Mg·ha−1.
Model performance was significantly improved through the introduction of stand factors. Incorporation of SCI dummy variables resulted in an increase in R2 from 0.5048 to 0.5857; introducing only SDI increased R2 further to 0.7795; the full PLM2 model, incorporating both SDI and SCI, further increased R2 to 0.7943. The introduction of stand factors also reduced all error metrics (RMSE, rRMSE, MAE) and information criteria (AIC, BIC) (Table 3). Consequently, PLM2 was identified as having achieved the best overall goodness-of-fit.
PLM3 models were constructed at three quantile points (τ = 0.83, 0.85, 0.87). R2 of the models decreased with increasing τ, reaching an R2 of only 0.0407 at τ = 0.87). In contrast, RMSE, rRMSE, MAE, AIC, and BIC showed gradual increases (Table 3). The R2 for the selected PLM3 model at τ = 0.85 was 0.1056. While this model achieved higher RMSE and rRMSE compared to the other models, parameter trends were stable (Table 2), and the model maintains interpretability for characterizing the potential of superior stands.
The residuals of all models were evenly distributed on both sides of zero, generally ranging from −4 to 4 Mg·ha−1 without showing distinct patterns (Figure 2a–e), indicating satisfactory performance for all models. Among the models, the residual plot indicated PLM2 to have the optimal performance. In contrast, that for PLM3 indicated over-estimation of simulated C density values for most sample plots (Figure 2f). However, this result is consistent with the inherent purposes of the model, namely, defining the upper quantile (τ = 0.85) of the conditional distribution of C density and visually confirming the widespread existence of C sink enhancement potential. Among the 750 plots, 638 (approximately 85.1%) had an actual C density lower than the value predicted by PLM3 (τ = 0.85). Six hundred and three plots (80.4%) were located below the curve.
Figure 2.
Predicted versus observed carbon densities of Larix olgensis plantations in Heilongjiang Province, China. The red line in each panel represents the 1:1 line between the observed and predicted values. Scatter plots of the predicted versus observed carbon densities are shown for the six models: (a) average-level model (ALM), (b) empirical upper boundary potential model (PLM1), (c) dummy variable potential model with site class index (SCI) (PLM2(SCI)), (d) dummy variable potential model with stand density index (SDI) (PLM2(SDI)), (e) dummy variable potential model with SCI & SDI (PLM2(SCI & SDI)), and (f) quantile potential model (PLM3, τ = 0.85). Predictions were generated from the modified Weibull model and its extensions (Equations (4)–(6)).
3.2. Analysis of Carbon Sink Enhancement Potential
Using the developed models (parameters listed in Table 2), the present study constructed C sequestration level curves (Figure 3a) and C sequestration rate curves (Figure 3b) to visually illustrate the C sequestration dynamics of larch plantations. Characteristic values at key age classes were also calculated.
Figure 3.
Carbon sequestration dynamics in Larix olgensis plantations. (a) Carbon sequestration level as a function of stand age, as predicted by the modified Weibull model. Curves represent the average-level model (ALM) and the three potential-level models (PLM1, PLM2, PLM3). The shaded bands surrounding each potential model curve indicate the corresponding 95% confidence intervals, as estimated using the Delta method. (b) Carbon sequestration rate as a function of stand age, derived as the first derivative of the modified Weibull model. Curves represent the average sequestration rate (ALM-seq) and the three potential sequestration rates (PLM1-seq, PLM2-seq, PLM3-seq).
Consistent with its status as a fast-growing tree species, larch exhibited continuous increases in C sequestration level with increasing stand age (Figure 3a), whereas C sequestration rate first increased and then decreased (Figure 3b). Mature stands (t = 60 yr) of larch plantation across the province had an average C sequestration level (CALM) of 64.13 Mg·ha−1. The results indicated clear variations in the maximum C sequestration capacity (CPLM) defined by the three potential models and the resulting C sink enhancement potential (C) (Table 4). The highest theoretical potential was given by PLM1, with a CPLM1 of 79.86 Mg·ha−1 resulting in a ΔC of 15.73 Mg·ha−1, representing an increase of 24.53%. PLM2 more closely reflected achievable potential, with a CPLM2 of 78.61 Mg·ha−1 yielding a C of 14.48 Mg·ha−1, an increase of 22.58%. The robust estimate of potential given by PLM3 of 77.39 Mg·ha−1 at τ = 0.85 corresponded with a C of 13.26 Mg·ha−1, an increase of 20.68%. Sensitivity analysis on the quantile point demonstrated the continuity of PLM3 predictions. At τ between 0.83 and 0.87, CPLM3 at 60 yr fluctuated reasonably between 75.56 and 78.75 Mg·ha−1, with a corresponding C sink enhancement potential (C) of 11.43 to 14.62 Mg·ha−1 (Table 4).
Table 4.
Statistical summary of carbon density and carbon sequestration rate for Larix olgensis plantations in Heilongjiang Province, northeastern China, under different modeling approaches.
The predicted C densities and their 95% confidence intervals for key stand ages are presented in Table 5. At the mature stand stage (60 yr), the width of the prediction intervals for the models ranged from approximately 3.32 to 12.99 Mg·ha−1. The stability of the models was confirmed by 10-fold cross-validation. As shown in Table A1 and Table A2, the standard deviations of the fold-specific mean ΔC values were 1.24 and 1.31 Mg·ha−1 for PLM2 and PLM3, respectively. In contrast, the standard deviation for PLM1 was slightly higher at 2.70 Mg·ha−1, although its overall mean ΔC was close to zero (−0.65 Mg·ha−1). In terms of the average of the fold-specific standard deviations of ΔC, the dispersion of prediction errors was similar for PLM1 and PLM2 (11.78 and 11.41 Mg·ha−1, respectively), while it was greater for PLM3 (17.63 Mg·ha−1). Furthermore, the standard deviation of the fold-specific standard deviations was smallest for PLM2 (0.84 Mg·ha−1), indicating that its prediction error was the most stable across the different data subsets.
Table 5.
Confidence interval ranges for C density in Larix olgensis plantations in the different models.
The variation in C sequestration rates shown in the results highlights the existence of a critical management time window for enhancing C sinks (Figure 3b, Table 4). The peak in the C sequestration rate of the average model (ALM-seq) was at 15 yr, reaching 1.85 Mg·ha−1·yr−1. In contrast, the higher peak sequestration rates of all potential models occurred substantially earlier. For example, the highest peak rate of PLM1-seq of (3.78 Mg·ha−1·yr−1; 104.3% increase over the ALM) occurred in the 9th yr; that of PLM2-seq (3.38 Mg·ha−1·yr−1; 82.7% increase) was in the 7th yr; that for PLM3-seq (2.97 Mg·ha−1·yr−1; 60.5% increase) was in the 11th yr. These results for PLM1-seq and PLM2-seq indicate that sequestration efficiency can be rapidly enhanced by regulating site conditions and stand density. The results for PLM3-seq underscores the importance of early stand management for maximizing C sequestration rates.
Considered collectively, the above results underscore the considerable C sink enhancement potential for larch plantations in Heilongjiang Province (exceeding 20% at maturity). Furthermore, the results demonstrate the early growth stage (7 to 15 yr) to be the critical time window for implementing C enhancement management measures. Optimized management practices can allow significant improvement of both the timing and magnitude of C sequestration rates.
4. Discussion
4.1. Modeling Strategies and Mechanisms Underlying Differences in Model Accuracy
The observed differences in model accuracy, reflected by their respective goodness-of-fit statistics (Table 3), stem from their distinct methodological foundations designed to quantify different facets of carbon sink potential. The ALM (R2 = 0.5048, Table 3) provides a province-scale average C density trend for larch plantations. The identified accuracy performance of this model is consistent with the findings of Zeng et al. [47], who applied the model to Northeast China. Considered collectively, these results indicate that the ALM provides a robust representation of regional average C density. However, the substantial portion of the unexplained variation highlights the limitation of incorporating only stand age.
The assessment of the C sink potential of forest ecosystems provides a scientific foundation for the support of C neutrality strategies. However, current assessment methods vary significantly in their conceptual definitions and practical applications, making it difficult to use the estimations for the direct guidance of management practices. Previous studies have primarily followed three approaches: evaluating the “theoretical potential” based on ecophysiological processes or theoretical maximum biomass [10,11]; constructing “empirical upper boundary” models using data from high-yield forest stands [40]; and defining “statistical potential” using statistically extreme points, such as through the application of quantile regression. Although each of these methods has value, they all have two major limitations. First, they frequently rely on idealized assumptions or extreme samples, resulting in a divergence of the estimated potential from realistically achievable management conditions. Second, they often overlook the spatial heterogeneity of stand structure (e.g., density, site quality), resulting in models that lack responsiveness to key controllable factors and are difficult to translate into specific management measures [14,45]. The present study assessed C sink potential through the adoption of three distinct modeling strategies. PLM1 was constructed by selecting the samples with the highest C density within each stand age class to form an “empirical upper boundary”. This model achieved high accuracy (R2 = 0.7910), thereby demonstrating a cohort of stands with exceptional growth performance within the dataset, the growth trajectories of which effectively characterize theoretical potential. These results are consistent with those of a study of Dong et al. [40] on Mongolian pine plantations. However, this model is sensitive to extreme values and may overestimate the potential achievable on average site conditions. Although the construction of PLM1 was based on the operational threshold of selecting the “top three” plots, sensitivity analysis confirmed the robustness of its results, alleviating concerns that the method might introduce random bias. This suggests that the model captures the overall growth trends of superior stands within the data, rather than being dominated by individual outlier plots.
The introduction of stand factors as dummy variables allowed the PLM2 model to achieve the most significant improvement in accuracy (R2 = 0.7943). This result indicates that SCI and SDI collectively explain nearly 30% of the variation in C density, establishing their status as key drivers of C sink differentiation. Many previous related studies similarly concluded that ignoring stand heterogeneity is a major contributor to biased predictions [40,48]. The PLM2 sub-model, representing high site quality and high tree density (SCI III-SDI III), achieved improved accuracy performance. In addition, the parameter structure of this model showed increases in parameter a with increasing SCI/SDI grades, whereas parameter b remained stable. This finding is consistent with those of Duan et al. [49] and clearly characterizes the physio-ecological mechanisms enabling sites of high quality and high tree density to support greater C storage capacity. More specifically, ample water and nutrient resources, and associated higher initial tree density, are associated with high site quality drive accelerated early biomass accumulation by intensifying competition for light resources [50,51]. However, the underestimation by this model in relation to PLM1 reveals the constraints imposed by intra-specific competition, natural thinning, and resource limitations on the theoretical potential under practical management conditions [43]. Therefore, PLM2 is a more reliable tool for assessing the “practical maximum potential”.
While the PLM3 model (τ = 0.85) showed relatively poor accuracy performance (R2 = 0.1056), it nevertheless retains significant application value. The low accuracy performance metric of this model is reasonable and expected since the model focuses on the high-C-density tail of data, capturing the upper quantile trend rather than performing a global fit of the overall trend. Furthermore, the residual plot for PLM3 showed most observed values to lie below the predicted curve (Figure 2f), consistent with the expectation for an upper quantile (τ = 0.85) model. The residual plot acts as a visual confirmation of the widespread existence of C sink enhancement potential. This is because around 85% of the sample plots have C density levels below that of the superior stands. The comparable goodness-of-fit metrics of PLM3 to those of PLM1 and PLM2 (Table 2) (RMSE = 1.9919 Mg·ha−1, MAE = 1.6034 Mg·ha−1, Table 3) indicate that while PLM3 avoids the influence of extreme values, it smoothly captures the growth trend of the top 15% of superior stands within the overall dataset. PLM3 provides a robust representation of the growth trend potential of high-C-density stands. Therefore, the model is particularly suitable for assessing the upper limit of regional C sink potential and provides a reference with lower uncertainty for formulating C enhancement management strategies. The high application value of PLM3 was reinforced by the results of sensitivity analysis on the quantile point τ. The continuity and monotonicity of the parameters and predicted values with changes in τ demonstrated the stability of behavior in PLM3, showing that the model is insensitive to the quantile point. The selection of τ = 0.85 achieved an optimal balance between capturing trends and conservative estimation, thereby addressing potential concerns on the subjectivity of quantile point selection. These observations highlight the good applicability of PLM3 in scenarios requiring robust upper-bound assessments, such as C sink project planning and risk management. From an application perspective, PLM3 (τ = 0.85) corresponds to the top 15% of high-yield stands in the dataset. This model achieves a balance between the capture of upper-tail trends and the avoidance of overfitting, thereby providing a robust upper bound of potential. Its lower R2 value is consistent with the characteristics of upper-quantile models [33], and its utility lies in offering a smooth statistical upper bound for risk management reference. Prediction confidence intervals (Table 5) clarify the risk boundaries for application, enabling conservative planning and target setting by managers. The narrower interval of PLM3 reflects its robustness, while the wider intervals of PLM1 and PLM2 indicate greater growth variability. The stability of the models was confirmed by 10-fold cross-validation. PLM2 exhibited the most stable performance (with the smallest standard deviation of ΔC across folds, 1.24 Mg·ha−1), while the fluctuation of PLM3 was associated with its ability to capture upper-tail distributions, and its conclusion as a “robust upper bound” remains reliable.
4.2. Regulatory Effects of Site Quality and Stand Density on Carbon Sink Potential
The results of the present study provided a robust confirmation of site quality and stand density being the core manageable factors regulating the C sink function of plantations [26,52,53]. This conclusion is supported by the results of the dummy variable model, which showed that the combination of high site quality (SCI > 16 m) and high tree density (SDI > 800 trees·ha−1) can achieve a C stock of 78.61 Mg·ha−1, a significant increase relative to the average (64.13 Mg·ha−1) (Table 4). This finding is consistent with the conclusions of a study by Wang et al. [54] in which net primary productivity (NPP) was shown to increase with increasing site quality, as well as with those of Hu et al. [55] in which stand density was identified as the second most important factor influencing C density after mean DBH. Although the PLM2 model combining SCI and SDI achieved the highest accuracy (R2 = 0.7943), its improvement over the SDI-only model was limited. This suggests that, in practice, a simplified density-based model offers a cost-effective alternative without substantial accuracy loss, especially for routine monitoring or large-scale assessments where site index data are unavailable. These findings further support density as a key manageable factor in plantation carbon management.
Stand carbon sequestration dynamics are primarily controlled by the interplay between stand density and site conditions. This interplay critically shapes competition for key resources: stand density dictates the demand for light, water, and nutrients, while site conditions govern their supply. In high-density forests where intraspecific competition is intense, competition for light forces trees to adapt by prioritizing resource allocation to height growth, leading to an early peak in the C accumulation rate [50]. Conversely, the enhanced soil fertility and increased water availability associated with high site quality support increased tree biomass production [51]. However, the drawbacks for this accelerated growth include the potential for high-density stands to encounter resource limitations earlier, resulting in a phase of C accumulation saturation [26,53] or even a decline in growth due to intense competition [43]. The above understanding aligns with the ecological concept of intensified intraspecific competition [45], thereby explaining the reason for the earliest peaks in PLM2 (7 yr) and a final C stock slightly lower than that for PLM1 (79.86 Mg·ha−1). These results indicate the importance in C-oriented forest management to optimize the balance between resource competition and individual tree growth through density control at different developmental stages. Under this approach, the total C sink can be maximized over the entire rotation period. PLM2 represents the maximum C storage capacity achievable under favorable site resources and an appropriate stand structure. PLM2 provides higher predictive accuracy while reflecting the maximum C sink potential attainable in practical management through deliberate site selection and density regulation. Therefore, PLM2 can guide the optimization of plantation management strategies.
4.3. Management Implications and Application Prospects of the Potential Assessment
The results of the present study showed that C sink enhancement potential (C) of larch plantations at maturity (t = 60 yr) ranges between 13.26 and 15.73 Mg·ha−1 (Table 4), equating to an increase of over 20% relative to the current average C density. This result highlights the substantial scope for enhancing regional forest C sinks through rational management, and the further significant potential for fulfilling province-level C neutrality commitments [39,56]. The three potential models developed in the present study (PLM1, PLM2, PLM3) should not be regarded as substitutive, but rather as serving as differentiated complementary tools for different management scenarios. Therefore, the models collectively form a decision-support system from top-level design to implementation. The results of the present study indicate a potential C density at maturity (t = 60 yr) stabilizing at around 78 Mg·ha−1 (Table 4), consistent with the findings of Wang et al. [54] and Zhang et al. [57]. Specifically, since PLM1 defines the theoretical upper limit of C sink potential, it is suitable for supporting macro-strategic planning and the setting of long-term emission reduction targets [10]. However, the reliance of PLM1 on extreme data necessitates cautious reference in practical applications. PLM2 closely links C sink potential with measurable stand states (SCI > 16 m, SDI > 800 trees·ha−1). Therefore, PLM2 provides clear guidance for site selection in high-quality areas and structural optimization of existing plantations. Consequently, PLM2 is a key operational tool for achieving “precision C enhancement”. PLM3 provides a robust estimate of the potential upper bound of C sink potential, sharing conceptual similarities with the maximum entropy (MaxEnt) approach of Ma et al. [58], as both models aim to define “potential” from the tail of the data distribution. The insensitivity of PLM3 to outliers provide unique advantages in setting baselines for C sink projects and managing risks in C markets. However, the limitations of PLM3 include reduced explanatory power for extreme values, requiring validation alongside PLM1, and a degree of subjectivity in selecting the quantile point τ, necessitating verification with actual management data. To achieve the C sequestration potential of the PLM2 model (a high site-quality and high-density model), forest management should focus on three key stages: during afforestation, a higher initial planting density (2200–2500 trees·ha−1) should be used in high-quality sites (SCI > 16 m). The first thinning should be conducted 6–8 yr after afforestation, with removal of trees to adjust the SDI value from the competitive peak (>1200) to the optimal range (800–900 trees·ha−1); this would correspond to retaining approximately 65%–75% of the trees. The second thinning should be performed in 15–20 yr, further stabilizing the SDI at 600–700 to ensure mid- to late-stage growth. This “early and moderate” density management approach would enhance the operational feasibility of the potential targets. The robust upper-bound potential provided by the PLM3 model (τ = 0.85) would be applied primarily in C sequestration project development and financial risk management. In project development, its predicted values would serve as a scientific reference for setting baselines, strengthening the rigor of additionality arguments, while in risk management, this curve could act as an early warning line for project compliance or be used for conservative valuation of C financial products, thereby providing a reliable basis for risk-averse decision-making.
The analysis of the C sequestration rate curves (Figure 3b) in the present study highlights the existence of a critical management time window. Peak sequestration rates of all potential models were 60.5%–104.3% higher than the average, with all peaks occurring substantially earlier, between 7 and 11 yr after afforestation (Figure 3b, Table 4). These observations align with the development pattern of stand biomass potential productivity [59] and are supported by previous studies on C accumulation dynamics across different stand ages [60]. These findings highlight the importance of prioritizing management interventions earlier in the rotation. Specifically, stand structure optimization should be implemented within the first 15 yr after afforestation, with a focus on the high sequestration phase of 7–11 yr. This stand optimization can be achieved through practices such as thinning and fertilization to simultaneously enhance both the efficiency and duration of C sequestration. Furthermore, the observation of greater C sink potential of stands on higher quality sites is consistent with the variation pattern observed for potential volume productivity [61]. The combination of high site quality (SCI > 16 m) and high-density afforestation can achieve an additional C density gain of approximately 14.48 Mg·ha−1. This finding aligns closely with the outcomes of a study by Salekin et al. [62], in which C sequestration efficiency was observed to be strongly dependent on specific combinations of tree species, site conditions, and management regimes.
A robust and well-defined prediction of future C can support the estimation of revenue from C sink transactions, thereby incentivizing managers to implement early investments. Furthermore, timber of small- to medium-size diameter obtained from thinning can be utilized in short-cycle industries such as biomass energy, thereby achieving a synergy between C sink enhancement and economic benefits. This multi-model assessment approach transforms the theoretical concept of C sink “potential” into a set of quantifiable, scenario-specific decision-making tools, which can support integrated management from strategic planning to practical operations. Future research could further integrate process-based models and machine learning methods [63] for developing dynamic management strategies that couple climate responses with site factors, thereby advancing the implementation of climate-smart precision forest C management. The implementation of management procedures guided by PLM2 would require consideration of socioeconomic constraints, such as the costs of thinning/fertilization, various land tenure and management objectives, and policy continuity. PLM2 provides a benchmark for biophysical potential, and requires support from policies such as C markets, ecological compensation, and technical and training for its application. Future research should integrate biophysical models with cost–benefit analyses to identify feasible management strategies. A practical concern for plot-based modeling studies is the potential extension of the derived relationships to broader regions to support management and policy-making. The regional applicability of the proposed framework depends on both the representativeness of the sample plots and the availability of key input variables (SCI and SDI) at larger spatial scales. The permanent sample plots used in this study are distributed across major Larix olgensis plantation areas in Heilongjiang Province and include a wide range of site conditions and stand structures, providing a sound empirical basis for extrapolation to similar ecological regions in Northeast China. Notably, the core input variables are not limited to research plots but represent operational forestry indicators that can be obtained at regional scales. SCI, a reflection of site productivity, can be derived from existing forest site classification systems, soil and topographic datasets, and remote-sensing proxies related to vegetation productivity and climate. SDI can be calculated directly from forest inventory data or estimated using remote-sensing techniques such as LiDAR for the assessment of stand structure.
Linkage of the proposed models with spatially continuous SCI and SDI layers enables application of the framework at township, county, or provincial scales to map current C density and potential C sink enhancement (ΔC), identify management priority areas, and translate model thresholds (e.g., SCI > 16 m, SDI > 800 trees·ha−1) into spatially explicit guidance. Thus, the framework provides a scalable and practical tool for supporting precision forest management under China’s “Dual Carbon” goals.
4.4. From Potential Assessment to Precision Management: Application of the Multi-Model Approach
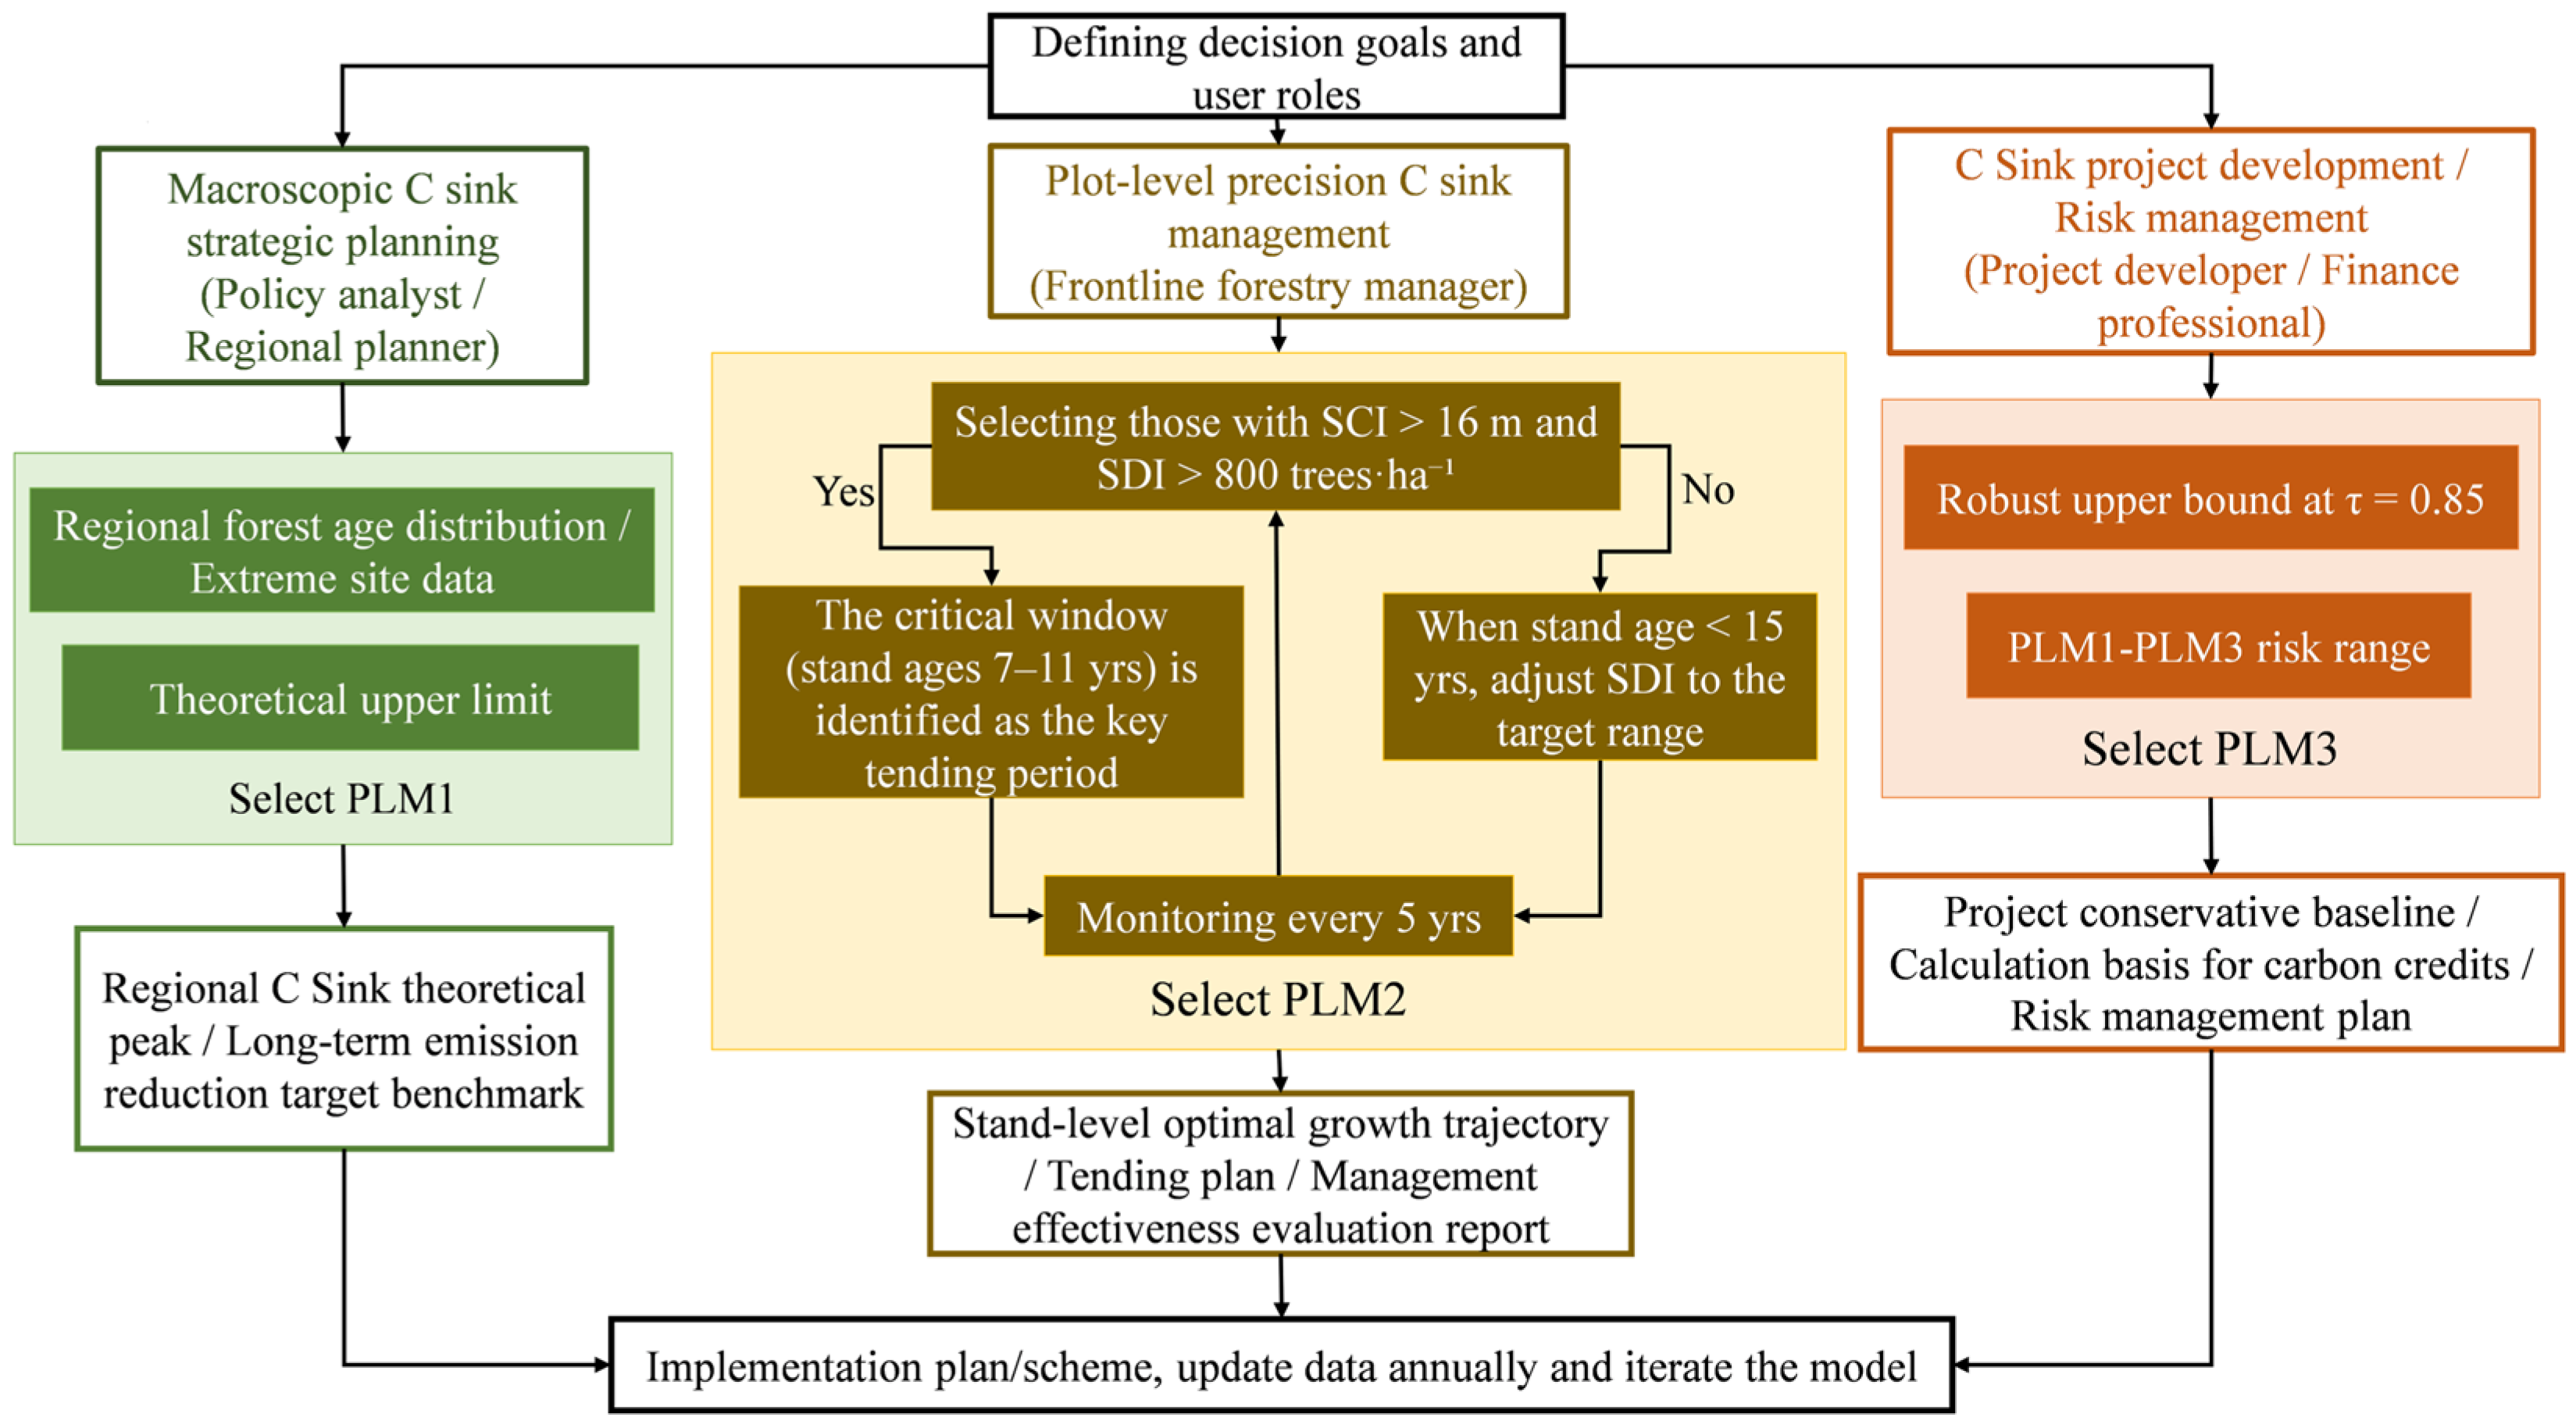
A comparison of the current study outcomes with related past domestic and international studies on C sink potential assessment highlights the methodological innovations and value proposition achieved in the present study. The range of C sink enhancement potential quantified in the present study (13.26–15.73 Mg·ha−1) aligns well with global estimates. Internationally, the range estimated in the current study falls within that reported for European temperate forests (10–30 Mg·ha−1) [64] and is consistent with global theoretical estimates [10]. This result confirms the competitive performance of larch plantations in Northeast China, being comparable to or higher than the long-term potential reported for Mongolian pine plantations (10–18 Mg·ha−1) [40], forests in Shaanxi Province (13.37 Mg·ha−1), and larch plantations in Liaoning Province (5–12 Mg·ha−1) [57]. The competitive performance of larch plantations in Heilongjiang Province highlights their potential for achieving national C neutrality goals. The present study provides a potential assessment based on permanent sample plot data, and is therefore a closer reflection of ground truth and offers higher resolution than alternative approaches. Therefore, the outcomes of the present study provide a more direct and readily applicable quantification tool for regional forest management, effectively complementing methods such as land use simulation [65], climate potential analysis [14], and ecophysiological process models [62,64]. The core conceptual contribution of the present study is the transition from “single value estimate” to “scenario-specific decision tools”. While most domestic and international studies provide an overall potential C sink value, the present study categorizes C sink potential into three distinct dimensions: theoretical potential (PLM1), achievable potential (PLM2), and robust potential (PLM3). By dividing potential into complementary dimensions, our multi-model assessment approach transforms a theoretical concept into an integrated decision toolbox, providing targeted tools for strategic (PLM1), operational (PLM2), and risk-aware (PLM3) contexts. The overriding conclusions of the present study of site quality and stand density being core factors regulating C sink potential, and there being no single optimal solution for C sequestration, are consistent with the established consensus of international studies such as Salekin et al. [62]. Furthermore, the present study operationalizes these concepts into concrete, actionable models and parameters (e.g., SCI > 16 m, SDI > 800 trees·ha−1). Thereby, the present study provides a scientifically sound and operational solution for promoting the strategic transition of forestry C sinks from “area expansion” to “efficiency enhancement”, effectively bridging the gap between theoretical potential and practical management. While PLM1, PLM2, and PLM3 are conceptually sound, their practical applications, especially in the presence of trade-offs, require clarification. Based on their characteristics and fitting effects, targeted strategies are proposed: (1) PLM1 for macro C sink planning (stable baseline); (2) PLM2 for on-site management (precise optimization via site/density); (3) PLM3 for risk assessment and selection of superior stands (C sink upper bound via quantile regression). A decision-support flowchart (Figure A1) illustrates the logic of model selection. PLM3 has a relatively low R2 at τ = 0.85, due to the focus of quantile regression on the upper tail of the C sink potential (superior stands) instead of the overall fitting accuracy. This does not invalidate PLM3 but reflects variability in the C sink of superior stands, consistent with regional Larix olgensis growth. In risk-averse scenarios, PLM3 is valuable as an upper-bound model, offering a conservative estimate of maximum C sink potential to avoid overestimation; its uncertainty bounds, consistent with the 95% confidence intervals shown in Figure 3a, clarify the degree of variation for decision support.
To further clarify the global and domestic application of the C sink potential of Larix olgensis plantations, the estimated ΔC value (13.26–15.73 Mg·ha−1) was compared with other major afforestation tree species or domestic and international forest types. Within China, this potential is significantly higher than that of larch plantations in Liaoning Province (5–12 Mg·ha−1, [19]) and the common increment of Mongolian pine forests in sandy areas. It is comparable to the high-yield stand potential of the Chinese fir (Cunninghamia lanceolata) in its core production regions (approximately 12–18 Mg·ha−1, [55]) and the C stock enhancement range of black locust (Robinia pseudoacacia) plantations on the Loess Plateau under optimized density conditions (approximately 10–15 Mg·ha−1, [52]). This indicates that Larix olgensis is a highly efficient C sink tree species in the temperate regions of China. In the context of global temperate plantations, the potential value estimated in this study falls within the range of C sink enhancement achievable through management in European temperate forests (10–30 Mg·ha−1, [64]) and is close to the median level of global theoretical potential estimates [10]. It also resembles the increased C accumulation observed in similar coniferous plantations (Douglas fir and loblolly pine) in North America under moderately intensive management, typically ranging from 10 to 20 Mg·ha−1. These comparisons collectively demonstrate that Larix olgensis plantations in Heilongjiang Province both have significant competitiveness and enhancement potential within the global temperate forest C sink system. The per-unit-area C sink enhancement potential (ΔC) observed in this study provides a key parameter for the quantification of management benefits at regional scales. Based on the total area of larch plantations in Heilongjiang Province, namely 1.0656 million hectares [38], if all stands achieve their “attainable potential” through precision management guided by this model system, this could theoretically add approximately 14.13 to 16.76 million metric tons of carbon to the regional forest carbon pool at maturity (60 yr), equivalent to approximately 51.8 to 61.5 million metric tons of CO2 equivalent (calculated based on a ΔC range of 13.26–15.73 Mg·ha−1). The size of this increased C sink is critical for Heilongjiang Province in fulfilling its C neutrality commitments and could also provide a greater contribution if this management framework were extended to similar forest regions nationwide. This clearly indicates that shifting from “area expansion” to science-based “quality and efficiency enhancement” is an effective and necessary means for unlocking the C sink potential of existing forest resources and supporting the national “dual-carbon” strategy.
4.5. Limitations, Management Implications, and Future Directions
The multi-model assessment approach developed in this study provides a systematic strategy for assessing the C sink potential of Larix olgensis plantations. Nevertheless, it represents a simplified abstraction of complex forest ecosystems. A clarification of its limitations is therefore essential for defining the scope of application and guiding future improvements. The ALM achieved a moderate goodness-of-fit (R2 ≈ 0.50, Table 3), consistent with the findings of similar regional studies [47]. Stand age alone explained half of the variation in C density, with residual heterogeneity from microclimate, soil properties, and past disturbances. While the incorporation of these covariates could improve model performance, difficulties arise in the availability of data and issues of collinearity. Future research could use remote sensing proxies or process-based models. The current ALM provides a pragmatic baseline for regional C sink assessment. Model predictions show increased deviation in the high carbon density range (Figure 2), with some high values tending to be underestimated. This is mainly attributed to: fewer samples in the high carbon density range (Table 1), leading to greater prediction uncertainty; PLM1 and PLM2 define a smooth envelope and do not fit extreme points; and PLM3 exhibits expected deviations due to inherent variability among superior stands. Based on the calibration data range (0.69–104.60 Mg·ha−1), the models are most reliable for predictions within 5–95 Mg·ha−1; caution is advised when applied beyond this range.
Although climate variables (e.g., temperature and precipitation) and disturbances (e.g., thinning and pest outbreaks) are widely recognized as important drivers of forest C dynamics, they were not explicitly included in the present multi-model assessment. This decision reflects a deliberate balance between ecological reasoning, statistical evidence, and management relevance. The SCI, derived from the dominant height at a reference age, acts as an integrated proxy for long-term climatic and edaphic conditions, as height growth represents a cumulative response to temperature, moisture, and nutrient availability. The inclusion of raw climate variables with the SCI would therefore introduce conceptual redundancy. Statistical analyses supported this choice, as no significant linear relationship was found between C density and mean annual temperature (r = −0.005, p = 0.90) or annual precipitation (r = 0.017, p = 0.63), and no multicollinearity was observed with SDI. At the provincial scale, the effects of climate on C density are likely to be indirect, non-linear, or already captured by SCI. From a management perspective, the multi-model assessment emphasizes controllable factors, such as SCI and SDI, and should be interpreted as a static management-oriented baseline under current climatic conditions rather than a dynamic climate-response model.
A key limitation of this study is the lack of an independent external validation dataset. The models were calibrated using the most comprehensive permanent sample plot dataset currently available for Larix olgensis plantations in Heilongjiang Province and were evaluated using C-density-stratified 10-fold cross-validation to reduce overfitting. However, spatial and temporal transferability beyond the calibration region should be assessed using independent datasets from adjacent regions or repeated plot measurements.
Uncertainty in C density estimates is associated with biomass allometric equations, stand-level aggregation, and fixed C concentration factors. These uncertainties are associated with the extrapolation of biomass estimation to C density, as well as the derivation of the C sink enhancement potential (ΔC) as the difference between potential- and average-level predictions. Prediction errors within the models can also contribute to the overall uncertainty. Although there was no calculation of explicit confidence or prediction intervals for CPLM and ΔC due to data limitations, established approaches such as Monte Carlo simulations, bootstrapping, or Bayesian hierarchical modeling could be applied in future investigations to quantify uncertainty.
The multi-model assessment accounts for total tree biomass (including roots) but excludes soil organic carbon and litter carbon, potentially underestimating the overall ecosystem C sink potential. In addition, the models were calibrated within a relatively homogeneous regional context, and caution is necessary if the results are extrapolated to regions with substantially different climatic, edaphic, or management conditions. Local recalibration of key parameters, particularly the SCI and SDI thresholds in PLM2, would be required.
Several operational choices in this study introduced unavoidable subjectivity, including the definition of the upper empirical boundaries (PLM1), threshold selection in dummy-variable models (PLM2), and the choice of quantile level (τ = 0.85) in PLM3. Sensitivity analyses indicated that the overall conclusions were not affected by reasonable variations in these choices; nevertheless, local ecological knowledge should inform their interpretation in different contexts.
Future studies could integrate remote-sensing and LiDAR data for spatial extrapolation and multi-carbon-pool assessment, integrate the multi-model assessment with process-based or machine-learning models to include climate and disturbance scenarios, and develop spatially explicit tools for decision support for precision forest management.
5. Conclusions
This study systematically compared and evaluated multiple models to quantify the C sink potential of larch plantations in Heilongjiang Province. The main conclusions are as follows:
- (1)
- The PLM2 model, integrating SDI and SCI, achieved the best accuracy performance (R2 = 0.7943). This result confirms that the optimization of site selection and stand structure is key for managing the C sink potential of plantations. While PLM3 (τ = 0.85) exhibited a lower accuracy performance, it provided a robust representation of the growth trend of superior stands, providing a reliable tool for risk assessment.
- (2)
- This study highlights the scope for significant C sink enhancement of larch plantations. At maturity (60 yr), the three potential models simulated C values in the range of 13.26 to 15.73 Mg·ha−1, equivalent to an increase of over 20% relative to the current average C density. This result underscores a substantial opportunity for improving C sequestration through targeted management.
- (3)
- The peak C sequestration rates of all potential models exceeded the average by 60.5% to 104.3%, with these peaks also occurring earlier, between 7 and 11 yr after afforestation. These findings emphasize the importance of the need to shift the time window of management measures. More specifically, the shift should occur from traditional mid-to-late rotation practices, which are often focused on timber production, to early and precise regulation aimed at maximizing C sequestration efficiency during this pivotal window.
- (4)
- The multi-model assessment approach proposed in this study transforms the theoretical concept of C sink potential into practical decision-making tools for various management scenarios. PLM1 defines the theoretical potential, suitable for national and provincial macro-strategic planning; PLM2 links potential to specific, measurable stand states (SCI > 16 m, SDI > 800 trees·ha−1), providing precise guidance for afforestation planning and the silvicultural management of existing plantations; PLM3 can guide the development of C sink projects and risk management in C finance markets. The multi-model assessment approach provides an operable solution for achieving precision C enhancement, bridging the gap from macro-level potential understanding to the implementation of plot-level management measures.
This study confirms the substantial C sequestration potential of Heilongjiang Province’s larch plantations and provides a precision enhancement multi-model assessment approach covering theory, methodology and practice. Future work could integrate remote sensing, process-based models or machine learning to incorporate climate change and disturbance risks, thereby developing adaptive management strategies. This will enable sustained improvement in plantation ecosystem services and provide more resilient scientific support for the national “Dual Carbon” strategy.
Author Contributions
Conceptualization, Y.Z. and W.W.; methodology, Y.Z. and W.W.; software, Y.Z., X.H. and H.L.; validation, Y.Z., Q.W. and W.W.; formal analysis, Y.Z., L.Z. and W.W.; investigation, X.H., H.L., Q.W., J.O. and L.Z.; resources, Q.W. and W.W.; data curation, Y.Z., H.L., J.O., L.Z. and W.W.; writing—original draft preparation, Y.Z.; writing—review and editing, X.H. and W.W.; visualization, Y.Z. and W.W.; supervision, W.W.; project administration, W.W.; funding acquisition, W.W. All authors have read and agreed to the published version of the manuscript.
Funding
This research was funded by the National Natural Science Foundation of China, grant number 32271867.
Data Availability Statement
The data presented in this study are available on request from the corresponding author.
Acknowledgments
The authors would like to thank the faculty and students of the Department of Forest Management at Northeast Forestry University (NEFU), China, for their assistance in providing and collecting the data for this research.
Conflicts of Interest
The authors declare no conflicts of interest.
Appendix A
Table A1.
Detailed 10-fold cross-validation results of (e) predictions for the three potential models (PLM1, PLM2, and PLM3).
Table A2.
Cross-validation summary statistics of (e) predictions for the three potential models (PLM1, PLM2, and PLM3).
Figure A1.
Operational Guide and Decision-Support Protocol for Applying the Multi-Model Approach.
References
- Pan, Y.; Birdsey, R.A.; Fang, J.; Houghton, R.; Kauppi, P.E.; Kurz, W.A.; Phillips, O.L.; Shvidenko, A.; Lewis, S.L.; Canadell, J.G.; et al. A Large and Persistent Carbon Sink in the World’s Forests. Science 2011, 333, 988–993. [Google Scholar] [CrossRef] [Scilit]
- Wani, A.A.; Joshi, P.K.; Singh, O. Estimating Biomass and Carbon Mitigation of Temperate Coniferous Forests Using Spectral Modeling and Field Inventory Data. Ecol. Inform. 2015, 25, 63–70. [Google Scholar] [CrossRef] [Scilit]
- Yu, Z.; Liu, S.; Li, H.; Liang, J.; Liu, W.; Piao, S.; Tian, H.; Zhou, G.; Lu, C.; You, W.; et al. Maximizing Carbon Sequestration Potential in Chinese Forests through Optimal Management. Nat. Commun. 2024, 15, 3154. [Google Scholar] [CrossRef] [Scilit]
- Fang, J.; Guo, Z.; Hu, H.; Kato, T.; Muraoka, H.; Son, Y. Forest Biomass Carbon Sinks in East Asia, with Special Reference to the Relative Contributions of Forest Expansion and Forest Growth. Glob. Change Biol. 2014, 20, 2019–2030. [Google Scholar] [CrossRef] [Scilit]
- Gundersen, P.; Thybring, E.E.; Nord-Larsen, T.; Vesterdal, L.; Nadelhoffer, K.J.; Johannsen, V.K. Old-Growth Forest Carbon Sinks Overestimated. Nature 2021, 591, E21–E23. [Google Scholar] [CrossRef] [Scilit]
- Li, H. Research progress on forest carbon sink assessment methods and carbon sequestration potential prediction under the vision of carbon neutrality. Geol. Surv. China 2021, 8, 79–86. (In Chinese) [Google Scholar] [CrossRef]
- Yao, L.; Liu, T.; Qin, J.; Jiang, H.; Yang, L.; Smith, P.; Chen, X.; Zhou, C.; Piao, S. Carbon Sequestration Potential of Tree Planting in China. Nat. Commun. 2024, 15, 8398. [Google Scholar] [CrossRef] [Scilit] [PubMed]
- Bradford, J.B.; Jensen, N.R.; Domke, G.M.; D’Amato, A.W. Potential Increases in Natural Disturbance Rates Could Offset Forest Management Impacts on Ecosystem Carbon Stocks. For. Ecol. Manag. 2013, 308, 178–187. [Google Scholar] [CrossRef] [Scilit]
- Qin, J.; Liu, P.; Martin, A.R.; Wang, W.; Lei, Y.; Li, H. Forest Carbon Storage and Sink Estimates under Different Management Scenarios in China from 2020 to 2100. Sci. Total Environ. 2024, 927, 172076. [Google Scholar] [CrossRef] [Scilit]
- Cannell, M.G.R. Carbon Sequestration and Biomass Energy Offset: Theoretical, Potential and Achievable Capacities Globally, in Europe and the UK. Biomass Bioenergy 2003, 24, 97–116. [Google Scholar] [CrossRef] [Scilit]
- Keith, H.; Mackey, B.G.; Lindenmayer, D.B. Re-Evaluation of Forest Biomass Carbon Stocks and Lessons from the World’s Most Carbon-Dense Forests. Proc. Natl. Acad. Sci. USA 2009, 106, 11635–11640. [Google Scholar] [CrossRef] [Scilit]
- Keith, H.; Mackey, B.; Berry, S.; Lindenmayer, D.; Gibbons, P. Estimating Carbon Carrying Capacity in Natural Forest Ecosystems across Heterogeneous Landscapes: Addressing Sources of Error. Glob. Change Biol. 2010, 16, 2971–2989. [Google Scholar] [CrossRef] [Scilit]
- Hennigar, C.; Weiskittel, A.; Allen, H.L.; MacLean, D.A. Development and Evaluation of a Biomass Increment Based Index for Site Productivity. Can. J. For. Res. 2017, 47, 400–410. [Google Scholar] [CrossRef] [Scilit]
- Peng, B.; Zhou, Z.; Cai, W.; Li, M.; Xu, L.; He, N. Maximum Potential of Vegetation Carbon Sink in Chinese Forests. Sci. Total Environ. 2023, 905, 167325. [Google Scholar] [CrossRef] [Scilit]
- Bera, D.; Das Chatterjee, N. Exploring the Variations and Potential of Carbon Stock in the Tropical Dry Deciduous Forests of West Bengal, India. J. For. Res. 2025, 30, 328–338. [Google Scholar] [CrossRef] [Scilit]
- Yu, G.; Zhu, J.; Xu, L.; He, N. Technological pathways for enhancing the carbon sink function of ecosystems in China: Nature-based solutions. Bull. Chin. Acad. Sci. 2022, 37, 490–501. (In Chinese) [Google Scholar] [CrossRef]
- Fatichi, S.; Pappas, C.; Zscheischler, J.; Leuzinger, S. Modelling Carbon Sources and Sinks in Terrestrial Vegetation. New Phytol. 2019, 221, 652–668. [Google Scholar] [CrossRef] [Scilit]
- Bai, Y.; Pang, Y.; Kong, D. Integrating Remote Sensing and 3-PG Model to Simulate the Biomass and Carbon Stock of Larix olgensis Plantation. For. Ecosyst. 2024, 11, 100213. [Google Scholar] [CrossRef] [Scilit]
- Zhang, C.; Li, H.; Wang, X.; Liu, P.; Liu, Q.; Zhan, S. Forest Carbon Storage in China from 2003 to 2021: Estimation Based on the Volume-Derived Carbon Storage Model with Scale-Compatible and Tree Species-Merged. For. Ecol. Manag. 2025, 578, 122483. [Google Scholar] [CrossRef] [Scilit]
- Huang, R.; Zhu, W.; Du, A.; Xu, Y.; Wang, Z. Stand Age Affects Biomass Allocation and Allometric Models for Biomass Estimation: A Case Study of Two Eucalypts Hybrids. Forests 2025, 16, 193. [Google Scholar] [CrossRef] [Scilit]
- Neilson, E.T.; MacLean, D.A.; Meng, F.-R.; Arp, P.A. Spatial Distribution of Carbon in Natural and Managed Stands in an Industrial Forest in New Brunswick, Canada. For. Ecol. Manag. 2007, 253, 148–160. [Google Scholar] [CrossRef] [Scilit]
- Smeglin, Y.H.; Davis, K.J.; Shi, Y.; Eissenstat, D.M.; Kaye, J.P.; Kaye, M.W. Observing and Simulating Spatial Variations of Forest Carbon Stocks in Complex Terrain. J. Geophys. Res. Biogeosciences 2020, 125, e2019JG005160. [Google Scholar] [CrossRef] [Scilit]
- Dong, L.; Lin, X.; Bettinger, P.; Liu, Z. The Contributions of Stand Characteristics on Carbon Sequestration Potential Are Triple That of Climate Variables for Larix spp. Plantations in Northeast China. Sci. Total Environ. 2024, 911, 168726. [Google Scholar] [CrossRef] [Scilit]
- Zald, H.S.J.; Spies, T.A.; Seidl, R.; Pabst, R.J.; Olsen, K.A.; Steel, E.A. Complex Mountain Terrain and Disturbance History Drive Variation in Forest Aboveground Live Carbon Density in the Western Oregon Cascades, USA. For. Ecol. Manag. 2016, 366, 193–207. [Google Scholar] [CrossRef] [Scilit]
- Zhai, L.; Zan, M.; Ye, M.; Zhou, J.; Xue, C.; Yang, S.; Liu, Y. Time-Series Forest Age Estimation in Xinjiang Based on Forest Disturbance and Recovery Detection. Ecol. Indic. 2025, 170, 113043. [Google Scholar] [CrossRef] [Scilit]
- Du, Y. Carbon Storage Allocation Characteristics of Platycladus orientalis Plantation Ecosystem with Different Densities. Glob. NEST J. 2020, 22, 592–602. [Google Scholar] [CrossRef] [Scilit]
- Chen, Z.; Zan, M.; Yang, X.; Dong, Y. Prediction of Forest Vegetation Carbon Storage in Xinjiang, China. Ecol. Environ. Sci. 2023, 32, 226–234. (In Chinese) [Google Scholar] [CrossRef]
- Crecente-Campo, F.; Marshall, P.; LeMay, V.; Dieguez-Aranda, U. A Crown Profile Model for Pinus radiata D. Don in Northwestern Spain. For. Ecol. Manag. 2009, 257, 2370–2379. [Google Scholar] [CrossRef] [Scilit]
- Weiskittel, A.R.; Hann, D.W.; Kershaw, J.A.J.; Vanclay, J.K. Forest Growth and Yield Modeling; John Wiley & Sons: Chichester, UK, 2011; p. 285. [Google Scholar]
- Geraci, M.; Bottai, M. Quantile Regression for Longitudinal Data Using the Asymmetric Laplace Distribution. Biostatistics 2006, 8, 140–154. [Google Scholar] [CrossRef] [Scilit]
- Mehtaetalo, L.; Gregoire, T.G.; Burkhart, H.E. Comparing Strategies for Modeling Tree Diameter Percentiles from Remeasured Plots. Environmetrics 2008, 19, 529–548. [Google Scholar] [CrossRef] [Scilit]
- Ducey, M.J. The Ratio of Additive and Traditional Stand Density Indices. West. J. Appl. For. 2009, 24, 5–10. [Google Scholar] [CrossRef] [Scilit]
- Bohora, S.B.; Cao, Q.V. Prediction of Tree Diameter Growth Using Quantile Regression and Mixed-Effects Models. For. Ecol. Manag. 2014, 319, 62–66. [Google Scholar] [CrossRef] [Scilit]
- Cao, Q.V.; Wang, J. Evaluation of Methods for Calibrating a Tree Taper Equation. For. Sci. 2015, 61, 213–219. [Google Scholar] [CrossRef] [Scilit]
- Zang, H.; Lei, X.; Zeng, W. Height-Diameter Equations for Larch Plantations in Northern and Northeastern China: A Comparison of the Mixed-Effects, Quantile Regression and Generalized Additive Models. Forestry 2016, 89, 434–445. [Google Scholar] [CrossRef] [Scilit]
- Wang, T.; Xie, L.; Miao, Z.; Widagdo, F.R.A.; Dong, L.; Li, F. Stand Volume Growth Modeling with Mixed-Effects Models and Quantile Regressions for Major Forest Types in the Eastern Daxing’an Mountains, Northeast China. Forests 2021, 12, 1111. [Google Scholar] [CrossRef] [Scilit]
- Miao, Z.; Li, F.; Zhao, X.; Jiang, Y.; Dong, L. Utilizing Quantile Regressions to Predict Vertical Distribution of Branch Size in Larix olgensis Henry: Capturing the Differentiated Responses of Varying Branch Sizes to Stand and Tree Factors. For. Ecosyst. 2025, 13, 100300. [Google Scholar] [CrossRef] [Scilit]
- National Forestry and Grassland Administration. China Forest Resources Report(2014–2018); China Forestry Publishing House: Beijing, China, 2019. (In Chinese) [Google Scholar]
- Reineke, L.H. Perfecting a Stand-Density Index for Even-Aged Forests. J. Agric. Res. 1933, 46, 627–638. [Google Scholar]
- Dong, J.; Li, G.; Liu, D.; Wang, W.; Jiang, L. Use of a Carbon Density Growth Model to Assess the Potential Carbon Sink Function of a Mongolian Pine Plantation in Heilongjiang Province, Northeast China. Forests 2024, 15, 2073. [Google Scholar] [CrossRef] [Scilit]
- Dong, L. Compatible Biomass Models of Main Tree Species in Heilongjiang Province. Master’s Thesis, Northeast Forestry University, Harbin, China, 2012. (In Chinese) [Google Scholar]
- Yang, G. Study on Distribution and Dynamics of Forest Carbon Storage in Heilongjiang Province; Northeast Forestry University Press: Harbin, China, 2016. (In Chinese) [Google Scholar]
- Zhao, B.; Zhu, Y.; Gao, L.; Zhang, Q.; Liu, M.; von Gadow, K. Tree Growth Decline to Warm-Wet Conditions in Boreal Forests Is Linked to Stand Density. For. Ecosyst. 2025, 12, 100266. [Google Scholar] [CrossRef] [Scilit]
- Dong, L.; Chen, G.; Chung, W.; Liu, Z. Variations on the Maximum Density-Size Lines to Climate and Site Factors for Larix spp. Plantations in Northeast China. Ecol. Model. 2024, 498, 110913. [Google Scholar] [CrossRef] [Scilit]
- Castedo-Dorado, F.; Gómez-García, E.; Diéguez-Aranda, U.; Barrio-Anta, M.; Crecente-Campo, F. Aboveground Stand-Level Biomass Estimation: A Comparison of Two Methods for Major Forest Species in Northwest Spain. Ann. For. Sci. 2012, 69, 735–746. [Google Scholar] [CrossRef] [Scilit]
- Li, H.; Zhao, P. Improving the Accuracy of Tree-Level Aboveground Biomass Equations with Height Classification at a Large Regional Scale. For. Ecol. Manag. 2013, 289, 153–163. [Google Scholar] [CrossRef] [Scilit]
- Zeng, W. Development of growth models for carbon storage and analysis of carbon sequestration capacity of larch forests in Northeast China. For. Resour. Manag. 2022, 1, 18–23. (In Chinese) [Google Scholar] [CrossRef]
- Arias-Rodil, M.; Crecente-Campo, F.; Barrio-Anta, M.; Diéguez-Aranda, U. Evaluation of Age-Independent Methods of Estimating Site Index and Predicting Height Growth: A Case Study for Maritime Pine in Asturias (NW Spain). Eur. J. For. Res. 2015, 134, 223–233. [Google Scholar] [CrossRef] [Scilit]
- Duan, G.; Lei, X.; Zhang, X.; Liu, X. Site Index Modeling of Larch Using a Mixed-Effects Model across Regional Site Types in Northern China. Forests 2022, 13, 815. [Google Scholar] [CrossRef] [Scilit]
- Adame, P.; del Río, M.; Cañellas, I. A Mixed Nonlinear Height–Diameter Model for Pyrenean Oak (Quercus pyrenaica Willd.). For. Ecol. Manag. 2008, 256, 88–98. [Google Scholar] [CrossRef] [Scilit]
- Gizachew, B.; Brunner, A. Density-Growth Relationships in Thinned and Unthinned Norway Spruce and Scots Pine Stands in Norway. Scand. J. For. Res. 2011, 26, 543–554. [Google Scholar] [CrossRef] [Scilit]
- Hu, Y.; Zhao, J.; Li, Y.; Tang, P.; Yang, Z.; Zhang, J.; Sun, R. Biomass and Carbon Stock Capacity of Robinia pseudoacacia Plantations at Different Densities on the Loess Plateau. Forests 2024, 15, 1242. [Google Scholar] [CrossRef] [Scilit]
- Chen, H.; Zhang, Z.; Yang, X.; Ai, X.; Wang, Y.; Liu, P. Effects of Forest Age and Stand Density on the Growth, Soil Moisture Content, and Soil Carbon Content of Populus simoni Plantations in the Sandy Area of Western Liaoning, Northeast China. Sci. Rep. 2025, 15, 2499. [Google Scholar] [CrossRef] [Scilit]
- Wang, B.; Li, M.; Fan, W.; Yu, Y.; Chen, J.M. Relationship between Net Primary Productivity and Forest Stand Age under Different Site Conditions and Its Implications for Regional Carbon Cycle Study. Forests 2018, 9, 5. [Google Scholar] [CrossRef] [Scilit]
- Hu, R.; Guo, Y.; Ouyang, X.; Liu, J.; Pan, P. Spatial distribution pattern of carbon density in Cunninghamia lanceolata forest in central Jiangxi and its influencing factors. Chin. J. Ecol. 2025, 44, 365–372. (In Chinese) [Google Scholar] [CrossRef]
- Li, Q.; Xia, X.; Kou, X.; Niu, L.; Wan, F.; Zhu, J.; Xiao, W. Forest Carbon Storage and Carbon Sequestration Potential in Shaanxi Province, China. Forests 2023, 14, 2021. [Google Scholar] [CrossRef] [Scilit]
- Zhang, Y.; Xia, M.; Zhou, W.; Zhou, L.; Wu, Z.; Ding, L.; Yong, H.; Yu, D. Carbon sink status and potential of existing management patterns of larch plantations in Liaoning Province. Chin. J. Appl. 2025, 36, 771–779. (In Chinese) [Google Scholar] [CrossRef] [Scilit]
- Ma, Y.; Han, L.; Wang, N.; Ma, J.; Wang, Y.; Ma, S. Changes in potential suitable habitat and carbon sequestration potential of Robinia pseudoacacia plantations under climate change scenarios. J. Soil Water Conserv. 2025, 39, 260–268. [Google Scholar] [CrossRef]
- Yan, X.; Feng, L.; Sharma, R.P.; Duan, G.; Pang, L.; Fu, L.; Guo, J. Evaluating Forest Site Quality Using the Biomass Potential Productivity Approach. Forests 2024, 15, 23. [Google Scholar] [CrossRef] [Scilit]
- Li, X.; Ramos Aguila, L.C.; Wu, D.; Lie, Z.; Xu, W.; Tang, X.; Liu, J. Carbon Sequestration and Storage Capacity of Chinese Fir at Different Stand Ages. Sci. Total Environ. 2023, 904, 166962. [Google Scholar] [CrossRef] [Scilit]
- Liu, X.; Duan, G.; Chhin, S.; Lei, X.; Wang, D.; Zhang, X. Evaluation of Potential versus Realized Site Productivity of Larix principis-rupprechtii Plantations across Northern China. For. Ecol. Manag. 2021, 479, 118608. [Google Scholar] [CrossRef] [Scilit]
- Salekin, S.; Dickinson, Y.L.; Bloomberg, M.; Meason, D.F. Carbon Sequestration Potential of Plantation Forests in New Zealand—No Single Tree Species Is Universally Best. Carbon Balance Manag. 2024, 19, 11. [Google Scholar] [CrossRef] [Scilit] [PubMed]
- Natel, C.; Belda, D.M.; Anthoni, P.; Haß, N.; Rabin, S.; Arneth, A. Emulating Grid-Based Forest Carbon Dynamics Using Machine Learning: An LPJ-GUESS v4.1.1 Application. Geosci. Model Dev. 2025, 18, 4317–4333. [Google Scholar] [CrossRef] [Scilit]
- Naudts, K.; Chen, Y.; McGrath, M.J.; Ryder, J.; Valade, A.; Otto, J.; Luyssaert, S. Europe’s Forest Management Did Not Mitigate Climate Warming. Science 2016, 351, 597–600. [Google Scholar] [CrossRef] [Scilit]
- Chou, J.; Hao, Y.; Xu, Y.; Zhao, W.; Li, Y.; Jin, H. Forest Carbon Sequestration Potential in China under Different SSP-RCP Scenarios. Sustainability 2023, 15, 7275. [Google Scholar] [CrossRef] [Scilit]
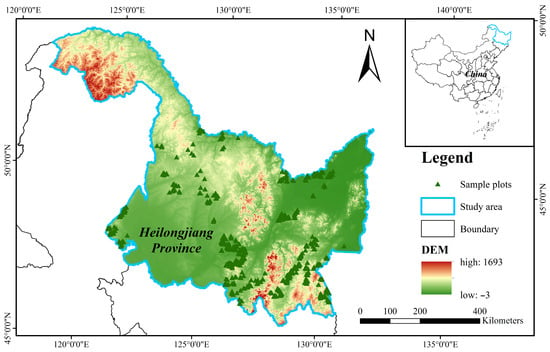
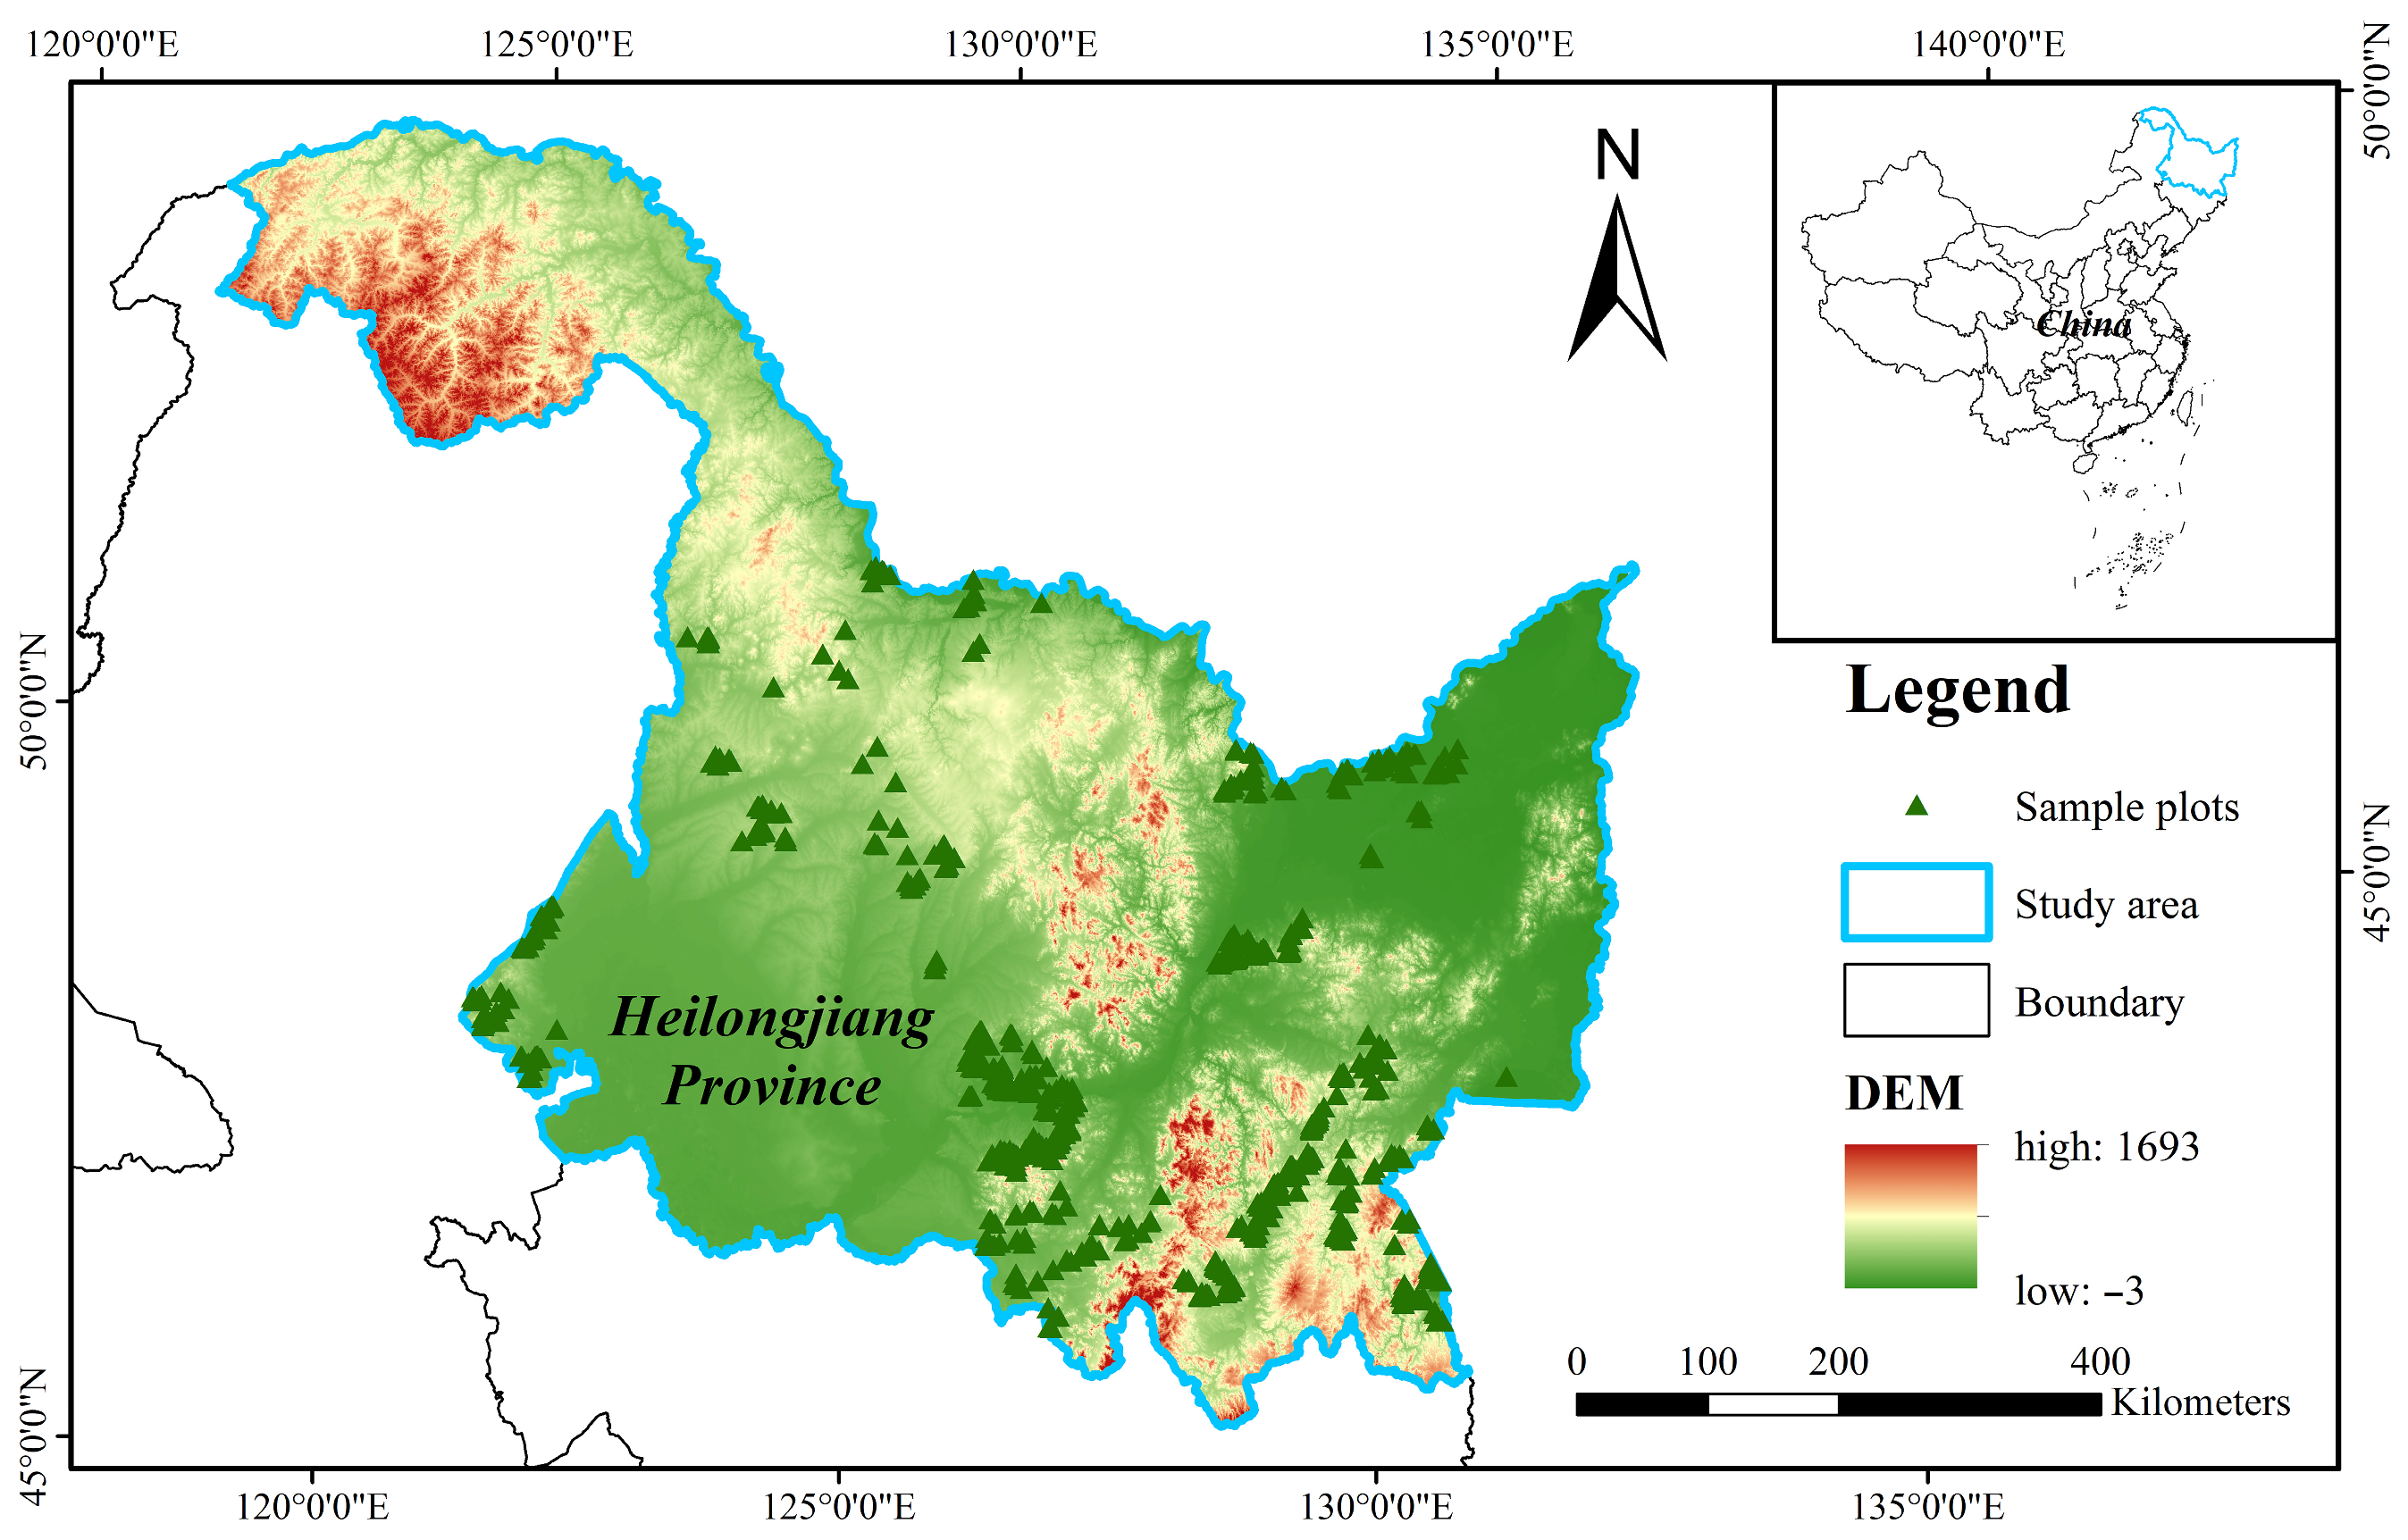
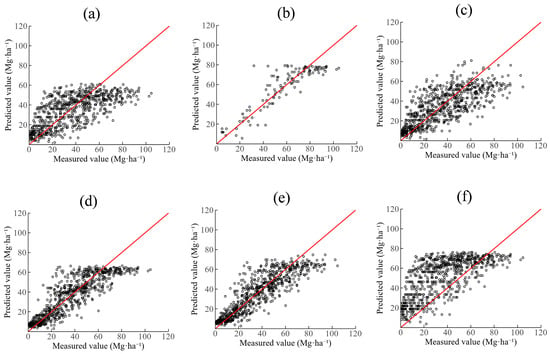
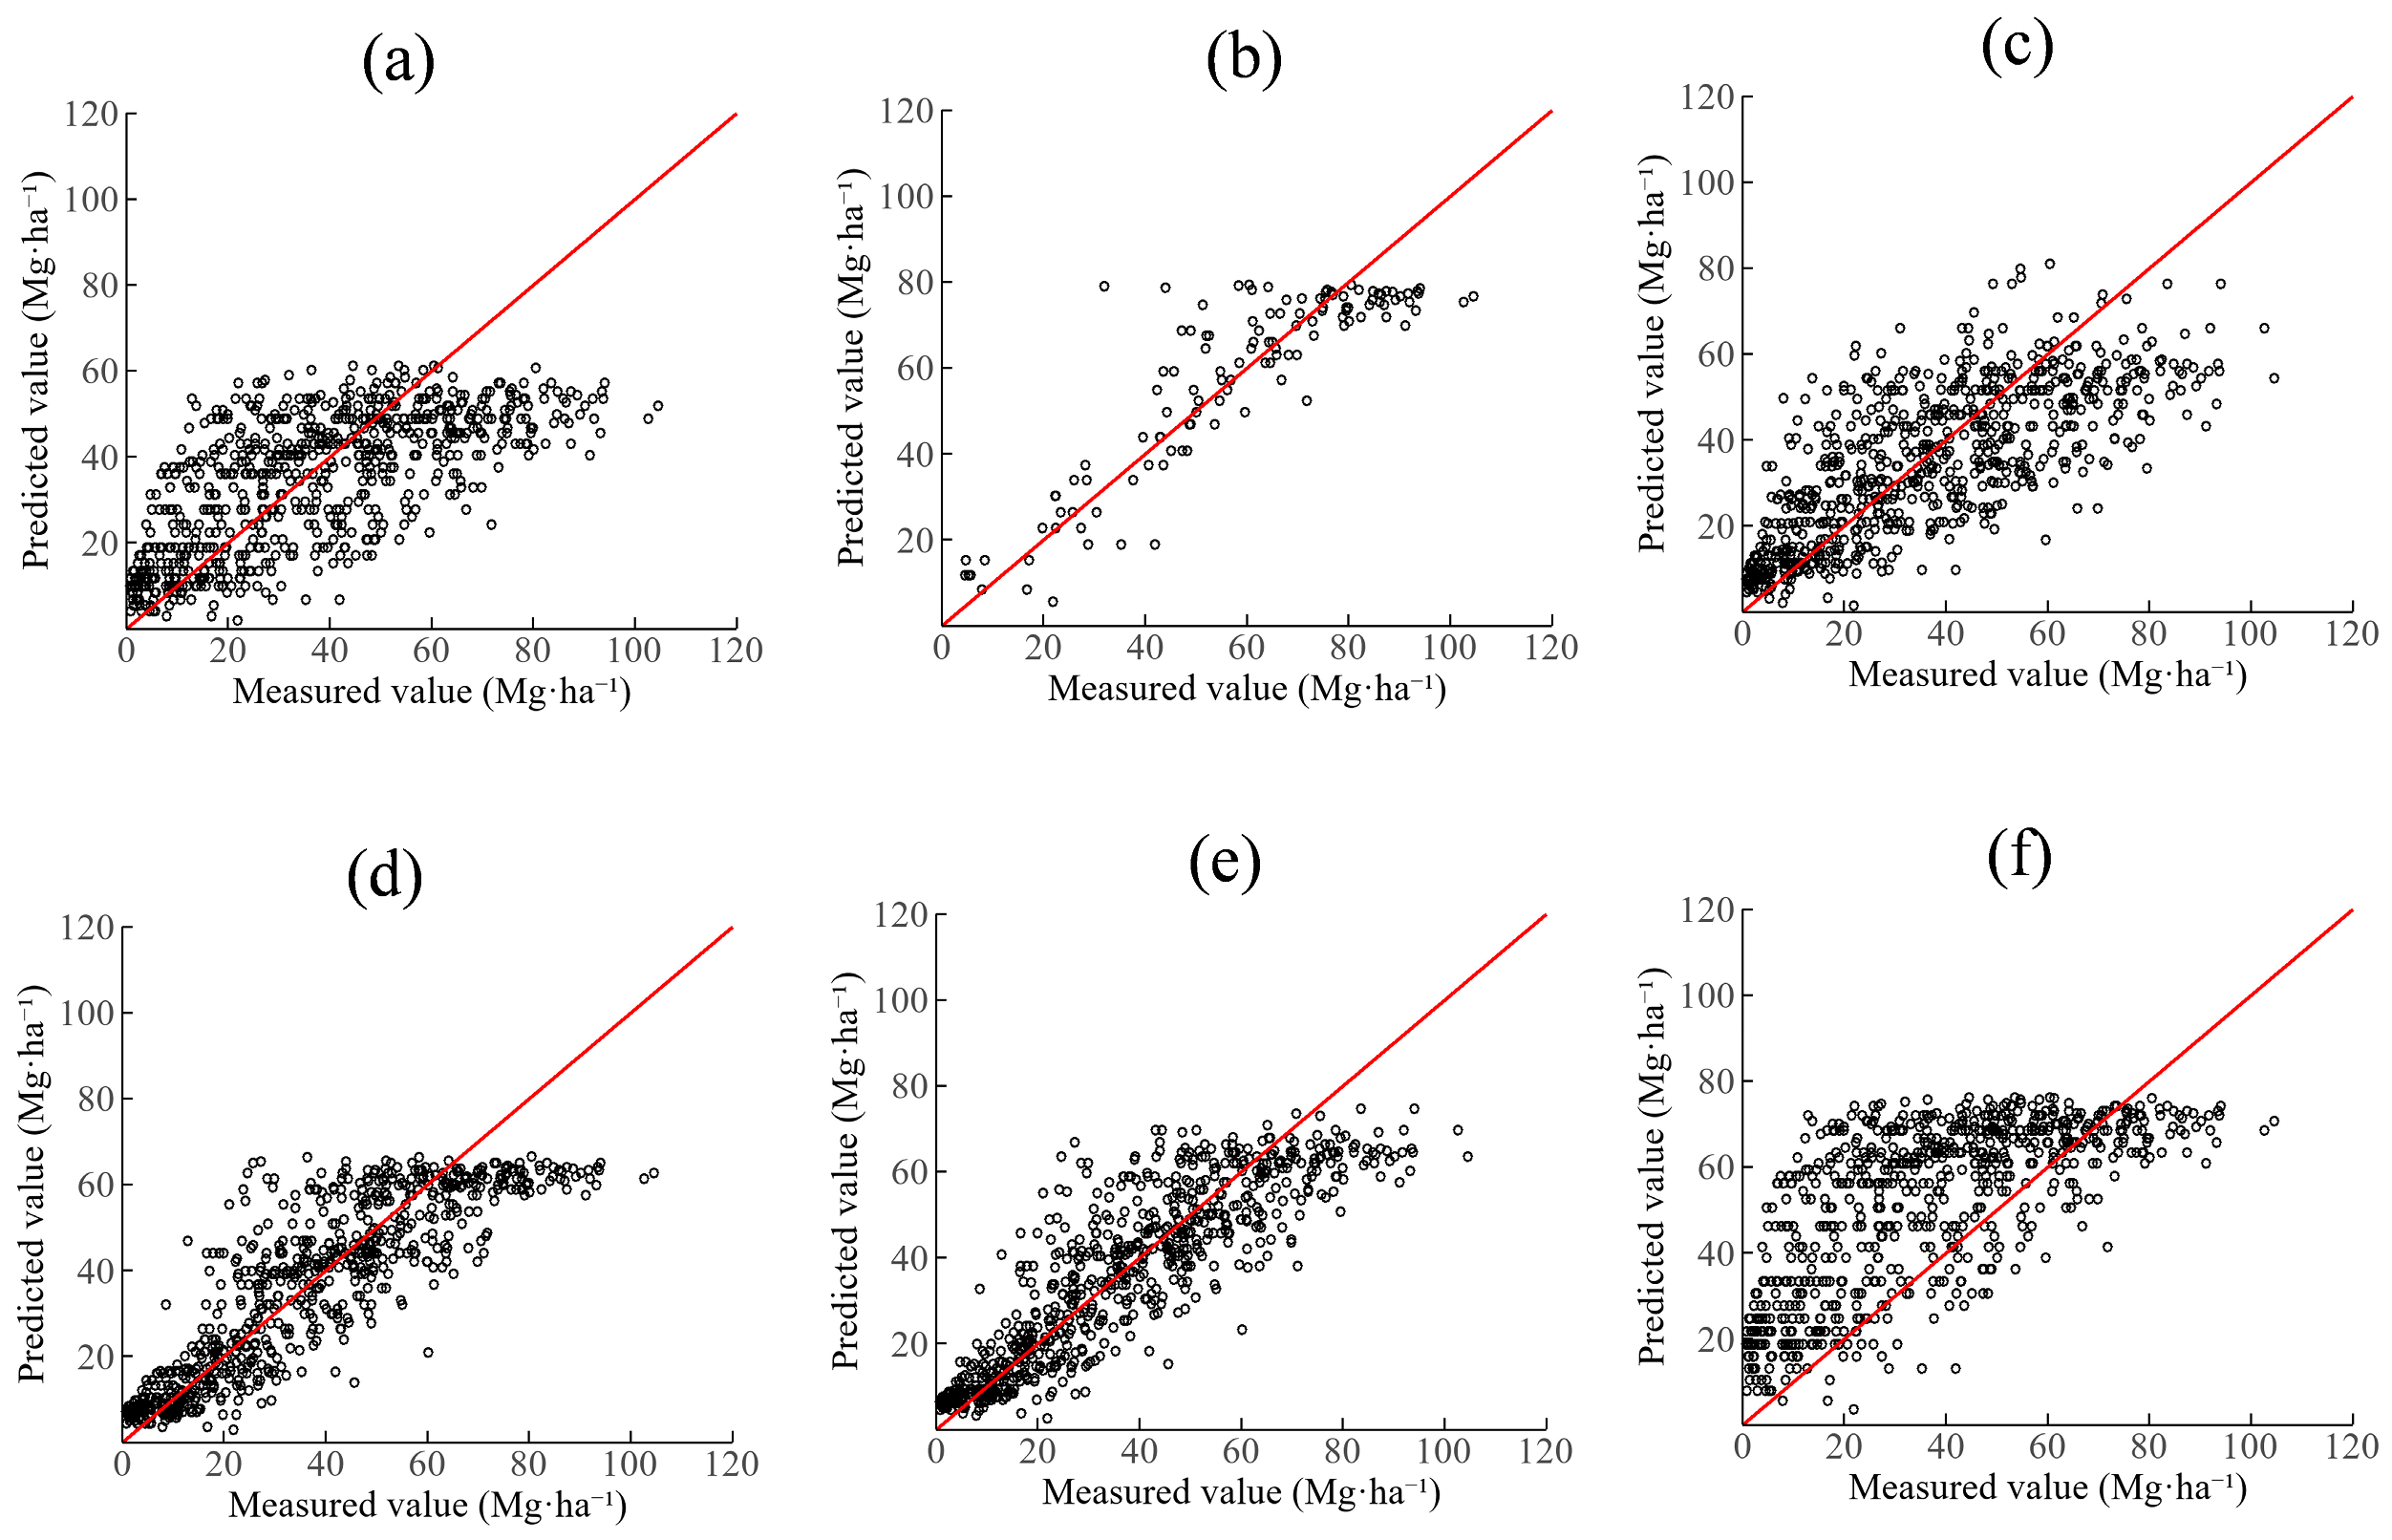
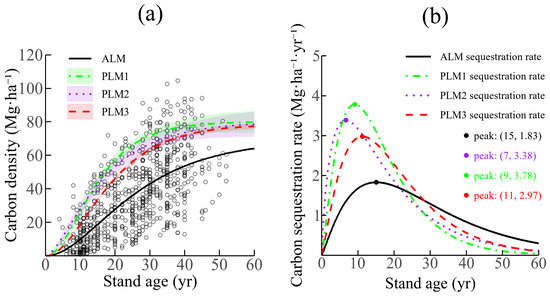
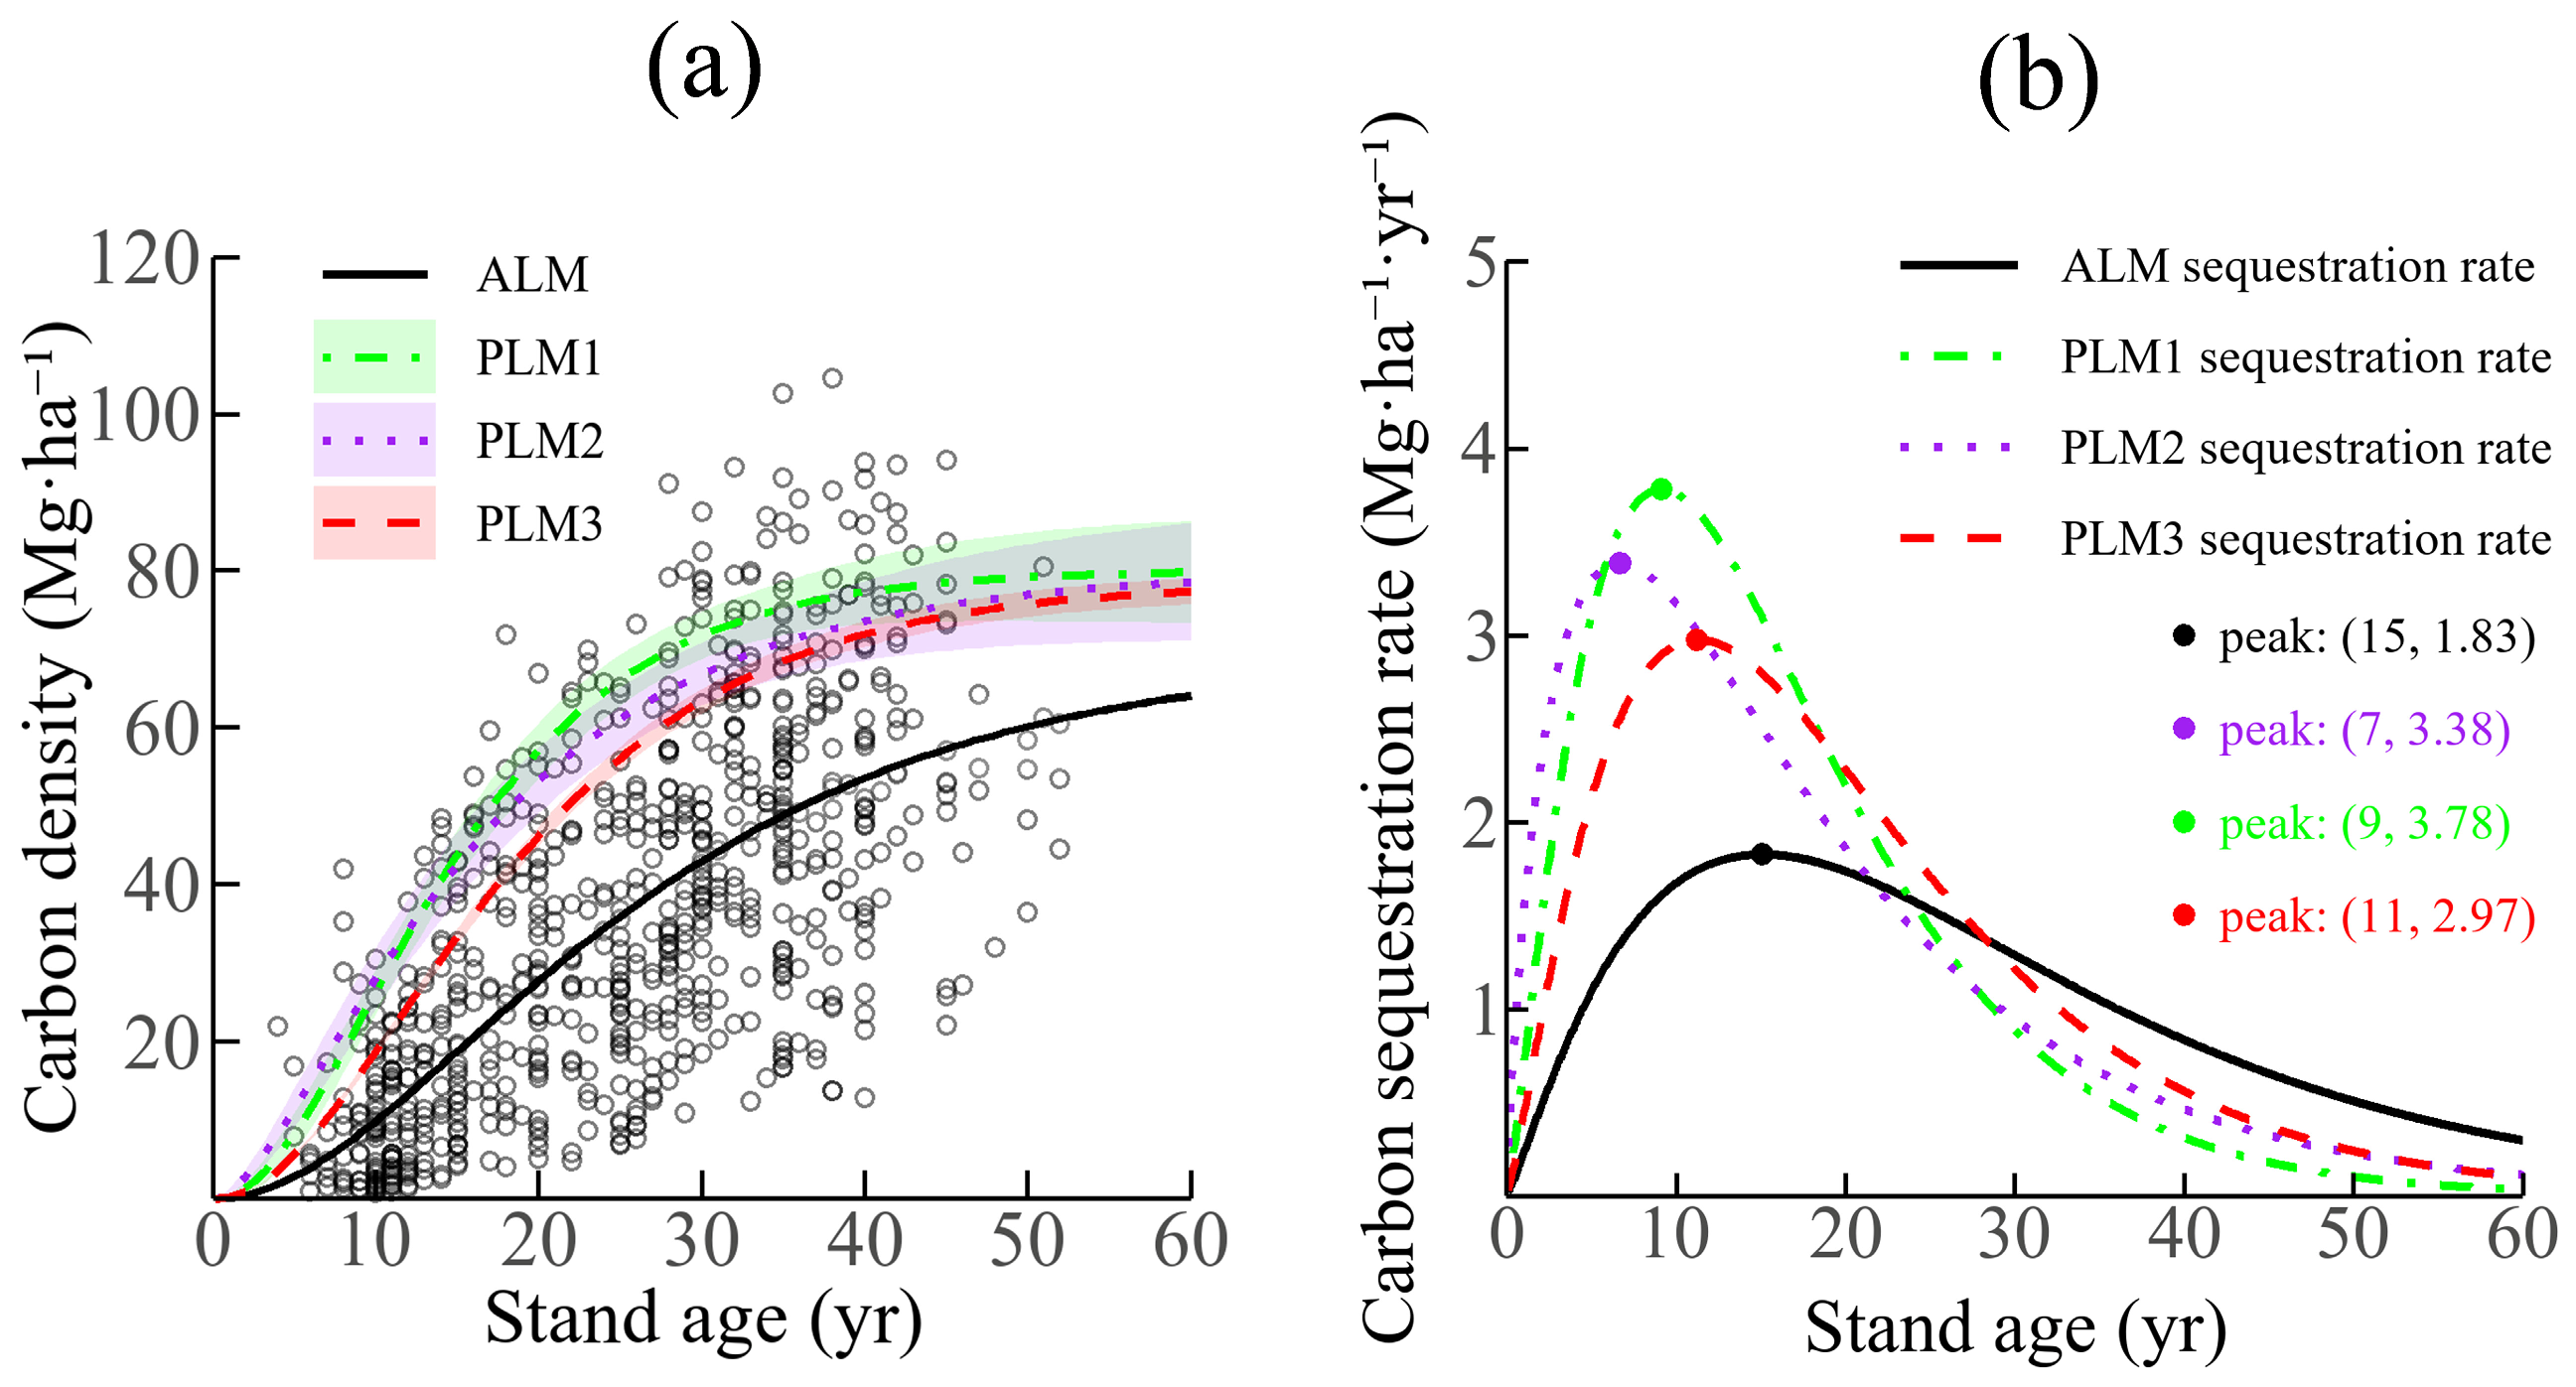

Disclaimer/Publisher’s Note: The statements, opinions and data contained in all publications are solely those of the individual author(s) and contributor(s) and not of MDPI and/or the editor(s). MDPI and/or the editor(s) disclaim responsibility for any injury to people or property resulting from any ideas, methods, instructions or products referred to in the content. |
© 2026 by the authors. Licensee MDPI, Basel, Switzerland. This article is an open access article distributed under the terms and conditions of the Creative Commons Attribution (CC BY) license.