


Abstract
Plywood has emerged as a key sustainable material in modern building. Yet, ensuring its consistent performance requires rigorous quality control of the rotary-cut veneers used in its manufacture. This task is complicated by the high-speed nature of industrial conveyors, where motion blur and the complex, varying textures of eucalyptus wood drastically reduce the effectiveness of real-time surface inspection. This study proposes an intelligent, real-time defect detection system specifically optimized for the diverse defect morphology of eucalyptus veneers. A lightweight model, YOLOv11-DMS-Veneers, was developed by integrating MobileNetV4 as the backbone, a Dynamic Head for multi-scale feature extraction, and a Shape-IoU loss function to precisely localize irregular defects like cracks and knots. Additionally, an ERD video enhancement framework (combining ESRGAN, RIFE, and DnCNN) was implemented to mitigate motion blur in dynamic environments. Experimental results demonstrate that the proposed model achieves a mean Average Precision (mAP@50) of 96.0% and a Precision of 95.7% with a low computational cost of only 4.5 GFlops, significantly outperforming traditional algorithms. Notably, the detection precision for challenging linear cracks reached 93.9%. In dynamic tests at conveyor speeds up to 24 m/min, the video enhancement strategy increased the average detection confidence by 0.288, maintaining a maximum confidence of 0.890. This technology offers a robust solution for the automated quality control of eucalyptus veneers, facilitating the production of high-performance plywood and advancing the efficient application of engineered wood in the building industry.
1. Introduction
Wood-based panels serve as fundamental components in modern civil engineering and architectural structures, occupying a pivotal role in the global timber industry [1]. Eucalyptus L’Hér spp., as a core sustainable resource for structural plywood manufacturing, offers the advantages of rapid growth and short rotation periods. However, its rapid growth characteristics lead to immense internal growth stress within the timber, which frequently induces irregular surface cracks and knot dropouts during the rotary cutting and drying processes [2]. Given that eucalyptus veneers function as both face and core plies in lamination, these complex biological defects disrupt the internal structural continuity, thereby compromising the overall quality and safety grade of the finished plywood. While eucalyptus plywood possesses merits such as uniform texture, high mechanical strength, and relatively low cost, it also faces limitations like susceptibility to deformation and poor moisture resistance. Plywood production typically encompasses log rotary cutting, drying, gluing, layup, and hot pressing; among these, the quality of the rotary-cut veneer directly determines the structural grade and value of the final product [3]. Precise, real-time online detection of defects in rotary-cut veneers can effectively support the implementation of automated, intelligent sorting and defect repair, thereby ensuring the rigorous quality standards demanded by the construction industry and enhancing wood resource utilization.
Due to growth characteristics, rotary-cut Eucalyptus veneers often contain diverse complex defects such as knots, cracks, and decay [4]. Live knots are formed by living branches connected to the surrounding wood during trunk growth; dead knots are formed by dead branches encased in new wood, which are prone to loosening and falling out to form knot holes; cracks are mostly caused by wood splitting due to growth stress or uneven drying; and decay and knot holes are primarily caused by fungal biodegradation or knot dropout [5,6]. These defects, resulting mainly from uneven fiber structure, concentrated growth stress, and susceptibility to biological attacks, severely compromise the mechanical stability and usage safety of the finished plywood [7,8]. Given the high density of defects in Eucalyptus veneers, traditional methods relying on manual detection and removal involve high labor intensity and exorbitant costs, restricting production efficiency and quality controllability [9].
Currently, sorting and patching of rotary-cut veneers in factories still rely primarily on manual visual inspection [10]. This method has three significant limitations: low detection efficiency that fails to match the rhythm of continuous production; subjective judgment standards that make quality consistency difficult to guarantee; and insufficient long-term stability due to visual fatigue. These issues have become critical bottlenecks restricting the industry’s automation and intelligent upgrading. To date, there is a lack of integrated industrial robots and assembly lines for plywood rotary-cut veneers that combine intelligent detection, grading, and rejection functions [11]. Achieving real-time online detection of defects in rotary-cut veneers will help significantly reduce labor costs and lay a critical visual foundation for developing such integrated industrial robots and assembly line sorting systems. With advancements in computer vision and artificial intelligence, an increasing number of enterprises and research institutions are exploring automated detection solutions based on machine vision to achieve efficient and precise recognition and classification of veneer defects, providing technical support for industrial intelligent upgrading.
To address the limitations of manual inspection, researchers have extensively explored automated technologies, utilizing the rapid evolution of computer vision architectures such as Transformers [12]. In the domain of non-destructive testing, early efforts focused on air-coupled ultrasonic assessment to characterize wood veneer properties [13]. Subsequent studies expanded this by applying air-coupled ultrasound with ferroelectret and piezoelectric sensors to detect natural defects [14]. Shifting towards imaging techniques, researchers implemented knot segmentation in 3D CT images of wet wood to analyze internal defect distributions [15]. This approach was further refined using tangential strategies for automatic knot segmentation in wet softwood logs [16]. Additionally, multi-sensor fusion methods combined near-infrared spectroscopy with machine vision to recognize wood surface defects [17]. With the rise of deep learning, attention shifted to advanced object detection, such as using improved SSD algorithms for solid wood panels [18]. Researchers also applied deep learning frameworks specifically for defect detection in edge-glued wooden panels [19]. To achieve higher efficiency, real-time detection of particleboard surface defects was realized based on improved YOLOv5 target detection models [20]. These technological progressions have culminated in the development of automatic machine vision-based algorithms suitable for inspecting hardwood flooring defects during manufacturing.
With the progress of computer vision technology, image-based automatic defect recognition has become an important direction for improving veneer detection efficiency and consistency. Nasir et al. (2022), in a systematic review of wood material monitoring technologies, pointed out that while physical contact monitoring means like acoustic emission are effective, non-contact visual detection better meets the needs of high-speed production lines [21]. Yi et al. (2024) systematically reviewed traditional wood-based panel detection methods, noting that early technologies mainly relied on manual experience and simple image threshold segmentation, which were difficult to adapt to complex defect scenarios [22]. To break through this bottleneck, Esteban et al. (2009) explored wood defect recognition based on traditional machine learning, preliminarily improving automation levels by extracting texture features combined with Artificial Neural Networks (ANN) [23]. Subsequently, Urbonas et al. (2019) further introduced deep Convolutional Neural Networks (CNN), achieving end-to-end high-precision classification on a mixed defect dataset [24]. This trend indicates that the field of wood-based panel detection is gradually transforming from pure manual judgment to human–machine collaborative modes, yet real-time online detection technology for high-precision, cross-scenario plywood rotary-cut veneers remains to be broken through.
In addition to the difficulties brought by the characteristics of the wood itself, the real-time detection environment in factories also significantly impacts recognition results. Studies by Longuetaud et al. (2012) and Johansson et al. (2013) show that even when using highly penetrating X-ray CT technology, algorithmic adaptation challenges remain when dealing with high-speed flow and internal structural variations [25,26]. Production sites often suffer from problems such as uneven lighting, dust interference, and cluttered backgrounds, leading to degraded image quality. Addressing such environmental lighting issues, Aguilera et al. (2018) proposed using non-visible spectrum imaging technology, effectively solving defect classification difficulties for melamine-faced boards under conventional visible light [27].
However, within the pure visual detection framework, to address the need for small defect detection in complex environments, Shi et al. (2020) proposed an imaging enhancement and detection method based on multi-scale feature fusion, significantly improving the detection rate of minute veneer fissures [28]; Li et al. (2021) addressed the scarcity of industrial samples by synthesizing multi-sample training data via generative adversarial network (GAN), effectively improving the model’s generalization ability under small-sample conditions [29]. Therefore, deep learning, as a machine learning method based on multi-layer neural networks, remains an effective technical path for solving complex defect detection problems in plywood veneers. Through multi-level feature extraction and non-linear mapping, it can automatically learn abstract representations of defects, adapting to complex backgrounds and variable imaging conditions.
Although the aforementioned methods have achieved high recognition accuracy on specific datasets, their large model parameters and high computational complexity make efficient deployment on resource-constrained terminals, such as factory edge devices, difficult, limiting their widespread application in actual production lines. Existing general object detectors (e.g., standard YOLO) typically use IoU/CIoU, which struggle to precisely localize the slender cracks or irregular decay unique to Eucalyptus, leading to positioning deviations. Moreover, most research is based solely on static high-definition images. However, in actual factories, conveyor speeds reach 15 m/min to 25 m/min, accompanied by vibration and motion blur. Existing research lacks enhancement processing for video streams, resulting in soaring missed detection rates and reduced detection accuracy during online inspection.
In summary, the characteristics of Eucalyptus plywood rotary-cut veneers—such as diverse defect types, complex texture backgrounds, and low imaging contrast—combined with challenges in the production environment like lighting fluctuations, equipment vibration, and high real-time requirements, pose numerous technical difficulties for realizing an integrated automatic sorting and repair system. Existing methods still have obvious limitations: first, insufficient detection capability for small-sized and high-density defects; second, limited discrimination between compound defects such as knots and cracks; and third, the lack of a high-speed online detection system suitable for production lines.
To this end, starting from the perspective of machine vision and addressing the needs of factory real-time online detection, this study aims to develop a veneer defect recognition model that balances accuracy, detection speed, and computational efficiency. The goal is to achieve intelligent image object detection and real-time video detection for five typical surface defects of Eucalyptus rotary-cut veneers—live knots, dead knots, cracks, decay, and knot holes—to improve sorting efficiency and accuracy, meeting the practical requirements for the efficient, continuous operation of timber production lines. This study addresses the problems of low precision, low efficiency, and high labor intensity in manual visual sorting during Eucalyptus plywood production, as well as the poor adaptability and flexibility of algorithms when migrating to complex visual tasks in lumber production lines due to the complexity of wood defects in terms of type, shape, texture, distribution, and color. To achieve this, we introduce a flexible dual-mode operational strategy: the YOLOv11-DMS-Veneers is specifically constructed as a lightweight, high-precision baseline model optimized for static images and standard continuous frames. Building upon this baseline, the comprehensive ERD-YOLO-DMS framework is formulated by integrating an ERD enhancement module to explicitly tackle dynamic motion blur. During real-time online inspection, the system can adaptively select either the standalone static model or the full dynamic framework based on varying conveyor speeds and specific quality assurance needs. The research focuses on the following key issues:
- (1)
- Dataset Construction: A dataset of Eucalyptus rotary-cut veneers was constructed, covering five defect types: live knots, dead knots, cracks, decay, and knot holes. This includes image data of small defect targets, compound defect targets, and multi-scale defect targets, establishing a fundamental dataset with over 20,000 labels after augmentation.
- (2)
- Model Development: The YOLOv11-DMS-Veneers model for Eucalyptus rotary-cut veneer defect detection was constructed. This model improves the Dynamic Head module for small and multi-scale targets; improves the MobileNet V4 module to balance accuracy and lightweighting for real-time detection; and improves Shape-IoU to focus on the shape of different defects, addressing insufficient performance in detecting compound and irregular defects. The YOLOv11-DMS-Veneers model was compared against other models via a series of metrics to verify its static detection performance on Eucalyptus veneer defects.
- (3)
- System Integration and Validation: To address the issue of accuracy degradation caused by high-speed motion blur, this study built an adjustable-speed assembly line detection system. It validates the performance of the YOLOv11-DMS-Veneers model when migrating from static image labels to real-time online detection across different conveyor speeds and cross-scenario conditions. Furthermore, based on deep learning, an ERD video enhancement detection system was constructed utilizing technologies such as ESRGAN super-resolution, RIFE frame interpolation, and DnCNN denoising convolutional networks, providing high-definition data sources for real-time detection.
2. Materials and Methods
2.1. Data Acquisition and Database Construction
2.1.1. Sampling Site and Research Overview
The raw veneer materials used in this study were sourced from Eucalyptus spp. plantations in Ning’er County, Pu’er City, Yunnan Province, China (23°7′ N, 101°1′ E). As a major production base for China’s plywood industry, this region is characterized by a subtropical highland monsoon climate, with an average annual temperature of 18.1 °C and annual precipitation of approximately 1400 mm. The rotary-cut veneers used in the experiments were sampled directly from the industrial drying line of Linda Wood Industry Co., Ltd. (Pu’er City, Yunnan Province, China), using logs harvested locally. These veneers exhibited biological defects typical of fast-growing timber, such as growth stress cracks and loose knots, providing foundational samples for constructing the defect dataset. Figure 1 illustrates the overall framework of this study, encompassing the entire process from veneer data acquisition to model development, validation, and the ultimate objective. A detailed description is provided below.
Figure 1.
Overview of the research framework. (a) Plywood manufacturing process and sources of defects; (b) Construction of the lightweight defect detection model; (c) Simulation of the online detection environment and video enhancement verification.
As one of the most important categories of wood-based panels, the performance of plywood depends largely on the quality of the veneer. Eucalyptus wood, with its moderate density and straight grain, is an excellent raw material for producing high-strength plywood. As shown in Figure 1a, the standard production process primarily includes log bucking, hydrothermal softening, rotary cutting, drying, gluing, layup, hot pressing, and post-processing. Among these steps, the veneer produced during the rotary cutting process (often referred to as “rotary-cut veneer” or “veneer”; hereafter referred to collectively as “veneer”) serves as the core substrate for plywood. This study focuses on this critical process, aiming to develop a detection method capable of automatically and accurately identifying defects in rotary-cut veneers.
To achieve real-time automatic detection of veneer defects and replace inefficient manual sorting, this study follows a systematic technical route. To facilitate high-precision automated sorting, a lightweight deep learning-based veneer defect detection model was constructed; the technical pathway is illustrated in Figure 1b. First, static images of dried veneers were collected via wireless transmission terminals to construct a dataset containing multiple defect classes—including live knots, dead knots, cracks, decay, knot holes, and discoloration—followed by standardized annotation and data augmentation. Regarding the model architecture, YOLOv11 was adopted as the baseline, integrating the MobileNetV4 backbone to achieve a lightweight design. Additionally, the Shape-IoU loss function and Dynamic Head were introduced to enhance feature extraction capabilities for small targets and complex defects. This design aims to significantly reduce the number of model parameters while simultaneously improving Precision and Recall.
Next, addressing the issue of motion blur caused by transmission speed variations (6 m/min to 24 m/min) and environmental interference during industrial online detection, an experimental platform with adjustable conveyor speed and video acquisition was built, as shown in Figure 1c. To verify the transfer performance of the detection model in dynamic scenes, an ERD video enhancement model was introduced. This model employs a multi-domain collaborative processing strategy: utilizing the RIFE algorithm for frame interpolation in the time domain, DnCNN for denoising in the frequency domain, and ESRGAN for super-resolution reconstruction in the spatial domain. By comparing video quality and detection confidence before and after enhancement, the system’s actual performance on the simulated drying line was evaluated, ultimately achieving the technical deployment from static environmental data to dynamic production lines.
2.1.2. Data Preprocessing and Augmentation
In this study, high-resolution static images of Eucalyptus veneers were acquired using a Nikon Z6 II camera (24.5 MP; manufactured by Nikon Corporation, Tokyo, Japan) paired with a Nikkor Z 24–50 mm f/4-6.3 lens. To minimize geometric distortion, the focal length was fixed at 50 mm. The camera was mounted vertically, 90 cm above the veneer surface under standardized LED lighting to simulate an industrial online inspection environment. Given that the standard plywood size is 1220 × 2440 mm, a single frame could not fully cover the board surface. Therefore, a center cross-division method was employed to capture images in four quadrants for each board, resulting in a total of 516 original high-definition images. Annotation was conducted by professional inspectors in accordance with the Chinese National Standard GB/T 9846-2015 (Plywood for General Use) [30], which clearly defines five defect categories: live knots, dead knots, cracks, insect holes, and decay. Figure 2 illustrates examples of the raw sample data and actual defects, along with augmented data samples and the label distribution of the dataset. Each of these components is described in detail below.
Figure 2.
Construction and Statistical Analysis of the Eucalyptus Veneer Defect Image Dataset.
Figure 2a presents full-view veneer images and local close-ups for each defect category, demonstrating the high morphological diversity of defects in the dataset. The original dataset consists of 475 high-resolution wood images encompassing five distinct defect types: live knot, dead knot, knot hole, crack, and decay, as illustrated in Figure 2a. Prior to model training, all original images were manually annotated by domain experts using LabelImg. Bounding boxes were carefully drawn around the visible defects, and each instance was assigned to its corresponding class category, ensuring high-quality ground truth for supervised learning.
To rigorously prevent data leakage and ensure the robustness of the evaluation, the dataset partitioning was performed strictly prior to data augmentation at the original image level. The 475 original images were randomly divided into a training set, a validation set, and a test set at a ratio of 8:1:1. This patient-level/image-level separation guarantees that augmented variants of a single original image do not cross into different subsets.
Subsequently, to suppress overfitting and balance the class distribution, data augmentation techniques were applied to the subsets. As shown in Figure 2b, the specific augmentation strategies included geometric transformations (horizontal flip, vertical flip, and random rotation by ) and pixel-level modifications (Gaussian noise injection with a variance ranging from 100 to 400, Gaussian blur, and brightness adjustment by a factor uniformly sampled from [−0.3, −0.1] and [0.1, 0.3]). After applying these techniques, the total dataset was expanded to 2850 images—comprising 2280 images for training, 285 for hyperparameter tuning (validation), and 285 for final performance evaluation (testing). This partition strategy ensured that the proportion of defect types in each subset remained consistent with the overall distribution.
The label distribution of the augmented dataset, which contains a total of 20,614 annotated instances, is illustrated in Figure 2c. The bar chart on the left quantifies the instance counts across the five defect classes. Dead knots account for the highest proportion (6722 instances), followed by live knots (4677), cracks (3622), knot holes (3594), and decay samples (1959). This distribution realistically reflects the natural occurrence frequencies of various defects in actual production environments. The subplots on the right visualize the geometric and spatial characteristics of the bounding boxes through a multi-dimensional scatter density distribution. The horizontal and vertical axes represent the normalized X and Y coordinates of the bounding box centers, respectively, indicating that targets are mostly concentrated in the central area of the images. Furthermore, the point density and color intensity reflect the width and height distributions, demonstrating that the defects are predominantly of small to medium sizes. This analysis indicates that although a natural class imbalance exists, the augmented dataset effectively covers key defect types and preserves their spatial distribution characteristics, providing a solid and diverse feature foundation for model learning.
2.2. YOLOv11-Based Detection Method
2.2.1. YOLOv11-DMS-Veneers Model for Eucalyptus Veneer Defect Detection
To address the urgent need in the wood processing industry for high-precision, high-efficiency, and real-time online detection of surface defects on rotary-cut Eucalyptus veneers, this study applies the YOLO object detection algorithm. As one of the latest iterations in the YOLO series, YOLOv11 achieves a new height in balancing detection accuracy and speed. Compared to its predecessors, YOLOv11 features significant improvements in neural network architecture, loss functions, and training strategies, effectively enhancing the model’s robustness against multi-scale objects and complex backgrounds. The model architecture consists primarily of four parts: the input, backbone network, neck network, and detection head.
To further overcome challenges faced by traditional YOLO algorithms in Eucalyptus veneer defect detection—specifically the missed detection of multi-scale and small defects, difficulties in recognizing composite defects, and the need for model lightweighting to enable real-time online detection—this study implemented targeted improvements to the baseline YOLOv11 model. The improved model architecture is illustrated in Figure 3.
Figure 3.
Architecture of the YOLOv11n-DMS-Veneers Eucalyptus veneer defect detection model.
First, targeting small-scale defects such as knots and cracks, the original detection head was replaced with a Dynamic Head algorithm. By introducing additional context-aware and spatial-aware modules, this significantly enhanced feature extraction and classification capabilities for small targets. Second, to achieve high-speed inference through model lightweighting, the original backbone was replaced with the MobileNetV4 algorithm, which drastically reduced the model’s parameter count and computational complexity while maintaining accuracy. Third, targeting composite objects where multiple defects (e.g., insect holes and discoloration) coexist, the bounding box regression loss function was upgraded from CIoU to Shape-IoU, which is more sensitive to target geometric shapes, thereby improving localization accuracy for overlapping and dense defects. Finally, based on the improved YOLOv11n-DMS-Veneers model, a complete real-time veneer defect detection pipeline was constructed, and the detection of Eucalyptus veneer defects was tested and validated under different conveyor belt speeds.
2.2.2. Dynamic Head Architecture for Multi-Scale Defects
The YOLOv11n baseline model adopts a decoupled head design, separating classification and bounding box regression tasks to reduce interference between them. However, in Eucalyptus veneer defect detection, targets such as tiny knots and superficial cracks exhibit weak features and low contrast against the background, necessitating tighter feature synergy and interaction between the classification and localization tasks. Therefore, this study replaces the original decoupled head with a Dynamic Head. By introducing a multi-scale attention mechanism, this module performs adaptive feature recalibration across three dimensions: feature map scale, space, and task channels. This enables the detection head to dynamically focus on the contextual information most relevant for discriminating defects of different scales. During the detection process, defects vary due to differences in tree parts, age, and growth environments; these variations often lead to false positives. The Dynamic Head reduces interference from the background and noise through more precise feature learning, thereby effectively lowering the false detection rate. The structure of the Dynamic Head is illustrated in Figure 4.
Figure 4.
Architecture of the Dynamic Head. (a) Overall architecture illustrating the synergistic workflow where input feature maps are processed by three parallel modules: scale-aware, spatial-aware, and task-channel-aware. (b) Detailed internal design of each awareness module.
The Dynamic Head treats the input as a 3-dimensional tensor with dimensions of scale space task channels, denoted as . Here, represents the feature level, is the product of the feature map’s height and width (), and is the number of channels. A scale-aware attention mechanism , a spatial-aware attention mechanism , and a task-aware attention mechanism are applied to each dimension, respectively. Before , an ROI pooling layer is used for compression. The detection head can be expressed as:
where: is the attention function; is a 3D tensor ; , ; and , , and are the different attention functions for the , , and dimensions, respectively.
The implementation methods of the attention functions for the three dimensions in the Dynamic Head are detailed below. The Scale-aware Attention Module is responsible for handling targets of different scales. It learns the dependencies between feature map channels through fully connected layers and global average pooling, thereby allowing the model to adaptively focus on feature channels important for targets of varying scales. The calculation method is as follows:
where is a function approximating a 1 1 convolution; and is the hard-sigmoid activation function.
The Spatial-aware Attention Module first uses deformable convolution to learn sparsity, and subsequently aggregates cross-level features at corresponding spatial locations; it is responsible for precisely locating targets in space. By calculating spatial offsets and applying a Sigmoid function, it learns a dynamic spatial attention weight map to enhance the feature response in target regions and suppress background interference. The calculation method is as follows:
where is the number of feature layers; is the number of sparse sampling locations; is the location, fine-tuned by the self-learned spatial offset ; is the weight matrix; and is the self-attention scale importance at location .
The Task-aware Attention Module allows for the selection of various tasks by dynamically enabling or disabling feature channels. This module is responsible for utilizing the contextual relationship between the target and the surrounding environment. Through operations such as normalization and fully connected layers, it models broader contextual information to help recognize partially occluded targets or targets with incomplete features. The method is shown in Equation (4):
where is the feature slice of the channel; is a hyper-function controlling the activation threshold. This function first performs global average pooling on the spatial dimensions ( and ) for dimensionality reduction, followed by two fully connected layers and a normalization layer, and finally applies a shifted Sigmoid function to normalize the output to the interval.
In summary, the proposed Dynamic Head completes the multi-task feature learning and representation for multi-scale defect targets on rotary-cut Eucalyptus veneers by reshaping the feature pyramid into a 3D tensor and sequentially stacking scale, spatial, and task-aware attention modules. When dealing with multi-scale targets, the channel weights learned by the scale-aware module can adaptively reinforce feature channels effective for large targets or those effective for small targets, enabling the model to handle scale variations without relying on complex feature pyramid networks. For the detection of small targets, the spatial-aware module significantly enhances the weak feature signals of small targets by focusing on key spatial locations where targets are present. Meanwhile, the context-aware module utilizes contextual information from the surrounding environment to provide supplementary clues for small targets, compensating for the sparsity of their intrinsic features.
2.2.3. MobileNet V4 Architecture for High Precision and Lightweighting
To achieve real-time inference with a low parameter count for plywood production lines, this study implements a lightweight improvement to the backbone network. The original backbone was replaced with the newly proposed MobileNetV4 to reduce the model’s parameter count and increase detection speed. MobileNetV4 is an efficient, lightweight deep neural network designed for mobile ecosystems, featuring a more advanced underlying architecture. Building upon the Inverted Residuals and Linear Bottlenecks of MobileNetV2, MobileNetV4 introduces the Universal Inverted Bottleneck (UIB), Mobile Multi-Query Attention (Mobile MQA), and Neural Architecture Search (NAS). This not only compresses the network volume but also enhances global context awareness.
As shown in Figure 5, the MobileNet V4 ConvMedium architecture first inputs data through a Convolution and Batch Normalization layer (ConvBN Layer 0) for preliminary feature extraction. Subsequently, data flows into the Fused Inverted Bottleneck layer (Fused IB Layer 1), which optimizes computational efficiency through integrated operations. Next, the data passes through the Universal Inverted Bottleneck layer (UIB Layer 2), which adopts an optional depthwise convolution design to enhance flexibility. The architecture then enters a hierarchy composed of multi-layer Universal Inverted Bottleneck modules: Layer 3 and Layer 4, where UIB blocks are stacked to progressively deepen feature representation. Finally, the data is output through another Convolution and Batch Normalization layer (ConvBN Layer 5), completing the forward propagation of the entire network. Linear data flow connections indicated by arrows between layers ensure sequential processing.
Figure 5.
Architecture of MobileNet V4. Note: Four instantiations of the UIB: (1) Inverted Bottleneck (IB) performs spatial mixing on expanded feature activations, providing larger model capacity at the cost of increased computation. (2) ConvNext-Like performs spatial mixing before expansion, achieving cheaper spatial mixing with larger kernel sizes. Extra DW allows for increasing the network depth and receptive field via depthwise convolution. FFN consists of two stacked 1 1 pointwise convolutions (PW) with activation and normalization layers between them. PW is one of the most accelerator-friendly operations but is best utilized in conjunction with other modules.
In this architecture, the Universal Inverted Bottleneck (UIB) serves as a core enhancement, improving upon the traditional Inverted Bottleneck (IB) of MobileNetV2. The structure of the UIB block is shown in Figure 5: the trapezoidal blocks in the figure represent the expansion layer and projection layer, respectively. Two optional Depthwise Convolutions (DW) are introduced before the expansion layer and between the expansion and projection layers, enhancing the network’s flexibility and feature expression capability. The figure also illustrates four specific implementations of the UIB module, including the ExtraDW module, IB module, ConvNext-Like module, and FFN module. The Fused Inverted Bottleneck (Fused IB) on the right is an alternative design that simplifies the computational structure by directly connecting a k × k convolution to a 1 × 1 convolution, commonly used in the initial stages of the model. UIB dynamically selects submodule types via NAS, allowing the model to achieve performance optimization across different hardware platforms and task requirements. Its universal form is shown in Equation (5).
In Equation (5), represents the input feature map, represents the output feature map, and denotes the application of the UIB block to input . represents the corresponding probability, where . The optimal combination is determined via NAS search.
Furthermore, this paper introduces Mobile MQA, proposed in MobileNetV4. This is a novel attention mechanism optimized specifically for mobile accelerators, capable of achieving over 39% inference acceleration. In mobile accelerator architectures, the performance bottleneck is often not computational power, but memory access efficiency. Mobile MQA integrates Spatial Reduction Attention (SRA) into an optimized attention block through an asymmetric computation design between Query, Key, and Value. This module maintains the high resolution of the Query while reducing the resolution of the Key and Value, thereby improving operational efficiency. Through asymmetric spatial downsampling, Mobile MQA maintains a constant number of tokens between input and output. This preserves the high-resolution characteristics of the attention mechanism while significantly improving computational efficiency. By using a 3 3 depthwise convolution with a stride of 2 instead of average pooling (AvgPooling) to perform spatial reduction, model capacity is effectively increased with lower computational cost. The computational expressions for the MQA module are shown in Equations (6) and (7).
where is the input feature matrix, is the dimensionality reduction operation, , , are the projection matrices for Query, Key, and Value, and is the scaling factor.
Additionally, MobileNetV4 incorporates NAS, employing a two-stage search method (coarse-grained and fine-grained) to automatically optimize network configurations on different hardware platforms. Meanwhile, MobileNetV4 enhances the model’s generalization ability and training effectiveness through innovative distillation techniques, including dynamic dataset mixing strategies and data augmentation methods.
2.2.4. Shape-IoU Principles Targeting Composite Defect Types
Traditional Intersection over Union (IoU) loss functions often struggle to accurately regress bounding boxes for Eucalyptus defects with extreme aspect ratios, such as linear cracks and irregular decay areas. To address this issue, this study introduces the Shape-IoU loss function. Unlike CIoU, Shape-IoU focuses on the matching degree of the bounding box’s geometric shape rather than solely on the center point distance. By introducing shape-related weight coefficients into the regression equation, the model is subjected to stronger shape constraints when the aspect ratio of the predicted box deviates from the ground truth. This mechanism plays a critical role in distinguishing irregular, composite, and partially occluded small target defects from complex wood grain backgrounds. The principle of Shape-IoU is illustrated in Figure 6.
Figure 6.
Principles of Shape-IoU. (a) Spatial matching relationship: Demonstrates how the Shape-IoU mechanism optimizes detection when decay holes or other composite defects exist in the same area. (b) Anchor box principles: Illustrates the geometric definition of the bounding box and its optimization parameters.
The standard calculation formula for IoU is as follows. Here, and represent the predicted box and the ground truth box, respectively.
For Shape-IoU, the calculation formulas for the horizontal weight coefficient and the vertical weight coefficient are shown in Equations (9) and (10).
where is the scaling factor, and its value is related to the ratio of target sizes in the dataset. The values of and are related to the shapes of the predicted box and the ground truth box. and represent the width and height of the ground truth box.
The method for calculating the bounding box distance is given by the following equation:
In the above equations, represents the shape distance loss; are the center coordinates of the predicted box; are the center coordinates of the ground truth box; represents the center distance between the ground truth box and the predicted box; is the distance loss; and and are the dynamic weight coefficients for the horizontal and vertical directions, respectively.
Finally, the bounding box regression loss for Shape-IoU is shown in Equation (15).
Shape-IoU introduces a scaling factor to add new geometric constraints on top of the standard IoU. By focusing on calculating the loss based on the scale of the Anchor itself, it enables the model to better learn feature correlations during detection tasks for composite defects and small target defects in veneers, while facilitating rapid convergence to the optimal solution. This improves detection performance and accuracy while saving computational time.
2.2.5. Configuration and Model Evaluation
To ensure the strict reproducibility of the experiments and to comprehensively detail the implementation environment, the training process was standardized across all comparative and ablation models. The experiments were executed on a Windows 11 operating system, leveraging a hardware configuration that included an NVIDIA GeForce RTX 4060 graphics processing unit. The software environment was established using Python version 3.11.5, the PyTorch version 2.8.0 deep learning framework, and the Compute Unified Device Architecture version 12.8 for hardware acceleration. During the training phase, the input image dimensions were fixed at 640 by 640 pixels, and the dataset was processed with a batch size of 16 over a total duration of 200 epochs. The optimization of the network weights was driven by the Stochastic Gradient Descent optimizer. To effectively regularize the model and prevent overfitting during the optimization process, the initial learning rate was set to 0.01, accompanied by a momentum factor of 0.937 and a weight decay coefficient of 0.0005. A comprehensive summary of the hardware architecture, software dependencies, and key hyperparameter configurations is systematically presented in Table 1.
Table 1.
Summary of hardware, software, and key hyperparameter configurations for model training.
Beyond basic validation, employing a diverse set of evaluation metrics is crucial for a comprehensive understanding of the enhanced model’s detection capabilities. This study adopted metrics including Precision, Recall, F1-score, mAP, Parameters, GFlops, and FPS as benchmarks to measure performance.
Precision represents the ratio of true positive samples to all samples predicted as positive. A higher Precision indicates that the model can accurately identify a specific class. The definition is shown in Equation (16).
Recall represents the ratio of correctly predicted positive samples. A higher Recall indicates that the model is capable of classifying the vast majority of instances in a category, although individual identification errors may occur. The definition is shown in Equation (17).
where represents the number of times a positive sample is predicted as a positive instance, refers to the number of times a positive sample is predicted as a negative instance, and refers to the number of times a negative sample is predicted as a positive instance.
The F1-score is the harmonic mean of Precision and Recall, used to reflect model performance more comprehensively. The definition is shown in Equation (18).
mAP represents the mean of the AP (Average Precision) across all classes. Its definition is shown in Equation (19).
To comprehensively evaluate the localization accuracy of the proposed model, the mean Average Precision is measured at different Intersection over Union thresholds. The metric mAP50 calculates the mean Average Precision at a single Intersection over Union threshold of 0.5, which evaluates the fundamental detection capability under relatively relaxed bounding box matching criteria. To further assess the strictness of the spatial localization, the comprehensive metric mAP50-95 is employed. This evaluation criterion computes the average of the mean Average Precision scores across ten distinct Intersection over Union thresholds ranging from 0.5 to 0.95 with an incremental step size of 0.05. Consequently, mAP50-95 serves as a rigorous indicator of the overall robustness and precise boundary regression capability of the detection framework across varying levels of localization strictness.
2.3. Online Veneer Detection System Based on ERD Video Enhancement
To address the issues of video blur and missed detections caused by speed variations in industrial conveyor belt scenarios, this study designed a deep learning-based real-time online video detection system. The online detection experimental platform adopted in this study is shown in Figure 7.
Figure 7.
Rate-adaptive and environment-aware real-time online wood defect detection system. (a) Covers the actual hardware detection scenario, including hardware components such as the adjustable-speed detection conveyor and industrial camera, as well as the computer displaying the detection interface. (b) Shows the basic architecture of the ESRGAN fundamental unit RRDB and the basic principle of the Dense Block within it, where is the residual scaling parameter. (c) Illustrates the principle of its underlying network IFNet and the network’s basic unit IFBlock. (d) Displays the model architecture of DnCNN (Denoising Convolutional Neural Network).
To simulate an industrial veneer drying production line, an adjustable-speed conveyor belt system was constructed (as shown in Figure 7a). Its visual acquisition component includes a Hikrobot MV-CS060-10UC-PRO industrial camera (Hikrobot Co., Ltd., Hangzhou, China), mounted vertically 0.9 m above the conveyor belt. The system is equipped with a Godox SL60IID high-frequency LED fill light to ensure uniform illumination (GODOX Photo Equipment Co., Ltd., Shenzhen, China). The conveyor belt width is 40 cm. The speed is precisely controlled by an STM32-based controller and monitored in real-time via a rotary encoder, with an adjustment range of 6 m/min to 24 m/min, aiming to test the system’s dynamic robustness at different rates. Meanwhile, to suppress motion blur and noise interference caused by high-speed transmission, this system introduces the ERD enhancement framework for processing prior to detection. As shown in Figure 7b–d, the raw video stream passes sequentially through three processing modules: (1) frame interpolation via the RIFE algorithm to enhance temporal resolution; (2) super-resolution reconstruction of key frames using ESRGAN to restore texture details; and (3) sensor noise elimination using DnCNN. The enhanced video frames are input into the YOLOv11-DMS-Veneers model to complete the final defect detection.
To improve the edge clarity of veneer defects and texture realism in video quality, ESRGAN (Enhanced Super-Resolution Generative Adversarial Network) was adopted. This is an image super-resolution reconstruction technique based on Generative Adversarial Networks (GAN) that enhances image resolution and detail quality through algorithms. Figure 7b visualizes the core architecture of ESRGAN, which replaces the standard discriminator with a RaD (Relativistic Discriminator). The principle involves a generator network reconstructing high-resolution details from low-resolution images, while a discriminator network distinguishes between generated images and real high-resolution images; this adversarial training forces the generator to recover more realistic textures. In specific implementations, the generator utilizes the RRDB (Residual-in-Residual Dense Block) structure as the basic building unit. Constructed from three Dense Blocks, it combines multi-level residual networks and dense connections to effectively transmit low-frequency information while focusing on learning high-frequency details during image upscaling.
To address the issue where low camera frame rates and traditional frame completion techniques cause artifacts in veneer defects, this study utilizes RIFE (Real-Time Intermediate Flow Estimation for Video Frame Interpolation) to complete video frame interpolation, achieving clear contours of defect targets at high frame rates. The core advantage of this algorithm lies in its ability to simplify flow-based Video Frame Interpolation (VFI) methods through an efficient IFNet, synthesizing high-quality intermediate frames from preceding and succeeding video frames without independent and time-consuming optical flow calculation steps. Figure 7c illustrates the core principle of RIFE: a lightweight neural network completes optical flow estimation and frame synthesis in a single pass. The network estimates a bidirectional optical flow field and subsequently warps and fuses the two frames. In implementation, consecutive low-frame-rate video frames are input into the RIFE interpolation network. The IFNet first extracts semantic information at different levels of the IFBlock, then adaptively fuses features from the anterior and posterior frames to predict optical flow in a coarse-to-fine manner.
To reduce the parameters of the interpolation model, a Leakage Distillation Loss is added to the IFBlock. This involves an additional ground truth input (the intermediate frame to be predicted, provided in the dataset) serving as a teacher network used during training but excluded during inference. This process effectively improves efficiency while enhancing the accuracy of optical flow prediction through teacher information. Consequently, the displacement of targets on the high-speed conveyor belt between consecutive frames is minimized, significantly alleviating motion blur and reducing missed detections caused by excessive instantaneous target movement.
Finally, to remove noise caused by lens or scene instability, the study employs DnCNN (Denoising Convolutional Neural Network) to remove video noise and reconstruct images, further improving defect clarity. Its basic principle is shown in Figure 7d. Based on a modified VGG network, this architecture employs deep convolutional networks to learn the noise distribution in images using a residual learning strategy. The network does not directly predict the clean image but learns the residual mapping R(y) ≈ v, where y is the noisy observation and v is the noise; denoising is achieved via x = y − R(y). Meanwhile, Batch Normalization is integrated into the intermediate layers (Conv + BN + ReLU) to mitigate internal covariate shift, accelerating training and boosting denoising performance. The architecture includes an input layer (Conv + ReLU), multiple intermediate layers (Conv + BN + ReLU), and an output layer (Conv). By using zero-padding to avoid boundary artifacts, it can effectively handle complex noise at different levels. Video frames processed by super-resolution and interpolation are input into the DnCNN model, which non-linearly fuses image context information through multiple convolutional layers to accurately distinguish between useful image structures and noise patterns.
Based on this hardware and software platform, the experiment was set up with the industrial camera at a fixed distance of 0.9 m from the board surface for image acquisition. To systematically evaluate model performance, the following experiments were designed: First, five sets of experiments were conducted by controlling the conveyor belt speed within the intervals of 6.0 m/min, 10.5 m/min, 15.0 m/min, 19.5 m/min, and 24.0 m/min (V1–V5). This was done to detect the model’s defect recognition performance and robustness under dynamic conditions using 54 randomly selected rotary-cut Eucalyptus veneers. Finally, the study evaluated the missed detection rate, average confidence, and maximum confidence metrics of the online YOLOv11n-DMS-Veneers model (migrated directly from static image training) before and after applying the ERD video enhancement model. This assessment determines the effectiveness of the ERD system in resolving video blur and missed detection issues caused by speed variations.
3. Results
3.1. Comparison Between Improved and Original YOLOv11n Models
To comprehensively evaluate the performance optimization of the improved YOLOv11n-DMS-Veneers model compared to the original YOLOv11n model in detecting defects on Eucalyptus veneers, this study conducted a systematic comparative analysis across three dimensions: training dynamics, detection accuracy, and classification reliability. Figure 8 illustrates the detailed curves.
Figure 8.
Performance comparison between the improved model and the YOLOv11n model. The solid lines in the figure represent the metrics of YOLOv11-DMS-Veneers, while the dashed lines/boxes represent the performance metrics of the original YOLOv11n. (a) Training and validation loss curves, (b) Precision evaluation metrics, (c) Confusion matrix heatmaps.
According to the experimental results in Figure 8a, the training and validation loss curves indicate that the YOLOv11n-DMS-Veneers model exhibits better training stability and generalization potential. Both its training loss and validation loss decrease synchronously and stably throughout the entire training cycle; furthermore, the two curves are more tightly aligned and achieve relatively lower convergence values. This suggests that the improved model effectively learned the features of the training data while avoiding significant overfitting. In contrast, the loss curves of the original YOLOv11n show minor fluctuations in the later stages or a slightly increasing gap with the validation loss, implying potential limitations in model capacity or training efficiency when facing the complex textures of veneer defects.
Regarding the evaluation metric curves shown in Figure 8a, the YOLOv11n-DMS-Veneers model demonstrates significant advantages in accuracy-related metrics. For instance, its mAP50 and mAP50-95 curves consistently remained above those of the original model throughout the training process and reached higher final convergence values on the validation set. It can be concluded that the improved model achieved substantial enhancements in overall detection accuracy and robustness for veneer defects under different confidence thresholds and IoU requirements. Furthermore, concerning metrics measuring bounding box regression accuracy, the improved model also outperformed the original version. Its Precision and Recall curves were smoother and reached higher values, implying that the model can localize defects more accurately and effectively reduce both missed detections and false detections.
Based on the comparative analysis of the P curve, R curve, PR curve, and F1 curve in Figure 8b, the overall analysis indicates that the improved YOLOv11n-DMS-Veneers model outperforms the baseline model across all four curves. The P curve of the improved model bows more upward and to the left compared to the original model; the R curve exhibits a steeper slope and approaches the top-right corner more closely; the PR curve is positioned closer to the top-right of the coordinate graph; and the F1 curve maintains higher peaks over a wider range of confidence thresholds. This suggests that the combined effect of the introduced improvement modules enables the model to achieve higher comprehensive performance in veneer defect detection tasks. It maintains high Precision while ensuring high Recall and is more robust to confidence threshold settings.
Regarding the P curve, the original model’s curve bends downward and to the right, indicating that high precision can only be obtained at higher confidence levels, which may lead to an increased missed detection rate and indicates poorer detector performance. In the PR curve comparison, the baseline model’s curve is generally lower and shows a rapid decline in precision earlier as recall rises, resulting in a smaller area under the curve. Comparing the R curves, the improved model’s curve has a steeper slope, indicating that filtering out low-confidence prediction boxes results in a greater increase in recall, thereby improving detection performance. Furthermore, the improved R curve is closer to the top-right corner, signifying better model performance. When the curve approaches the top-right, it indicates that the model can maintain high precision while keeping high recall. This demonstrates that the algorithm can accurately predict the presence of targets and maintain high recall even after filtering low-confidence predictions.
The improved model’s PR curve maintains a higher precision level across the entire recall range, with an increased area under the curve. This difference indicates that the improved model possesses higher accuracy and reliability in identifying veneer defects. When the model needs to detect a high proportion of defects, the improved model generates significantly fewer false positives than the baseline model. This is crucial in actual industrial quality inspection scenarios, as excessive false alarm rates can disrupt production lines and increase the cost of manual re-inspection. Regarding the F1 curve, in an ideal state, the F1 curve shows good scores within the confidence interval of 0.4–0.6. The original model’s F1 score is 0.280, while the improved model achieves 0.460. The improved model’s F1 score falling within this range indicates that the model performs ideally in balancing precision and recall after optimization.
The confusion matrix analysis in Figure 8c further reveals the classification advantages of the YOLOv11n-DMS-Veneers model. Compared to the original YOLOv11n, the improved model shows distinct advantages in classification accuracy, false detection control, and class distinctiveness. In the normalized confusion matrices (comparison between the 1st graph for the improved model and the 3rd graph for the original), the diagonal values of the improved model are generally higher. For example, the correct prediction ratio for Live Knots increased from 0.92 in the original to 0.95, and for Dead Knots, it increased from approximately 0.90 to 0.96. This indicates that the improved model, optimized through training on veneer data, significantly enhanced the recognition accuracy for various defects. Simultaneously, the misclassification ratios generally decreased; for instance, the ratio of misclassifying Live Knots as Dead Knots dropped from 0.02 in the original to 0.01, reflecting a stronger ability to distinguish similar defects.
In the confusion matrices showing raw sample counts (2nd vs. 4th graph), the improved model also dominates in the absolute number of correct detections. For the Dead Knot category, the improved model correctly detected 657 samples compared to 617 for the original. Additionally, the number of background false detections was significantly reduced in the improved model (only 12 instances compared to 24 in the original). This demonstrates that the optimized model not only reduced missed detections but also lowered the probability of misjudging defects as background. These differences stem from the design of the YOLOv11-DMS-Veneers model targeting veneer textures and defect features, making the model more robust during training and validation, thereby validating the effectiveness of the improvement scheme in enhancing defect detection performance.
3.2. Ablation Study of the Improved YOLOv11n-DMS-Veneers Model
3.2.1. Performance Comparison of Different Lightweight Backbones
To justify the selection of a lightweight backbone suitable for eucalyptus veneer defect detection, the backbone of YOLOv11n was replaced with other lightweight networks (MobileNetV1, MobileNetV2, and MobileNetV3) for comparison. Additionally, comparative experiments were conducted using specific lightweight modules (DynamicConv and UIB). The experimental results are presented in Table 2.
Table 2.
Performance comparison of different lightweight backbones and modules.
YOLOv11n-MobileNetV4 demonstrated the optimal overall performance. For the mAP50-95 metric, which best reflects the comprehensive detection capability of the model, MobileNetV4 achieved the highest value of 0.579 among all evaluated models. Although its mAP50 (0.894) and F1 score (0.863) were comparable to those of MobileNetV3 (0.897 and 0.864, respectively), MobileNetV4 required only 1.80 M parameters and 4.3 GFLOPs of computational load. This is substantially lower than MobileNetV3 (3.54 M parameters and 4.9 GFLOPs). Thus, MobileNetV4 maintained high detection accuracy while reducing the parameter count by approximately half.
Compared with the earlier MobileNetV1 and MobileNetV2 architectures, MobileNetV4 exhibited significant improvements across nearly all accuracy metrics. Although MobileNetV2 had the fewest parameters (1.63 M) and the lowest computational cost (3.9 GFLOPs), its mAP50 and mAP50-95 were only 0.873 and 0.563, respectively. This indicates that its lightweight nature was achieved at a significant expense to detection accuracy, rendering it less suitable for practical applications in complex scenarios.
When dynamic convolution (DynamicConv) and the Universal Inverted Bottleneck (UIB, a core component of MobileNetV4) were introduced and evaluated as independent modules, they achieved acceptable detection accuracies (mAP50 of 0.884 and 0.890, respectively). However, their parameter counts and computational costs increased significantly, with both requiring 6.0 GFLOPs. This demonstrates that merely replacing or stacking individual lightweight modules does not yield optimal results. In contrast, MobileNetV4, as an integrated architecture, presents a more rational design in balancing feature extraction efficiency and computational resource consumption.
3.2.2. Quantitative Ablation Analysis
To comprehensively evaluate the performance optimization of the improved YOLOv11n-DMS-Veneers model and address the specific challenges of detecting defects on Eucalyptus veneers, a systematic ablation study was conducted. As presented in Table 3, this study evaluates not only the independent contributions of each module (Dynamic Head, MobileNetV4, and Shape-IoU) but also their synergistic effects, demonstrating a design rationale that goes beyond the mere integration of disparate components.
Table 3.
Comparison of Model Performance in Ablation Study.
The baseline YOLOv11n model achieved an mAP50 of 0.885 and an mAP50-95 of 0.571, with 2.62 M parameters and 6.6 GFLOPs. The independent introduction of each module yielded distinct optimization trajectories:
Replacing the baseline backbone with the MobileNetV4 architecture to form the YOLOv11n-M model primarily targeted architectural efficiency. This modification significantly reduced the parameter count to 1.80 M, representing a reduction of 31.3 percent, and decreased the computational load to 4.3 GFLOPs. Concurrently, it slightly improved the comprehensive evaluation metric mAP50-95 to 0.579. These results confirm the robust feature extraction capability of MobileNetV4 at a substantially lower computational cost.
The integration of the Shape-IoU loss function to create the YOLOv11n-S model provided a performance boost without incurring additional costs. Without adding any parameters or computational overhead to the baseline network, this approach improved Precision, Recall, and mAP50 across the board. This overall enhancement stems from the inherent ability of Shape-IoU to penalize bounding box shape inconsistencies, an attribute that proves particularly effective for detecting irregular wood defects.
The independent introduction of the Dynamic Head to form the YOLOv11n-D model revealed a notable performance tradeoff between Precision and Recall. While the Precision metric surged from 0.849 to 0.900, the Recall experienced a sharp decline from 0.824 to 0.765, which consequently led to drops in both the F1-score and the mean Average Precision. This phenomenon indicates that the Dynamic Head enforces a stricter and more discriminative spatial and task-aware attention mechanism. As a result, it effectively filters out background noise and false positives to boost Precision, but its overly rigid nature suppresses the detection of subtle, ambiguous, or highly irregular defect samples, thereby reducing the overall Recall.
Unlike conventional YOLO-based methods for wood defect detection that often stack attention mechanisms indiscriminately, the YOLOv11-DMS-Veneers architecture is designed to explicitly resolve the aforementioned tradeoffs through module synergy, tailored to the morphological characteristics of veneer defects.
To mitigate the recall suppression caused by the Dynamic Head, the Shape-IoU and MobileNetV4 modules were systematically combined with it to address the performance tradeoff. As demonstrated by the YOLOv11n-DS model, the addition of Shape-IoU forces the rigid Dynamic Head to adapt to the geometric variations of defects, including slender cracks caused by growth stress. This structural adaptation successfully rescued the Recall back to 0.830 and pushed the mAP50 to 0.914. Similarly, the YOLOv11n-DM model leverages the rich, multi-scale feature representation of MobileNetV4 to provide the Dynamic Head with higher-quality feature maps. This integration further balances the performance metrics while maximizing lightweighting by dropping the parameter count to 1.93 M.
The final YOLOv11n-DMS model represents the optimal convergence of these synergistic strategies within a complete architecture. In this framework, MobileNetV4 acts as a highly efficient feature engine, the Dynamic Head functions as a strict discriminative filter, and Shape-IoU serves as a geometric calibrator. Working in concert, these components achieve an unprecedented Precision of 0.957, a Recall of 0.911, and an F1-score of 0.933, while the mAP50 and mAP50-95 reached 0.960 and 0.700, respectively.
In summary, the proposed YOLOv11n-DMS-Veneers model reduces the computational overhead to 1.93 M parameters and 4.5 GFLOPs, which are lower than the baseline requirements, while simultaneously improving overall detection accuracy. This ablation study demonstrates that the contribution of the model extends beyond the simple integration of independent modules. Instead, it relies on the structural synergy among these components to resolve the specific performance tradeoffs associated with detecting complex wood defect morphologies.
To provide a granular evaluation of the proposed modules across different wood defect morphologies, a category-wise precision analysis was conducted. The baseline model demonstrated unbalanced detection capabilities, performing adequately on regular-shaped defects such as live knots but showing marked deficiencies in recognizing irregular or slender defects. Specifically, the crack and decay categories recorded the lowest baseline precisions of 0.822 and 0.819, respectively. The detailed results across five defect categories are presented in Table 4.
Table 4.
Category-wise precision comparison of different ablation models for veneer defect detection.
The independent integration of the Dynamic Head primarily enhanced the detection of defects with distinct spatial and textural features. This architectural modification significantly increased the precision for live knots, dead knots, and knot holes, raising the live knot precision to 0.932. Conversely, substituting the backbone with the MobileNetV4 architecture provided a more balanced precision improvement across all categories, including the previously challenging crack and decay classes, demonstrating its capacity for generalized feature representation.
Addressing the specific challenges associated with slender defects, the introduction of the Shape-IoU loss function yielded targeted morphological improvements. When applied independently to the baseline, this module increased the precision for the crack category from 0.822 to 0.890. This substantial gain confirms that incorporating shape and scale constraints into the bounding box regression process effectively resolves the localization difficulties inherent to high-aspect-ratio defect morphologies.
The intermediate combined models further illustrate the structural synergy of these modules on specific defect categories. The combination of the Dynamic Head and MobileNetV4 maximized the precision for knot-related defects, pushing the live knot precision to 0.952, yet it showed relatively limited gains for decay. In contrast, integrating the Shape-IoU loss function with either the Dynamic Head or MobileNetV4 consistently elevated the precision for cracks to over 0.930. The final model, incorporating all three modules, converged these distinct advantages. It achieved peak precision scores exceeding 0.930 across all five defect categories, establishing a highly uniform and robust detection performance for complex wood veneer defects.
3.2.3. Visualization of Attention Mechanism
To comprehensively demonstrate the overall advantages of the improved YOLOv11n model in rotary-cut veneer defect detection tasks, Figure 9 utilizes heatmap visualizations and quantitative performance comparisons to evaluate the model’s spatial localization capabilities regarding attention mechanisms, as well as the variations in accuracy across defect types following the stepwise addition of modules. The baseline YOLOv11n model exhibits diffuse and poorly localized attention distributions. For instance, in the live knot and decay categories, the activation regions of the baseline model are scattered and fail to cover the entire defect area, while simultaneously allocating unnecessary attention to the surrounding healthy wood grain.
Figure 9.
Comparison of the detection attention mechanism of the YOLOv11n model after the addition of various modules.
The independent introduction of the Dynamic Head alters the spatial attention distribution by significantly intensifying the activation signals. While this mechanism enhances the network’s responsiveness to distinct defect features, it occasionally over-activates adjacent background regions, as visually evident in the broadened heatmaps for the live knot category. Conversely, replacing the backbone with the MobileNetV4 architecture promotes a more refined feature representation. The resulting heatmaps display more concentrated activation centers, effectively reducing the dispersed background noise observed in the baseline.
The visualization results strongly corroborate the quantitative findings regarding the Shape-IoU loss function and its morphological constraints on slender defects. Observing the crack category, the baseline model produces a fragmented and disorganized attention map that fails to capture the continuous longitudinal extension of the defect. However, upon integrating the Shape-IoU module, the attention network is forced to adapt to the geometric variations of the target. The corresponding activation areas for the crack become distinctly tighter and align accurately with the elongated physical boundaries of the defect, proving the effectiveness of this loss function in guiding the network to perceive high-aspect-ratio shapes.
The synergistic effect of these components culminates in the final YOLOv11n-DMS-Veneers architecture. The heatmaps for this comprehensive model demonstrate the optimal convergence of the attention mechanisms. Across all five categories, from the localized knot hole to the extensive decay and slender cracks, the final model produces highly concentrated and intense activation regions. These regions are strictly confined to the actual defect contours, while irrelevant background textures are successfully suppressed. This visual evidence confirms that the engineered structural synergy enables the model to precisely differentiate between complex wood defect morphologies and normal veneer surfaces.
3.3. Comparison of Different Models Under Static Detection
3.3.1. Quantitative Ablation Analysis
To further evaluate the comprehensive performance of YOLOv11n-DMS-Veneers, this study designed a cross-model comparative experiment. The proposed model was compared with YOLOv13n, YOLOv12n, YOLOv11n, YOLOv10n, YOLOv8n, YOLOv5n, Faster-RCNN, and SSD to assess its performance under different metrics, as well as its detection effectiveness for different defect types and complex scenarios. A detailed comparison of various evaluation metrics across different models is presented in Table 5.
Table 5.
Performance comparison between the proposed model and series/classic models.
Traditional detectors, including the two-stage Faster R-CNN and the single-stage SSD, exhibited significant limitations in this specific wood defect detection task. These models demanded higher computational resources, utilizing 27.7 and 16.3 GFLOPs, respectively, while yielding the lowest mean average precision scores. This performance gap indicates that their standard architectures struggle to effectively capture the complex morphological variations inherent to veneer defects. Similarly, while YOLOv5n and YOLOv8n are frequently deployed in industrial scenarios, they achieved mAP50 values of only 0.713 and 0.740. Their primary drawback in this context lies in a limited ability to accurately localize irregular defect boundaries, which subsequently leads to lower overall precision and recall metrics.
To rigorously evaluate the proposed model against modern state-of-the-art frameworks, the recently introduced YOLOv12n and YOLOv13n models were integrated into the comparison. These advanced networks demonstrated robust feature extraction capabilities, with YOLOv13n reaching an mAP50 of 0.929 and an F1-score of 0.883. However, despite their improved detection accuracy over previous generations, these modern frameworks still depend on parameter sizes exceeding 2.45 million and computational loads above 6.2 GFLOPs, limiting their deployment efficiency on edge devices.
The YOLOv11n-DMS-Veneers model successfully addresses the respective shortcomings of both the widely used industrial models and the newer cutting-edge frameworks. It achieves the highest detection accuracy across all evaluated metrics, recording a Precision of 0.957, a Recall of 0.911, and an mAP50 of 0.960. Furthermore, its mAP50-95 metric reached 0.700, demonstrating stable robustness across stricter intersection-over-union thresholds. Concurrently, the proposed model maintains the lowest parameter count among all tested networks at 1.93 million, alongside a highly efficient computational requirement of 4.5 GFLOPs. This comparative data confirms that the structural modifications within the proposed model effectively resolve the traditional trade-off between high-precision defect localization and the strict computational constraints required for practical production line deployment.
3.3.2. Qualitative Analysis of Detection Robustness
This study also systematically evaluated the actual performance differences between YOLOv11n-DMS-Veneers and the series/classic models in the static detection of various wood defects. The following analysis focuses on defect type adaptability and robustness in special scenarios. Figure 10 intuitively demonstrates the comprehensive performance advantages of YOLOv11n-DMS-Veneers across different wood defect detection tasks through multi-model comparison.
Figure 10.
Accuracy comparison between YOLOv11n-DMS-Veneers and series/classic models.
Regarding single defect detection, YOLOv11n-DMS-Veneers showed superior positioning accuracy for typical Eucalyptus defects such as Live Knots and Dead Knots compared to other models. It maintained high accuracy even in cases of occasional missed detections; the bounding boxes aligned well with defect contours without offsets, and small targets were stably detected. When evaluating the latest baseline iterations, YOLOv13n exhibited better performance than YOLOv12n in localizing live and dead knots; however, both models remained slightly inferior to the baseline YOLOv11n and our proposed YOLOv11n-DMS-Veneers. While other models could detect most live and dead knots, their accuracy showed a declining trend. The release of internal stress caused by the fast growth of Eucalyptus is the root cause of the high frequency of veneer Crack defects. In the practical tests of this section, the Crack detection accuracy of YOLOv11n-DMS-Veneers was higher than that of other YOLO series models. Interestingly, YOLOv13n and YOLOv12n demonstrated a noticeable advantage in crack detection over their predecessors, YOLOv11n and YOLOv10n. Whereas Faster R-CNN and SSD showed severe missed detections with accuracy below 0.35, making them unsuitable for online veneer defect detection. Decay, which affects the performance of the final plywood product and is a mandatory sorting criterion, was also detected well by YOLOv11n-DMS-Veneers, achieving precise localization and optimal accuracy. Other models (except SSD) did not show significant missed detections but had lower accuracy; similarly, YOLOv13n and YOLOv12n successfully captured both decay and knot holes, yet their overall precision could not match the improved YOLOv11n-DMS-Veneers. Regarding the fifth defect, Knot Holes, YOLOv11n-DMS-Veneers consistently performed above 0.8. Crucially, the model could effectively recognize knot holes appearing at the bottom-left of regions or where holes formed at the knot edge while the center remained unformed. Under these conditions, such defects bear strong similarity to dead knots, indicating that the model possesses robust feature discrimination capabilities, accurately capturing key differences in texture continuity, color gradients, or subtle morphological variations between edge holes and dead knots. Overall, while YOLOv11n, YOLOv10n, YOLOv12n, and YOLOv13n could capture major defects, their accuracy was noticeably lower than YOLOv11n-DMS-Veneers, and YOLOv8n and YOLOv5n exhibited partial missed detections. The performance gap was particularly evident in traditional models: Faster R-CNN generated redundant bounding boxes in hole detection, and SSD lacked complete coverage for linear crack defects, reflecting the adaptability limitations of single-stage detectors in complex texture environments.
In addition to the five defect types mentioned above, Eucalyptus veneers present two special scenarios: first, overlapping defects where multiple defects combine in the same area; and second, high-density occurrences of complex small targets (e.g., dead knots, live knots, holes, and cracks) within the image. Both scenarios pose immense challenges for manual and machine sorting. In the overlapping defect and high-density small target scenarios (right side of the dashed line in Figure 10), the robustness of YOLOv11n-DMS-Veneers is further highlighted. Facing interlaced defect regions, the model effectively separated adjacent independent targets, such as overlapping Cracks and Decay, while maintaining high classification confidence. Other models showed varying degrees of missed detections or target merging. Notably, among the comparative models, YOLOv13n and YOLOv12n delivered highly competitive performances in these composite and high-density scenarios, ranking second only to the proposed YOLOv11n-DMS-Veneers and significantly outperforming earlier YOLO versions. Particularly in clustered multi-class defect detection, YOLOv11n-DMS-Veneers leveraged its multi-scale feature fusion mechanism to precisely capture minute knots and dense groups of holes and cracks. The quantity of detected targets was significantly higher than that of traditional industrial models like YOLOv8n and YOLOv5n. Conversely, traditional architectures like Faster R-CNN and SSD, lacking targeted optimization, suffered from significantly increased missed detection rates and class misjudgments (e.g., misidentifying knot holes as dead knots) in dense scenarios, validating the practical value of the improved model in complex veneer processing environments.
However, despite the overall robustness demonstrated in these complex scenarios, a detailed error analysis of specific challenging cases reveals certain limitations of the YOLOv11n-DMS-Veneers model (Figure 11). As illustrated in Figure 11a, in high-density regions containing minute defects, the model occasionally misses exceptionally fine cracks. Furthermore, Figure 11b highlights instances of inadequate bounding box coverage for certain linear cracks; such incomplete spatial encapsulation could potentially compromise the accuracy of downstream automated grading and decision-making processes. Another significant challenge lies in the subtle morphological distinction between similar defect classes. For example, in Figure 11c (bottom right), a dead knot is misclassified as a knot hole. Although visually similar, a dead knot remains physically encased in the veneer, whereas a knot hole is a complete void. This misclassification is critical in industrial contexts, as the subsequent automated patching procedures and grading metrics for these two defects differ substantially. Finally, Figure 11d reveals severe missed detections for specific diffuse presentations of decay (e.g., disease spots). The model’s insensitivity to this particular decay morphology consequently exacerbates missed detection rates when such decay co-occurs within composite defects.
Figure 11.
Error analysis and typical failure cases of the YOLOv11n-DMS-Veneers model in complex scenarios. (a) Missed detection of fine cracks in high-density defect regions. (b) Inadequate bounding box coverage for extended linear cracks. (c) Misclassification caused by subtle morphological similarities (e.g., dead knot misidentified as a knot hole). (d) Missed detection of diffuse decay and disease spots.
3.4. Real-Time Dynamic Detection Evaluation of YOLO Migration with Video Enhancement
3.4.1. Evaluation of Video Quality Enhancement
While static detection comparisons established the recognition potential of the YOLOv11n-DMS-Veneers model, its real-time dynamic performance on actual industrial assembly lines remains to be verified. To achieve high-precision dynamic detection, this section evaluates a scheme that integrates video enhancement to improve dynamic detection performance following the migration of YOLOv11n-DMS-Veneers to dynamic scenarios. Specifically, raw video sequences underwent comprehensive enhancement processing involving ESRGAN super-resolution, DnCNN denoising, and RIFE frame rate upscaling to evaluate visual improvements. This section compares the quantitative performance of videos before and after processing by systematically adding enhancement modules. Table 6 presents the results of key quality metrics (PSNR, SSIM, MS-SSIM, FSIM, GMSD) under various enhancement combinations.
Table 6.
Performance Comparison of Video Enhancement Model.
Overall, the enhancement processing significantly improved video quality, with the synergistic effect of multiple modules being particularly prominent. Specific analysis indicates that basic ESRGAN processing achieved a PSNR of 38.69 dB and an SSIM of 0.9778, demonstrating that super-resolution effectively preserved the structural information of the original video. After adding the DnCNN denoising module, PSNR decreased slightly to 38.59 dB, SSIM dropped marginally to 0.9765, and GMSD rose from 0.0967 to 0.0988. This suggests that the denoising process may introduce slight detail loss, but the variance remains controllable. Notably, in the third configuration combining RIFE frame rate upscaling (based on 60 fps reference video), PSNR dropped to 37.88 dB, SSIM to 0.9713, and GMSD increased to 0.1116, reflecting the impact of frame rate multiplication on single-frame quality. However, when ESRGAN, RIFE, and DnCNN were combined, PSNR increased to 43.24 dB (an 11.8% improvement over basic ESRGAN), SSIM optimized to 0.9855, GMSD decreased to 0.0836 (a reduction of approximately 13.5%), and FSIM concurrently improved to 0.8791. This indicates that multi-module synergy effectively balanced the conflicts between super-resolution, frame rate upscaling, and denoising, playing a significant role in enhancing image clarity and reducing distortion.
3.4.2. Impact of Enhancement on Dynamic Detection Performance
To rigorously evaluate the statistical robustness of the ERD enhancement pipeline as requested, we simulated continuous industrial inspection by performing = 5 independent repeated evaluation cycles for each conveyor speed. In each cycle, the complete set of 54 veneers was processed to capture the stochastic variances introduced by high-speed motion blur and frame-sampling disparities.
To comprehensively quantify the reliability and error margin of the detection model under random industrial disturbances, the Standard Deviation (SD) and 95% Confidence Interval (CI) are introduced to measure the dispersion of the experimental results and estimate the probabilistic bounds of the system’s performance in actual deployment. Their derivations are formulated in Equations (20) and (21):
The reported evaluation metrics (Precision, Recall, F1-score) represent the mean values across these 5 independent runs. To quantify system stability, the Standard Deviation (SD) and 95% Confidence Intervals (CI) were strictly calculated using Student’s t-distribution ( = 2.776 for = 4).
As shown in Table 7, a granular analysis of these statistical indicators reveals the profound impact of motion blur on target detection and the independent contribution of the ERD pipeline.
Table 7.
Quantitative assessment of dynamic detection performance.
At lower conveyor speeds (V1 and V2), the unenhanced original video stream maintained a robust F1-score above 0.890. However, as the speed accelerated to V4 (19.5 m/min) and V5 (24.0 m/min), a catastrophic performance drop occurred. Most notably, the Recall of the original video plummeted to 0.641 at V4 and 0.522 at V5. Physically, this degradation is attributed to severe motion smearing, which obscures the boundaries of fine and slender defects (such as cracks and minor decay), causing them to blend with the background Eucalyptus grain and rendering them virtually invisible to the detector. Consequently, this high susceptibility to random mechanical vibrations and exposure variations caused the Standard Deviation (SD) to inflate drastically from 0.092 (at V1) to 0.185 (at V5). The excessively wide 95% Confidence Interval (CI) bounds for the unenhanced video at V5 ([0.390, 0.850]) underline its extreme statistical instability, proving it entirely inadequate for reliable industrial grading.
Following the integration of the ERD system, the dynamic detection performance was significantly improved. The Recall prominently improved to 0.875 at V4 and 0.856 at V5, with the corresponding F1-scores robustly recovering to 0.892 and 0.879, respectively. By restoring high-frequency texture details prior to detection, the ERD pipeline effectively mitigated the feature loss caused by motion blur. Furthermore, at the maximum testing speed of 24.0 m/min (V5), the SD dramatically decreased to 0.072, and the 95% CI narrowed significantly to [0.790, 0.968]. This substantial reduction in statistical variance proves that the enhancement process decreases the influence of random environmental noise on detection outcomes, thereby guaranteeing the consistency and reliability of the YOLOv11-DMS-Veneers model under continuous, high-speed dynamic operation.
Finally, this study focuses on a comparative analysis of changes in defect detection confidence for the migrated YOLOv11n-DMS-Veneers model before and after video enhancement, thereby quantifying the actual contribution of video enhancement to final dynamic detection performance. To verify the real-time detection performance of the migrated YOLOv11n-DMS-Veneers after online video enhancement, experiments evaluated the model’s performance at different conveyor belt speeds. Additionally, key frames were used to compare the detection model migration effects before and after ERD model enhancement; the actual test results are shown in Figure 12. As shown in Figure 12a, overall, following the introduction of the ERD model, the veneer surface texture in the images became more detailed. The edge contours and surface details of defects were superior to those in the original images, which was particularly evident in the textural representation of complex and minute samples such as Decay and Knot Holes. Regarding detection performance, the detection accuracy after enhancement was higher than that of the original video images, while the missed detection rate was lower.
Figure 12.
Comparison of YOLO detection performance on original and enhanced video at different speeds.
Referring to Figure 12b, at speeds V1–V3, the degree of veneer blurring is relatively low; consequently, the average confidence and actual detection performance for both original and enhanced videos remain stable. However, at these speeds, the original images exhibited severe missed detections for live knots and cracks, indicating significant loss of defect information under original conditions, which hinders effective model migration for detection. At speed V3, when veneer stacking occurred, both methods showed misdetections in overlapping regions, likely attributable to feature confusion caused by occlusion. As the speed increased to V4, the average detection confidence for original images dropped markedly (by 0.114 compared to V3). Simultaneously, significant blurring and smearing appeared on the veneers on the conveyor, leading to more severe loss of defect information in the original images. Regarding dead knot detection, precision and missed detection rates were similar between original and enhanced images. However, for other defects—especially slender ones like cracks—the extent of missed detections was greater in original images, as blurring and smearing further exacerbated detection difficulty.
In industrial scenarios, conveyor speeds typically range between V3 and V4. To test the model’s limit performance, experiments were further conducted at speed V5. When the conveyor reached speed V5, motion blur caused severe degradation of features in the original video; average confidence in original images further declined to 0.313. Conversely, detection performance after video enhancement remained balanced across all five speeds; the average confidence at speed V5 even increased by 0.012 compared to V4. According to the maximum confidence comparison in Figure 12c, the difference between the two was minimal at the first four speeds. However, at speed V5, the maximum confidence for original images showed the most significant decline, dropping by 0.281 (from V4) to 0.611, whereas detection on enhanced video maintained a level of 0.890.
In summary, at speeds V1 and V2, model migration can still cope with real-time online detection. However, at speeds V3–V5, the online detection performance on the original video exhibits significant deterioration. With the YOLO model migrated after video enhancement, the average confidence improved by 0.157, 0.076, 0.128, 0.159, and 0.288 at speeds V1–V5, respectively, compared to the original video. Although the maximum confidence of the original video was only slightly lower than the enhanced results at speeds V1, V3, and V4, at the maximum speed V5, the enhanced result exceeded the original video by 0.279. This indicates that the ERD framework successfully restored high-frequency texture details lost due to blur. Furthermore, the higher-definition target textures and image quality resulting from ERD enhancement play a positive auxiliary role in model migration. This confirms that the “enhance-then-detect” strategy is not merely image processing but serves as a viable prerequisite step for high-speed online grading.
4. Discussion
To guarantee the structural reliability and quality consistency of engineered wood products, deep learning-based computer vision—as a pivotal non-destructive testing (NDT) technology—has emerged as a mainstream solution for replacing subjective manual inspection [30]. However, rotary-cut Eucalyptus veneers present severe challenges to object detection algorithms due to the high density of defects caused by growth characteristics, complex texture backgrounds, and the dynamic environment of high-speed transmission lines. The YOLOv11-DMS-Veneers model and the ERD video enhancement system proposed in this study have achieved significant progress in addressing multi-scale defects, morphological complexity, and dynamic environment adaptability by improving feature extraction architectures and introducing video enhancement technology, effectively overcoming numerous bottlenecks of traditional detection methods.
Veneer defects exhibit extreme morphological heterogeneity, and the semantic confusion between live knots and dead knots has long been a difficulty in the industry [31]. Traditional machine vision methods usually rely on simple image processing or manual feature engineering, which struggle to adapt to complex backgrounds and offer limited discrimination for similar defects [32]. In the comparative experiments of this study, it was found that while the classic two-stage detector Faster R-CNN performs well in general object detection, it is prone to generating redundant bounding boxes when detecting knot holes. Meanwhile, the single-stage detector SSD shows seriously insufficient coverage integrity for linear defects like cracks, leading to obvious missed detections.
In contrast to the aforementioned methods, this study introduced the Dynamic Head, utilizing its multi-dimensional attention mechanism (scale, spatial, and task-aware) to significantly enhance the model’s perception of subtle texture variations at knot edges (such as bark residue on the edges of dead knots) [33]. Previous studies utilizing traditional YOLO architectures often struggled to distinguish between morphologically similar defects. For instance, Wang reported limited precision in classifying knot types due to feature confusion, noting that the visual ambiguity between certain dead knots and live knots frequently led to misclassification [34]. In contrast, our experimental results show that the detection precision for live knots and dead knots reached 0.971 and 0.968, respectively, demonstrating a confusion status significantly superior to the baseline YOLOv11 model.
More critically, regarding the slender cracks caused by the release of growth stress in Eucalyptus, previous studies utilizing CIoU or SIoU often ignored the shape attributes of the bounding box itself, resulting in limited regression accuracy. This study introduced the Shape-IoU loss function, which incorporates the aspect ratio of the bounding box into the regression constraints, forcing the predicted box to closely fit the linear geometric morphology of the crack [35]. This improvement caused crack detection precision to leap from a baseline of 0.773 to 0.939, effectively solving the issue of missed detections caused by excessive background noise when models like SSD handle large aspect ratio defects. This finding has important reference significance for processing other agro-forestry products with linear defect characteristics (e.g., bamboo splitting, hemp fiber flaws).
In the context of Industry 4.0, algorithmic deployment efficiency is as important as detection precision. Early deep learning research achieved high-precision classification but was often accompanied by huge model parameter counts and computational complexity, making deployment on resource-constrained terminals like factory edge devices difficult [36]. Taking the Faster R-CNN compared in this study as an example, its computational load reaches 27.7 GFlops with a parameter size of 4.13 M, severely constraining real-time performance.
Further, this study adopted MobileNetV4 as the backbone network. Through the optimization of UIB modules and Mobile MQA attention mechanisms, the model parameter count was controlled at 1.80 M and the computational load (GFlops) reduced to 4.3 while ensuring feature extraction depth. Ablation experiments confirmed that although lightweight backbones typically lead to feature sparsity, by combining the feature recalibration capability of the Dynamic Head, the model not only maintained precision but also improved recall (from 0.824 to 0.911). Compared with the same series YOLOv8n and YOLOv5n, the proposed model improved precision by 0.23 and 0.238, respectively, under lower computational loads. This “Light Backbone + Heavy Head” design paradigm proves that realizing high-precision real-time detection on resource-constrained edge devices is entirely feasible, laying a solid technical foundation for developing low-cost, portable wood defect detectors.
Most importantly, this study achieved breakthroughs regarding robustness in dynamic environments and industrial application potential. A significant “Domain Shift” exists between laboratory environments and industrial sites. Previous studies have mostly focused on recognition accuracy in static images, often ignoring problems such as uneven lighting, equipment vibration, and motion blur caused by high-speed conveyor movement in production sites. Experiments in this study show that when the conveyor speed reaches the V5 level, the maximum detection confidence for untreated raw video plummets from 0.88 at low speeds to 0.611, with a large number of missed detections. To address this industrial pain point, the ERD video enhancement system constructed in this study innovatively integrates processing technologies from the time domain (RIFE frame interpolation), spatial domain (ESRGAN super-resolution), and frequency domain (DnCNN denoising). Experimental data indicate that under simulated high-speed industrial production (V5 rate), this system successfully increased the average detection confidence by 0.288, maintaining the maximum confidence at 0.890, effectively resisting feature degradation caused by motion blur. This contrasts sharply with traditional schemes relying solely on static dataset training without considering dynamic video enhancement, validating the effectiveness of the “Enhance-then-Detect” strategy in high-speed industrial vision and demonstrating the system’s immense economic potential in improving Eucalyptus plywood production efficiency and reducing waste rates.
Regarding industrial feasibility and the “high-speed real-time” performance of the ERD-YOLO-DMS framework, a comprehensive computational overhead analysis was conducted on an NVIDIA RTX 4060 GPU. The standalone YOLOv11n-DMS-Veneers model demonstrates exceptional inference efficiency with a processing speed of approximately 66 FPS, inherently meeting the rigorous online real-time detection requirements of timber processing lines. Although the full-scale execution of the ERD video enhancement module—comprising RIFE, DnCNN, and ESRGAN—results in a single-frame latency of about 100 ms (approximately 10 FPS) within a native PyTorch 2.8.0 environment, this does not undermine the framework’s overall efficiency in practical industrial deployment.
From a physical perspective, at a maximum conveyor speed of 24.0 m/min (0.4 m/s), a 10 FPS processing rate equates to an inspection interval of 4 cm. This ensures that within the field of view of a standard industrial camera, the same veneer is captured multiple times with overlapping frames, effectively preventing missed detections. In practical industrial applications, the ERD-YOLO-DMS framework utilizes an asynchronous operational mechanism. The ERD pipeline is positioned as an on-demand triggered module, activated only to re-evaluate specific frames when the primary YOLO detector outputs low-confidence results—such as image blur caused by sudden mechanical vibrations—rather than processing every sequential frame.
Furthermore, deploying the system using industrial C++ inference engines with TensorRT FP16/INT8 quantization can significantly compress the latency of the ERD module, thereby providing robust real-time throughput assurance for online veneer production. This dual-mode operational strategy establishes the lightweight YOLOv11n-DMS-Veneers model as the primary high-speed detector running continuously for all standard frames. Meanwhile, the computationally intensive ERD module remains in a standby state as a secondary fallback, specifically targeting the restoration and secondary evaluation of degraded images affected by severe motion blur and resultant confidence drops. This architectural design achieves an ideal balance between maximizing system throughput and pursuing extreme detection accuracy.
Despite the promising performance of the ERD-YOLO-DMS framework in real-time online detection, several inherent limitations regarding its generalizability and operational stability must be acknowledged. Currently, the model was trained and validated on a single-source industrial dataset acquired under a specific, standardized LED imaging environment. Consequently, its direct applicability to other factories remains to be fully verified, as variations in camera sensor specifications, ambient lighting fluctuations, dust density, and conveyor belt colors can introduce domain shifts that may degrade initial detection accuracy. Furthermore, while the algorithm is highly optimized for the unique defect morphologies of Eucalyptus, such as severe growth stress cracks, its plug-and-play applicability to other commercial species like pine or poplar is limited due to distinct background textures and different defect typologies.
Beyond these environmental factors, the practical deployment of the asynchronous enhancement strategy faces technical constraints. While the dual-mode design aims to balance throughput and precision, continuous or burst blurring events—caused by persistent mechanical vibrations or lighting flickers—could lead to a rapid accumulation of the ERD processing queue. Such a bottleneck might result in significant temporal latency, potentially causing the automated sorting mechanisms to misalign with the physical location of the moving veneer. Additionally, the system’s reliance on the primary detector’s confidence scores for triggering the ERD pipeline poses a risk; if the main model produces an overconfident false negative due to a significant domain shift, the enhancement mechanism will remain dormant, allowing critical defects to pass undetected. Moreover, the simultaneous execution of multiple heavy deep learning models—including YOLO, ESRGAN, RIFE, and DnCNN—on a single edge device places a substantial strain on memory bandwidth and GPU resources, which may challenge the long-term stability and cost-effectiveness of the system in a high-intensity industrial setting. Therefore, future work must focus not only on transfer learning and domain adaptation to guarantee cross-domain generalizability but also on optimizing resource scheduling and real-time buffer management to ensure robust performance under unconstrained factory conditions.
To synthesize the findings, the core methodological contribution of this study extends beyond the mere assembly of existing deep learning modules; it lies in establishing a highly targeted structural synergy specifically optimized for the unique biological and industrial challenges of Eucalyptus veneer inspection. Eucalyptus timber is characterized by extreme morphological defect heterogeneity and high internal growth stress, which traditional detectors fail to process effectively in dynamic environments. Our proposed ERD-YOLO-DMS framework explicitly maps algorithmic solutions to these specific bottlenecks: the ERD pipeline functions as a prerequisite signal stabilizer to neutralize high-speed motion blur on the conveyor; the Dynamic Head resolves the severe semantic ambiguity between morphologically similar live and dead knots; the Shape-IoU imposes tailored geometric constraints to capture slender stress cracks; and the MobileNetV4 backbone guarantees the computational feasibility for real-time edge deployment. This purposeful integration establishes a highly effective and robust paradigm for high-speed timber defect inspection.
Despite these advancements, this study currently relies on visible light imaging, which effectively characterizes surface morphology but lacks the penetrative capability to assess internal structural integrity (e.g., hidden voids, deep decay). Since the mechanical performance of load-bearing plywood is heavily dependent on the internal continuity of its constituent veneers, future research will aim to develop a multimodal non-destructive evaluation (NDE) conceptual framework. Specifically, this multimodal architecture would employ a parallel sensing and fusion strategy: utilizing the current visible-light YOLOv11 pipeline for high-resolution surface defect tracking, while synchronously integrating X-ray computed tomography (CT) to map internal density variations and Near-Infrared (NIR) spectroscopy to evaluate moisture gradients and chemical anomalies. By incorporating cross-domain attention mechanisms to fuse these heterogeneous data streams at the feature level, this evolution will enable a holistic quality assessment—from surface texture to internal structural integrity—thereby facilitating the precise prediction of the mechanical properties (such as modulus of rupture) of the manufactured plywood. Finally, regarding data diversity, the current dataset is geographically localized. Given that the variability in Eucalyptus spp. growth conditions significantly affects the physical properties of the timber, future work will expand the dataset to include diverse provenances and species. This expansion aims to enhance the model’s robustness across global timber supply chains and establish a standardized, data-driven framework for the quality assurance of engineered wood products.
5. Conclusions
To guarantee the mechanical performance and safety standards of eucalyptus plywood in construction applications, this study proposed and validated an intelligent quality control and video enhancement solution based on deep learning. Addressing the heterogeneity of bio-based materials—specifically defect complexity and background interference—the YOLOv11-DMS-Veneers model achieved significant breakthroughs in detection accuracy and efficiency by integrating the Dynamic Head multi-dimensional attention mechanism, the MobileNetV4 lightweight backbone network, and the Shape-IoU geometric shape loss function.
Experimental results demonstrate that while maintaining an extremely low computational load (4.5 GFlops, 1.93 M parameter count), the model achieved an mAP@50 of 96.0%. It comprehensively outperformed mainstream models (Faster R-CNN, SSD, YOLOv8) in detecting five categories of critical defects: live knots, dead knots, cracks, decay, and knot holes. Crucially, for structural weaknesses like slender cracks and minute knot holes, detection precision reached 0.939 and 0.969, respectively, proving the effectiveness of the improvement modules in characterizing the complex geometric features of construction-grade veneers.
Furthermore, to ensure rigorous quality monitoring under high-speed manufacturing conditions, this study innovatively introduced the ERD video enhancement system (incorporating ESRGAN, RIFE, and DnCNN). Under extreme operating conditions with conveyor speeds reaching 24 m/min (V5), this system improved the average detection confidence by 0.288 compared to the original video, maintaining a high maximum confidence of 0.890.
In conclusion, the synergy of the YOLOv11-DMS-Veneers model and ERD technology not only theoretically addresses the dual challenges of “multi-scale detection” and “dynamic blur” but also provides a robust, automated grading solution for ensuring the quality consistency of engineered wood products. Nevertheless, it must be acknowledged that the current framework is constrained by its validation on a single-species Eucalyptus spp. dataset and its exclusive reliance on visible-light surface imaging. To overcome these limitations and achieve robust cross-domain generalizability across diverse commercial tree species, future research will further explore multimodal sensing technologies to achieve non-destructive evaluation (NDE) of internal defects, thereby supporting the standardization of sustainable building materials and facilitating the high-value application of plantation timber in the construction industry.
Author Contributions
Conceptualization, writing—original draft preparation, H.L.; writing—review and editing, funding acquisition, Z.L.; methodology, M.Q.; software, validation, S.X., Y.H. and X.T.; supervision, L.D. All authors have read and agreed to the published version of the manuscript.
Funding
This research was funded by the Key R&D Program Project of Yunnan Provincial: Key Technology Research and Application Demonstration of Public Rail Intermodal Intelligent Logistics Park, grant number (202503AA080013); Yunnan Provincial Department of Education Scientific Research Fund Project (2026Y0885); Research on Intelligent Perception and Mending Methods for Rotary-Cut Veneer in Plywood (YJS-KCJJ-2025-24); Yunnan Fundamental Research Projects, grant number (202501AT070245).
Data Availability Statement
The data presented in this study are available on request from the corresponding author.
Acknowledgments
The authors express profound gratitude to the editor and reviewers for their insightful feedback and recommendations, which significantly enhanced the quality of this paper.
Conflicts of Interest
The authors declare no conflicts of interest.
References
- Kwon, J.H.; Ayrilmis, N.; Han, T.H. Enhancement of flexural properties and dimensional stability of rice husk particleboard using wood strands in face layers. Compos. Part B Eng. 2013, 44, 728–732. [Google Scholar] [CrossRef] [Scilit]
- Pan, Z.; Zheng, Y.; Zhang, R.; Jenkins, B.M. Physical properties of thin particleboard made from saline eucalyptus. Ind. Crop. Prod. 2007, 26, 185–194. [Google Scholar] [CrossRef] [Scilit]
- Liao, Y.; Tu, D.; Zhou, J.; Zhou, H.; Yun, H.; Gu, J.; Hu, C. Feasibility of manufacturing cross-laminated timber using fast-grown small diameter eucalyptus lumbers. Constr. Build. Mater. 2017, 132, 508–515. [Google Scholar] [CrossRef] [Scilit]
- Taskhiri, M.S.; Hafezi, M.H.; Harle, R.; Williams, D.; Kundu, T.; Turner, P. Ultrasonic and thermal testing to non-destructively identify internal defects in plantation eucalypts. Comput. Electron. Agric. 2020, 173, 105396. [Google Scholar] [CrossRef] [Scilit]
- Balasso, M.; Hunt, M.; Jacobs, A.; O’Reilly-Wapstra, J. Characterisation of wood quality of Eucalyptus nitens plantations and predictive models of density and stiffness with site and tree characteristics. For. Ecol. Manag. 2021, 491, 118992. [Google Scholar] [CrossRef] [Scilit]
- Pearson, H.; Donaldson, L.; Kimberley, M. Mitigation of cellular collapse during drying of Eucalyptus nitens wood using supercritical CO2 dewatering. IAWA J. 2022, 44, 1–20. [Google Scholar] [CrossRef] [Scilit]
- Vega, M.; Hamilton, M.G.; Blackburn, D.P.; McGavin, R.L.; Baillères, H.; Potts, B.M. Influence of site, storage and steaming on Eucalyptus nitens log-end splitting. Ann. For. Sci. 2016, 73, 257–266. [Google Scholar] [CrossRef] [Scilit]
- Balasso, M.; Hunt, M.; Jacobs, A.; O’Reilly-Wapstra, J. Development of a segregation method to sort fast-grown Eucalyptus nitens (H. Deane & Maiden) Maiden plantation trees and logs for higher quality structural timber products. Ann. For. Sci. 2022, 79, 9. [Google Scholar] [CrossRef] [Scilit]
- Burnard, M.; Leavengood, S.; Muszyński, L.; Ganio, L. Investigating face veneer check development in decorative plywood panels: The impact of four common manufacturing factors. Eur. J. Wood Wood Prod. 2019, 77, 961–979. [Google Scholar] [CrossRef] [Scilit]
- Ge, Y.; Jiang, D.; Sun, L. Wood veneer defect detection based on multiscale DETR with position encoder net. Sensors 2023, 23, 4837. [Google Scholar] [CrossRef] [Scilit]
- Xia, J.; Jeong, Y.; Yoon, J. An automatic machine vision-based algorithm for inspection of hardwood flooring defects during manufacturing. Eng. Appl. Artif. Intell. 2023, 123, 106268. [Google Scholar] [CrossRef] [Scilit]
- Khan, S.; Naseer, M.; Hayat, M.; Zamir, S.W.; Khan, F.S.; Shah, M. Transformers in vision: A survey. ACM Comput. Surv. (CSUR) 2022, 54, 1–41. [Google Scholar] [CrossRef] [Scilit]
- Blomme, E.; Bulcaen, D.; Cool, T.; Declercq, F.; Lust, P. Air-coupled ultrasonic assessment of wood veneer. Ultrasonics 2010, 50, 180–187. [Google Scholar] [CrossRef] [Scilit]
- Tiitta, M.; Tiitta, V.; Gaal, M.; Heikkinen, J.; Lappalainen, R.; Tomppo, L. Air-coupled ultrasound detection of natural defects in wood using ferroelectret and piezoelectric sensors. Wood Sci. Technol. 2020, 54, 1051–1064. [Google Scholar] [CrossRef] [Scilit]
- Krähenbühl, A.; Kerautret, B.; Debled-Rennesson, I.; Mothe, F.; Longuetaud, F. Knot segmentation in 3D CT images of wet wood. Pattern Recognit. 2014, 47, 3852–3869. [Google Scholar] [CrossRef] [Scilit]
- Roussel, J.; Mothe, F.; Krähenbühl, A.; Kerautret, B.; Debled-Rennesson, I.; Longuetaud, F. Automatic knot segmentation in CT images of wet softwood logs using a tangential approach. Comput. Electron. Agric. 2014, 104, 46–56. [Google Scholar] [CrossRef] [Scilit]
- Yu, H.; Liang, Y.; Liang, H.; Zhang, Y. Recognition of wood surface defects with near infrared spectroscopy and machine vision. J. For. Res. 2019, 30, 2379–2386. [Google Scholar] [CrossRef] [Scilit]
- Ding, F.; Zhuang, Z.; Liu, Y.; Jiang, D.; Yan, X.; Wang, Z. Detecting defects on solid wood panels based on an improved SSD algorithm. Sensors 2020, 20, 5315. [Google Scholar] [CrossRef] [Scilit] [PubMed]
- Chen, L.; Pardeshi, M.S.; Lo, W.; Sheu, R.; Pai, K.; Chen, C.; Tsai, P.; Tsai, Y. Edge-glued wooden panel defect detection using deep learning. Wood Sci. Technol. 2022, 56, 477–507. [Google Scholar] [CrossRef] [Scilit]
- Zhao, Z.; Yang, X.; Zhou, Y.; Sun, Q.; Ge, Z.; Liu, D. Real-time detection of particleboard surface defects based on improved YOLOV5 target detection. Sci. Rep. 2021, 11, 21777. [Google Scholar] [CrossRef] [Scilit]
- Nasir, V.; Ayanleye, S.; Kazemirad, S.; Sassani, F.; Adamopoulos, S. Acoustic emission monitoring of wood materials and timber structures: A critical review. Constr. Build. Mater. 2022, 350, 128877. [Google Scholar] [CrossRef] [Scilit]
- Yi, L.P.; Akbar, M.F.; Ab Wahab, M.N.; Rosdi, B.A.; Fauthan, M.A.; Shrifan, N.H. The prospect of artificial intelligence-based wood surface inspection: A review. IEEE Access 2024, 12, 84706–84725. [Google Scholar] [CrossRef] [Scilit]
- Esteban, L.G.; Fernández, F.G.; de Palacios, P.D.P.; Romero, R.M.; Cano, N.N. Artificial neural networks in wood identification: The case of two Juniperus species from the Canary Islands. IAWA J. 2009, 30, 87–94. [Google Scholar] [CrossRef] [Scilit]
- Urbonas, A.; Raudonis, V.; Maskeliūnas, R.; Damaševičius, R. Automated identification of wood veneer surface defects using faster region-based convolutional neural network with data augmentation and transfer learning. Appl. Sci. 2019, 9, 4898. [Google Scholar] [CrossRef] [Scilit]
- Longuetaud, F.; Mothe, F.; Kerautret, B.; Krähenbühl, A.; Hory, L.; Leban, J.M.; Debled-Rennesson, I. Automatic knot detection and measurements from X-ray CT images of wood: A review and validation of an improved algorithm on softwood samples. Comput. Electron. Agric. 2012, 85, 77–89. [Google Scholar] [CrossRef] [Scilit]
- Johansson, E.; Johansson, D.; Skog, J.; Fredriksson, M. Automated knot detection for high speed computed tomography on Pinus sylvestris L. and Picea abies (L.) Karst. using ellipse fitting in concentric surfaces. Comput. Electron. Agric. 2013, 96, 238–245. [Google Scholar] [CrossRef] [Scilit]
- Aguilera, C.A.; Aguilera, C.; Sappa, A.D. Melamine faced panels defect classification beyond the visible spectrum. Sensors 2018, 18, 3644. [Google Scholar] [CrossRef] [Scilit]
- Shi, J.; Li, Z.; Zhu, T.; Wang, D.; Ni, C. Defect detection of industry wood veneer based on NAS and multi-channel mask R-CNN. Sensors 2020, 20, 4398. [Google Scholar] [CrossRef] [Scilit]
- Li, D.; Xie, W.; Wang, B.; Zhong, W.; Wang, H. Data augmentation and layered deformable mask R-CNN-based detection of wood defects. IEEE Access 2021, 9, 108162–108174. [Google Scholar] [CrossRef] [Scilit]
- GB/T 9846-2015; Plywood for General Use. State Administration for Market Regulation: Beijing, China, 2015.
- Chun, T.H.; Hashim, U.R.; Ahmad, S.; Salahuddin, L.; Choon, N.H.; Kanchymalay, K. A review of the automated timber defect identification approach. Int. J. Electr. Comput. Eng. 2023, 13, 2156–2166. [Google Scholar]
- He, T.; Liu, Y.; Yu, Y.; Zhao, Q.; Hu, Z. Application of deep convolutional neural network on feature extraction and detection of wood defects. Measurement 2020, 152, 107357. [Google Scholar] [CrossRef] [Scilit]
- Xie, Y.H.; Wang, J.C. Study on the identification of the wood surface defects based on texture features. Optik 2015, 126, 2231–2235. [Google Scholar] [CrossRef] [Scilit]
- Dai, X.; Chen, Y.; Xiao, B.; Chen, D.; Liu, M.; Yuan, L.; Zhang, L. Dynamic Head: Unifying Object Detection Heads with Attentions. arXiv 2021, arXiv:2106.08322. [Google Scholar] [CrossRef] [Scilit]
- Wang, X. Research on Wood Defects Feature Imbalance Optimization and Recognition. IEEE Access 2025, 13, 23841–23850. [Google Scholar] [CrossRef] [Scilit]
- Zhang, H.; Zhang, S. Shape-IoU: More Accurate Metric considering Bounding Box Shape and Scale. arXiv 2023, arXiv:2312.17663. [Google Scholar]
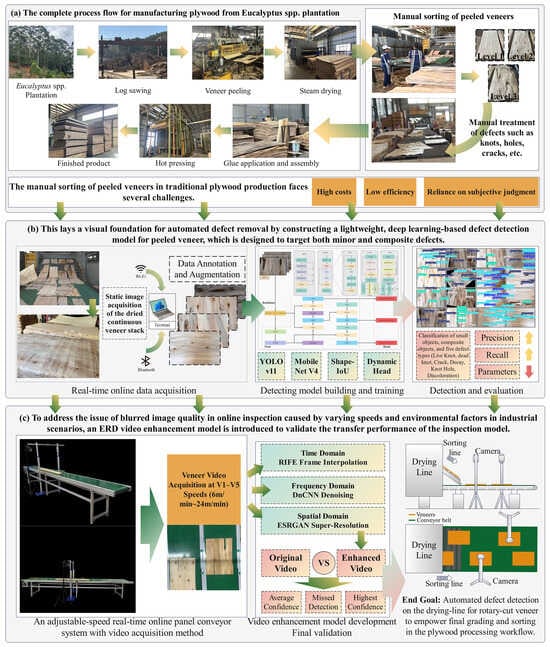
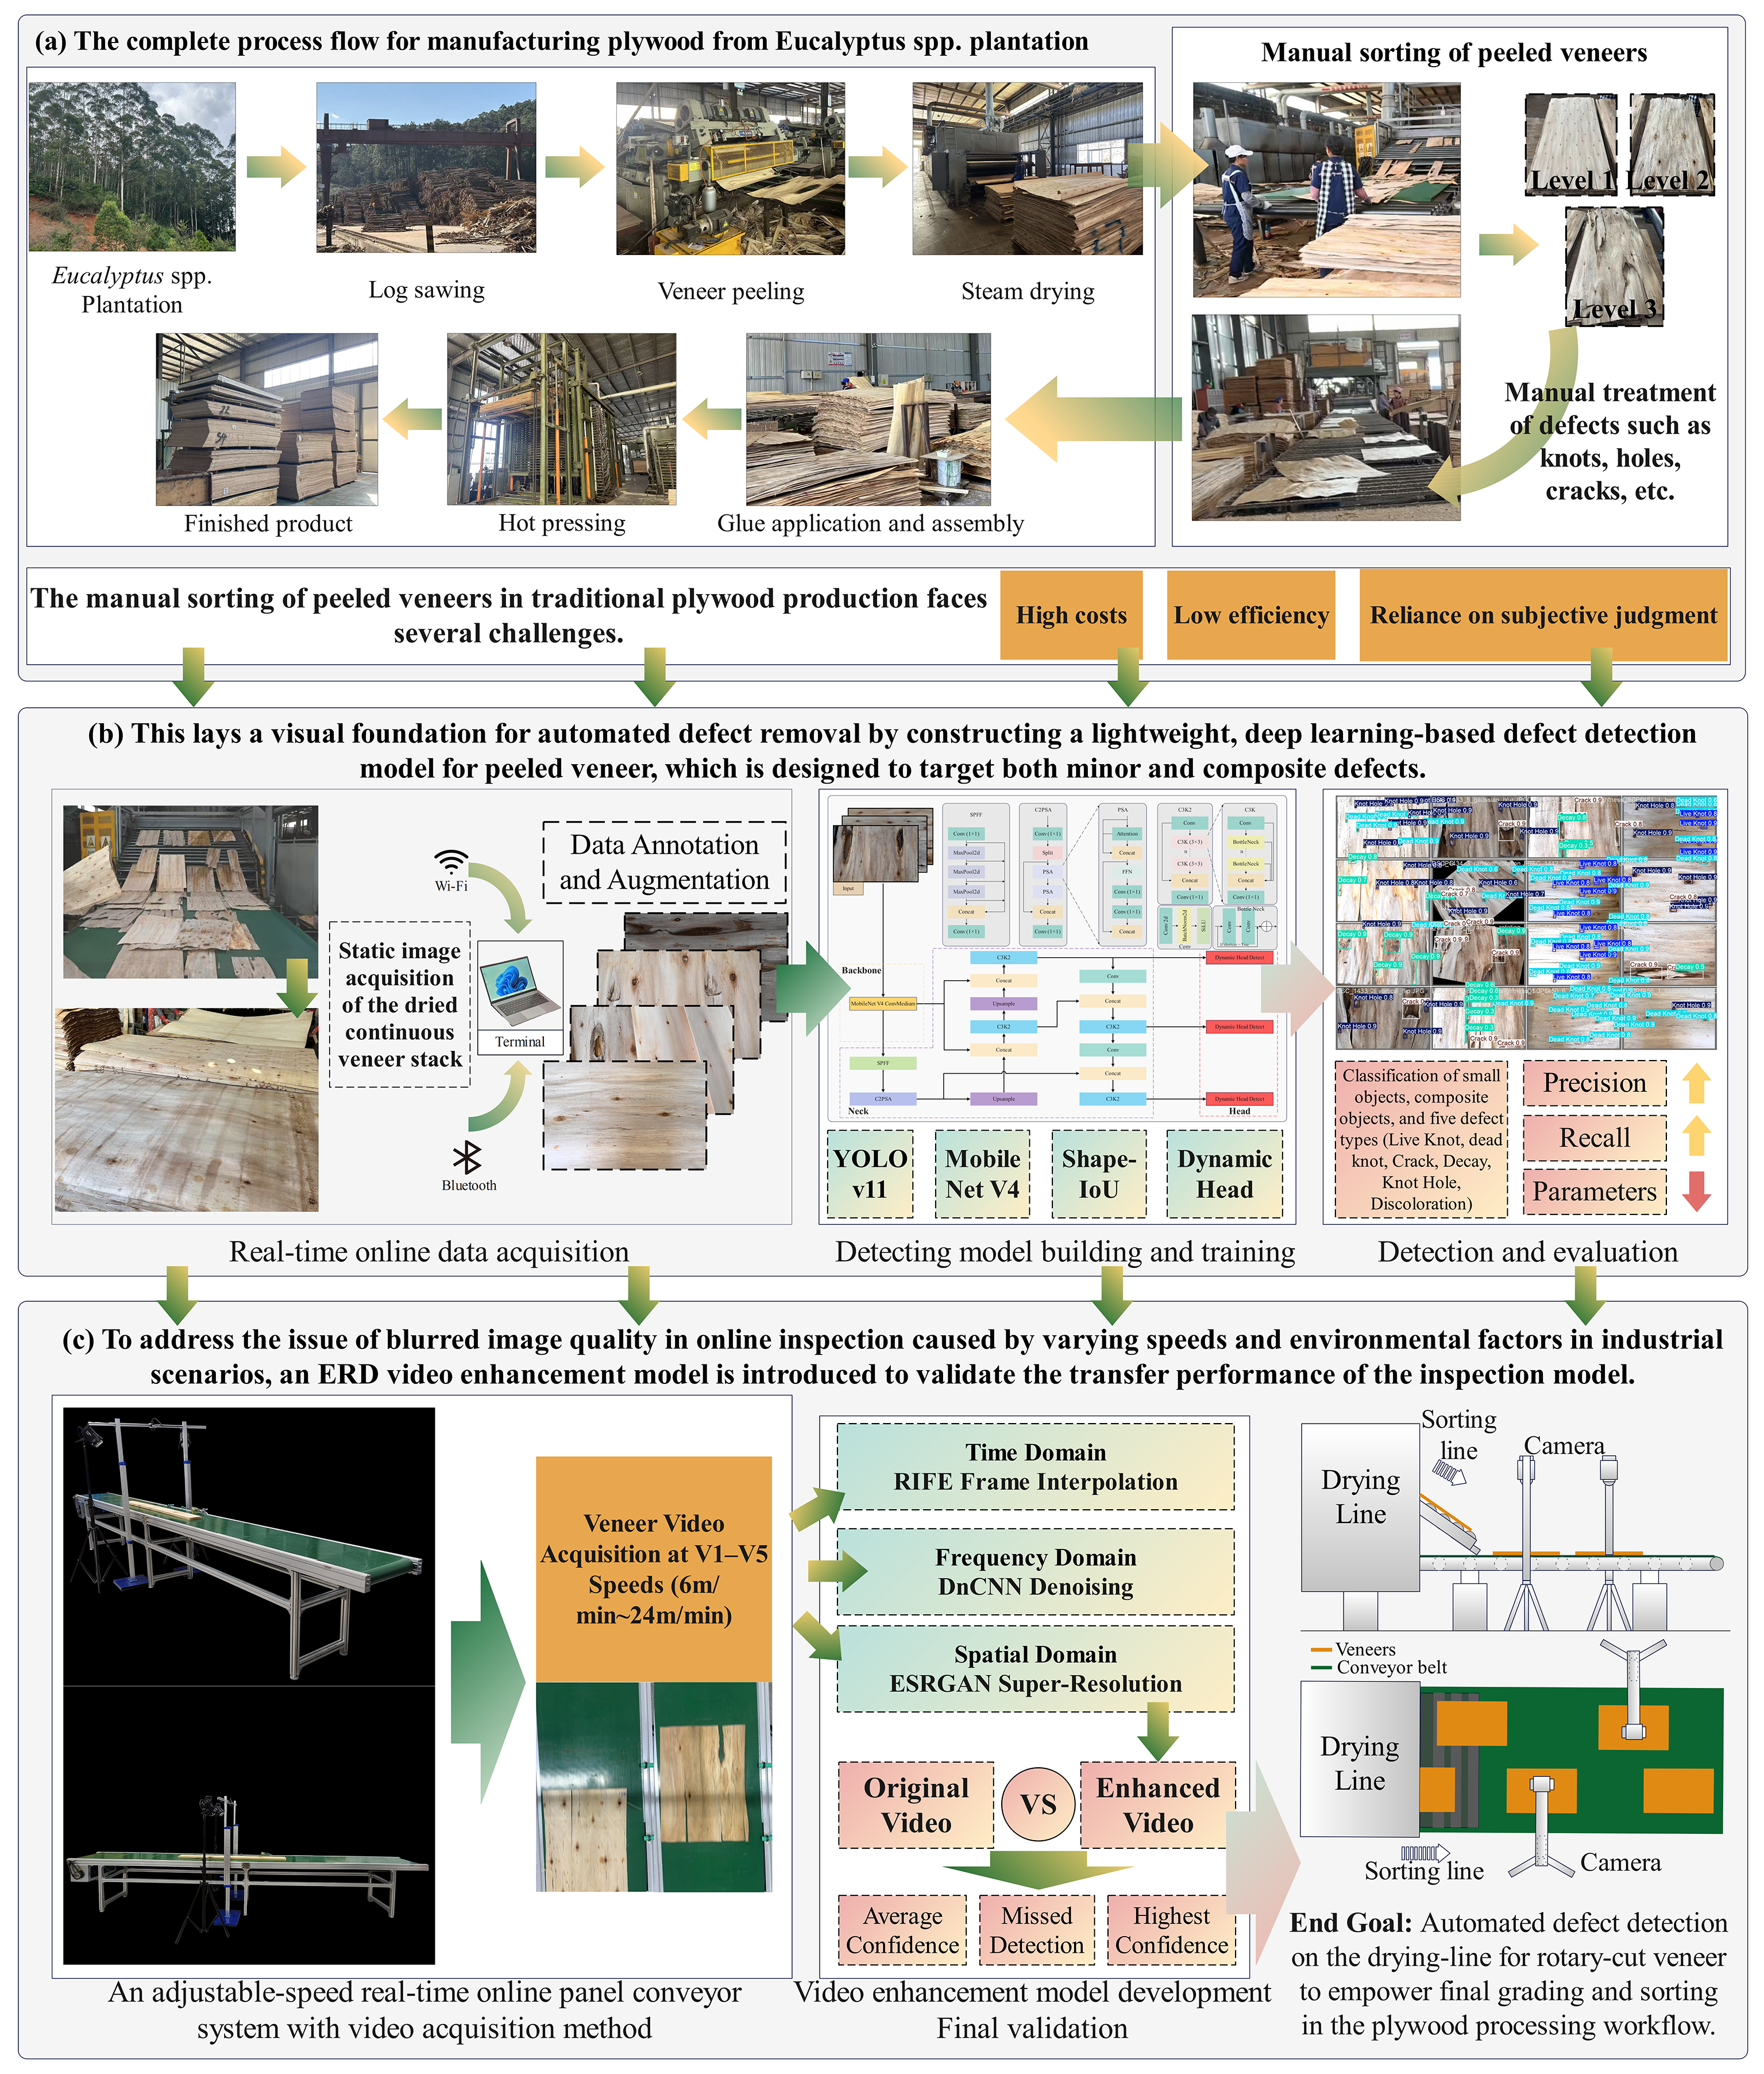
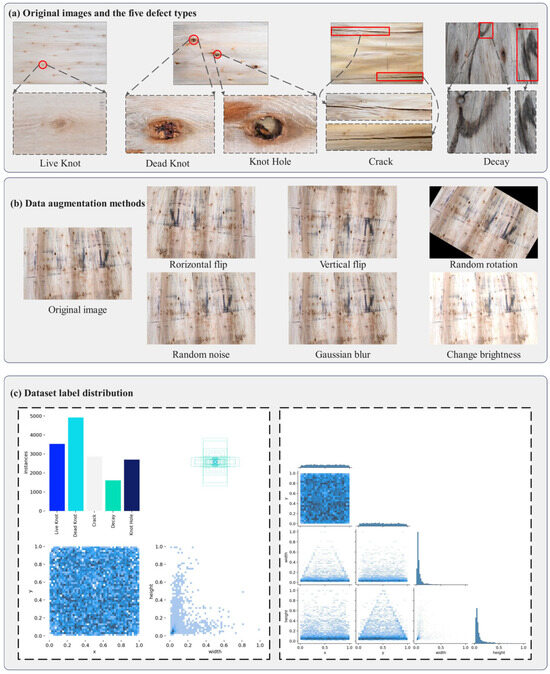
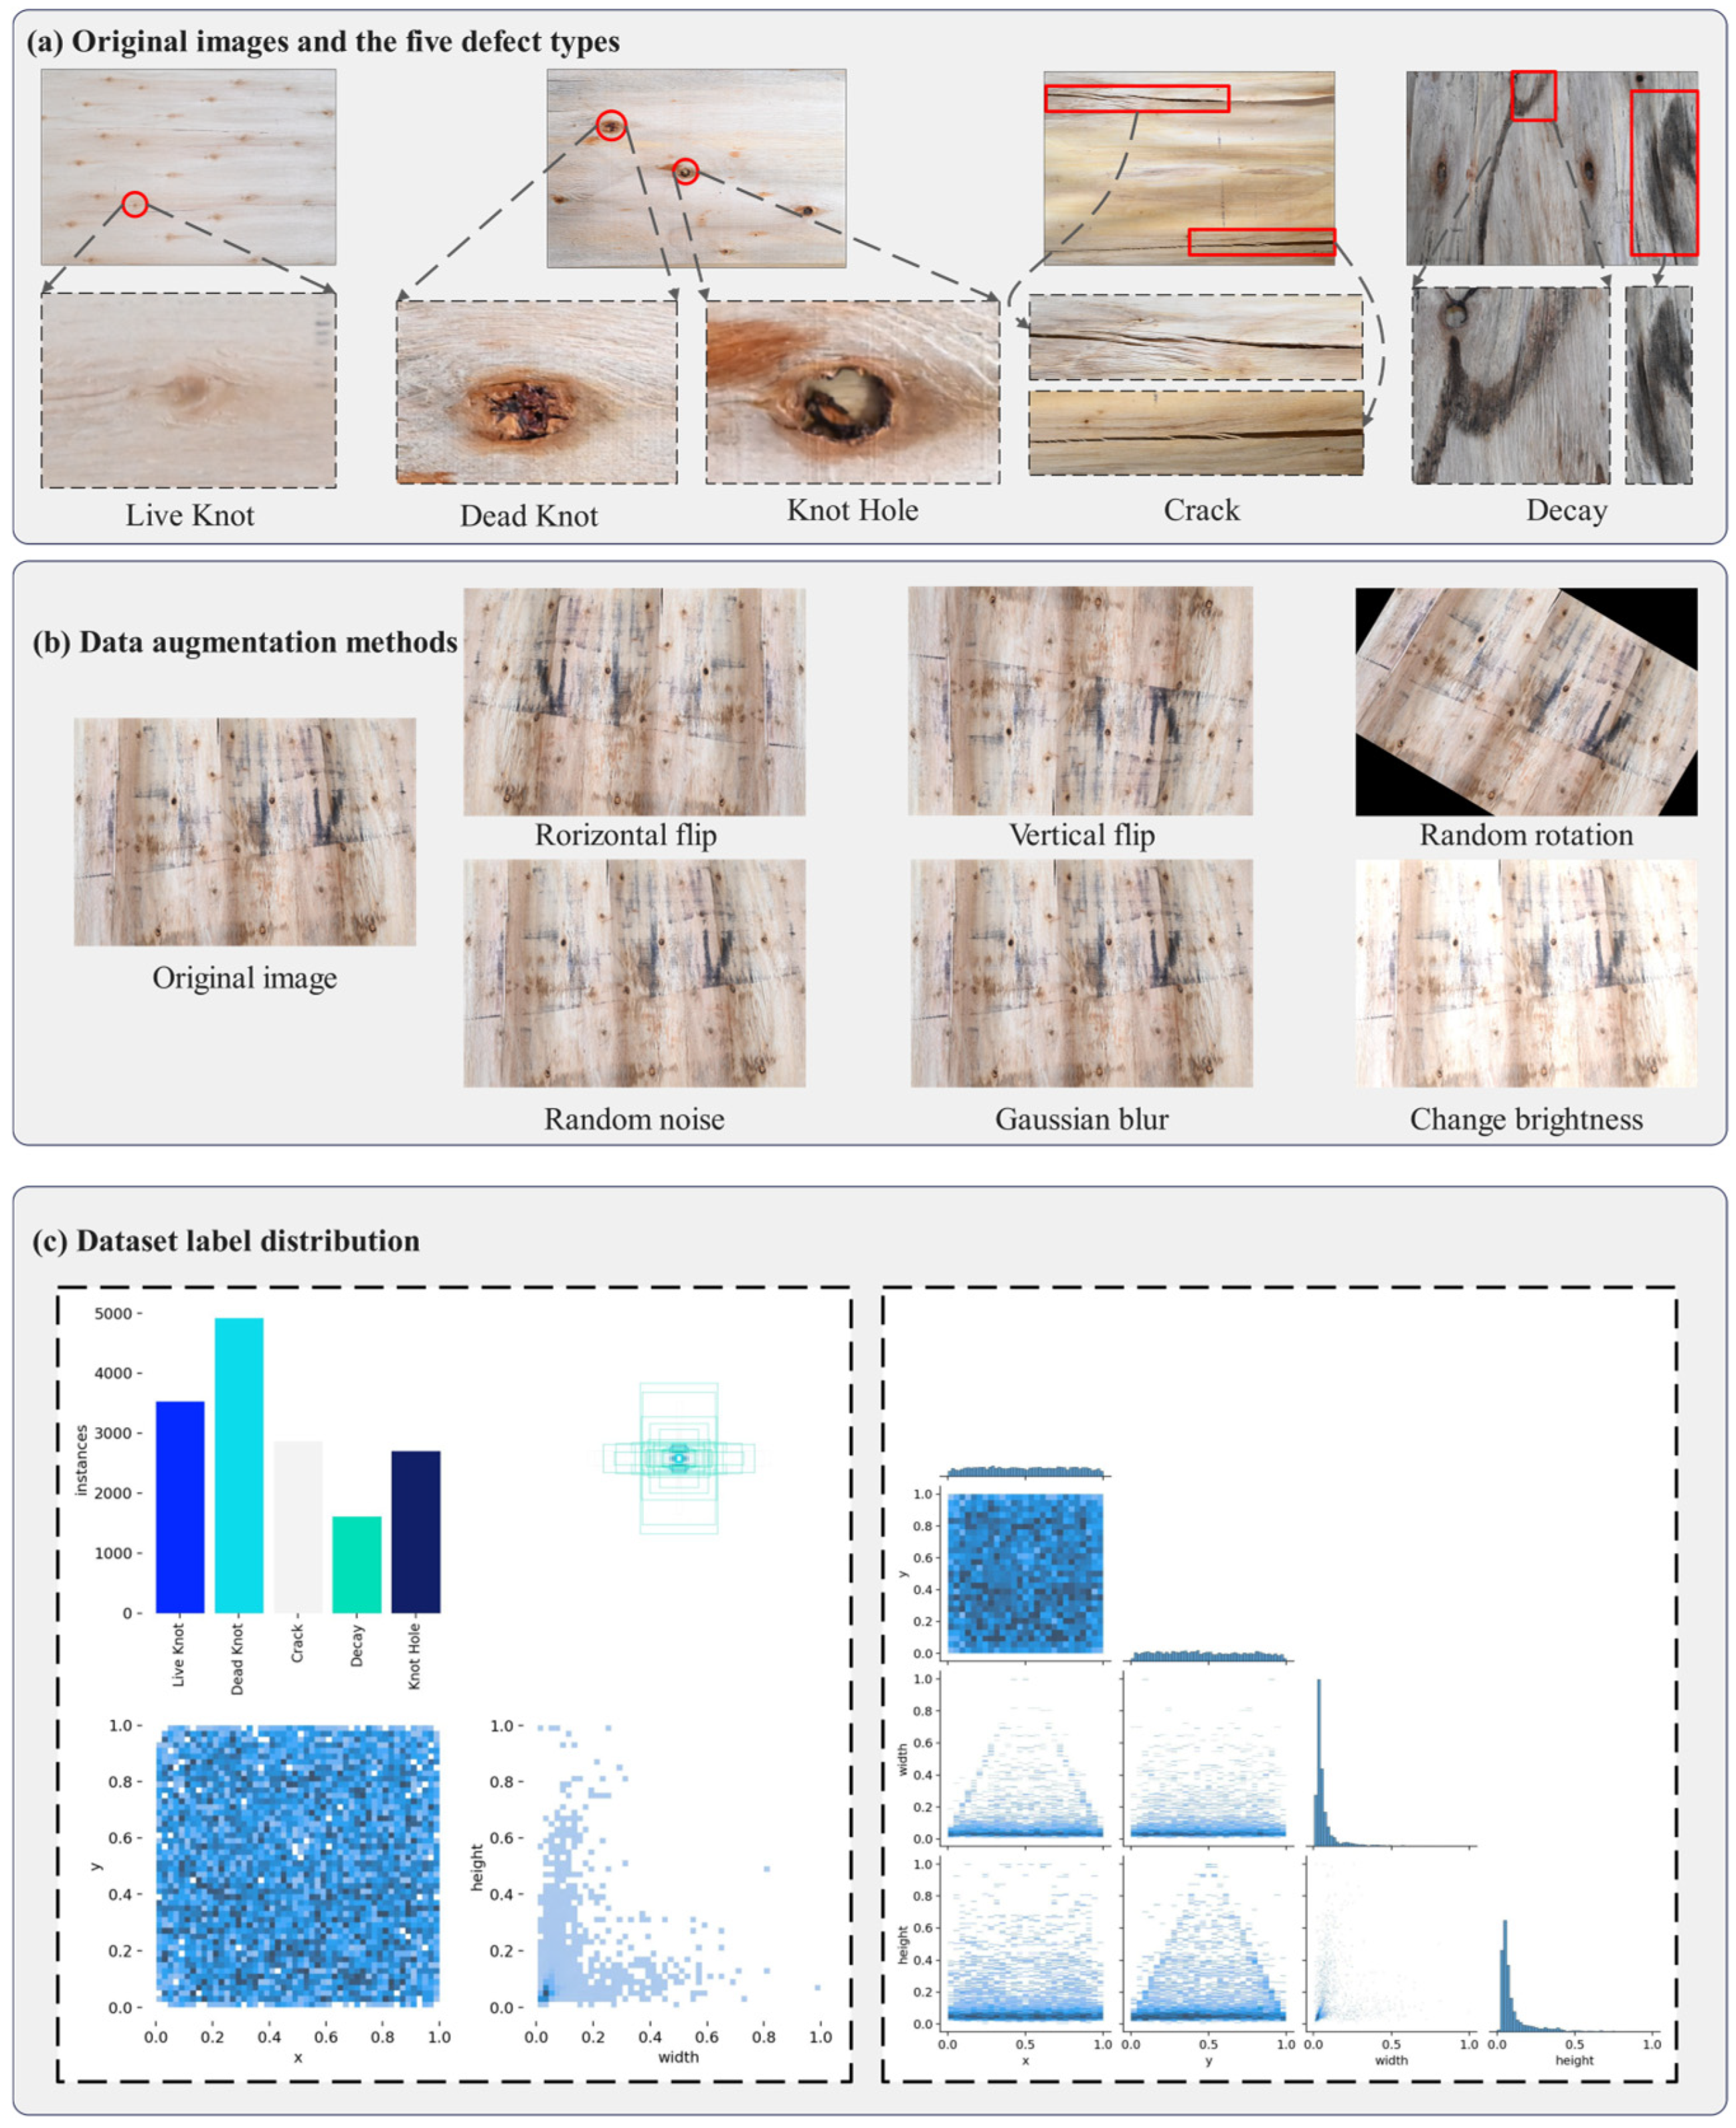
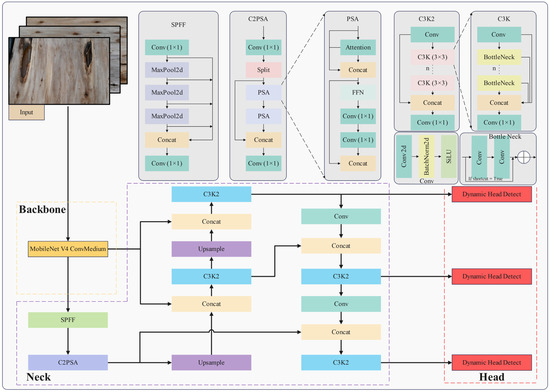
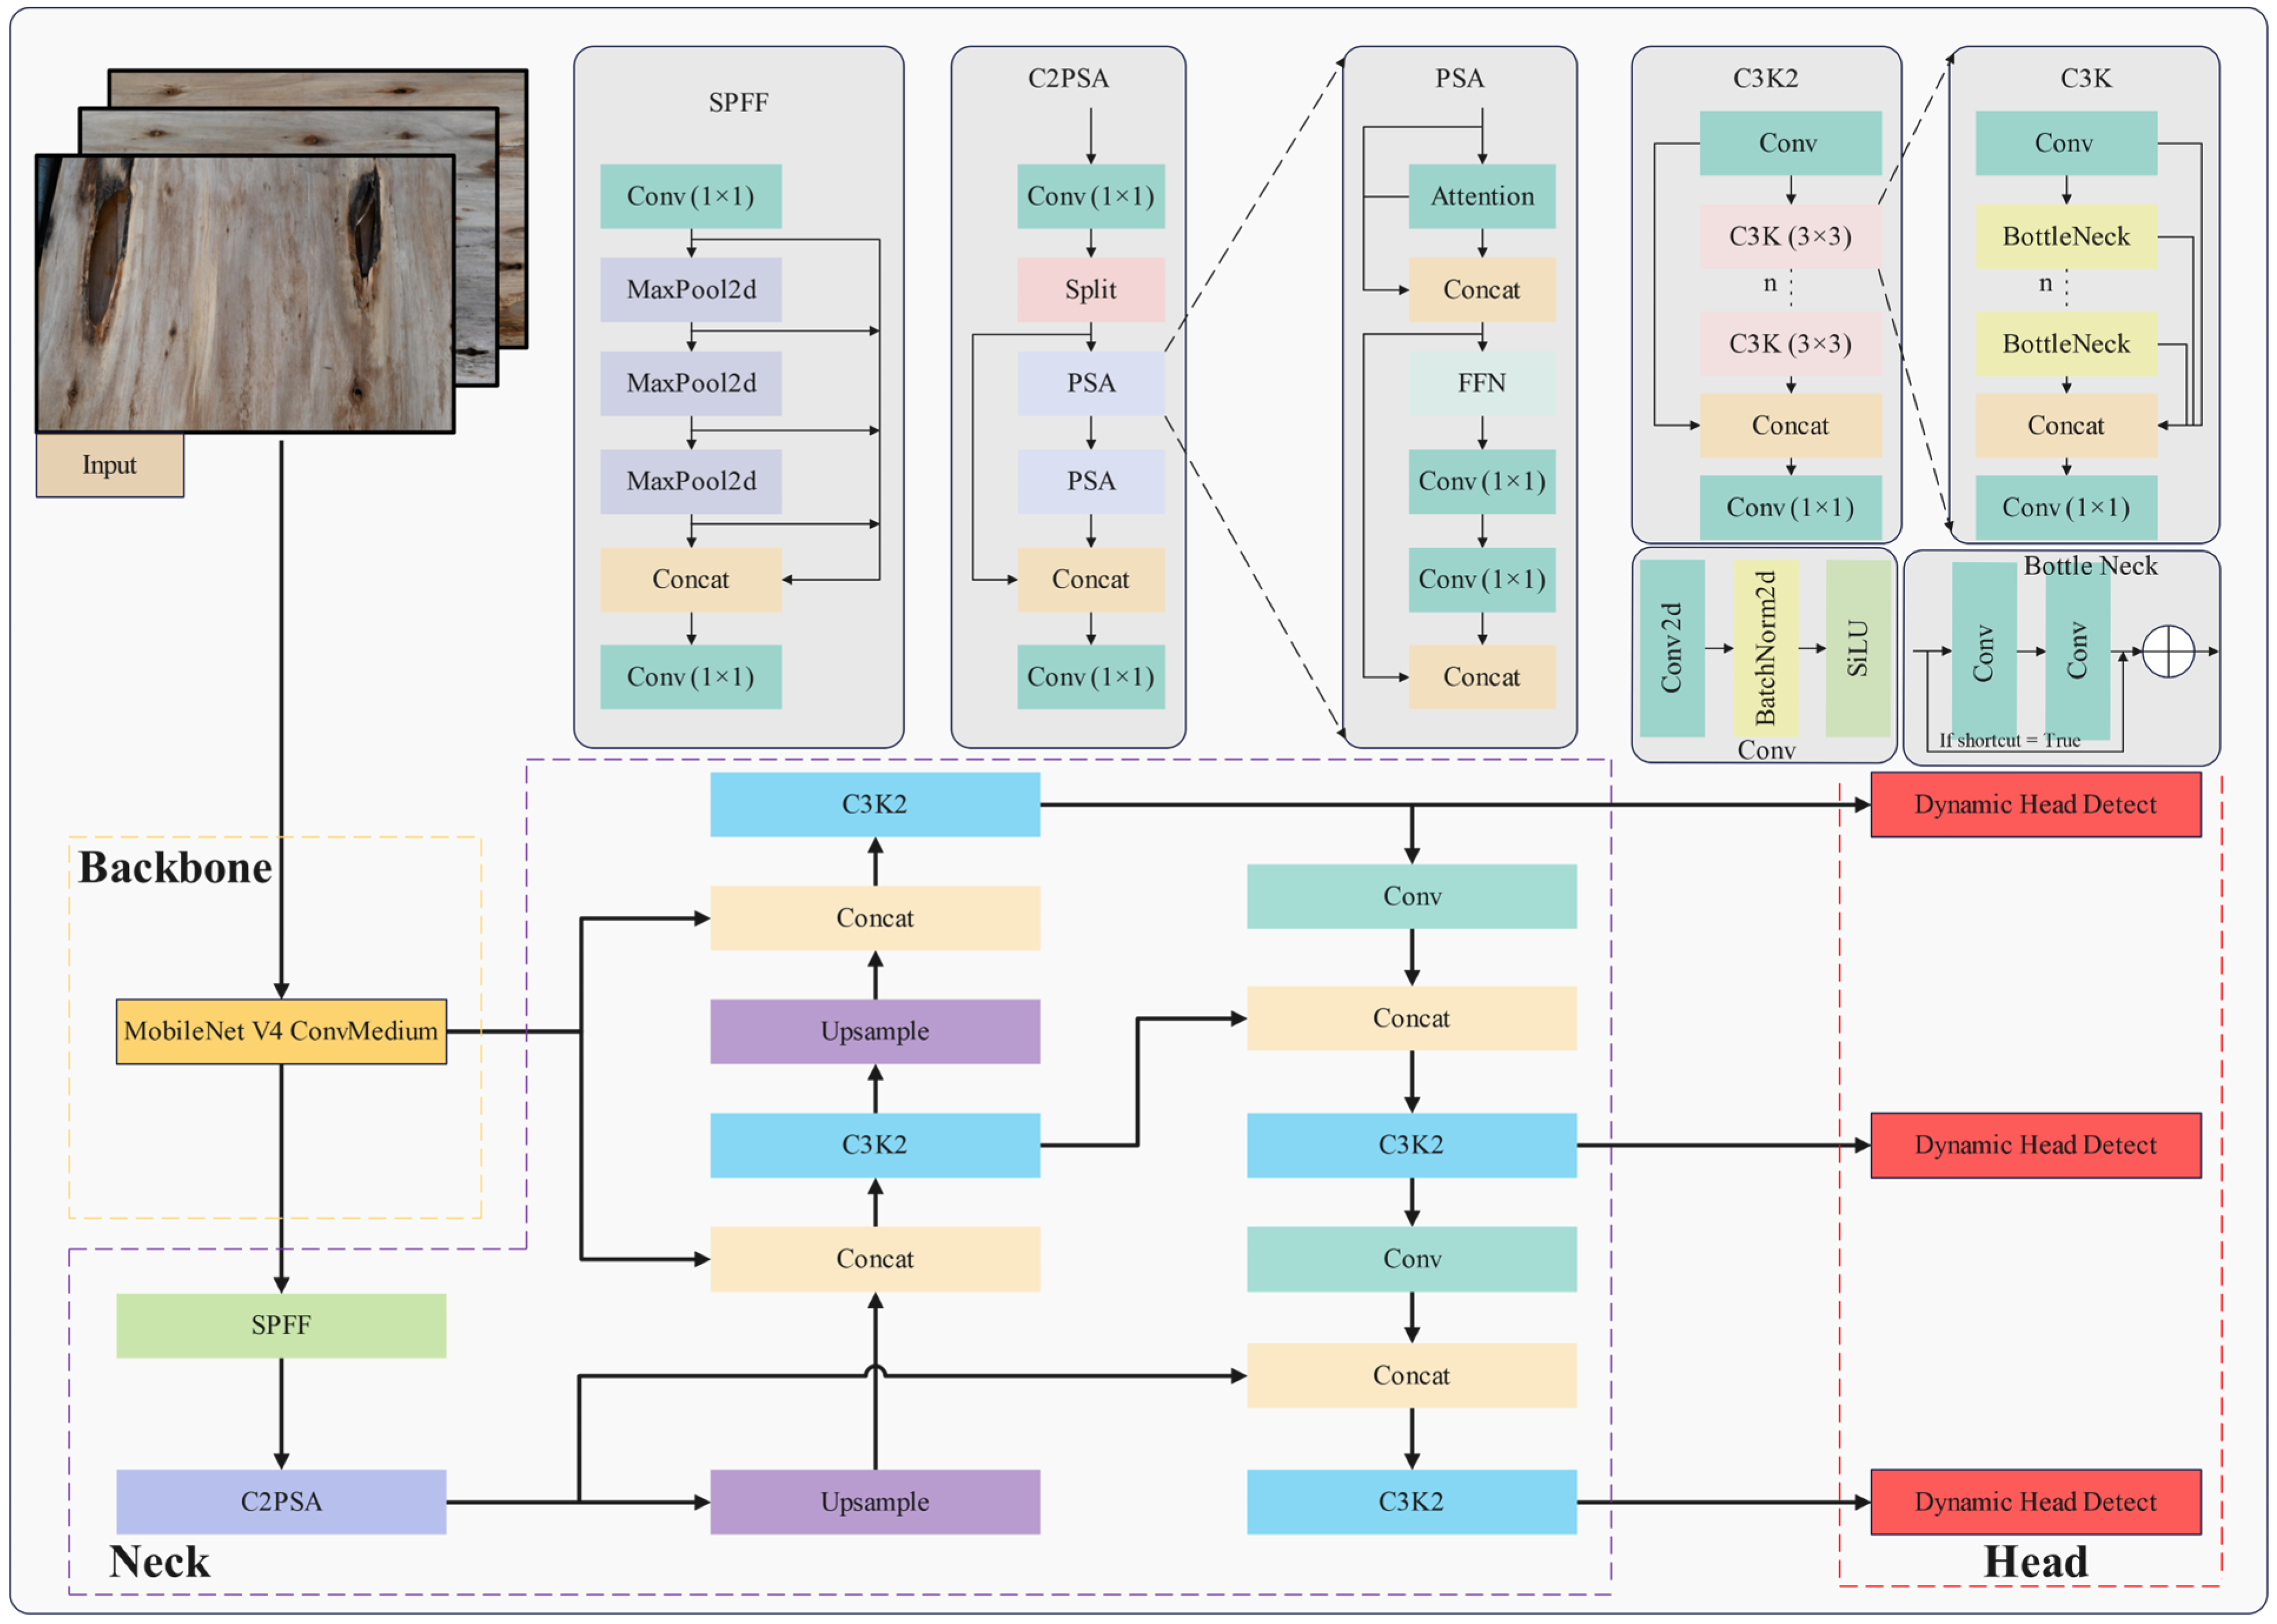
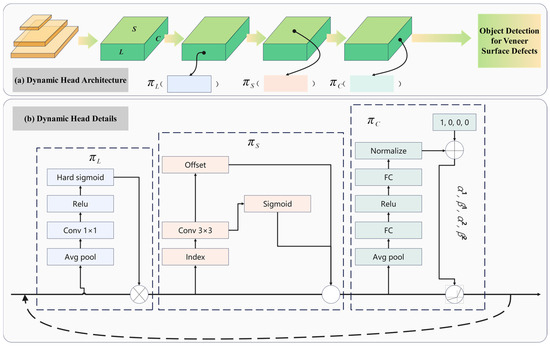
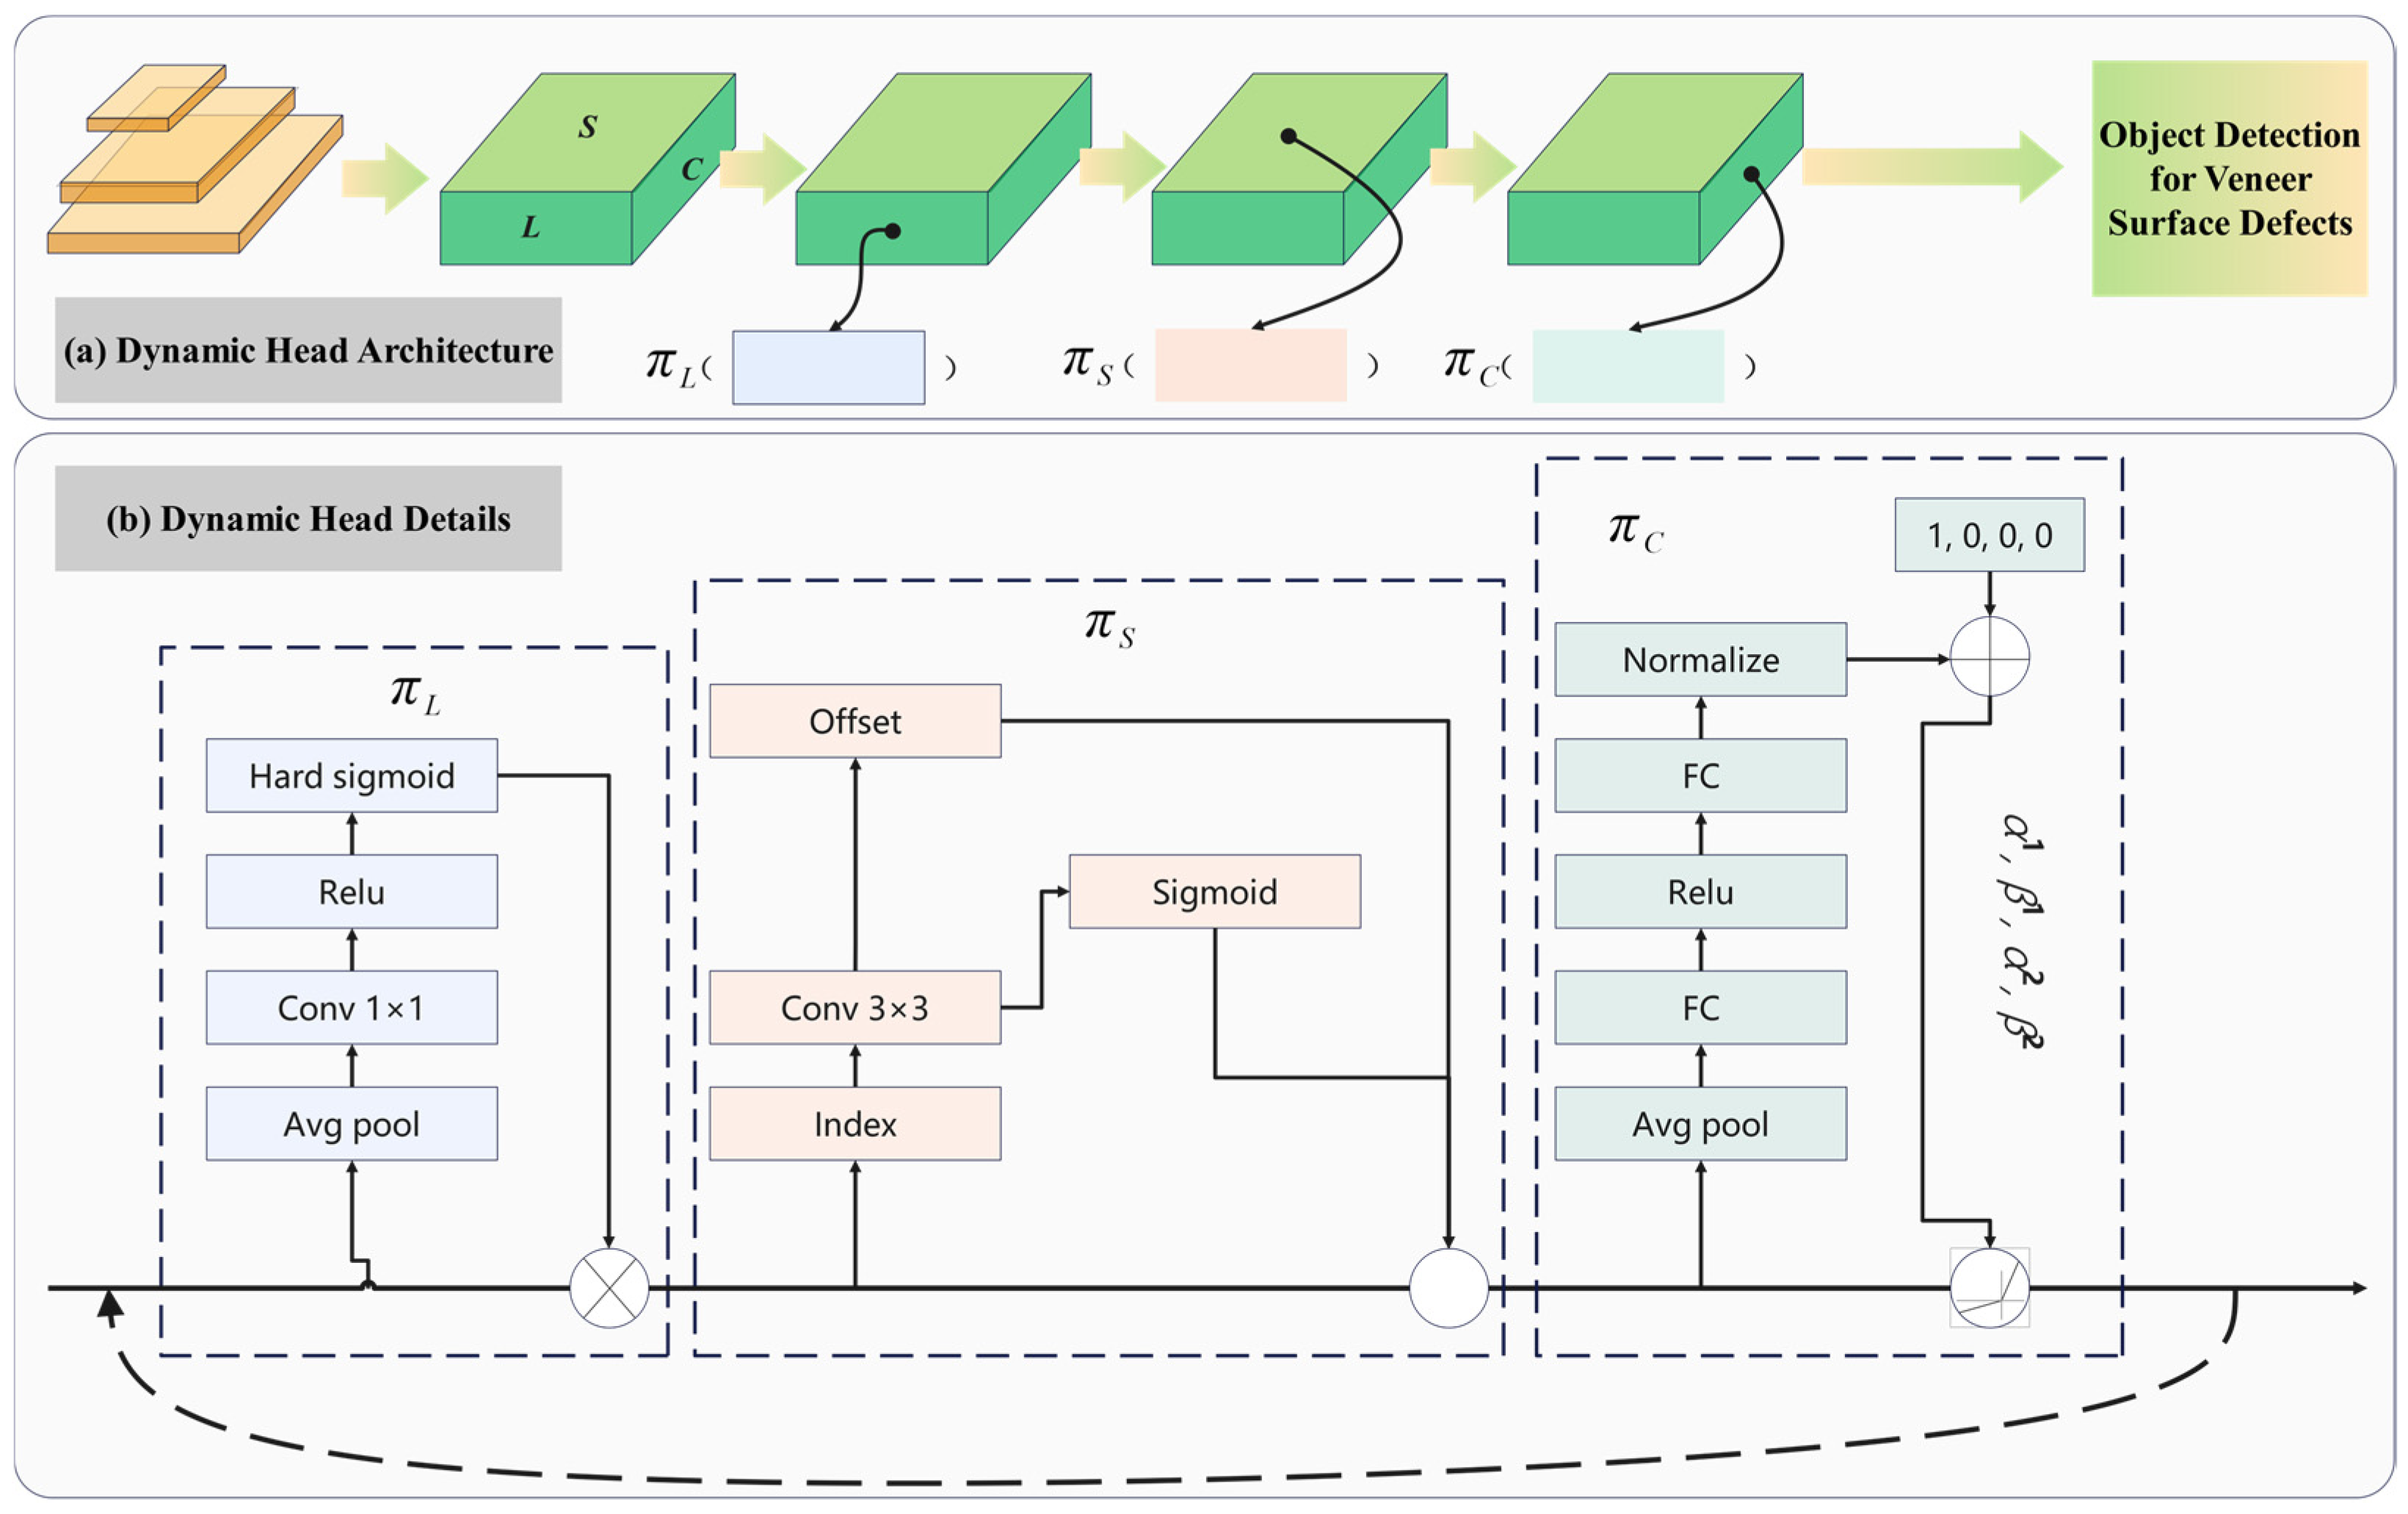
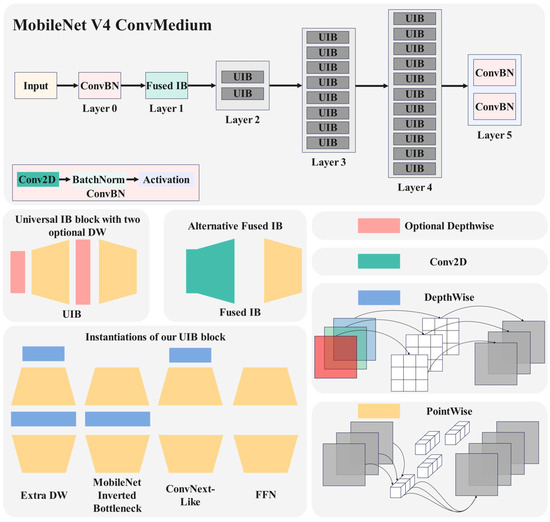
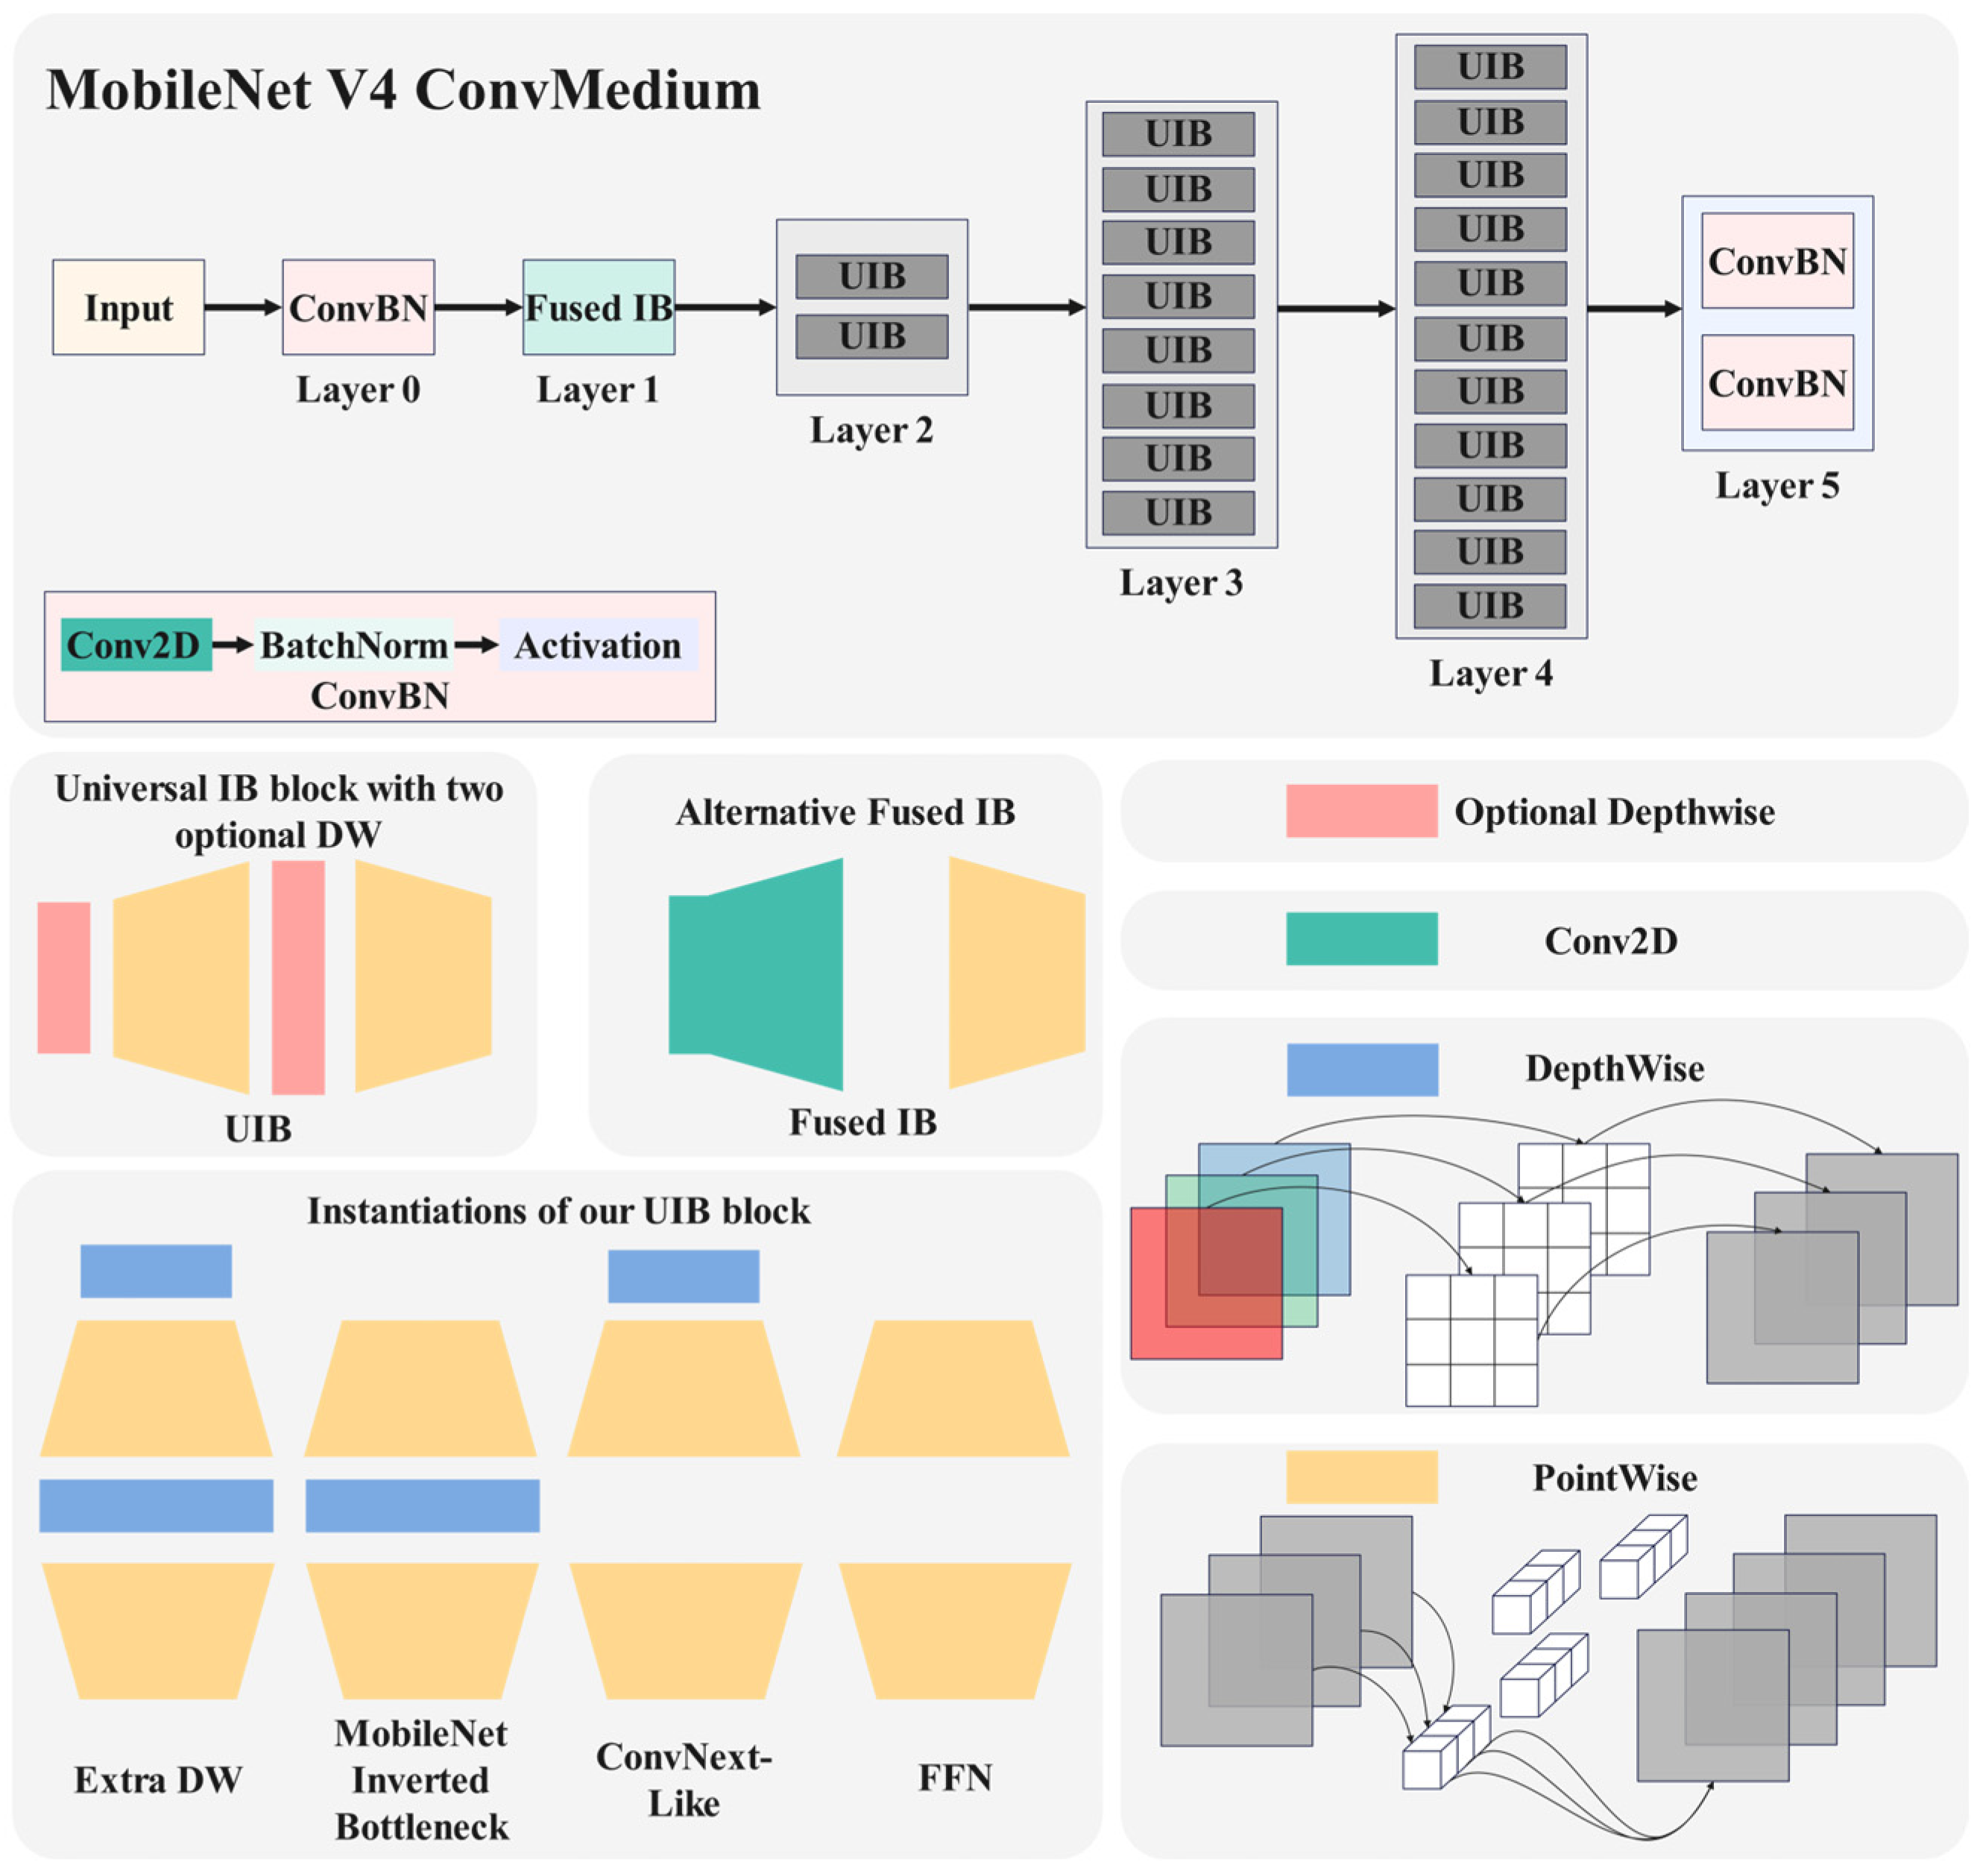
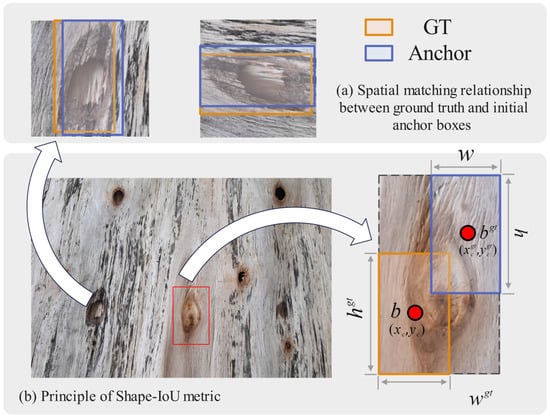
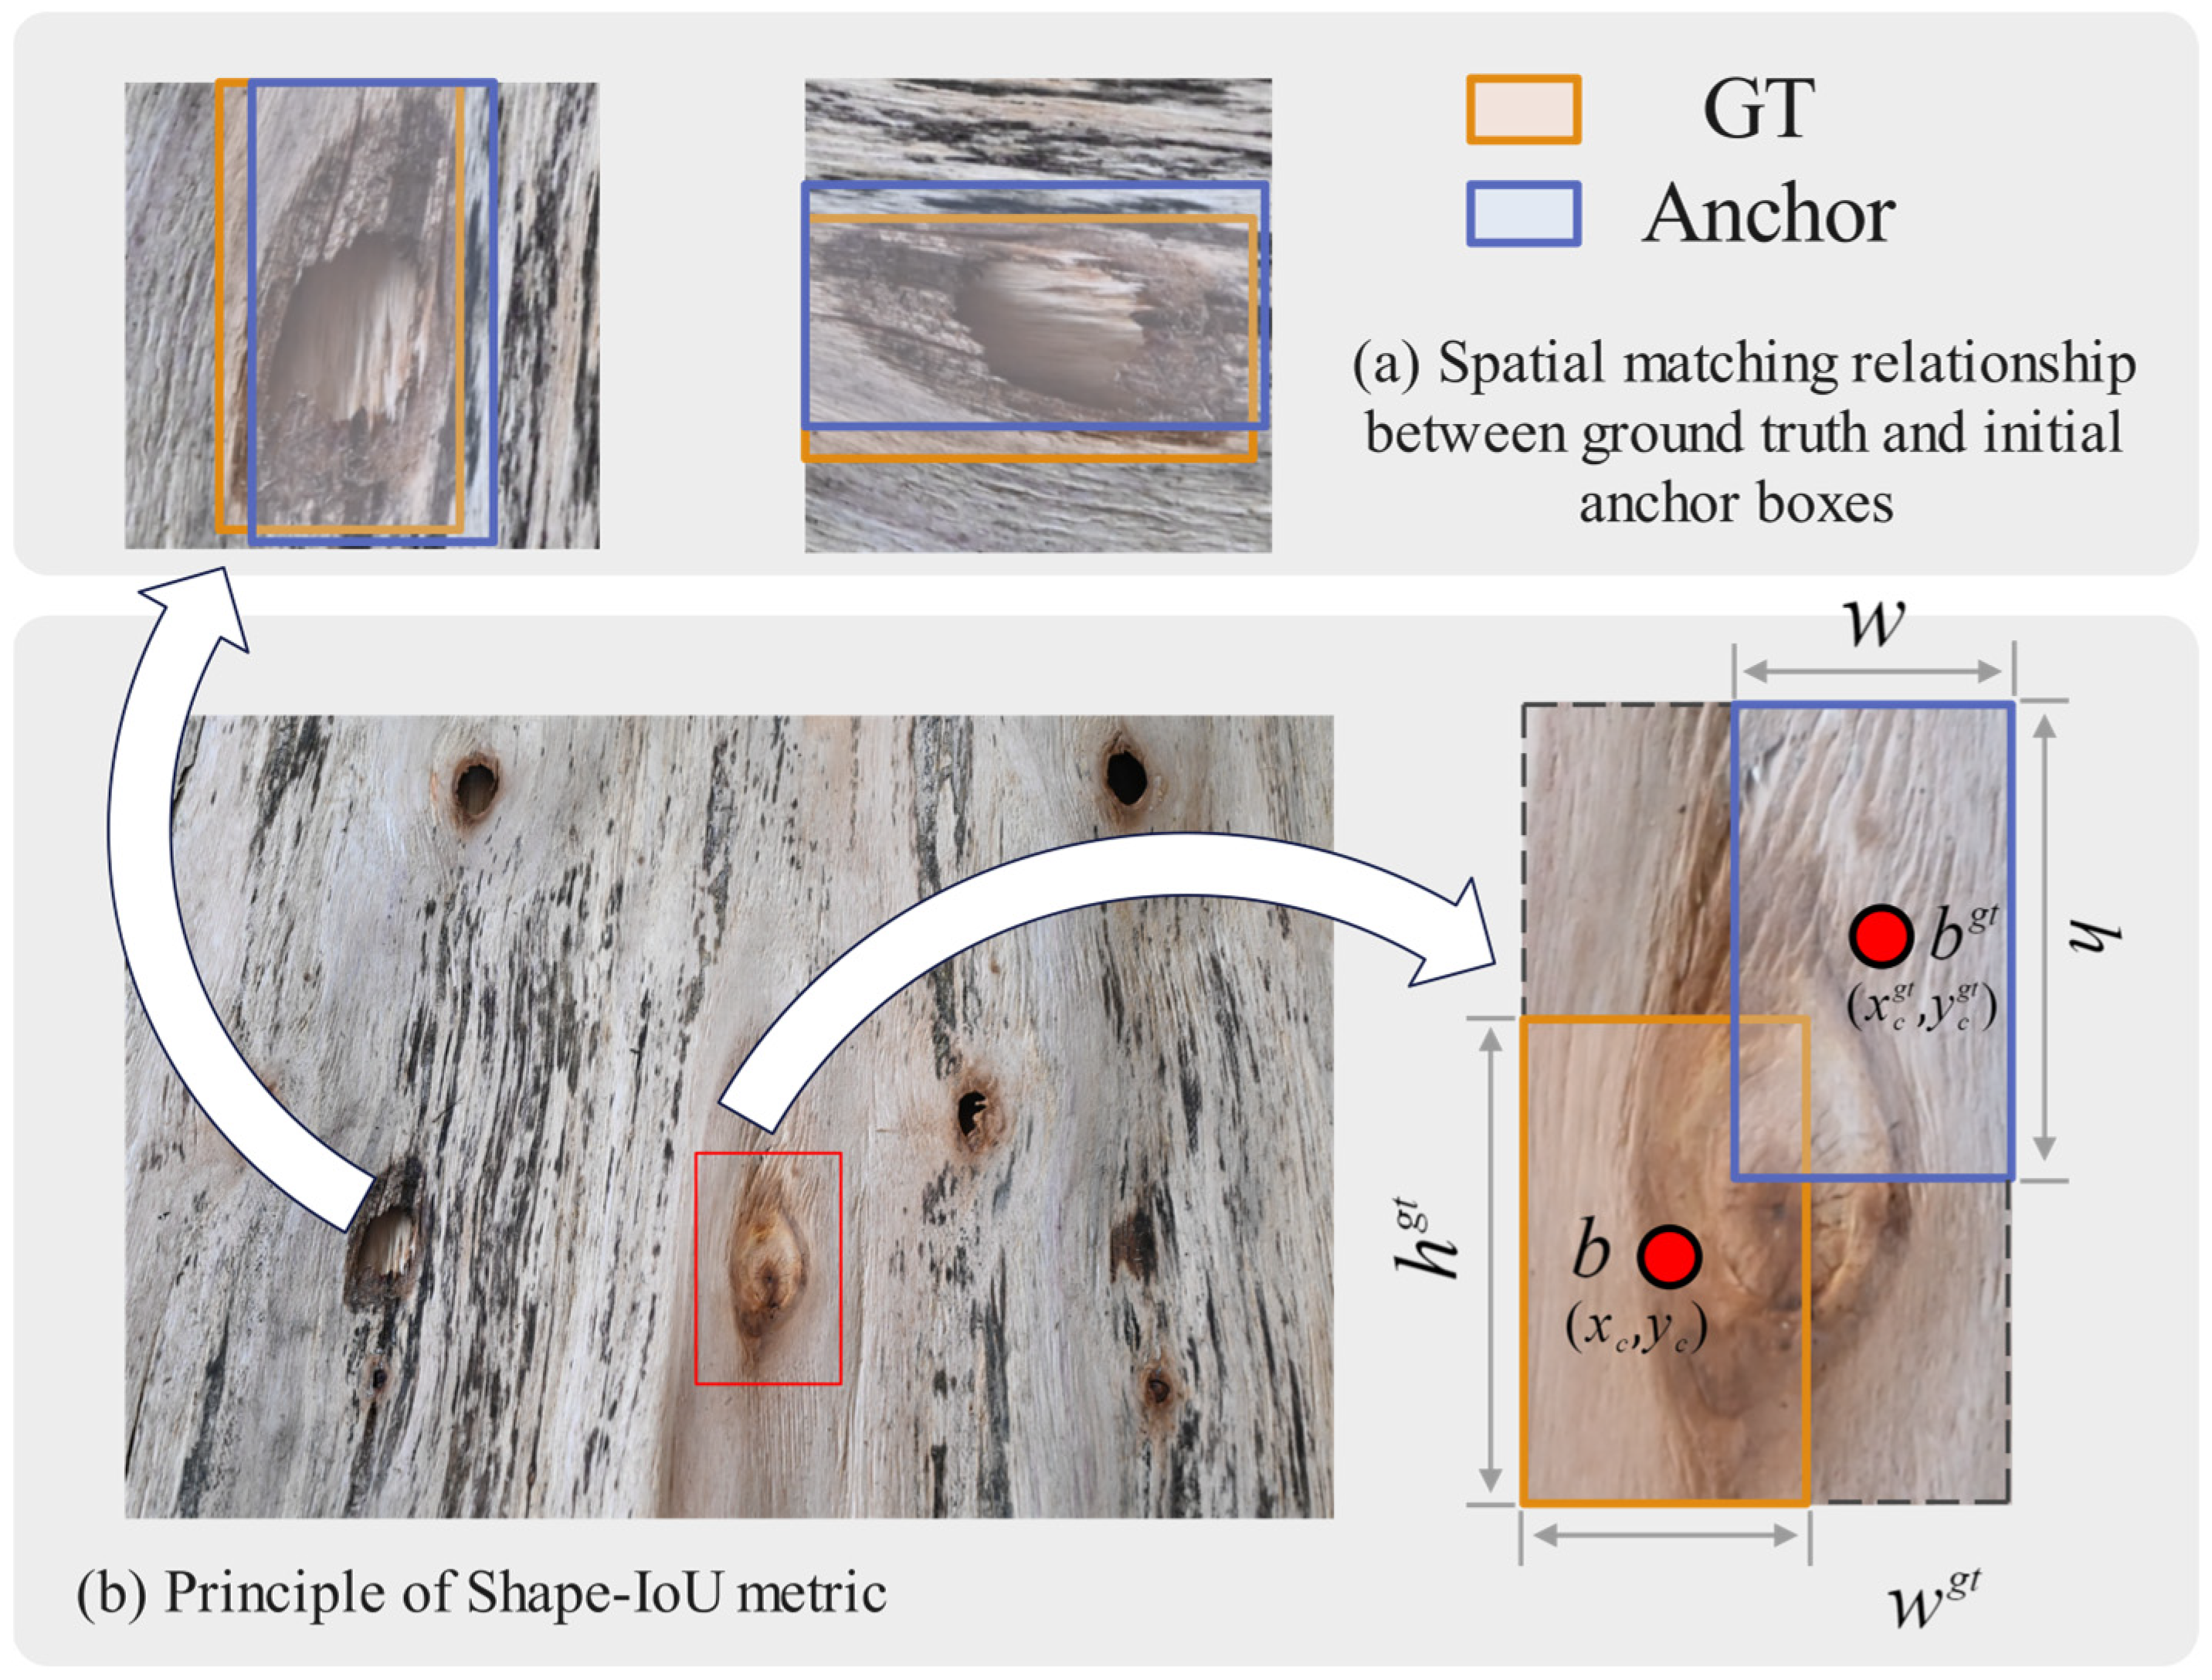
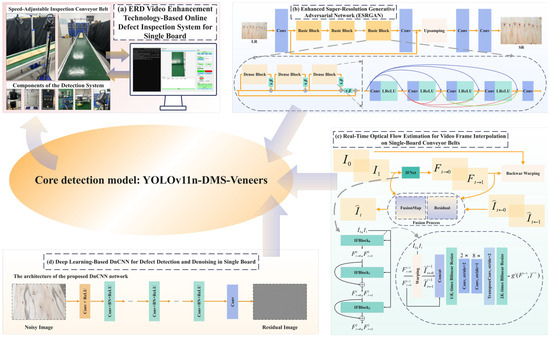
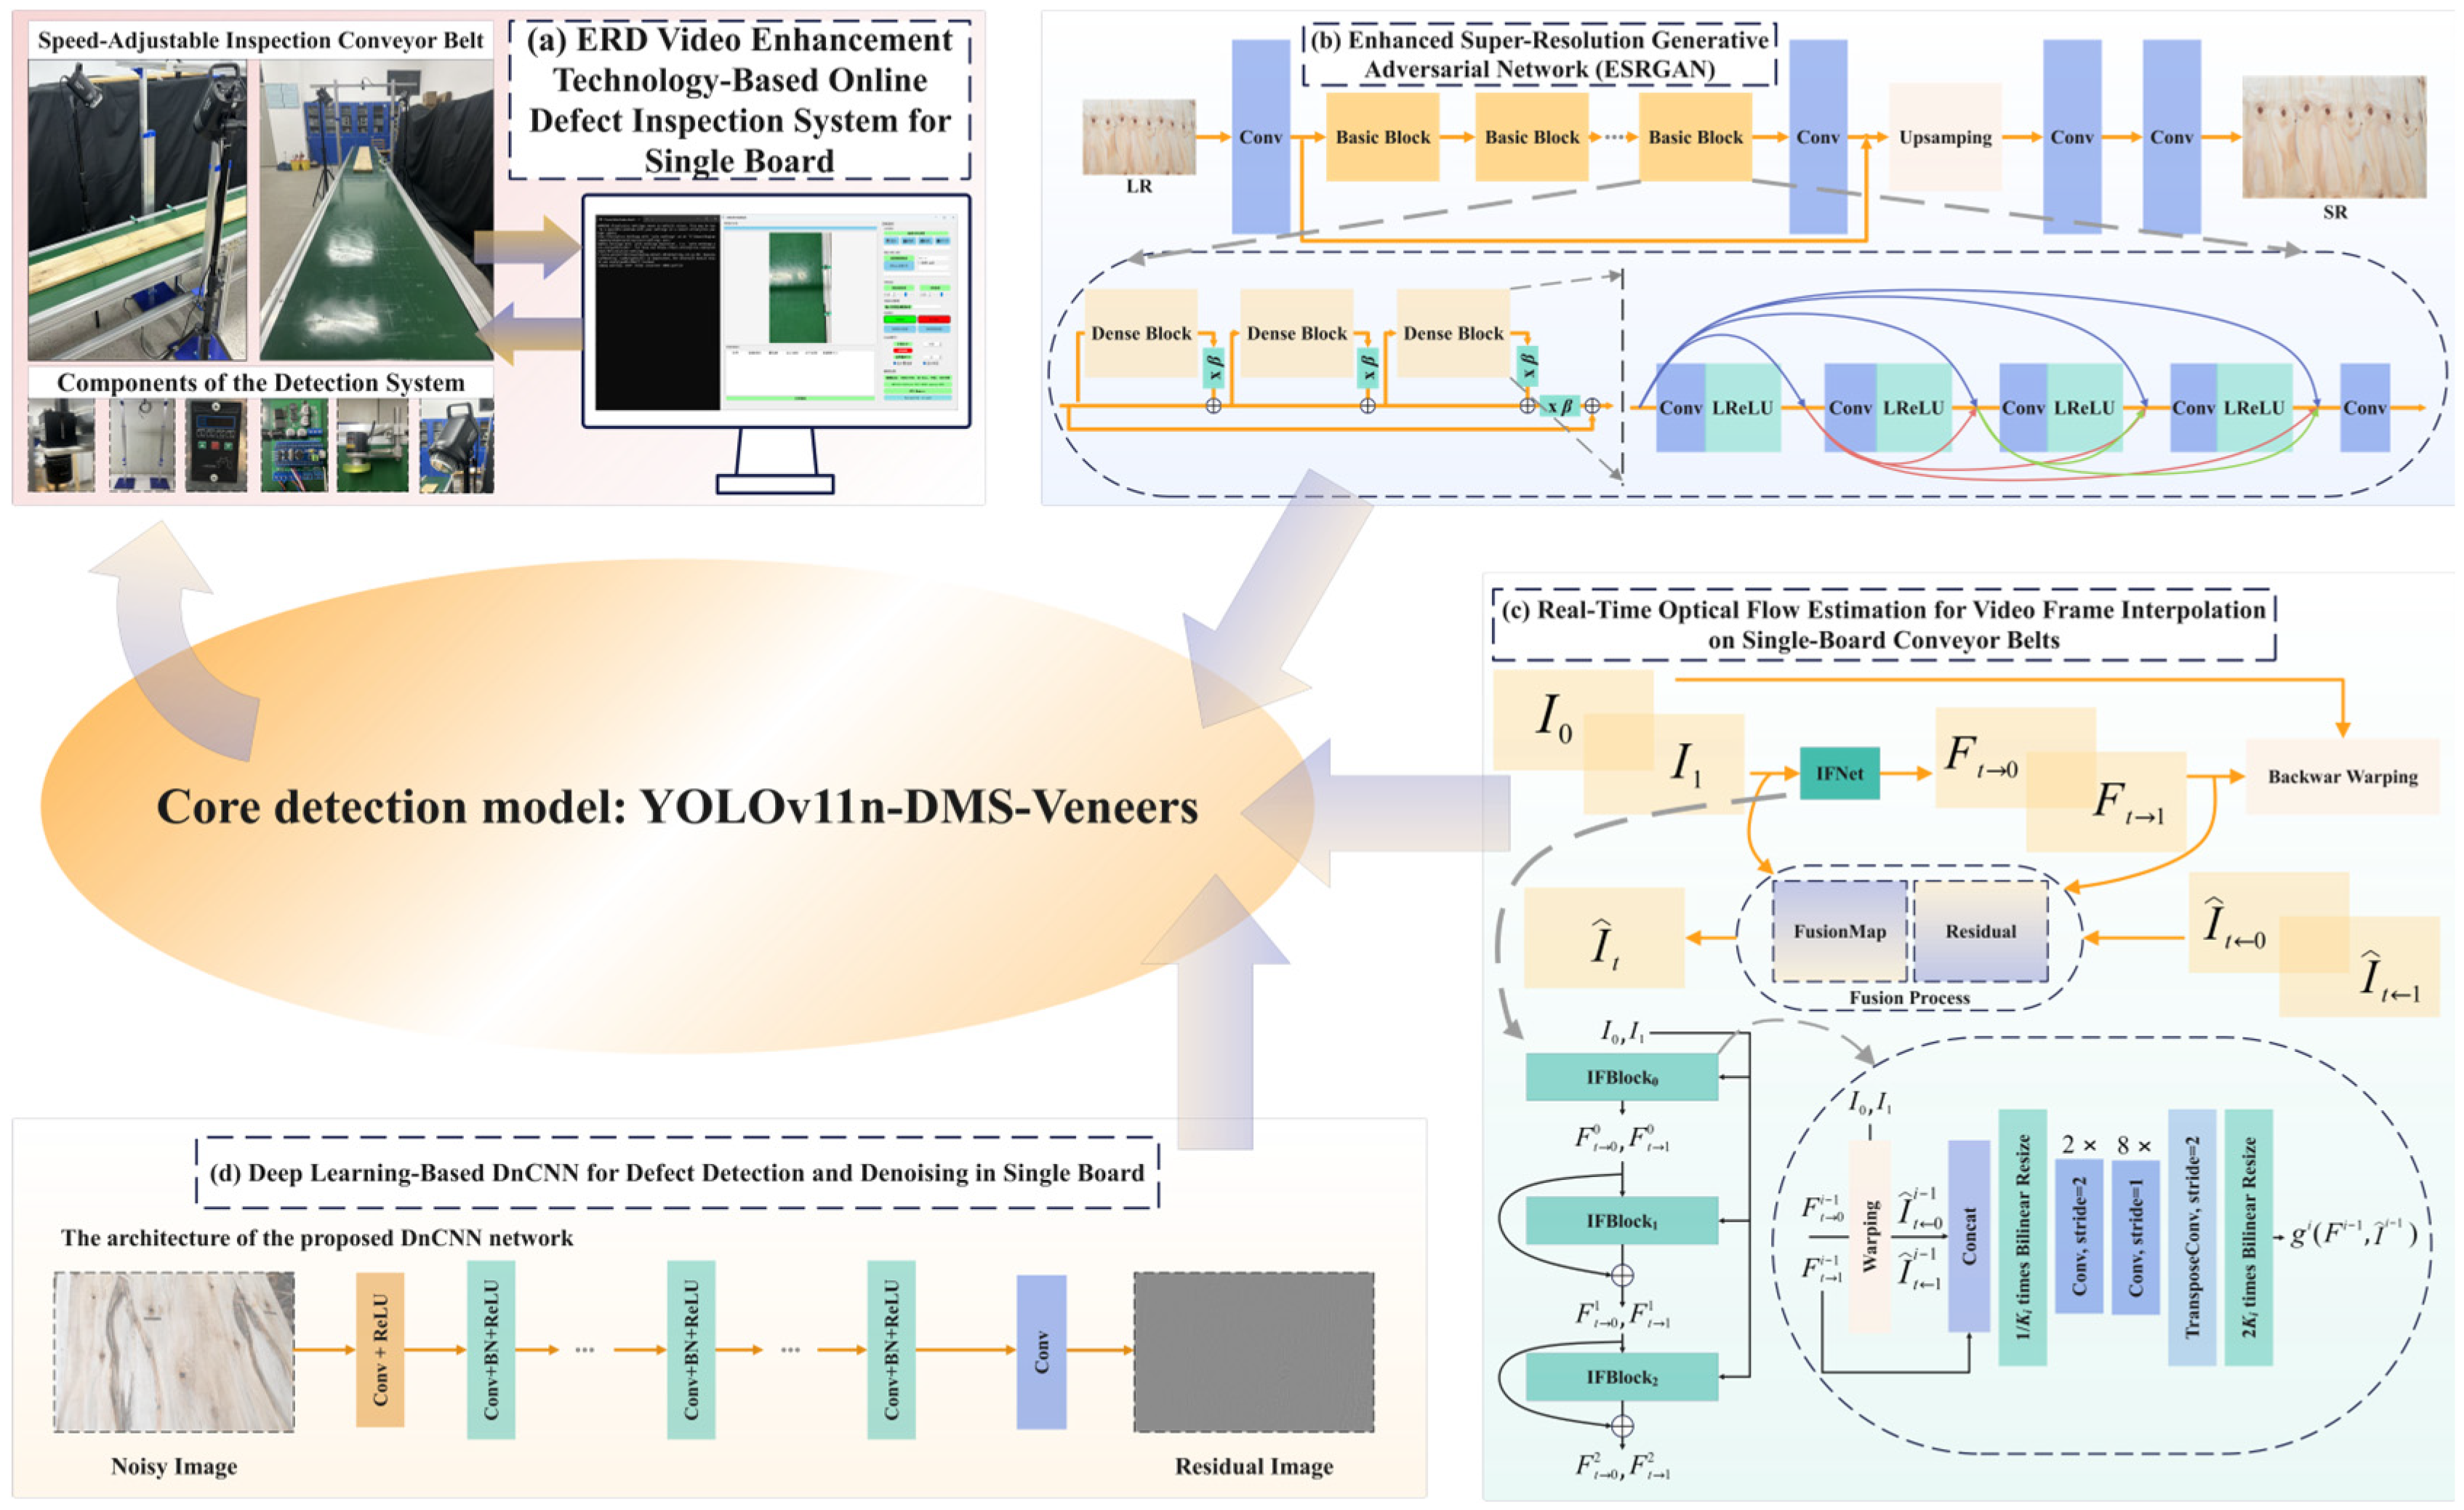
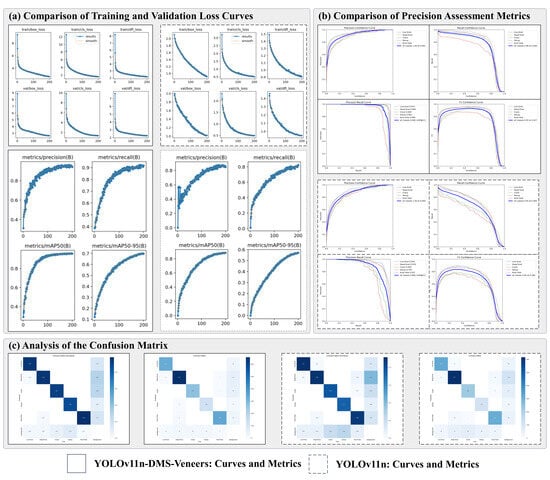
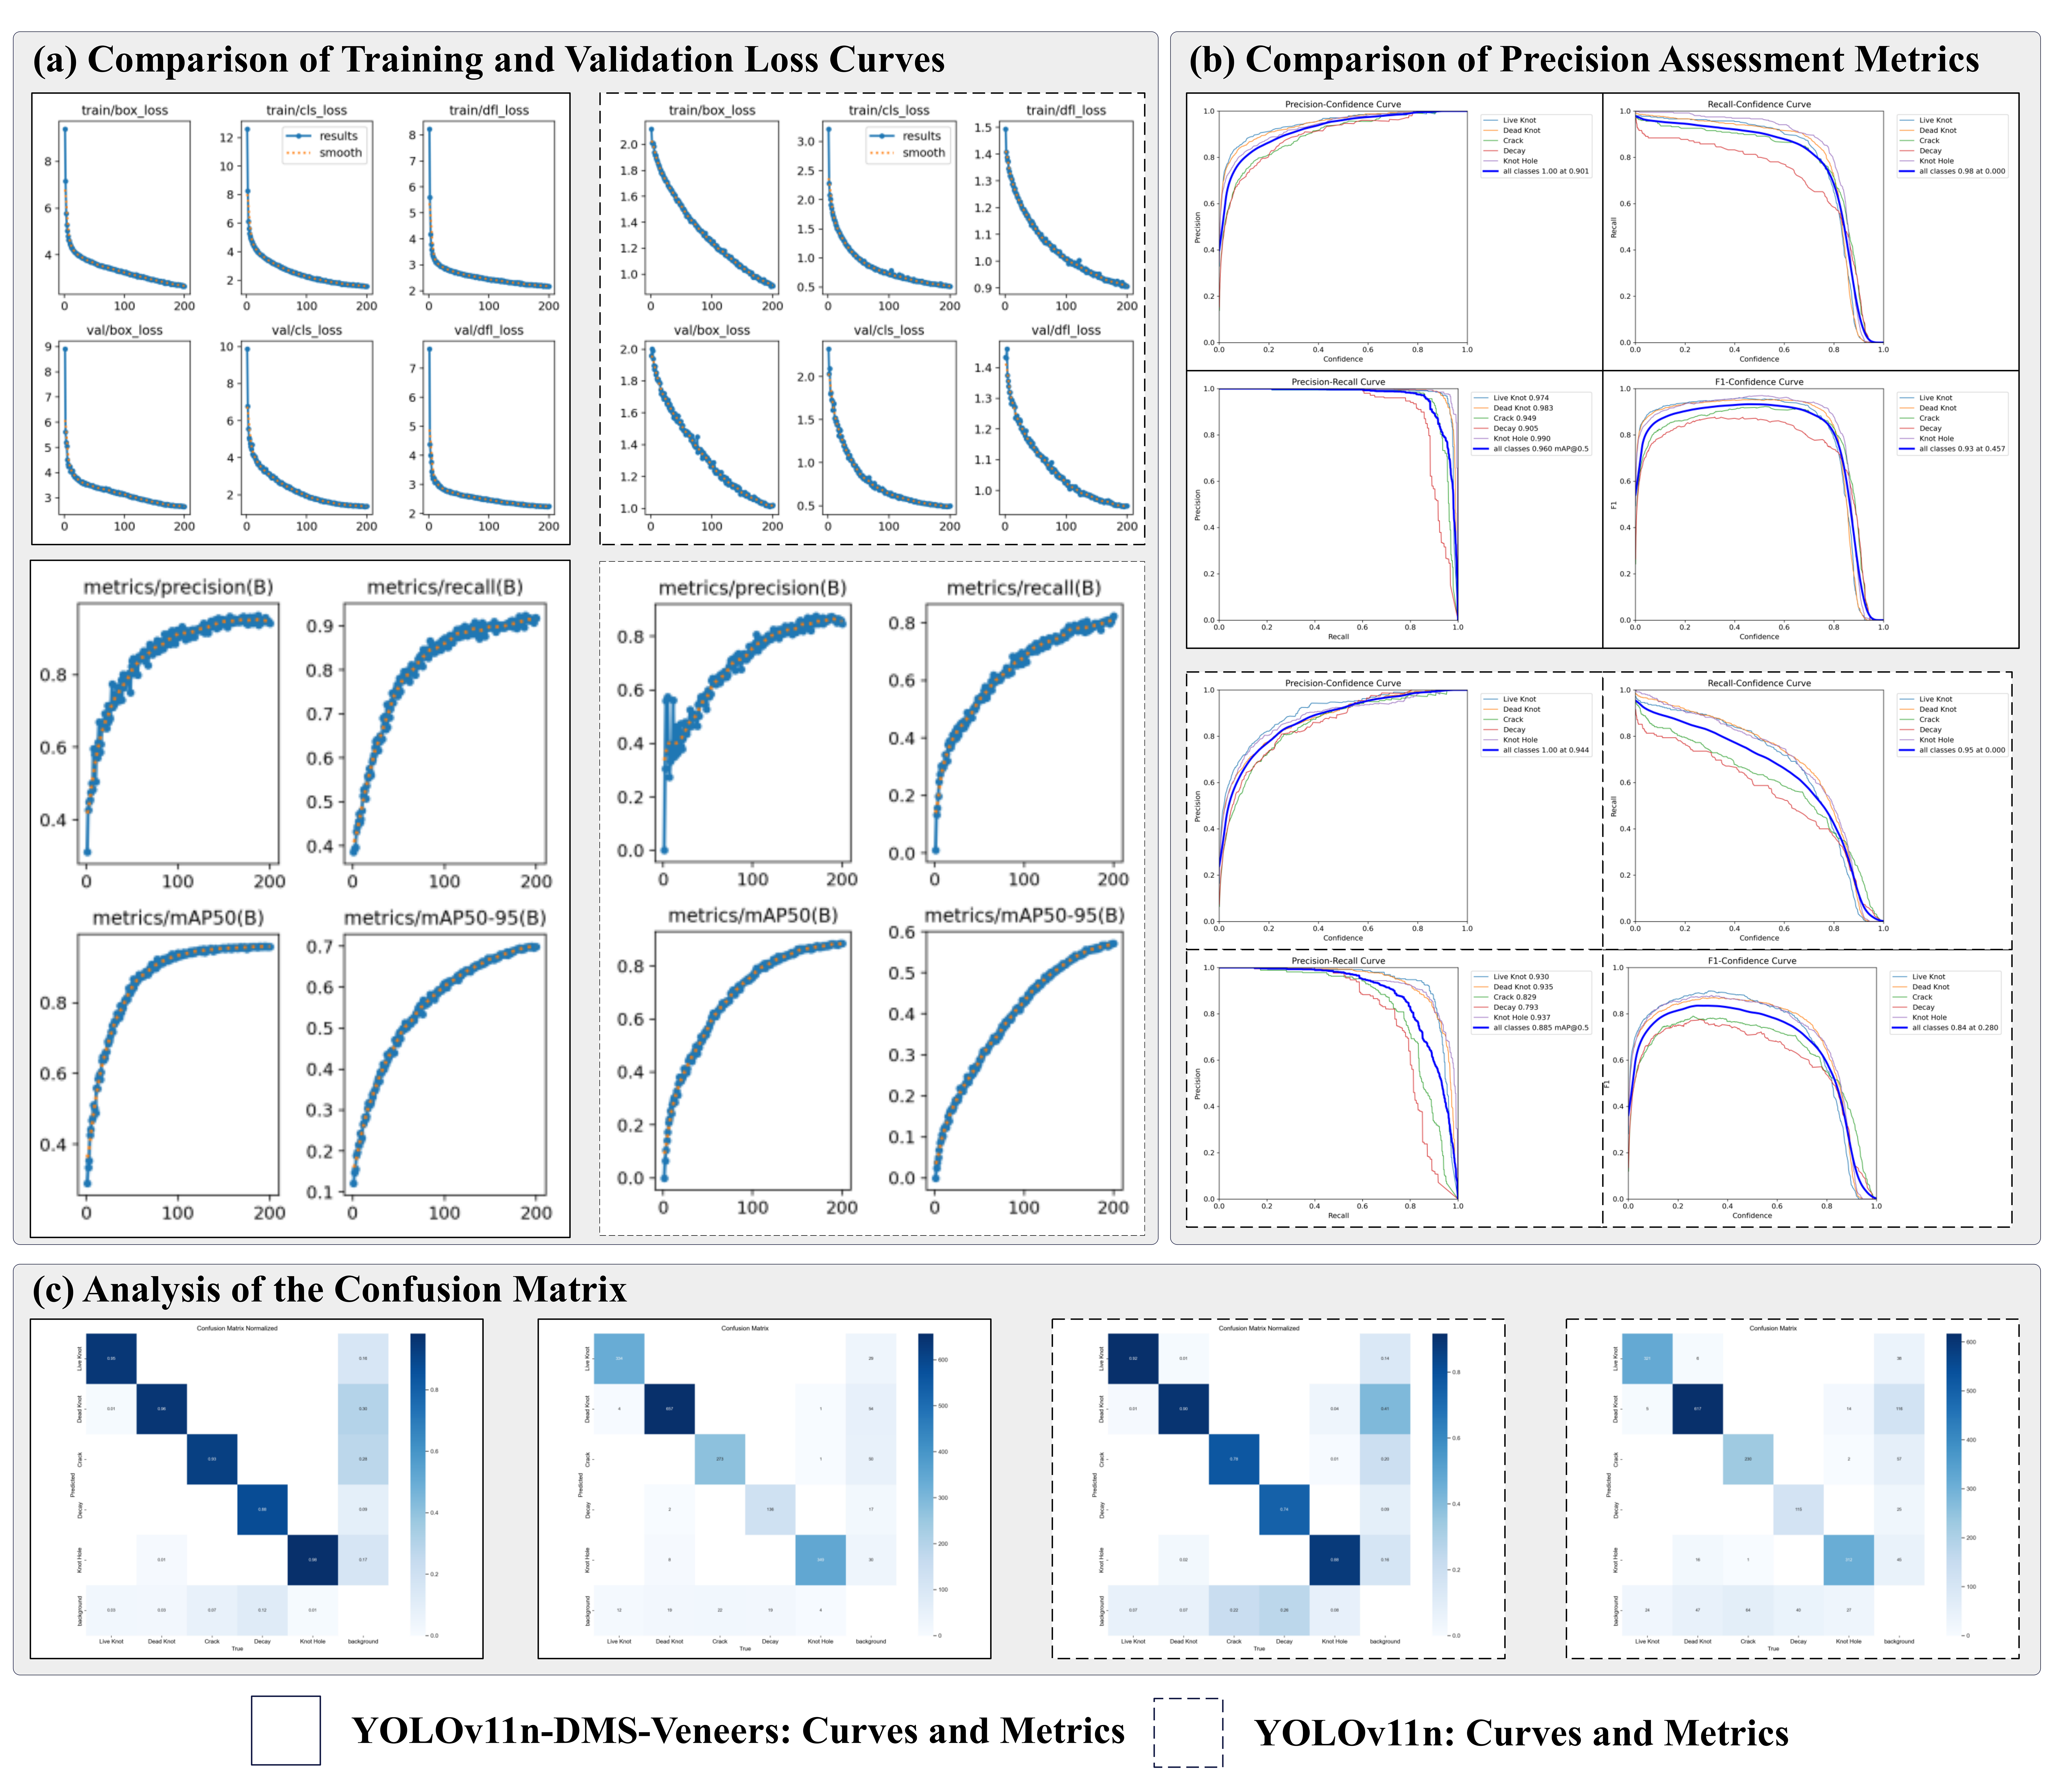
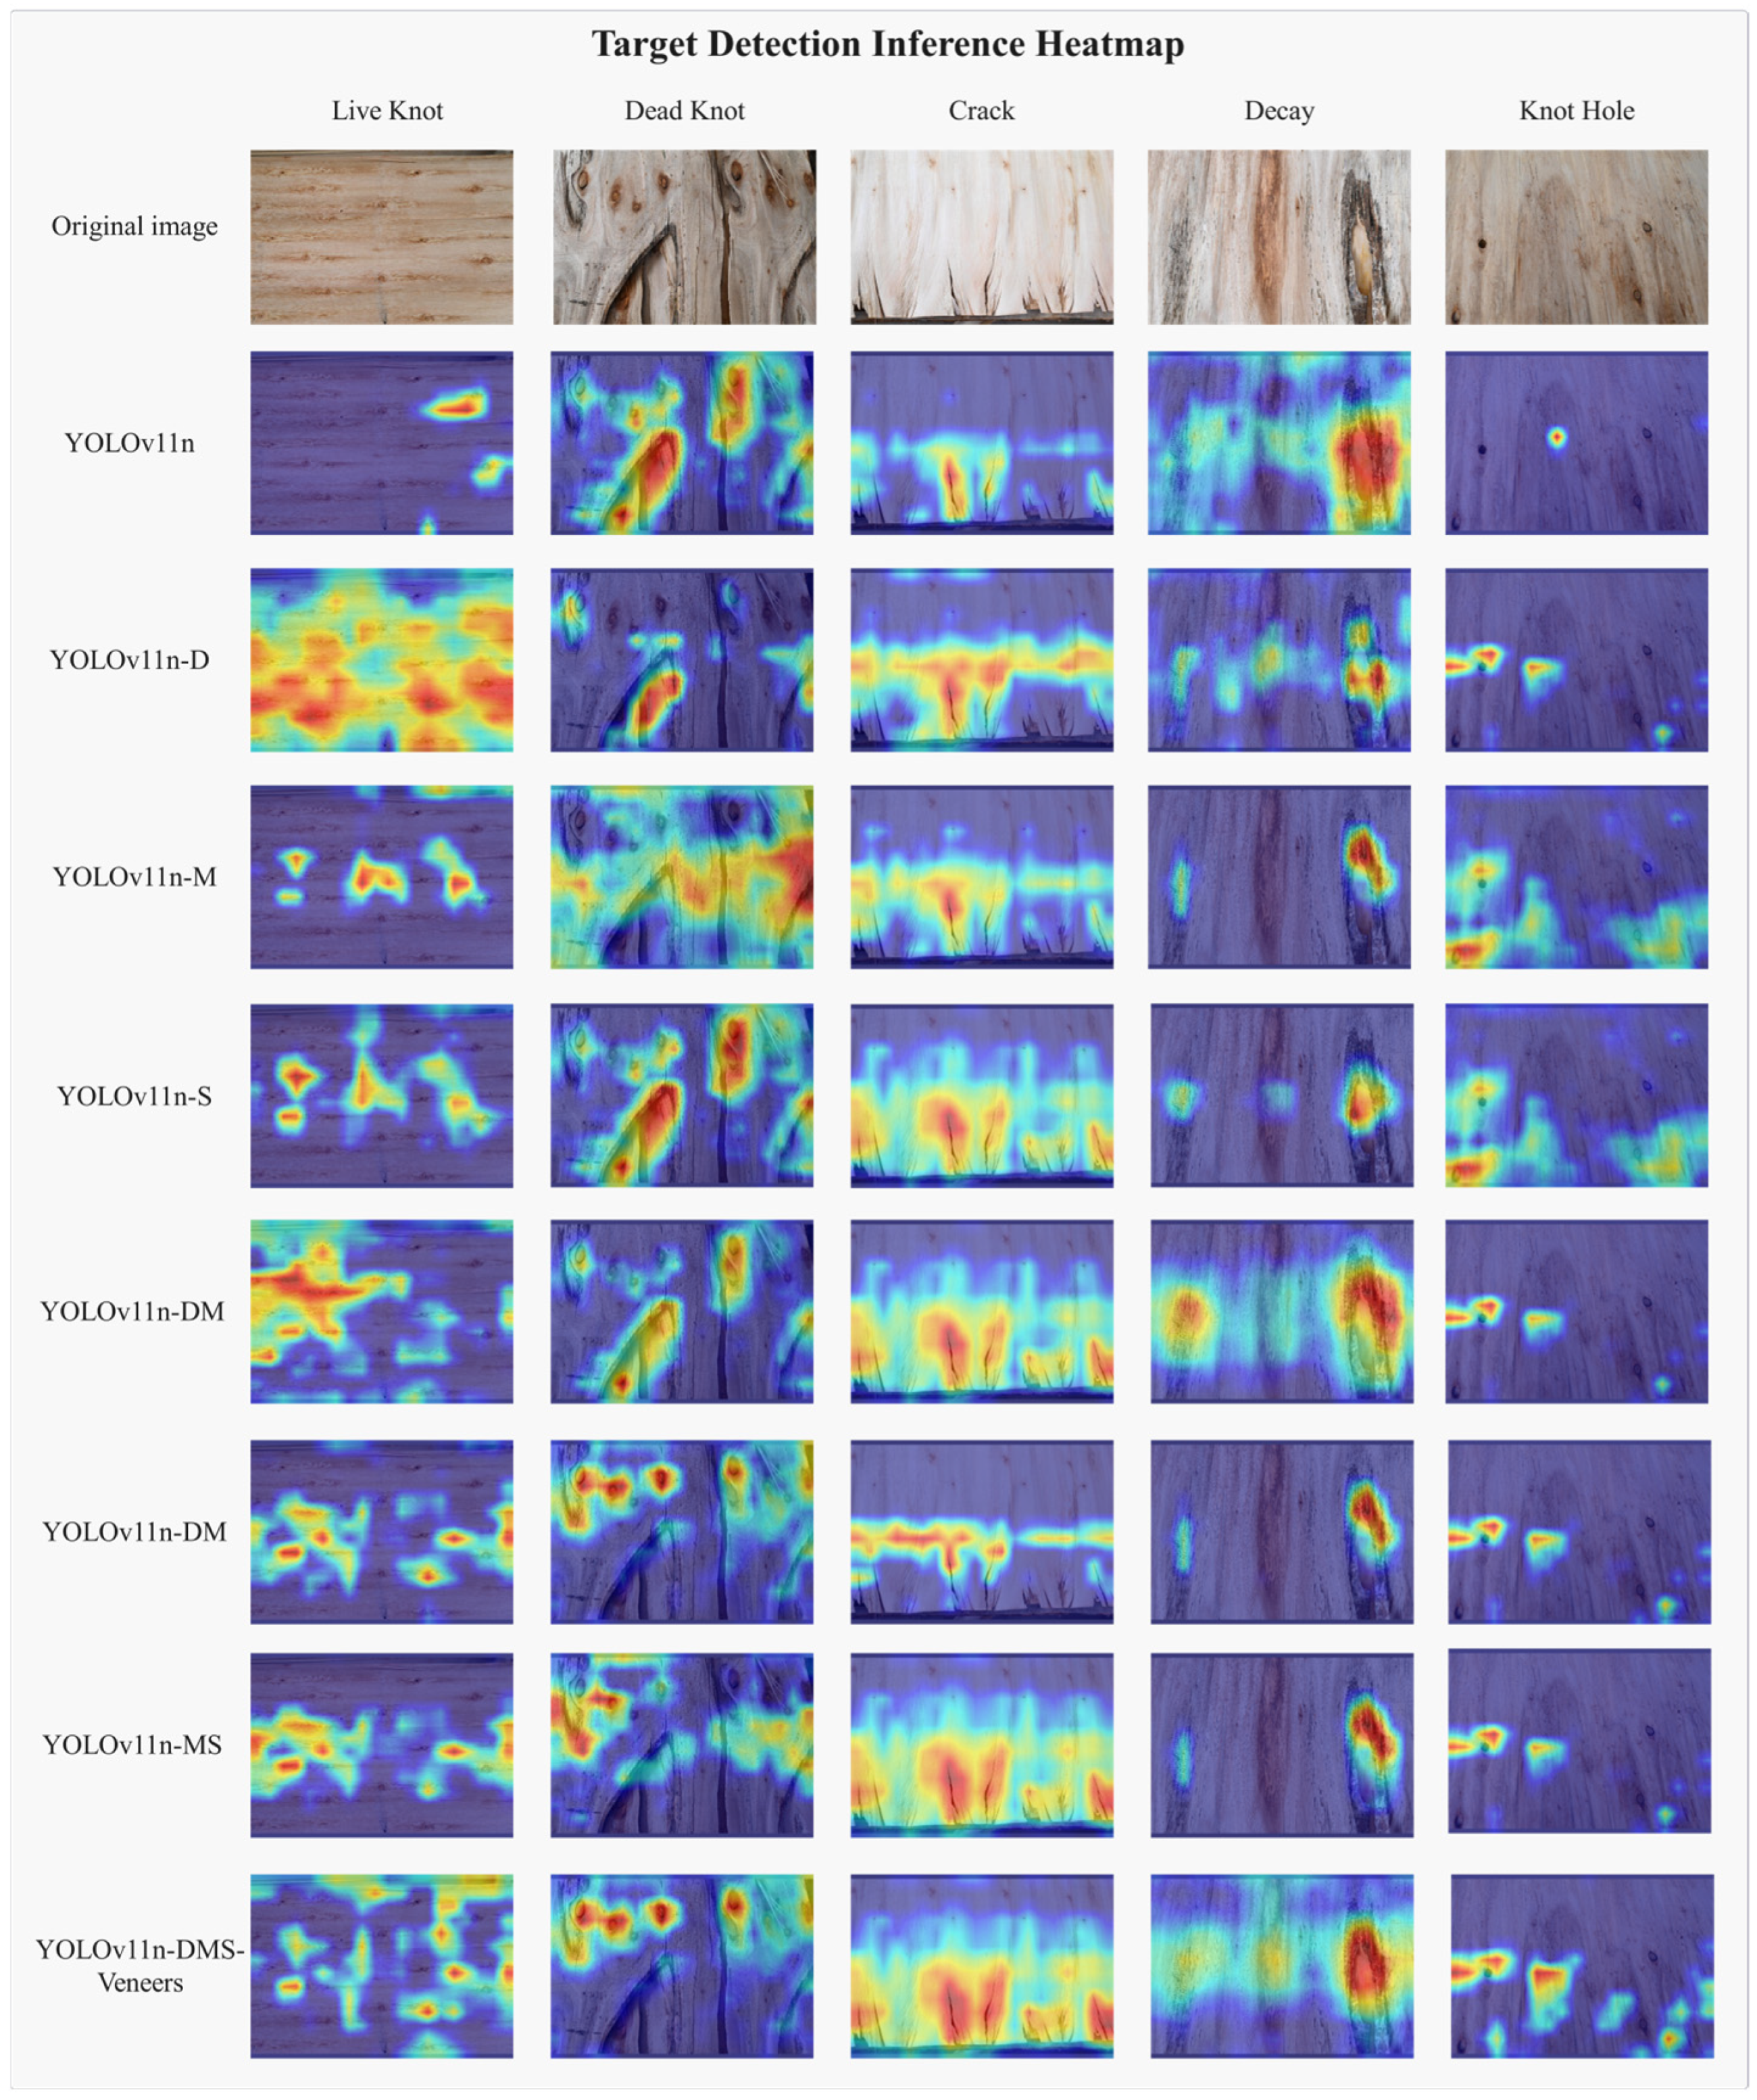
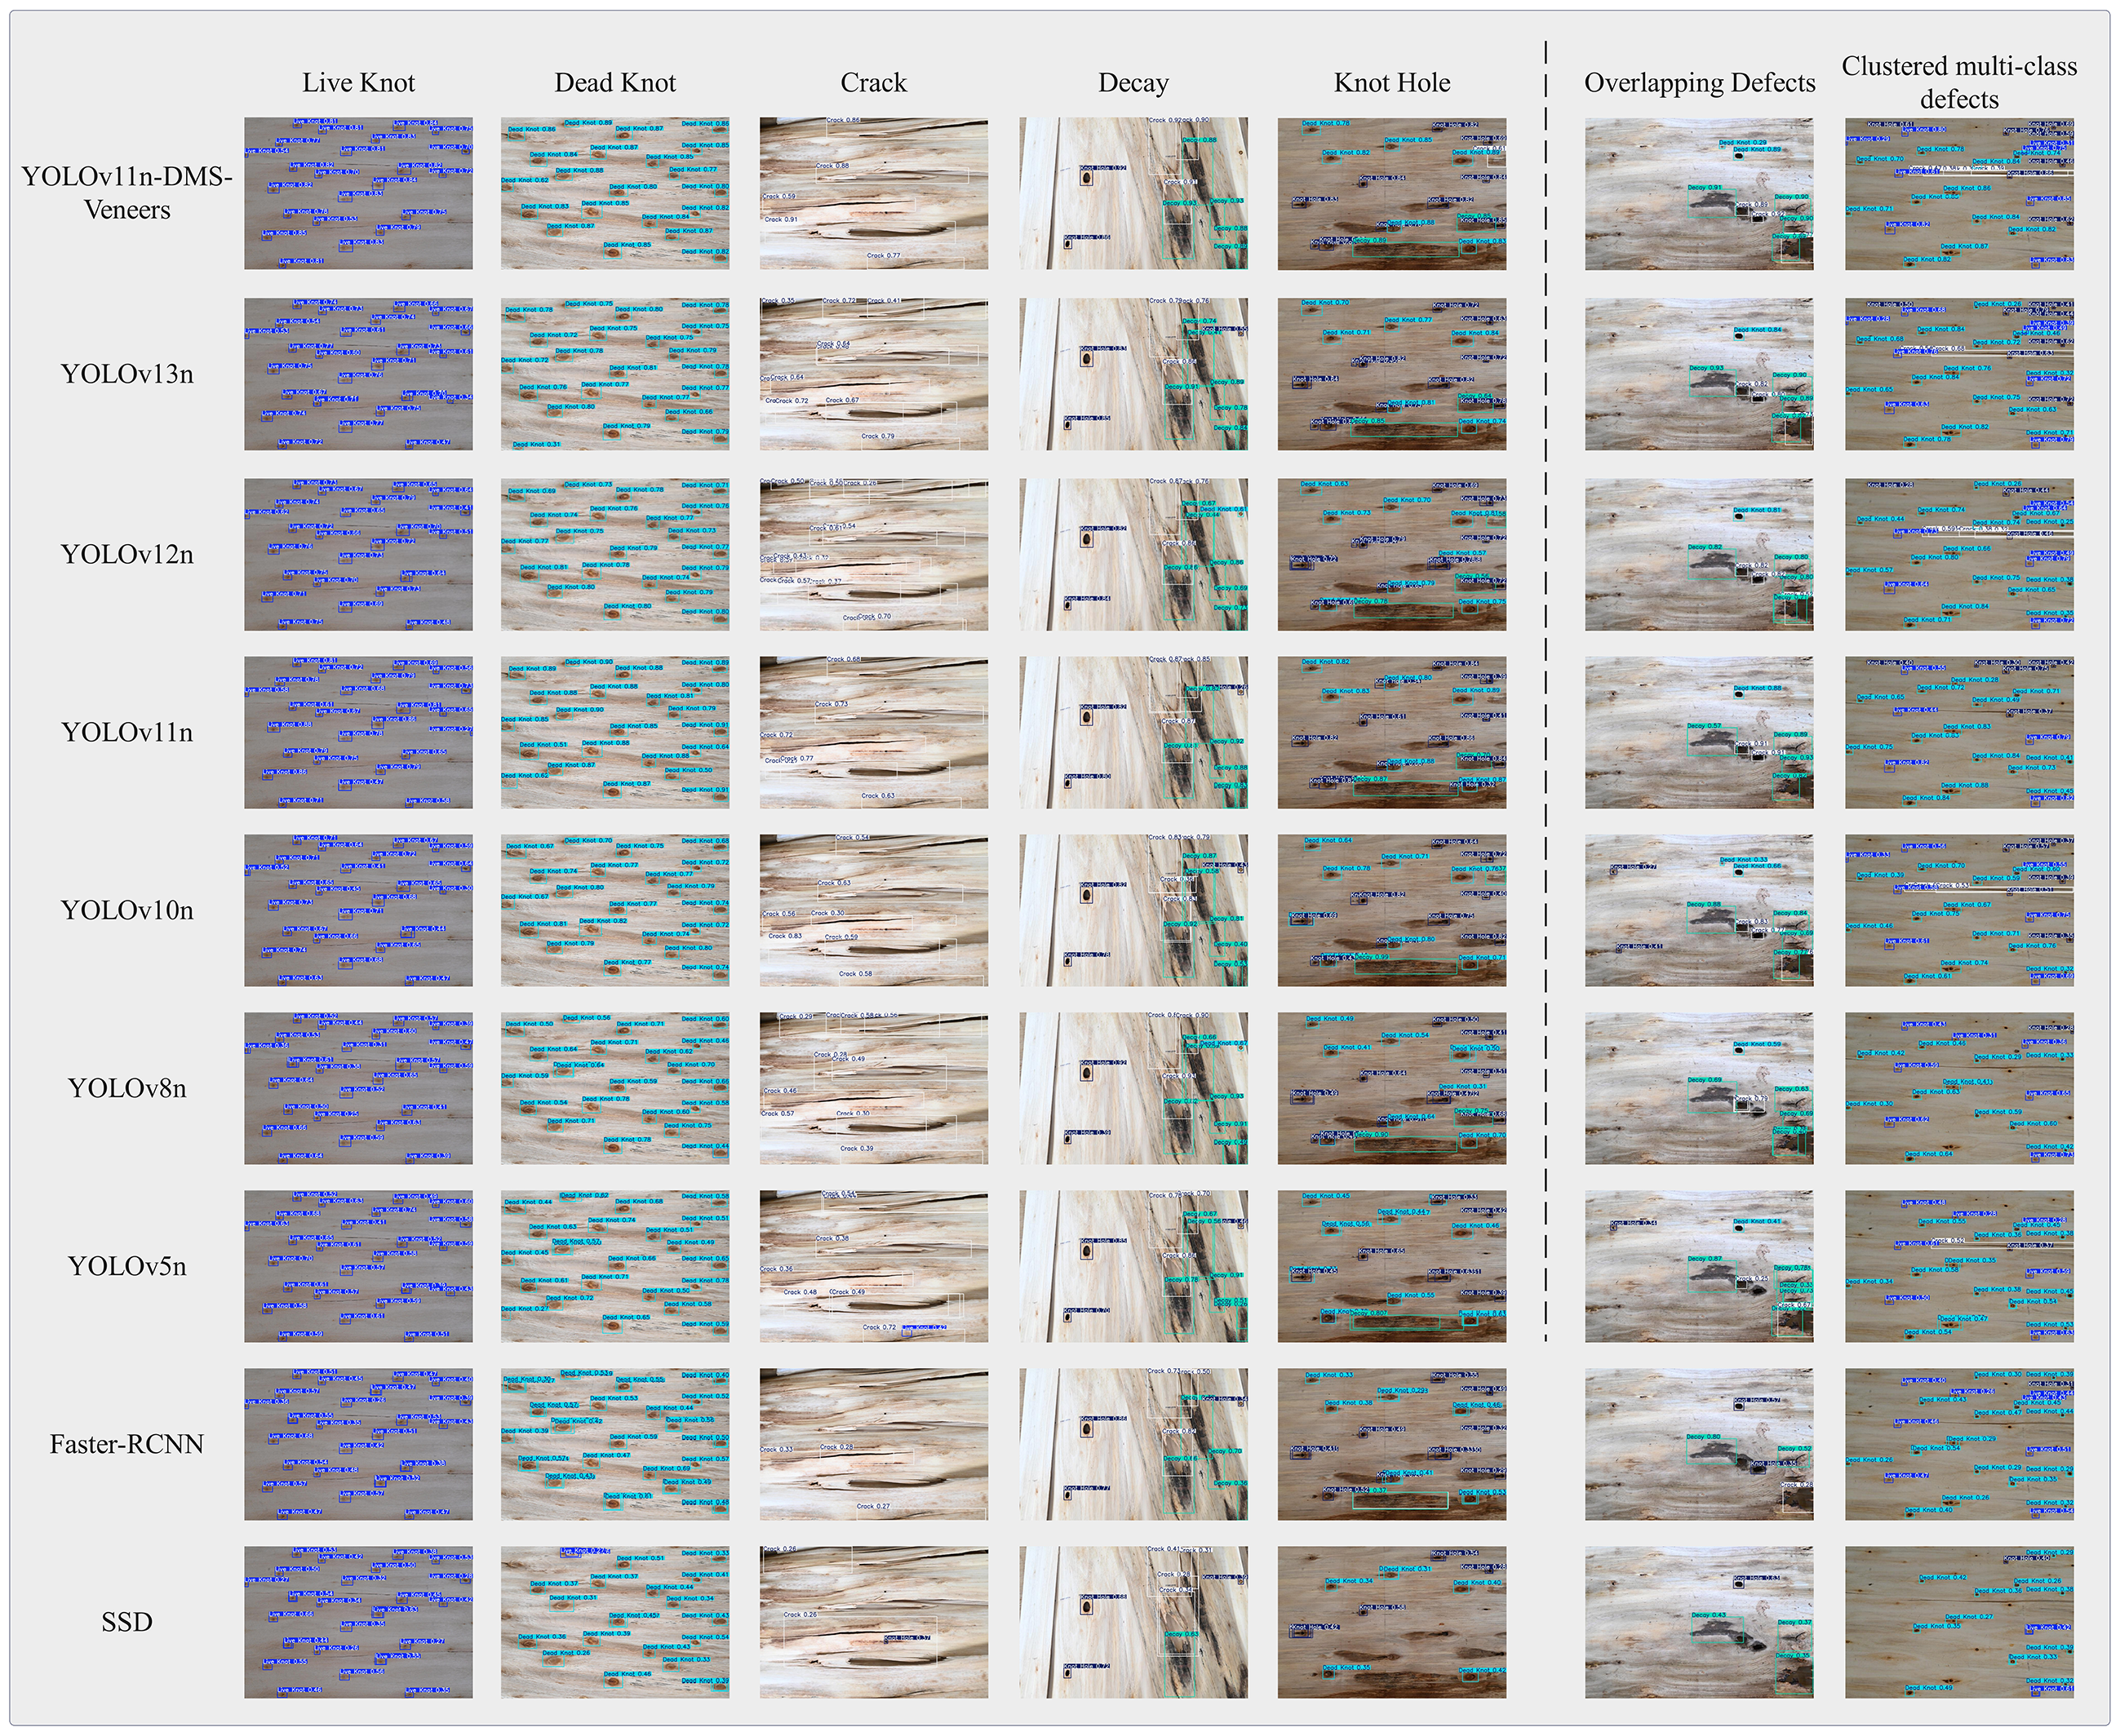
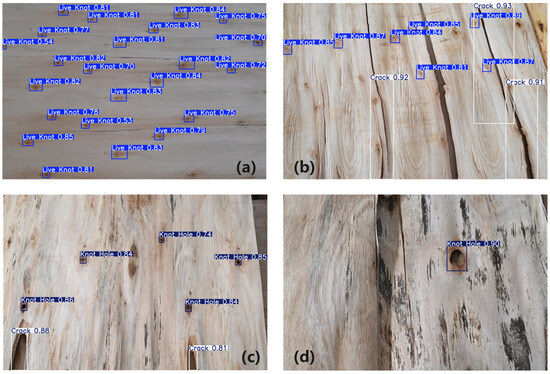
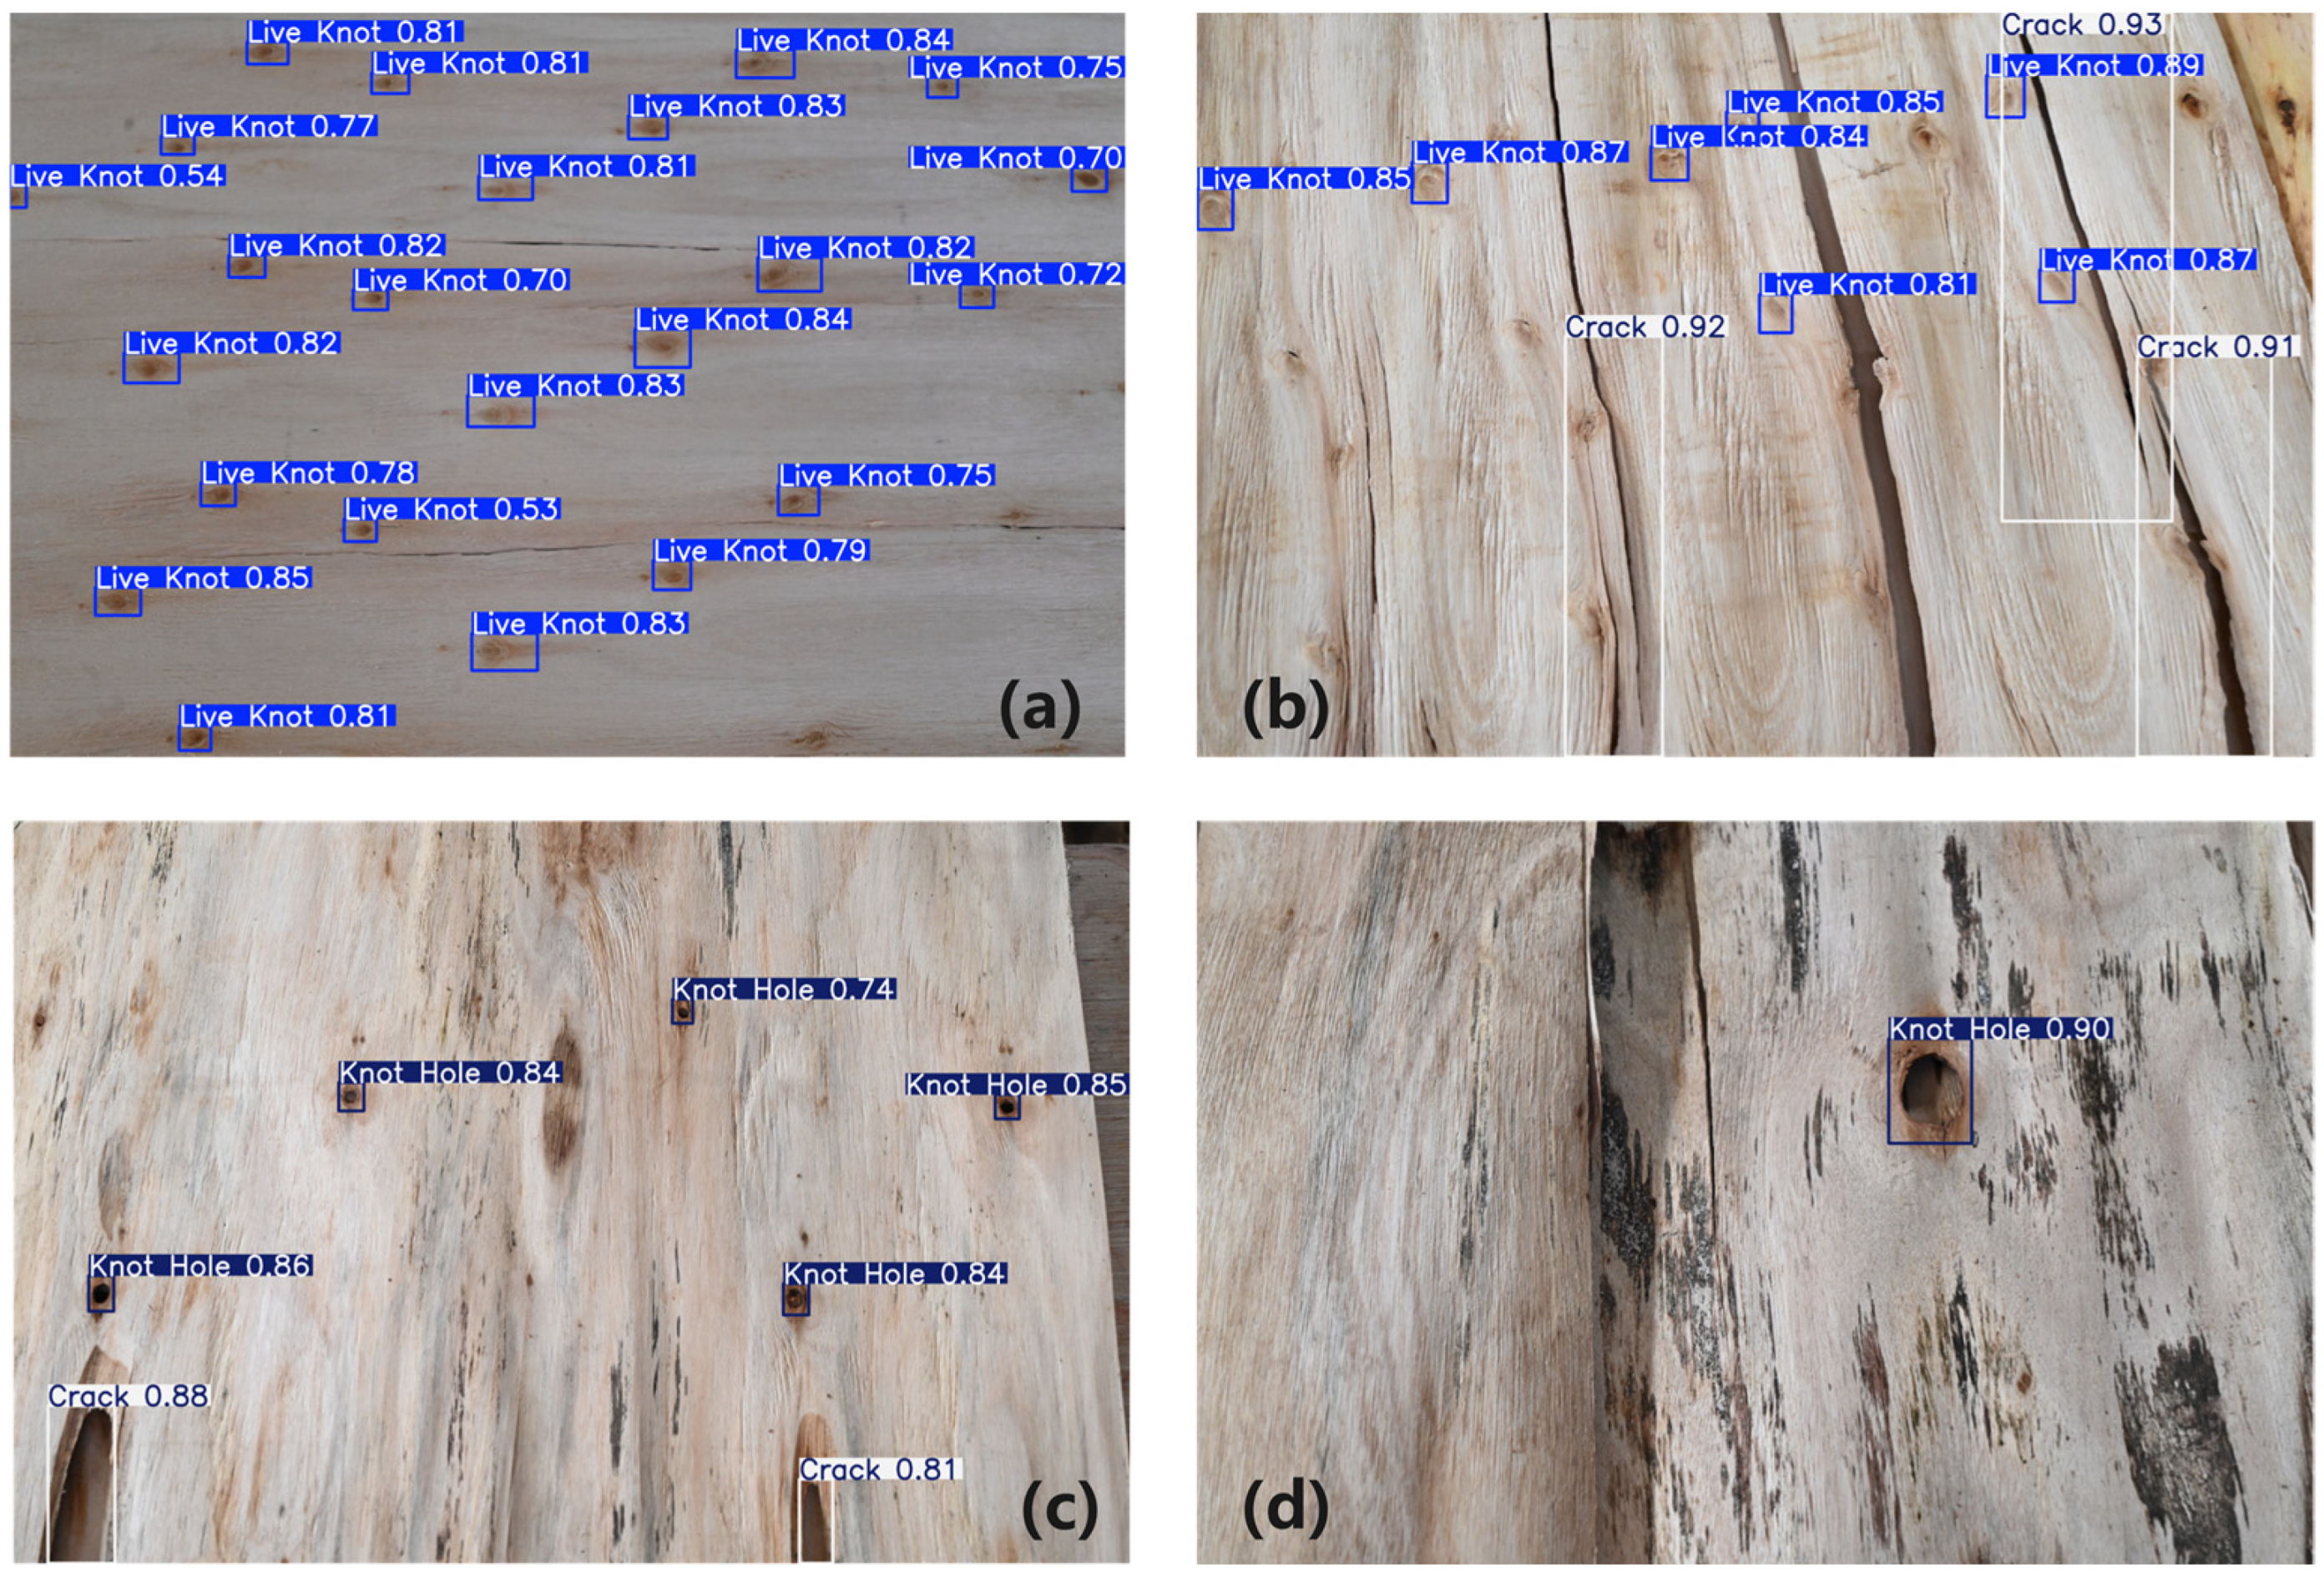
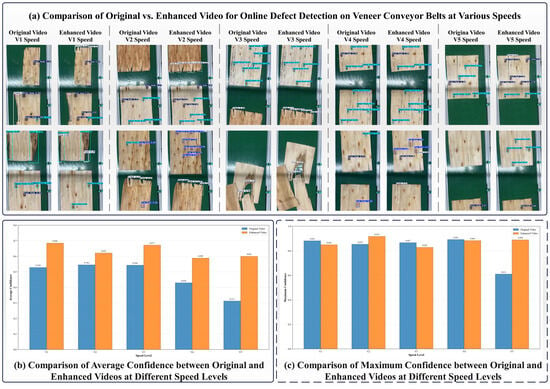
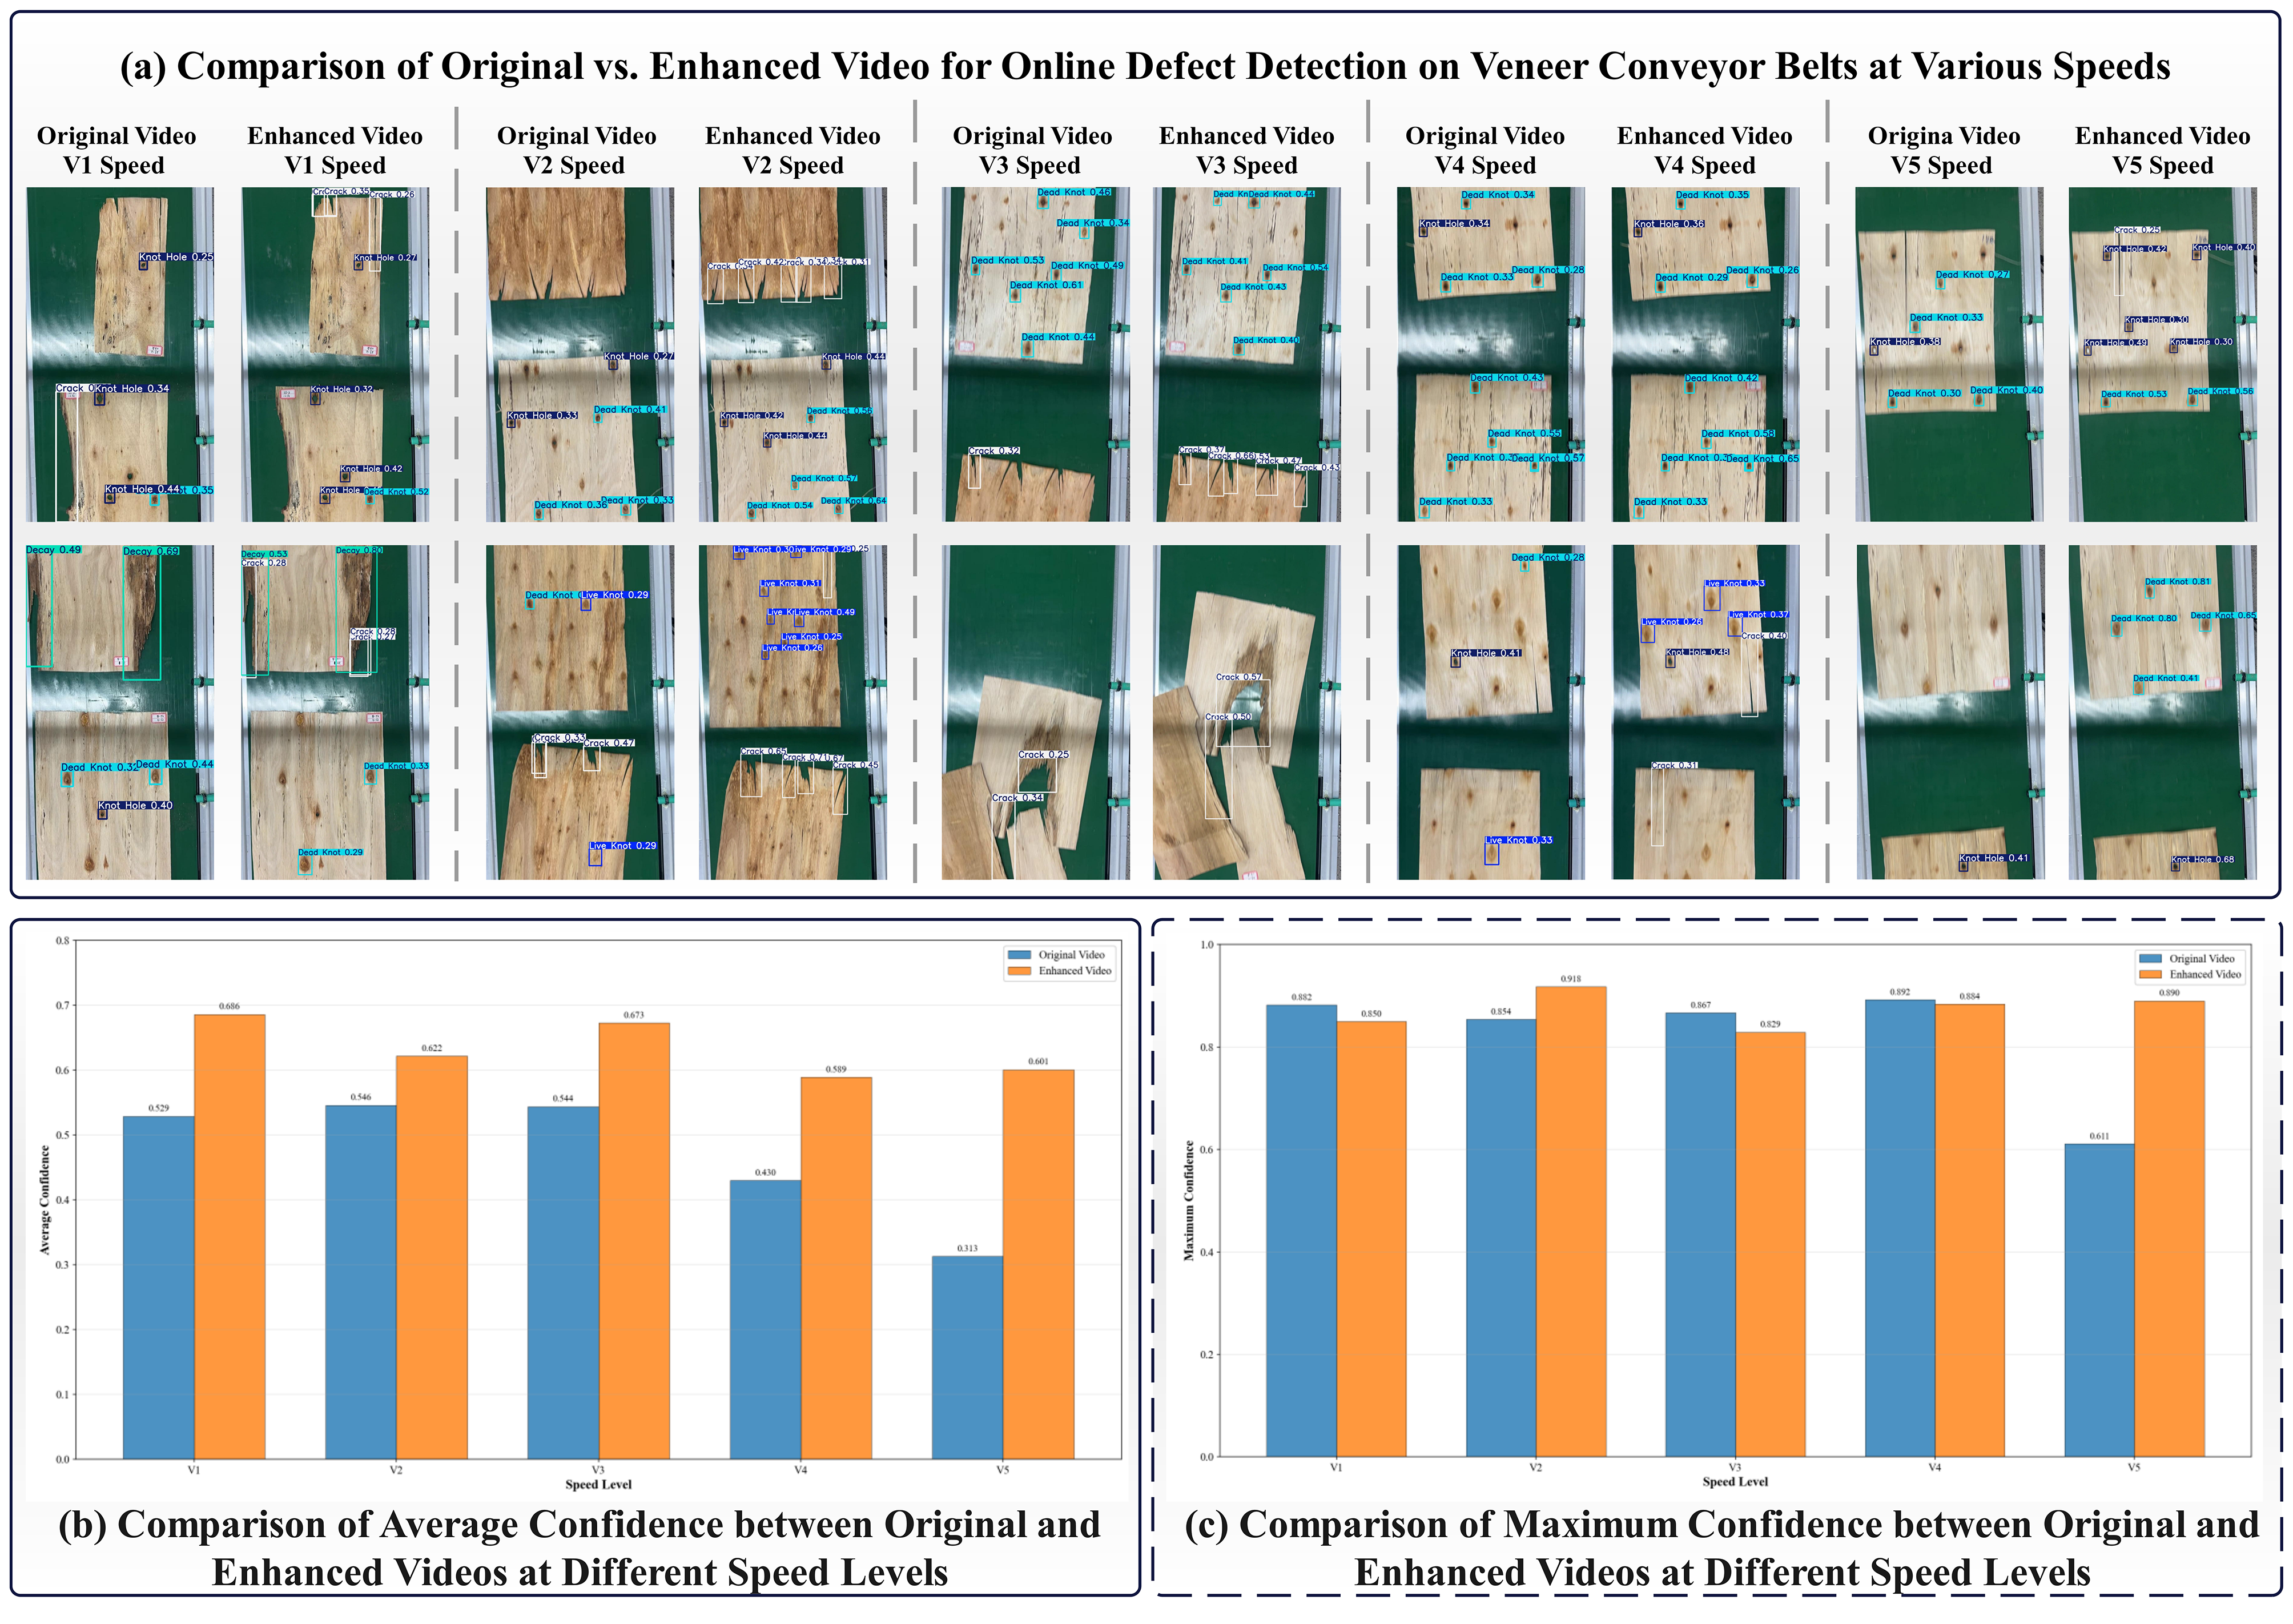

Disclaimer/Publisher’s Note: The statements, opinions and data contained in all publications are solely those of the individual author(s) and contributor(s) and not of MDPI and/or the editor(s). MDPI and/or the editor(s) disclaim responsibility for any injury to people or property resulting from any ideas, methods, instructions or products referred to in the content. |
© 2026 by the authors. Licensee MDPI, Basel, Switzerland. This article is an open access article distributed under the terms and conditions of the Creative Commons Attribution (CC BY) license.