


Abstract
Poplars (Populus spp.) and their hybrids are increasingly being grown in coppice production to generate bioenergy feedstocks at frequent intervals. Allometric equations are re-quired to predict aboveground biomass (AGB) of coppiced individuals with minimal field measurements. Likewise, remote sensing tools like LiDAR (light detection and ranging) can be used if models are available to predict AGB from point cloud data. Therefore, this study sought to develop equations to predict dry woody AGB from field measurements and LiDAR data from coppiced poplar field trials containing eastern cottonwood (P. del-toides) and hybrid poplar taxa. We found that taxa-specific allometric models containing the summed basal area of the three largest stems in the coppice provided the best predictive model, with stem height and stem count failing to provide additional explanatory power. The best predictive LiDAR-based model was independent of taxa but had slightly lower adjusted R2 and higher RMSE than the allometric model. It contained four parameters including crown volume, leaf area index, variance of height returns, and the top point density (i.e., density metric 9 or the proportion of points in the highest point interval when the point cloud is evenly divided into ten vertical intervals). In total, these models can be used to quickly and efficiently estimate dry woody AGB of Populus coppice systems for bioenergy feedstock production.
1. Introduction
Populus species have been grown around the world for a variety of wood products including pulp, veneer, and excelsior and are now increasingly being grown for bioenergy and bioproducts to be made from their cellulose, hemicellulose, and lignin components [1], as well as in agroforestry systems [2]. Populus species contain many advantages for bioenergy and agroforestry due to their exceptionally fast growth, relatively low ash content, regeneration from cuttings making genetic improvement and hybridization feasible, and ability to resprout after being cut over many cycles [3]. Bioenergy and bioproducts favor short rotations and potentially also coppice production [4,5,6], where aboveground stems are harvested every two to three years with stem resprouting occurring after each harvest for up to seven cycles before the stand needs to be regenerated from new cuttings. In coppice production, harvests are more frequent and stems are typically smaller in diameter (although individual plants have multiple stems), meaning that forage harvesters with in-field cut and chip systems can be used [7,8], which have been shown to have similar costs as whole stem harvesting systems [9]. Therefore, coppice management represents a viable production strategy for woody bioenergy crops and agroforestry systems and equations are needed to estimate the biomass of whole coppice stools.
Particularly, for the management of Populus for bioenergy and agroforestry production, aboveground dry woody biomass is an important parameter to estimate since it represents the potential feedstock available for further thermochemical or biochemical processing. For coppice production, it may make more sense to estimate biomass at the individual plant level incorporating all of the stems from each stool as one estimate instead of estimating biomass for each individual stem [10]. In developing models for coppice stools, allometric measurements can be made including diameters and heights of multiple stems [11,12,13,14] or only the largest stem in the stool [15,16,17], and the total number of stems above a certain diameter in the stool [10,18]. More measurements of a greater number of stems may increase accuracy of the modeled aboveground biomass estimate, but will take longer for field measurements to be made, particularly if both heights and diameters of stems are needed [12]. Therefore, models should identify the minimum number of stems necessary to be measured, as well as the fewest number of metrics that are necessary to achieve satisfactory models for aboveground biomass. However, the literature is lacking in the optimal number of stems within stools to measure in Populus systems that minimizes fieldwork without compromising the predictive ability.
Increasingly, LiDAR (light detection and ranging) is a useful tool for quickly and easily scanning large areas for the estimation of biomass and other aboveground components [19,20,21,22]. LiDAR sensors can be airborne on drones or other aircraft, or terrestrial, which include either stationary scanners or mobile scanners that are carried by hand, with a backpack, or on a car or other vehicle. LiDAR systems are active sensors that release radiation that is then received again by the sensor after hitting objects like stems, leaves, and the ground surface. The sensor records the location in three dimensions of each point of impact with objects, as well as the intensity with which the radiation returned to develop a point cloud of the landscape. Models can then be developed based on statistical representations of these point clouds to estimate various biometric parameters [23,24,25]. While LiDAR data are much faster to collect in the field than manual stem measurements, they typically require more data processing to filter outlier points, separate ground points from non-ground points, normalize the point cloud data to heights above ground, and potentially segment individual trees for biomass and the estimation of other attributes [26]. However, LiDAR provides a powerful tool for quickly and efficiently inventorying large areas and will continue to improve given advancements in computer processing efficiencies [27].
This study sought to develop allometric equations to estimate aboveground dry woody biomass of Populus plants in coppice production using both field measurements and terrestrial mobile scanning LiDAR on a backpack system. Specifically, we sought to identify the optimal number of field-measured stems (k) that need to be measured to reach an acceptable trade-off between effort and accuracy, across multiple taxa and develop a mobile backpack LiDAR model for coppiced Populus that is independent of taxa but comparable in accuracy to a field allometric model. We measured all stems in selected coppice stools at two sites located in the southeastern United States, which included genotypes from eastern cottonwood (P. deltoides Bartram ex Marshall; D × D) and various hybrid poplars comprising P. deltoides × P. maximowiczii Henry (D × M), P. deltoides × P. nigra L. (D × N), P. deltoides × P. trichocarpa Torr. & Gray ex. Hook. (D × T), P. trichocarpa × P. deltoides (T × D), and P. trichocarpa × P. maximowiczii (T × M) taxa. The developed models can be used to estimate aboveground dry woody biomass of Populus coppice production systems to estimate feedstock availability and production rates for bioenergy and agroforestry systems.
2. Materials and Methods
Two field sites, one located in Monroe County (33°51′ N, 88°17′ W; 1.36 ha in size) and the other located in Pontotoc County (34°08′ N, 88°59′ W; 1.12 ha in size) in Northeast Mississippi, USA, were used for the study. The climate for both sites is classified as humid subtropical with mild winters and hot summers. These sites have a 30 year (1991–2020) mean annual rainfall of about 1500 mm and mean annual temperature of 16.4 °C. The Monroe site had fine sandy loam soils and was planted in 2018 with 100 genotypes of eastern cottonwood and hybrid poplars, whereas the Pontotoc site had silt loam soils and was planted in 2019 with 108 genotypes of eastern cottonwood and hybrid poplars. Sites were established with dormant, unrooted cuttings procured from either Mississippi State University’s stoolbed (for eastern cottonwood) or GreenWood Resources (Portland, OR, USA) for hybrid poplars. Specific genotypes used in this study can be found in Table S1.
Eastern cottonwood cuttings were about 41 cm in length and hybrid poplar cuttings were about 31 cm and both were kept in a freezer until planting. Both sites were planted in early spring of each year on an approximately 1.8 m × 2.7 m spacing with 2.7 m distance between subsoiled rows and 1.8 m planting distance between cuttings in each row. The cuttings grew for two years at each site, then trees were cut after the second growing season (beginning of 2020 for Monroe and 2021 for Pontotoc). Cut stumps resprouted and stems were allowed to grow for two more growing seasons before being measured for this study at the end of the 2021 and 2022 growing seasons for the Monroe and Pontotoc sites, respectively. Average stem sizes for measured coppice stools can be found in Table 1.
Table 1.
Stem characteristics (mean and standard error in parentheses) from individual Populus coppice stools (2 years old following the first coppice cut) measured at two field sites and various taxa including P. deltoides × P. deltoides (D × D), P. deltoides × P. maximowiczii (D × M), P. deltoides × P. nigra (D × N), P. deltoides × P. trichocarpa (D × T), P. trichocarpa × P. deltoides (T × D), and P. trichocarpa × P. maximowiczii (T × M). Taxa were compared via ANOVA from the same field site with different superscript letters differing significantly at = 0.05. Sample density was not measured for Pontotoc samples. DBH = Diameter at breast height (1.37 m above ground).
A mobile terrestrial backpack LiDAR system (Figure S1; LiBackpack DGC50; Green Valley International, Berkeley, CA, USA) was used for the study, which contains two Velodyne Puck VLP-16 laser scanners (San Jose, CA, USA; one located vertically and one located horizontally) that have a measurement range limit of 100 m and a measurement rate of 600,000 pts/s with a laser wavelength of 903 nm. The measurement system also includes an inertial measurement unit (IMU) and a base station to accurately georeference the point cloud data given that the LiDAR unit is in constant motion. The base station collects satellite signals to determine the location of itself and the scanning unit using the Global Navigation Satellite System (GNSS). LiDAR data were collected by walking around measured coppice trees between rows and ultimately closing the walking loop to minimize data drift. Data were retrieved from both the mobile scanner and base station, and raw point cloud files were processed using LiFuser version 3 software (Green Valley International). LiFuser takes the raw point data as well as the path of the mobile system and the location of the base station to perform SLAM (Simultaneous Localization and Mapping) processing and locate each point in three-dimensional, georeferenced space. This process generates a point cloud data file that was further processed using LiDAR360 version 7 software (Green Valley International).
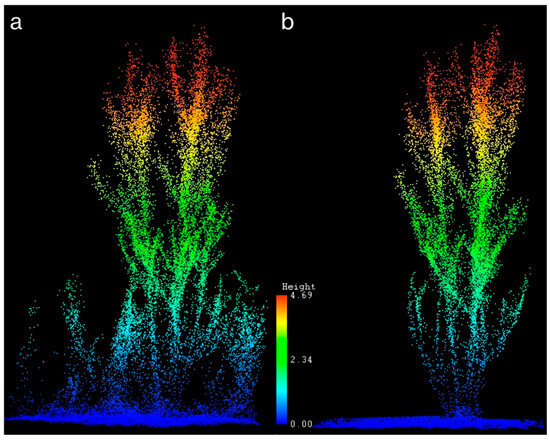
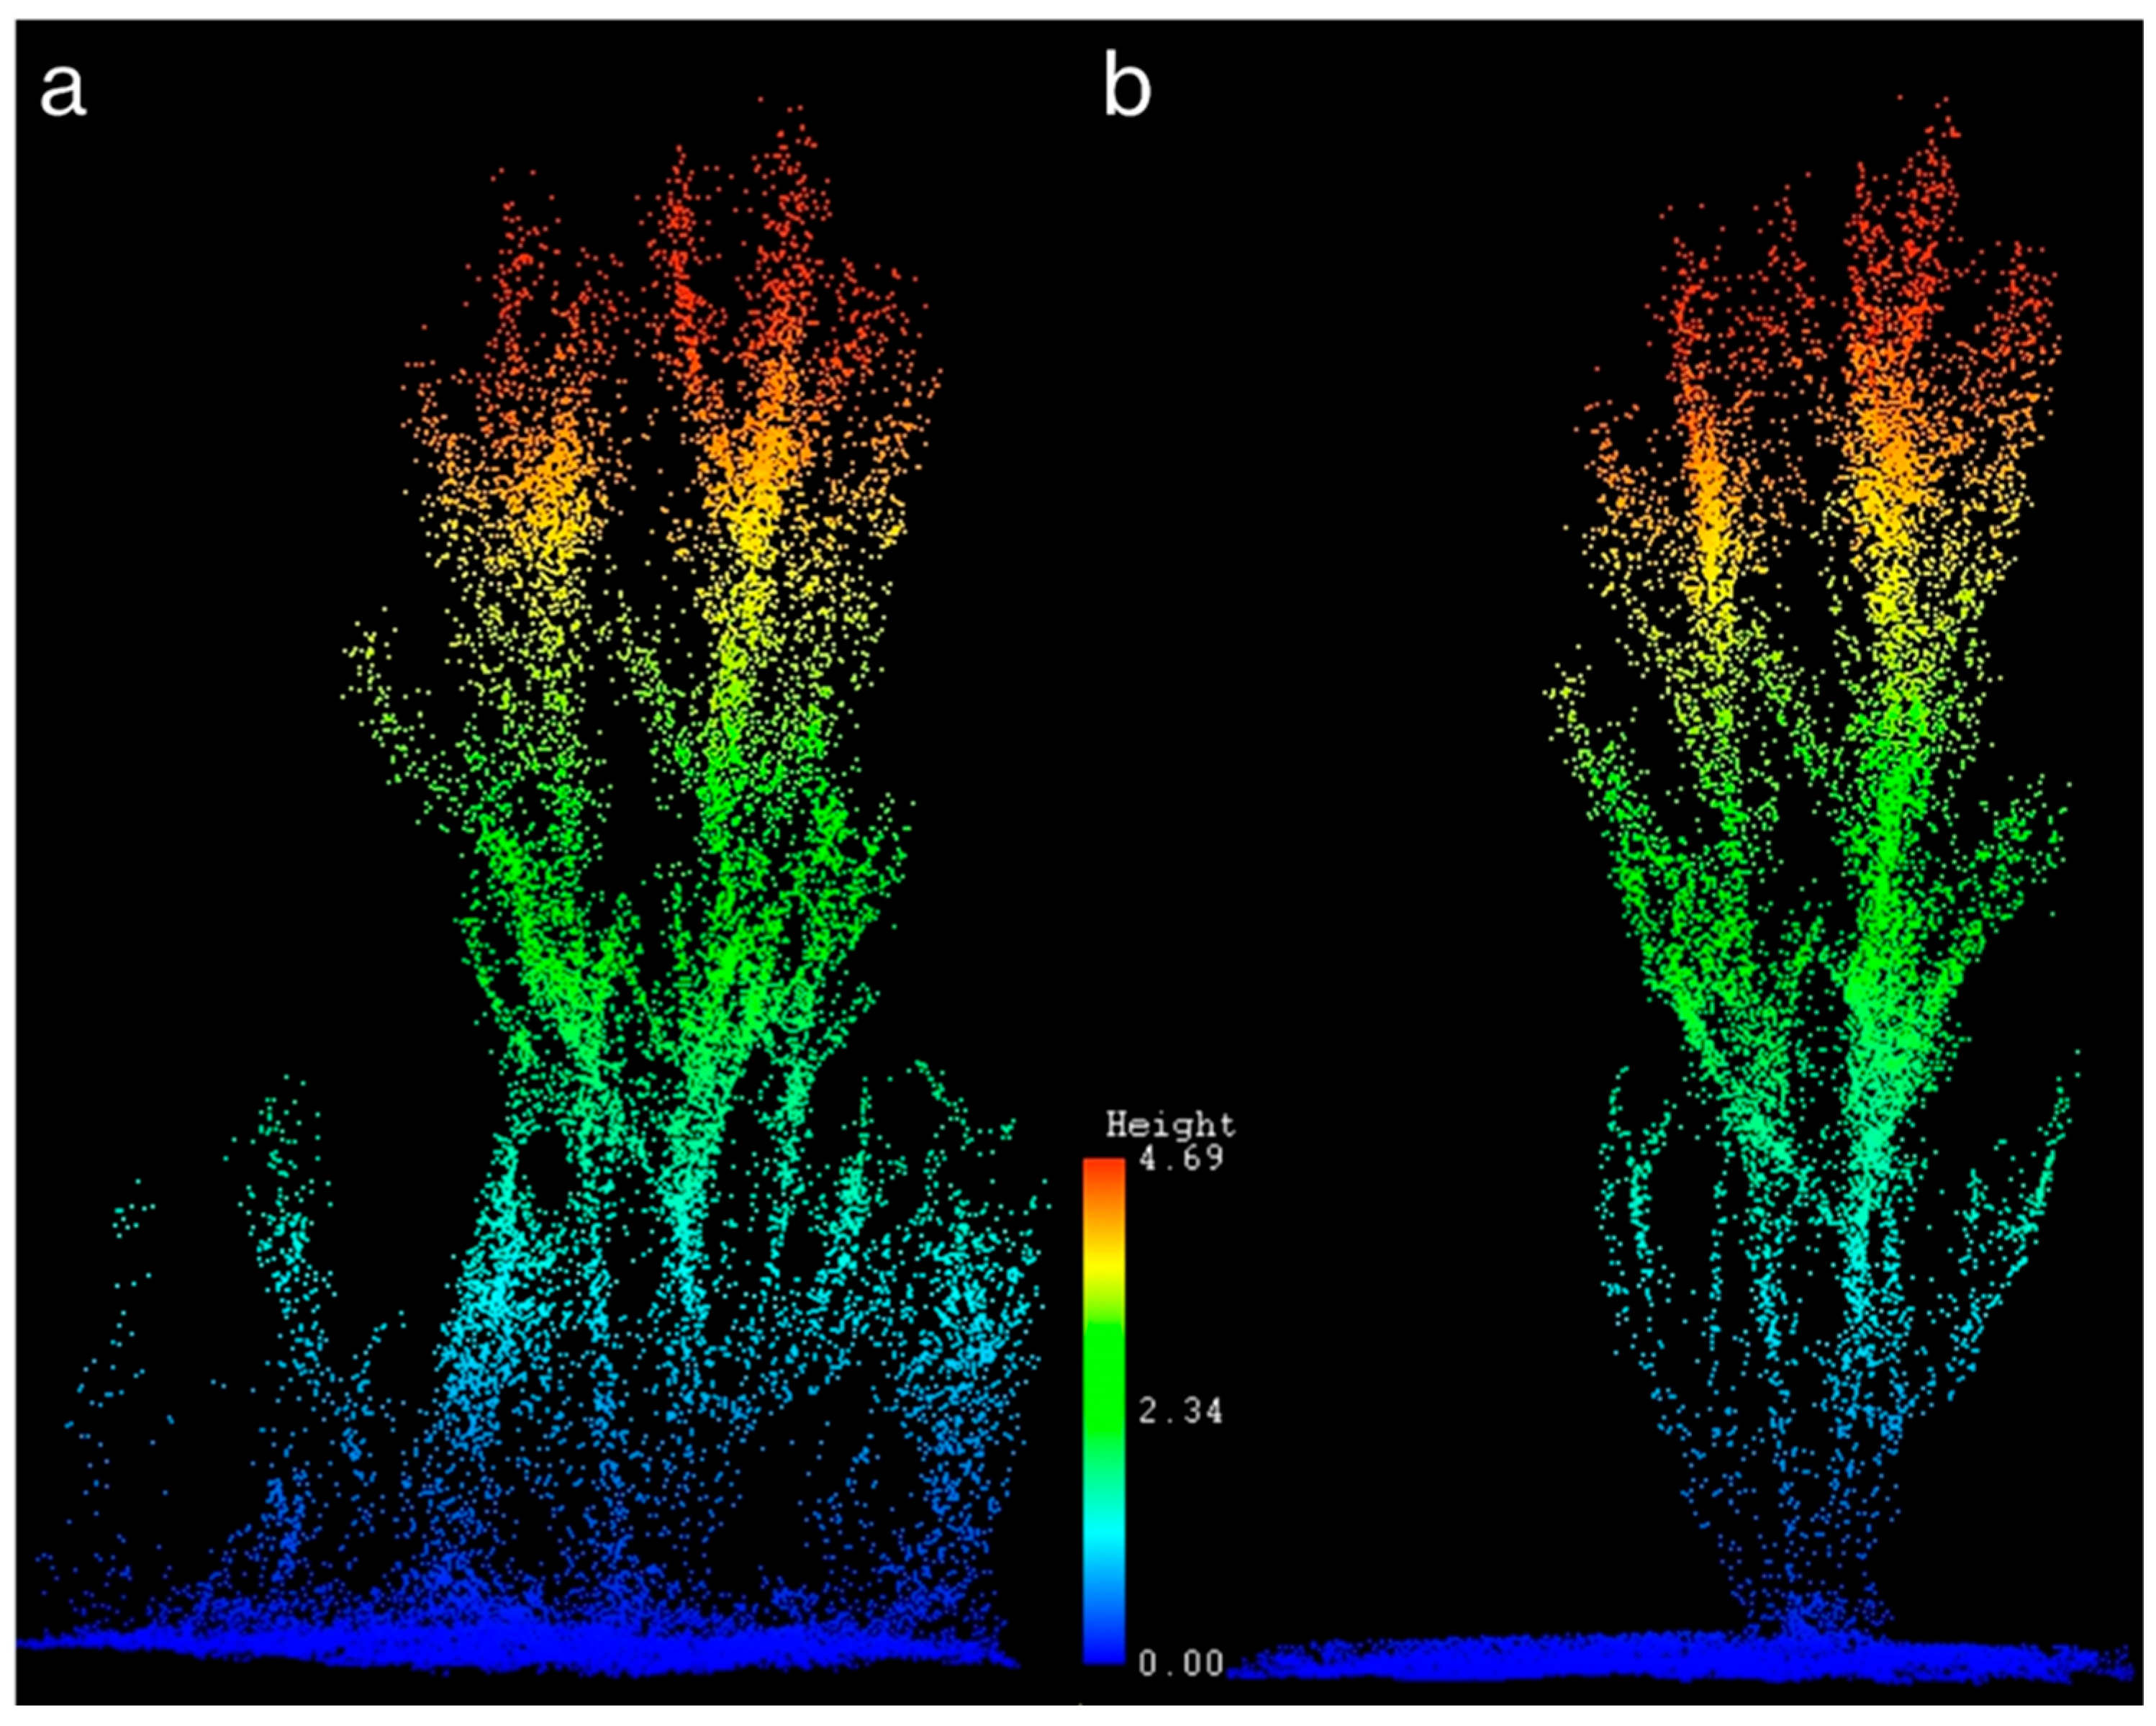
LiDAR360 software was used to delete outlier points that were more than five standard deviations (the default in the program) from the nearest neighbor points, determine ground points as the points with the lowest elevation, and normalize the point cloud based on the ground points to remove the effects of topographic variation and calculate point heights based on distance from the ground [28]. LiDAR360 also contains automatic tree segmentation algorithms based on seed points; however, coppice stools could not be accurately segmented with these automated tools because they contain multiple stems within each stool. Therefore, coppiced individuals that were harvested for field biomass sampling (see below) were manually clipped from the larger stand-level point cloud file based on their location on the planting map for further processing using the “clip by polygon” function in LiDAR360 software and saved as individual tree files. Each individual coppice plant point cloud file was further processed in LiDAR360 by removing points representing herbaceous material around the woody stems and any other points not affiliated with the target individual (Figure 1).
Figure 1.
Mobile terrestrial LiDAR point cloud of an individual coppice stool with (a) understory herbaceous vegetation present and (b) understory herbaceous vegetation manually deleted from the point cloud. Color values and corresponding scale represent the height of the LiDAR points.
Forest metrics representing the coppice individual’s point cloud were extracted (Table 2) and the individual was then “segmented” in order to extract tree-level metrics including tree height, crown diameters, crown area, and crown volume using LiDAR360. It is important to note the LiDAR scans were performed in the winter during dormancy and leaf-off conditions for the trees. Therefore, parameters including crown diameter, crown area, crown volume, gap fraction, and leaf area index (LAI), represent these parameters during leaf-off conditions. Although we were not able to capture crown dimensions and variables with leaves, these crown-level parameters may still provide important information and capture aspects of crown size from branch spread and branch density from the “gap fraction” and “leaf area index” parameters. Likewise, Adhikari et al. [29] found that leaf-on vs. leaf-off conditions did not affect developed LiDAR models and individuals could be grouped together in estimating woody biomass (the response variable in this study as well). Overall, the quality of the LiDAR data was very good with field-measured heights of the tallest stem in the coppice stool matching very well with LiDAR-estimated tree heights (Figure S2) with the best fit regression model having an R2 = 0.97, an RMSE = 0.09 m (%RMSE = 1.8%), and a bias = −0.09.
Table 2.
LiDAR metrics along with their definitions used in predictive models of dry woody aboveground biomass.
Individuals to be harvested for developing allometric and LiDAR models were purposively selected, ensuring sufficient representation across taxonomic groups and that the dataset included individuals representing a range of sizes and aboveground biomass values. Selected individuals across planted eastern cottonwoods and hybrid poplars (Table S1) were measured and harvested for aboveground woody biomass measurement in the 2021–2022 dormant season for the Monroe site and 2022–2023 dormant season at the Pontotoc site, which followed the second growing season after the initial harvest (i.e., two years of coppice growth) for each site. In total, 40 individuals were harvested from the Monroe site, and 47 individuals were harvested from the Pontotoc site. For each individual, all stems larger than 0.5 cm were measured at breast height (1.37 m above ground) and at the base of the stem (basal diameter) just above where it was attached to the stump (about 20 cm above ground). All stems were then cut, and the tallest stem was measured for length with the length of the remaining stool added to this value to obtain the total height of the tallest stem in the stool. All stems were bundled and measured with a hanging scale to the nearest 0.01 kg ensuring that all of the stem weights were being supported by the scale (i.e., no stems or branches were touching the ground). A representative stem sample of about 10 cm long was then cut and weighed in the field on a scale to the nearest gram. The stem samples for each individual were then returned to the lab and samples for the Monroe site were measured for fresh volume by submerging them in a beaker of water over a scale using the Archimedes method. All stem samples were then dried at 60 °C in a drying oven to constant weight and their dry weights measured. Sample density (wood and bark; g/cm3) was estimated for the Monroe samples as oven dry weight divided by fresh wood volume and sample moisture content was calculated as fresh weight minus dry weight divided by fresh weight. Total aboveground dry woody biomass was calculated as the total field fresh weight multiplied by the sample dry weight divided by the sample fresh weight.
For developing allometric models to predict aboveground dry woody biomass (kg) based on field measurements, stem diameters at breast height (DBH; cm) and basal diameters were used to calculate stem basal area (BA; cm2) at either breast height or basal height for each stem assuming circular stems. For each individual, basal areas were sorted from largest to smallest and sum of basal area of k largest stems (k = 1, 2, …, 10; i.e., ∑BAk) was obtained for each individual. Multiple linear regression models were then compared across the number of stems included (k), as well as including other metrics like height of the tallest stem in the coppice (height; m), total stem count in the coppice, and the taxa of the individual as an interaction term in the models. Site was also tested but did not significantly improve model fits. Additionally, it was determined that data using DBH performed better than basal diameters (Figure S3); therefore, analysis proceeded with DBH data only. Biomass models are commonly fit with logarithmic transformation to correct for possible violation of homogenous variance assumption. Therefore, we also compared models with and without a natural log transformation of AGBdry and stem BA. Both model forms were found to perform similarly in terms of model fit parameters and had similar residual properties (Figures S3 and S4). Therefore, models with untransformed data were selected because log transformation can introduce bias that needs to be accounted for with a correction factor when backtransforming data. Models included for testing can be found in Table 3. For all developed models, residual diagnostics were examined and did not show any violation of regression assumptions (Figures S4 and S5).
Table 3.
Tested multiple linear regression allometric models to predict dry woody aboveground biomass (AGBdry; kg) based on measured field data of stems in the coppice stool including the sum of basal areas of k (k = 1, 2, …, 10) largest stems (Σ(stem BA; cm2), X1) calculated from diameter at breast height (DBH; cm at 1.37 m above ground), total stem count in the coppice (No. stems; X2), height of the tallest stem in the coppice (Height; m; X3) and the product of ∑stemBA and height (cm2·m; X4). Models were compared with and without a natural log transformation of AGBdry and stem BA. Populus taxa were also included in models as an interaction term with P. deltoides × P. trichocarpa (D × T) and P. trichocarpa × P. deltoides (T × D) grouped together.
Models were evaluated based on their adjusted R2 values and RMSE and models with the best fit statistics (while requiring the least number of stems to be measured for the summation of basal area) progressed to the next level of analysis. For this smaller subset of models, leave-one(individual)-out cross-validation was performed in R version 4.2.2 using the CVlm function from the DAAG package. The model with the lowest cross-validated root mean square error (RMSE) and bias was selected as the best model.
For developing models to predict aboveground dry woody biomass from LiDAR data, 108 parameters derived from the LiDAR point cloud (Table 2) were included in a full model with and without ‘taxa’ included. The regsubsets function in the leaps package in R was used for model parameter selection using forward selection and limiting models to include eight parameters or less. It was found taxa and/or its interaction with LiDAR metrics were not included in the best models; therefore, it was dropped for further analysis. The best 50 parameters from forward selection (mostly height metrics and excluding the intensity metrics) were included in the second round of model selection using the exhaustive method and limiting the number of parameters in the model to four or fewer. This ensured that models were not overfit, in addition to selecting models based on the lowest Akaike Information Criterion (AIC), and Bayesian Information Criterion (BIC) values. Models were compared based on their adjusted R2 and Mallow’s Cp values and the best models were retained for further analysis. For these best models, we calculated and compared adjusted R2, AIC, BIC, root mean square error (RMSE), and variance inflation factors (VIF) for each parameter in the model. Models including parameters with VIF > 10 [30] were removed from further consideration and the ten best models with the highest adjusted R2 and lowest AIC, BIC, and RMSE parameters were then tested in leave-one(individual)-out cross-validation using the CVlm function in R. The model with the lowest cross-validated mean square error (MSE) was selected as the final model. RMSE and bias were also calculated for this best fit model. We also investigated other dimension reduction methods like Principal Component Analysis (PCA) and partial least square regression during preliminary analysis. However, the results are not reported here as the resulting models performed poorly compared with the models presented here.
3. Results
Coppiced trees measured for aboveground biomass were similar between the Monroe and Pontotoc sites in terms of total stem count per coppice stool (p = 0.26); however, the individuals at the Monroe site were larger in terms of the DBH of the largest stem (p < 0.0001), average DBH of the three largest stems (p < 0.0001), height of the tallest stem in the coppice stool (p < 0.0001), total coppice stool aboveground dry woody biomass (p < 0.0001), and stem moisture content (p = 0.047) compared with individuals at the Pontotoc site (Table 1). At both sites D × M individuals tended to have the fewest stems, while D × N individuals had the most (Table 1). Likewise, at both sites, for D × D individuals the DBH of the largest stems was greater than that of D × N and T × M individuals. Stem moisture content did not differ significantly across taxa at the Monroe site; meanwhile, at the Pontotoc site, moisture content of D × N stems was significantly larger than T × D/D × T stems (Table 1). At the Monroe site, D × N stems had higher wood density than all other taxa. Overall, dry woody aboveground biomass of coppiced individuals did not differ by taxa at either the Monroe or Pontotoc sites (Table 1). In general, all biometric parameters were highly correlated with one another, as well as with aboveground biomass, except for the number of stems in the coppice stool, which was not significantly correlated with any other metrics (Table 4).
Table 4.
Correlation matrix including correlation coefficients for field biometric parameters measured across both field sites. BA = basal area (cm2).
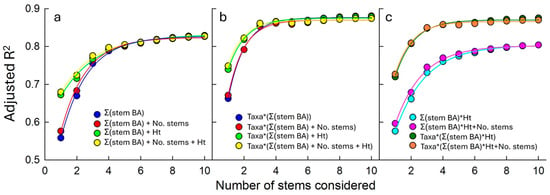
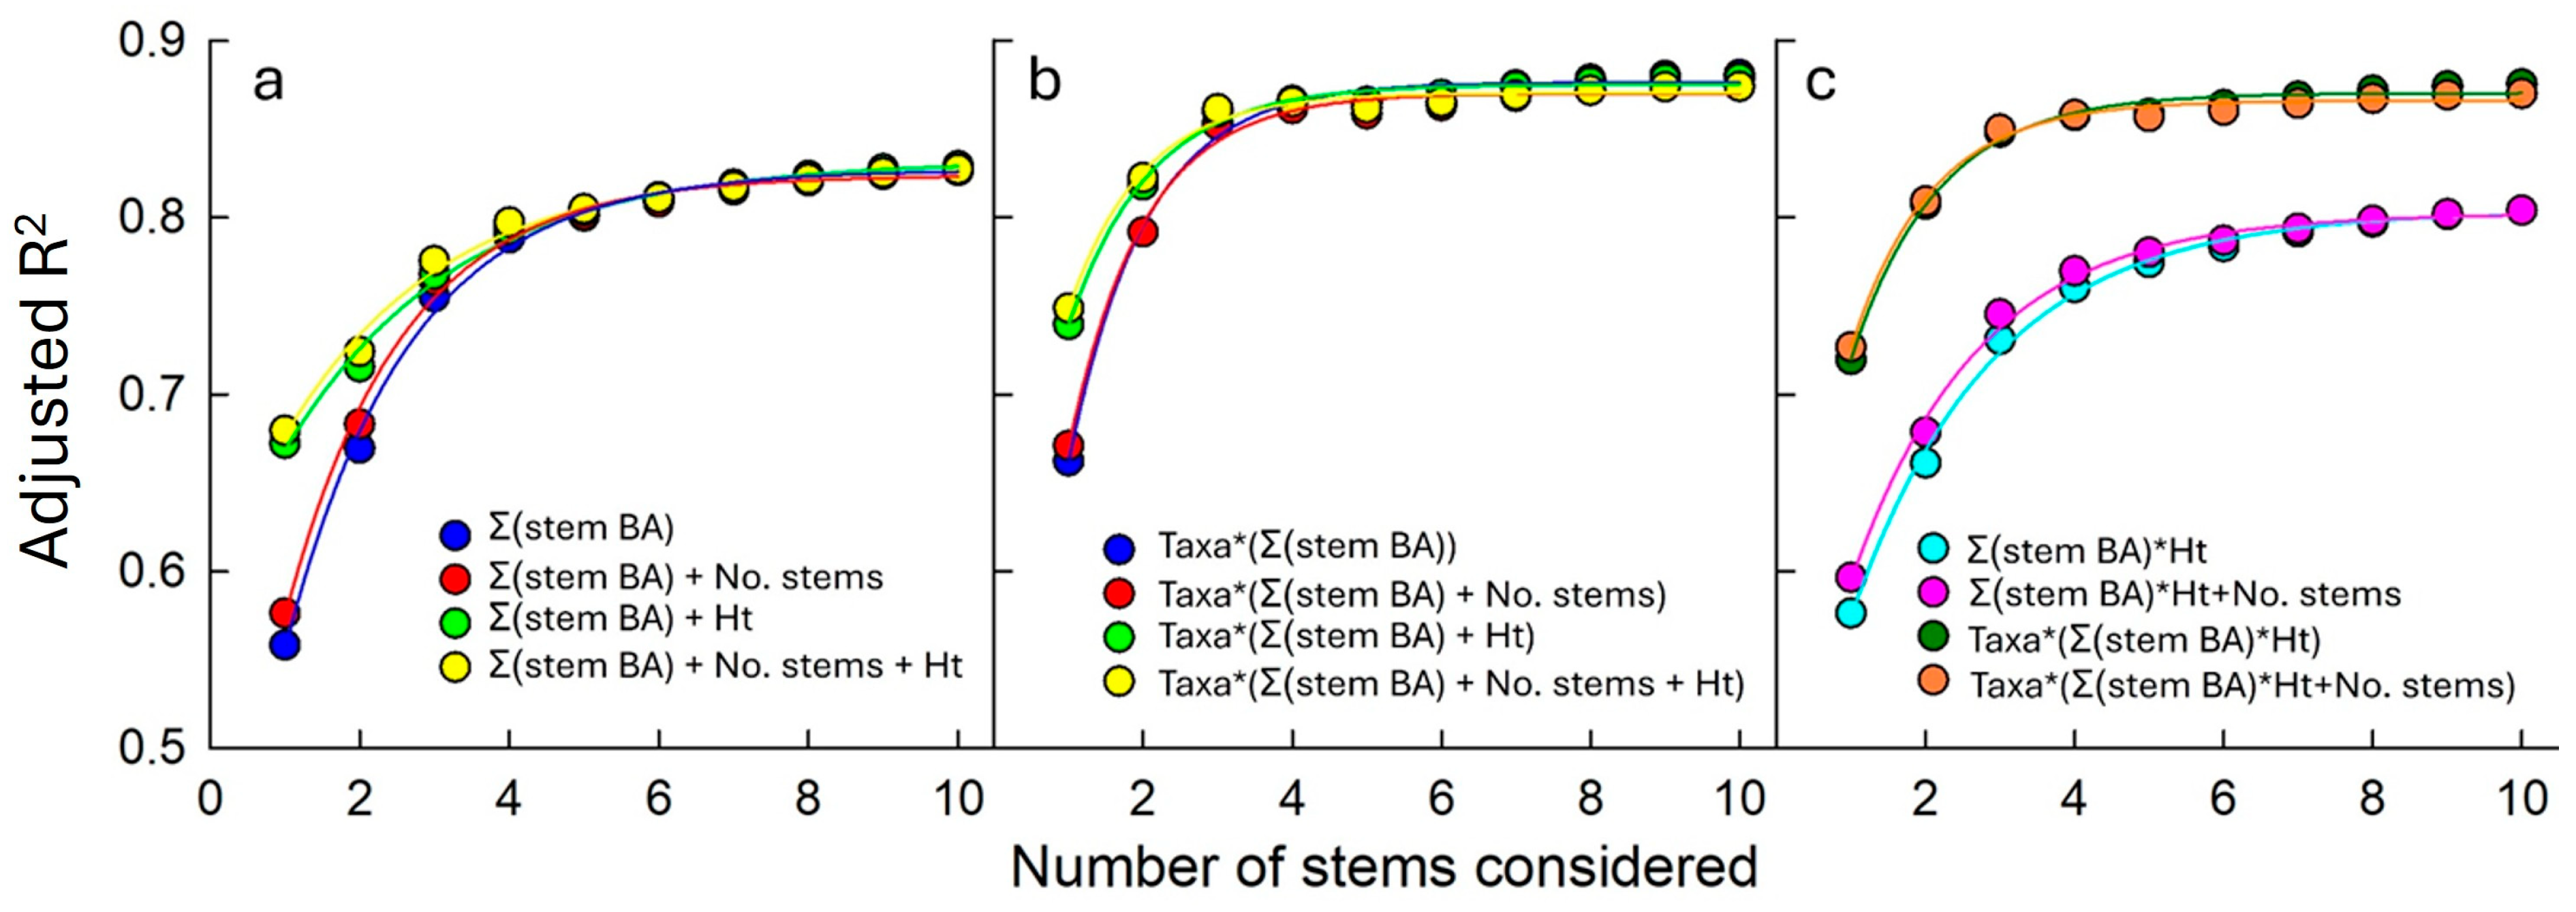
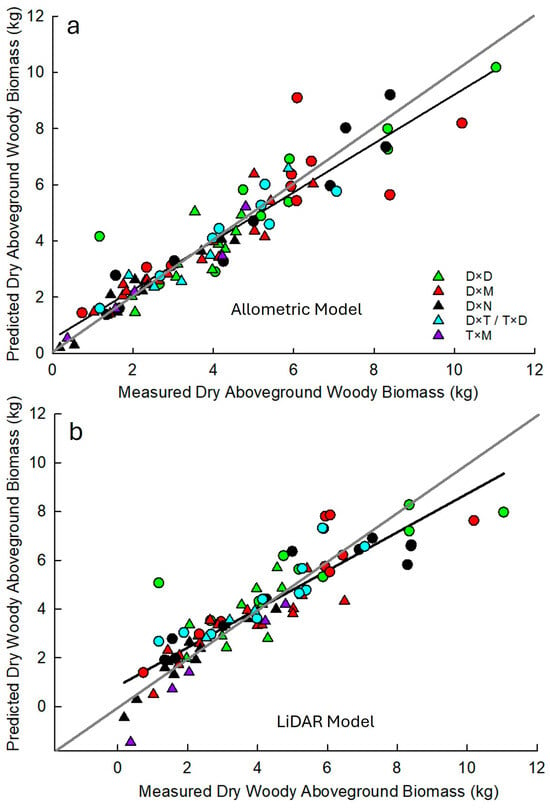
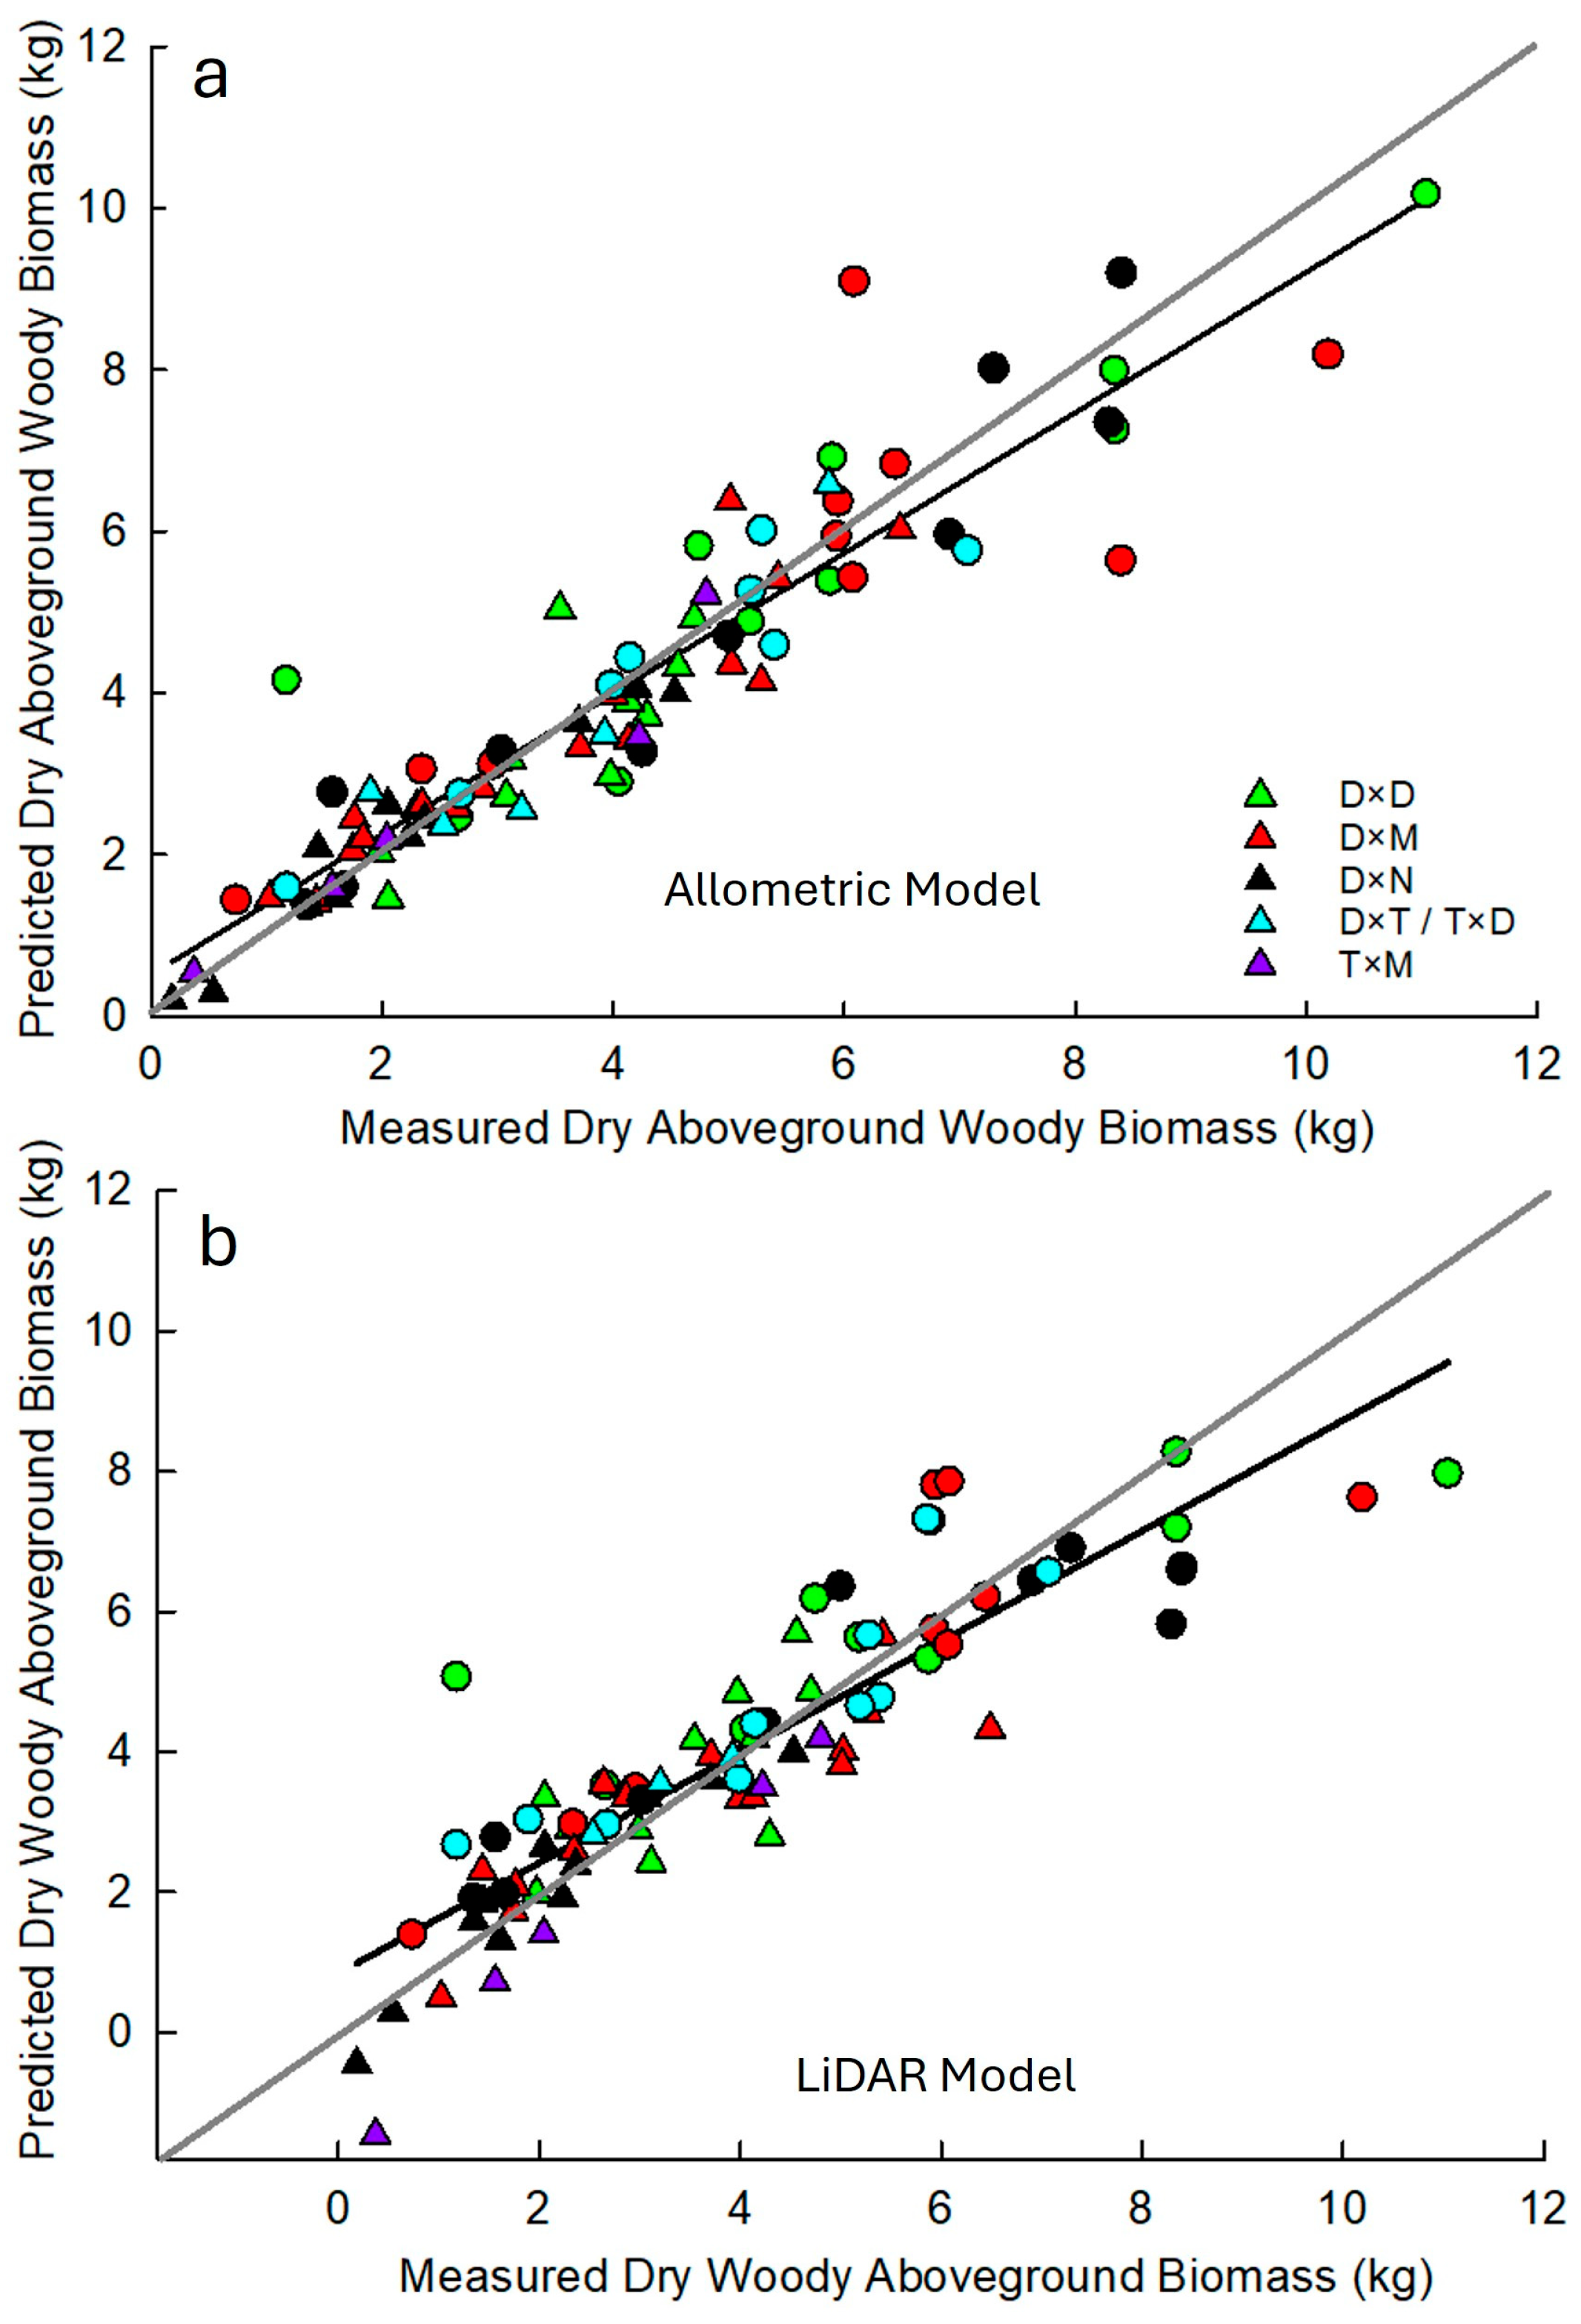
When the models used to predict aboveground dry woody biomass of the coppiced individual based on field metrics were fit ignoring taxa, the models with height and ∑BA had greater adjusted R2 values with the total stem count in the stool having little effect on adjusted R2 values (Figure 2a). In addition, adjusted R2 values continued to increase as more stems were included in the summation. However, the rate of increase in adjusted R2 declined when more than k = 4 stems were included in the summation (Figure 2a). In general, greater adjusted R2 values were achieved when taxa were included in models with the ∑BAk, regardless of whether stem height or total stem count in the stools were also included in models. For the taxa-specific models, the ∑BAk for k > 3 resulted in a minimal increase in adjusted R2 values (Figure 2b,c). In comparing all models that included taxa and the ∑BAk=3, as well as height and number of the stems in the coppice, we found that the simplest model with just taxa and ∑BAk=3 had the lowest cross-validated RMSE of 0.97 kg (24.44%) and bias (−0.02 kg; Table 5). The best model (Table 6) had an adjusted R2 of 0.85 and fit the one-to-one line well. The model slightly overestimated woody AGB at low values and slightly underestimated it at high values (Figure 3a). The residuals ranged from −3.44 to 2.6 kg (Figure S4). However, most residuals, except for three observations, were within kg (Figure S4).
Figure 2.
Coefficient of determination (R2) for models to predict dry woody aboveground biomass (AGBdry; kg) using stem diameter at breast height (measured at 1.37 m above ground) to calculate the sum of stem basal area (ΣBA; cm2) from increasing numbers (from 1 to 10 stems) of stems considered, total stem count (no. stems), height of the tallest stem in the coppice (height; m); (a) without taxa included, (b) with taxa included, and (c) with ΣBA × Height (cm2·m).
Table 5.
Multiple linear regression model fit parameters to predict dry woody aboveground biomass (AGBdry; kg) accessed from leave one tree out cross-validation including root mean standard error (RMSE; raw value and percentage of the mean AGB) and bias (raw value and percent of the mean AGB) of various tested models using allometric field-measured parameters including the sum of the three largest stem basal areas (Σ(stem BA; cm2); X1) calculated from diameter at breast height (DBH; cm; measured at 1.37 m above ground), total stem count in the coppice (No. stems; X2), height of the tallest stem in the coppice (Height; m; X3), and the product of ∑stemBA and height (cm2·m; X4) and mobile terrestrial LiDAR-derived metrics (Table 2), including crown volume (Cr_V), leaf area index (LAI), variance of height returns (Ht_var), and the highest point density or density metric 9 (Dens9). Populus taxa were also included in allometric models with P. deltoides × P. trichocarpa (D × T) and P. trichocarpa × P. deltoides (T × D) grouped together. Note that trees were measured during leaf-off conditions; therefore, “Cr_V” and “LAI” represent branch-level metrics.
Table 6.
Coefficients to predict dry woody aboveground biomass (AGBdry; kg) from the best taxa-specific allometric model based on field-measured data, which includes the sum of the basal area (calculated from diameter at breast height measured at 1.37 m above ground) of the three largest stems (Σstem BA; cm2). D × D: P. deltoides × P. deltoides, D × M: P. deltoides × P. maximowiczii, D × N: P. deltoides × P. nigra, D × T: P. deltoides × P. trichocarpa, T × D: P. trichocarpa × P. deltoides, T × M: P. trichocarpa × P. maximowiczii.
Figure 3.
Predicted vs. field-measured dry woody aboveground biomass from an allometric model based on field-measured data (a) and a model based on mobile terrestrial LiDAR data (b) for individuals measured at the Monroe (circle) and Pontotoc (triangle) field sites from the P. deltoides × P. deltoides (D × D; green), P. deltoides × P. maximowiczii (D × M; red), P. deltoides × P. nigra (D × N; black), P. deltoides × P. trichocarpa and P. trichocarpa × P. deltoides (D × T and T × D; blue) and P. trichocarpa × P. maximowiczii (T × M; purple) taxa. Gray lines represent the one-to-one line, and black lines are the best fit lines for the data.
The best models to predict woody AGB based on terrestrial mobile LiDAR did not include taxa; therefore, the same model can be used regardless of Populus taxa. LiDAR-derived metrics, including crown volume and leaf area index (LAI), which captured branch-level parameters since trees were scanned during leaf-off conditions, were selected in all 10 best models with five of those models also including height variance or variance of the height returns (Table 7). The first percentile of height returns, cumulative height returns to the 75th percentile, and the interquartile distance of height returns were each included in two of the 10 best LiDAR-based models (Table 7). Seven other parameters (density metric 9, mean absolute deviation (MAD) of median height returns, coefficient of variation in height returns, cumulative height to the 40th percentile, diameter at breast height, and height returns of the 5th and 20th percentiles) were only included in a single model (Table 7). The best LiDAR-based model to predict woody AGBdry (Table 8) included crown volume and LAI (although trees were measured during leaf-off conditions), variance of height returns, and the highest point density or density metric 9, which represents the proportion of height returns in the highest height interval, had a cross-validated RMSE of 1.15 kg (28.79%), adjusted R2 of 0.78, and a bias of 0.007 kg (Table 5). The LiDAR-based model fit the one-to-one line well but underestimated AGBdry at high values (bigger trees), slightly more than the best allometric model based on field data (Figure 3b and Figure S4).
Table 7.
Top ten models to predict dry woody aboveground biomass (AGBdry) using various mobile terrestrial LiDAR metrics (Table 2). Numbers associated with each parameter in each model represent their variance inflation factor and model fit metrics are included at the bottom of the table, specifically, the mean standard error (MSE) from cross-validation, adjusted coefficient of determination (R2), Akaike Information Criterion (AIC), Bayes Information Criterion (BIC), and root mean square error (RMSE). Bolded numbers were the best for each model metric among tested models.
Table 8.
Coefficient parameters for the best-fit multiple linear regression model to predict dry woody aboveground biomass (AGBdry; kg) from mobile terrestrial LiDAR data. Parameter definitions can be found in Table 2. Note that trees were measured in leaf-off conditions; therefore, crown volume and leaf area index represent branch-level parameters.
4. Discussion
We found that the best model to predict aboveground dry woody biomass of coppiced Populus individuals based on field-measured data could be achieved by using the sum of basal area of three largest stems (∑BAk=3) in the coppice, and that the addition of stem height and total stem count in the stool does not improve this best model. Including the three largest stems vs. only the single largest stem decreased the %RMSE by about 10%, whereas including all stems in the coppice stool only decreased %RMSE by about 2% compared with including the three largest stems. Taxa were also included in the best model, as our model predicts biomass across several hybrid poplars, as well as eastern cottonwood taxa; this model has an adjusted R2 of 0.85 and RMSE of 24.44%. It should be noted that this model was developed for a two-year-old coppice after one cutting cycle in northeastern Mississippi; therefore, extrapolation to older coppice rotations, different rotation lengths or different climate/soil conditions should be done with caution until further datasets are available. This adjusted R2 value is similar to values reported in other studies that estimated aboveground biomass of coppiced Populus individuals, even though those models summed the entire cross-sectional area of all shoots [13] or summed the total stem volume (calculated as D2 × H) of all shoots [31] and only included a single Populus taxa. Šrámek et al. [12] used average DBH of the three largest shoots in the stool and achieved R2 values around 0.95, although their models for aboveground biomass only included one Populus taxa (P. nigra × P. maximowiczii), and they also found that using three stems yielded better models than one or two stems. In addition, as with our study, they also found that measurements made at breast height level yielded better models than basal diameters [12]; Vanbeveren and Ceulemans [32] found that sampling at breast height was comparable in terms of model output to sampling at 22 cm above the soil and is easier on field crews making these measurements.
Other models for aboveground biomass of coppiced stools yielded higher R2 values than our model using measurements of just the largest stem in the coppice [17,32,33]; however, these models either included more individuals and/or were genotype specific. Dillen et al. [17] also found that Populus families/taxa needed to be included in modeling and that their effect was more important than site. However, Oliveira et al. [33] found that it was not possible to group genotypes by taxa for model development and that genotype specific models performed better than taxonomic models. Oliveira et al. [18] and Dahal et al. [10] also found that including the total stem count per stool in the coppice increased model accuracy, whereas we found that the best model did not include stem count. One reason may be that we included data from three stems as opposed to only the largest stem in their model. Additionally, both of these studies included stools of varying ages with stem number potentially being an important parameter when modeling across stool age [18]. Finally, as with our findings several other studies found that dominant stem height was not as good a predictor as stem diameter and was not necessary to include in models when diameter or basal area is already present in the model [16,17,18].
Our best LiDAR-based model to predict aboveground woody biomass had a slightly lower adjusted R2 at 0.78 and slightly higher RMSE of 28.79% compared with the allometric field model; however, it was not taxa-specific and could be used across all taxa measured and is well within an acceptable range in terms of fit statistics. Menéndez-Miguélez et al. [34] used terrestrial laser scanning (TLS) to develop predictive biomass equations for poplar coppice and found that the TLS model performed relatively poorly with an R2 of 0.25 and RMSE of 46.1%, which was worse than their model based on field measurements (number of stems, dominant stem height, and diameter) which had an R2 of 0.71 and RMSE of 28.8%. They did find that combining TLS with field-measured stem diameters yielded a model similar to the field-only model with an R2 = 0.70 and RMSE of 29.1%. However, on uncoppiced Populus trees, Adhikari et al. [29] found that a model for aboveground biomass based on mobile terrestrial LiDAR data performed slightly better than a model based on field metrics alone and had an R2 = 0.84 and RMSE = 28.7%. Castaño-Díaz et al. [35] were also able to derive a model with a fairly high R2 value of 0.78 using low-density (0.5 pulses m−2) airborne LiDAR data on short rotation willow (Salix spp.) coppice in Spain. It is also important to reiterate that automated “tree segmentation” was not able to group whole coppice individuals together and coppice stools needed to be manually clipped from the larger dataset for further processing. Menéndez-Miguélez et al. [34] also manually clipped individual stools to estimate biomass parameters. For coppice stands that are planted at a set spacing, it is likely feasible to automate individual selection by placing a grid over the LiDAR dataset or to develop algorithms that will group multiple stems that are located in close enough proximity to one another [36]; however, these were beyond the scope of this study.
Our best LiDAR-based model had four predictors in it, including crown volume, leaf area index, the variance of all height returns, and the highest point density (i.e., density metric 9 or the proportion of height returns in the highest height interval). Crown volume is calculated by LiDAR360 software as the volume of a convex hull that comprises the crown’s point cloud and was also found to be a significant parameter in single stem [29] and coppiced [34] Populus tree models for aboveground biomass. Leaf area index is calculated in LiDAR360 software from the average scan angle of the LiDAR points, gap fraction (calculated as the proportion of ground points to total points), and leaf angle distribution, which is user entered (0.5 in this case; [28]). Although our individuals were scanned in winter and did not have leaves, the “leaf area index” parameter can still capture the distribution and density of branches in the point cloud to predict aboveground biomass. While we only measured trees in leaf-off conditions, Adhikari et al. [29] measured both leaf-on and leaf-off trees in similar growing conditions and found that they could be combined into one model. Variance of the height return intervals were also significant which represents the spread of the points along the height distribution with greater dispersion of points across a larger height range correlated with higher aboveground biomass. Singh et al. [37] also found this attribute to be an important predictor of urban tree biomass. Finally, density metric 9 or the proportion of all height returns in the highest category (when height returns are split evenly into 10 vertical height categories 0–9) was significant in the model with a negative correlation, suggesting that having fewer points higher in the crown proportionally was correlated with higher aboveground biomass. This suggests that having a higher proportion of points lower in the point cloud corresponds to larger biomass, potentially because the lower stem contributes more to increasing biomass than the upper region of the stem. A similar result was found by Adhikari et al. [29] for non-coppiced Populus trees where density metric 0 was positively correlated with aboveground dry woody biomass particularly for D × M genotypes, while the density metric 5 (midpoint density) was negatively correlated with dry woody biomass across taxa.
5. Conclusions
We found that an allometric model containing the summed basal area (measured at breast height) of the three largest stems in a poplar coppice stool provided the best model to estimate dry woody aboveground biomass, with stem height and total stem count failing to provide additional explanatory power. Likewise, diameter measurements taken at breast height yielded better models than measurements taken at the base of the stems. Therefore, field crews interested in only estimating aboveground woody biomass of coppice stools can restrict measurements to the DBH of the three largest stems and taxa information and bypass the time-consuming task of measuring stem heights. The best model to predict aboveground dry woody biomass based on terrestrial mobile LiDAR data had slightly poorer RMSE and R2 metrics than the model based on field data; however, it was independent of poplar taxa, whereas the allometric model based on field data was taxa-specific. Therefore, the LiDAR-based aboveground biomass model can provide estimates within 4% RMSE of field-based models, provided that comparable scanning and segmentation procedures are followed. The best LiDAR-based model included four parameters, specifically, crown volume, leaf area index, the variance of the height returns, and the highest point density (i.e., density metric 9 or the proportion of points in the highest point interval (negative correlation)). While both field measurements and mobile terrestrial LiDAR yielded similar model fits, they have specific strengths and weaknesses with field measurements having lower initial costs but potentially being more time-consuming, particularly over larger spatial scales. Mobile LiDAR systems allow for field measurements to be made quickly and over larger spatial scales, particularly if aerial LiDAR sensors can yield similar models as the terrestrial sensor tested here. However, they have higher upfront costs and potentially more computer processing time, although continued development of automated algorithms should reduce processing time. It is important to note that both the field and LiDAR models were developed for two-year-old coppice stools after one cutting cycle; therefore, extrapolation to other ages, management regimes, and climate/soil conditions should be done with caution. Overall, these models can be used to quickly and efficiently predict aboveground dry woody biomass of coppice poplar stools grown for bioenergy production.
Supplementary Materials
The following supporting information can be downloaded at: https://www.mdpi.com/article/10.3390/f17020227/s1, Table S1: Populus genotypes used to develop allometric equations to predict dry woody aboveground biomass grouped by taxa (D × D: P. deltoides × P. deltoides, D × M: P. deltoides × P. maximowiczii, D × N: P. deltoides × P. nigra, D × T: P. deltoides × P. trichocarpa, T × D: P. trichocarpa × P. deltoides, T × M: P. trichocarpa × P. maximowiczii) and indicating the field site from which they were measured and harvested; Figure S1: The mobile terrestrial backpack LiDAR system used in this study; Figure S2: (a) Best fit model between field-measured and LiDAR-estimated coppice stool maximum stem height for individuals measured at the Monroe (circle) and Pontotoc (triangle) field sites from the P. deltoides × P. deltoides (D × D; green), P. deltoides × P. maximowiczii (D × M; red), P. deltoides × P. nigra (D × N; black), P. deltoides × P. trichocarpa and P. trichocarpa × P. deltoides (D × T and T × D; blue) and P. trichocarpa × P. maximowiczii (T × M; purple) taxa where the black line is the one-to-one line and (b) residuals for the model; Figure S3: Adjusted R2 for models to predict dry woody aboveground biomass (AGBdry; kg) using stem diameter to calculate the sum of stem basal area (ΣBA; cm2) from increasing numbers (from 1 to 10 stems) of stems considered, total stem count (no. stems), height of the tallest stem in the coppice (height; m) and poplar taxa. Blue points are fitted with stem basal areas calculated from diameter at breast height (1.37 m above ground) measurements and red points are calculated from diameter measurements taken at the base of the stem where it emerges from the stump (about 20 cm above ground); Figure S4: Residual plots for (a) the best allometric model (∑stemBA) with natural log transformed aboveground dry woody biomass, (b) the best allometric model (∑stemBA) without natural log transformation and (c) the best fit LiDAR model; Figure S5: QQ plots for (a) the best allometric model (∑stemBA) with natural log transformed aboveground dry woody biomass, (b) the best allometric model (∑stemBA) without natural log transformation and (c) the best fit LiDAR model.
Author Contributions
Conceptualization, H.J.R. and K.P.P.; formal analysis, H.J.R.; investigation, H.J.R.; writing—original draft preparation, H.J.R.; writing—review and editing, K.P.P.; funding acquisition, H.J.R. and K.P.P. All authors have read and agreed to the published version of the manuscript.
Funding
This research was funded by the National Institute of Food and Agriculture, U.S. Department of Agriculture (2018-68005-27636 and McIntire-Stennis projects MISZ-700001 and MISZ-700012), and the United States Department of Energy (DE-EE0009280).
Data Availability Statement
The original data presented in this study are openly available in Mississippi State University’s Institutional Repository (Scholar’s Junction) at https://scholarsjunction.msstate.edu/research-data/4/ which were uploaded on 27 October 2025.
Acknowledgments
The authors thank R. Rousseau, C. James, M. Murphy, T. Bowling, and W. Booth for site logistics and fieldwork assistance. The authors thank S. Adhikari, J. Wang, W. Shafqat and T.Y. Kyaw for fieldwork assistance. This publication is a contribution of the Forest and Wildlife Research Center, Mississippi State University.
Conflicts of Interest
The authors declare no conflicts of interest.
References
- Sannigrahi, P.; Ragauskas, A.J.; Tuskan, G.A. Poplar as a feedstock for biofuels: A review of compositional characteristics. Biofuels Bioprod. Biorefin. 2010, 4, 209–226. [Google Scholar] [CrossRef] [Scilit]
- Enescu, C.; Mihalache, M.; Illie, L.; Dinca, L.; Chira, D.; Vasić, A.; Murariu, G. Advancing the Sustainability of Poplar-Based Agroforestry: Key Knowledge Gaps and Future Pathways. Sustainability 2026, 18, 341. [Google Scholar] [CrossRef] [Scilit]
- Langholtz, M.H. 2023 Billion-Ton Report: An Assessment of U.S. Renewable Carbon Resources; Oak Ridge National Laboratory, U.S. Department of Energy: Oak Ridge, TN, USA, 2024; Volume ORNL/SPR-2024/3103. [Google Scholar] [CrossRef]
- Ferm, A.; Kauppi, A. Coppicing as a means for increasing hardwood biomass production. Biomass 1990, 22, 107–121. [Google Scholar] [CrossRef] [Scilit]
- Stanton, B.J.; Bourque, A.; Coleman, M.; Eisenbies, M.; Emerson, R.M.; Espinoza, J.; Gantz, C.; Himes, A.; Rodstrom, A.; Shuren, R.; et al. The practice and economics of hybrid poplar biomass production for biofuels and bioproducts in the Pacific Northwest. BioEnergy Res. 2020, 14, 543–560. [Google Scholar] [CrossRef] [Scilit]
- Fuertes, A.; Oliveira, N.; Cañellas, I.; Sixto, H.; Rodríguez-Soalleiro, R. An economic overview of Populus spp. in Short Rotation Coppice systems under Mediterranean conditions: An assessment tool for decision-making. Renew. Sustain. Energy Rev. 2021, 151, 111577. [Google Scholar] [CrossRef] [Scilit]
- Vanbeveren, S.P.P.; Schweier, J.; Berhongaray, G.; Ceulemans, R. Operational short rotation woody crop plantations: Manual or mechanised harvesting? Biomass Bioenergy 2015, 72, 8–18. [Google Scholar] [CrossRef] [Scilit]
- Santangelo, E.; Scarfone, A.; Del Giudice, A.; Acampora, A.; Alfano, V.; Suardi, A.; Pari, L. Harvesting systems for poplar short rotation coppice. Ind. Crops Prod. 2015, 75, 85–92. [Google Scholar] [CrossRef] [Scilit]
- Rummer, B.; Mitchell, D. Harvesting systems and costs for short rotation poplar. In Proceedings of the SunGrant Initiative 2012 National Conference: Science for Biomass Feedstock Production and Utilization, New Orleans, LA, USA, 2–5 October 2012. [Google Scholar]
- Dahal, B.; Poudel, K.; Renninger, H.; Granger, J.; Leininger, T.; Gardiner, E.; Souter, R.; Rousseau, R. Aboveground biomass equations for black willow (Salix nigra Marsh.) and eastern cottonwood (Populus deltoides Bartr. ex Marsh.). Trees For. People 2022, 7, 100195. [Google Scholar] [CrossRef] [Scilit]
- Šrámek, M.; Matoušková, M.; Lengálová, K.; Kruttová, M.; Zlatanov, T.; Úradníček, L.; Ehrenbergerová, L.; Matula, R. Effective determination of biomass in oak coppices. Trees 2020, 34, 1335–1345. [Google Scholar] [CrossRef] [Scilit]
- Šrámek, M.; Weger, J.; Bubeník, J.; Matoušková, M.; Lengálová, K.; Matula, R. Effective woody biomass estimation in poplar short-rotation coppices—Populus nigra × P. maximowiczii. iForest 2023, 16, 202–209. [Google Scholar] [CrossRef] [Scilit]
- Benetka, V.; Novotná, K.; Štochlová, P. Biomass production of Populus nigra L. clones grown in short rotation coppice systems in three different environments over four rotations. iForest 2014, 7, 233–239. [Google Scholar] [CrossRef] [Scilit]
- Mosseler, A.; Major, J.E.; Labrecque, M.; Larocque, G.R. Allometric relationships in coppice biomass production for two North American willows (Salix spp.) across three different sites. For. Ecol. Manag. 2014, 320, 190–196. [Google Scholar] [CrossRef] [Scilit]
- Al Afas, N.; Marron, N.; Van Dongen, S.; Laureysens, I.; Ceulemans, R. Dynamics of biomass production in a poplar coppice culture over three rotations (11 years). For. Ecol. Manag. 2008, 255, 1883–1891. [Google Scholar] [CrossRef] [Scilit]
- Ben Brahim, M.; Gavaland, A.; Cabanettes, A. Generalized allometric regression to estimate biomass of Populus in short-rotation coppice. Scand. J. For. Res. 2000, 15, 171–176. [Google Scholar] [CrossRef] [Scilit]
- Dillen, S.Y.; Marron, N.; Bastien, C.; Ricciotti, L.; Salani, F.; Sabatti, M.; Pinel, M.P.C.; Rae, A.M.; Taylor, G.; Ceulemans, R. Effects of environment and progeny on biomass estimations of five hybrid poplar families grown at three contrasting sites across Europe. For. Ecol. Manag. 2007, 252, 12–23. [Google Scholar] [CrossRef] [Scilit]
- Oliveira, N.; Rodríguez-Soalleiro, R.; Hernández, M.J.; Cañellas, I.; Sixto, H.; Pérez-Cruzado, C. Improving biomass estimation in a Populus short rotation coppice plantation. For. Ecol. Manag. 2017, 391, 194–206. [Google Scholar] [CrossRef] [Scilit]
- Mapuru, M.J.; Xulu, S.; Gebreslasie, M. Remote sensing applications in monitoring poplars: A review. Forests 2023, 14, 2301. [Google Scholar] [CrossRef] [Scilit]
- Chen, Q. Modeling aboveground tree woody biomass using national-scale allometric methods and airborne lidar. ISPRS J. Photogramm. Remote Sens. 2015, 106, 95–106. [Google Scholar] [CrossRef] [Scilit]
- Popescu, S.C.; Zhao, K.; Neuenschwander, A.; Lin, C. Satellite lidar vs. small footprint airborne lidar: Comparing the accuracy of aboveground biomass estimates and forest structure metrics at footprint level. Remote Sens. Environ. 2011, 115, 2786–2797. [Google Scholar] [CrossRef] [Scilit]
- Zolkos, S.G.; Goetz, S.J.; Dubayah, R. A meta-analysis of terrestrial aboveground biomass estimation using lidar remote sensing. Remote Sens. Environ. 2013, 128, 289–298. [Google Scholar] [CrossRef] [Scilit]
- Ruhan, A.; Du, W.; Ying, H.; Wei, B.; Shan, Y.; Dai, H. Estimation of aboveground biomass of individual trees by backpack LiDAR based on parameter-optimized quantitative structural models (AdQSM). Forests 2023, 14, 475. [Google Scholar] [CrossRef] [Scilit]
- Wang, Q.; Pang, Y.; Chen, D.; Liang, X.; Lu, J. Lidar biomass index: A novel solution for tree-level biomass estimation using 3D crown information. For. Ecol. Manag. 2021, 499, 119542. [Google Scholar] [CrossRef] [Scilit]
- Campbell, M.J.; Eastburn, J.F.; Mistick, K.A.; Smith, A.M.; Stovall, A.E.L. Mapping individual tree and plot-level biomass using airborne and mobile lidar in piñon-juniper woodlands. Int. J. Appl. Earth Obs. Geoinf. 2023, 118, 103232. [Google Scholar] [CrossRef] [Scilit]
- Xu, D.; Wang, H.; Xu, W.; Luan, Z.; Xu, X. LiDAR applications to estimate forest bioass at the individual tree scale: Opportunities, challenges and future perspectives. Forests 2021, 12, 550. [Google Scholar] [CrossRef] [Scilit]
- Yun, T.; Li, J.; Ma, J.Y.; Zhou, J.; Wang, R.; Eichhorn, M.P.; Zhang, H. Status, advancements and prospects of deep learning methods applied in forest studies. Int. J. Appl. Earth Obs. Geoinf. 2024, 131, 103938. [Google Scholar] [CrossRef] [Scilit]
- Green Valley International. LiDAR360 User Guide LiDAR Point Cloud Processing and Analyzing Software; Green Valley International: Berkeley, CA, USA, 2025; Volume 9. [Google Scholar]
- Adhikari, S.; Ma, Q.; Poudel, K.; Renninger, H.J. Aboveground biomass estimation of young bioenergy plantations of Populus and its hybrids using mobile (backpack) LiDAR remote sensing. Trees For. People 2024, 18, 100665. [Google Scholar] [CrossRef] [Scilit]
- Myers, R. Classical and Modern Regression with Applications, 2nd ed.; Duxbury Press: Pacific Grove, CA, USA, 1990. [Google Scholar]
- Byrd, B.A.; Hood, W.G.; Tyree, M.C.; Dillaway, D.N. Estimation of above ground biomass for multi-stemmed short-rotation woody crops. In Proceedings of the 17th Biennial Southern Silvicultural Research Conference; e–Gen. Tech. Rep. SRS–203; Holley, A.G., Connor, K.F., Haywood, J.D., Eds.; Department of Agriculture, Forest Service, Southern Research Station: Asheville, NC, USA, 2015; pp. 313–314. [Google Scholar]
- Vanbeveren, S.P.P.; Ceulemans, R. Genotypic differences in biomass production during three rotations of short-rotation coppice. Biomass Bioenergy 2018, 119, 198–205. [Google Scholar] [CrossRef] [Scilit]
- Oliveira, N.; Rodríguez-Soalleiro, R.; Pérez-Cruzado, C.; Cañellas, I.; Sixto, H. On the genetic affinity of individual tree biomass allometry in poplar short rotation coppice. BioEnergy Res. 2017, 10, 525–535. [Google Scholar] [CrossRef] [Scilit]
- Menéndez-Miguélez, M.; Madrigal, G.; Sixto, H.; Oliveira, N.; Calama, R. Terrestrial laser scanning for non-destructive estimation of aboveground biomass in short-rotation poplar coppice. Remote Sens. 2023, 15, 1942. [Google Scholar] [CrossRef] [Scilit]
- Castaño-Díaz, M.; Álvarez-Álvarez, P.; Tobin, B.; Nieuwenhuis, M.; Afif-Khouri, E.; Cámara-Obregón, A. Evaluation of the use of low-density LiDAR data to estimate structural attributes and biomass yield in a short-rotation willow coppice: An example in a field trial. Ann. For. Sci. 2017, 74, 69. [Google Scholar] [CrossRef] [Scilit]
- Ghasemi, M.; Latifi, H.; Pourhashemi, M. A novel method for detecting and delineating coppice trees in UAV images to monitor tree decline. Remote Sens. 2022, 14, 5910. [Google Scholar] [CrossRef] [Scilit]
- Singh, K.K.; Chen, G.; McCarter, J.B.; Meentemeyer, R.K. Effects of LiDAR point density and landscape context on estimates of urban forest biomass. ISPRS J. Photogramm. Remote Sens. 2015, 101, 310–322. [Google Scholar] [CrossRef] [Scilit]

Disclaimer/Publisher’s Note: The statements, opinions and data contained in all publications are solely those of the individual author(s) and contributor(s) and not of MDPI and/or the editor(s). MDPI and/or the editor(s) disclaim responsibility for any injury to people or property resulting from any ideas, methods, instructions or products referred to in the content. |
© 2026 by the authors. Licensee MDPI, Basel, Switzerland. This article is an open access article distributed under the terms and conditions of the Creative Commons Attribution (CC BY) license.