


Abstract
Nitrous oxide (N2O) is a potent greenhouse gas, and acidic forest soils are major sources. Biochar can mitigate N2O emissions in some soils but its effectiveness is pH-dependent, and can vary with biochar modification. It is unclear whether modified biochar reduces or increases N2O emissions in acidic forest soils. This study was designed primarily to evaluate ferric nitrate-modified biochar as an amendment for improving soil pH in acidic Moso bamboo (Phyllostachys edulis) forest soils, and to determine whether this pH improvement can be achieved without increasing N2O emissions. We investigated effects of modified biochar on N2O emissions and nitrogen transformation genes in acidic Moso bamboo forest soils. An incubation study (121 days; 5% w/w dose; four replicates per treatment) included seven treatments: control, pristine biochar (B), and ferric nitrate-modified biochars (MB1–MB5) prepared at different pH values. Cumulative N2O emissions were lowest in the control and 4.8–7.7-fold higher in all biochar variants than in the control, peaking at MB3 and declining at MB5. Soil pH was the main factor: the N2O emission rate peaked at pH ≈ 5.18, and the (nirK + nirS)/nosZ ratio showed a fitted maximum at pH 5.19, although this quadratic fit was not significantly better than a linear model. Bacterial amoA and nosZ abundances increased with pH. Under MB treatments, N2O emission rate was negatively correlated with pH and nosZ and positively correlated with ammonium nitrogen, nitrate nitrogen, and the (nirK + nirS)/nosZ ratio (all p < 0.05). Soil pH and the amount of added nitrate varied in tandem across treatments, so their effects could not be fully disentangled.
1. Introduction
Nitrous oxide (N2O) is a potent greenhouse gas with a global warming potential approximately 273 times that of carbon dioxide over a 100-year time frame [1]. Soil, as the largest natural emission source, contributes approximately 6.4 Tg of N2O-N (N2O expressed as nitrogen) to the atmosphere each year and accounts for 35% of the total global N2O emissions [2]. The concentration of N2O in the atmosphere has increased by over 20% since the industrial revolution [3]. Notably, 87% of this increase is linked to agricultural activities, especially the use of nitrogenous fertilizers [4]. N2O is produced mainly by nitrification and denitrification, which are regulated by soil pH, nitrogen (N) substrates, and functional gene abundance [5]. Soil pH strongly influences both N2O production and consumption. Low pH generally stimulates N2O production by inhibiting N2O reductase, thereby increasing the N2O: dinitrogen (N2) ratio [6]. However, increasing soil pH can also enhance gross nitrification rates and the associated N2O production [7]. The net effect of pH on N2O emissions therefore depends on the relative contributions of nitrification and denitrification [6]; low pH favors denitrification and heterotrophic nitrification [8], whereas increasing soil pH can decrease N2O emissions from denitrification [9]. Therefore, managing soil pH is critical for mitigating N2O emissions in acidic forest ecosystems.
Biochar, produced by biomass pyrolysis under oxygen-limited conditions, has been widely studied as an amendment to reduce soil N2O emissions [10]. It has a porous structure, functional groups, and a carbon-rich composition; therefore, it is considered an important amendment to mitigate greenhouse gas emissions [11]. Biochar decreases N2O production by improving N sorption, soil aeration, and modulating microbial activities [12,13]. A global meta-analysis showed that biochar reduces N2O emissions by 13.1% on average, by increasing amoA and nosZ and decreasing nirS abundance [14]. However, biochar effects on N2O emissions are inconsistent and depend strongly on biochar pH and soil pH, especially in acidic soils. This inconsistency suggests that the effect of biochar on N2O may be regulated by its own pH relative to that of the tested soil. For example, alkali-modified biochar reduced N2O emissions by 38.9% by increasing nosZ gene abundance, whereas polyethyleneimine-alkali-modified biochar increased N2O emissions by 119.5% in the same acidic soil [15]. Similarly, previous study reported that modified biochar derived from Camellia oleifera fruit shell reduced N2O emissions by 34.3% in N-fertilized soil without cadmium addition, compared with 25.8% for pristine biochar [16]. These contrasting results indicate that the modification method and the resulting biochar pH critically determine whether biochar mitigates or stimulates N2O.
Moso bamboo (Phyllostachys edulis (Carrière) J. Houzeau), a native and economically important bamboo species covering approximately 4.43 million hectares in subtropical China, often grows in acidic soils and plays an important role in N cycling [17]. In intensively managed Moso bamboo forests, intercropping edible fungi has become an important understory industry, but it generates large amounts of spent mushroom substrate (SMS), and its disposal constrains sustainable development. Rich in carbon and N, SMS is not only a potential N2O emission source but also an ideal feedstock for biochar. The application of biochar made from SMS to Moso bamboo forest soil significantly decreased N2O emissions with N fertilization at 25 and 30 °C [18]. Likewise biochar from corn straw applied at 5 t C/ha reduced N2O emissions by 17–20% in Moso bamboo forest soil, attributed to decreased N substrate availability and reduced abundances of N2O-producing genes (ammonia-oxidizing bacteria (AOB) amoA, nirK, nirS), together with enhanced nosZ abundance [19].
However, it is important to distinguish between the pH of the biochar itself and the resulting soil pH after amendment. Biochar pH reflects the alkalinity of the material, whereas the resulting soil pH depends on biochar alkalinity and buffering capacity, application rate, and the initial soil pH. These two measures are often conflated when linking biochar pH to N2O emissions. It is unclear how modified biochar influences the linkage between N2O emissions and N transformation genes in these acidic soils, and whether a soil pH threshold exists for N2O production and reduction remains unknown. Therefore, we conducted a laboratory incubation experiment using modified biochars derived from SMS in acidic Moso bamboo forest soils and measured N2O emissions together with the abundance of N transformation genes to examine how modified biochar affects N2O production and reduction. We aimed to determine whether a soil pH threshold exists for N2O production and reduction, without presupposing that pH modification would mitigate emissions, and to provide a gene-level basis for biochar management in Moso bamboo forest soils. To our knowledge, this is the first study to compare five SMS-derived biochar variants prepared with different ferric nitrate (Fe(NO3)3) doses applied to acidic Moso bamboo forest soils and to relate the final N2O emission rate to both resulting soil pH and mineral N at the gene level, thereby advancing previous research on modified biochar, soil pH, and N2O emissions.
2. Materials and Methods
2.1. Soil Sampling and Biochar Preparation
Soil samples (0–20 cm) were collected from a Moso bamboo forest at Shuangzhen Forest Farm, Guixi City, Jiangxi Province, China (27°54′18″ N, 117°20′51″ E) in June 2024. The soil is classified as Acrisol, corresponding to a yellow earth, with a clay texture. No fertilization was applied at the sampling site. Twenty soil cores were collected and combined into one composite sample, which was then divided into 28 subsamples for the incubation. The farm covers 2200 ha of Moso bamboo forest. It also has distinctive understorey edible mushroom cultivation and mushroom-picking tourism activities near its resort at an altitude of about 950 m. After removing litter and roots, fresh soil was passed through a 2-mm sieve and stored at 4 °C for less than one month before incubation.
The biochar feedstock was SMS generated from Pleurotus ostreatus cultivation, with a substrate composition of 45% sawdust, 45% straw, and 8% wheat bran (plus 1% sucrose and 1% gypsum). Biochar was produced from SMS at 600 °C for 30 min using a CSJIN-03 carbonisation machine (Zhejiang Dajiang Wood Industry Co., Ltd., Huzhou, China). The biochar was sieved to <2 mm and stored in sealed containers for less than one week before use. For the modification, four independent batches were prepared for each modified biochar. The pristine biochar (B) was used as received, and modified biochars (MB1–MB5) were prepared following the method described previously [16]. Biochar (112 g) was activated with 500 mL of 4 mol/L potassium hydroxide (Xilong Scientific Co., Ltd., Guangzhou, China), and then different volumes of 1 mol/L Fe(NO3)3 solution (624, 599, 590, 581, and 554 mL for MB1–MB5, respectively; Xilong Scientific Co., Ltd., Guangzhou, China) were added, resulting in the formation of a red precipitate. Ultrapure water was added to bring the volume to 2500 mL, and the mixture was activated in an oven at 70 °C for 24 h. After activation, the supernatant was removed, and ultrapure water was added to the remaining precipitate to a final volume of 2500 mL, after which the suspension was allowed to stand for 30 min, and this washing procedure was repeated twice. Finally, the red precipitate was dried at 70 °C and used for further experiments. The yield of the modified biochar was not determined. The initial physicochemical properties of the soil, pristine biochar and modified biochars are presented in Table 1. To characterize the preparation gradient, the properties of MB1–MB5 were regressed against Fe(NO3)3 loading. Across the five modified biochars, pH decreased linearly with increasing Fe(NO3)3 loading (x, volume of 1 mol/L Fe(NO3)3 solution in mL; ŷ = −0.014x + 17.659, R2 = 0.985, p < 0.05, n = 20, five modified biochars × four independent preparation batches), whereas nitrate nitrogen (NO3−-N) increased with loading (ŷ = 93.323x – 40,074.365, R2 = 0.832, p < 0.05, n = 20). The relationship between ammonium nitrogen (NH4+-N) and Fe(NO3)3 loading was weaker (ŷ = 0.047x − 11.566, R2 = 0.213, p = 0.041, n = 20).
Table 1.
Initial pH, ammonium nitrogen (NH4+-N), nitrate nitrogen (NO3−-N), total organic carbon (TOC), and dissolved organic carbon (DOC) of the soil and biochar treatments (B, pristine biochar; MB1–MB5: ferric nitrate-modified biochars) used in the incubation experiment.
2.2. Experimental Design and Measurements
A single-factor incubation experiment was conducted with seven treatments, namely control (soil only), B (pristine biochar), and MB1–MB5 (modified biochars), each with four replicates. Fresh soil equivalent to 30 g oven-dried soil was added to 250 mL conical flasks. Biochar and modified biochars were mixed into the soil at 5% (w/w). The experimental unit was one incubation flask, with four replicate flasks per treatment (28 flasks in total), and flasks were randomly placed in the incubator. The 5% (w/w) dose was calculated as g dry biochar per g oven-dry soil. Moreover, 60% of the water-holding capacity was determined for each mixture. It should be noted that the Fe(NO3)3 modification simultaneously altered several properties of the biochar: it introduced NO3−-N, changed the iron (Fe) content and material composition, and shifted pH. Consequently, MB1–MB5 differ as complete formulations. The preparation gradient therefore cannot by itself separate the independent effects of pH, NO3−-N, Fe, or material composition, and attributing differences among treatments to pH alone would not be justified without additional controls. The soil samples were incubated at 60% water-holding capacity and 25 °C in the dark under aerobic conditions. Gas exchange was maintained using gas-permeable closures. Ultrapure water was supplied daily to maintain constant moisture. Gas sampling was performed on days 5, 12, 19, 26, 33, 45, 60, 70, 80, 90, 104, and 121.
Soil N2O emission rates were determined by monitoring changes in N2O concentrations within the headspace of the incubation flasks. For each assay, 250 mL incubation flasks (headspace volume calculated as the flask volume minus the soil volume) were flushed with air, an initial headspace sample was collected, and the flasks were sealed; a second sample was taken after exactly 2 h. N2O concentration was determined by a gas chromatograph (Agilent 7890B, Santa Clara, CA, USA) equipped with an ECD. The gas chromatograph was calibrated daily with standard N2O gases. Emission rates were calculated from the 2-h concentration difference and expressed as g N2O/g soil/h using the following equation:
Here, F, soil N2O emission rate (g N2O/g soil/h); P, 1.013 × 10⁵ Pa; V, flask headspace volume (m3); c, N2O concentration (ppb); t, gas collection time (h); R, 8.314 Pa m3/mol/K; T, absolute temperature (K); M, N2O molecular mass (g/mol); m, oven-dry mass of incubated soil (g).
Furthermore, cumulative soil N2O emissions were calculated by following equation
Here, E, cumulative soil N2O emissions (g N2O/g soil); F, soil N2O emission rate (g/g soil/h); i, the i-th gas sampling; ti+1 − ti, interval between two gas samplings (day); n, total number of gas samplings. For the first interval (days 0–5), cumulative emission was calculated by assuming a rate of zero at day 0 and the measured rate at day 5, multiplied by the 5-day interval.
Soil pH was measured in a 1:2.5 (w/v) soil-to-water suspension for soil samples before and after incubation. For biochar and modified biochar samples, pH was measured in a 1:10 (w/v) biochar-to-water suspension using a LE438 pH meter (Mettler Toledo, Shanghai, China). NH4+-N and NO3−-N were determined on a discrete analyser (Smartchem 200, AMS Alliance, Rome, Italy). Dissolved organic carbon (DOC) and total organic carbon (TOC) were measured on a multi N/C 3100 analyser (Analytik Jena, Jena, Germany), and are expressed in mg/kg and g/kg, respectively. The initial pH, NH4+-N, NO3−-N, TOC, and DOC of the soil and of each biochar alone were measured before mixing; the corresponding values for the soil-biochar mixtures were not determined.
Soil samples collected at the end of the 121 day incubation were stored at −80 °C and 0.5 g soil were used for microbial DNA extraction with the Fast DNA SPIN Kit (MP Biomedicals, Solon, OH, USA) according to the manufacturer’s instructions. DNA concentration and purity were determined using a NanoDrop spectrophotometer (NanoDrop Technologies, Wilmington, DE, USA), and DNA was diluted with ultrapure water to 10 ng μL−1. qPCR was performed in 20-μL reactions containing 2 μL of DNA template and 18 μL of master mix [10 μL of 2× SYBR® Premix Ex Taq (Takara Bio Inc., Kusatsu, Shiga, Japan), 0.4 μL of ROX reference dye (50×; Takara Bio Inc., Kusatsu, Shiga, Japan), 0.4 μL each of forward and reverse primer, and 6.8 μL of ultrapure water]. The primers for ammonia-oxidizing archaea (AOA) amoA, AOB-amoA, nirK, nirS, and nosZ clade I were Arch-amoAF/Arch-amoAR, amoA1F/amoA2R, nirKF1aCu/nirKR3C, nirSCd3aF/nirSR3cd, and nosZ-F/nosZ-R, respectively. The amplification programs for AOA amoA, AOB-amoA, nirK, nirS, and nosZ were as follows: AOA amoA: 95 °C for 10 min, followed by 35 cycles of 95 °C for 30 s, 65 °C for 30 s, and 72 °C for 30 s; AOB amoA: 95 °C for 10 min, followed by 35 cycles of 95 °C for 30 s, 52 °C for 30 s, and 72 °C for 30 s; nirK: 95 °C for 10 min, followed by 35 cycles of 95 °C for 15 s, 58 °C for 30 s, and 72 °C for 30 s; nirS: 95 °C for 10 min, followed by 35 cycles of 95 °C for 15 s, 58 °C for 30 s, and 72 °C for 30 s; nosZ: 95 °C for 10 min, followed by 35 cycles of 95 °C for 15 s, 60 °C for 30 s, and 72 °C for 30 s. Target gene copy numbers were determined by constructing standard curves for the functional genes, and gene abundances were expressed as copies g−1 dry soil.
2.3. Statistical Analyses
Data were analysed using one-way ANOVA or non-parametric Kruskal–Wallis tests depending on normality and homogeneity of variance. Multiple comparisons were performed using Tukey’s HSD test or Dunn’s test. Pearson correlation analysis was used to examine relationships between N2O emission rates and soil variables.
The mixed-effects model was fitted as:
where Yijk is the N2O emission rate for flask k at time i under treatment j, μ is the overall mean, τi is the fixed effect of time (i = 1–12), βj is the fixed effect of treatment (j = 1–7), (τβ) ij is their interaction, bk ~ N (0, σ2b) is the random intercept for flask k (k = 1–28), and εijk ~ N(0, σ2) is the residual error. The model was fitted using the nlme package in R. Type III Wald χ2 tests were obtained with the Anova function from the car package; the numerator degrees of freedom were 11 for time, 6 for treatment, and 66 for their interaction.
Yijk = μ + τi + βj + (τβ) ij + bk + εijk
For the quadratic fits, a second-degree polynomial was chosen because the relationships were non-monotonic and a quadratic term allowed the position of the maximum to be estimated. Quadratic models were compared with linear models by F test. The 95% confidence intervals of the vertices were obtained by bootstrap (2000 resamples), and sensitivity was assessed by refitting after excluding each MB variant in turn. Residual diagnostics (residuals vs fitted, Q-Q, Scale-Location, and Cook’s distance) showed no major deviation from normality or homoscedasticity.
All statistical analyses were performed in R (version 4.6.2; R Foundation for Statistical Computing, Vienna, Austria) with a significance level of p < 0.05.
3. Results
3.1. N2O Emission Dynamics and Emissions
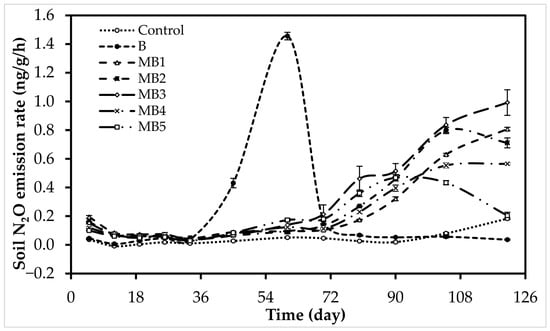
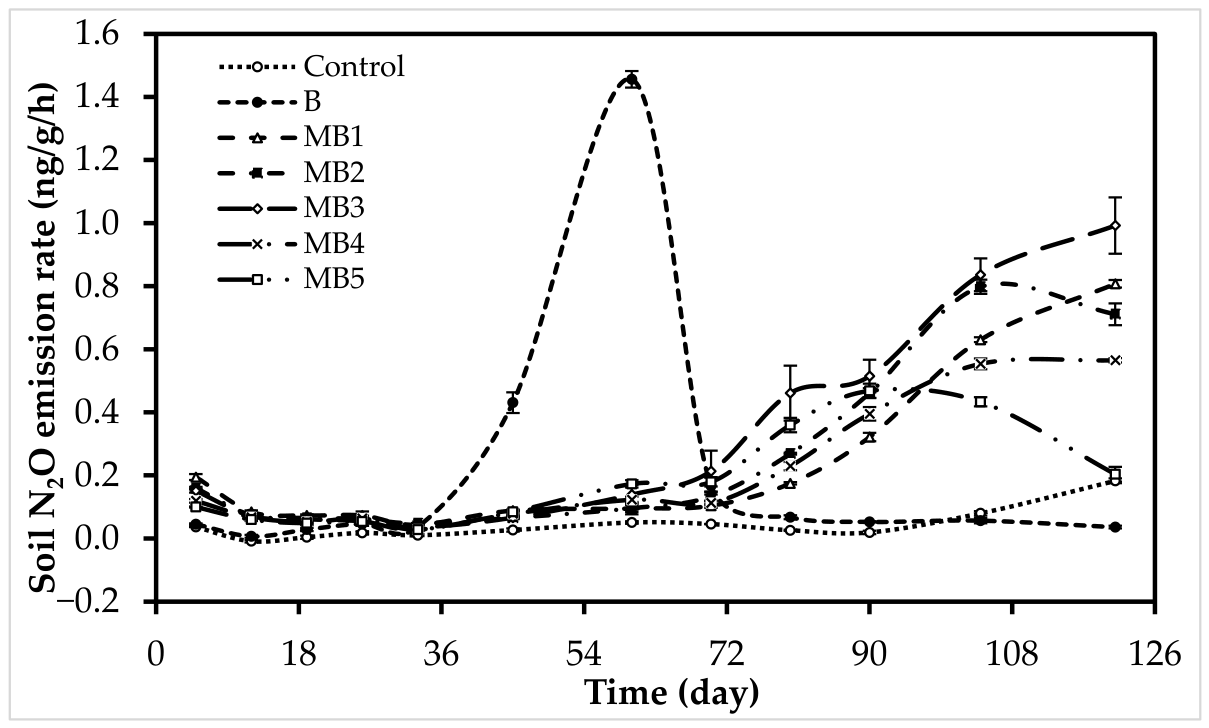
The temporal dynamics of N2O emission rates differed among treatments (Figure 1). Emission rates remained low in the control throughout the 121-day incubation, whereas B showed a sharp peak around day 60. The MB treatments exhibited more gradual and prolonged emissions, with MB5 peaking earlier and at a lower rate. Time, treatment, and their interaction significantly affected N2O emission rates (Time: χ2 = 4292.39, df = 11, p < 0.05; Treatment: χ2 = 48.21, df = 6, p < 0.05; Time × Treatment: χ2 = 7024.36, df = 66, p < 0.05).
Figure 1.
Dynamics of soil nitrous oxide (N2O) emission rates during the 121-day incubation under Control (soil only), B (pristine biochar), and MB1–MB5 (ferric nitrate-modified biochars). Values are means ± SE (n = 4). Lines connecting the points are linear interpolations between sampling dates and do not represent continuous measurements. Emission rates are expressed as ng N2O/g soil/h.
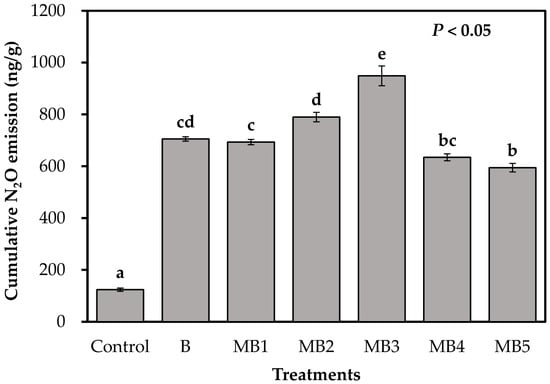
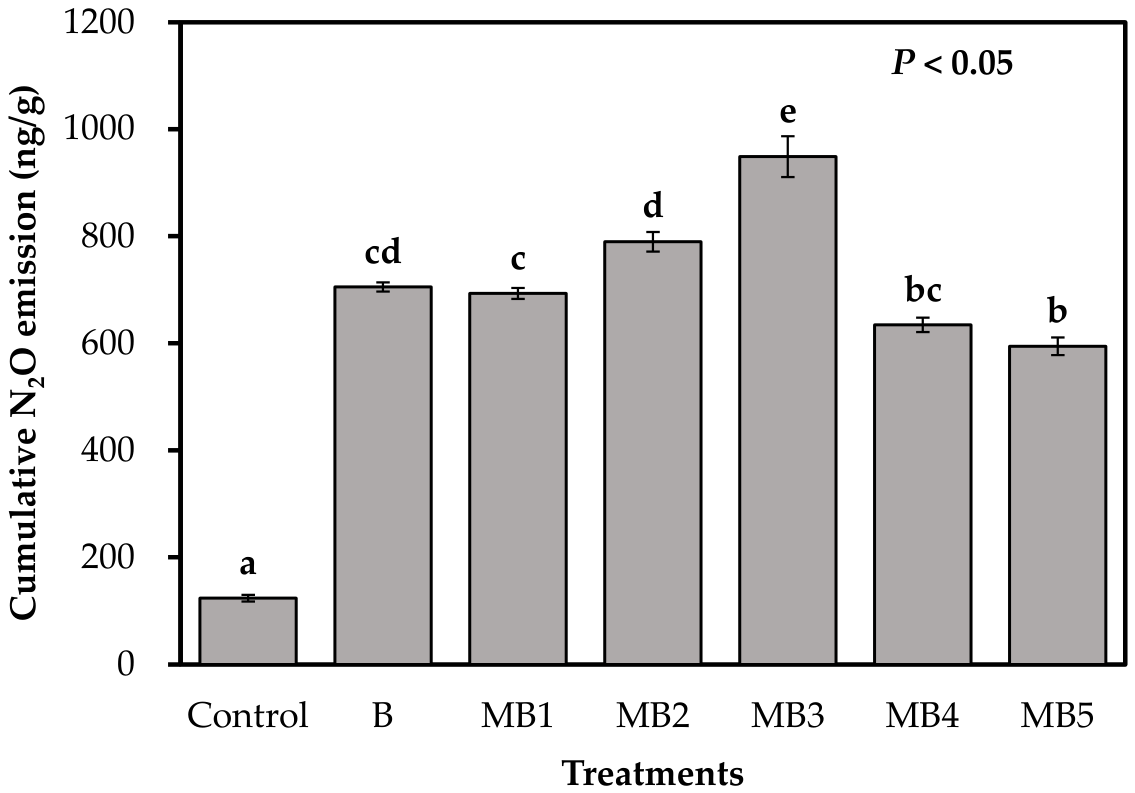
Cumulative N2O emissions over the 121-day incubation differed significantly among treatments (p < 0.05; Figure 2). The control soil emitted the least N2O, whereas biochar and modified addition increased cumulative emissions by 4.8- to 7.7-fold during this period, peaking in MB3 and declining to the lowest biochar value in MB5. MB3 and MB5 differed significantly from B, whereas the other MB treatments did not. Accordingly, N2O followed the order MB (n = 20; 732.12 ± 30.32 ng/g) = B (705.29 ± 8.63 ng/g) > control (123.86 ± 6.20 ng/g) (p < 0.05).
Figure 2.
Cumulative nitrous oxide (N2O) emissions over the 121 day incubation under Control (soil only), B (pristine biochar), and MB1–MB5 (ferric nitrate-modified biochars). Values are means ± SE (n = 4). Different lowercase letters above bars indicate significant differences among treatments (p < 0.05).
3.2. Post-Incubation Soil pH and Inorganic Nitrogen
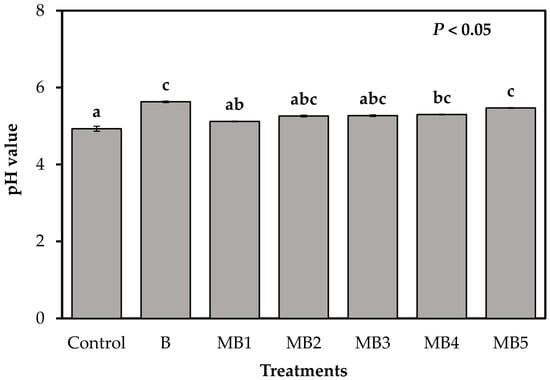
Soil pH differed significantly among treatments (p < 0.05; Figure 3). The control soil remained acidic (pH 4.93), whereas the pristine biochar (B) raised soil pH to 5.63, the highest value among all treatments. Among the modified biochars, soil pH increased progressively from MB1 (5.12) to MB5 (5.47). Overall, all biochar treatments raised soil pH above the control level, with B (5.63 ± 0.02) showing a stronger alkalinizing effect than the MB treatments (n = 20, 5.29 ± 0.03) (p < 0.05).
Figure 3.
Soil pH at the end of incubation under Control (soil only), B (pristine biochar), and MB1–MB5 (ferric nitrate-modified biochars). Values are means ± SE (n = 4). Different lowercase letters above bars indicate significant differences among treatments (p < 0.05).
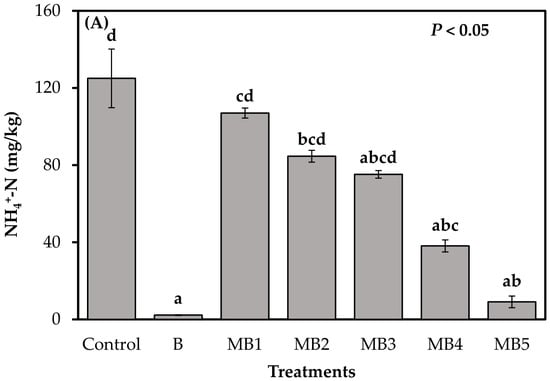
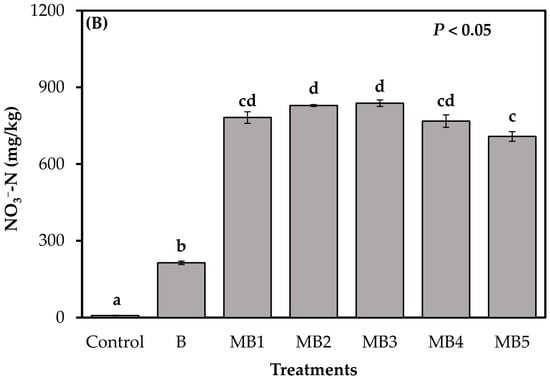
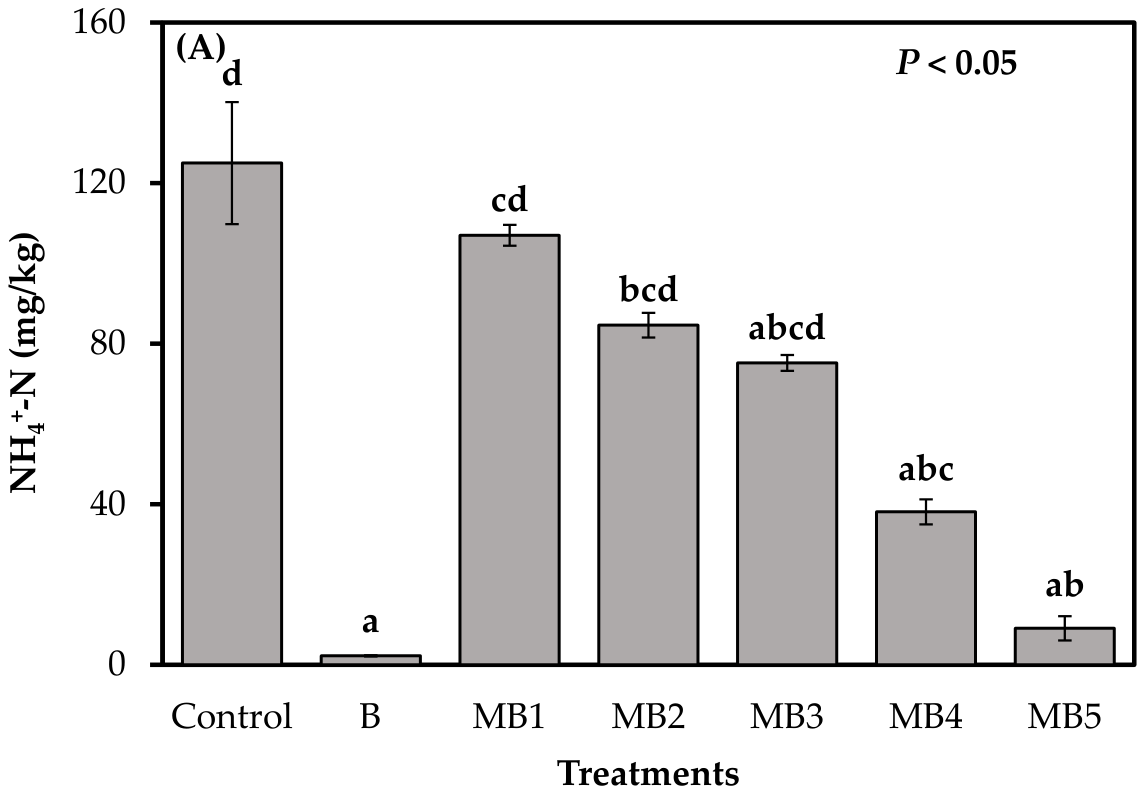
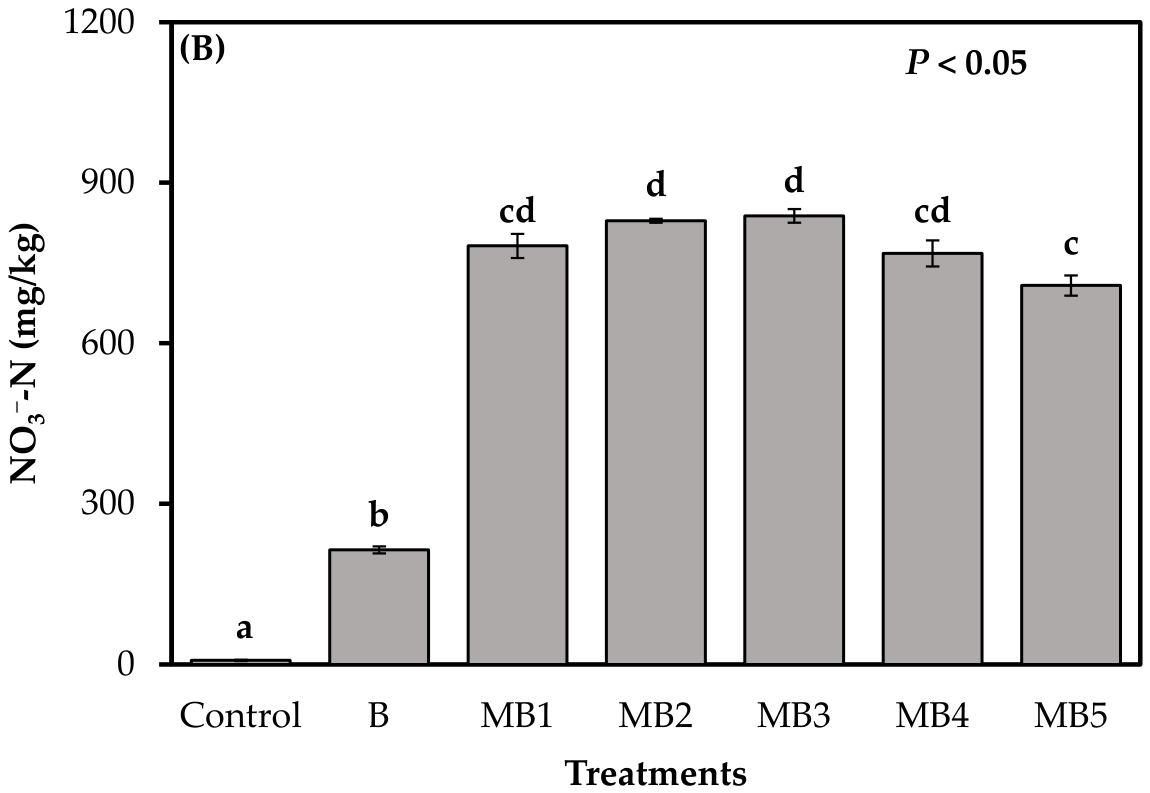
Soil NH4+-N differed significantly among treatments (p < 0.05; Figure 4A). The control soil had the highest NH4+-N concentration, whereas B had the lowest. Within the MB series, NH4+-N declined progressively from MB1 to MB5. Overall, NH4+-N followed the order control (125.22 ± 15.20 mg/kg) > MB (n = 20; 62.84 ± 8.09 mg/kg) > B (2.22 ± 0.17 mg/kg) (p < 0.05). Soil NO3−-N showed the opposite pattern (p < 0.05; Figure 4B). The control soil had the lowest NO3−-N concentration, B was intermediate, and the MB treatments (MB1–MB5) were the highest (Figure 4B). Within the MB series, NO3−-N showed no consistent monotonic trend across the MB gradient. Accordingly, NO3−-N followed the order MB (n = 20; 784.96 ± 12.91 mg/kg) > B (213.61 ± 6.51 mg/kg) > control (7.45 ± 1.24 mg/kg) (p < 0.05).
Figure 4.
Soil ammonium nitrogen (NH4+-N) (A) and nitrate nitrogen (NO3−-N) (B) concentrations at the end of incubation under Control (soil only), B (pristine biochar), and MB1–MB5 (ferric nitrate-modified biochars). Values are means ± SE (n = 4). Different lowercase letters above bars indicate significant differences among treatments (p < 0.05).
3.3. Abundance of N-Cycling Functional Genes and the (nirK + nirS)/nosZ Ratio
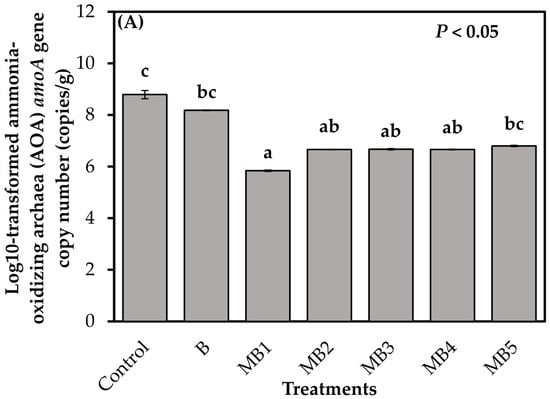
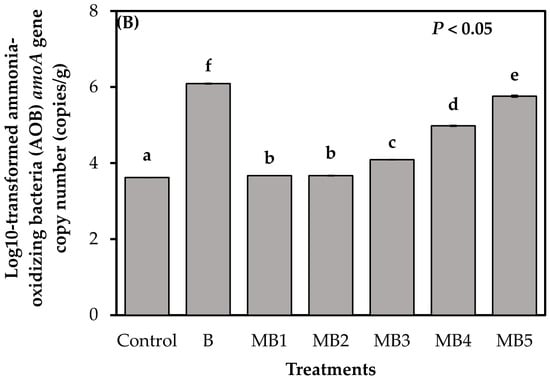
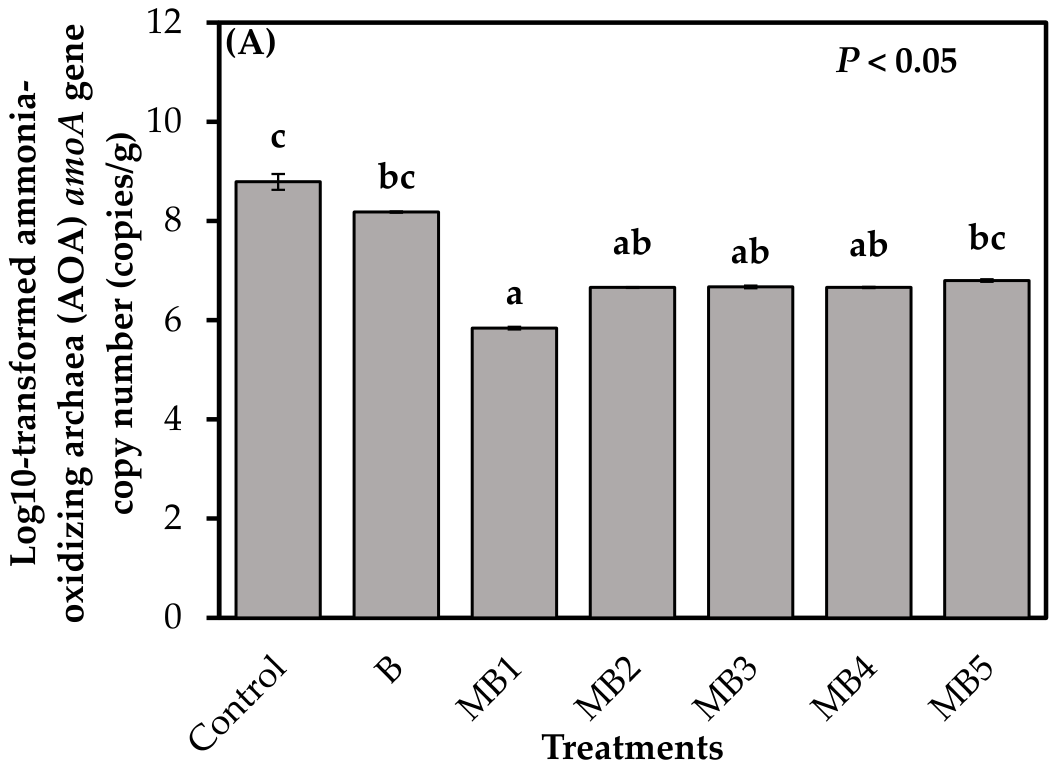
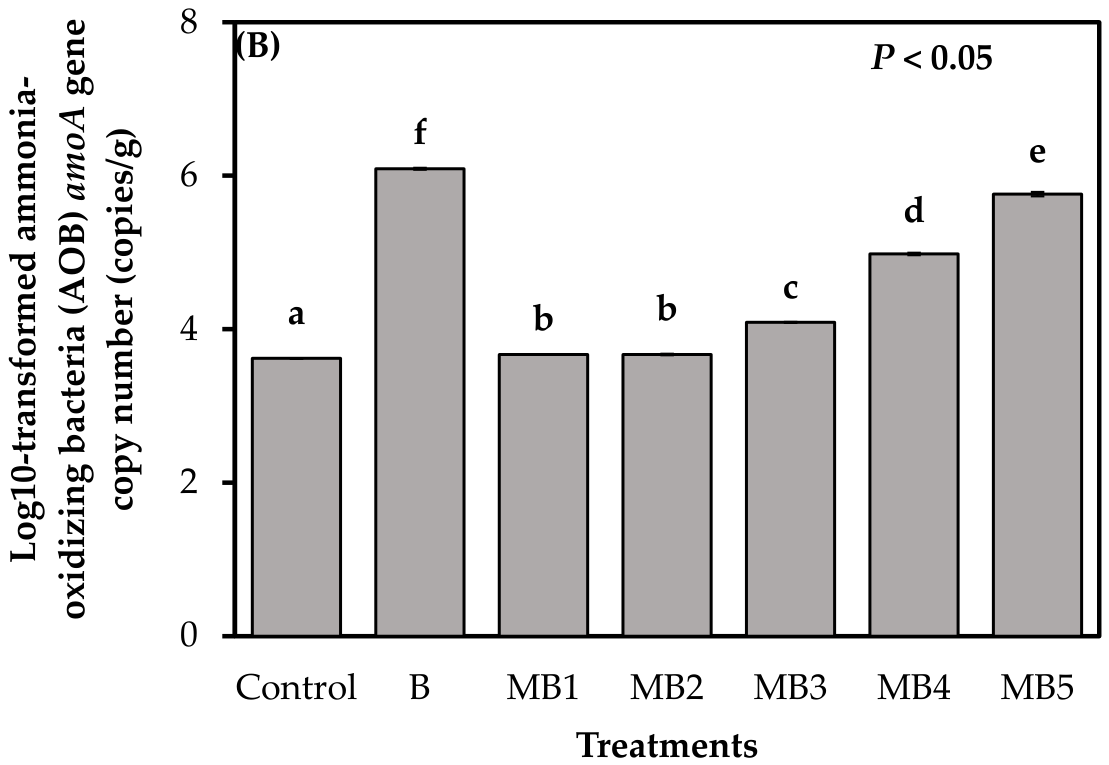
AOA amoA abundance differed significantly among treatments (p < 0.05; Figure 5A). AOA amoA abundance was higher in the control (8.79 ± 0.15 log10 copies/g) and B (8.18 ± 0.01 log10 copies/g) than in the MB treatments (n = 20; 6.52 ± 0.08 log10 copies/g) (p < 0.05). In contrast, AOB amoA abundance was highest in B and increased progressively from MB1 to MB5 within the MB treatments (Figure 5B).
Figure 5.
Abundance of ammonia-oxidizing archaea (AOA) amoA (A) and ammonia-oxidizing bacteria (AOB) amoA (B) gene copies at the end of incubation under Control (soil only), B (pristine biochar), and MB1–MB5 (ferric nitrate-modified biochars). Values are means ± SE (n = 4). Different lowercase letters above bars indicate significant differences among treatments (p < 0.05).
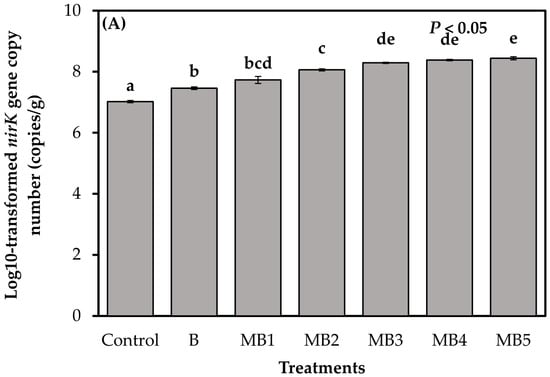
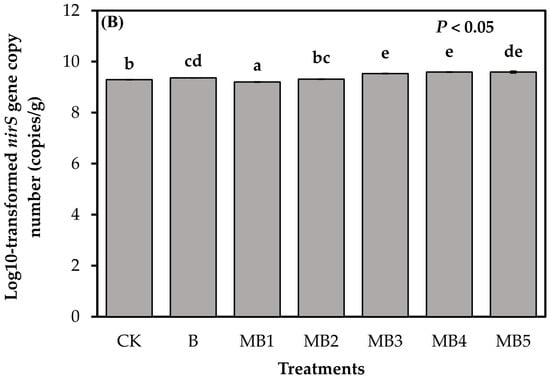
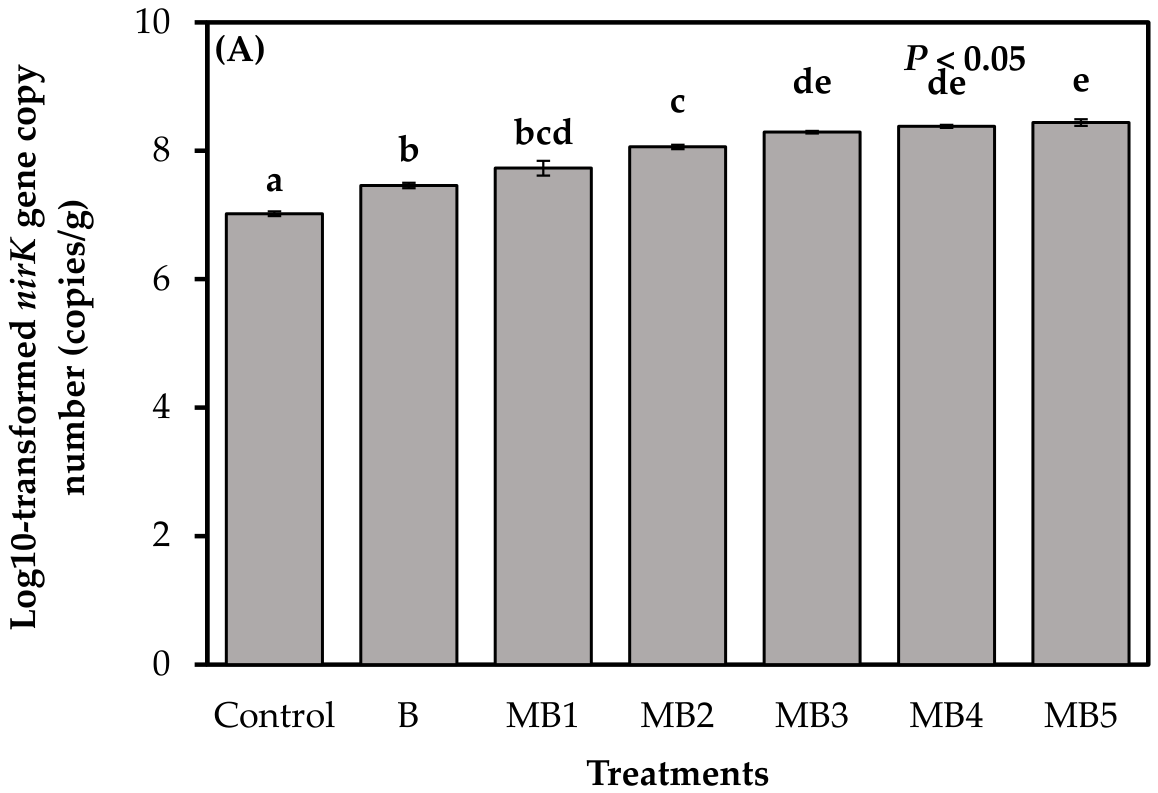
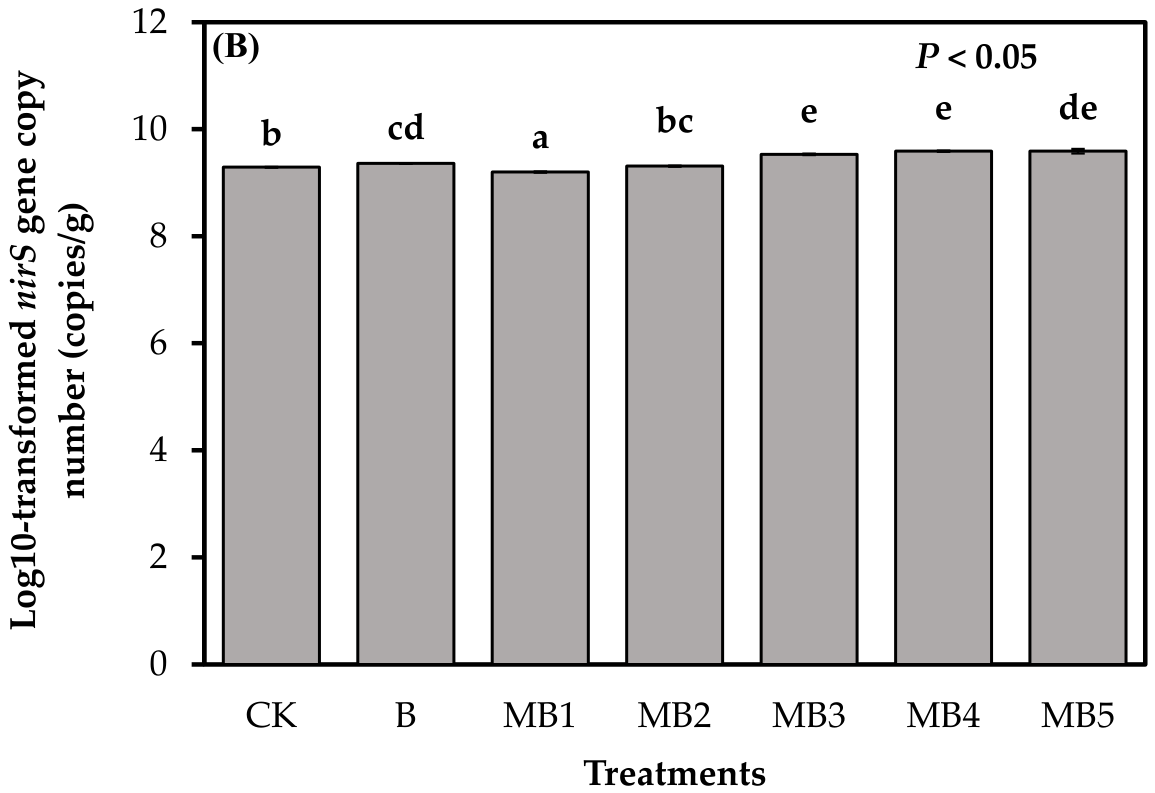
Both nirK and nirS abundances were higher in the biochar treatments than in the control (Figure 6). Within the MB series, both genes increased progressively from MB1 to MB5, with nirS showing a stronger response to biochar addition than nirK.
Figure 6.
Abundance of nirK (A) and nirS (B) gene copies at the end of incubation under Control (soil only), B (pristine biochar), and MB1–MB5 (ferric nitrate-modified biochars). Values are means ± SE (n = 4). Different lowercase letters above bars indicate significant differences among treatments (p < 0.05).
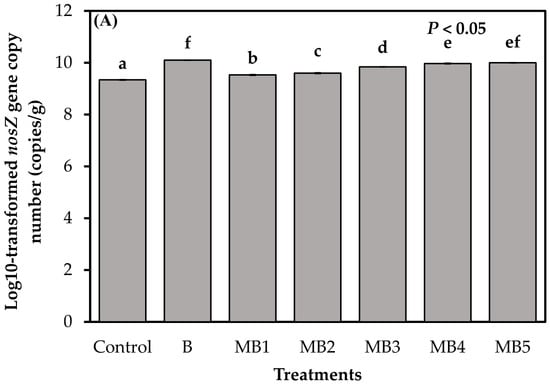
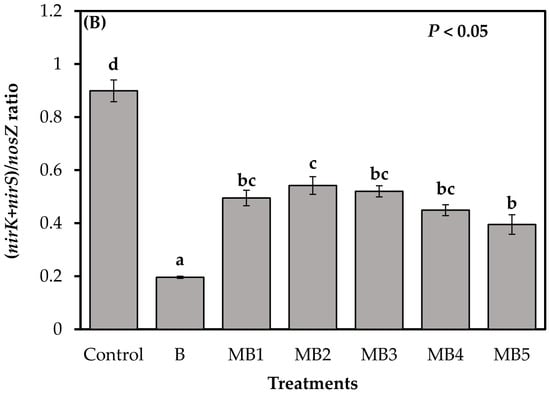
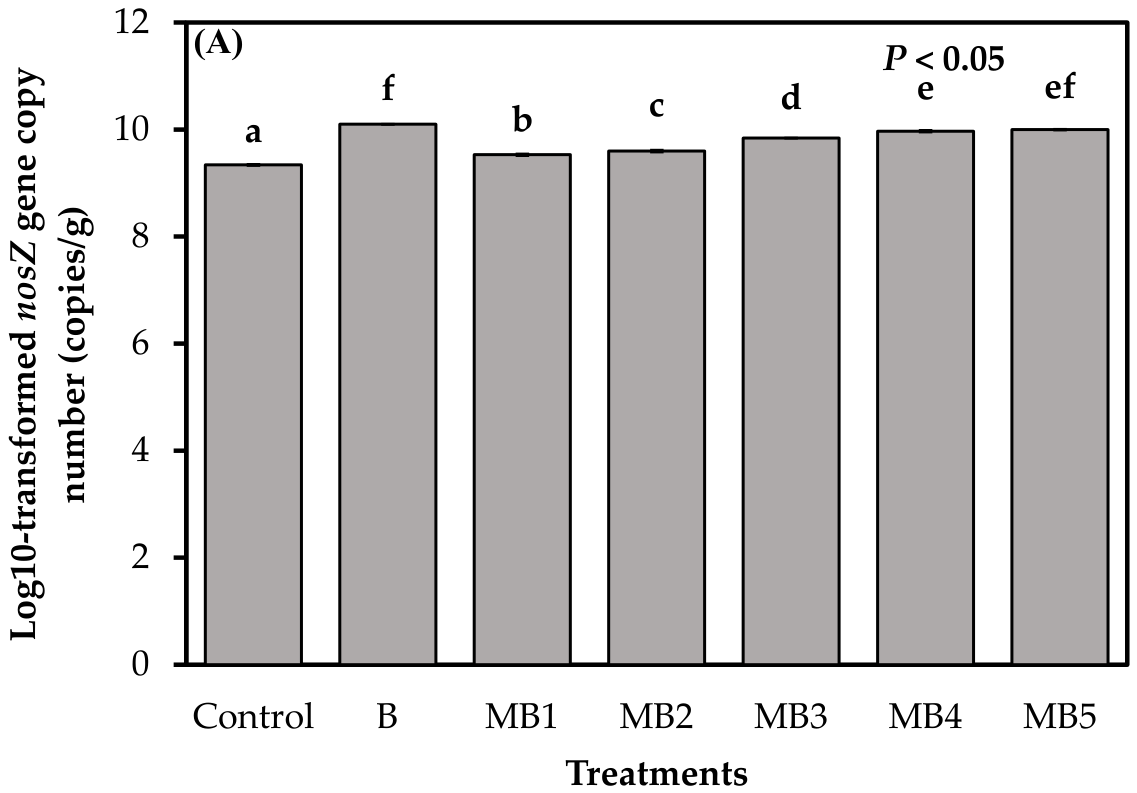
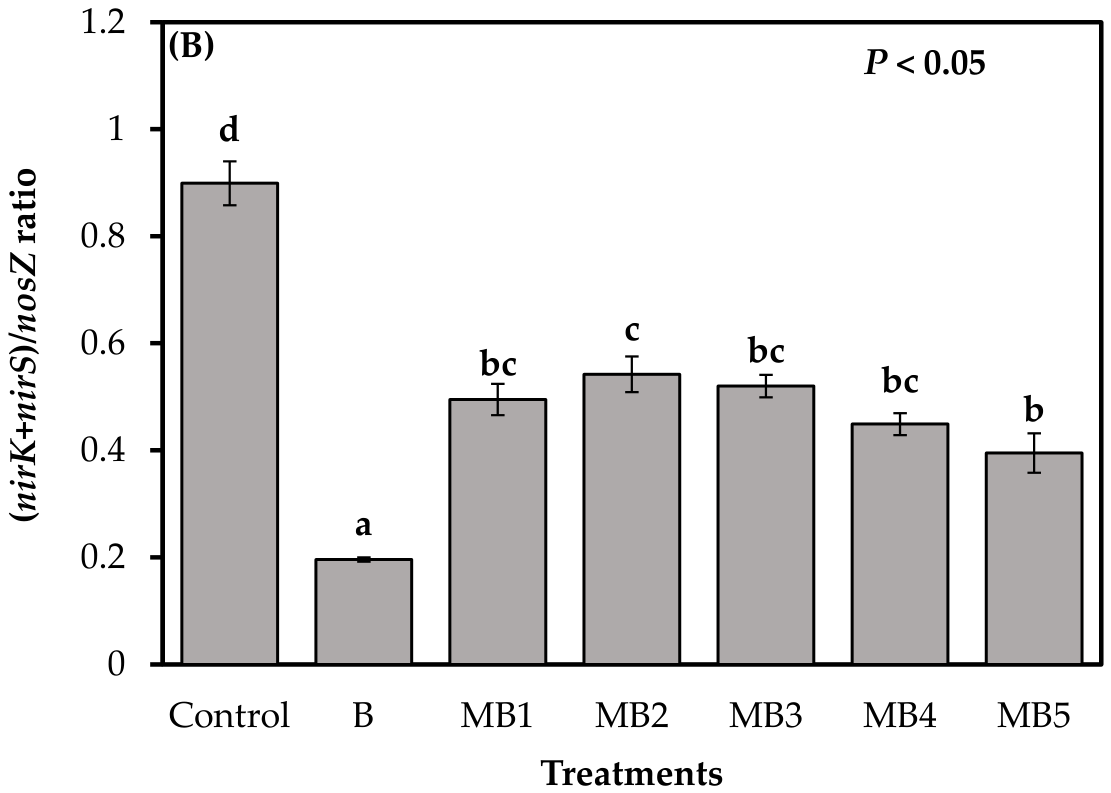
NosZ abundance was highest in B and MB5, and lowest in the control (Figure 7A). The (nirK + nirS)/nosZ ratio was highest in the control, lowest in B, and intermediate in the MB treatments (Figure 7B).
Figure 7.
Abundance of nosZ gene copies (A) and the (nirK + nirS)/nosZ ratio (B) at the end of incubation under Control (soil only), B (pristine biochar), and MB1–MB5 (ferric nitrate-modified biochars) Values are means ± SE (n = 4). Different lowercase letters above bars indicate significant differences among treatments (p < 0.05).
3.4. Quadratic Relationships Within the MB Treatments
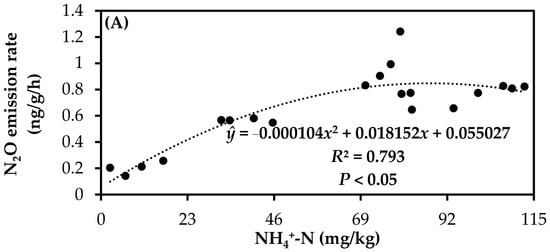
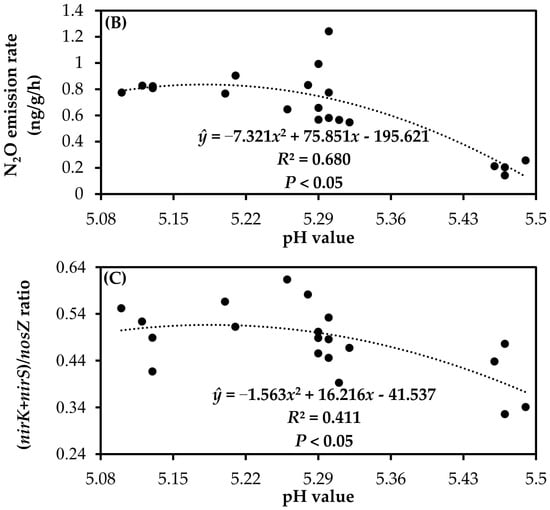
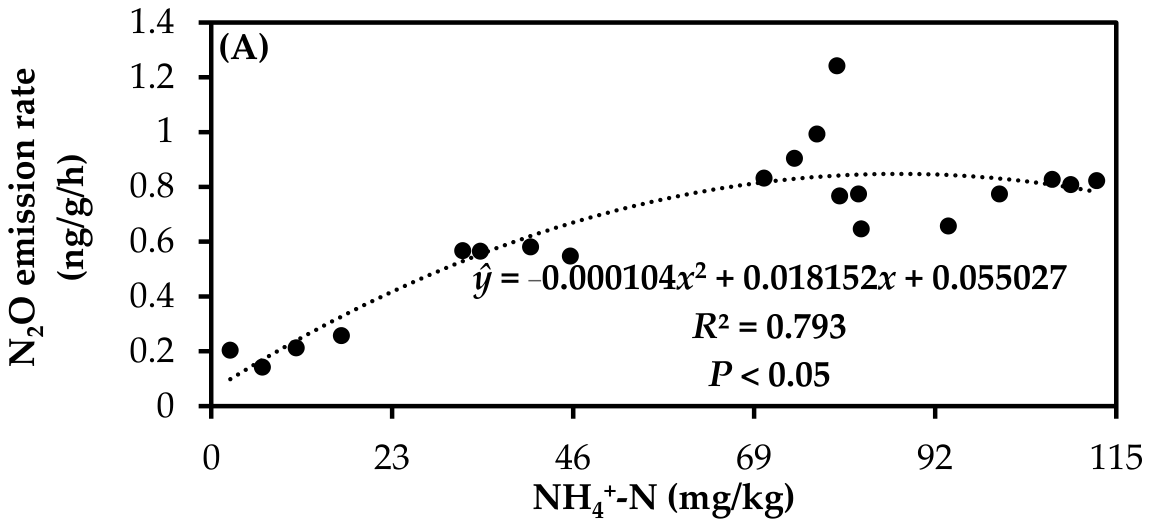
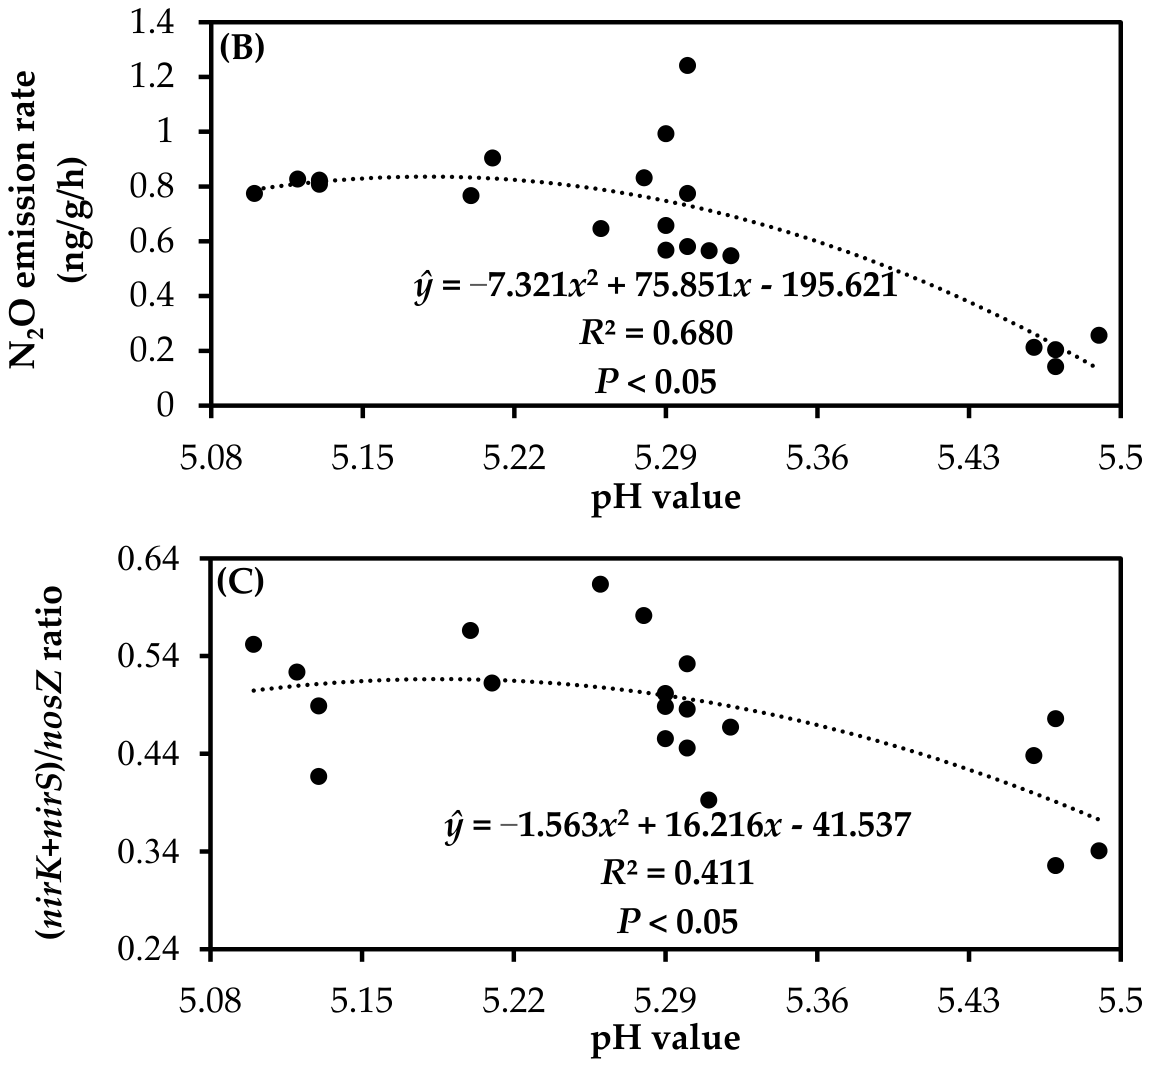
Within the MB treatments, N2O emission rate was nonlinearly related to both NH4+-N (R2 = 0.793, p < 0.05) and pH (R2 = 0.680, p < 0.05); quadratic terms significantly improved the fit over linear models (p = 0.003 and p = 0.010), with vertices at 87.3 mg/kg NH4+-N (95% CI 76.4–103.6) and pH 5.18 (95% CI 5.03–5.23), respectively (Figure 8A,B). Excluding each MB variant in turn shifted the vertex between 5.06 and 5.22 for N2O rate ~ pH, and between 81.3 and 104.6 mg/kg for N2O rate ~ NH4+-N. The (nirK + nirS)/nosZ ratio decreased with pH (R2 = 0.411, p = 0.011 for the quadratic fit); however, the quadratic term did not significantly improve the fit over a linear model (p = 0.103), the vertex CI (4.53–5.76) spanned almost the entire observed pH range, and excluding MB1 shifted the vertex to 5.89, outside the observed range (Figure 8C).
Figure 8.
Quadratic relationships of (A) nitrous oxide (N2O) emission rate with ammonium nitrogen (NH4+-N) concentration, (B) N2O emission rate with soil pH, and (C) the (nirK + nirS)/nosZ ratio with soil pH across the MB treatments (MB1–MB5) at the end of incubation. Dotted lines indicate fitted quadratic regressions (n = 20).
3.5. Correlation Analysis
Soil N2O emission rate was correlated with several soil variables, and the strength of these correlations differed between the all-treatment dataset and the MB-only dataset (Table 2). Across all treatments, N2O emission rate was positively correlated with NH4+-N, NO3−-N, and nirK, and negatively correlated with AOA amoA and AOB amoA, whereas its correlations with pH, nirS, nosZ, and the (nirK + nirS)/nosZ ratio were not significant. Within the MB treatments, N2O emission rate was negatively correlated with pH, AOB amoA, nirK, and nosZ, and positively correlated with NH4+-N, NO3−-N, and the (nirK + nirS)/nosZ ratio, whereas its correlations with AOA amoA and nirS were not significant.
Table 2.
Pearson correlation coefficients between nitrous oxide (N2O) emission rate and soil pH, ammonium nitrogen (NH4+-N), nitrate nitrogen (NO3−-N), and the abundance of ammonia-oxidizing archaea (AOA) amoA, ammonia-oxidizing bacteria (AOB) amoA, nirK, nirS, nosZ, and the (nirK + nirS)/nosZ ratio under all treatments and under modified biochar (MB) treatments only.
4. Discussion
4.1. Biochar pH and Soil pH in Acidic Soils
Biochar addition raised soil pH above the control (Figure 3), consistently with previous reports in acidic soils [15,16]. However, the magnitude of this increase differed among biochars: B produced the strongest alkalinizing effect (pH 5.63), whereas the modified biochars (MB1–MB5) raised soil pH to a smaller extent (5.12–5.47; Figure 3). This contrast is notable because the pH of the modified biochars themselves (9.03–9.98) was comparable to or even higher than that of B (9.36; Table 1), indicating that the alkalinizing effect of biochar in soil is not determined by its own pH alone.
This decoupling between biochar pH and soil pH has also been documented in iron-modified systems. A previous study reported that Fe(NO3)3-modified biochars had higher pH and higher dissolved NO3−-N concentrations than pristine biochars [20], which aligns with the much higher NO3−-N content of MB relative to B in the present study (Table 1). However, in our materials the pH of B (9.36) was higher than that of MB1 (9.03) and MB2 (9.32). That study did not directly compare the magnitude of soil pH increase between pristine and modified biochars. In contrast, other research directly observed that iron modification weakened the effect of biochar on soil pH and attributed this weakening to a reduction in gum-like substances, hydrophobic carbon, and aromatic compounds within soil dissolved organic carbon [21]. This result is consistent with our observation that B was a stronger alkalinizer than MB, and it suggests that the liming effect of biochar depends not only on its own pH but also on the composition and reactivity of its alkaline functional groups and dissolved organic matter. Moreover, comparisons between the pH of the materials and their ability to neutralize soil acidity should take buffer capacity into account, because a material with a higher pH does not necessarily have a greater acid-neutralizing capacity.
The liming potential of biochar is primarily derived from its carbonate and (hydro) oxide minerals in the ash fraction, as well as exchangeable base cations that neutralize soil hydrogen ions (H+) and aluminum ions (Al3+) [22]. Iron modification can weaken this potential through two complementary pathways. First, ferric ion (Fe3+) introduced during Fe(NO3)3 modification can hydrolyze in soil and release H+, partially offsetting the alkalinity supplied by the biochar matrix; however, Fe concentration was not determined in this study, so this mechanism remains a possible explanation rather than a quantified contribution. Second, modification alters the dissolved organic carbon composition of the biochar, reducing the gum-like and aromatic fractions that participate in H+ consumption, thereby lowering the “effective alkalinity” per unit mass of biochar. In addition, the large amount of NO3−-N introduced by Fe(NO3)3 modification can enter several N-transformation pathways: NO3- is a product of nitrification but also a substrate for denitrification and microbial assimilation, so changes in NO3− concentration reflect the net balance of these processes rather than nitrification alone. Because these processes differ in their net proton balance, the N transformations associated with the added NO3- may superimpose an acidification or alkalinization signal on the soil pH response [23]. However, our data do not allow this signal to be partitioned among individual path-ways. The weaker alkalinizing effect of MB is therefore best interpreted as the combined outcome of a reduced effective alkalinity of the modified biochar and an acidifying pressure associated with Fe and N inputs, rather than as a direct function of biochar pH.
4.2. Effects of Biochar on Availability of Nitrogen Substrates and N2O Emissions
Biochar addition altered the availability of N substrates, thereby affecting N2O emissions. In this study, biochar addition reduced the NH4+-N concentration (Figure 4A). This may be linked to biochar accelerating nitrification and inhibiting the effect of high NH4+ content on nitrite (NO2-) transforming to NO3-, thereby suppressing N2O formation [24]. This biochar-driven shift in the soil N supply pattern is consistent with recent evidence that biochar-based amendments can substantially modify soil N transformation and availability [25]. Additionally, biochar may have directly adsorbed NH4+-N, thus decreasing NH4+-N availability and subsequently N availability for formation of N2O by nitrification [26]. This is consistent with earlier studies reporting that biochar amendments decrease NH4+-N availability and subsequently N2O emissions [27,28,29]. The results showed that biochar application, particularly MB, significantly enhanced the soil NO3−-N concentration (Figure 4B). This increase was most plausibly linked to the introduction of NO3−-N by Fe(NO3)3 modification, which can leave residual nitrate as soluble salts and as nitrate adsorbed or occluded within Fe oxides and biochar pores. This nitrate may be gradually released over time rather than released immediately, which may have provided a sustained supply of electron acceptor, potentially contributing to the later increase in N2O emissions observed after 100 days in the modified treatments. This added NO3−-N is a direct substrate for denitrification and may therefore have sustained N2O production, potentially offsetting part of the pH effect. However, MB1, which had the highest NO3−-N content but the lowest pH among the MB treatments (Table 1), did not show the highest N2O emission; additionally, N2O was nonlinearly related to NH4+-N (Figure 8A), indicating that substrate supply and pH acted jointly rather than independently. Because pH, NO3−-N, NH4+-N, and Fe varied simultaneously in this study, the observed effects cannot be attributed to pH alone.
The lower emission at MB5 (Figure 2) may be associated with enhanced N2O reduction at higher pH, as biochar alkalinity can suppress N2O production and promote N2 formation [14]. This decrease in N2O emissions may also be linked to the large gap between biochar pH and acidic-soil pH, which increased soil pH. Previous study also reported that biochar application significantly reduced N2O emissions in acidic soils [30]. The potential mechanism of biochar-mediated reduction in N2O emissions may have included: (i) a decrease in substrate (NH4+-N) availability [31], (ii) an increase in soil pH and nosZ abundance involved in N2O reduction [32]. These results indicate that the timing, rather than simply the magnitude, of N2O production differed between the pristine and ferric nitrate-modified biochars.
The temporal patterns differed between B and the MB treatments (Figure 1). B showed a sharp peak at around day 60, whereas the MB treatments increased more gradually, and in MB1–MB4 emissions were still declining at the end of the 121-day incubation. A possible explanation for the early peak in B is the release of labile carbon from pristine biochar, which has been shown to stimulate microbial activity and N2O production shortly after application [33]; in contrast, part of the labile carbon fraction in the modified biochars may have been altered or lost during preparation, which could reduce such an early labile carbon release. The later and more sustained increase in the MB treatments may be associated with the continuous supply of NO3−-N introduced by Fe(NO3)3 modification, as these biochars carry additional nitrate substrates that sustain denitrification over a longer period [20], and with possible gradual effects of Fe on the microbial community, since Fe loading can alter electron-shuttling capacity and the balance between N2O production and reduction [34]. These mechanisms are proposed as possible explanations based on previous reports rather than measured processes, and the 121-day observation period limits our ability to determine whether emissions in MB1–MB4 would have continued to decline with a longer incubation. A longer incubation (e.g., 150–200 days) would be needed to establish whether emissions in MB1–MB4 eventually return to baseline, and this is recommended for future work.
4.3. pH Threshold and the (nirK + nirS)/nosZ Balance
Within the MB treatments, both N2O emission rate and the (nirK + nirS)/nosZ ratio were nonlinearly related to soil pH, with fitted maxima at pH 5.18 and pH 5.19, respectively (Figure 8B,C). This co-occurrence of peak N2O emission and peak (nirK + nirS)/nosZ ratio at a similar pH is consistent with the view that the balance between N2O-producing and N2O-consuming denitrifiers, rather than the absolute abundance of either group, governs net N2O emissions. A global synthesis based on 5438 paired flux observations and a meta-analysis of denitrification genes showed that N2O emission factors peak at pH 6.0, with the (nirK + nirS)/nosZ ratio reaching its maximum at pH 6.05 [6]. Our peak at pH 5.18 was lower than this global optimum, likely reflecting the acid-adapted microbial community in Moso bamboo forest soil. In addition, the Fe(NO3)3 modification introduced large amounts of NO3−-N, which may have sustained denitrification at lower pH than would occur under native soil conditions, although the relative contribution of Fe itself could not be quantified. The hump shape itself, however, agrees with the global pattern: N2O emissions rose from MB1 (pH 5.12) to MB3 (pH 5.27) and then declined at MB5 (pH 5.47), where cumulative N2O was 37.35% lower than in MB3 (Figure 2).
A comparable pH dependence has been observed for iron-modified biochars. A previous study reported that Fe(NO3)3-modified biochars increased cumulative N2O emissions relative to pristine biochars, an effect attributed to the mineral N introduced by the modification [20]. This is consistent with our finding that some individual MB treatments (e.g., MB3) showed higher cumulative N2O emissions than B (Figure 2). However, that study did not resolve the internal pH gradient within their modified biochars [20]. Our data show that, once the modification is held constant, increasing the pH of the modified biochar from 5.27 (MB3) to 5.47 (MB5) reduced, rather than increased N2O emissions (Figure 2 and Figure 3). This suggests that the net effect of iron modification is the sum of two opposing components: an N-substrate-driven stimulation that operates across all MB treatments, and a pH-driven shift in the (nirK + nirS)/nosZ balance that becomes evident only when the N input is comparable.
The peak in the (nirK + nirS)/nosZ ratio at low pH (Figure 8C) may reflect an asymmetric constraint on the two sides of denitrification. We quantified the abundance of nosZ, and did not directly assess the synthesis or functional maturation of the N2O reductase enzyme. Accordingly, the gene ratio is interpreted here as an index of community-level genetic potential rather than of enzyme activity. Previous research has proposed that low pH can impair the post-transcriptional maturation of the nosZ apo-protein, meaning functional N2O reductase may not be assembled even when nosZ is transcribed [35]. For example, cells from neutral soils failed to produce functional N2O reductase at pH ≤ 6.1 despite significant nosZ transcription. In the present study, nosZ abundance increased with modified biochar pH, reaching the highest value in MB5 (Figure 7A). This suggests that the higher pH of modified biochar alleviated soil acidity and created a more favorable microenvironment for nosZ-harboring denitrifiers, thereby increasing nosZ abundance and potentially enhancing N2O reduction to N2 [36]. In contrast, nirK- and nirS-type denitrifiers may remain active over a wider acidic range, and a global meta-analysis of biochar effects on N-cycling genes reported that biochar addition increased nirK, nirS, and nosZ abundances by 32.0%, 14.6%, and 17.0%, respectively, with soil pH identified as a key modifier [37]. Indeed, nirK and nirS were positively correlated with pH (Table 2, Figure 6). If this post-transcriptional impairment of N2O reductase occurs in our soils under low pH conditions, it could explain why the measured increase in the (nirK + nirS)/nosZ gene abundance ratio was associated with higher net N2O emissions. In this scenario, the genetic potential for production is decoupled from the functional capacity for reduction. Conversely, at pH ≈ 5.47 (MB5), if nosZ maturation is less impaired, a larger fraction of the N2O produced could be reduced to N2 before escaping the soil. Future studies should incorporate enzymatic activity assays or proteomic analysis to verify this proposed mechanism.
The AOA and AOB responses provide independent support for a pH-driven microbial reorganization. AOA amoA abundance was highest in the control and in B and lower across the MB treatments, whereas AOB amoA was highest in B and increased progressively from MB1 to MB5 (Figure 5). This pattern aligns with the well-documented niche segregation between the two groups: AOA dominate ammonia oxidation in acidic soils, whereas AOB become increasingly competitive as pH rises [38,39]. The underlying mechanism is largely a difference in substrate affinity: AOA possess ammonia monooxygenase with a much higher affinity for ammonia (NH3) than AOB, allowing them to remain active at the low NH3 availability that prevails under acidic conditions [40]. The shift from AOA-dominated (control, B) to increasingly AOB-dominated (MB5) communities across the pH gradient from 4.93 to 5.47 is therefore an expected ecological consequence of ameliorating an already acidic soil, and it converges with the denitrifier-based interpretation: the narrow pH window created by the MB treatments (approximately 5.1–5.5) sits at a transition zone where the balance between N2O production and consumption is maximally sensitive to small pH changes. A factorial design with nitrate-only and pH-only controls would be needed to isolate the individual effects of pH and NO3−-N, and this is recommended for future work.
5. Conclusions
In acidic Moso bamboo forest soil, biochar addition increased cumulative N2O emissions 4.8- to 7.7-fold relative to the unamended control. Considered together, the five MB treatments did not differ significantly from B in cumulative N2O emissions. Modification with Fe(NO3)3 simultaneously altered both biochar pH and amendment-derived nitrate inputs; thus, pH cannot be isolated as the sole or master variable in this system. N2O emission rate peaked at pH 5.18, and the (nirK + nirS)/nosZ ratio showed a fitted maximum at pH 5.19, although this quadratic fit was not significantly better than a linear model, indicating that the balance between N2O production and reduction, rather than the absolute abundance of any single gene group, governed net emissions. Within the MB treatments, N2O emission rate was negatively correlated with pH and nosZ abundance and positively correlated with NH4+-N, NO3−-N, and the (nirK + nirS)/nosZ ratio, consistently with a combined shift in pH and mineral N toward greater N2O reduction capacity at higher pH. MB5, which raised soil pH to 5.47, reduced cumulative N2O by 37.35% relative to the peak treatment MB3. While higher pH was associated with lower emissions in this experiment, the fitted maximum at pH 5.18 should be interpreted as an experimental association rather than an operational mitigation threshold. Additionally, pH and NO3−-N varied simultaneously in this study, and their relative contributions could not be separated. Thus, field validations and factorial design studies capable of separating the NO3−-N effect from the pH effect are required before specific pH targets can be recommended.
Author Contributions
Conceptualization, B.D.; methodology, B.D.; software, B.D.; validation, A.M.; formal analysis, B.D.; investigation, B.D.; resources, B.D.; data curation, B.D.; writing—original draft preparation, B.D.; writing—review and editing, A.M.; visualization, B.D.; supervision, A.M.; project administration, B.D.; funding acquisition, B.D. All authors have read and agreed to the published version of the manuscript.
Funding
This research was supported by Jiangxi Provincial Natural Science Foundation (grant numbers 20224BAB215030, 20232ACB205007 and 20252BAC240644).
Data Availability Statement
The data presented in this study are available on request from the corresponding author.
Acknowledgments
Thanks are given to Zhen Li, Yingyu Zhu, Wei Liu and Longli Tian for their help in laboratory work.
Conflicts of Interest
The authors declare no conflicts of interest.
References
- IPCC. Climate Change 2021: The Physical Science Basis. In Contribution of Working Group I to the Sixth Assessment Report of the Intergovernmental Panel on Climate Change (IPCC); IPCC: Geneva, Switzerland, 2021; pp. 1–2409. [Google Scholar]
- Tian, H.; Pan, N.; Thompson, R.L.; Canadell, J.G.; Suntharalingam, P.; Regnier, P.; Davidson, E.A.; Prather, M.; Ciais, P.; Muntean, M.; et al. Global nitrous oxide budget (1980–2020). Earth Syst. Sci. Data 2024, 16, 2543–2604. [Google Scholar] [CrossRef] [Scilit]
- Adu-Poku, D.; Ackerson, N.O.B.; Devine, R.N.O.A.; Addo, A.G. Climate mitigation efficiency of nitrification and urease inhibitors: Impact on N2O emission—A review. Sci. Afr. 2022, 16, e01170. [Google Scholar] [CrossRef] [Scilit]
- Tian, H.; Xu, R.; Canadell, J.G.; Thompson, R.L.; Winiwarter, W.; Suntharalingam, P.; Davidson, E.A.; Ciais, P.; Jackson, R.B.; Janssens-Maenhout, G.; et al. A comprehensive quantification of global nitrous oxide sources and sinks. Nature 2020, 586, 248–256. [Google Scholar] [CrossRef] [Scilit] [PubMed]
- Kuypers, M.M.M.; Marchant, H.K.; Kartal, B. The microbial nitrogen-cycling network. Nat. Rev. Microbiol. 2018, 16, 263–276. [Google Scholar] [CrossRef] [Scilit] [PubMed]
- Qiu, Y.; Zhang, Y.; Zhang, K.; Xu, X.; Zhao, Y.; Bai, T.; Zhao, Y.; Wang, H.; Sheng, X.; Bloszies, S.; et al. Intermediate soil acidification induces highest nitrous oxide emissions. Nat. Commun. 2024, 15, 2695. [Google Scholar] [CrossRef] [Scilit] [PubMed]
- Cheng, Y.; Cai, Z.; Chang, S.X.; Wang, J.; Zhang, J. Effects of soil pH and salt on N2O production in adjacent forest and grassland soils in central Alberta, Canada. J. Soils Sediments 2013, 13, 863–868. [Google Scholar] [CrossRef] [Scilit]
- Zhang, Y.; Zhao, J.; Huang, X.; Cheng, Y.; Cai, Z.; Zhang, J.; Müller, C. Microbial pathways account for the pH effect on soil N2O production. Eur. J. Soil Biol. 2021, 106, 103337. [Google Scholar] [CrossRef] [Scilit]
- Qu, Z.; Wang, J.; Almøy, T.; Bakken, L.R. Excessive use of nitrogen in Chinese agriculture results in high N2O/(N2O+N2) product ratio of denitrification, primarily due to acidification of the soils. Glob. Change Biol. 2014, 20, 1685–1698. [Google Scholar] [CrossRef] [Scilit] [PubMed]
- Lehmann, J.; Joseph, S. Biochar for Environmental Management, 2nd ed.; Routledge: New York, NY, USA, 2015; pp. 1–944. [Google Scholar]
- Lehmann, J.; Cowie, A.; Masiello, C.A.; Kammann, C.; Woolf, D.; Amonette, J.E.; Cayuela, M.L.; Camps-Arbestain, M.; Whitman, T. Biochar in climate change mitigation. Nat. Geosci. 2021, 14, 883–892. [Google Scholar] [CrossRef] [Scilit]
- Zhang, Y.; Yan, C.; Wang, T.; Zhang, G.; Bahn, M.; Mo, F.; Han, J. Biochar strategy for long-term N2O emission reduction: Insights into soil physical structure and microbial interaction. Soil Biol. Biochem. 2025, 202, 109685. [Google Scholar] [CrossRef] [Scilit]
- Zheng, J.; Li, Z.; Sa, Q.; Wang, Y. Effects of biochar, biogas slurry, and dicyandiamide application on N2O emissions from soil in tomato production under protected cultivation. Nitrogen 2025, 6, 17. [Google Scholar] [CrossRef] [Scilit]
- Bai, J.; De Almeida Moreira, B.R.; Bai, Y.; Nadar, C.G.; Feng, Y.; Yadav, S. Assessing biochar’s impact on greenhouse gas emissions, microbial biomass, and enzyme activities in agricultural soils through meta-analysis and machine learning. Sci. Total Environ. 2025, 963, 178541. [Google Scholar] [CrossRef] [Scilit] [PubMed]
- Liu, C.; Chen, H.; Li, B.; Wu, Q.; Zhou, W.; Chen, D.; Ao, J. The effects and underlying mechanisms of modified biochar combined with nitrification inhibitors on nitrous oxide mitigation in acidic soils. Ecotoxicol. Environ. Saf. 2025, 303, 118876. [Google Scholar] [CrossRef] [Scilit] [PubMed]
- Gao, Y.; Wang, B.; Luo, L.; Deng, B.; Shad, N.; Hu, D.; Aly, H.M.; Zhang, L. Effects of hydroxyapatite and modified biochar derived from Camellia oleifera fruit shell on soil Cd contamination and N2O emissions. Ind. Crops Prod. 2022, 177, 114476. [Google Scholar] [CrossRef] [Scilit]
- Song, X.; Peng, C.; Ciais, P.; Li, Q.; Xiang, W.; Xiao, W.; Zhou, G.; Deng, L. Nitrogen addition increased CO2 uptake more than non-CO2 greenhouse gases emissions in a Moso bamboo forest. Sci. Adv. 2020, 6, eaaw5790. [Google Scholar] [CrossRef] [Scilit] [PubMed]
- Deng, B.; Shi, Y.; Zhang, L.; Fang, H.; Gao, Y.; Luo, L.; Feng, W.; Hu, X.; Wan, S.; Huang, W.; et al. Effects of spent mushroom substrate-derived biochar on soil CO2 and N2O emissions depend on pyrolysis temperature. Chemosphere 2020, 246, 125608. [Google Scholar] [CrossRef] [Scilit] [PubMed]
- Xiao, M.; Tang, C.; Jiang, Z.; Zhou, J.; Luo, Y.; Ge, T.; Pan, L.; Yu, B.; Cai, Y.; White, J.C.; et al. Opposing effects of maize straw and its biochar on soil N2O emissions by mediating microbial nitrification and denitrification in a subtropical Moso bamboo forest. Biochar 2026, 8, 50. [Google Scholar] [CrossRef] [Scilit]
- Liao, X.; Mao, S.; Shan, Y.; Gao, W.; Wang, S.; Malghani, S. Impact of iron-modified biochars on soil nitrous oxide emissions: Variations with iron salts and soil fertility. J. Environ. Manag. 2024, 356, 120571. [Google Scholar] [CrossRef] [Scilit] [PubMed]
- Hu, K.; Yu, C.; Chen, S.; Liu, Y.; Wei, H. Effects of biochar and iron-modified biochar on acid buffering capacity and organic carbon fractions of lateritic red soil. J. South China Agric. Univ. 2025, 46, 499–508. [Google Scholar]
- Shi, R.Y.; Hong, Z.N.; Li, J.Y.; Jiang, J.; Baquy, M.A.; Renkou, X.; Wei, Q. Mechanisms for increasing the pH buffering capacity of an acidic Ultisol by crop residue derived biochars. J. Agric. Food Chem. 2017, 65, 8111–8119. [Google Scholar] [CrossRef] [Scilit] [PubMed]
- Pauleta, S.R.; Dell Acqua, S.; Moura, I. Nitrous oxide reductase. Coord. Chem. Rev. 2013, 257, 332–349. [Google Scholar] [CrossRef] [Scilit]
- He, L.; Zhao, X.; Wang, S.; Xing, G. The effects of rice-straw biochar addition on nitrification activity and nitrous oxide emissions in two Oxisols. Soil Tillage Res. 2016, 164, 52–62. [Google Scholar] [CrossRef] [Scilit]
- Shofiati, S.A.; Nugroho, G.A.; Kusuma, Z.; Kurniawan, S. Effect of biochar-coated urea on soil nitrogen, plant uptake, and sweet corn yield in sandy soil. Nitrogen 2025, 6, 61. [Google Scholar] [CrossRef] [Scilit]
- Clough, T.; Condron, L.; Kammann, C.; Müller, C. A review of biochar and soil nitrogen dynamics. Agronomy 2013, 3, 275–293. [Google Scholar] [CrossRef] [Scilit]
- Lan, Z.M.; Chen, C.R.; Rashti, M.R.; Yang, H.; Zhang, D.K. Stoichiometric ratio of dissolved organic carbon to nitrate regulates nitrous oxide emission from the biochar-amended soils. Sci. Total Environ. 2017, 576, 559–571. [Google Scholar] [CrossRef] [Scilit] [PubMed]
- Yang, F.; Lee, X.; Theng, B.K.G.; Wang, B.; Cheng, J.; Wang, Q. Effect of biochar addition on short-term N2O and CO2 emissions during repeated drying and wetting of an anthropogenic alluvial soil. Environ. Geochem. Health 2017, 39, 635–647. [Google Scholar] [CrossRef] [Scilit] [PubMed]
- Chen, X.; Yang, S.; Jiang, Z.; Ding, J.; Sun, X. Biochar as a tool to reduce environmental impacts of nitrogen loss in water-saving irrigation paddy field. J. Clean. Prod. 2021, 290, 125811. [Google Scholar] [CrossRef] [Scilit]
- Ntacyabukura, T.; Uwiringiyimana, E.; Zhou, M.; Zhang, B.; Zhu, B.; Harerimana, B.; Nambajimana, J.D.; Nsabimana, G.; Nsengumuremyi, P. Effect of biochar and straw application on nitrous oxide and methane emissions from Eutric Regosols with different pH in sichuan basin: A mesocosm study. Atmosphere 2021, 12, 729. [Google Scholar] [CrossRef] [Scilit]
- Cornelissen, G.; Rutherford, D.W.; Arp, H.P.H.; Dörsch, P.; Kelly, C.N.; Rostad, C.E. Sorption of pure N2O to biochars and other organic and inorganic materials under anhydrous conditions. Environ. Sci. Technol. 2013, 47, 7704–7712. [Google Scholar] [CrossRef] [Scilit] [PubMed]
- Dong, Y.; Zhang, X.; Wang, X.; Xie, C.; Liu, J.; Cheng, Y.; Yue, Y.; You, X.; Li, Y. Modified biochar affects CO2 and N2O emissions from coastal saline soil by altering soil pH and elemental stoichiometry. Sci. Total Environ. 2024, 954, 176283. [Google Scholar] [CrossRef] [Scilit] [PubMed]
- van Zwieten, L.; Singh, B.P.; Kimber, S.W.L.; Murphy, D.V.; Macdonald, L.M.; Rust, J.; Morris, S. An incubation study investigating the mechanisms that impact N2O flux from soil following biochar application. Agric. Ecosyst. Environ. 2014, 191, 53–62. [Google Scholar] [CrossRef] [Scilit]
- Yuan, D.; Wu, P.; Yuan, J.; Jia, Z.; Hu, C.; Clough, T.J.; Wrage-Mönnig, N.; Luo, J.; Tang, J.; Qin, S. Loading of redox-active metal Fe largely enhances the capacity of biochar to mitigate soil N2O emissions by promoting complete denitrification. Biol. Fertil. Soils 2025, 61, 681–693. [Google Scholar] [CrossRef] [Scilit]
- Liu, B.; Frostegård, Å.; Bakken, L.R. Impaired reduction of N2O to N2 in acid soils is due to a posttranscriptional interference with the expression of nosZ. mBio 2014, 5, e01383-14. [Google Scholar] [CrossRef] [Scilit] [PubMed]
- Kong, D.; Zhang, X.; Li, B.; Zhu, G.; Liu, M.; Liu, S.; Liu, Y.; Jiang, P. Biochar-based fertilizer mitigates paddy soil N2O emissions by shifting nitrifier-denitrifier functional gene balance and enhancing recovery efficiency of nitrogen. Soil Tillage Res. 2026, 261, 107176. [Google Scholar] [CrossRef] [Scilit]
- Xiao, Z.; Rasmann, S.; Yue, L.; Lian, F.; Zou, H.; Wang, Z. The effect of biochar amendment on N-cycling genes in soils: A meta-analysis. Sci. Total Environ. 2019, 696, 133984. [Google Scholar] [CrossRef] [Scilit] [PubMed]
- Gao, W.; Zhang, W.; Liu, H.; Chen, X.; Fan, C.; Liu, Y.; Wu, X.; Chen, M. Lack of inhibitory effects of 1-Octyne and PTIO on ammonia oxidizers, nitrite oxidizers, and nitrate formation in acidic paddy soils. Appl. Soil Ecol. 2024, 203, 105673. [Google Scholar] [CrossRef] [Scilit]
- Xiang, X.; Gong, H.; Ahmed, W.; Thompson, R.B.; Shi, W.; Yin, J.; Chen, Q. Liming-induced nitrous oxide emissions from acidic soils dominated by stimulative nitrification. Biology 2025, 14, 1110. [Google Scholar] [CrossRef] [Scilit] [PubMed]
- Martens-Habbena, W.; Berube, P.M.; Urakawa, H.; de la Torre, J.R.; Stahl, D.A. Ammonia oxidation kinetics determine niche separation of nitrifying Archaea and Bacteria. Nature 2009, 461, 976–979. [Google Scholar] [CrossRef] [Scilit] [PubMed]

Disclaimer/Publisher’s Note: The statements, opinions and data contained in all publications are solely those of the individual author(s) and contributor(s) and not of MDPI and/or the editor(s). MDPI and/or the editor(s) disclaim responsibility for any injury to people or property resulting from any ideas, methods, instructions or products referred to in the content. |
© 2026 by the authors. Licensee MDPI, Basel, Switzerland. This article is an open access article distributed under the terms and conditions of the Creative Commons Attribution (CC BY) license.