


Abstract
Tropical rainforests play a vital role in maintaining global ecological balance, carbon cycling, and biodiversity conservation, making research on their biomass dynamics scientifically significant. This study integrates multi-source remote sensing data, including canopy height derived from GEDI and ICESat-2 satellite-borne lidar, Landsat imagery, and environmental variables, to estimate forest biomass dynamics in Hainan’s tropical rainforests at a 30 m spatial resolution, involving a correlation analysis of factors influencing spatiotemporal changes in Hainan Tropical Rainforest biomass. The research aims to investigate the spatiotemporal variations in forest biomass and identify key environmental drivers influencing biomass accumulation. Four machine learning algorithms—Backpropagation Neural Network (BP), Convolutional Neural Network (CNN), Random Forest (RF), and Gradient Boosting Decision Tree (GBDT)—were applied to estimate biomass across five forest types from 2003 to 2023. Results indicate the Random Forest model achieved the highest accuracy (R2 = 0.82). Forest biomass and carbon stocks in Hainan Tropical Rainforest National Park increased significantly, with total carbon stocks rising from 29.03 million tons of carbon to 42.47 million tons of carbon—a 46.36% increase over 20 years. These findings demonstrate that integrating multimodal remote sensing data with advanced machine learning provides an effective approach for accurately assessing biomass dynamics, supporting forest management and carbon sink evaluations in tropical rainforest ecosystems.
1. Introduction
Tropical rainforests are a vital component of global climate regulation and play a key role not only in biodiversity conservation, but also in forest carbon sequestration. Although tropical forests cover only 7%–10% of the Earth’s land surface, they store approximately 40% of the planet’s forest biomass carbon [1]. The Hainan Tropical Rainforest National Park is a key ecosystem in China characterized by diverse forest types, including tropical montane cloud forests, tropical coniferous forests, tropical seasonal forests, tropical lowland rainforests, and tropical montane rainforests. The park exhibits remarkable carbon sequestration capacity.
In this study, we integrated multiple remote sensing and environmental data sources, including GEDI and ICESat-2 lidar observations, Landsat imagery, and climate, atmospheric, and soil variables, to estimate forest biomass in Hainan’s tropical rainforests at a 30 m spatial resolution. The primary objectives were to investigate the spatiotemporal dynamics of forest biomass and identify key environmental factors driving biomass growth and carbon accumulation.
As a critical component of the global carbon cycle, measuring and dynamically monitoring the carbon sink of the Hainan Tropical Rainforest National Park is of great significance in the context of climate change and has attracted widespread attention from researchers worldwide. Zhang et al. developed a carbon sink assessment model for the Diaoluoshan forest area based on the methodology described in the Guidelines for the Compilation of Provincial Greenhouse Gas Inventories [2]. They quantified changes in forest carbon stocks and emissions across five distinct periods between 1998 and 2018. Pi et al. used the InVEST model combined with geographic detector analysis to investigate the long-term carbon sequestration of forest ecosystems on Hainan Island from 1990 to 2020 [3]. Their study identified the normalized difference vegetation index (NDVI), elevation, and slope as the primary drivers of spatial variation in carbon storage. Lei et al. applied the InVEST and Cellular Automata (CA)–Markov models to assess and predict the impacts of different land-use patterns on carbon storage on Hainan Island for 2000–2020 and 2030–2050 [4]. They also quantitatively analyzed the factors influencing and the driving mechanisms underlying the spatial distribution of forest carbon storage [4]. Cheng et al. used allometric growth models to estimate the aboveground biomass of tropical cloud forests in the Hainan Jianfengling, Bawangling, and Limushan National Nature Reserves [5].
Traditional methods for estimating carbon sequestration from biomass typically depend on field surveys. By directly measuring canopy height and diameter and identifying tree species, single-tree growth models can be developed, providing a robust basis for high-precision forest biomass carbon estimation [6,7,8,9,10]. However, this approach is costly, time-consuming, and often destructive, limiting its large-scale application to tropical rainforests characterized by complex terrain. Remote sensing technology, with its advantages of extensive coverage, non-destructive data acquisition, and continuous monitoring capabilities, has emerged as a vital tool for investigating aboveground biomass carbon sequestration in forest ecosystems [11,12].
Early remote-sensing studies of biomass mostly used optical remote-sensing data (such as Landsat and MODIS) to monitor vegetation canopy height and aboveground biomass. However, optical data are prone to be affected by canopy reflection saturation in areas with high vegetation coverage, thereby limiting the estimation accuracy in medium- and high-biomass regions. To address these issues, microwave radar and laser radar (light detection and ranging, LiDAR) technologies have gradually been incorporated into research. Microwave radar (such as synthetic aperture radar, SAR) has strong canopy penetration capabilities and thus advantages in estimating forest density and structural characteristics, especially in areas with medium biomass. However, its signal is susceptible to terrain effects and lacks precise descriptions of canopy details and vertical structure. In contrast, LiDAR, an active remote-sensing technology, substantially improves the accuracy of aboveground biomass estimation by precisely measuring the three-dimensional (3D) canopy structure [13,14,15]. The integration of LiDAR data can substantially improve the spatial accuracy of carbon storage estimations [16]. Recent studies published in 2024 and 2025 further demonstrate that integrating multi-source remote sensing data with machine learning algorithms significantly enhances the accuracy and reliability of forest aboveground biomass estimation, particularly in structurally complex forest ecosystems. These investigations highlight the effectiveness of methods such as random forests and multi-sensor data fusion in capturing forest structural heterogeneity and carbon stock dynamics. [17,18,19]
However, current research methods face several challenges in improving estimation accuracy. First, insufficient consideration of the unique characteristics of different forest types limits their ability to comprehensively capture changes in vegetation structure. Second, many above-ground forest biomass estimation models often neglect the multi-layered structure of the litter layer, herbaceous layer, and shrub layer, potentially leading to underestimation of forest biomass. Furthermore, reliance on a single data source carries inherent limitations. To address these challenges, recent studies have proposed various improvement strategies:
- Introduction of forest structural parameters: Incorporating structural parameters, such as canopy height, leaf area index (LAI), and gap fraction, can improve forest biomass estimation accuracy to a certain extent. For example, in a study of German forest biomass, Torano et al. applied a vertical structure inversion algorithm based on Legendre polynomials, which increased the correlation coefficient of biomass estimation to 0.76 and reduced the relative root mean square error (RMSE) to 48.31 Mg·ha−1, thereby enhancing estimation accuracy [20]. Fischer et al. analyzed the horizontal and vertical structures of 375,000 forest plots in Germany using LiDAR technology; canopy top height and the standard deviation of vertical leaf distribution were identified as key indicators for estimating forest biomass and wood productivity [21].
- Multilevel structural analysis: Incorporating the multilayer structure of the litter, herb, and shrub layers has also been shown to substantially improve the accuracy of forest biomass estimation. Haq et al., in their study of forest biomass and carbon storage distribution across different vegetation layers in the Western Himalayas, found marked differences in aboveground forest biomass and carbon storage among the tree, shrub, herb, and surface layers [22]. The tree layer accounted for the majority of carbon storage, (averaging 172.92 Mg/ha).
- Multimodal data fusion: By utilizing multi-modal remote sensing technology and integrating optical remote sensing data, active remote sensing data (such as LiDAR and SAR), and thermal infrared remote sensing data, the limitations of a single data source can be overcome [16,23,24,25,26,27,28,29,30,31].
- Type-based and hierarchical modeling: Developing independent models for different forest types can enhance model adaptability. For example, in their study of northern forests in Finland, Adnan et al. proposed the use of the Gini coefficient instead of the traditional forest height diversity (FHD) metric [32]. By applying a stratified modeling approach, they improved the accuracy of LiDAR-based aboveground forest biomass estimation, reducing the RMSD from 41.7% to 37.0%, highlighting the influence of varying forest structures on predictor variables.
Moreover, forests, as complex ecosystems, exhibit unique and intricate patterns across multiple dimensions. Specifically, they demonstrate nonlinear relationships, spatial and temporal autocorrelation, and interactions between variables. When modeling such systems, nonparametric algorithms typically outperform parametric methods [33]. Nonparametric models, particularly machine learning algorithms, can effectively capture the complex nonlinear relationships between remote sensing variables and forest biomass. Compared to parametric models, they typically exhibit superior estimation performance [34]. The incorporation of machine-learning algorithms, including convolutional neural networks (CNN), random forests (RF), k-nearest neighbors (KNN), support vector machines (SVM), and backpropagation neural networks (BP), has substantially enhanced the accuracy and generalization ability of biomass estimation models [34,35,36,37,38].
The current study introduces several innovations based on traditional methods:
- Forest biomass of the herb, shrub, litter, and tree layers was calculated separately.
- Separate models were developed for five forest types: tropical montane cloud forests, tropical seasonal forests, tropical coniferous forests, tropical montane rainforests, and tropical lowland rainforests.
- Four advanced machine-learning algorithms were used for nonparametric modeling: random forest (RF), gradient boosting decision tree (GBDT), convolutional neural network (CNN), and backpropagation neural network (BP).
This study estimated the spatiotemporal evolution of biomass carbon sequestration in the tropical rainforests of the Hainan Tropical Rainforest National Park from 2003 to 2023, analyzing the environmental response mechanisms of its carbon sink. This work aims to provide a more scientific basis for the sustainable management and conservation of tropical rainforests.
2. Materials and Methods
2.1. Study Area
Hainan Tropical Rainforest National Park is located in the mountainous areas of central and southern Hainan Island (18°33′–19°14′ N, 108°44′–110°04′ E), situated at the intersection of the north–south thermal gradient and the east–west moisture gradient (Figure 1). The park covers approximately 4269 km2, representing about 13% of the island’s total land area. The region experiences a mean annual temperature of around 25 °C and receives annual precipitation ranging from 1700 to 2700 mm. Forest ecosystems dominate the landscape, with a forest coverage rate of 95.85%. Notably, the park contains more than 95% of Hainan Island’s primary forests and over 55% of its natural forests, forming the largest, most continuous, and best-preserved tropical rainforest area in China.
Figure 1.
Overview of the study area of the Hainan Tropical Rainforest National Park in southwestern Hainan Island, China.
2.2. Data Sources
2.2.1. Forest Sample Plot Data
This study employed a 1 km × 1 km grid method to purposefully and randomly select 140 plots (Figure 2) within the Hainan Tropical Rainforest National Park for field biomass surveys. The study area features complex topography and is designated as a national key protected area, resulting in extremely constrained fieldwork conditions that made plot establishment and data collection exceptionally challenging. When selecting plots, we specifically ensured that at least 15 plots were obtained for each forest type. Ultimately, we established 15 tropical montane cloud forest plots, 23 tropical coniferous forest plots, 30 tropical seasonal forest plots, 43 tropical montane rainforest plots, and 29 tropical lowland rainforest plots. Each plot measured 10 m by 10 m to adequately reflect the surrounding forest conditions. Due to the rugged topography of the Hainan Tropical Rainforest National Park, some plots were spaced less than 1 km apart horizontally. A VLP-16 3D LiDAR scanner was used to scan all 140 plots, capturing comprehensive 3D point cloud data that were subsequently preprocessed to ensure data quality. The point cloud data were processed using the Lego_Loam algorithm, successfully reconstructing the three-dimensional structure of the tropical rainforest within each plot. Precise measurements of canopy volume, tree height, and diameter at breast height (DBH) for tropical rainforest trees were conducted using MATLAB 2024 software (MathWorks Inc., Natick, MA, USA) and the Rviz tool. Using the minimally invasive plot sampling method, stem and crown biomass densities were determined by collecting stem and partial crown samples (including branches and leaves) with an electric increment borer. Standard trees were selected for each species within the plot (ensuring that at least three samples per species surveyed), and individual tree biomass was calculated by combining 3D LiDAR measurements of each tree’s volume. Second, five 0.3 m × 0.3 m small sample plots were randomly established at the edges and center of each plot. Samples of understory litter (dead branches and leaves), herbaceous plants, and shrubs were collected to calculate understory biomass within the plots. Across the 140 plots, a total of 169 tree species and 4732 individual trees were recorded (Table A1).
Figure 2.
Distribution of forest types in Hainan Tropical Rainforest National Park. Subfigures (a–e) represent forest type distributions in 2003, 2008, 2013, 2018, and 2023, respectively. The maps were generated using the WGS 1984 geographic coordinate system and projected with the WGS 1984 UTM Zone 49N coordinate system.
Additionally, the relationship between spectral data and biomass is significantly influenced by multiple factors across different years, including sensor type, atmospheric conditions, seasonal variations, and changes in vegetation structure. Landsat 5–7 satellites were used from 2003 to 2013, while Landsat 8 was employed from 2013 to 2023. Differences in their spectral response functions may still cause reflectance biases even after atmospheric correction. Therefore, this study also utilized five biomass data sets (2003, 2008, 2013, 2018, and 2023) from 64 historical plots (25.8 m × 25.8 m).
2.2.2. Other Data
- The canopy height data used in this study were derived from our previous research [39], which integrated GEDI and ICESat-2 satellite-borne LiDAR observations with Landsat imagery, topographic variables, and climatic factors. In that study, ground-based LiDAR and UAV plot observations were used as reference data, and machine learning algorithms, including Random Forest, were applied to construct a canopy height inversion model for the Hainan Tropical Rainforest National Park from 2003 to 2023. The results demonstrated that the Random Forest model based on the RH80 percentile achieved the highest accuracy (R2 = 0.60, RRMSE = 21.36%), providing a reliable canopy structure dataset for biomass estimation in the present study.GEDI provides full-waveform LiDAR measurements, from which relative height (RH) metrics (e.g., RH25, RH50, RH75, and RH80) were extracted to characterize the vertical distribution of vegetation energy returns at different canopy layers. These RH metrics represent the cumulative proportion of waveform energy reflected from vegetation and ground surfaces, allowing the quantification of multi-level canopy height characteristics. ICESat-2, as a photon-counting LiDAR system, provides high-resolution elevation profiles by detecting individual canopy and ground photons. The method for calculating canopy height involves: first filtering out noise and applying terrain correction, then calculating the height difference between the canopy photon return value and the ground photon return value.For tropical montane cloud forests, the combination of GEDI and ICESat-2 offers complementary advantages due to their complex vertical stratification, dynamic canopy conditions influenced by frequent cloud cover, steep topography, and disturbance events. GEDI captures detailed vertical structural information within dense forest canopies, while ICESat-2 provides precise elevation references across complex terrain. To reduce uncertainties associated with short-term canopy dynamics and cloud-induced noise, multi-year LiDAR observations were aggregated, and the satellite-derived canopy height estimates were calibrated using field-based LiDAR measurements and machine learning models. This approach improves the robustness and applicability of canopy height estimation under the dynamic conditions of tropical montane cloud forests.
- Monthly temperature and precipitation records for the study area covering the period 1960–1982 were obtained from the WorldClim database (https://www.worldclim.org/; last accessed 5 March 2025) and processed at an approximate spatial resolution of 4 km to calculate annual mean temperature and precipitation. Annual climate data for the period 1982–2023, with a spatial resolution of 1 km, were acquired from the National Earth System Science Data Center (https://www.geodata.cn; last accessed 5 March 2025). To ensure data consistency and reliability, the two datasets were harmonized and bias-corrected prior to analysis. Pixel-based statistical analyses were conducted in ArcGIS Pro 3.4.0 to derive mean annual temperature and precipitation for Hainan Island across five time intervals: 1960–2023, 1960–2018, 1960–2013, 1960–2008, and 1960–2003. Subsequently, all datasets were resampled to a spatial resolution of 30 m using the cubic convolution interpolation method to enhance spatial consistency and analytical precision.
- The natural forest classification dataset and the GLC_FCS30D product, a global dynamic land-cover dataset at 30 m spatial resolution with detailed thematic classes, were employed in this study [40,41]. A forest-type distribution map for the Hainan Tropical Rainforest National Park covering the period 2003–2023 was produced by integrating the natural forest classification data with the GLC_FCS30D land-cover dataset and ALOS digital elevation model (DEM) data (Figure 2).
- Landsat series data, which underwent radiometric calibration and atmospheric correction, were downloaded from the Google Earth Engine platform (https://code.earthengine.google.com, accessed on 5 March 2025). Remote sensing data from 2003 to 2023, including Landsat 5 TM and Landsat 8 OLI data, were acquired. Six original spectral bands were used and 18 vegetation indices were derived. To address the saturation issue of optical features, textural features were used as a complementary source of spatial structural information for estimating the forest above-ground biomass (AGB). Textural features were extracted using the Gray-Level Co-occurrence Matrix (GLCM) method, including mean, variance, homogeneity, contrast, dissimilarity, entropy, second moment, and correlation, and were calculated over 3 × 3, 5 × 5, and 7 × 7 windows. A total of 144 textural feature variables were derived from the six bands (Table 1). Smaller windows (3 × 3) preserve fine-scale texture details, while larger windows (5 × 5 and 7 × 7) better represent broader canopy structure and spatial heterogeneity. Using multiple window sizes helps balance local detail and contextual information, which is particularly important for heterogeneous tropical forest landscapes.
- In addition, the 1 km-resolution LandScan population dataset for the study area from 2003 to 2022 was downloaded (https://landscan.ornl.gov/, last accessed on 5 March 2025). Monthly climate data for the study area from 2003 to 2023, including the average minimum temperature, average maximum temperature, precipitation, and potential evapotranspiration at a spatial resolution of 1 km, were obtained from the National Qinghai–Tibet Plateau Science Data Center [42,43,44,45]. The dataset included 5-y averages of the minimum and maximum annual temperatures, potential evapotranspiration, and population distribution for 2004–2008, 2009–2013, 2014–2018, and 2019–2023.
- The second version of the 1 km-resolution Chinese soil datasets for land surface simulations, downloaded from the National Qinghai–Tibet Plateau Data Center, was used for the study area [46]. The soil dataset included bulk density (0–30 cm, g/cm3), cation exchange capacity (0–30 cm, me/100 g), clay (0–30 cm, %), content (0–30 cm, %), organic carbon (0–30 cm, %), sand (0–30 cm, %), silt (0–30 cm, %), total potassium (0–30 cm, g/100 g), total nitrogen (0–30 cm, g/100 g), total phosphorus contents (0–30 cm, g/100 g), porosity (0–30 cm, %), and soil pH at three depths: 0–5 cm, 5–15 cm, and 15–30 cm.
Table 1.
Features extracted from Landsat data.
2.3. Methods
2.3.1. Feature Selection
Before data modeling, many features potentially related to the target variable are typically collected. However, not all features contribute equally to the predictive performance of the model. Therefore, feature selection is essential in retaining only those features with high predictive power for the target variable, thereby improving the model performance and generalization. The Spearman correlation coefficient was calculated between the features and dependent variable (forest biomass) to assess the monotonic relationships among variables. The Spearman correlation coefficient is advantageous because of its nonparametric nature, which makes it suitable for handling non-normal or ranked data. Features with strong correlations were identified by ranking them according to the absolute values of their Spearman correlation coefficients.
Subsequently, a collinearity diagnosis was conducted on the ranked features to evaluate the impact of multicollinearity on model stability and parameter estimation. Collinearity refers to a high degree of correlation between predictors, which can lead to unstable models and biased parameter estimates. Common methods for diagnosing collinearity include the variance inflation factor (VIF), tolerance, condition index, and variance proportion. VIF was used for collinearity assessment. Features with VIF values < 10 were retained for the final prediction and estimation (Table 2).
Table 2.
Characteristics of biomass estimation models in Hainan tropical rainforests by remote sensing.
2.3.2. Model Construction
This study employed four machine learning algorithms (BP, RF, CNN, and GBDT) to develop a remote sensing-based biomass estimation model for Hainan’s tropical rainforests. A total of 460 biomass samples, including 140 field survey datasets and 320 historical biomass records, were used for model development. For each forest type, the dataset was randomly divided into training (70%) and testing (30%) subsets, a widely adopted ratio that ensures sufficient data for model training while retaining independent samples for robust performance evaluation.
The CNN architecture was implemented to extract multilevel features from remote sensing inputs using successive convolutional, pooling, and fully connected operations. In the canopy height modeling framework, a one-dimensional convolution kernel of size 3 × 1 was applied, with 32 and 64 feature maps assigned to the convolutional layers. Dimensionality reduction was achieved through max pooling, while a dropout rate of 0.2 was introduced to reduce overfitting. The extracted features were subsequently fed into a fully connected layer consisting of 128 neurons. Model training was carried out using the Adam optimizer, with a minimum batch size of 64, a maximum of 2000 epochs, and a staged learning rate scheme.
For above-ground biomass estimation, the network configuration was simplified by setting the convolutional layers to 16 and 32 filters and reducing the fully connected layer to 32 neurons. Optimization was performed using the SGDM, with a minimum batch size of eight and a training duration limited to 100 epochs.
The RF algorithm uses an ensemble learning approach to construct decision trees with bootstrap sampling. In the canopy height model, 100 decision trees were integrated, with a minimum leaf node size of 10 to enhance the robustness and generalization ability of the model. For the forest biomass estimation model, 100 decision trees were integrated, and the minimum leaf node size was adjusted to five.
The BP algorithm, as a classical feedforward neural network, comprises an input layer and an output layer and is trained using the backpropagation algorithm. In the canopy height model, the hidden layer contained 50 neurons, with 300 training iterations, an error threshold of 1 × 10⁻⁹, a learning rate of 0.001, and normalized input data. For the forest biomass estimation model, the hidden layer was reduced to 5 neurons, with 800 training iterations, an error threshold of 1 × 10⁻⁵, a learning rate of 0.01, and similarly normalized input data.
By iteratively aggregating multiple decision trees, GBDT enhances prediction accuracy to effectively capture nonlinear relationships and interactions among variables. Within the canopy height modeling framework, the model was configured with 800 trees, each with a maximum split depth of 10 and a learning rate of 0.1, to progressively minimize prediction error. For estimating forest aboveground biomass, the number of trees was reduced to 300, the maximum split count was set to 5, and the learning rate was lowered to 0.01 to achieve a stable and progressively optimized model.
These four algorithms were selected to represent the various machine learning methods commonly used in remote sensing research. BP represents traditional neural networks, CNN captures nonlinear feature representations, RF is an ensemble tree-based method with strong robustness against noise and multicollinearity, while GBDT represents ensemble learning based on reinforcement learning. This selection enables a comprehensive comparison of representative algorithm families while maintaining computational efficiency. Algorithms such as SVM and XGBoost were excluded to avoid model type redundancy and ensure methodological focus and comparability. All machine learning models were implemented in MATLAB. The BP and CNN models were developed using the Deep Learning Toolbox, while the Random Forest and Gradient Boosting Decision Tree models were implemented using the Statistics and Machine Learning Toolbox.
2.3.3. Model Evaluation and Validation
Model performance was evaluated using five statistical indicators: the coefficient of determination (R2), bias, relative bias, root mean square error (RMSE), and relative root mean square error (RRMSE) (Equations (1)–(5)). Together, these metrics were used to characterize both model fit and predictive accuracy. The coefficient of determination (R2) was applied to describe the proportion of variance in the reference data accounted for by the model. Bias and relative bias were used to quantify systematic differences between predicted and observed values in absolute and proportional terms, respectively. RMSE was calculated to represent the overall magnitude of prediction errors, while RRMSE expressed these errors relative to observed values. To enhance the robustness of model evaluation, the division of samples into training and testing subsets was repeated multiple times using random sampling. Final model performance was determined based on the averaged evaluation metrics, thereby reducing the influence of sampling uncertainty and improving the reliability of the assessment [65]:
where is the average value of the observed data, represents the observed value, is the corresponding predicted value, and is the sample size.
3. Results
3.1. Accuracy Verification Results
Accuracy Validation of Remote Sensing Models for Biomass Estimation
To validate the performance of the biomass estimation models, model accuracy was evaluated using independent testing datasets across different forest types in the Hainan Tropical Rainforest National Park (Table 3).
Table 3.
Accuracy Validation of Remote Sensing Models for Tropical Rainforests Biomass Established by Four Machine Learning Algorithms.
In tropical lowland and montane rainforests, the RF-based model outperformed the other algorithms, achieving training set R2 values of 0.82 and 0.65 and test set R2 values of 0.71 and 0.59, respectively. The relative bias was low (7.54% and 8.24%), accompanied by smaller RRMSE values (33.95% and 31.79%), indicating reliable and robust biomass estimation in these forest types.
Similarly, in tropical coniferous and seasonal forests, the RF-based biomass estimation models showed stable performance, with test set R2 values of 0.57 and 0.60, relative bias of 8.64% and −1.06%, respectively, and the lowest RRMSE among all tested algorithms. These validation results confirm the broad applicability and robustness of the Random Forest algorithm for biomass estimation across diverse tropical forest ecosystems.
3.2. Biomass Changes in Hainan Tropical Rainforest National Park from 2003 to 2023
This study employed a remote sensing-based biomass estimation model for Hainan Tropical Rainforest National Park, constructed using the RF algorithm, to generate a 30 m spatial resolution biomass distribution map for the reserve from 2003 to 2023 (Figure 3).
Figure 3.
Biomass distribution map of Hainan Tropical Rainforest National Park. Subfigures (a–e) depict the spatial distribution of carbon storage in 2003, 2008, 2013, 2018, and 2023, respectively. The map is based on the WGS 1984 geographic coordinate system and the WGS 1984 UTM 49N projection coordinate system.
From 2003 to 2023, the park exhibited a pronounced overall upward trend in biomass. Particularly between 2013 and 2023, biomass growth was especially significant, with the transition from lighter to darker shades indicating continuous forest ecosystem recovery and improved vegetation cover. This suggests that effective ecological conservation measures may have been implemented over the past decade, such as enhanced forest protection, reduced human disturbance, and promotion of natural restoration. Biomass levels expanded from 19.71 Mg/ha to 554.55 Mg/ha, with particularly dense distribution and high biomass values observed in the central mountainous core area. This concentration was closely linked to favorable conditions including complex topography, abundant rainfall, and minimal disturbance.
However, biomass declined in some areas between 2008 and 2013, potentially linked to natural disasters (e.g., typhoons), pest infestations, or localized human activities. Peripheral zones and low-elevation areas consistently exhibited relatively low biomass, suggesting these regions may face greater ecological pressures. Overall, the ecological health of Hainan Tropical Rainforest National Park has progressively improved over the past two decades. The sustained increase in biomass reflects vegetation recovery, laying the foundation for enhanced regional ecosystem service value.
Based on the distribution of forest biomass density in the Hainan Tropical Rainforest National Park, this study calculated the biomass and carbon stocks for each sub-district and forest type within the park, as presented in Table 4 and Table 5. Carbon stocks were determined by multiplying the forest aboveground biomass by the internationally accepted conversion factor of 50%.
Table 4.
Biomass and carbon storage statistics by forest type in Hainan Tropical Rainforest National Park, 2003–2023.
Table 5.
Biomass carbon sequestration statistics of seven branches of Hainan Tropical Rainforest National Park from 2003 to 2023.
According to the results (Table 4), between 2003 and 2023, the Hainan tropical rainforest ecosystem showed significant improvement driven by multiple ecological conservation and restoration policies. Overall biomass and carbon storage continued to increase, with a marked rise in carbon sequestration efficiency. Particularly during 2018–2023, the growth rates of biomass density and carbon storage accelerated. This trend is closely linked to the establishment of the national park system, support from the carbon emissions trading mechanism, and the intensive implementation of ecological restoration and vegetation recovery projects. Significant differences in biomass growth rates and carbon sink capacities were observed across different forest types, reflecting heterogeneity in ecological functions and natural recovery capabilities among these forest categories.
The primary forest types in Hainan’s tropical rainforests—tropical lowland rainforests, tropical montane rainforests, tropical montane cloud forests, tropical seasonal forests, and tropical coniferous forests—all exhibited upward trends in biomass and carbon storage from 2003 to 2023. However, their growth rates and dynamic processes showed distinct variations.
Tropical lowland rainforests demonstrated the most significant biomass accumulation capacity. Their average biomass density increased from 166.54 Mg/ha in 2003 to 236.53 Mg/ha in 2023, representing a 41.70% increase. Total biomass rose from 19.79 Tg to 28.17 Tg, while carbon stocks increased from 9.90 TgC to 14.09 TgC (a 42.30% growth). This forest type experienced its fastest growth between 2003 and 2013, achieving an average annual carbon sink of 0.41 TgC/yr. Growth slowed during 2013–2018 (0.01 TgC/yr) before rebounding in 2018–2023. This pattern indicates that lowland rainforests exhibit high productivity during early recovery phases, with biomass accumulation rates gradually decreasing as communities mature.
The biomass density of tropical montane cloud forests showed an upward trend from 2003 to 2013, increasing from 285.56 Mg/ha to 385.60 Mg/ha, but subsequently declined slightly, reaching 354.65 Mg/ha by 2023. Total biomass and carbon stocks decreased to 5.12 Tg and 2.56 TgC, respectively. The average annual carbon sink even turned negative between 2018 and 2023, indicating that this forest type may be affected by climate change or environmental disturbances at high elevations, with ecological recovery facing certain constraints.
During the study period, the forest area of tropical montane rainforests first decreased and then increased, but the overall trend of biomass accumulation remained positive. Their average biomass density increased from 230.65 Mg/ha to 326.41 Mg/ha, representing a growth exceeding 41%. Despite covering a smaller area than lowland rainforests, montane rainforests contributed the highest total biomass and carbon stocks across the entire park—reaching 33.28 Tg and 16.68 TgC, respectively, in 2023—demonstrating their pivotal role in regional carbon cycling.
Tropical seasonal forests demonstrated robust recovery potential between 2018 and 2023, with average biomass density increasing from 219.13 Mg/ha to 297.71 Mg/ha. This represents the fastest growth among all forest types, achieving an average annual carbon sequestration rate of 0.49 TgC/yr. This reflects their high activity and strong carbon sequestration capacity during the ecological recovery phase.
Although tropical coniferous forests possess relatively high average biomass density, their limited distribution area results in a modest contribution to overall carbon stocks. Their total biomass in 2023 amounted to only 0.09 Tg, indicating relatively weak carbon sequestration.
Overall, the biomass accumulation and carbon storage trends across forest types in the Hainan Tropical Rainforest National Park were clearly defined. Among these, montane rainforests and lowland rainforests exhibited the most prominent carbon sequestration capacity, forming the core of the region’s carbon sink function. Tropical seasonal rainforests followed with strong restoration potential. Carbon stocks in tropical montane cloud forests showed a slight decline, possibly influenced by climatic stress. Tropical coniferous forests, however, contributed relatively little due to their limited area. The distinct characteristics of different forest types provide crucial guidance for future forest management and ecological restoration. This suggests implementing zoned management and differentiated conservation strategies based on forest type and environmental conditions to enhance the overall carbon sink efficiency of the ecosystem.
According to the results (Table 5), both overall forest biomass and carbon storage of the Hainan Tropical Rainforest National Park showed a significant upward trend from 2003 to 2023. However, marked spatial differences in biomass accumulation rates and carbon sequestration capacities were observed among different subdistricts.
The Yinggeling Subdistrict, as the area with the largest forest coverage, exhibited the most significant increases in biomass and carbon stocks. Over the 20-year period, biomass rose from 12.81 Tg to 18.28 Tg, an increase of 5.47 Tg (42.70%), while carbon stocks increased from 6.40 TgC to 9.14 TgC. Its average annual carbon sink capacity remained consistently high across all phases, particularly reaching 0.21 TgC/yr during 2003–2008 and 0.13 TgC/yr during 2018–2023. This demonstrates the region’s exceptional carbon sequestration potential and ecological restoration capacity.
The Jianfengling Subdistrict recorded the highest biomass growth rate, with forest biomass increasing from 9.77 Tg to 14.87 Tg, representing a 52.20% rise, and carbon stocks rising from 4.88 TgC to 7.44 TgC. Its average annual carbon sequestration capacity reached 0.18 TgC/yr during 2003–2008 and 0.21 TgC/yr during 2018–2023, indicating a trend of enhanced forest vitality and significantly improved carbon sequestration capacity in recent years.
The biomass increase in the Bawangling Subdistrict ranked second, rising from 10.59 Tg to 15.19 Tg—an increase of 4.60 Tg (43.44%). Carbon stock growth in this area exhibited a relatively stable trend, with the highest average annual carbon sink capacity (0.16 TgC/yr) occurring between 2003 and 2008. Following slight fluctuations, it rebounded to 0.13 TgC/yr during 2018–2023. Overall, the Bawangling forest ecosystem maintains stable structural integrity and strong carbon sequestration potential, representing a typical high-biomass region within the park.
Although the Diaoluoshgan and Maorui Subdistricts had relatively small forest areas, their biomass growth rates still reached 50.70% and 50.00%, respectively, demonstrating high carbon accumulation efficiency per unit area. This indicates that forests maintained strong productivity and ecological resilience even within limited spaces. Biomass growth in the Wuzhishan Subdistrict remained relatively stable, increasing from 7.67 Tg to 11.20 Tg. The average annual carbon sink capacity between 2013 and 2018 and 2018–2023 was essentially consistent, reflecting that the forest communities in this region had stabilized and entered a relatively mature stage.
Although the biomass growth rate of the Limushan Subdistrict was the lowest among all subdistricts (42.60%), it maintained a sustained upward trend. Its carbon sequestration capacity was relatively strong during 2003–2008 (0.12 TgC/yr), slowed during 2008–2018, and showed a slight rebound during 2018–2023 (0.08 TgC/yr), indicating gradual recovery of its forest ecosystems.
Overall, biomass growth rates and carbon sequestration capacity across the Subdistricts of the Hainan Tropical Rainforest National Park exhibit distinct spatial heterogeneity. The Yinggeling, Jianfengling, and Bawangling Subdistricts exhibit the most vigorous forest growth and should maintain strict protection and long-term monitoring. For subdistricts with relatively lower biomass growth rates, such as Limushan and certain small-to-medium-sized areas, enhanced ecological monitoring and implementation of appropriate artificial restoration measures can promote forest structural optimization and enhance carbon sequestration functions. These differentiated dynamic characteristics provide crucial scientific basis for future regionalized forest management and carbon sequestration enhancement strategies.
4. Discussion
4.1. Comparative Analysis of Four Machine Learning Algorithms for Remote Sensing Estimation of Forest Biomass
During the remote sensing-based biomass modeling process, the four machine learning approaches (RF, BP, CNN, and GBDT) showed distinct performance patterns among different forest types. Overall, the Random Forest (RF) model consistently outperformed the other algorithms, demonstrating superior estimation accuracy and greater model robustness. High coefficients of determination (R2) were maintained for both training and testing datasets across all forest types, with particularly strong performance observed in tropical lowland rainforests and tropical montane cloud forests. In addition, the RF-based biomass estimates exhibited relatively low bias, indicating effective error regulation and a strong ability to capture variations in observed biomass. These findings are consistent with previous research by Ghosh et al., who reported that RF achieved the most accurate above-ground biomass (AGB) estimates, with the lowest relative root mean square error (RRMSE) of 26.75% [66].
In comparison, the BP neural network algorithm exhibited lower model accuracy. Although it demonstrated some fitting capability on the tropical lowland rainforests training set (R2 = 0.74), its performance significantly declined on the test set (R2 = 0.60), indicating a pronounced risk of overfitting. Particularly in seasonal rainforest types, the BP model exhibits a substantial bias of −53.14 Mg/ha, significantly underestimating actual biomass. This aligns with findings from other studies indicating that the BP algorithm is prone to overfitting under complex forest structures, resulting in limited predictive accuracy. In a biomass study of nature reserves in Liaoning Province, the coefficient of determination was only R2 = 0.78 [37].
Convolutional neural network (CNN) algorithms exhibited certain advantages in feature extraction and spatial pattern recognition, particularly when processing the spatial characteristics of remote sensing imagery. However, the CNN model demonstrated strong type dependency in this study: it showed lower bias (−12.26 Mg/ha) in tropical lowland rainforests but poor accuracy (R2 = 0.35) on the test set for tropical montane cloud forests. This phenomenon aligns with findings from other regions. For instance, in forest biomass estimation in the Hangzhou area, the RF model achieved an accuracy of R2 = 0.73 with a relative bias of −11.40%, while the CNN model only reached R2 = 0.56. This indicates that the stability of CNN algorithms across different forest types remains limited [34].
The Gradient Boosted Decision Tree (GBDT) algorithm demonstrated overall superior performance compared to the BP and CNN algorithms. Its test set R2 reached 0.79 in tropical lowland rainforests, with low Bias and RMSE values, indicating high estimation accuracy and stability. Compared with results from other regional studies, the GBDT algorithms (XGBoost and LightGBM) also demonstrated superior performance in AGB estimation for the Qilian Mountains region. Among these, the LightGBM model achieved the highest accuracy (R2 = 0.41, RMSE = 19.40 Mg/ha), closely matching the performance results of the RF model [36]. This indicates that GBDT can effectively capture nonlinear relationships and possesses strong feature-learning capabilities. However, in complex forest types such as tropical montane cloud forests and tropical coniferous forests, GBDT errors remain slightly higher than that of the RF algorithm. Research by Ghosh et al. further confirms that in AGB estimation for Indian tropical forests, while GBDT performed well in Tectona grandis stands (R2 = 0.60, RMSE = 79.45 Mg/ha), the RF model achieved higher estimation accuracy in Shorea robusta stands (R2 = 0.71, RMSE = 105.03 t/ha) [67]. This indicates that GBDT is significantly influenced by data characteristics and vegetation heterogeneity across different forest types, yet it still held considerable potential in high-resolution or multi-source data fusion scenarios.
Additionally, some studies indicated that the Support Vector Regression (SVR) algorithm can achieve high accuracy under specific data conditions (R2 = 0.80, RMSE = 8.00 Mg/ha). However, its performance is sensitive to sample size and feature complexity, and it performs poorly in certain forest types (R2 = 0.23, RMSE = 25.36 Mg/ha) [36], Moreover, the parameter tuning process is complex, limiting its widespread application.
In summary, the comprehensive comparison of the four algorithms revealed that the BP model suffers from overfitting and exhibited the weakest predictive performance. The CNN model showed potential in spatial feature extraction but lacked stability. The GBDT algorithm effectively captured nonlinear features and achieved high accuracy for certain forest types. Meanwhile, the RF algorithm emerged as the optimal choice for constructing a remote sensing estimation model for biomass in Hainan’s tropical rainforests, owing to its superior accuracy, robustness, and error control capabilities. This finding is consistent with recent studies published in 2024–2025, which report that Random Forest and other ensemble learning approaches exhibit strong performance and stability in forest biomass estimation when multi-source remote sensing data are used, especially under heterogeneous forest conditions [17,19]. In the ecological context of Hainan’s tropical rainforests—characterized by high structural heterogeneity, strong nonlinear interactions among climate, soil, and canopy variables, and limited field samples—the Random Forest algorithm is particularly effective because of its robustness to multicollinearity, noise, and overfitting, as well as its ability to capture complex variable interactions.
4.2. Environmental Mechanisms of Biomass Growth in the Hainan Tropical Rainforest National Park
This study conducted Pearson correlation analyses of forest biomass, climatic factors, population density, precipitation, PM2.5 concentration, potential evapotranspiration, and multiple soil properties within the Hainan Tropical Rainforest National Park to analyze the environmental mechanisms underlying biomass growth, rather than to serve as input variables for biomass modeling. The results encompassed correlations among diverse factors, including climatic conditions, environmental pollution, and soil physicochemical properties, offering insights into how environmental conditions regulate biomass accumulation.
Based on the results of Pearson correlation analysis (Figure 4), average annual population density showed no significant correlation with tropical forest biomass growth. This finding reflects the effectiveness of ecological conservation efforts in the Hainan Tropical Rainforest National Park, indicating relatively well-preserved forests with low human disturbance and minimal land-use changes. These conditions have effectively maintained the stability and integrity of the forest ecosystem. Additionally, average annual PM2.5 levels also showed no significant correlation with tropical forest biomass growth. This may be attributed to Hainan Island’s generally good air quality, with PM2.5 levels within the park ranging from 14.6 to 28.0 μg/m2. The negative impact of air pollution on forest growth in Hainan’s tropical rainforests was negligible, further highlighting the greater biomass accumulation potential of these forests in a low-pollution environment.
Figure 4.
Correlation analysis between influencing factors and the spatiotemporal evolution of biomass in tropical rainforests of Hainan. B represents the five-year increase in biomass, and the remaining variables include climatic (temperature, precipitation, PET), atmospheric (PM2.5), population density, and soil-related properties.
The average annual minimum temperature exhibited a highly significant negative correlation (p < 0.001) with tropical rainforest biomass growth. Simultaneously, the average annual maximum temperature also showed a highly significant negative correlation (p < 0.001) with tropical rainforest biomass growth. Research has indicated that tree growth had specific temperature requirements, typically thriving only in areas where the monthly average temperature exceeds 6 °C [68]. Excessively high temperatures may exceed the growth tolerance limits of certain trees, thereby restricting their growth [69]. Therefore, extreme temperature fluctuations are detrimental to carbon accumulation in Hainan’s tropical rainforests, whereas a moderate temperature environment is more conducive to carbon sequestration and storage within the ecosystem. This observation holds particular significance in the context of global climate change. Warming temperatures may have led to an increase in extreme temperature events, which could exacerbate fluctuations in carbon stocks and compromised the stability of tropical rainforest ecosystems.
There was a highly significant positive correlation (p < 0.001) between average annual rainfall and tropical forest biomass growth, indicating that adequate rainfall enhanced the forest’s carbon sequestration capacity [70]. Biomass in Hainan’s tropical rainforests increased with rising average annual rainfall [71]. This may have been achieved by increasing soil moisture and nutrient elements through precipitation [72]. Conversely, average annual potential evapotranspiration showed a highly significant negative correlation (p < 0.001) with biomass growth in Hainan’s tropical rainforests. This indicates that in areas with high potential evapotranspiration, water loss may have constrained both growth and carbon accumulation in these forests. In these areas, high evaporation rates lead to rapid soil moisture loss. Plants struggle to grow under insufficient water supply, impairing photosynthesis and root health, which in turn limit carbon sequestration. Furthermore, excessive soil moisture evaporation may cause soil salinization, further weakening plant growth capacity.
In addition to temperature and moisture controls, atmospheric CO2 fertilization represents an important large-scale driver influencing forest biomass dynamics. Although satellite remote sensing cannot directly quantify ecosystem-scale CO2 fertilization, it provides an effective means to indirectly monitor its impacts through vegetation functional and structural responses. Elevated atmospheric CO2 concentrations generally enhance photosynthetic efficiency and water-use efficiency by stimulating carboxylation while reducing stomatal conductance. These physiological processes can increase carbon assimilation, promote leaf area expansion, and facilitate canopy structural development, ultimately contributing to biomass accumulation.
Under favorable atmospheric conditions, such as sufficient precipitation and moderate temperatures, the positive effects of CO2 fertilization are more likely to be translated into observable biomass growth. In this study, long-term increases in satellite-derived vegetation indices, canopy height, and aboveground biomass can be interpreted as integrated ecosystem responses to multiple interacting drivers, including CO2 fertilization, climate variability, and site conditions. Remote sensing captures these responses by recording sustained changes in canopy greenness, vertical structure, and biomass over time. Recent studies have highlighted that satellite-based observations provide an effective means to assess ecosystem-scale biomass responses to interacting climatic drivers and atmospheric CO2 fertilization under changing environmental conditions [17,18].
However, the magnitude of the CO2 fertilization effect is strongly modulated by atmospheric and environmental constraints. High temperatures and elevated potential evapotranspiration may offset the benefits of increased CO2 by enhancing respiratory losses and inducing physiological stress, thereby limiting biomass accumulation. In tropical montane and cloud forest ecosystems, frequent cloud cover, complex topography, and strong microclimatic gradients further influence how CO2 fertilization interacts with local temperature and moisture regimes. Consequently, spatially heterogeneous biomass responses emerge, reflecting the combined effects of CO2 fertilization and climatic controls rather than the isolated influence of CO2 alone. Therefore, satellite-based observations represent the net ecosystem response to multiple atmospheric drivers, providing valuable insights into biomass growth dynamics under changing environmental conditions.
Regarding soil properties, the negative correlation between soil bulk density (0–30 cm) and tropical rainforest biomass growth indicates that soil bulk density served as an indicator of soil compaction. Higher soil bulk density may have led to tighter soil structure, restricting plant root development and consequently affecting water and nutrient uptake, thereby limiting plant growth and carbon sequestration. Cation exchange capacity (CEC) in soil is a crucial indicator for assessing soil fertility, representing a comprehensive reflection of soil’s physical and chemical properties. It directly reflects the soil’s capacity to retain, supply, and buffer cation nutrients, aiding in the analysis of soil’s ability to provide plant nutrients [73]. Soil compaction may also have led to insufficient oxygen supply to roots, inhibiting root respiration and organic matter decomposition. It reduces soil bulk density and maintains a loose soil structure, thereby promoting plant growth and carbon sequestration. Furthermore, the extremely significant positive correlation (p < 0.001) between soil porosity (0–30 cm) and tropical rainforest biomass growth underscores the importance of good soil structure for carbon sequestration.
Generally, soils with higher cation exchange capacity retain readily available nutrients more effectively, while lower exchange capacity indicates weaker nutrient retention capacity. The positive correlation between soil cation exchange capacity (0–30 cm) and tropical rainforest biomass growth reflects the positive role of soil nutrient retention capacity in biomass growth. Soil acidity and metallic elements can influence carbon storage and release in forests by affecting the stability of soil organic matter (SOM) [74]. Soil pH values across different soil layers showed a highly significant negative correlation (p < 0.001) with biomass growth in tropical rainforests. Soil pH directly influences nutrient availability and microbial activity within the soil. The soil pH range in the Hainan Tropical Rainforest National Park was relatively low, spanning from 5 to 6.76 (slightly acidic to neutral). This soil environment was suitable for many tropical plants, as most species thrive in slightly acidic to weakly alkaline soils [75]. Research indicated that maintaining soil PH within an optimal range helps preserve the stability of soil organic matter (SOM), thereby influencing forest biomass growth and carbon storage. Excessively high or low soil acidity may reduce the availability of certain nutrients, affecting plant growth and consequently inhibiting carbon accumulation.
Regarding soil texture, soil clay content (0–30 cm) and soil silt content (0–30 cm) showed extremely significant positive correlations (p < 0.001) with tropical rainforest biomass growth, while soil sand content (0–30 cm) exhibited extremely significant negative correlations (p < 0.001) with tropical rainforest biomass growth. Clay and silt possess superior water retention capacity, maintaining soil moisture for extended periods, thereby promoting plant growth and carbon sequestration. In contrast, sandy soils exhibit poor water retention, leading to rapid moisture evaporation that impedes plant growth and limits carbon accumulation.
Soil organic carbon content (0–30 cm) showed a highly significant positive correlation (p < 0.001) with tropical rainforest biomass growth. This indicates that enhancing soil organic matter content is crucial for biomass increase, and boosting soil organic matter is one of the key measures for enhancing carbon sequestration capacity. Increased soil organic carbon contributes to improved soil fertility and structure, thereby promoting plant growth and carbon storage. Total soil potassium content (0–30 cm) showed a significant correlation with biomass growth (p < 0.05), while total soil nitrogen content (0–30 cm) and total soil phosphorus content (0–30 cm) both exhibited extremely significant positive correlations with biomass growth (p < 0.001). Adequate soil nitrogen, phosphorus, and potassium nutrients play a crucial role in enhancing tropical rainforest biomass growth capacity. These nutrients were essential for plant growth and photosynthesis. Sufficient nitrogen, phosphorus, and potassium promotes plant growth and development, increases photosynthetic efficiency, and boosts biomass growth, thereby enhancing carbon fixation and storage. Furthermore, adequate soil nitrogen, phosphorus, and potassium supply increases soil organic matter accumulation and stimulates microbial activity, thereby further enhancing soil carbon storage capacity.
From the perspective of ecological restoration, biomass accumulation under different climatic conditions in Hainan’s tropical rainforests results from the integrated effects of climate regulation, soil improvement, forest structural development, and long-term conservation measures. Under favorable climatic conditions characterized by adequate precipitation and moderate temperature, ecological restoration enhances biomass growth by promoting photosynthesis, accelerating canopy closure, and improving nutrient cycling efficiency. In contrast, under climatic stress such as elevated temperature or high potential evapotranspiration, restoration outcomes depend more strongly on soil structure, water-holding capacity, and microclimatic buffering, which together enhance ecosystem resilience and stabilize carbon storage.
The pronounced spatial heterogeneity of carbon accumulation observed in this study further reflects a nonlinear relationship between forest area and carbon storage capacity. Regions with relatively smaller spatial extent but higher biomass density often correspond to mature or late-successional forests with complex vertical structure, large tree size, and long carbon residence time. As shown by the subdistrict-level results (Table 5), areas such as Yinggeling and Jianfengling exhibit disproportionately high biomass density and carbon stocks despite differences in forest area. This pattern can be attributed to long-term strict protection, reduced anthropogenic disturbance, favorable topographic and climatic conditions, and advanced successional stages, which jointly promote efficient carbon accumulation per unit area.
At the global scale, long-term studies of tropical rainforests have generally reported increasing biomass and carbon stocks under effective protection, accompanied by localized declines in montane or cloud forest ecosystems due to climatic stress and disturbance sensitivity [76]. The biomass and carbon stock trends observed in Hainan are consistent with these global patterns, showing overall carbon accumulation alongside post-2013 declines in tropical montane cloud forests. This consistency suggests that Hainan’s tropical rainforests respond to climate variability and ecological protection in ways comparable to other tropical rainforest regions worldwide.
Therefore, carbon sequestration capacity is not solely determined by forest area, but by the combined effects of biomass density, structural maturity, ecological stability, and restoration history. Small but high-biomass regions can contribute disproportionately to regional carbon stocks and should be prioritized in ecological restoration and conservation strategies under changing climatic conditions.
Overall, biomass growth and carbon accumulation in Hainan’s tropical rainforests are governed by the integrated effects of climatic conditions, soil properties, forest structural development, and ecological restoration, resulting in pronounced spatial heterogeneity and disproportionately high carbon storage in mature, high-biomass forest regions. Optimal temperature, precipitation, soil structure, and nutrient content promote biomass growth in tropical rainforests, enhancing their carbon sink capacity. Conversely, extreme temperatures, excessively high potential evapotranspiration, soil compaction, and nutrient-poor soils limit carbon sequestration. Moving forward, in the context of climate change mitigation, protecting and managing tropical rainforest ecosystems should focus on the integrated regulation of factors such as temperature, precipitation, and soil quality to enhance their carbon sink capacity. Particularly as global climate change intensifies, implementing measures to reduce temperature fluctuations, stabilize precipitation, and optimize soil nutrient and water management would help increase the carbon storage potential of tropical rainforest ecosystems. This would facilitate their transition into powerful carbon sinks and strengthen their capacity to address climate change.
4.3. Spatial Drivers of Vigorous and Reduced Forest Growth
Marked spatial differences in forest growth intensity were observed across the study area, with particularly vigorous biomass accumulation occurring in Yinggeling, Jianfengling, and Bawangling. These differences reflect the combined influences of biophysical conditions, forest structural development, and long-term management regimes, which together regulate carbon uptake and storage efficiency at the regional scale.
The most vigorous forest growth in Yinggeling, Jianfengling, and Bawangling can be attributed to a favorable energy–water balance, complex topography, advanced successional stages, and sustained protection from anthropogenic disturbance. These mountainous regions receive high annual precipitation while experiencing moderate temperature regimes and relatively low potential evapotranspiration, creating conditions that support continuous photosynthetic activity and long growing seasons. Orographic effects associated with complex terrain enhance moisture availability and reduce thermal and evaporative stress, thereby stabilizing canopy energy balance and lowering vapor pressure deficit. From a structural perspective, forests in these regions are dominated by mature and late-successional stands with tall canopies, high vertical complexity, and large woody biomass pools, enabling disproportionately high carbon accumulation per unit area. Long-term conservation policies in these areas further promote biomass stability by minimizing disturbance and allowing uninterrupted forest development and extended carbon residence times.
In contrast, regions exhibiting relatively reduced forest growth are generally characterized by stronger climatic stress, soil limitations, and higher levels of historical or ongoing human influence. Elevated temperatures and potential evapotranspiration, coupled with lower or more variable moisture availability, constrain photosynthetic efficiency and carbon allocation to woody biomass. In addition, soil physical and nutrient limitations restrict root development and resource uptake, further suppressing biomass accumulation, particularly in fragmented or previously disturbed forests. To address these constraints, ecological restoration and management strategies implemented or recommended in these regions emphasize reducing anthropogenic disturbance, promoting natural regeneration, enhancing forest connectivity, and improving site conditions through soil and water conservation measures. Long-term monitoring using remote sensing provides an effective means to track recovery trajectories and evaluate the effectiveness of these strategies in gradually enhancing biomass accumulation and ecosystem resilience.
5. Conclusions
This study developed a remote sensing-based biomass estimation model for Hainan’s tropical rainforests using machine learning algorithms. It integrated multi-temporal remote sensing data (Landsat imagery and environmental variables) with ground plot observations. Results indicate that multi-source data fusion and structural parameter incorporation significantly enhanced model accuracy and stability, with the Random Forest (RF) algorithm demonstrating optimal performance in biomass estimation. From 2003 to 2023, forest biomass in the Hainan Tropical Rainforest National Park exhibited an overall upward trend, with biomass density ranging from 19.71 Mg/ha to 554.55 Mg/ha. Tropical lowland rainforests and tropical seasonal forests demonstrated the most pronounced growth. Concurrently, forest carbon stocks increased from 29.03 TgC to 42.47 TgC, representing a 46.36% rise, indicating robust ecosystem recovery and enhanced carbon sink capacity in the region. Forest biomass changes were driven by multiple environmental factors: ample precipitation favored growth, while extreme temperature fluctuations and high potential evapotranspiration suppressed carbon accumulation. Conversely, favorable soil structure and sufficient nutrient availability promoted carbon sequestration. Biomass growth was relatively slower in some marginal areas, potentially related to differences in land-use history and micro-topographic climatic conditions. This study integrated multi-source remote sensing data with machine learning approaches to investigate the spatiotemporal dynamics of forest biomass in Hainan’s tropical rainforests. Among the tested machine learning algorithms, the Random Forest model consistently demonstrated the best overall performance, achieving higher accuracy and stability in canopy height inversion and aboveground biomass estimation. Its strong capability to handle nonlinear relationships and complex interactions among climatic, atmospheric, and soil variables makes it particularly suitable for biomass modeling in structurally heterogeneous tropical forest environments.
By applying the optimal Random Forest framework with multimodal remote sensing data across multiple analytical branches, including biomass estimation, spatial pattern analysis, and temporal change assessment, this study provides a robust basis for understanding forest growth dynamics and carbon accumulation processes. The results highlight that high-biomass regions with favorable biophysical conditions and long-term protection exhibit disproportionately strong carbon sequestration capacity. Furthermore, the findings suggest that forest management strategies should be differentiated according to ecosystem type. Tropical montane cloud forests, which exhibit higher sensitivity to climatic variability and recent biomass declines, require strengthened protection and targeted monitoring, whereas tropical lowland rainforests with sustained biomass accumulation can benefit from long-term conservation and stable management practices. Overall, the proposed machine learning-based framework offers a reliable and scalable approach for high-resolution forest biomass monitoring and supports improved ecological management and carbon sink assessment under changing environmental conditions.
Author Contributions
Conceptualization, Z.Q.; methodology, Z.L., Q.L. and Z.Q.; software, Z.L.; validation, Z.L., Q.L., W.Z., Z.F. and H.P.; formal analysis, Z.L., Q.L. and Z.Q.; investigation, Z.L.; resources, Z.Q.; data curation, Z.L., Q.L. and Z.F.; writing—original draft preparation, Z.L. and Q.L.; writing—review and editing, Z.L. and Z.Q.; visualization, Z.L., Q.L. and W.Z.; supervision, Z.Q. and P.G.; project administration, Z.Q.; funding acquisition, Z.Q. All authors have read and agreed to the published version of the manuscript.
Funding
This research was funded by “National Natural Science Foundation of China, grant number 32160364”.
Data Availability Statement
The data presented in this study are openly available in https://figshare.com/articles/dataset/The_spatio-temporal_evolution_law_of_biomass_in_Hainan_Tropical_rainforest_based_on_the_fusion_of_multimodal_temporal_remote_sensing_data_2003_-_2023_/29149736 (accessed on 1 December 2025).
Acknowledgments
The authors thank those students who assisted with fieldwork and data collection, and instructors for their constructive comments on the improvement of this study.
Conflicts of Interest
The authors declare no conflicts of interest.
Nomenclature
| AGB | Aboveground biomass |
| BP | Backpropagation neural network |
| CNN | Convolutional neural network |
| RF | Random forest |
| GBDT | Gradient boosting decision tree |
| KNN | K-nearest neighbors |
| SVM | Support vector machine |
| SVR | Support vector regression |
| SGDM | Stochastic gradient descent with momentum |
| Adam | Adaptive moment estimation |
| LiDAR | Light detection and ranging |
| SAR | Synthetic aperture radar |
| DEM | Digital elevation model |
| GEDI | Global Ecosystem Dynamics Investigation |
| ICESat-2 | Ice, Cloud, and land Elevation Satellite-2 |
| GLCM | Gray-Level co-occurrence matrix |
| TM | Thematic Mapper |
| OLI | Operational Land Imager |
| MODIS | Moderate Resolution Imaging Spectroradiometer |
| NDVI | Normalized difference vegetation index |
| LAI | Leaf area index |
| R2 | Coefficient of determination |
| RMSE | Root mean square error |
| RRMSE | Relative root mean square error |
| RMSD | Root mean square deviation |
| Bias | Mean bias error |
| Tmin | Mean annual minimum temperature |
| Tmax | Mean annual maximum temperature |
| Precip | Mean annual precipitation |
| PET | Potential evapotranspiration |
| PopDens | Population density |
| PM2.5 | Fine particulate matter with aerodynamic diameter ≤ 2.5 μm |
| SOC | Soil organic carbon |
| CEC | Cation exchange capacity |
| SBD | Soil bulk density |
| TN | Total nitrogen |
| TP | Total phosphorus |
| TK | Total potassium |
| pH | Soil pH value (0–5, 5–15, and 15–30 cm) |
Appendix A
Samples were collected from tree trunks and canopy sections using electric growth cones, yielding 140 sample plots encompassing 169 tree species. The biomass densities of the trunks and canopies of these species were measured. Detailed data on the biomass density of each component for all 169 tree species are provided in Appendix A.
Table A1.
The biomass density of each component of 169 tree species.
References
- Ledo, A.; Illian, J.B.; Schnitzer, S.A.; Wright, S.J.; Dalling, J.W.; Burslem, D.F. Lianas and soil nutrients predict fine-scale distribution of above-ground biomass in a tropical moist forest. J. Ecol. 2016, 104, 1819–1828. [Google Scholar] [CrossRef] [Scilit]
- Zhang, C.; Li, Z.; Zhang, X.; Ma, L. Carbon Sink Calculation and Time Variation in Hainan Tropical Rainforest National Park—A Case Study of Diaoluo Mountain Forest Area. J. Phys. Conf. Ser. 2020, 1637, 012002. [Google Scholar] [CrossRef] [Scilit]
- Pi, Z.; Wang, X.; Zang, Z.; Song, X.; Zhou, G.; Guo, H.; BaoYin, M.; Zhao, H.; Li, Z.; Qiu, Z. Spatiotemporal Variation in Carbon Sequestration in the Forest Ecosystem of Hainan Island over a 30-Year Period and Its Driving Factors. 2024. Available online: https://www.researchsquare.com/article/rs-4105908/v1 (accessed on 21 December 2025).
- Lei, J.; Zhang, L.; Chen, Z.; Wu, T.; Chen, X.; Li, Y. The impact of land use change on carbon storage and multi-scenario prediction in Hainan Island using InVEST and CA-Markov models. Front. For. Glob. Change 2024, 7, 1349057. [Google Scholar] [CrossRef] [Scilit]
- Cheng, Y.; Shao, X.; Long, W.; Li, C. Distribution Patterns of Aboveground Biomass of Tropical Cloud Forests in Hainan Island. In Tropical Cloud Forest Ecology in Hainan Island; Cheng, Y., Shao, X., Long, W., Li, C., Eds.; Springer: Berlin/Heidelberg, Germany, 2022; pp. 129–138. [Google Scholar]
- Tang, X.-G.; Liu, D.-W.; Wang, Z.-M.; Jia, M.-M.; Dong, Z.-Y. Estimation of forest aboveground biomass based on remote sensing data: A review. Chin. J. Ecol. 2012, 31, 1311. [Google Scholar]
- Chave, J.; Réjou-Méchain, M.; Búrquez, A.; Chidumayo, E.; Colgan, M.S.; Delitti, W.B.; Duque, A.; Eid, T.; Fearnside, P.M.; Goodman, R.C. Improved allometric models to estimate the aboveground biomass of tropical trees. Glob. Change Biol. 2014, 20, 3177–3190. [Google Scholar] [CrossRef] [Scilit]
- Kenzo, T.; Furutani, R.; Hattori, D.; Kendawang, J.J.; Tanaka, S.; Sakurai, K.; Ninomiya, I. Allometric equations for accurate estimation of above-ground biomass in logged-over tropical rainforests in Sarawak, Malaysia. J. For. Res. 2009, 14, 365–372. [Google Scholar] [CrossRef] [Scilit]
- Ketterings, Q.M.; Coe, R.; van Noordwijk, M.; Palm, C.A. Reducing uncertainty in the use of allometric biomass equations for predicting above-ground tree biomass in mixed secondary forests. For. Ecol. Manag. 2001, 146, 199–209. [Google Scholar] [CrossRef] [Scilit]
- Cartus, O.; Santoro, M.; Kellndorfer, J. Mapping forest aboveground biomass in the Northeastern United States with ALOS PALSAR dual-polarization L-band. Remote Sens. Environ. 2012, 124, 466–478. [Google Scholar] [CrossRef] [Scilit]
- Lu, D.; Chen, Q.; Wang, G.; Liu, L.; Li, G.; Moran, E. A survey of remote sensing-based aboveground biomass estimation methods in forest ecosystems. Int. J. Digit. Earth 2016, 9, 63–105. [Google Scholar] [CrossRef] [Scilit]
- Zhang, R.; Zhou, X.; Ouyang, Z.; Avitabile, V.; Qi, J.; Chen, J.; Giannico, V. Estimating aboveground biomass in subtropical forests of China by integrating multisource remote sensing and ground data. Remote Sens. Environ. 2019, 232, 111341. [Google Scholar] [CrossRef] [Scilit]
- Palace, M.; Sullivan, F.B.; Ducey, M.; Herrick, C. Estimating tropical forest structure using a terrestrial lidar. PLoS ONE 2016, 11, e0154115. [Google Scholar] [CrossRef] [Scilit]
- Zhang, Z.; Cao, L.; She, G. Estimating forest structural parameters using canopy metrics derived from airborne LiDAR data in subtropical forests. Remote Sens. 2017, 9, 940. [Google Scholar] [CrossRef] [Scilit]
- Zhou, X.; Li, C. Mapping the vertical forest structure in a large subtropical region using airborne LiDAR data. Ecol. Indic. 2023, 154, 110731. [Google Scholar] [CrossRef] [Scilit]
- Liang, M.; Duncanson, L.; Silva, J.A.; Sedano, F. Quantifying aboveground biomass dynamics from charcoal degradation in Mozambique using GEDI Lidar and Landsat. Remote Sens. Environ. 2023, 284, 113367. [Google Scholar] [CrossRef] [Scilit]
- Nguyen, A.; Saha, S. Machine Learning and Multi-source Remote Sensing in Forest Carbon Stock Estimation: A Review. arXiv 2024, arXiv:2411.17624. [Google Scholar] [CrossRef] [Scilit]
- Wang, E.; Huang, T.; Liu, Z.; Bao, L.; Guo, B.; Yu, Z.; Feng, Z.; Luo, H.; Ou, G. Improving Forest Above-Ground Biomass Estimation Accuracy Using Multi-Source Remote Sensing and Optimized Least Absolute Shrinkage and Selection Operator Variable Selection Method. Remote Sens. 2024, 16, 4497. [Google Scholar] [CrossRef] [Scilit]
- Saim, A.A.; Aly, M.H. Machine learning and multisensor data fusion for forest above ground biomass estimation in Arkansas. Earth Syst. Environ. 2025; in press.
- Toraño Caicoya, A.; Kugler, F.; Pretzsch, H.; Papathanassiou, K. Forest vertical structure characterization using ground inventory data for the estimation of forest aboveground biomass. Can. J. For. Res. 2016, 46, 25–38. [Google Scholar] [CrossRef] [Scilit]
- Fischer, R.; Knapp, N.; Bohn, F.; Shugart, H.H.; Huth, A. The relevance of forest structure for biomass and productivity in temperate forests: New perspectives for remote sensing. Surv. Geophys. 2019, 40, 709–734. [Google Scholar] [CrossRef] [Scilit]
- Haq, S.M.; Rashid, I.; Waheed, M.; Khuroo, A.A. From forest floor to tree top: Partitioning of biomass and carbon stock in multiple strata of forest vegetation in Western Himalaya. Environ. Monit. Assess. 2023, 195, 812. [Google Scholar] [CrossRef] [Scilit]
- Jiang, F.; Zhao, F.; Ma, K.; Li, D.; Sun, H. Mapping the forest canopy height in Northern China by synergizing ICESat-2 with Sentinel-2 using a stacking algorithm. Remote Sens. 2021, 13, 1535. [Google Scholar] [CrossRef] [Scilit]
- Lee, W.-J.; Lee, C.-W. Forest canopy height estimation using multiplatform remote sensing dataset. J. Sens. 2018, 2018, 1593129. [Google Scholar] [CrossRef] [Scilit]
- Li, W.; Niu, Z.; Shang, R.; Qin, Y.; Wang, L.; Chen, H. High-resolution mapping of forest canopy height using machine learning by coupling ICESat-2 LiDAR with Sentinel-1, Sentinel-2 and Landsat-8 data. Int. J. Appl. Earth Obs. Geoinf. 2020, 92, 102163. [Google Scholar] [CrossRef] [Scilit]
- Shah, S.A.A.; Manzoor, M.A.; Bais, A. Canopy height estimation at Landsat resolution using convolutional neural networks. Mach. Learn. Knowl. Extr. 2020, 2, 3. [Google Scholar] [CrossRef] [Scilit]
- Wang, M.; Sun, R.; Xiao, Z. Estimation of forest canopy height and aboveground biomass from spaceborne LiDAR and Landsat imageries in Maryland. Remote Sens. 2018, 10, 344. [Google Scholar] [CrossRef] [Scilit]
- Tian, X.; Yan, M.; van der Tol, C.; Li, Z.; Su, Z.; Chen, E.; Li, X.; Li, L.; Wang, X.; Pan, X. Modeling forest above-ground biomass dynamics using multi-source data and incorporated models: A case study over the qilian mountains. Agric. For. Meteorol. 2017, 246, 1–14. [Google Scholar] [CrossRef] [Scilit]
- Wang, X.; Liu, C.; Lv, G.; Xu, J.; Cui, G. Integrating multi-source remote sensing to assess forest aboveground biomass in the Khingan mountains of north-eastern China using machine-learning algorithms. Remote Sens. 2022, 14, 1039. [Google Scholar] [CrossRef] [Scilit]
- Saarela, S.; Holm, S.; Grafström, A.; Schnell, S.; Næsset, E.; Gregoire, T.G.; Nelson, R.F.; Ståhl, G. Hierarchical model-based inference for forest inventory utilizing three sources of information. Ann. For. Sci. 2016, 73, 895–910. [Google Scholar] [CrossRef] [Scilit]
- Eckert, S. Improved forest biomass and carbon estimations using texture measures from WorldView-2 satellite data. Remote Sens. 2012, 4, 810–829. [Google Scholar] [CrossRef] [Scilit]
- Adnan, S.; Maltamo, M.; Mehtätalo, L.; Ammaturo, R.N.; Packalen, P.; Valbuena, R. Determining maximum entropy in 3D remote sensing height distributions and using it to improve aboveground biomass modelling via stratification. Remote Sens. Environ. 2021, 260, 112464. [Google Scholar] [CrossRef] [Scilit]
- Evans, J.S.; Cushman, S.A. Gradient modeling of conifer species using random forests. Landsc. Ecol. 2009, 24, 673–683. [Google Scholar] [CrossRef] [Scilit]
- Tian, X.; Li, J.; Zhang, F.; Zhang, H.; Jiang, M. Forest Aboveground Biomass Estimation Using Multisource Remote Sensing Data and Deep Learning Algorithms: A Case Study over Hangzhou Area in China. Remote Sens. 2024, 16, 1074. [Google Scholar] [CrossRef] [Scilit]
- Hu, T.; Su, Y.; Xue, B.; Liu, J.; Zhao, X.; Fang, J.; Guo, Q. Mapping global forest aboveground biomass with spaceborne LiDAR, optical imagery, and forest inventory data. Remote Sens. 2016, 8, 565. [Google Scholar] [CrossRef] [Scilit]
- Song, J.; Duan, X.; Wu, J.; Ma, B.; Liu, X. Comparative Analysis of Machine Learning Algorithms and Scales for Estimating Boreal Forest Above Ground Biomass in the Qilian Mountains, China. 2023. Available online: https://www.researchsquare.com/article/rs-3448183/v1 (accessed on 21 December 2025).
- Zhang, D.; Ni, H. Inversion of Forest Biomass Based on Multi-Source Remote Sensing Images. Sensors 2023, 23, 9313. [Google Scholar] [CrossRef] [Scilit]
- López-Serrano, P.M.; Cárdenas Domínguez, J.L.; Corral-Rivas, J.J.; Jiménez, E.; López-Sánchez, C.A.; Vega-Nieva, D.J. Modeling of aboveground biomass with Landsat 8 OLI and machine learning in temperate forests. Forests 2019, 11, 11. [Google Scholar] [CrossRef] [Scilit]
- Ling, Q.; Chen, Y.; Feng, Z.; Pei, H.; Wang, C.; Yin, Z.; Qiu, Z. Monitoring Canopy Height in the Hainan Tropical Rainforest Using Machine Learning and Multi-Modal Data Fusion. Remote Sens. 2025, 17, 966. [Google Scholar] [CrossRef] [Scilit]
- Zhang, X.; Zhao, T.; Xu, H.; Liu, W.; Wang, J.; Chen, X.; Liu, L. GLC_FCS30D: The first global 30 m land-cover dynamics monitoring product with a fine classification system for the period from 1985 to 2022 generated using dense-time-series Landsat imagery and the continuous change-detection method. Earth Syst. Sci. Data 2024, 16, 1353–1381. [Google Scholar] [CrossRef] [Scilit]
- Jiankang, S.; Chen, G.; Xinwu, L.; Xiangxing, W.; Zhongchang, S. Classification of Hainan Island natural forests based on multi-source remote sensing data. China Sci. Data 2019, 4, 40. [Google Scholar] [CrossRef] [Scilit]
- Shouzhang, P. 1-km Monthly Precipitation Dataset for China (1901–2023). National Tibetan Plateau/Third Pole Environment Data Center, Dataset. 2024. Available online: https://zenodo.org/records/3114194 (accessed on 15 November 2024).
- Shouzhang, P. 1-km Monthly Maximum Temperature Dataset for China (1901–2023). National Tibetan Plateau/Third Pole Environment Data Center, Dataset. 2024. Available online: https://zenodo.org/records/3185722 (accessed on 15 November 2024).
- Shouzhang, P. 1-km Monthly Potential Evapotranspiration Dataset for China (1901–2023). National Tibetan Plateau/Third Pole Environment Data Center, Dataset. 2024. Available online: https://loess.geodata.cn/data/datadetails.html?dataguid=34595274939620&docid=74 (accessed on 15 November 2024).
- Shouzhang, P. 1-km Monthly Minimum Temperature Dataset for China (1901–2023). National Tibetan Plateau/Third Pole Environment Data Center, Dataset. 2024. Available online: https://zenodo.org/records/3185722 (accessed on 15 November 2024).
- Shangguan, W.; Shi, G.S. A China Dataset of Soil Properties for Land Surface Modeling (Version 2, CSDLv2). National Tibetan Plateau/Third Pole Environment Data Center, Dataset. 2024. Available online: https://data.tpdc.ac.cn/en/data/46ddd893-3b2b-4bb3-b9e6-b043f3c5c3a2 (accessed on 15 November 2024).
- Huete, A.R.; Liu, H.Q. An error and sensitivity analysis of the atmospheric-and soil-correcting variants of the NDVI for the MODIS-EOS. IEEE Trans. Geosci. Remote Sens. 1994, 32, 897–905. [Google Scholar] [CrossRef] [Scilit]
- Tucker, C.J. Red and photographic infrared linear combinations for monitoring vegetation. Remote Sens. Environ. 1979, 8, 127–150. [Google Scholar] [CrossRef] [Scilit]
- Huete, A.; Didan, K.; Miura, T.; Rodriguez, E.P.; Gao, X.; Ferreira, L.G. Overview of the radiometric and biophysical performance of the MODIS vegetation indices. Remote Sens. Environ. 2002, 83, 195–213. [Google Scholar] [CrossRef] [Scilit]
- Gitelson, A.A.; Kaufman, Y.J.; Merzlyak, M.N. Use of a green channel in remote sensing of global vegetation from EOS-MODIS. Remote Sens. Environ. 1996, 58, 289–298. [Google Scholar] [CrossRef] [Scilit]
- Wu, W. The generalized difference vegetation index (GDVI) for dryland characterization. Remote Sens. 2014, 6, 1211–1233. [Google Scholar] [CrossRef] [Scilit]
- Gitelson, A.A.; Merzlyak, M.N. Remote sensing of chlorophyll concentration in higher plant leaves. Adv. Space Res. 1998, 22, 689–692. [Google Scholar] [CrossRef] [Scilit]
- Sripada, R.P.; Heiniger, R.W.; White, J.G.; Meijer, A.D. Aerial color infrared photography for determining early in-season nitrogen requirements in corn. Agron. J. 2006, 98, 968–977. [Google Scholar] [CrossRef] [Scilit]
- Crippen, R.E. Calculating the vegetation index faster. Remote Sens. Environ. 1990, 34, 71–73. [Google Scholar] [CrossRef] [Scilit]
- Boegh, E.; Soegaard, H.; Broge, N.; Hasager, C.; Jensen, N.; Schelde, K.; Thomsen, A. Airborne multispectral data for quantifying leaf area index, nitrogen concentration, and photosynthetic efficiency in agriculture. Remote Sens. Environ. 2002, 81, 179–193. [Google Scholar] [CrossRef] [Scilit]
- Gong, P.; Pu, R.; Biging, G.S.; Larrieu, M.R. Estimation of forest leaf area index using vegetation indices derived from Hyperion hyperspectral data. IEEE Trans. Geosci. Remote Sens. 2003, 41, 1355–1362. [Google Scholar] [CrossRef] [Scilit]
- Chen, J.M. Evaluation of vegetation indices and a modified simple ratio for boreal applications. Can. J. Remote Sens. 1996, 22, 229–242. [Google Scholar] [CrossRef] [Scilit]
- Rondeaux, G.; Steven, M.; Baret, F. Optimization of soil-adjusted vegetation indices. Remote Sens. Environ. 1996, 55, 95–107. [Google Scholar] [CrossRef] [Scilit]
- Roujean, J.-L.; Breon, F.-M. Estimating PAR absorbed by vegetation from bidirectional reflectance measurements. Remote Sens. Environ. 1995, 51, 375–384. [Google Scholar] [CrossRef] [Scilit]
- Towers, P.C.; Strever, A.; Poblete-Echeverría, C. Comparison of vegetation indices for leaf area index estimation in vertical shoot positioned vine canopies with and without grenbiule hail-protection netting. Remote Sens. 2019, 11, 1073. [Google Scholar] [CrossRef] [Scilit]
- Jordan, C.F. Derivation of leaf-area index from quality of light on the forest floor. Ecology 1969, 50, 663–666. [Google Scholar] [CrossRef] [Scilit]
- Huete, A.R. A soil-adjusted vegetation index (SAVI). Remote Sens. Environ. 1988, 25, 295–309. [Google Scholar] [CrossRef] [Scilit]
- Gitelson, A.; Stark, R.; Grits, U.; Rundquist, D.; Kaufman, Y.; Derry, D. Vegetation and soil lines in visible spectral space: A concept and technique for remote estimation of vegetation fraction. Int. J. Remote Sens. 2002, 23, 2537–2562. [Google Scholar] [CrossRef] [Scilit]
- Haralick, R.M.; Shanmugam, K.; Dinstein, I.H. Textural features for image classification. IEEE Trans. Syst. Man Cybern. 1973, SMC-3, 610–621. [Google Scholar] [CrossRef] [Scilit]
- Qiu, Z.; Feng, Z.; Jiang, J.; Lin, Y.; Xue, S. Application of a Continuous Terrestrial Photogrammetric Measurement System for Plot Monitoring in the Beijing Songshan National Nature Reserve. Remote Sens. 2018, 10, 1080. [Google Scholar] [CrossRef] [Scilit]
- Ghosh, S.M.; Behera, M.D.; Paramanik, S. Canopy Height Estimation Using Sentinel Series Images through Machine Learning Models in a Mangrove Forest. Remote Sens. 2020, 12, 1519. [Google Scholar] [CrossRef] [Scilit]
- Ghosh, S.M.; Behera, M.D. Aboveground biomass estimation using multi-sensor data synergy and machine learning algorithms in a dense tropical forest. Appl. Geogr. 2018, 96, 29–40. [Google Scholar] [CrossRef] [Scilit]
- Körner, C. A re-assessment of high elevation treeline positions and their explanation. Oecologia 1998, 115, 445–459. [Google Scholar] [CrossRef] [Scilit]
- Hatfield, J.L.; Prueger, J.H. Temperature extremes: Effect on plant growth and development. Weather Clim. Extrem. 2015, 10, 4–10. [Google Scholar] [CrossRef] [Scilit]
- Hilker, T.; Lyapustin, A.I.; Tucker, C.J.; Hall, F.G.; Myneni, R.B.; Wang, Y.; Bi, J.; Mendes de Moura, Y.; Sellers, P.J. Vegetation dynamics and rainfall sensitivity of the Amazon. Proc. Natl. Acad. Sci. USA 2014, 111, 16041–16046. [Google Scholar] [CrossRef] [Scilit] [PubMed]
- Tang, X.; Zhao, X.; Bai, Y.; Tang, Z.; Wang, W.; Zhao, Y.; Wan, H.; Xie, Z.; Shi, X.; Wu, B. Carbon pools in China’s terrestrial ecosystems: New estimates based on an intensive field survey. Proc. Natl. Acad. Sci. USA 2018, 115, 4021–4026. [Google Scholar] [CrossRef] [Scilit] [PubMed]
- Chen, B.; Yun, T.; Ma, J.; Kou, W.; Li, H.; Yang, C.; Xiao, X.; Zhang, X.; Sun, R.; Xie, G. High-precision stand age data facilitate the estimation of rubber plantation biomass: A case study of Hainan Island, China. Remote Sens. 2020, 12, 3853. [Google Scholar] [CrossRef] [Scilit]
- Aprile, F.; Lorandi, R. Evaluation of cation exchange capacity (CEC) in tropical soils using four different analytical methods. J. Agric. Sci. 2012, 4, 278. [Google Scholar] [CrossRef] [Scilit]
- Mulder, J.; De Wit, H.A.; Boonen, H.W.; Bakken, L.R. Increased levels of aluminium in forest soils: Effects on the stores of soil organic carbon. In Proceedings of the Acid rain 2000. In Volume III/III Conference Statement Plenary and Keynote Papers, Proceedings of the 6th International Conference on Acidic Deposition: Looking Back to the Past and Thinking of the Future, Tsukuba, Japan, 10–16 December 2000; Kluwer Academic Publishers: Dordrecht, The Netherlands, 2001; pp. 989–994. [Google Scholar]
- Truog, E. Soil acidity: I. Its relation to the growth of plants. Soil Sci. 1918, 5, 169–196. [Google Scholar] [CrossRef] [Scilit]
- Zhong, J.; Cui, L.; Deng, Z.; Zhang, Y.; Lin, J.; Guo, G.; Zhang, X. Long-term effects of ecological restoration projects on ecosystem services and their spatial interactions: A case study of Hainan tropical forest park in China. Environ. Manag. 2024, 73, 493–508. [Google Scholar] [CrossRef] [Scilit] [PubMed]
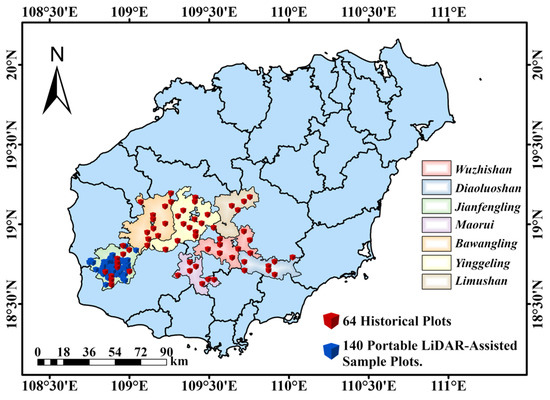
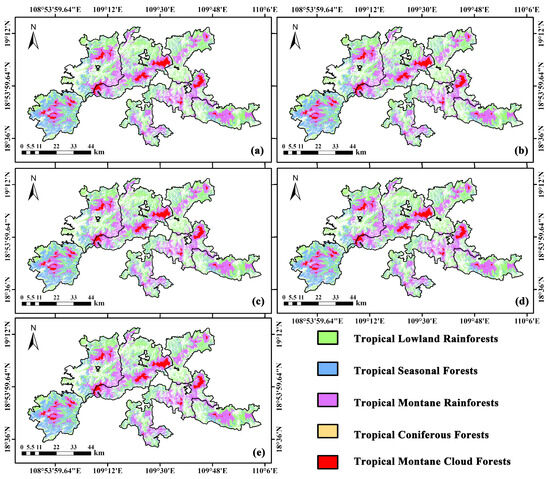
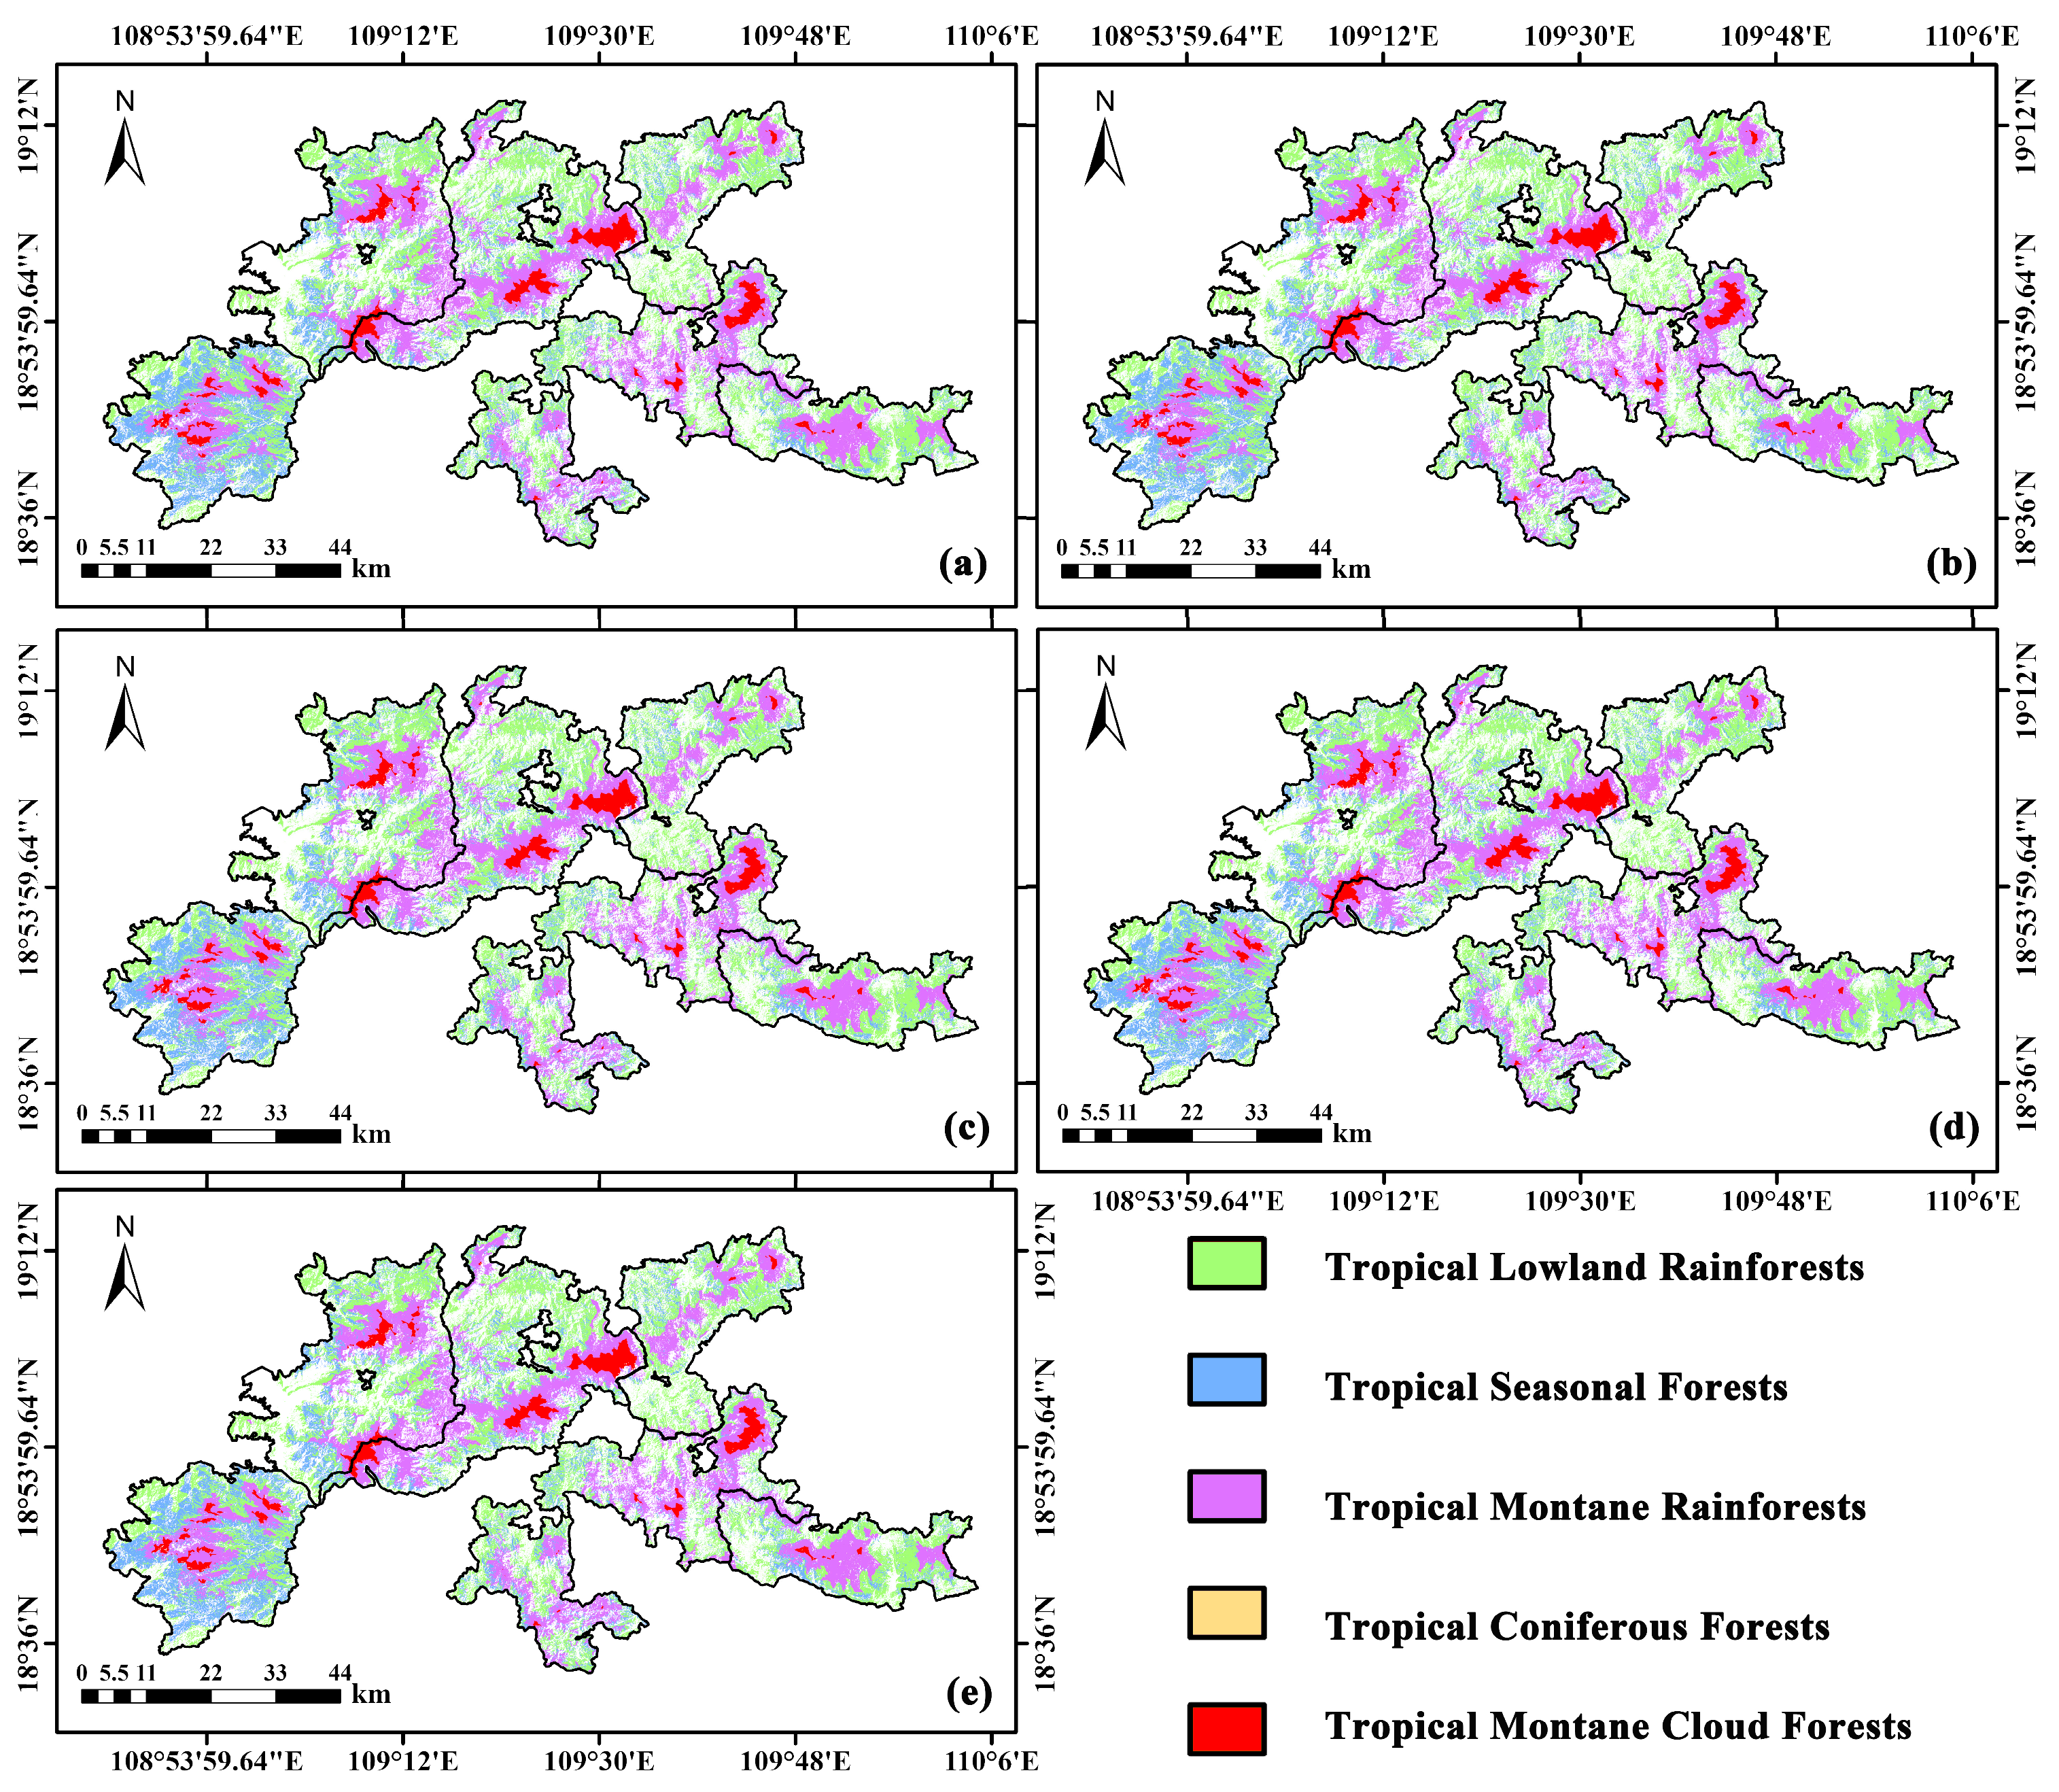
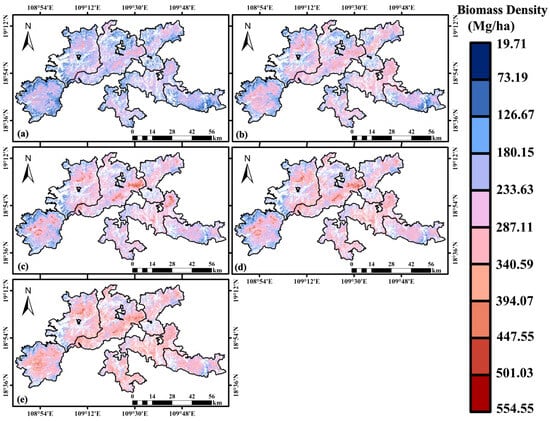
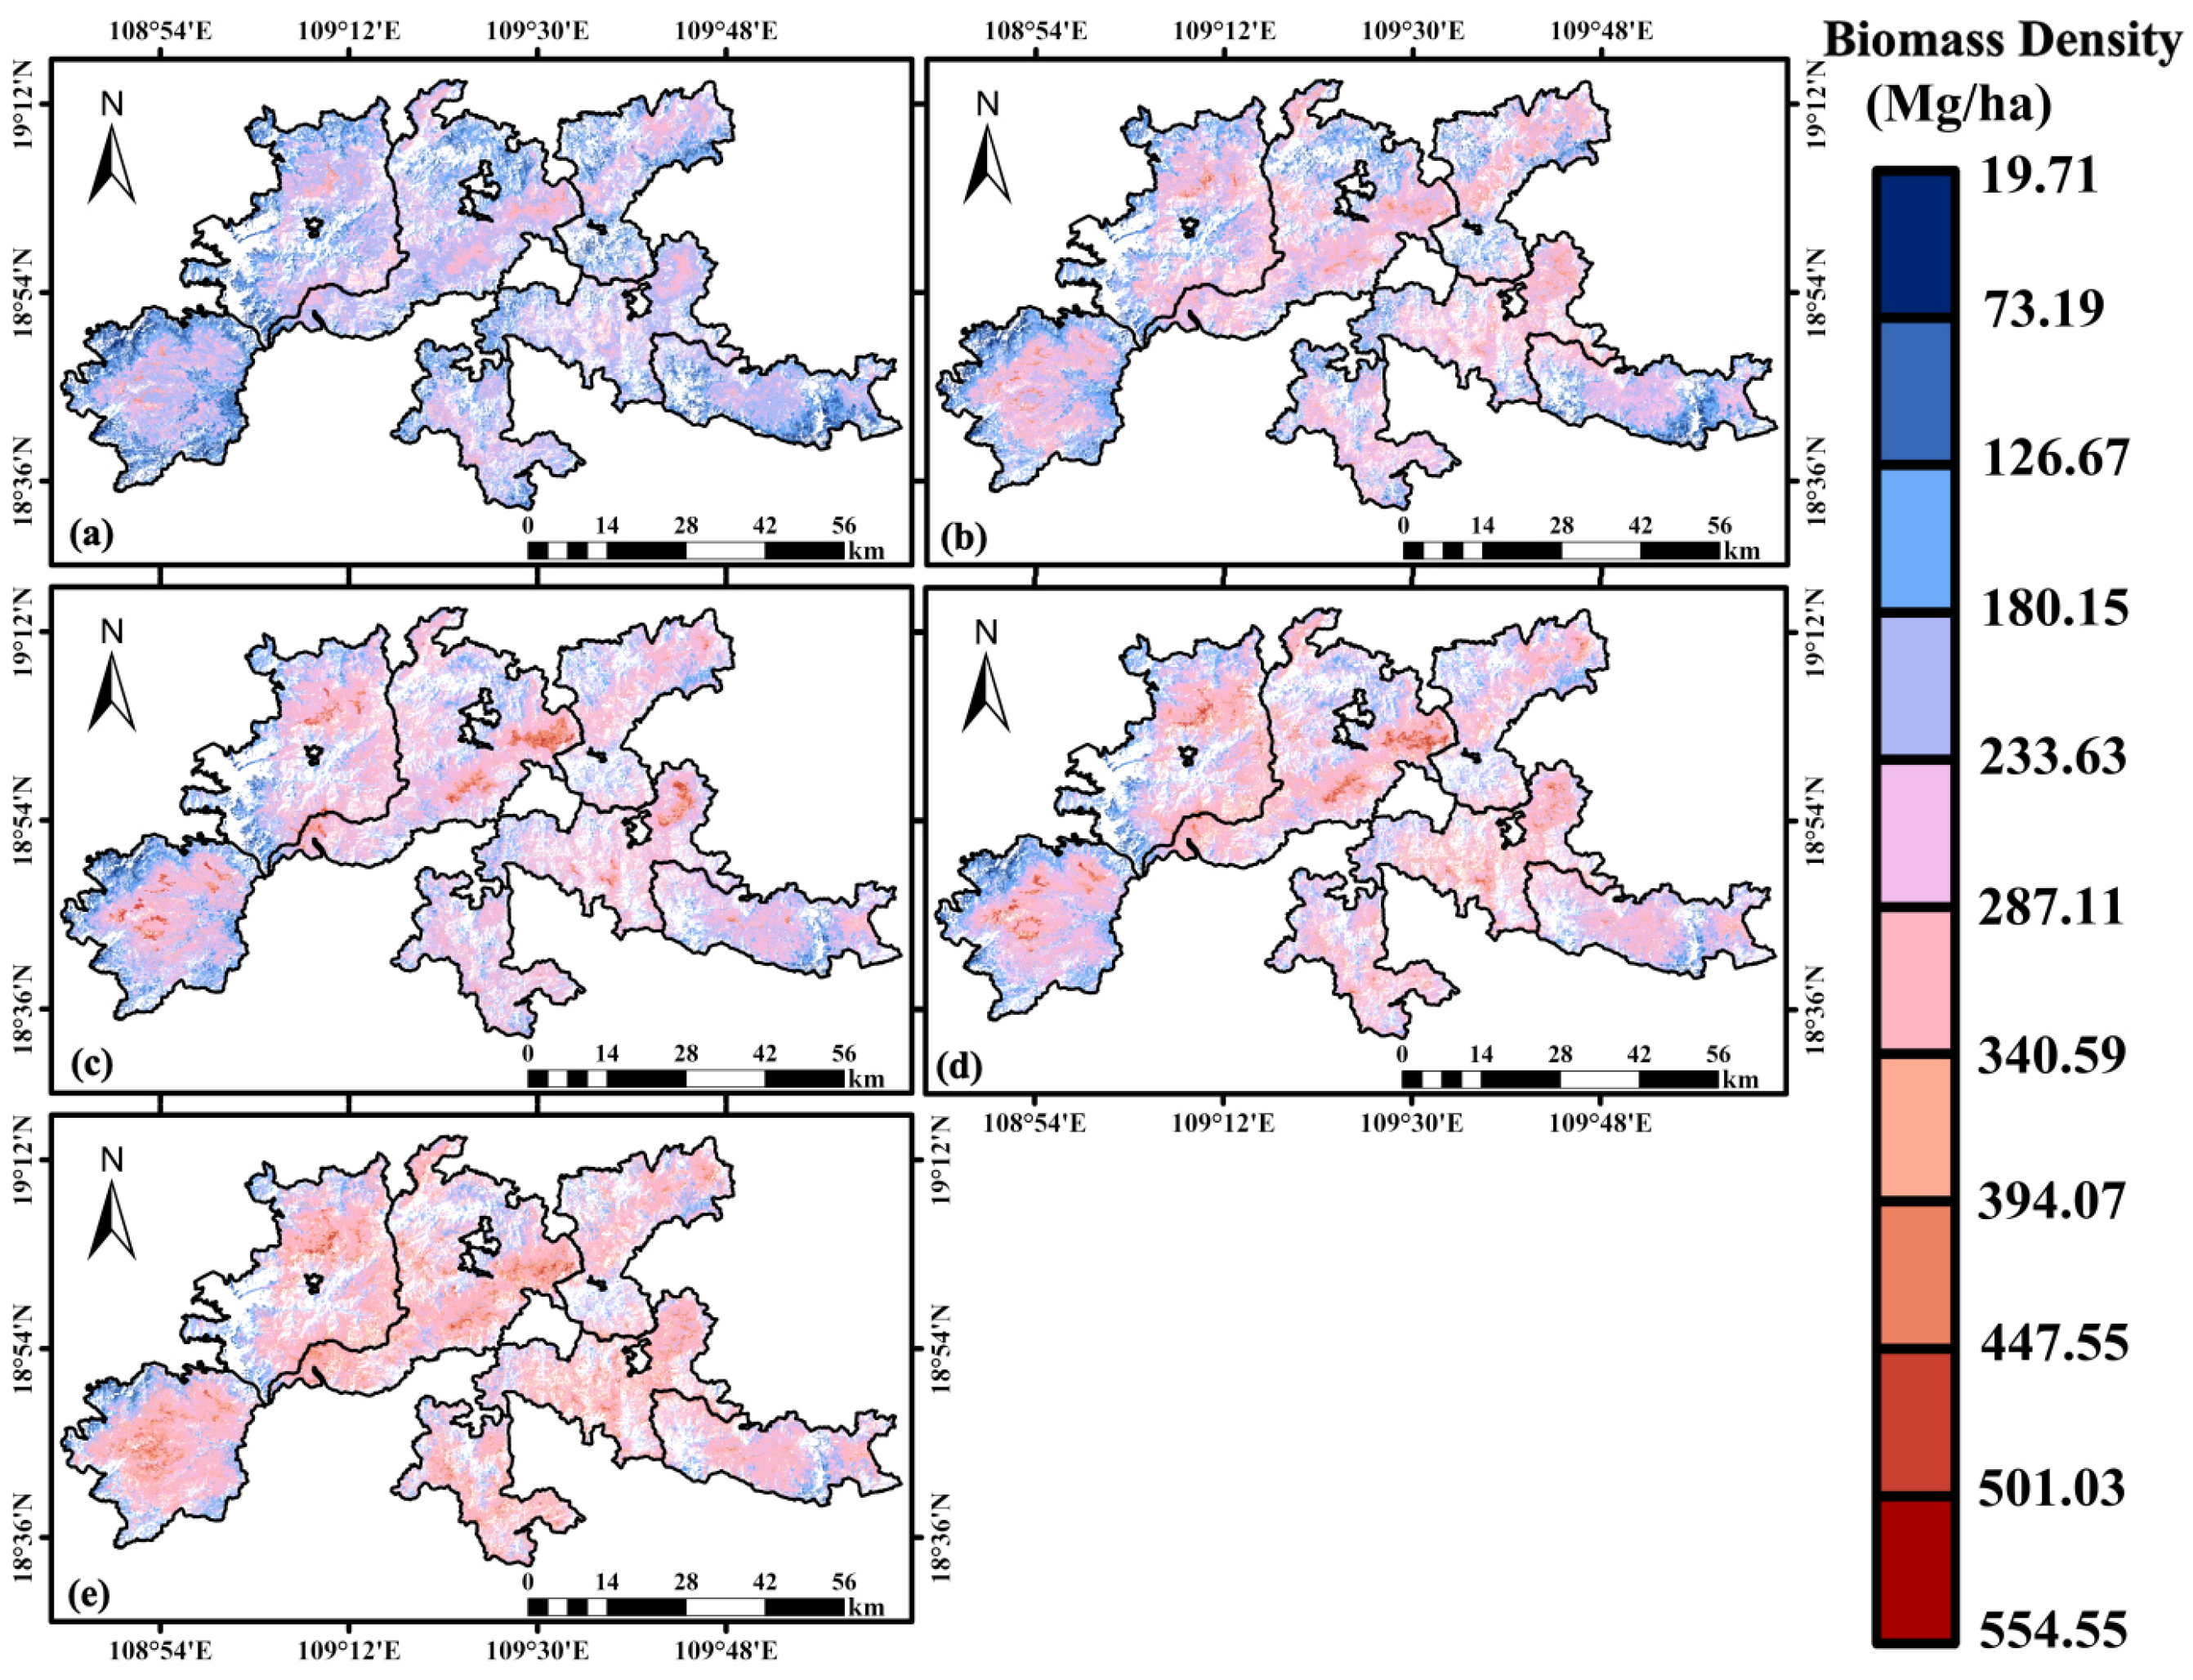
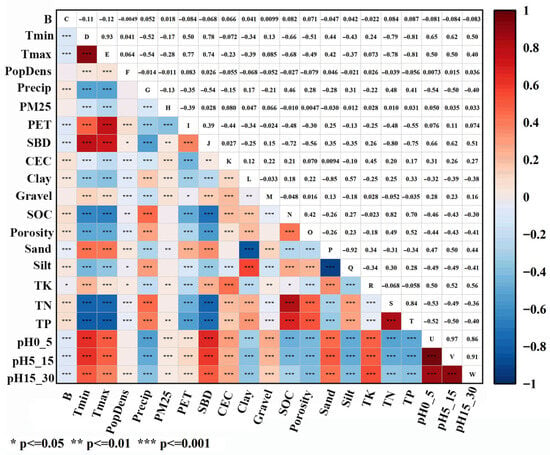
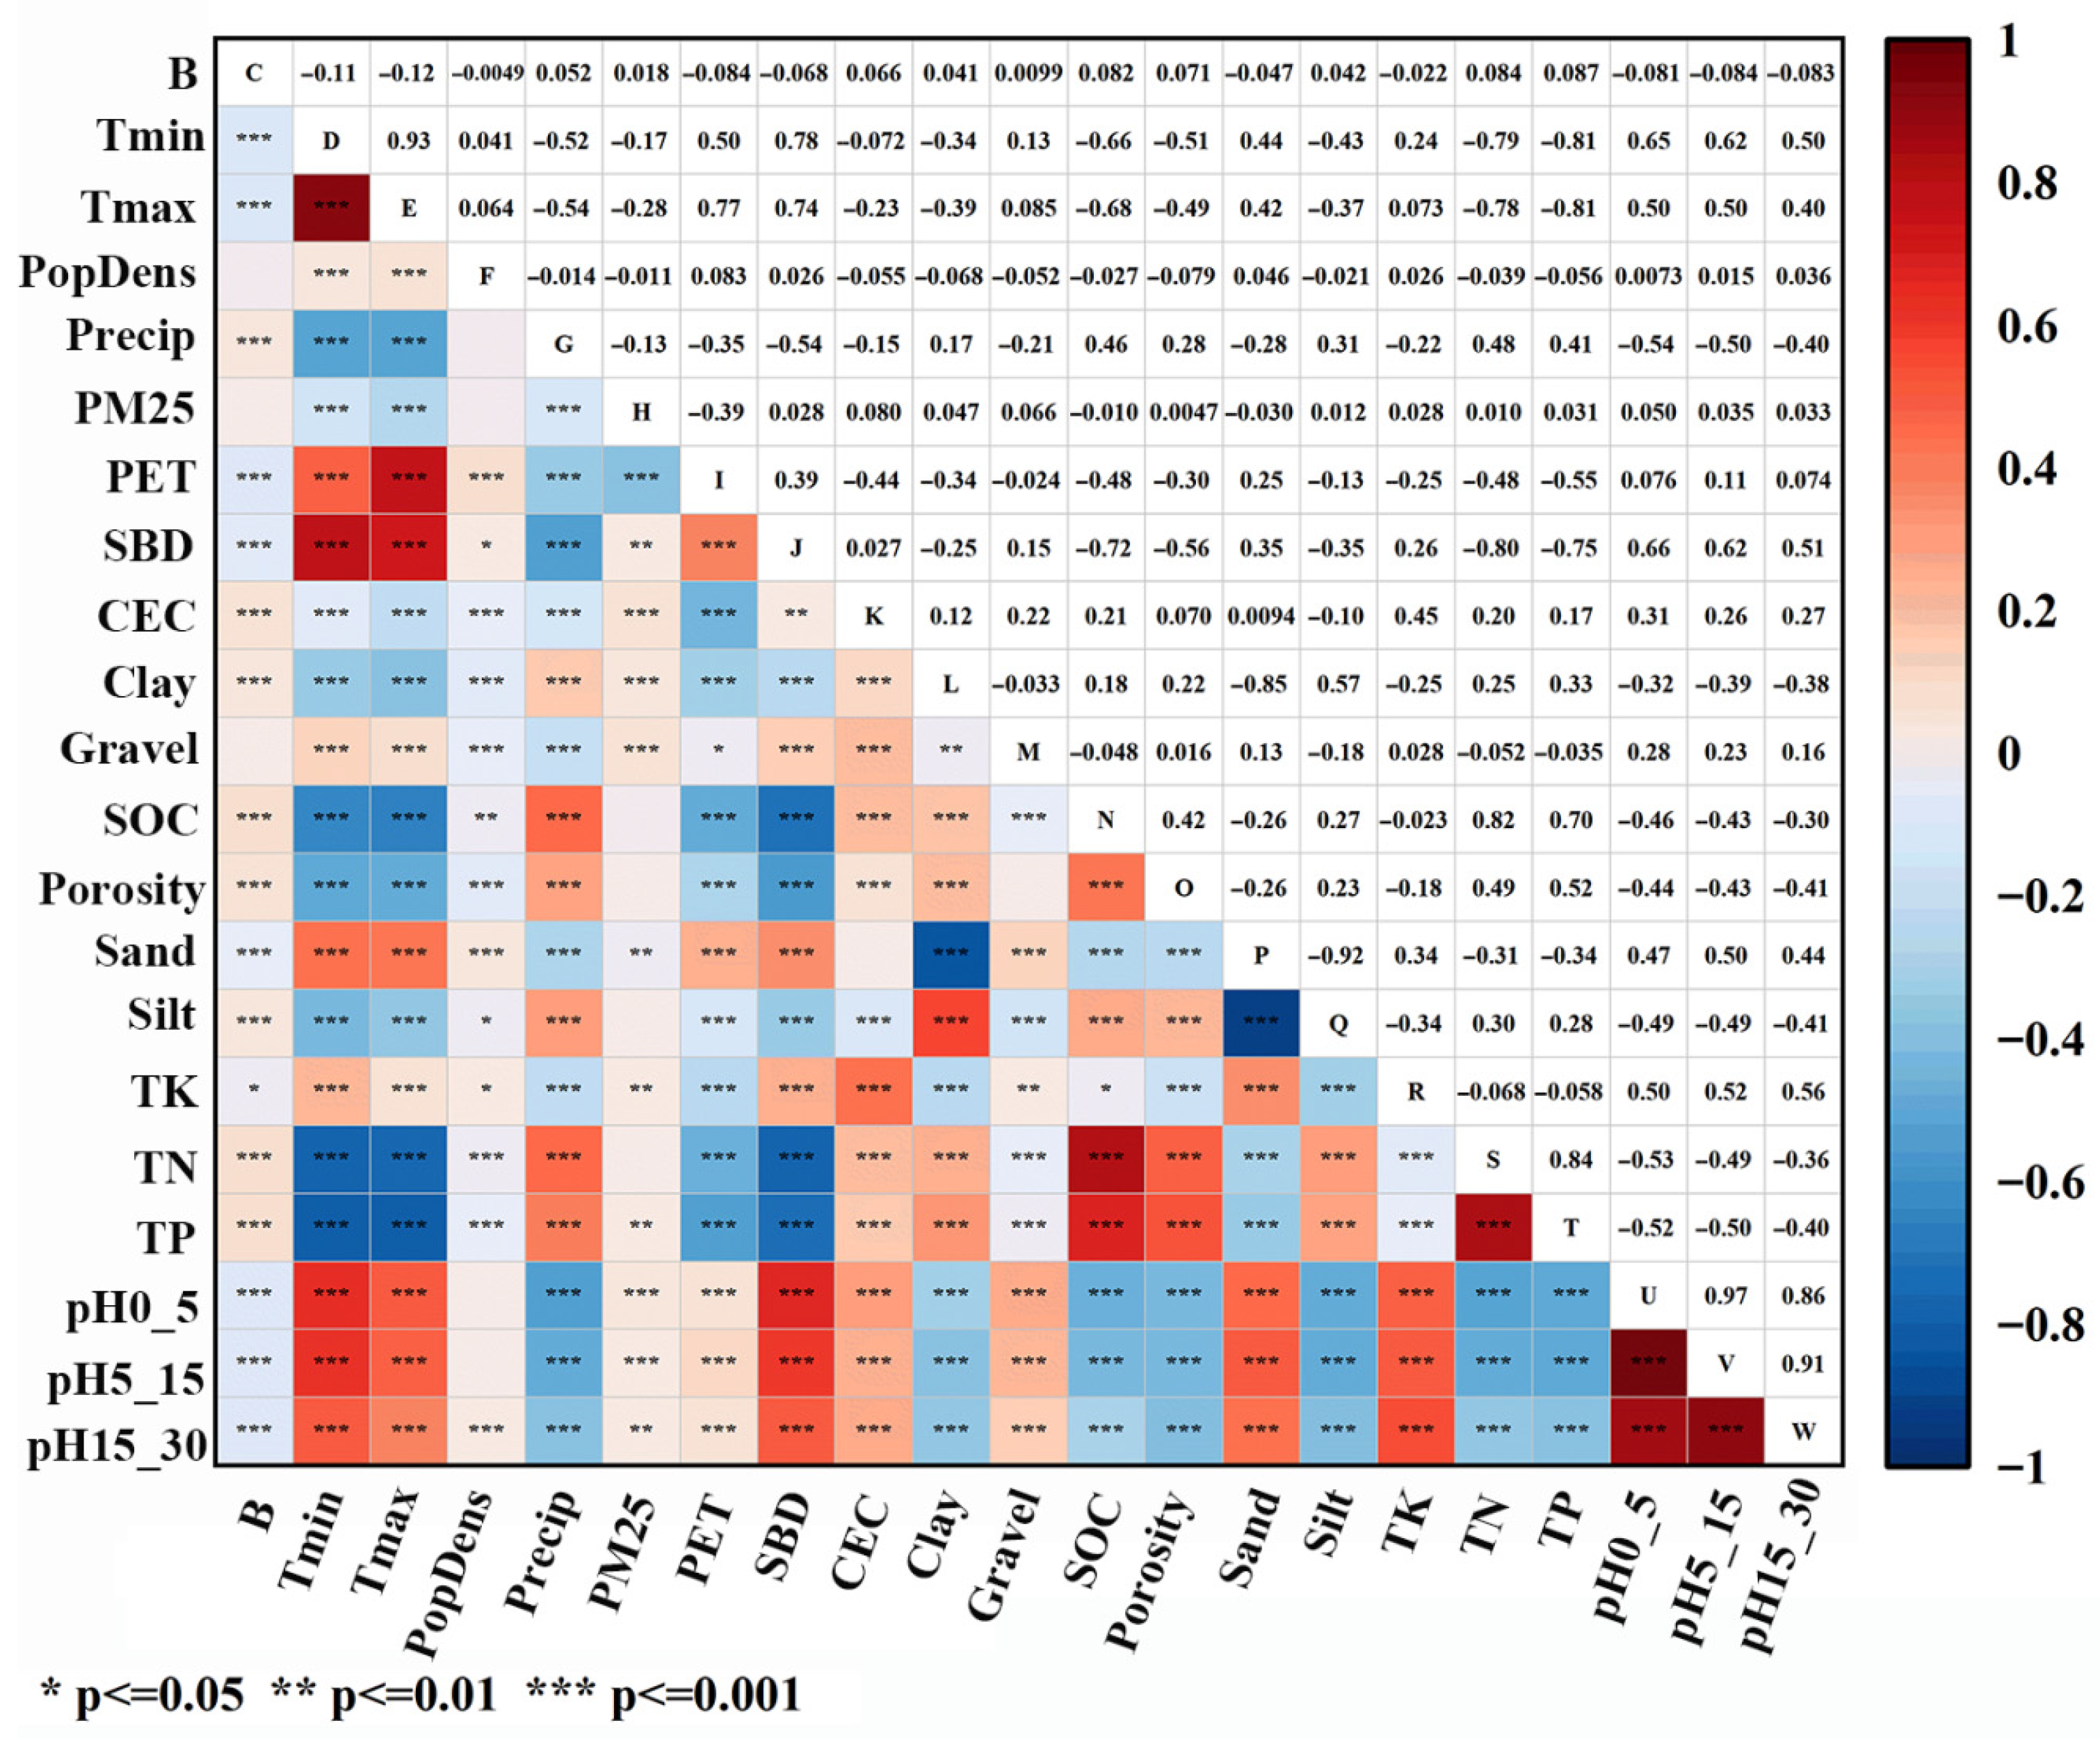

Disclaimer/Publisher’s Note: The statements, opinions and data contained in all publications are solely those of the individual author(s) and contributor(s) and not of MDPI and/or the editor(s). MDPI and/or the editor(s) disclaim responsibility for any injury to people or property resulting from any ideas, methods, instructions or products referred to in the content. |
© 2026 by the authors. Licensee MDPI, Basel, Switzerland. This article is an open access article distributed under the terms and conditions of the Creative Commons Attribution (CC BY) license.