


Abstract
Operational production planning has become a key factor in a company’s competitiveness, enabling efficient resource management and a rapid response to fluctuations in demand. However, many manufacturing organizations base their decisions on a conceptual perspective, creating imbalances between supply and demand. In this context, this study proposes a hybrid framework that integrates demand forecasting techniques and discrete-event simulation to optimize production planning at a dairy plant under scenarios involving random demand. First, a predictive model was developed using ARIMA as a baseline for comparison, and then parameters were adjusted in neural networks to estimate demand. The results showed that neural networks performed better, specifically the RN2 model, in generating future projections. Subsequently, the estimates were used as inputs for the simulation model to represent the company’s current system, enabling the identification of bottlenecks and the evaluation of improvement scenarios. The findings indicated that the company’s current capacity is insufficient to meet current and projected demand. Similarly, the “Assembly” and “Quality Control” stations were identified as the main operational constraints. The proposed improvement increased production capacity by 27.7%, enabling the company to meet demand. The evidence shows that integrating forecasting with simulation is an effective tool, as it provides data and scenarios that closely reflect reality, allowing companies to anticipate constraints and, most importantly, reduce risks and make more informed investment decisions.
1. Introduction
Advance planning in production processes ensures competitiveness in the market [1]. Generally speaking, human decision-making tends to be subjective and intuitive, and prone to errors, especially in highly variable environments; in this regard, constantly adapting in real time poses a logistical challenge due to the complexity of industrial operations [2]. This shortcoming has forced companies to rethink their strategies across the supply chain, seeking to reduce response times, optimize the flow of information within production systems, and, above all, build resilience into the system.
The adoption of technology in industrial processes has enabled the collection of large volumes of operational data, facilitating the continuous monitoring and analysis of production system performance in real time to support logistics management [3,4]. The availability of data on production, demand, and resources has enabled the adoption of advanced approaches to support decision-making and, in this way, evaluate system performance while identifying opportunities for improvement [5,6]. As a result, simulation-based analysis methodologies have gained prominence and support production planning in complex manufacturing environments.
Discrete-event simulation (DES) is widely used to represent manufacturing processes by modeling key operational factors such as production capacity, maintenance schedules, processing times and resource availability [7,8]. By recreating production systems in a virtual environment, DES allows manufacturers to evaluate system performance, identify bottlenecks and test alternative production scenarios without interrupting real operations [9,10]. Recent studies [11,12,13,14,15] have demonstrated its effectiveness in supporting production planning, reducing cycle times, improving resource utilization and evaluating different operational strategies under uncertain conditions [16,17,18,19,20].
Previous studies have explored the integration of DES with artificial intelligence and optimization techniques to improve manufacturing performance. Machine learning have been used to predict system performance in manufacturing and plan production by automatically adjusting parameters [21,22], while reinforcement learning has show promising results in resource allocation and production control [23,24]. Additionally, genetic algorithms and other metaheuristic techniques have been applied to identify efficient production configurations, reduce processing times and improve overall system productivity [17,25,26,27,28]. Although these approaches have reported improvements in production efficiency and resource utilization, they are generally developed using historical or predefined production conditions. As a result, demand forecasting is often treated as a separate component rather than being directly integrated into simulation models, limiting their ability to assess future production capacity under changing market conditions.
Artificial intelligence techniques, particularly neural networks, has become an important tool for demand forecasting because of its ability to capture complex nonlinear patterns from historical data [29,30]. Compared with traditional statistical models, neural networks are often better suited to handling demand variability and changing operating conditions, making them well suited for dynamic manufacturing environments [31]. Studies have incorporated predictive models into production planning by assigning specific orders to different machines in the process, achieving high accuracy rates while reducing scheduling errors and improving on-time delivery rates [21,32,33]. However, forecasting alone cannot determine whether the available production capacity will be sufficient to meet future demand. Integrating demand forecasting with production capacity analysis, allowing manufacturers to evaluate operational scenarios before capacity constraints effect system performance.
Despite the significant advances made in recent years in both forecasting models and simulation tools, their integration into a unified framework for production planning remains limited. Most of the existing research on simulation focuses on evaluating the performance of manufacturing systems using historical data. In contrast, studies on demand forecasting are generally aimed at improving prediction accuracy without considering the production capacity required to meet the forecasted demand. As a result, many manufacturing companies lack integrated tools that allow them to simultaneously forecast demand, analyze production capacity, identify bottlenecks, and evaluate improvement alternatives to mitigate future operational challenges. This need is particularly relevant in sectors characterized by highly variable demand, where anticipating capacity limitations can support more efficient planning and improve decision-making related to resource allocation and investment strategies.
The production system in this study has limitations that prevent it from fully meeting market expectations. However, the lack of planning due to demand volatility leads to operational inefficiencies at the plant. As a result, production decisions are made subjectively, preventing the company from adequately assessing whether current production capacity meets customer needs. In this regard, an approach is needed that can forecast future demand, analyze production behavior, and evaluate different scenarios to improve performance and support operational decision-making.
Based on the gap identified in the literature, this study proposes an integrated decision-support framework that combines demand forecasting through an intelligent forecasting model with a discrete-event simulation model to improve production planning. Unlike traditional approaches that rely solely on historical demand data, the proposed methodology incorporates forecasted demand as a dynamic input to the simulation model. This integration makes it possible to evaluate future production capacity, identify potential bottlenecks, and analyze improvement scenarios before capacity limitations affect the performance of the production system. The methodology is validated through a case study conducted in a large dairy manufacturing company, where the results demonstrate that the integration of demand forecasting and simulation supports a more proactive approach to production planning. Furthermore, the proposed framework provides meaningful and actionable information to support decision-making in stochastic environments characterized by uncertainty and variability.
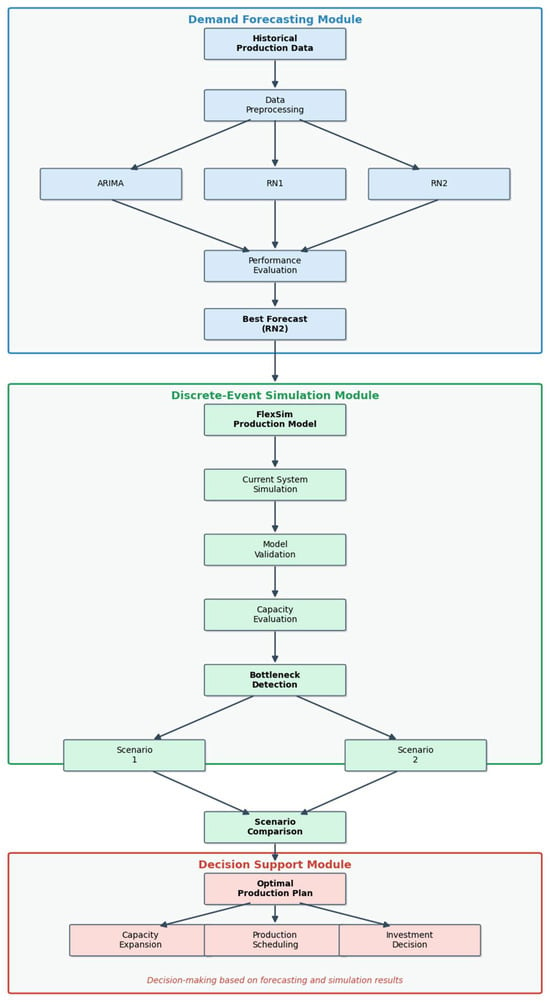
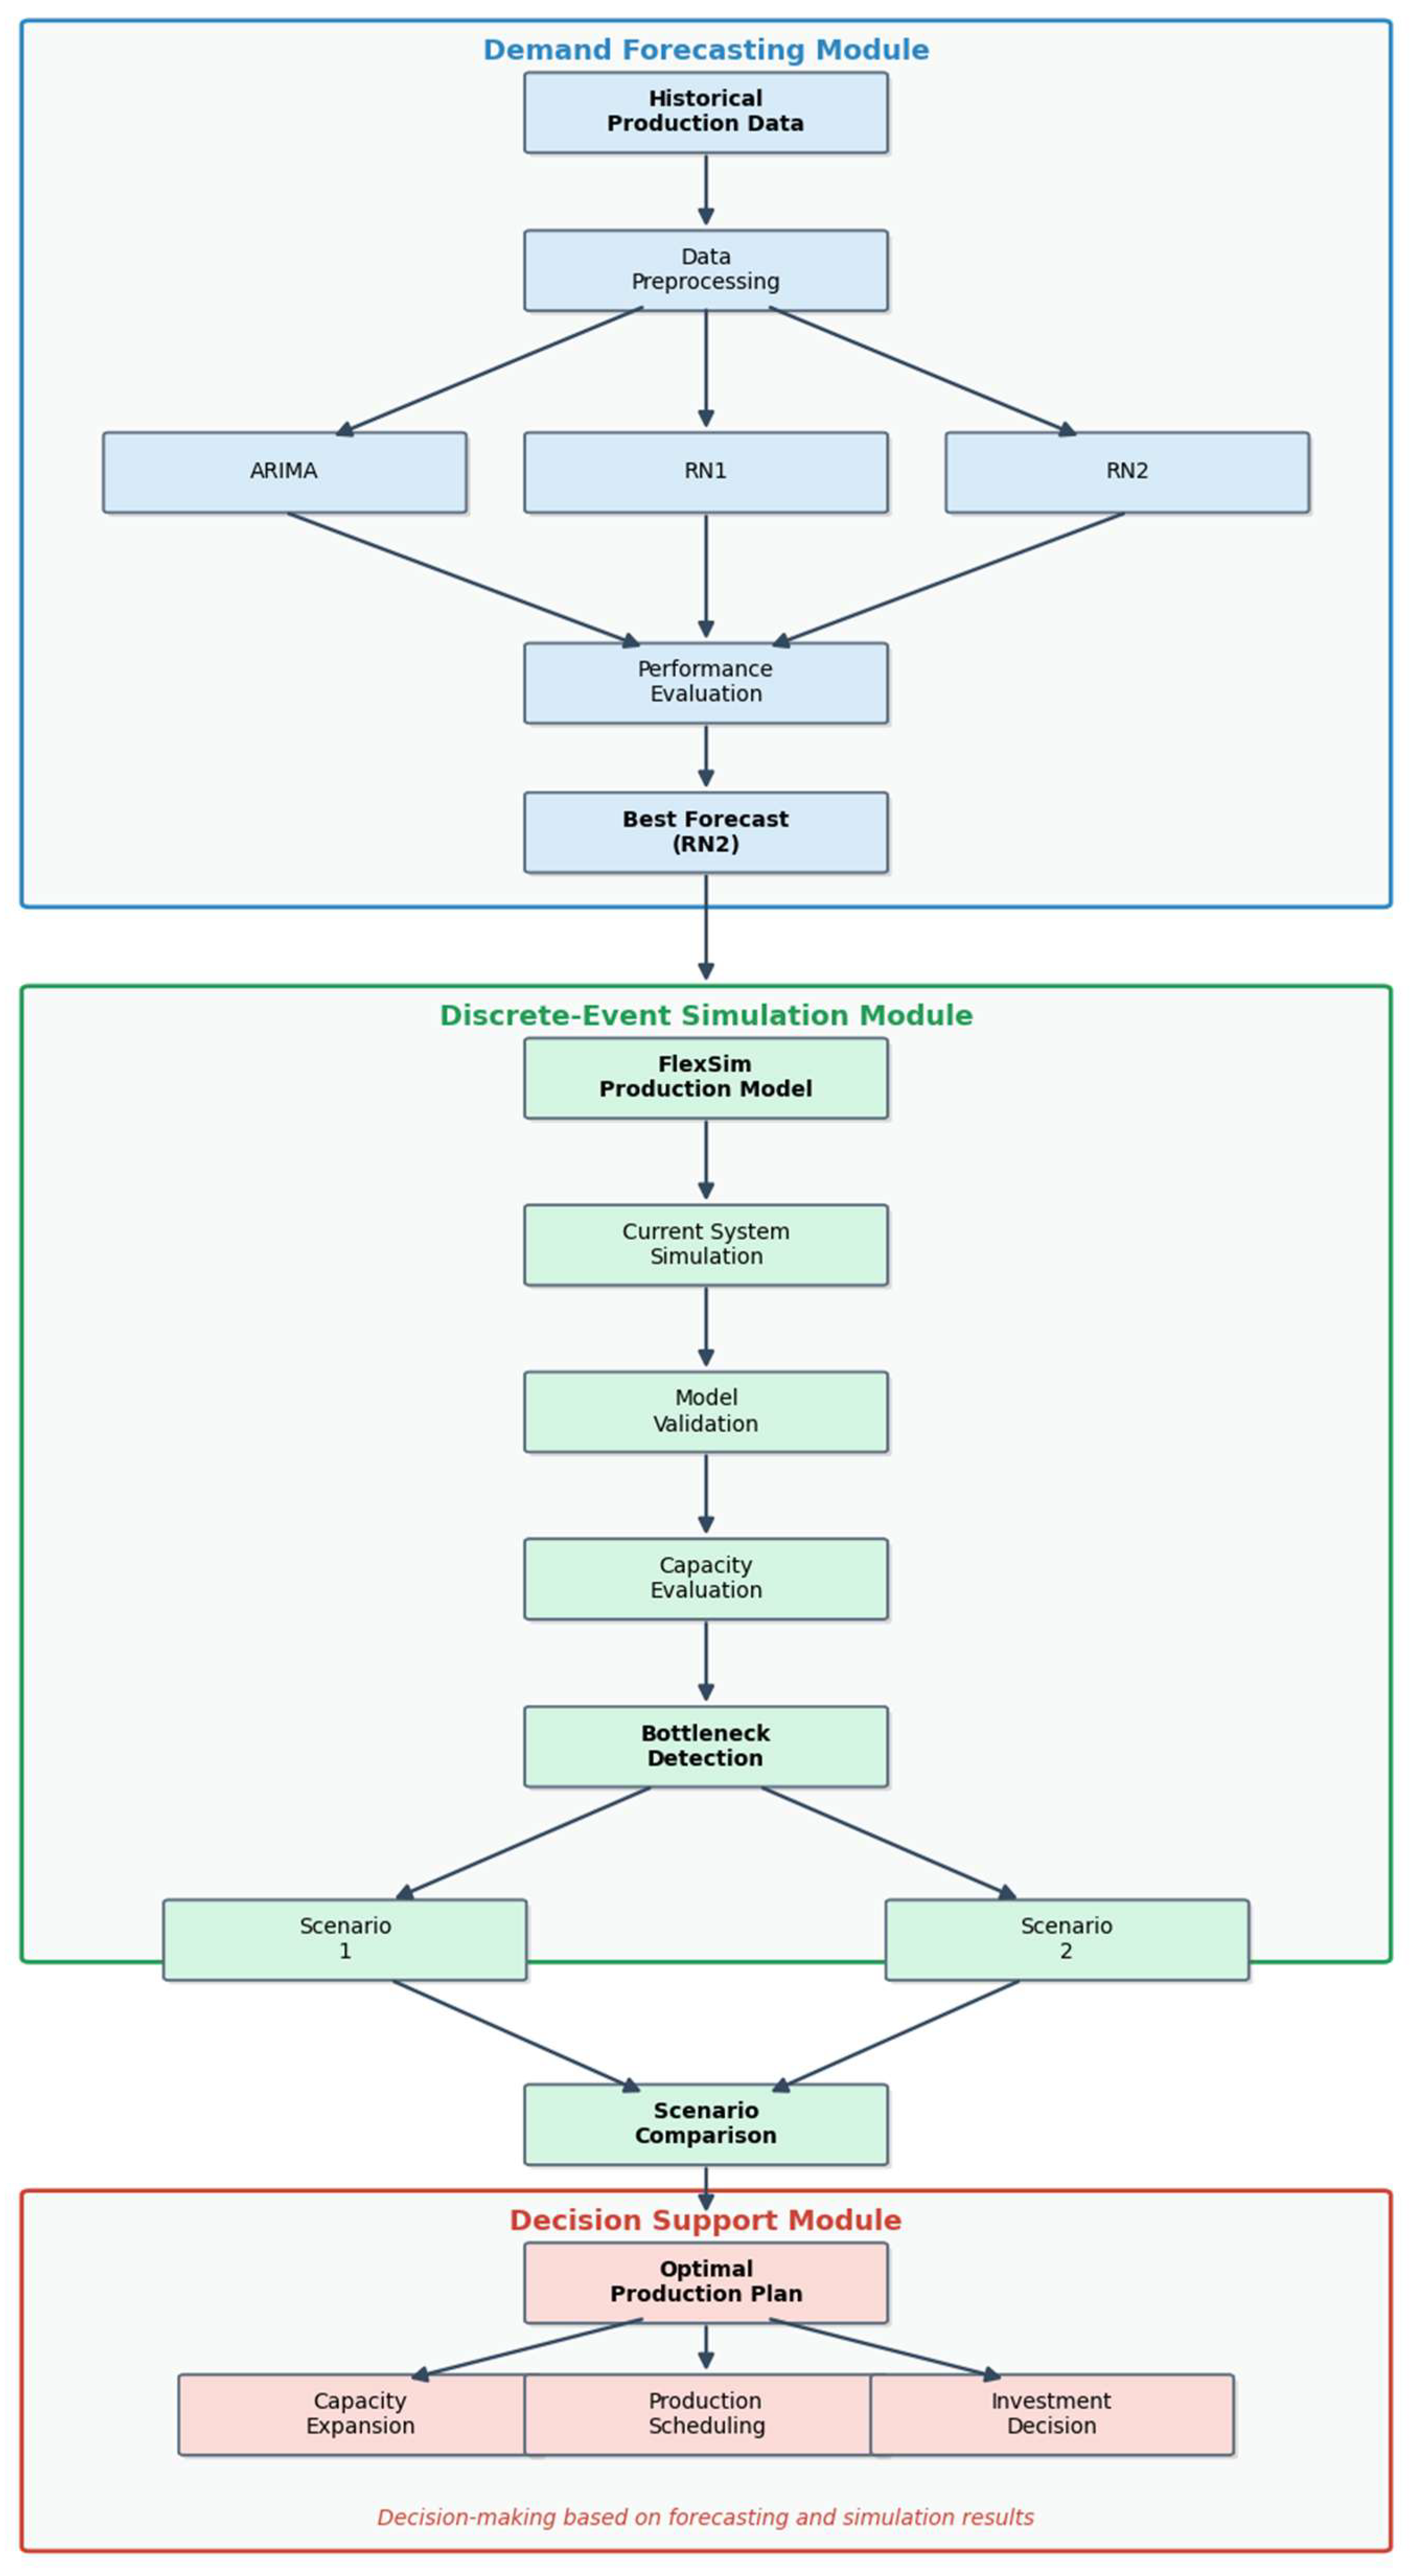
Figure 1 illustrates the proposed hybrid framework, in which the demand forecasts generated by the forecasting model are integrated into a discrete-event simulation model. This integration enables the evaluation of future production capacity, the identification of operational constraints, and the assessment of alternative improvement scenarios.
Figure 1.
Proposed Hybrid Decision-Support Framework Integrating Demand Forecasting and Discrete-Event Simulation for Production Planning.
2. Materials and Methods
2.1. Research Framework
This study proposes a hybrid framework that integrates demand forecasting and simulation to support production planning in a dairy manufacturing environment. The methodology is structured into four sequential stages: data collection and preprocessing, demand forecasting, discrete-event simulation driven by the selected forecasting model, and the evaluation of improvement scenarios aimed at enhancing production planning. The overall workflow of the proposed framework is presented in Figure 1.
To conduct this research, historical sales data were collected for the best-selling product over a two-year period. The data was analyzed using Microsoft Excel (Microsoft Corporation, Redmond, WA, USA) to identify trends, seasonality, variations, or existing patterns for the forecasting process. The forecasted demand was then incorporated as input data into the simulation model representing the current production system, enabling the evaluation of performance indicators, station dwell times, resource utilization, and the identification of bottlenecks. Finally, improvement strategies were developed to optimize production capacity and support decision-making in operational planning.
2.2. Data Collection and Preprocessing
The case study company provided a database containing records of daily sales, production volume, operating hours, and the number of customers, resulting in a total of 1952 raw observations. Prior to model development, the data were cleaned, filtered, and checked for duplicates to ensure data quality and consistency. For the ARIMA model, daily sales records were aggregated into a monthly time series comprising 24 observations, covering the period from January 2024 to December 2025, since the statistical forecasting model was applied to monthly demand patterns.
A different dataset was constructed for the intelligent forecasting model, consisting of 118 observations for each input variable—demand, production volume, and operating hours—resulting in a total of 354 input data points for the neural network. Before training, all variables were normalized using Min–Max scaling to ensure comparable numerical ranges and improve the learning process of the network. Subsequently, the dataset was divided into training (80%), validation (10%), and testing (10%) subsets to support model development and performance evaluation.
2.3. Demand Forecasting Models
The forecasting stage was developed in the Google Colabab (Google LLC, Mountain View, CA, USA) using the Python 3.12.13 (Python Software Foundation, Wilmington, DE, USA) programming language. It was deemed appropriate to compare different forecasting approaches, and to that end, two predictive models were developed.
Given the limited number of observations available for forecasting, the ARIMA model was selected as the baseline statistical approach due to its well-established effectiveness in modeling time-series data with relatively small datasets. This statistical model is widely used in time-series analysis because of its ability to capture underlying temporal patterns and generate reliable forecasts, making it a common benchmark against which more advanced forecasting techniques are evaluated [34,35].
As described in Section 2.2, the ARIMA model was developed using a monthly time series consisting of 24 observations covering the period from January 2024 to December 2025. To assess model performance, the data were divided chronologically into training (60%) and testing (40%) subsets. Several combinations of the autoregressive (p), differencing (d), and moving average (q) parameters were then evaluated, and the final model specification was selected based on the lowest Akaike Information Criterion (AIC) value. Once the optimal parameter configuration had been identified, forecasting performance was assessed using the Root Mean Square Error (RMSE) and Mean Absolute Percentage Error (MAPE), which provided a quantitative measure of the model’s predictive accuracy.
The second approach was a neural network; a feedforward network was chosen because of its ability to capture nonlinear patterns in a dataset. Its simple computational structure is well-suited to the limited dataset available, as it requires fewer parameters, thereby minimizing the risk of overfitting [27,36,37]. Historical records of demand, production volume, and operating time were used for training. These variables were selected because of their direct impact on demand behavior and operations planning; furthermore, they represent real and consistent data within the company and allow for the capture of operational relationships for the estimation process.
The three variables representing the neurons in the input layer comprise a total of 354 data points, which were divided into three subsets: training (80%), validation (10%), and testing (10%). Using this distribution, it was possible to adjust the parameters, train the neural network, and evaluate its performance using data not seen during training. The performance of neural networks depends largely on their configuration; with that in mind, to evaluate forecasting performance, two neural network configurations (RN1 and RN2) were developed and compared. Both models employed the same network architecture but differed in the optimization algorithm used for training. This comparison was carried out to determine the extent to which the optimization strategy affected forecasting accuracy and model performance. The configuration that achieved the best results according to the selected evaluation metrics was subsequently chosen for integration into the proposed framework.
The first model, called RN1, consisted of an input layer, a hidden layer, and an output layer. This simple architecture is due to the fact that a single hidden layer maintains a high level of functional approximation [38,39]. The standard architecture, with densely connected layers (Dense), was used to enable the propagation of information from the input neurons to the estimated output neuron. The ReLU activation function, which is widely used, was employed to introduce nonlinearity into the network and model complex relationships between the variables [40]. One of the most influential hyperparameters in neural network training is the optimizer; for this model, Stochastic Gradient Descent (SGD) was selected. SGD is a standard optimizer, and its function is to update the network weights to minimize the prediction error [41] using a learning rate of 0.01 to control the weight updates. The RN1 training ran for 150 epochs—a standard value—to ensure that the weights converge to a stable solution.
The second model, called RN2, retained the same architecture as RN1, its main modification was replacing SGD with ADAM. This optimizer is an evolution of stochastic gradient descent that automatically updates the weights during training [42]. In addition, the Early Stopping regularization technique was incorporated to monitor the validation loss (val_loss) and reduce the risk of overfitting. The validation subset was continuously monitored throughout the training process, and optimization was automatically stopped once no further improvement was observed. This strategy helped prevent overfitting and promoted better generalization of the model when applied to unseen data. To ensure the reproducibility of the experiments, a fixed random seed (seed = 10) was used during model training. The performance of both neural network configurations was subsequently evaluated using the Root Mean Square Error (RMSE) and Mean Absolute Percentage Error (MAPE), which served as the primary metrics for assessing forecasting accuracy.
2.4. Discrete-Event Simulation
Once the demand for 2026 was known, a discrete-event simulation model was developed in FlexSim 2026 (FlexSim Software Products, Orem, UT, USA) to represent the operational behavior of the dairy production line and assess its production capacity under current conditions. This model simulates the entire production process, including each workstation, material flow, available resources, operational constraints, and production sequence. This digital representation allows for informed decision-making regarding production performance and helps identify potential bottlenecks before implementing changes in the real system.
The operational parameters of the simulation model were defined using information gathered directly from the production plant. Processing times for each workstation were obtained through interviews with experienced operators, who provided standard operating times under normal conditions. Since the production process follows standardized operating procedures and stable production cycles, constant processing times were assigned to each workstation. Material flow adhered to a First-In, First-Out (FIFO) queue discipline, reflecting the company’s actual production policy. Additionally, preventive maintenance and equipment cleaning are routinely performed every Sunday, which is why unexpected machine failures were not explicitly modeled; operators indicated that this strategy effectively prevents production interruptions during normal operations.
The simulation model was validated by comparing the simulated daily production with the actual production recorded by the company. Under the current production configuration, both the real system and the simulation model produced approximately 940 units per shift, resulting in a simulation error of 0%. This alignment confirmed that the model accurately represented the operational behavior of the production system and was suitable for evaluating improvement alternatives.
The daily output from the simulation was compared against the actual daily production the company recorded, mostly when operating under similar conditions, to verify the simulation model’s accuracy. Simulation error was calculated using Equation (1).
where SE is the simulation percentage error represents the actual daily production observed in the case study company, and corresponds to the daily production estimated by the FlexSim simulation model. Lower values of SE indicate a higher level of agreement between the real production system and the simulated model, providing evidence that the simulation accurately reflects the operating conditions and performance of the production process.
Once validated, the model was used to assess various scenarios for expanding production capacity. The goal was to identify operational configurations that could reduce bottlenecks, improve resource utilization, and increase production capacity without disrupting the existing workflow. The validated DES model served as the foundation for comparing alternative configurations and supporting production planning decisions under varying demand conditions.
3. Results
3.1. Demand Analysis
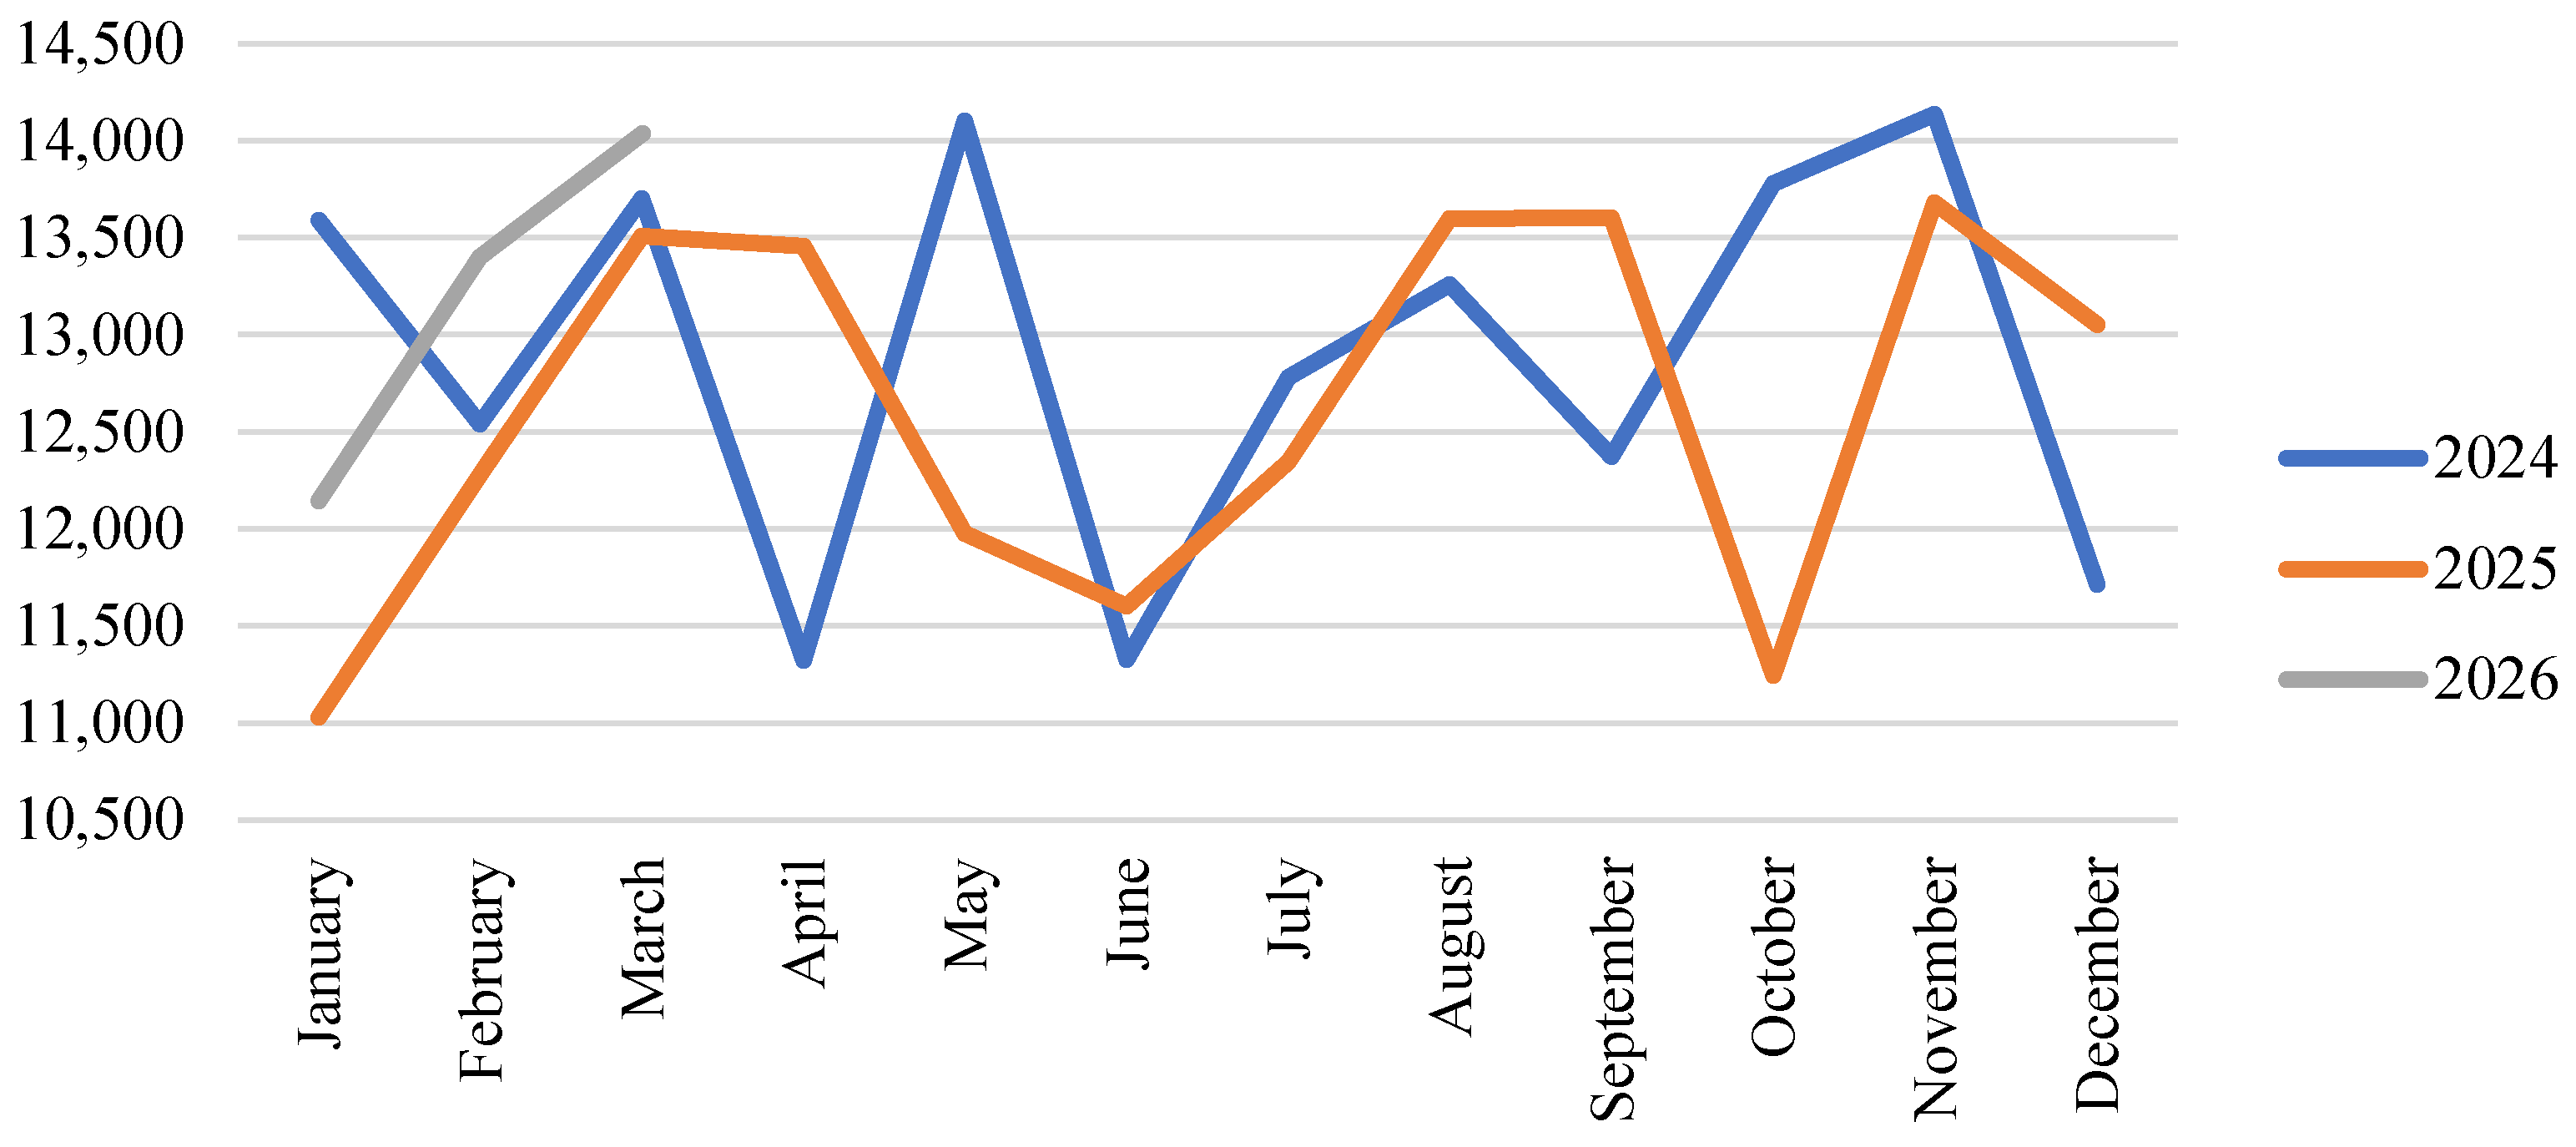
A chronological analysis of demand (Figure 2) for the years 2024, 2025, and early 2026 shows the monthly trend, revealing that demand ranges between 11,000 and 14,200 units per month, indicating fluctuations without a clear trend. Notably, sales exceed the plant’s monthly production (11,280 units), so the increase suggests that demand is being met by safety stock or adjustments to the production schedule.
Figure 2.
Historical Demand 2024–2025.
The analyzed data suggest that the company under study has demand with irregular fluctuations, and because it does not follow a consistent pattern, it is difficult to identify a clear seasonal trend. This variability may be influenced by seasonal factors such as changes in supply. Some of the factors contributing to the uncertainty stem from the price of raw materials, supplies (bags, packaging), and the seasonal increase in consumption during the month of March (Holy Week).
Demand does not follow a deterministic or completely random pattern; however, sales fall within a range that exhibits stochastic but controlled behavior. Furthermore, the coefficient of variation of 7% indicates low dispersion in the values. These characteristics make it suitable to implement intelligent models for forecasting and improving production planning. These characteristics justify the need to implement a forecasting model in order to anticipate future manufacturing requirements for the product.
3.2. Demand Forecasting
3.2.1. ARIMA Model Result
Using Python, an Auto-ARIMA approach was implemented, which identified the (0,2,1) model as the configuration that best fits the data, with an AIC value of 224.69. Figure 2 shows the relationship between actual demand values and the predictions generated by the model (Figure 3).
Figure 3.
Model Evaluation ARIMA. The red line represents the observed (actual) demand values, while the blue dots represent the demand values predicted by the ARIMA (0,2,1) model.
The model performed poorly in forecasts, which tended to stabilize around a value of approximately 13,491 units. The statistical results showed an RMSE of 915.15 units and an MAPE of 6.47%; these values indicate that the ARIMA model failed to capture the patterns in demand variability.
3.2.2. Neural Network Model Results
RN1 Results
The configuration of the first model served as a baseline for analyzing and evaluating subsequent configurations and establishing a point of comparison. Table 1 presents the parameters and hyperparameters used to train the neural network.
Table 1.
Characteristics of RN1 Model.
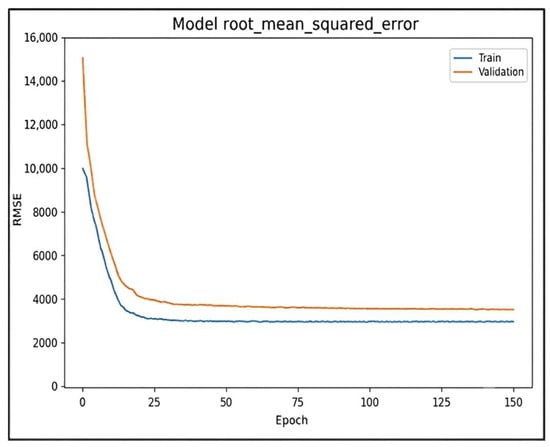
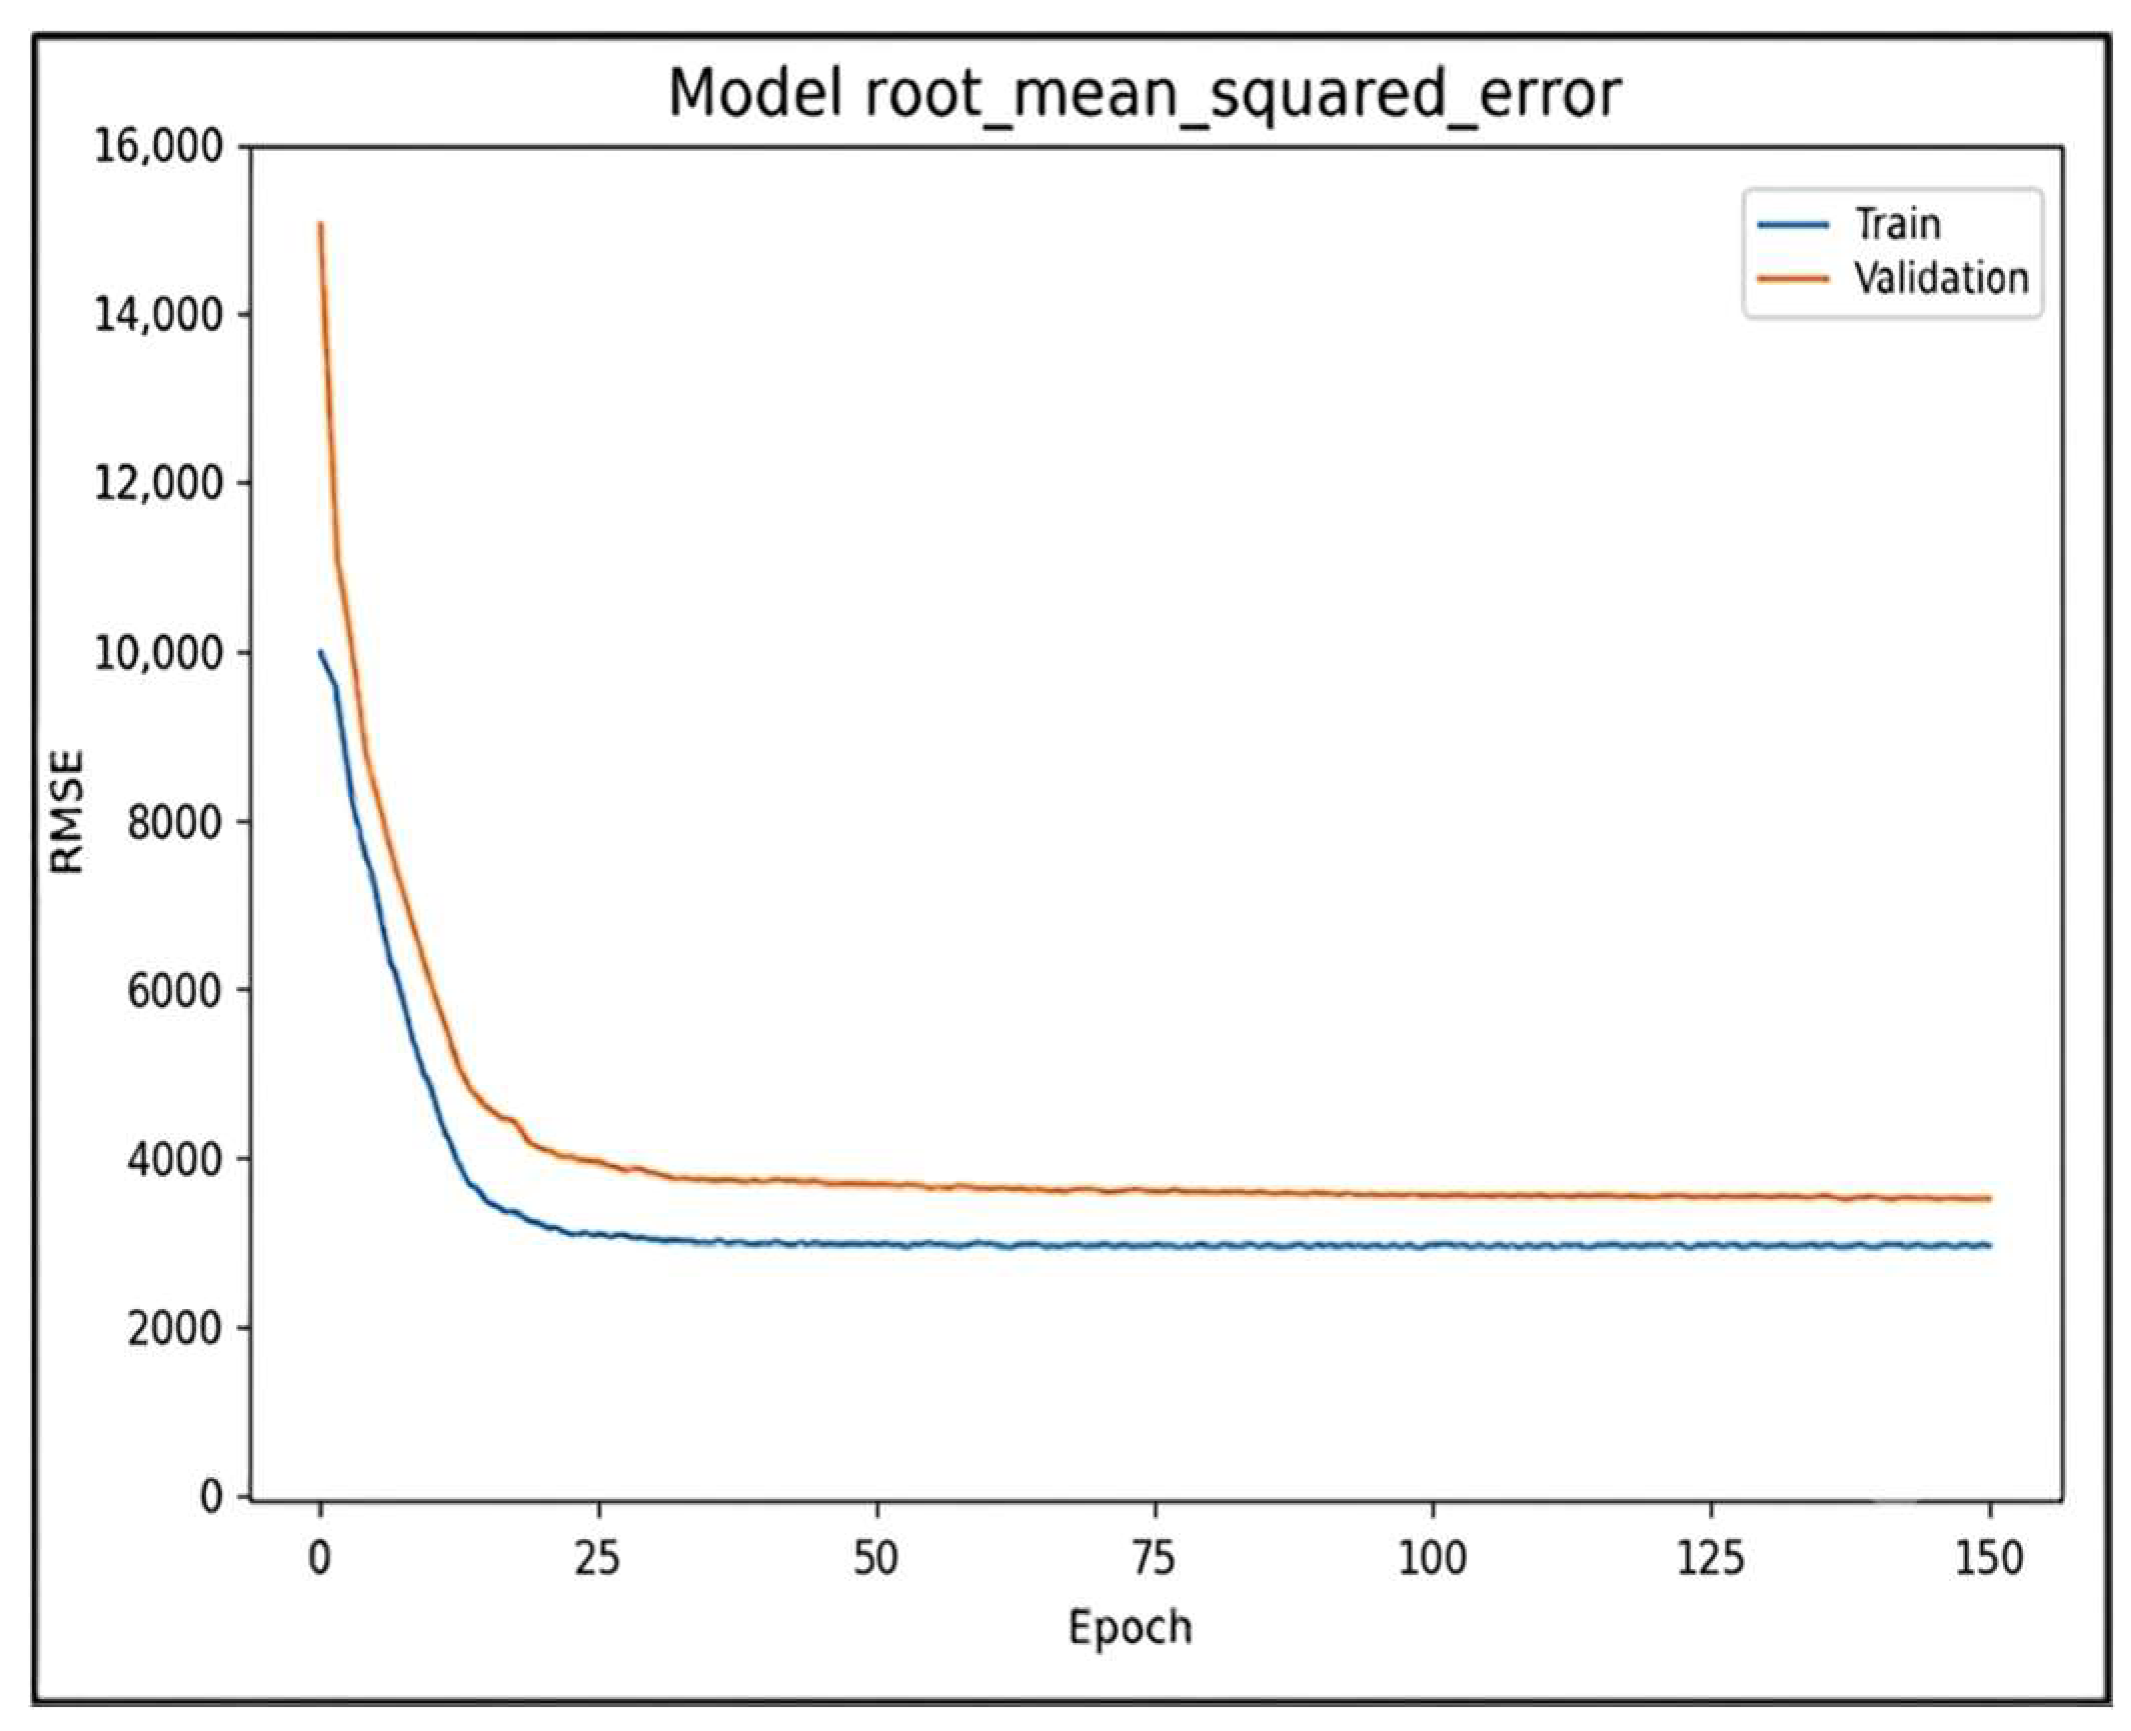
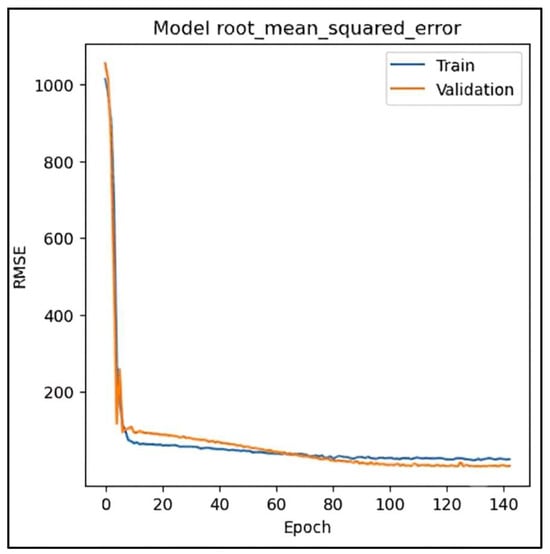
We analyzed the evolution of the root mean square error (RMSE) in the training and validation datasets to assess the neural network’s learning ability, generalization, and stability. Figure 4 shows the evolution of the RMSE over the 150 training epochs. The RMSE in this model was 3450; this value indicates that the predictions differ by 3450 units from the actual values, and the MAPE was 38.7%.
Figure 4.
RMSE curve for the model RN1. Evolution of the root mean squared error (RMSE) during neural network training. The blue curve represents the training dataset, while the orange curve represents the validation dataset.
In the early stages of the model, there is a reduction in error, indicating a rapid initial learning process. However, there is a consistent gap between the two datasets, indicating limited generalization ability and the presence of overfitting. These characteristics suggest that the RN1 model fits the training data well but fails to capture the dynamics of the validation subset. Therefore, the performance of the RN1 model indicates that the configuration used is not optimal for demand forecasting, which justifies the need to evaluate different parameter settings.
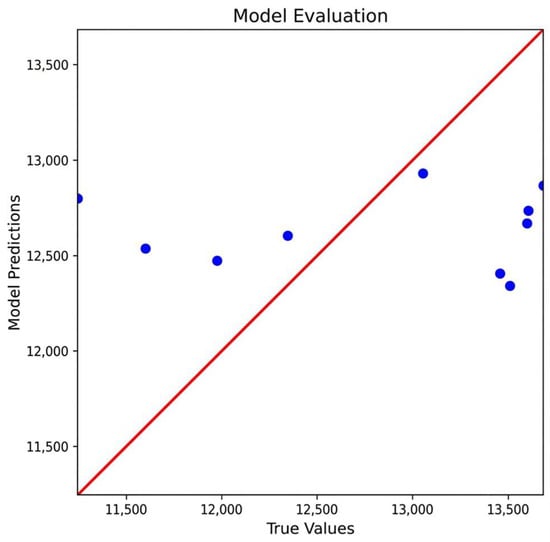
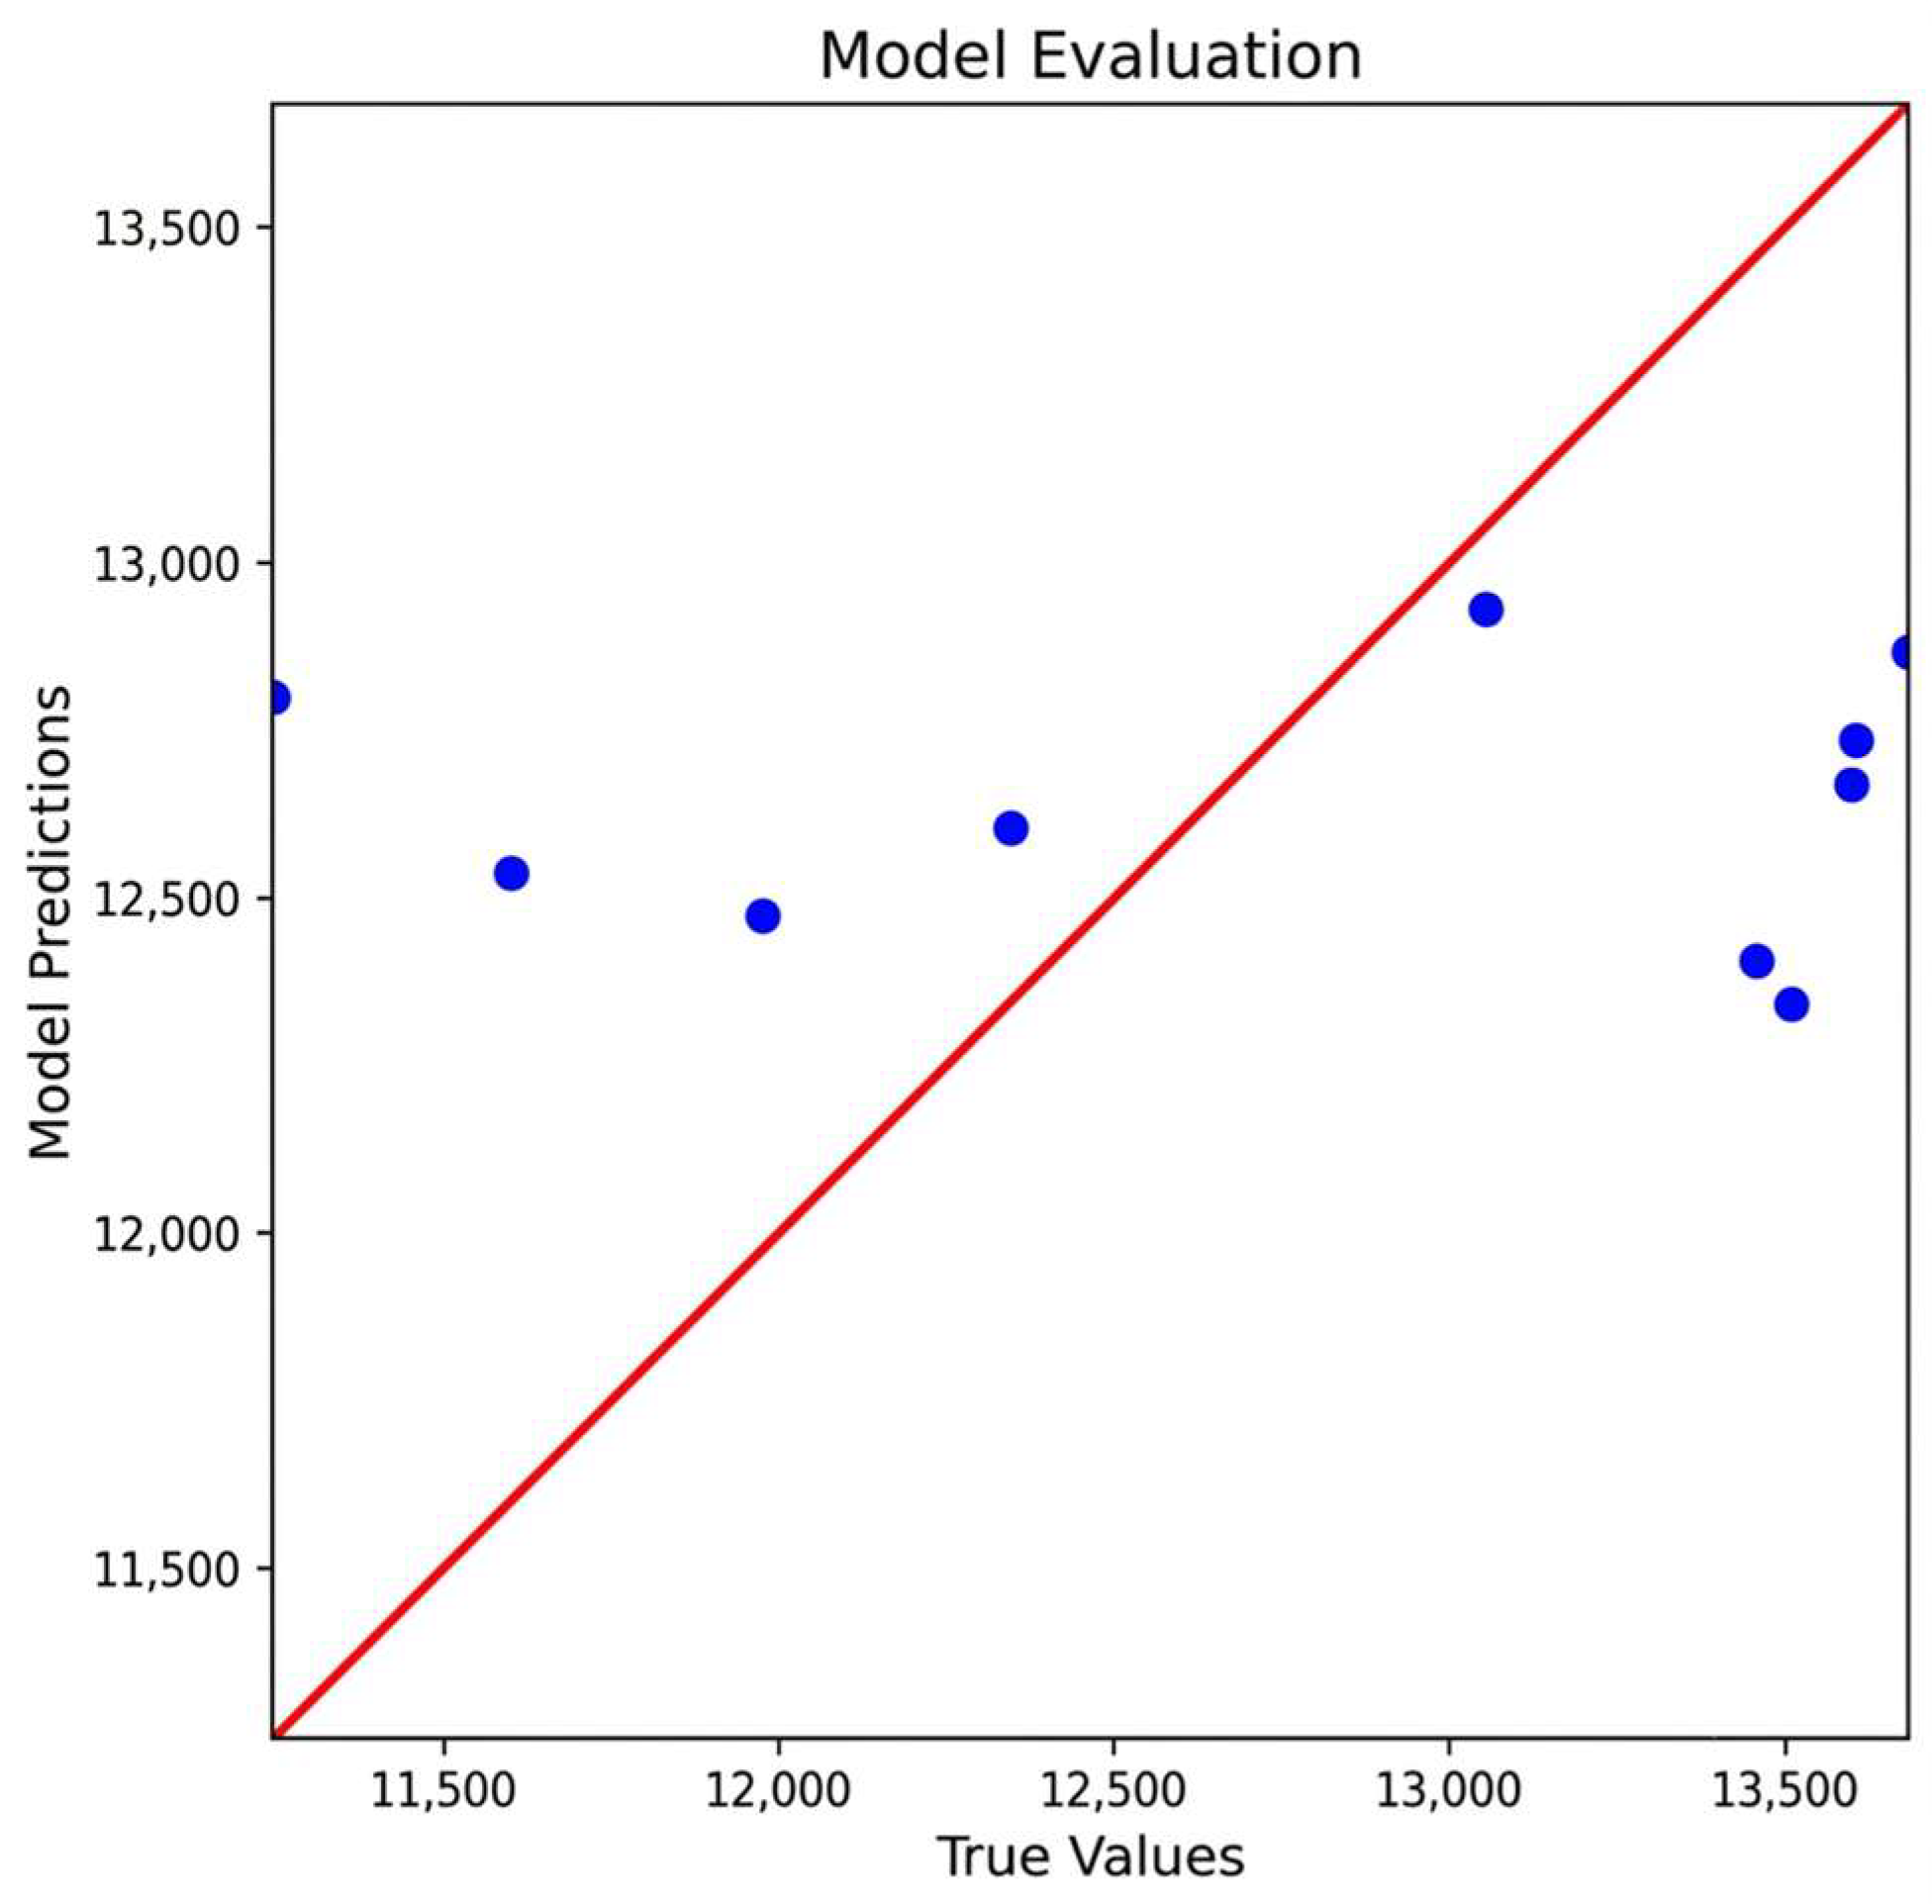
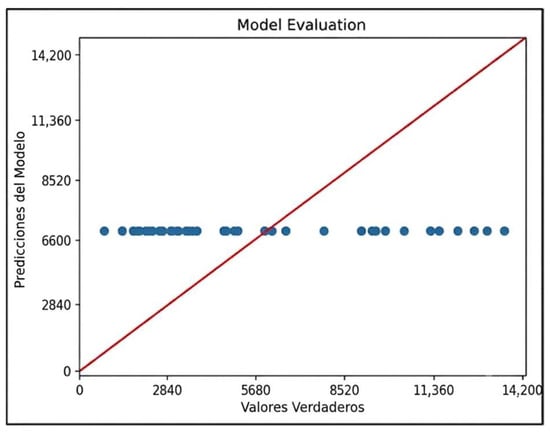
Subsequently, to evaluate the predictive capability of the RN1 model, the actual demand values (test subset) were compared with the predictions generated by the network. This comparison allows us to assess the model’s fit; Figure 5 shows the relationship between the two values.
Figure 5.
Model Evaluation RN1. Comparison between the observed and predicted demand values. The red diagonal line represents the ideal agreement between predicted and observed values, while the blue dots represent the predictions generated by the neural network model.
It can be seen that the model is not generalizing correctly, producing single-value predictions (blue points); consequently, the model failed to learn the patterns in the data. This result, together with the RMSE value, confirms that the configuration used to train the model is not suitable for the system’s dynamics.
RN2 Results
Since RN1 had limitations, the ADAM optimizer and the Early Stopping regularization technique were incorporated into the configuration of the second model, with the aim of minimizing the overfitting identified in RN1. Table 2 details the parameters and hyperparameters used in the second intelligent model.
Table 2.
Characteristics of RN2 Model.
As with RN1, to evaluate the performance of RN2, we analyzed the evolution of the root mean square error (RMSE) (Figure 6) to assess the model’s performance over the training epochs.
Figure 6.
RMSE curve for the model RN2. Evolution of the root mean squared error (RMSE) during neural network training. The blue curve represents the training dataset, while the orange curve represents the validation dataset.
The figure shows that the model reduces the error during the first few epochs, indicating a high rate of initial learning. Similarly, the two curves do not diverge significantly, suggesting good generalization ability and, above all, the absence of overfitting. The use of the ADAM optimizer in conjunction with the regularization technique improved the model’s stability and efficiency.
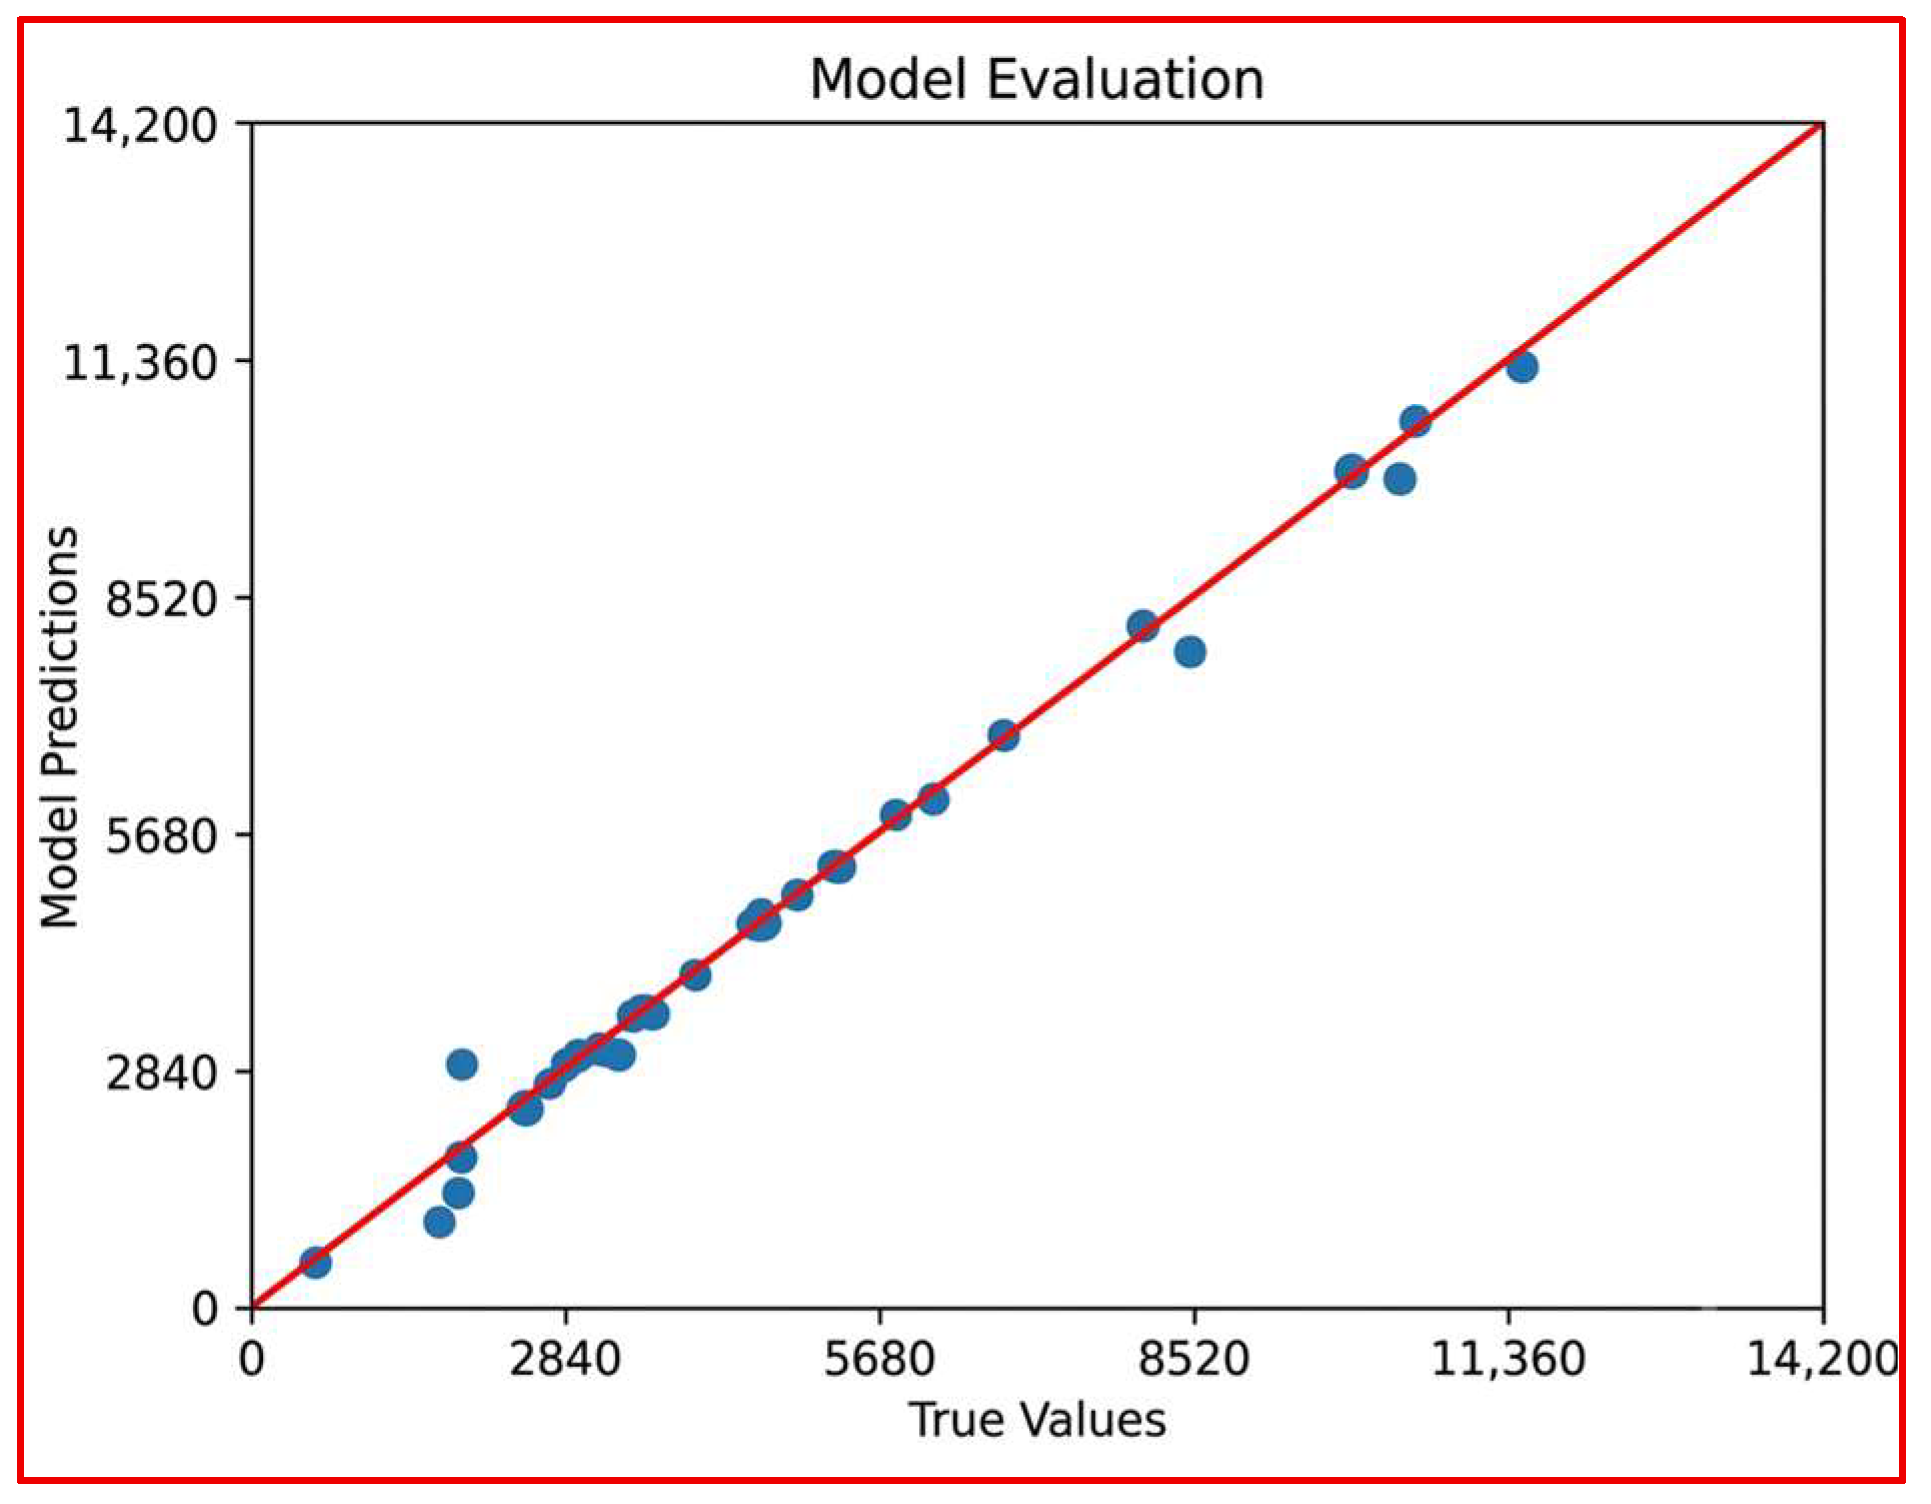
To analyze the predictive capability of the RN2 model, the values from the test subset were compared with the forecast generated by the model (Figure 7); this allows us to assess whether the configuration parameters are appropriate.
Figure 7.
Model Evaluation RN2. Comparison between the observed and predicted demand values. The red diagonal line represents the ideal agreement between predicted and observed values, while the blue dots represent the predictions generated by the neural network model.
The figure shows a high degree of agreement between the predicted values (blue dots) and the actual values (red line), indicating a very strong agreement between predicted and observed values. The data points are closely clustered, suggesting that the model successfully captured the relationship between the input variables and the target variable. The low dispersion of the data points suggests a high degree of accuracy in the estimates. This model represents a significant improvement over the first model, demonstrating more robust predictive performance.
The model results, along with an RMSE of 127.7 and a MAPE of 1.01%, indicate that the RN2 network offers better fit and reliability in forecasting demand for the dairy plant. Despite the limited dataset used for model training, adequate predictive performance was achieved; the low variability in the analyzed data, combined with the ability of neural networks to learn patterns even from limited samples, contributed to the model’s generalization.
These factors helped identify relationships between the variables to generate accurate predictions despite the limitations of the available data. Once the model was trained and evaluated, predictions were made (Table 3) for the months of April through December.
Table 3.
RN2 Forecasts for April–December 2026.
Subsequently, a simulation of the operational plant was conducted to assess its capacity in relation to projected demand levels. This process enabled a feasibility analysis of the production system, identifying potential constraints and verifying whether current capacity is sufficient to meet projected requirements while adhering to the company’s established operational policies regarding work hours and production days.
The forecasting results offered estimates of production demand, which were essential for the discrete-event simulation model. These forecasts formed the foundation for assessing whether the current production system could meet the anticipated market demand under the existing operational conditions. From an operational perspective,, the high forecasting accuracy achieved by RN2 helps reduce the uncertainty involved in production planning. With more dependable demand estimates, the company can anticipate future needs and assess production capacity expansion options before shortages become a problem. In this way, the forecasting model goes beyond simply predicting demand; it also supports strategic decision-making by providing valuable insights that enhance the quality and effectiveness of the subsequent discrete-event simulation analysis.
3.3. Current System Simulation
The current production system was modeled in FlexSim based on the operational assumptions outlined in Section 2.4. The simulation took into account equipment capacities, fixed processing times, preventive maintenance policies, a First-In, First-Out (FIFO) approach for material flow, operating schedules, and the available production resources. The validated demand forecasts from the RN2 model were used as input to assess whether the existing production system could meet the projected market demand under the current operating conditions.
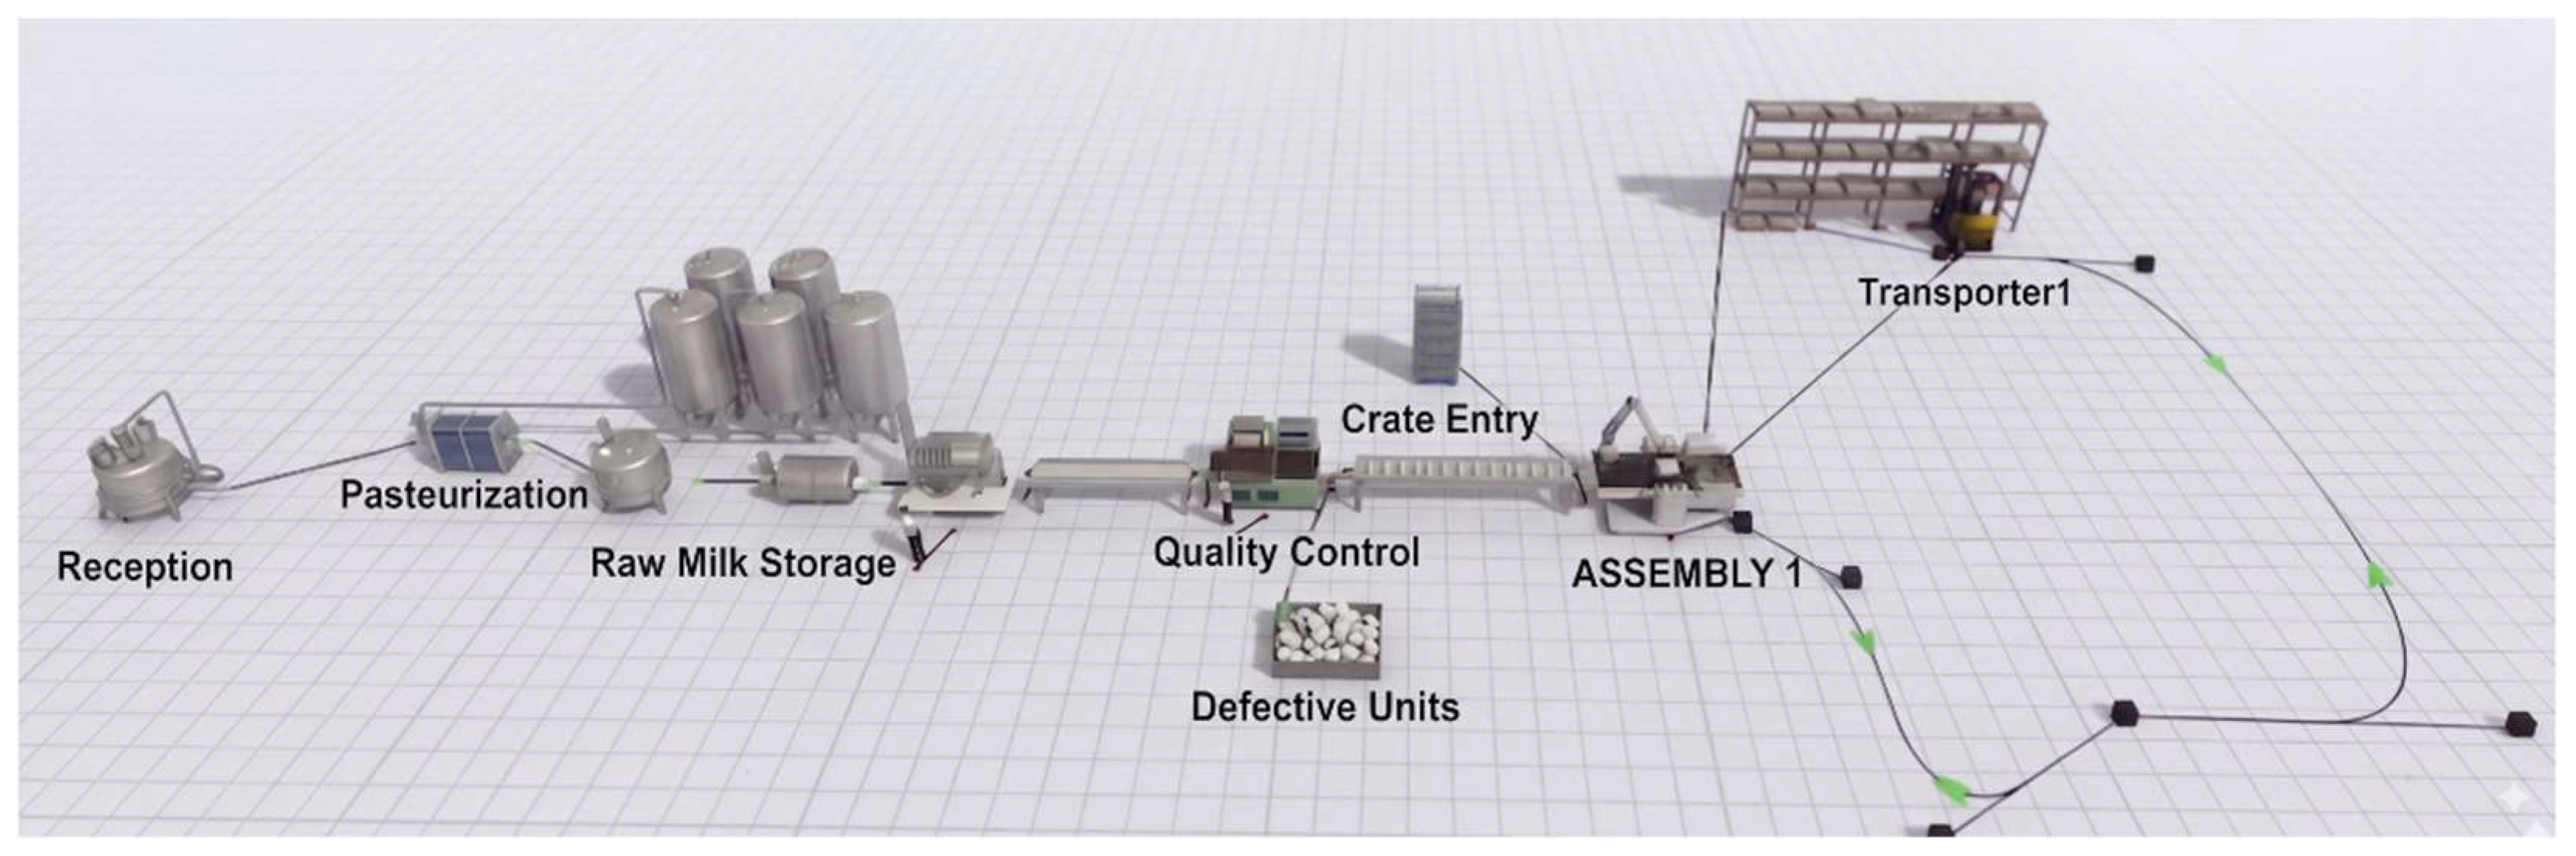
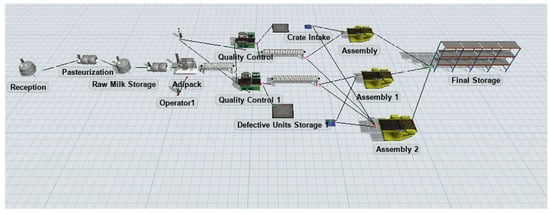
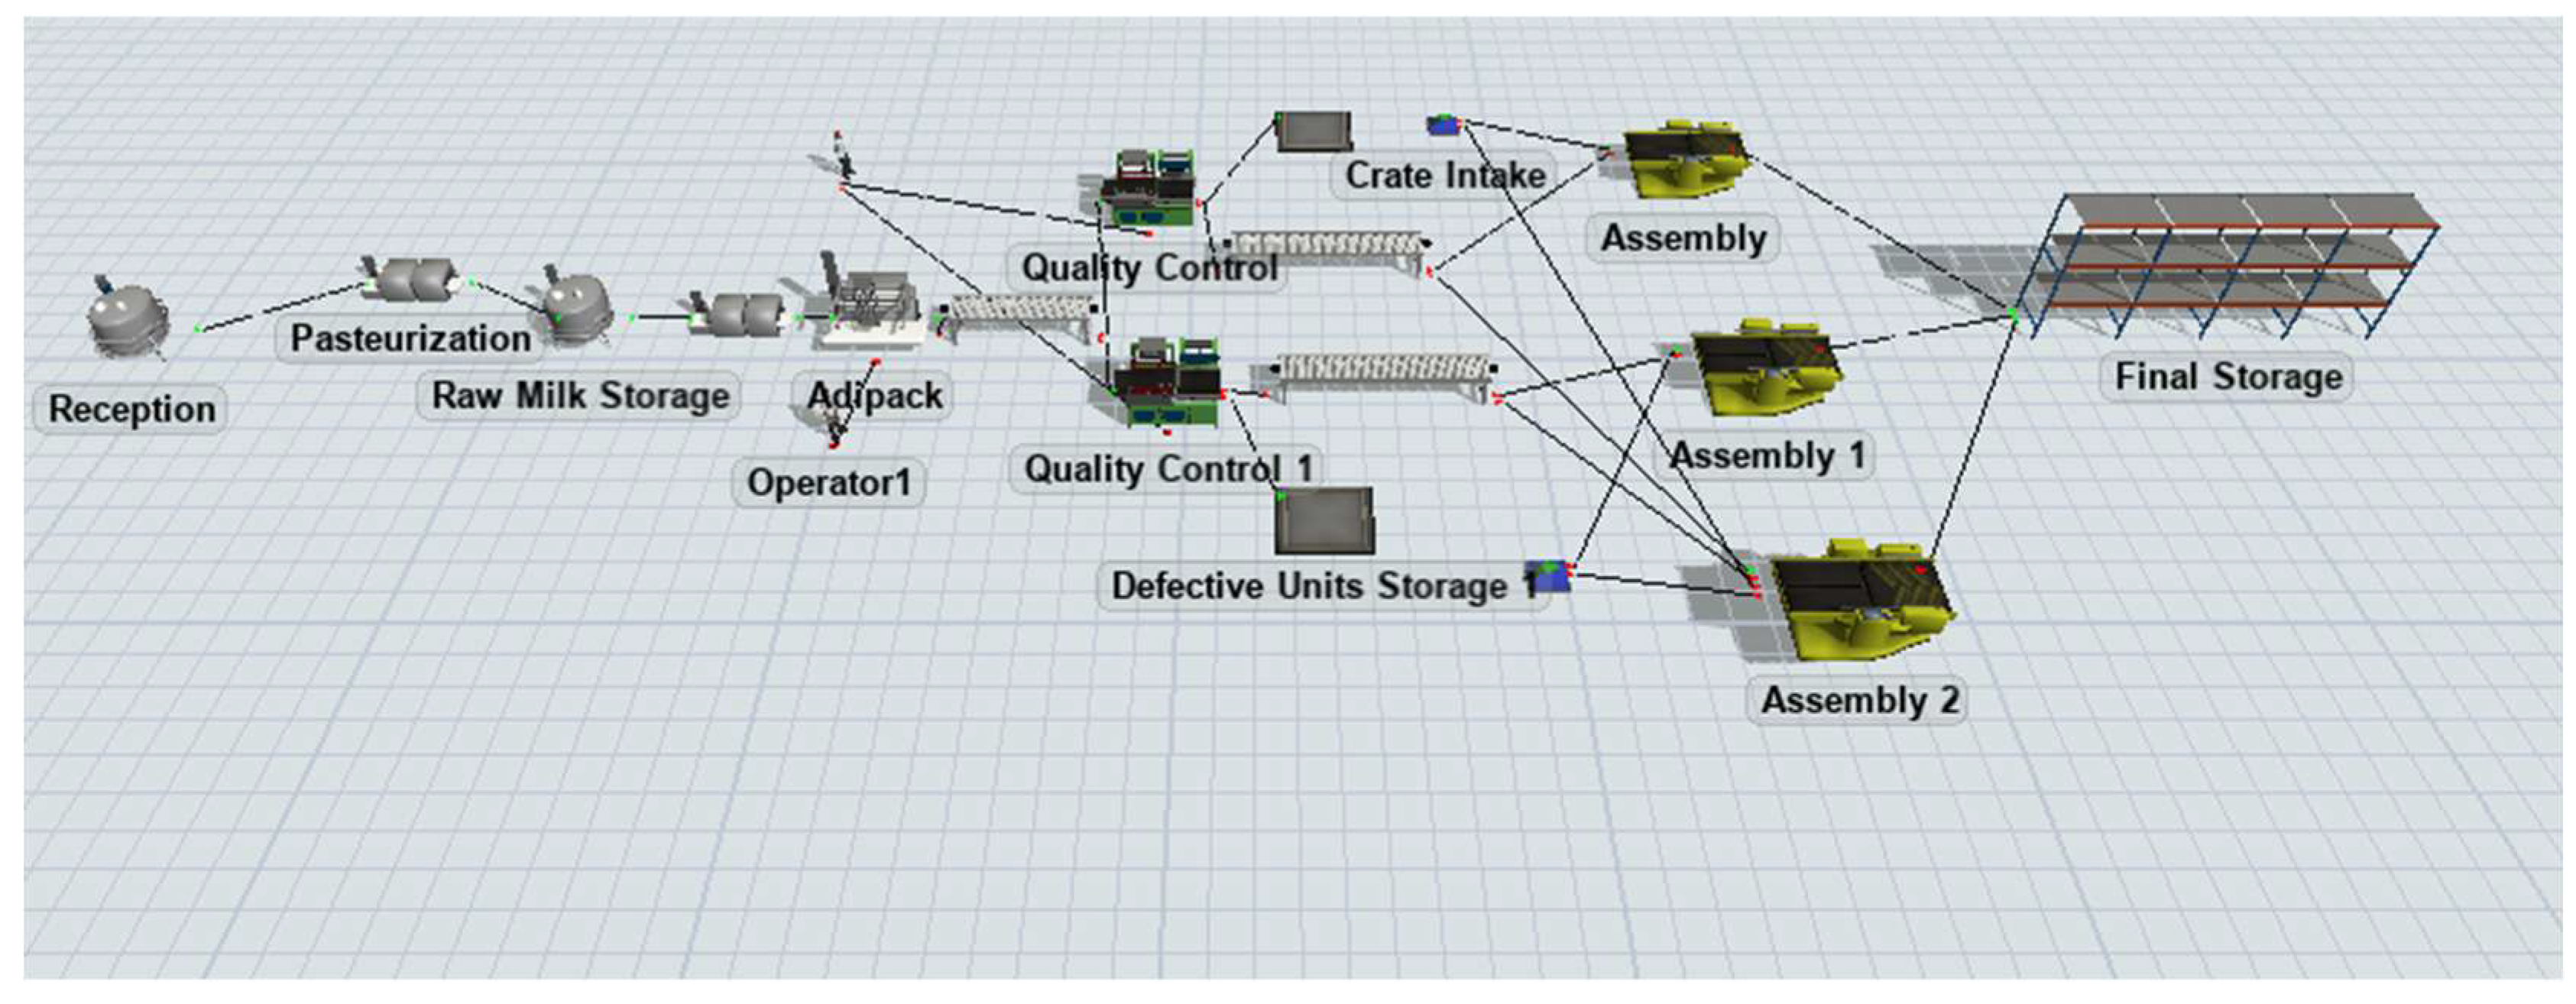
The simulation was developed based on the milk production process, which involves receiving, pasteurization, homogenization, packaging, and distribution of finished products. The plant consists of storage tanks, solid and liquid processors, forklifts, conveyors, and product quality control areas (Figure 8).
Figure 8.
Modeling and Simulation of the Current Production Logistics Process. The green arrows indicate the direction of flow/travel along the paths, and the black squares represent the network nodes (decision points or intersections) within the FlexSim simulation model.
In this regard, the company currently dedicates three days a week to the production of this product, beginning with the receipt of 1250 L of raw milk, which is then transferred to the storage tank until pasteurization (Fluid Processor). This equipment has a maximum capacity of 1500 L and a maximum output flow of 1 L; these quantities ensure that the milk is properly pasteurized, eliminating bacteria and guaranteeing its quality. After completing the heat treatment, the milk is stored in tanks (Fluid Tank) with a capacity of 1500 L.
The simulation rendered a daily output of 940 units, which breaks down to roughly 117 units per hour. given the company’s working schedule of three days each week for four weeks. The total monthly production capacity comes to 11,280 units. However, the RN2 model’s forecast suggests a peak demand of 13,987 units for October, creating a shortfall of 2707 units. Honestly, these findings show the existing production setup cannot meet the projected requirement; this is without adding more production days or extending working hours, actions that would disrupt the production schedules of other items made in the plant.
Daily production data from FlexSim was collated against the actual output to substantiate the simulation model under identical operating conditions logged by the company. The company currently fabricates roughly 940 units of the investigated product during an 8 h working shift. The simulation model also produced 940 units in 28,800 s (8 h), which resulted in a simulation error of 0% according to Equation (1). The close correspondence between the simulation results and the observed performance of the production system provides evidence that the model adequately represents the operational dynamics of the process under normal working conditions. The model was constructed based on deterministic processing times, stable operating parameters, and a predefined production schedule, which ensured that system behavior remained consistent throughout the analysis. As a result, repeated simulation executions generated identical outcomes, indicating the absence of stochastic variability within the modeled environment. Given these characteristics, a single simulation run was considered sufficient to validate the model and to assess the potential effects of the proposed production capacity expansion scenarios. Therefore, the model provides a reliable basis for supporting decision-making regarding future capacity planning and resource allocation.
The results indicate that the plant’s current production capacity is insufficient to meet the projected demand under the existing operating configuration. Although the simulation model successfully replicates current production conditions and provides a reliable representation of the system, the estimated monthly capacity of 11,280 units falls short of the forecasted peak demand of 13,987 units. This gap generates a production deficit of 2707 units that the company must address through operational adjustments.
In practice, this shortage is typically managed by extending production shifts or increasing the number of working days. While these measures provide a temporary solution, they also create additional pressure on the production schedule of other dairy products, leading to inefficiencies in resource utilization and overall plant performance. Consequently, the findings suggest that relying on short-term corrective actions is not a sustainable strategy for future demand fulfillment. Instead, the company should consider capacity expansion and improved resource allocation mechanisms to ensure that anticipated demand can be satisfied while preserving the stability and efficiency of its current production schedule.
These findings suggest that relying on overtime or adding extra production days can help address demand increases in the short term, but it is not a sustainable long-term solution. A more effective approach is to increase production capacity through strategic resource allocation, enabling the company to meet future demand consistently while maintaining stable operations. This strategy also helps prevent disruptions to the production schedules of other dairy products, ensuring a more balanced and efficient manufacturing process.
3.4. Bottleneck Detection
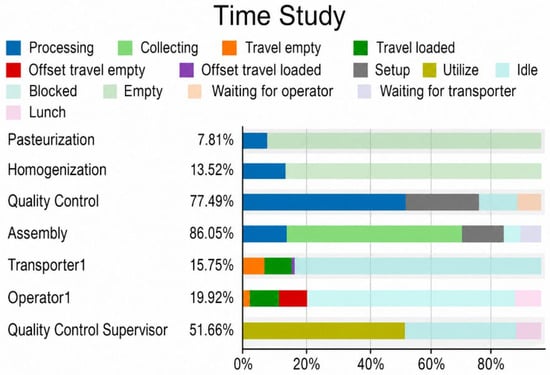
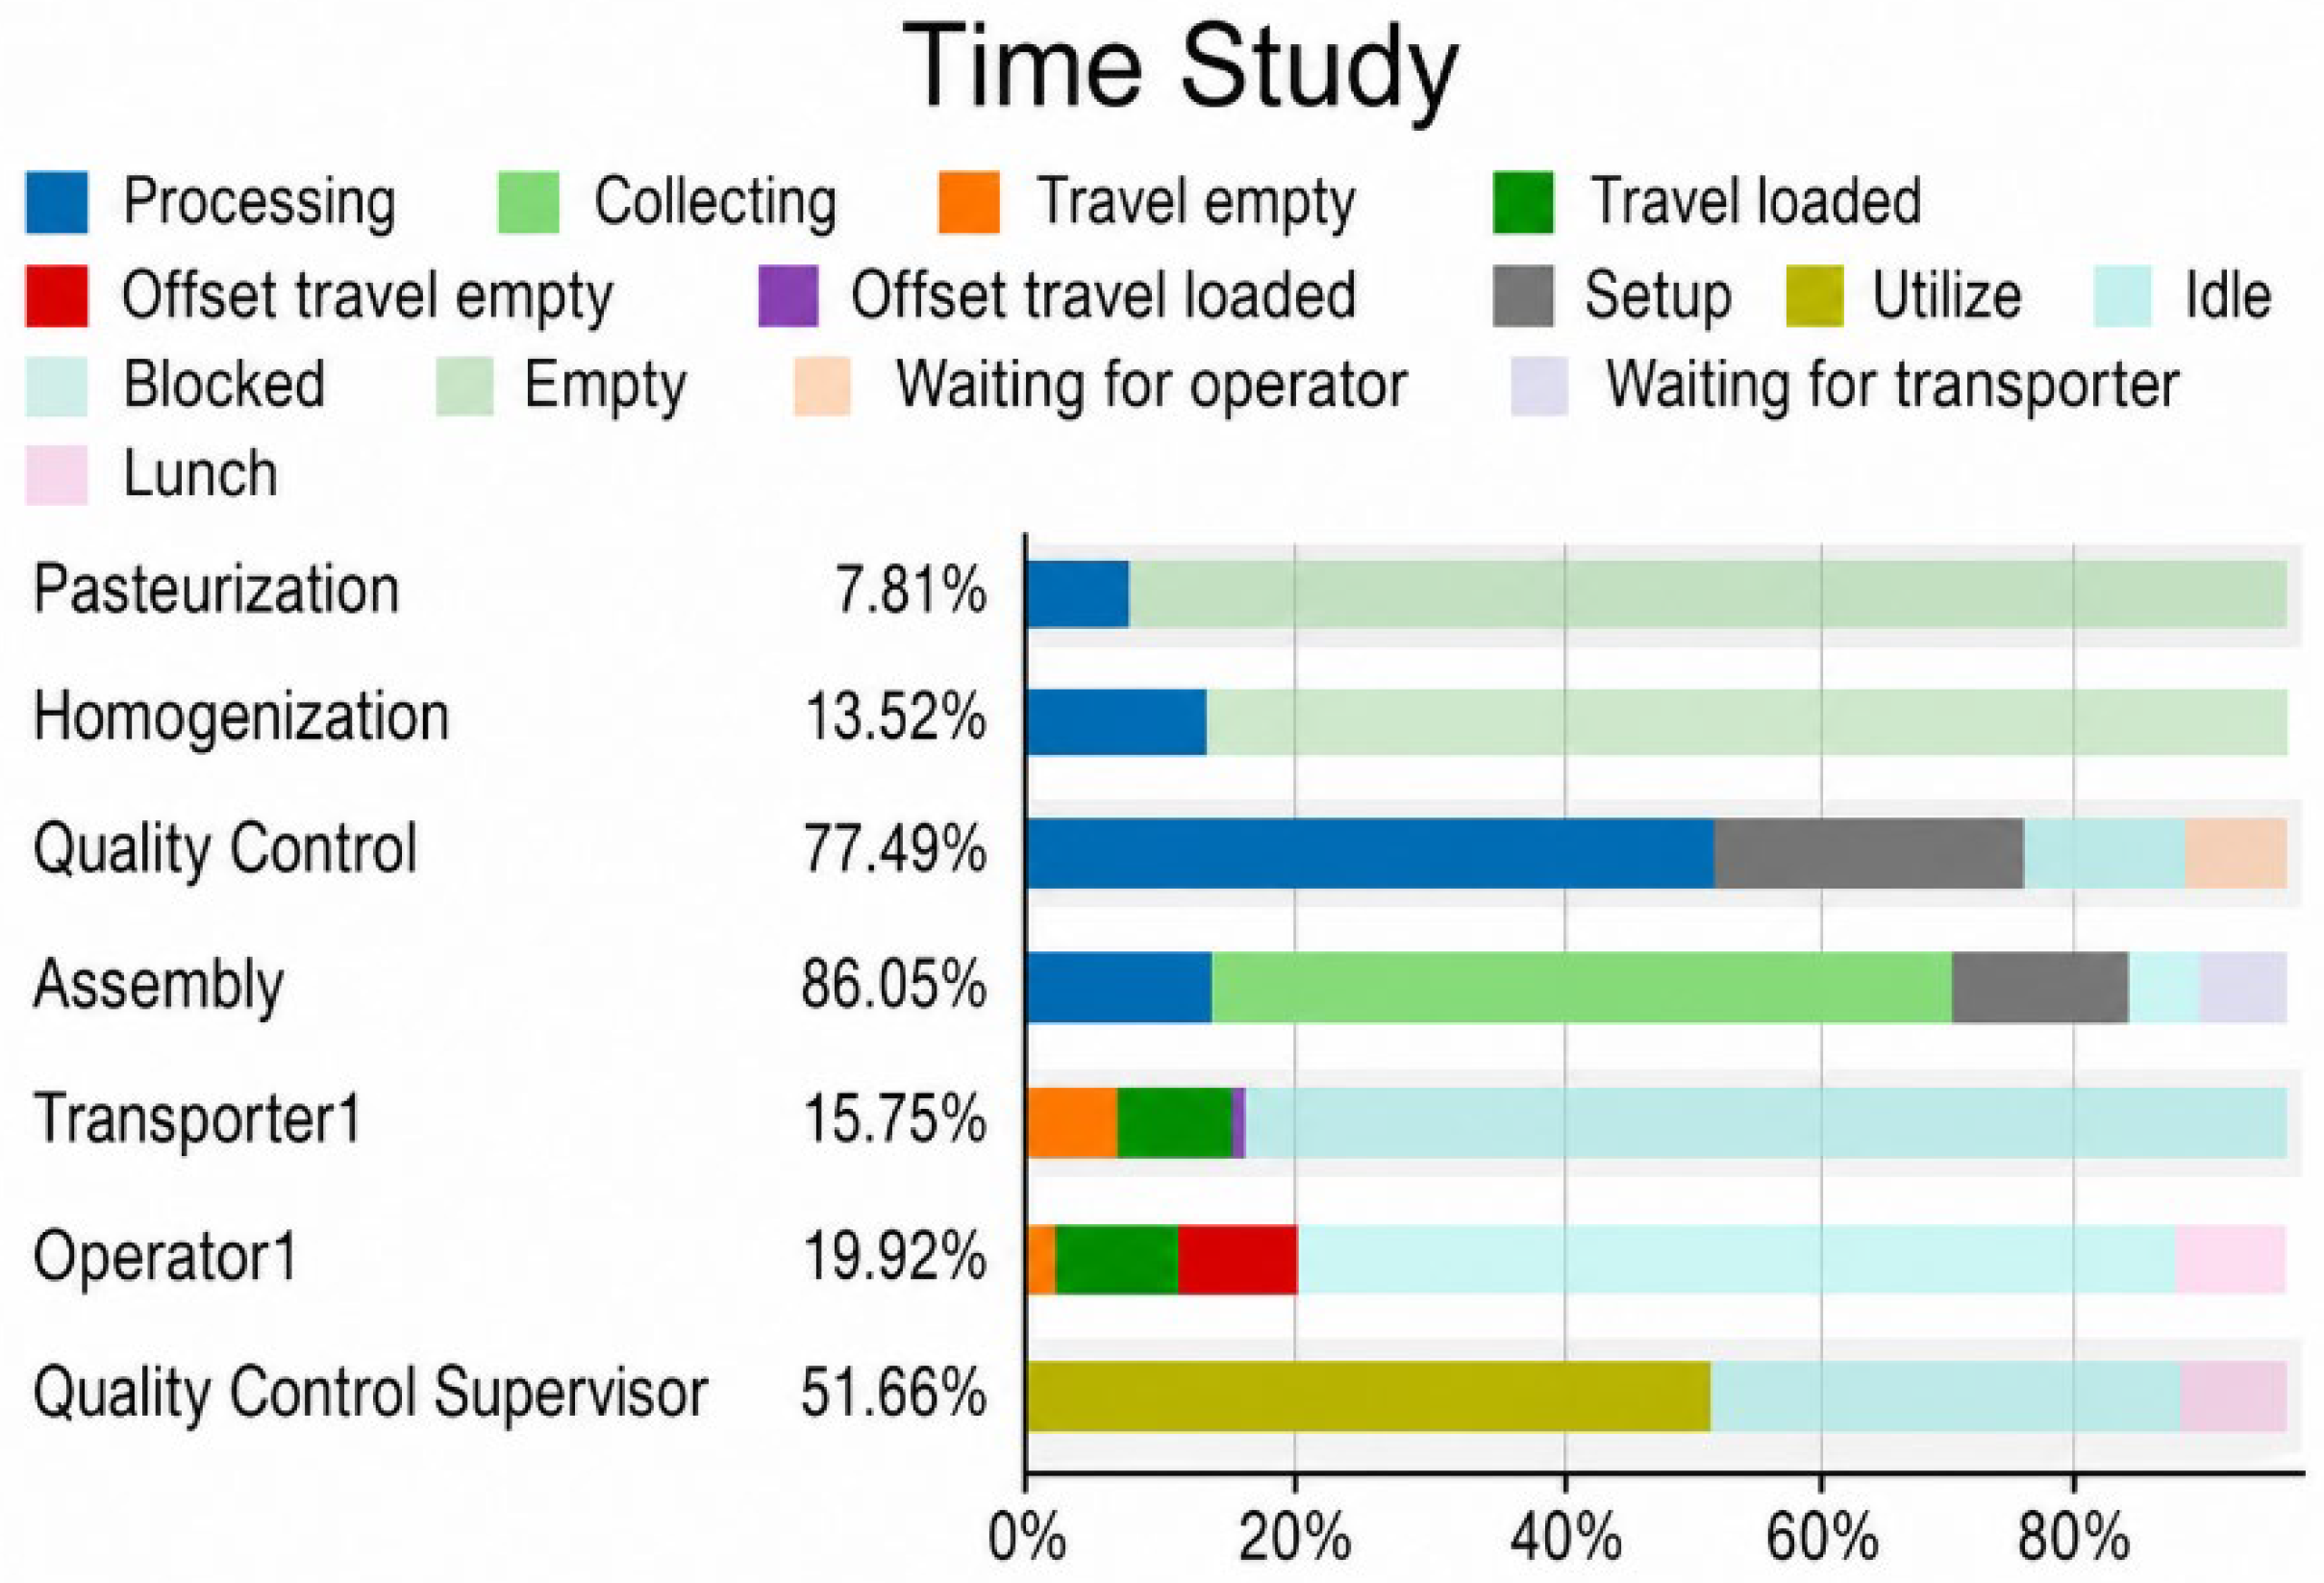
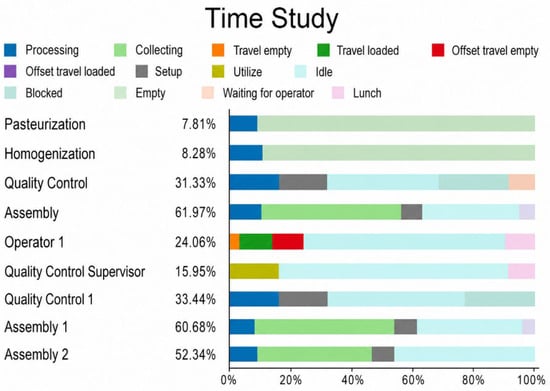
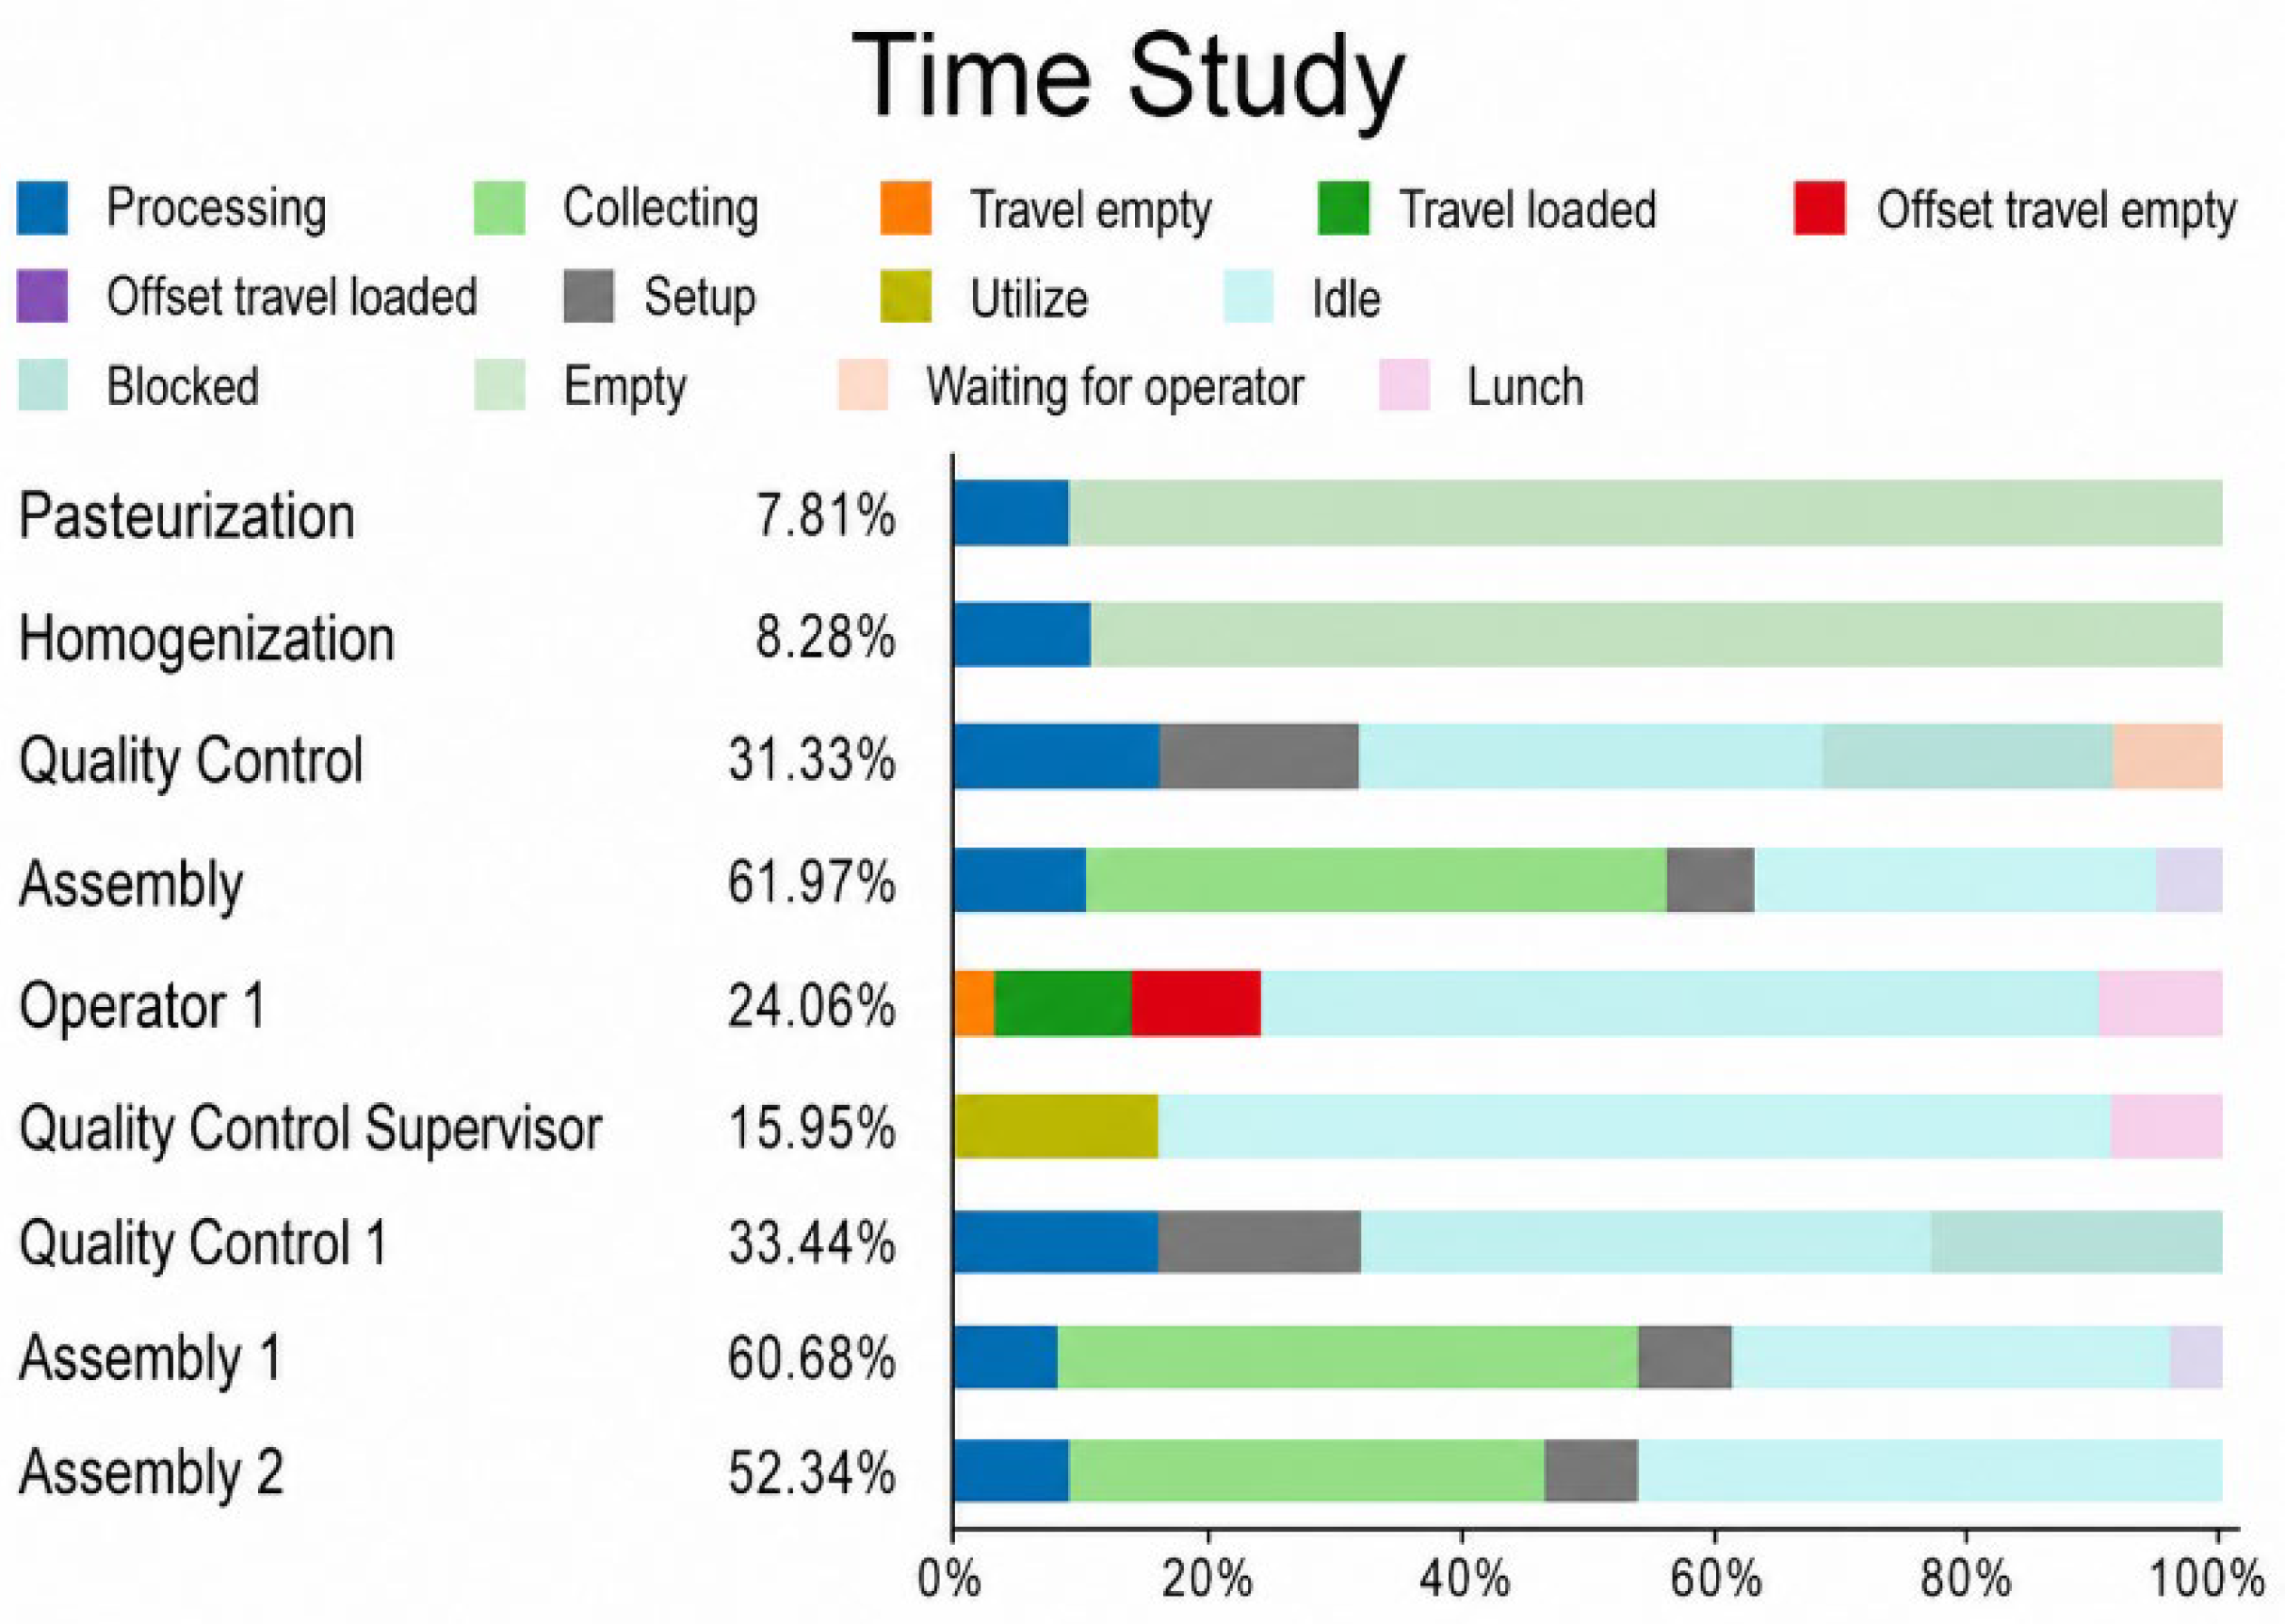
The simulation provided an analysis of the resource utilization indicators currently used by the company. The purpose was to identify the stations that limit production flow and constrain the capacity to manufacture dairy products. Figure 9 shows the resource utilization levels at each station under current operating conditions.
Figure 9.
Current Scenario Dashboard.
The results revealed significant differences in resource utilization across the entire system. The “Assembly” 1 station had the highest utilization rate at 86.05%, followed by “Quality Control” at 77.49% capacity; these values are considerably higher than those of other stations observed, and their high utilization indicates that these stations are operating at their maximum effective capacity, constituting the main constraints limiting the plant’s production flow.
The analysis suggests an opportunity to improve resource utilization. The optimization proposal will focus on improving the capacity of the slowest stages and reviewing the workflow at critical stations to reduce queues and maintain an efficient and balanced system. The percentages indicate an imbalance in the distribution of work throughout the product manufacturing process. This discrepancy suggests that production capacity is limited by the final product preparation operations.
The bottleneck analysis also highlights the value of understanding how resources are being used before committing to new equipment investments. Instead of increasing capacity across the entire production line, the simulation helped pinpoint the specific workstations that were limiting production flow. By focusing improvements on these critical areas, the company can avoid unnecessary spending and achieve greater operational gains from its capacity expansion efforts.
3.5. Proposed Optimization Model
After identifying the bottlenecks in the “Assembly” and “Quality Control” workstations, two production capacity expansion scenarios were developed and evaluated using the validated simulation model. The purpose of these scenarios was not only to reduce the waiting times and congestion observed at these critical stages of the process, but also to improve the overall flow of materials throughout the production system. By doing so, the study aimed to increase the plant’s production capacity without disrupting its current operating structure. Given that the company receives approximately 1250 L of raw milk per production day, the proposed alternatives were designed to make better use of the available raw material while respecting existing scheduling practices and operational limitations. This approach ensured that the evaluated solutions were both practical and aligned with the plant’s real operating conditions.
3.5.1. Scenario 1
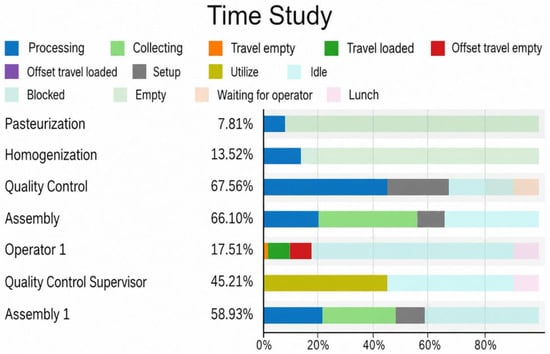
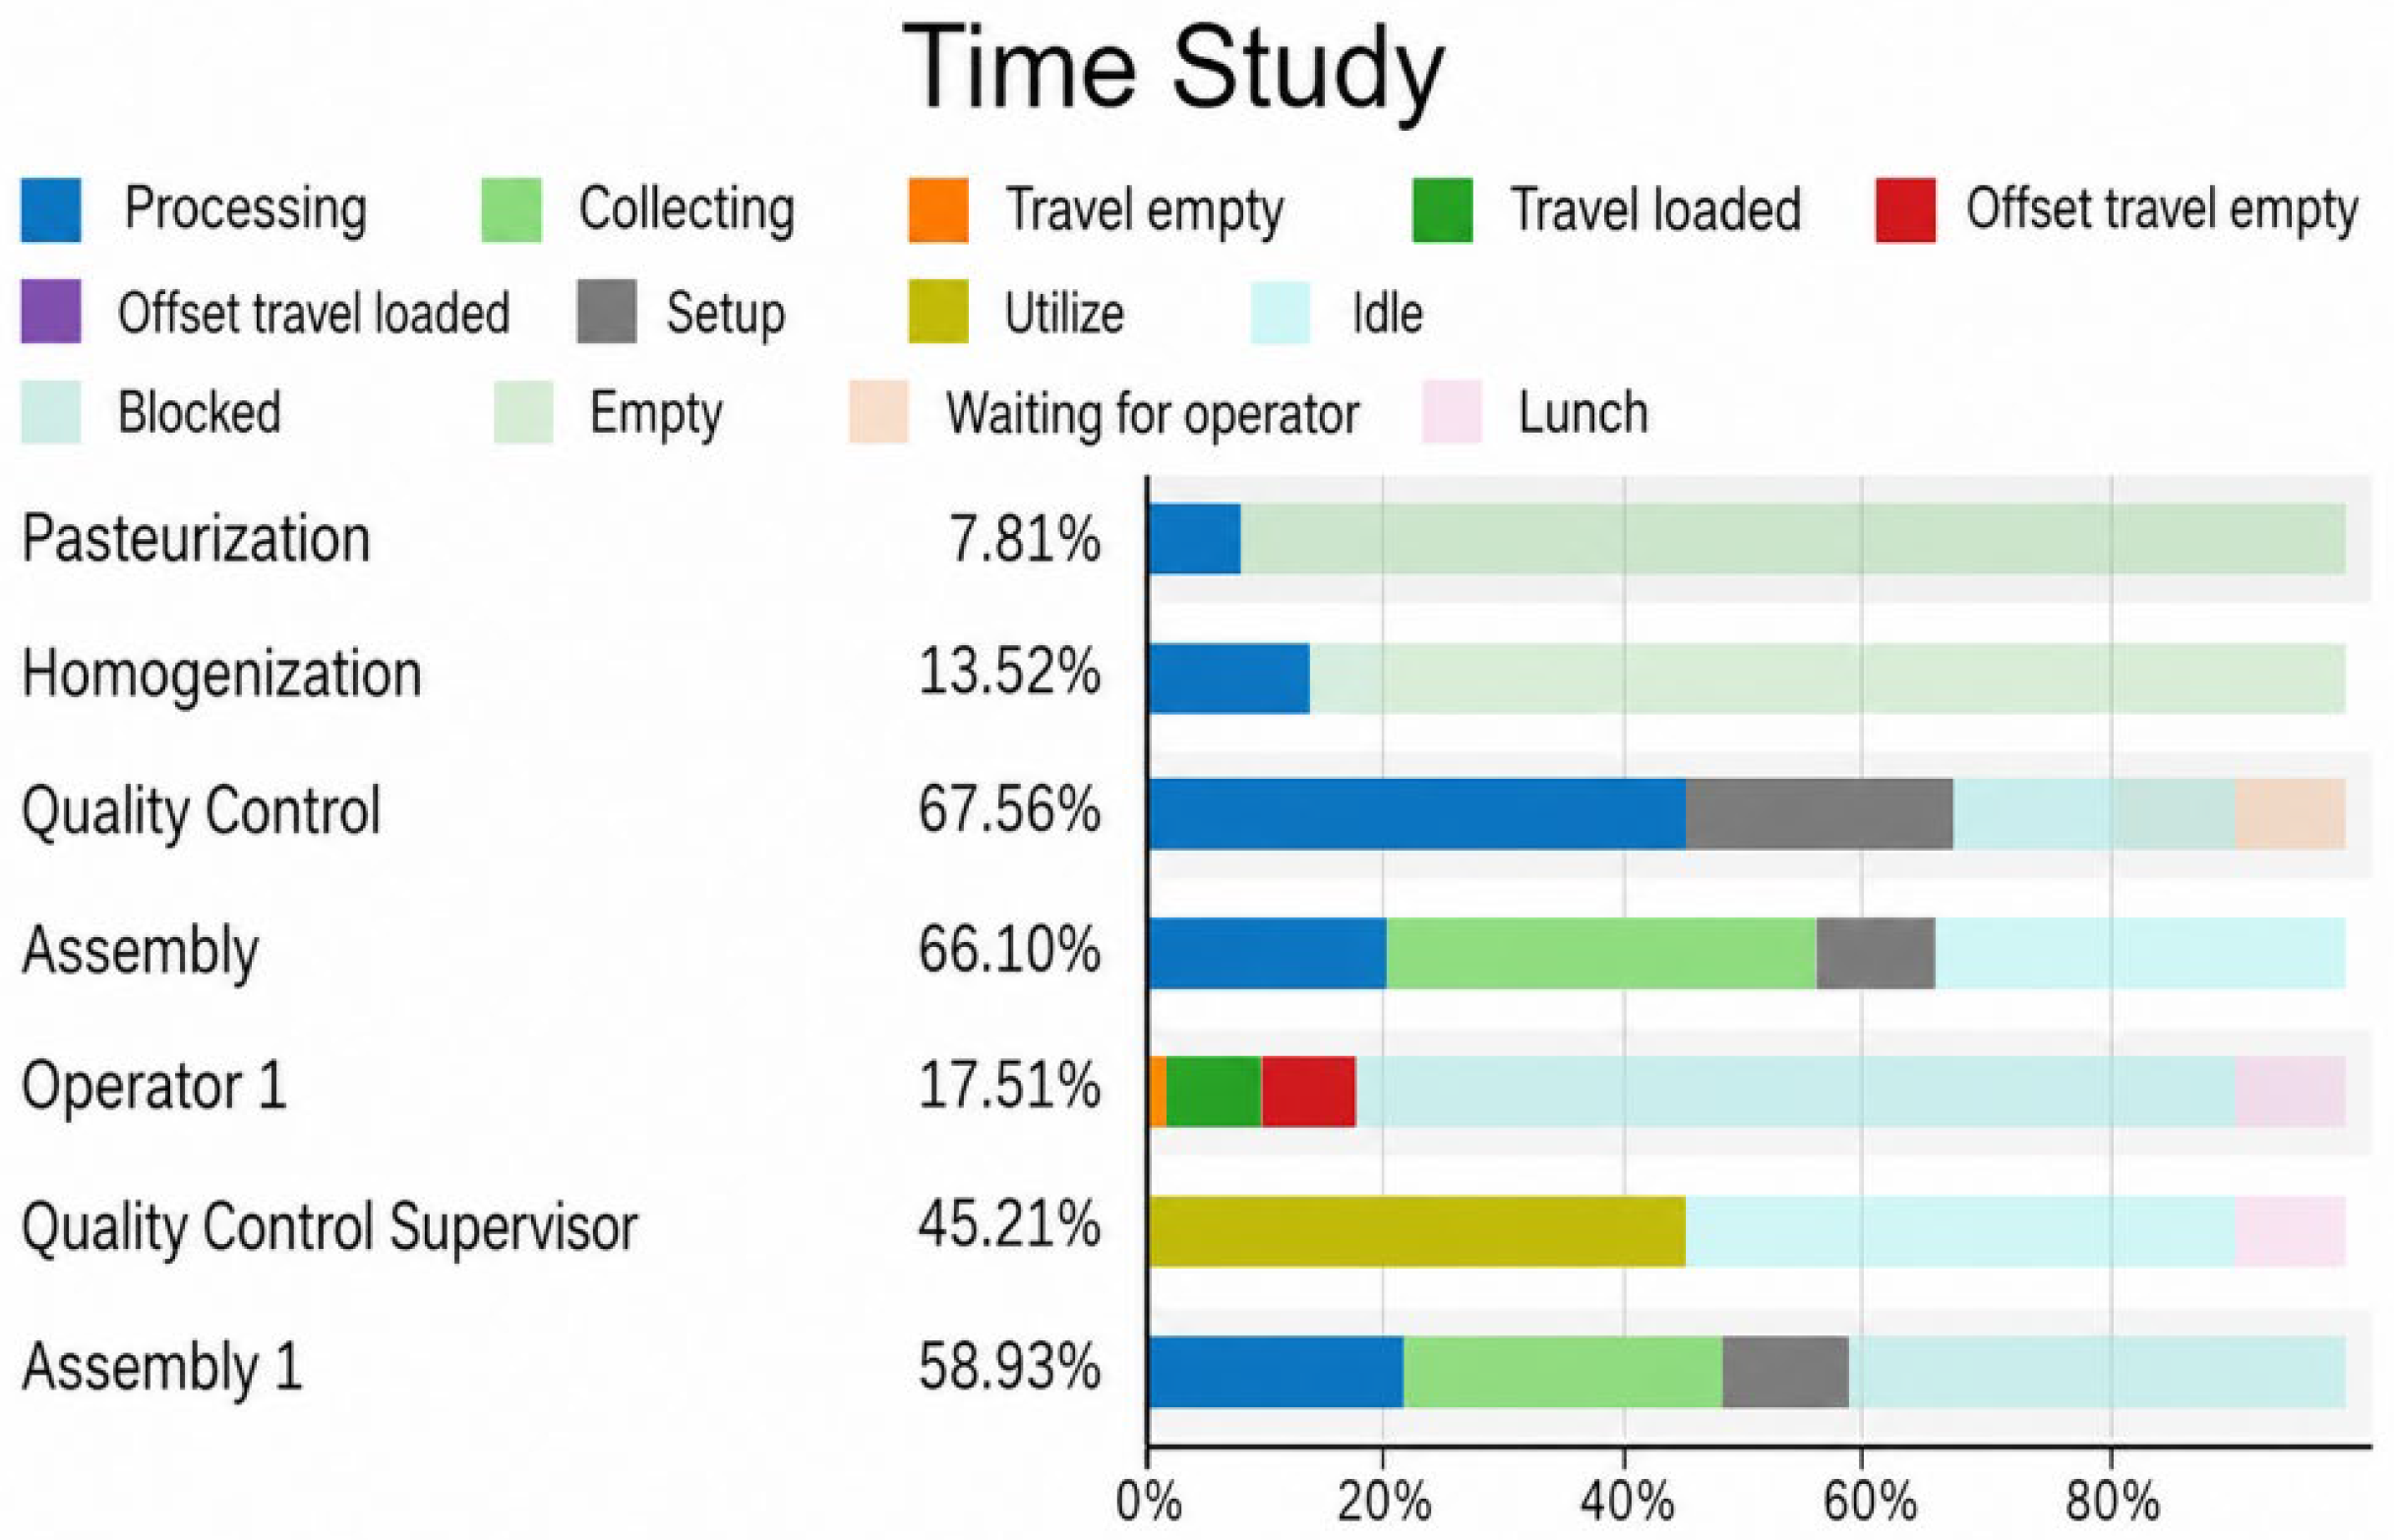
Scenario 1 (Figure 10) was proposed as an initial step toward increasing the plant’s production capacity. This alternative involved adding one “Assembly” station while keeping the existing “Quality Control” configuration unchanged. The intention was to determine whether addressing the main bottleneck identified in the “Assembly” stage would be enough to improve the flow of products through the system and increase overall output. By focusing on a single modification, the scenario also allowed for a clearer assessment of the contribution of the “Assembly” workstation to the capacity limitations observed in the current production process. Ultimately, this analysis helped determine whether the forecasted demand could be met through a relatively simple capacity adjustment or whether additional changes would be required in other stages of the system.
Figure 10.
Scenario 1 Dashboard.
The results showed an improvement in the workload distribution at the problematic “Assembly” station by dividing the workload between the original station (66.10%) and the additional station (58.93%), indicating a better balance of capacity. The “Quality Control” station also saw its operating capacity decrease by 12.81%, representing an improvement over the current scenario. Total production output with the new configurations increased from 940 to 986 units per day, a 9.56% improvement. Although this scenario reduced pressure on the problematic stations, monthly production stands at 11,832 units, which is still insufficient to meet current and projected demand, suggesting other configurations to make full use of the raw material.
Although this configuration helped balance the workload more effectively and resulted in higher daily production levels, the increase was still not sufficient to meet the projected demand. The simulation results showed that the plant’s monthly production capacity remained below the expected requirements, indicating that some limitations within the system persisted. As a result, it became necessary to consider additional capacity improvements at other critical workstations. Expanding capacity beyond the “Assembly” stage would not only help eliminate the remaining constraints but would also allow the company to make better use of the available raw milk and further improve overall production performance.
The simulation results revealed that eliminating only one bottleneck was not sufficient because other highly utilized workstations continued to restrict the production flow. While the improvements made to the “Assembly” station significantly increased its performance, capacity constraints at the Quality Control stage continued to limit the overall production flow. As a result, the system was unable to achieve the production levels required to meet demand, highlighting the need for a broader and more coordinated capacity expansion strategy.
3.5.2. Scenario 2
Scenario 2 (Figure 11) was developed as a more comprehensive capacity expansion alternative by increasing the resources available at both the “Assembly” and “Quality Control” workstations, which were identified as the main bottlenecks in the production process. The rationale behind this configuration was that improving only one stage of the system might shift the constraint to another workstation rather than fully resolving the capacity limitations. By expanding both areas simultaneously, the scenario aimed to promote a more balanced flow of products across the production line, reduce congestion at critical stages, and improve overall system performance. In addition, this alternative was intended to maximize the utilization of the raw milk received by the company, allowing for a greater proportion of the available material to be converted into finished products while operating within the plant’s existing production framework.
Figure 11.
Scenario 2 Dashboard.
In Scenario 2 (Figure 12), the product’s daily production capacity increased from 940 to 1200 units, representing a 27.7% increase. Consequently, the monthly production capacity reaches 14,400 units, which is sufficient to meet current and projected demand; furthermore, any surplus units are allocated to safety stock to cover potential demand fluctuations.
Figure 12.
Optimized production system configuration obtained for Scenario 2 in FlexSim. The red and green dots indicate the connection ports used in FlexSim to establish the material flow among the processing stations.
Based on the simulation results, Scenario 2 was identified as the most effective alternative for the company. In contrast to the first scenario evaluated, which only addressed one of the production constraints, Scenario 2 eliminated the bottlenecks identified in both the “Assembly” and “Quality Control” stages, enabling the system to achieve the capacity required to meet the projected demand. Furthermore, this improvement was achieved without extending working hours or adding production days, helping preserve the existing production schedule for the company’s other dairy products. Therefore, Scenario 2 represents the most balanced and sustainable capacity expansion strategy identified in this study.
Overall, the comparison of the two scenarios highlights the importance of addressing the bottlenecks identified in the production process when seeking to increase plant capacity. Although Scenario 1 reduced congestion at the “Assembly” stage and improved production output, some limitations remained within the system. In contrast, Scenario 2 provided a more effective solution by increasing capacity in both “Assembly” and “Quality Control”, resulting in a better balance of workloads across the production line. This improvement reduced operational constraints and allowed the system to operate more efficiently. Consequently, the plant achieved its maximum practical production capacity of 1200 units per day, making it possible to fully utilize the available raw milk supply while continuing to operate under its existing production schedule (Table 4).
Table 4.
Comparative Performance Indicators of the Evaluated Production Scenarios.
This comparison indicates a gradual improvement in system performance across each scenario. With the configurations established in Scenario 1, production capacity was increased by adding another assembly station; however, production remained insufficient to meet demand. On the other hand, Scenario 2 achieved the highest manufacturing capacity while maintaining balanced levels at each station in the plant. The evidence highlights that the implementation of new equipment in the plant eliminates operational constraints and ensures adequate system performance while adhering to the company’s labor policies.
Beyond the quantitative improvements achieved in Scenario 2, the results of this study showed that increasing capacity at a single workstation is not enough to significantly improve the overall performance of the production system. The comparison between the evaluated scenarios revealed that when one bottleneck is eliminated, production constraints can quickly appear at other stages of the process. For this reason, it is essential to consider the balance of capacity across the entire production line rather than focusing on individual workstations. The simulation model proved valuable in identifying these interactions before any physical changes were implemented, allowing the company to evaluate different capacity expansion alternatives with lower investment risk. In addition, the analysis made it possible to determine the minimum resource configuration required to meet the forecasted demand, helping improve operational efficiency while maintaining the current production schedule for the company’s other dairy products.
4. Discussion
Combining demand forecasting with discrete-event simulation provides an effective framework for operational planning in dairy manufacturing. The forecasting study revealed that current production capacity is insufficient to meet estimated demand, while the simulation model facilitated the identification of operational bottlenecks, which were then used to evaluate capacity expansion alternatives. The proposed scenario increased production capacity from 11,280 to 14,400 units per month, meeting the forecasted demand while maintaining control over the capacity of each station throughout the process.
The findings regarding prediction indicate that the intelligent neural network model significantly outperforms the ARIMA model. Although the ARIMA statistical model is frequently used for datasets, it failed to capture the variability in the historical demand series, resulting in estimates that were nearly constant. In contrast, the neural network successfully captured the nonlinear patterns in the training data, supporting previous studies in which deep learning models outperform traditional models by up to 17.1% in prediction accuracy [31,43] compared to traditional methods.
On the other hand, the evidence confirmed the use of discrete-event simulation as a tool to support informed decision-making, particularly for identifying operational constraints and limitations and analyzing improvements without interrupting actual production activities. Similar results were reported by [44] who, by using simulations, were able to intervene in “Assembly” processes without affecting the actual plant, thereby improving the flow of materials, production, and information. Another important advantage of the validated simulation model was its ability to evaluate different capacity expansion alternatives without affecting ongoing plant operations. This allowed potential improvements to be tested in a virtual environment before making any changes to the actual production system. As a result, the company could analyze the expected impact of each alternative, identify possible operational challenges, and support decision-making with greater confidence. By avoiding direct experimentation on the production line, the risks, costs, and disruptions typically associated with implementing physical changes were significantly reduced.
The allocation of resources to the problematic “Assembly” and “Quality Control” stations significantly improved plant performance. The optimal scenario increased product manufacturing capacity by 27.7% and reduced the workload at these stations through balanced resource allocation. Similar results were obtained in the study of [45], who demonstrated the effectiveness and efficiency of the simulation scenarios for improving productivity by moving from 80 to 90 units compared to the original system. Similarly, [46] demonstrated that redesigning the cross-docking layout using simulation can increase deliveries by up to 35%.
The estimates generated by the neural network serve as input data for the simulation model, enabling the assessment of production capacity under actual market conditions rather than assumptions based on historical data. One of the main contributions of this research is the integration of demand forecasting and discrete-event simulation into a single decision-support approach. While these methods are often applied separately, this study combines them to create a more comprehensive framework for production planning. In this way, the demand forecasts are not treated as an isolated output but are directly incorporated into the simulation model to evaluate how the production system would perform under future demand conditions. This integration makes it possible to assess capacity requirements more realistically and provides a stronger basis for identifying and evaluating improvement strategies before they are implemented in practice.
Many simulation studies evaluate system performance under predefined conditions; the proposed approach uses estimates from the intelligent model as dynamic input to analyze production capacity. This integration allows the industry to anticipate manufacturing requirements by assessing whether current capacity will be sufficient to meet future market needs and identifying potential operational constraints before they occur in the actual plant. With this information, the company can adopt a strategic rather than a reactive planning approach, considering optimization proposals and making decisions based on empirical data to respond promptly to market needs.
The results of the study are positive; however, it has limitations. The demand forecasting model used historical data for a single product, and the production system simulation omitted potential variations related to the other products offered by the company. Future research could incorporate additional factors from other products to create a broader database, thereby improving the accuracy of the forecast and the realism of the simulation. Furthermore, the simulation model was developed under deterministic operating conditions, using constant processing times provided by experienced plant personnel. This approach was considered appropriate because the company follows a highly standardized production process, allowing the model to closely reflect actual operating conditions. Nevertheless, some aspects of real-world production may vary over time due to operational, environmental, or managerial factors. For this reason, future studies could enhance the proposed framework by incorporating stochastic processing times, alternative demand scenarios, and sensitivity analyses. Doing so would provide a broader understanding of how the system responds to uncertainty and would help evaluate the robustness of the proposed capacity expansion strategies under different operating conditions.
5. Conclusions
The proposed methodology successfully demonstrated that integrating demand forecasting with discrete-event simulation provides an effective decision-support framework for production planning in dairy manufacturing. The intelligent model predicted that demand would exceed the current production capacity of 11,280 units, confirming a capacity gap that jeopardizes the company’s ability to meet customer needs.
Simulation of the plant’s current system revealed that the “Assembly” and “Quality Control” stations are the bottlenecks affecting system performance. Furthermore, the results showed that the existing configuration is unable to meet either the projected demand or the current demand based on historical data, requiring overtime at the plant or even an additional workday. Therefore, the simulation model proved to be an effective decision-making tool by evaluating the system’s behavior and identifying opportunities for improvement.
The proposed simulated scenario incorporates two “Assembly” stations and one “Quality Control” station, increasing capacity from 11,280 to 14,400 units per month—a 27.7% improvement. The new configuration eliminated the identified bottlenecks, balanced the workload at each station, and successfully met both current and projected demand. These findings demonstrate the practical value of combining intelligent forecasting techniques and simulation to optimize planning in manufacturing plants.
Finally, beyond the improvement achieved in operational capacity, the main contribution of this research is to demonstrate that integrating demand forecasts into simulation scenarios allows for a better assessment of the system’s future performance in situations not yet observed in the actual plant. Anticipating such situations enables companies to analyze improvement options before fluctuations in consumption affect operational performance. In this regard, the proposed framework offers a valuable approach for supporting operational planning and strategic decision-making in manufacturing environments. Its integration of demand forecasting and simulation allows companies to anticipate future production needs, assess capacity expansion options in advance, and determine the most suitable course of action before committing resources. As a result, organizations can make more informed investment decisions, reduce operational risks, and improve their ability to respond effectively to future demand requirements.
Beyond its application to the case study company, the framework developed in this research demonstrates the potential of integrating artificial intelligence and discrete-event simulation to support capacity planning decisions in manufacturing systems. Although the study focused on the production of 1 L packaged milk, the methodology can be adapted to other dairy products and production environments where demand uncertainty and resource constraints affect operational performance. The results show that combining forecasting and simulation provides managers with a practical tool for evaluating alternative capacity expansion strategies before investing in physical resources. Future studies could extend this work by incorporating advanced forecasting models, economic evaluation criteria, optimization techniques, and real-time production data. Such improvements would increase the framework’s applicability and help organizations make more agile, efficient, and resilient decisions in increasingly competitive and dynamic markets.
Author Contributions
Conceptualization, D.M.B.D.H. and D.M.C.M.; methodology, D.M.B.D.H. and D.M.C.M.; software, D.M.B.D.H.; validation, D.M.B.D.H. and D.M.C.M.; investigation, D.M.B.D.H. and D.M.C.M.; data curation, D.M.B.D.H.; writing—original draft preparation, D.M.B.D.H.; writing—review and editing, D.M.C.M.; visualization, D.M.B.D.H.; supervision, G.A.G.M. and M.J.C.G.; project administration, G.A.G.M. and M.J.C.G. All authors have read and agreed to the published version of the manuscript.
Funding
This research received no external funding.
Data Availability Statement
The data that support the findings of this study are available from the corresponding author upon reasonable request. Restrictions apply to the availability of these data because they were obtained from a private company and are not publicly available.
Conflicts of Interest
Author Gustavo Adolfo Guerrero Marín is currently employed by Alimentarte S.A. BIC as General Manager. Alimentarte S.A. BIC had no role in the study design, data collection, data analysis, interpretation of the results, manuscript preparation, or the decision to submit the manuscript for publication. The remaining authors declare that the research was conducted in the absence of any commercial or financial relationships that could be construed as a potential conflict of interest.
References
- Oyewo, B.; Alta’any, M.; ALo, K.A.; Dube, N.T. Determinants and impact of production planning and control accounting techniques on competitiveness of manufacturing companies: A structural equation modelling approach. Account. Res. J. 2024, 37, 453–478. [Google Scholar] [CrossRef] [Scilit]
- Ekundayo, F. Leveraging Ai-Driven Decision Intelligence For Complex Systems Engineering. Int. J. Res. Publ. Rev. 2024, 5, 5489–5499. [Google Scholar] [CrossRef] [Scilit]
- Park, J.; Bae, H. Big Data and AI for Process Innovation in the Industry 4.0 Era. Appl. Sci. 2022, 12, 6346. [Google Scholar] [CrossRef] [Scilit]
- Janík, S.; Szabó, P.; Mĺkva, M.; Mareček-Kolibiský, M. Effective Data Utilization in the Context of Industry 4.0 Technology Integration. Appl. Sci. 2022, 12, 10517. [Google Scholar] [CrossRef] [Scilit]
- Kumbhar, M.; Ng, A.H.C.; Bandaru, S. A digital twin based framework for detection, diagnosis, and improvement of throughput bottlenecks. J. Manuf. Syst. 2023, 66, 92–106. [Google Scholar] [CrossRef] [Scilit]
- Mahmoodi, E.; Fathi, M.; Tavana, M.; Ghobakhloo, M.; Ng, A.H.C. Data-driven simulation-based decision support system for resource allocation in industry 4.0 and smart manufacturing. J. Manuf. Syst. 2024, 72, 287–307. [Google Scholar] [CrossRef] [Scilit]
- Benker, M.; Rommel, V.; Zaeh, M.F. An investigation into the economic efficiency of different maintenance strategies based on a discrete event simulation. Procedia CIRP 2022, 107, 428–433. [Google Scholar] [CrossRef] [Scilit]
- Kassoul, K.; Cheikhrouhou, N.; Zufferey, N. Simultaneous allocation of buffer capacities and service times in unreliable production lines. Int. J. Prod. Res. 2024, 62, 644–664. [Google Scholar] [CrossRef] [Scilit] [PubMed]
- Wooley, A.; Bitencourt, J.; Silva, D. Bridging the gap between discrete event simulation and digital twin: A manufacturing case study. Manuf. Lett. 2025, 44, 1274–1284. [Google Scholar] [CrossRef] [Scilit]
- Ciauşu-Sliwa, M.R.; Ciauşu-Sliwa, D.; Dodun, O. Discrete-Event Simulation for Smart Manufacturing: Assessing Software, Industry Adoption, and Future Research Challenges. Bull. Polytech. Inst. Iași Mach. Constr. Sect. 2025, 71, 105–124. [Google Scholar] [CrossRef] [Scilit]
- Rocha, E.M.; Lopes, M.J. Bottleneck prediction and data-driven discrete-event simulation for a balanced manufacturing line. Procedia Comput. Sci. 2022, 200, 1145–1154. [Google Scholar] [CrossRef] [Scilit]
- Ragazzini, L.; Negri, E.; Fumagalli, L.; Macchi, M. Digital Twin-based bottleneck prediction for improved production control. Comput. Ind. Eng. 2024, 192, 110231. [Google Scholar] [CrossRef] [Scilit]
- Ju, Z.; Wang, Y.; Quan, Z.; Liu, X.; Ji, Z. Bottleneck alleviation and scheduling optimization of flexible manufacturing system based on information-energy flow model. Swarm Evol. Comput. 2024, 89, 101600. [Google Scholar] [CrossRef] [Scilit]
- Muchtar, D.; Moengin, P.; Surjasa, D.; Cahyati, S. Bottleneck Analysis and Improvement in Apparel Manufacturing Production Processes Using Integration Design of Experiments and Discrete Event Simulation. Adv. Sustain. Sci. Eng. Technol. 2026, 8, 02602038. [Google Scholar] [CrossRef] [Scilit]
- Calvo, R. Identification of bottlenecks and optimization of throughput for manufacturing serial lines with limited buffers. Int. J. Adv. Manuf. Technol. 2026. [Google Scholar] [CrossRef] [Scilit]
- Woschank, M.; Dallasega, P.; König, A.; Hoffelner, M. Potentials of using real-time data to increase the update frequency of production planning and control strategies in MTO: A discrete event simulation study. Flex. Serv. Manuf. J. 2024, 36, 760–779. [Google Scholar] [CrossRef] [Scilit]
- Al-zqebah, R.; Guertler, M.; Clemon, L. Powder bed fusion factory productivity increases using discrete event simulation and genetic algorithm. Prod. Eng. 2025, 19, 29–45. [Google Scholar] [CrossRef] [Scilit]
- Frey, M.; Maul, T.; Hörsting, R.; Stindt, J.; May, M.C.; Mark, P.; Lanza, G. A method for considering aleatory and epistemic uncertainties as well as product variance in discrete event simulation of production systems. J. Manuf. Syst. 2025, 82, 547–560. [Google Scholar] [CrossRef] [Scilit]
- Mofokeng, P.N. A Discrete-Event Simulation for Optimising Cutting Process Productivity in Furniture Manufacturing Production. J. Inf. Syst. Eng. Manag. 2025, 10, 622–638. [Google Scholar] [CrossRef] [Scilit]
- Bataillie, W.; Aghezzaf, E.-H.; Cottyn, J. Discrete Event Simulation: A Behavior Modeling Framework for Evaluating Production Schedules. Procedia Comput. Sci. 2025, 263, 301–308. [Google Scholar] [CrossRef] [Scilit]
- Bitsch, G.; Senjic, P. Intelligent Scheduling based on Discrete-Time Simulation using Machine Learning. Procedia CIRP 2024, 126, 48–51. [Google Scholar] [CrossRef] [Scilit]
- Elbasheer, M.; Longo, F.; Madden, M.G.; Padovano, A.; Ullah, I. Towards a Digital Twin for Production Planning: Combining Discrete Event Simulation and ML for Flexible Job Shops. Procedia Comput. Sci. 2025, 253, 3078–3087. [Google Scholar] [CrossRef] [Scilit]
- Klar, M.; Schworm, P.; Wu, X.; Simon, P.; Glatt, M.; Ravani, B.; Aurich, J.C. Transferable multi-objective factory layout planning using simulation-based deep reinforcement learning. J. Manuf. Syst. 2024, 74, 487–511. [Google Scholar] [CrossRef] [Scilit]
- Zuercher, P.-D.; Bohné, T. Discrete Event Probabilistic Simulation (DEPS) integrated into a Reinforcement Learning Framework for Optimal Production. Procedia CIRP 2024, 130, 662–670. [Google Scholar] [CrossRef] [Scilit]
- Goyal, A.; Alander, A.; Hjalmarsson, J.; Moberg, J.; Acar, Ö.F.; Aslanidou, I. Simulation–Validated Genetic algorithm scheduling for industrial production systems. Comput. Ind. Eng. 2026, 215, 111915. [Google Scholar] [CrossRef] [Scilit]
- Mohanavelu, T.; Krishnaswamy, R.; Mannepu, V.R.; Seshadri, N.M.; McDermott, O. Dynamic layout optimisation through simulation: Enhancing machine utilisation for fluctuating demand. Int. J. Adv. Manuf. Technol. 2025, 138, 983–998. [Google Scholar] [CrossRef] [Scilit]
- Dong, A.; Starr, A.; Zhao, Y. Neural network-based parametric system identification: A review. Int. J. Syst. Sci. 2023, 54, 2676–2688. [Google Scholar] [CrossRef] [Scilit]
- Vázquez-Serrano, J.I.; Cárdenas-Barrón, L.E.; Vicencio-Ortiz, J.C.; Matis, T.; Gaitán-Mercado, C.M.; Peimbert-García, R.E. Hybrid optimization and discrete-event simulation model to reduce waiting times in a primary health center. Expert Syst. Appl. 2024, 238, 121920. [Google Scholar] [CrossRef] [Scilit]
- Mumali, F. Artificial neural network-based decision support systems in manufacturing processes: A systematic literature review. Comput. Ind. Eng. 2022, 165, 107964. [Google Scholar] [CrossRef] [Scilit]
- Chakraborty, S.; Chakraborty, S. Applications of artificial neural networks in machining processes: A comprehensive review. Int. J. Interact. Des. Manuf. (IJIDeM) 2024, 18, 1917–1948. [Google Scholar] [CrossRef] [Scilit]
- Küçüktopcu, E.; Cemek, E.; Cemek, B.; Simsek, H. Hybrid Statistical and Machine Learning Methods for Daily Evapotranspiration Modeling. Sustainability 2023, 15, 5689. [Google Scholar] [CrossRef] [Scilit]
- Sara, S.B.V.J.; Anand, M.; Silvia Priscila, S.; Yuvaraj, N.; Manikandan, R.; Ramkumar, M. Design of autonomous production using deep neural network for complex job. Mater. Today Proc. 2023, 81, 957–961. [Google Scholar] [CrossRef] [Scilit]
- Al-yasin, S.A.; Gheibi, M.; Montazeri, H.; Khaksar, R.Y.; Akrami, M.; Fathollahi-Fard, A.M.; Wong, K.Y. A smart industrial information system using a business process model, discrete events simulation, optimization, and machine learning algorithms. J. Ind. Inf. Integr. 2025, 47, 100896. [Google Scholar] [CrossRef] [Scilit]
- Houssein, E.H.; Mohamed, M.; Younis, E.M.G.; Mohamed, W.M. Artificial intelligence and classical statistical models for time series forecasting: A comprehensive review. J. Big Data 2025, 12, 271. [Google Scholar] [CrossRef] [Scilit]
- Kontopoulou, V.I.; Panagopoulos, A.D.; Kakkos, I.; Matsopoulos, G.K. A Review of ARIMA vs. Machine Learning Approaches for Time Series Forecasting in Data Driven Networks. Future Internet 2023, 15, 255. [Google Scholar] [CrossRef] [Scilit]
- Teso-Fz-Betoño, A.; Zulueta, E.; Cabezas-Olivenza, M.; Teso-Fz-Betoño, D.; Fernandez-Gamiz, U. A Study of Learning Issues in Feedforward Neural Networks. Mathematics 2022, 10, 3206. [Google Scholar] [CrossRef] [Scilit]
- Masini, R.P.; Medeiros, M.C.; Mendes, E.F. Machine learning advances for time series forecasting. J. Econ. Surv. 2023, 37, 76–111. [Google Scholar] [CrossRef] [Scilit]
- Ismailov, V.E. Approximation error of single hidden layer neural networks with fixed weights. Inf. Process Lett. 2024, 185, 106467. [Google Scholar] [CrossRef] [Scilit]
- Seo, S.; Jo, J.; Hamza, M.; Kim, Y. Improving I-ELM structure through optimal addition of hidden nodes: Compact I-ELM. Sci. Rep. 2024, 14, 22782. [Google Scholar] [CrossRef] [Scilit] [PubMed]
- Chen, X.; Cheng, Y.; Wang, S.; Sang, G.; Nah, K.; Wang, J. A Periodic Mapping Activation Function: Mathematical Properties and Application in Convolutional Neural Networks. Mathematics 2025, 13, 2843. [Google Scholar] [CrossRef] [Scilit]
- Tian, Y.; Zhang, Y.; Zhang, H. Recent Advances in Stochastic Gradient Descent in Deep Learning. Mathematics 2023, 11, 682. [Google Scholar] [CrossRef] [Scilit]
- Liu, M.; Yao, D.; Liu, Z.; Guo, J.; Chen, J. An Improved Adam Optimization Algorithm Combining Adaptive Coefficients and Composite Gradients Based on Randomized Block Coordinate Descent. Comput. Intell. Neurosci. 2023, 2023, 4765891. [Google Scholar] [CrossRef] [Scilit] [PubMed]
- Elsaraiti, M.; Merabet, A. A Comparative Analysis of the ARIMA and LSTM Predictive Models and Their Effectiveness for Predicting Wind Speed. Energies 2021, 14, 6782. [Google Scholar] [CrossRef] [Scilit]
- Gao, X.; Long, J. Simulation Optimization of Assembly Production Line Process Based on Digital Twinning. In Proceedings of the 8th International Conference on Advances in Machinery, Materials Science and Engineering Application (MMSE 2022), Wuhan, China, 23–24 July 2022. [Google Scholar] [CrossRef] [Scilit]
- Lewicki, W.; Niekurzak, M.; Wróbel, J. Development of a Simulation Model to Improve the Functioning of Production Processes Using the FlexSim Tool. Appl. Sci. 2024, 14, 6957. [Google Scholar] [CrossRef] [Scilit]
- Lorenc, A. Cross-Docking Layout Optimization in FlexSim Software Based on Cold Chain 4PL Company. Sustainability 2024, 16, 9620. [Google Scholar] [CrossRef] [Scilit]

Disclaimer/Publisher’s Note: The statements, opinions and data contained in all publications are solely those of the individual author(s) and contributor(s) and not of MDPI and/or the editor(s). MDPI and/or the editor(s) disclaim responsibility for any injury to people or property resulting from any ideas, methods, instructions or products referred to in the content. |
© 2026 by the authors. Licensee MDPI, Basel, Switzerland. This article is an open access article distributed under the terms and conditions of the Creative Commons Attribution (CC BY) license.