


Abstract
Breast cancer is one of the most common malignant tumors worldwide, and ultrasound computed tomography (USCT) has attracted increasing attention due to its quantitative imaging capability and radiation-free characteristics. However, improving image contrast and lesion visualization remains challenging, especially for multi-parameter reconstruction using compact ultrasound transducer arrays. In this study, a breast USCT imaging method based on dual-pair piezoelectric micromachined ultrasonic transducer (PMUT) linear arrays and multi-parameter acoustic fusion is proposed. A numerical breast phantom containing adipose tissue, glandular tissue, cancer, fibroadenoma, and cyst structures was established to evaluate the proposed method. Multi-angle ultrasound transmission data were acquired using dual-pair PMUT linear arrays, and sound speed and attenuation images were reconstructed using a filtering convolution back-projection reconstruction algorithm. In addition, impedance information was introduced as an auxiliary feature to enhance structural boundaries, and a multi-parameter acoustic fusion strategy was developed to improve tissue contrast. The results demonstrated that the fused image achieved improved quantitative performance, with a structural similarity index (SSIM) of 0.82 and a correlation coefficient (Corr) of 0.83 compared with individual parameter reconstructions. The proposed method enhanced the visualization of different breast tissue structures and lesions, indicating its potential for PMUT-based quantitative breast USCT imaging.
1. Introduction
Breast cancer is one of the most common malignant tumors among women worldwide and remains a major threat to public health [1]. Early detection and accurate characterization of breast lesions, including the differentiation between benign and malignant tumors, are essential for improving treatment outcomes and reducing mortality [2]. Currently, clinical breast imaging techniques mainly include mammography, magnetic resonance imaging (MRI), and conventional ultrasound imaging [3]. Although mammography provides high diagnostic value, its application is limited by ionizing radiation exposure and reduced sensitivity in dense breast tissue. MRI offers excellent soft-tissue contrast but suffers from high cost, long acquisition time, and limited accessibility. Ultrasound imaging is widely used in breast examination due to its advantages of non-ionizing radiation, low cost, and real-time operation [4]. However, conventional B-mode ultrasound mainly provides morphological information and is highly dependent on operator experience, which limits its quantitative evaluation capability for tissue characterization.
Ultrasound computed tomography (USCT) has emerged as a promising quantitative imaging technique for breast imaging by exploiting the acoustic properties of biological tissues [5,6,7,8]. Unlike conventional pulse-echo ultrasound, USCT acquires transmission signals from multiple projection angles and reconstructs quantitative acoustic parameter maps, including sound speed, attenuation, and acoustic impedance distributions [9,10,11,12]. These parameters are closely related to tissue composition and mechanical properties, providing complementary information for breast tissue characterization [13]. Compared with conventional ultrasound imaging, USCT has the potential to provide quantitative and operator-independent information, making it an attractive approach for breast tissue characterization [2,14,15]. However, the performance of USCT systems strongly depends on the configuration and characteristics of ultrasound transducer arrays. Piezoelectric micromachined ultrasonic transducers (PMUTs), based on micro-electromechanical systems (MEMS) technology, have attracted increasing attention for biomedical ultrasound applications due to their small size, low fabrication cost, batch manufacturability, and potential for large-scale array integration [16,17,18]. Compared with conventional piezoelectric transducers, PMUT arrays provide advantages in miniaturization, frequency scalability, and electronic integration, making them promising candidates for compact USCT systems [19,20,21]. Recent studies have demonstrated the feasibility of PMUT arrays for pulse-echo imaging, photoacoustic imaging, and three-dimensional ultrasound imaging. However, the application of PMUT arrays in quantitative breast USCT remains insufficiently explored, particularly for dual-array configurations, multi-angle transmission imaging, and multi-parameter acoustic reconstruction.
In breast USCT, different acoustic parameters provide complementary information for tissue characterization. Sound speed has been extensively investigated because of its strong correlation with tissue composition and density, while acoustic attenuation provides additional contrast due to its sensitivity to tissue absorption characteristics [22,23]. Acoustic impedance, which reflects tissue interface properties, can provide valuable structural boundary information [24,25,26]. Therefore, integrating multiple acoustic parameters has great potential for improving tissue differentiation and lesion visualization. However, most existing USCT systems reconstruct sound speed distributions using ray-based tomography algorithms, where ultrasound propagation is approximated as straight-line paths under high-frequency assumptions. The accuracy of these methods can be affected by finite-frequency effects, acoustic attenuation, diffraction, and scattering. In breast USCT applications, ultrasound typically operates at frequencies of 3.5 MHz and propagates through approximately 18 cm of tissue, resulting in considerable energy loss and waveform distortion. Moreover, when lesion dimensions approach the ultrasound wavelength, diffraction effects become significant, limiting the accuracy of travel-time-based reconstruction. Although wave-equation-based reconstruction methods provide a more accurate physical description of acoustic propagation, their high computational complexity remains a challenge for simultaneous reconstruction of multiple acoustic parameters [27]. Therefore, efficient multi-parameter reconstruction and fusion strategies are required to improve the quantitative imaging capability of breast USCT.
In this study, a breast ultrasound computed tomography method based on dual-pair PMUT linear arrays with multi-parameter acoustic fusion is proposed. A dual-pair PMUT linear array configuration consisting of two orthogonal pairs of opposite arrays is employed to acquire multi-directional ultrasound data without mechanical rotation. Quantitative sound speed and attenuation images are reconstructed using a filtered convolution back-projection algorithm, while acoustic impedance information obtained from pulse-echo imaging is introduced as an auxiliary feature to enhance structural boundaries. Spatial compounding and wavelet-based fusion are subsequently employed to integrate information from different propagation directions and acoustic parameters. The proposed framework integrates multi-directional acquisition, multi-parameter acoustic reconstruction, and image within a dual-pair PMUT linear array-based architecture, enabling complementary directional and acoustic parameters information to be jointly utilized for breast imaging. A numerical breast phantom containing adipose tissue, glandular tissue, cancer, fibroadenoma, and cyst structures is established to evaluate the proposed method. Quantitative evaluations were further performed to assess the reconstruction and multi-parameter fusion performance.
2. Methods
2.1. Dual-Pair PMUT Linear Array-Based USCT System and Spatial Compounding Configuration
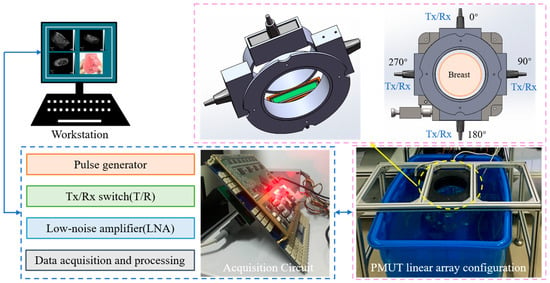
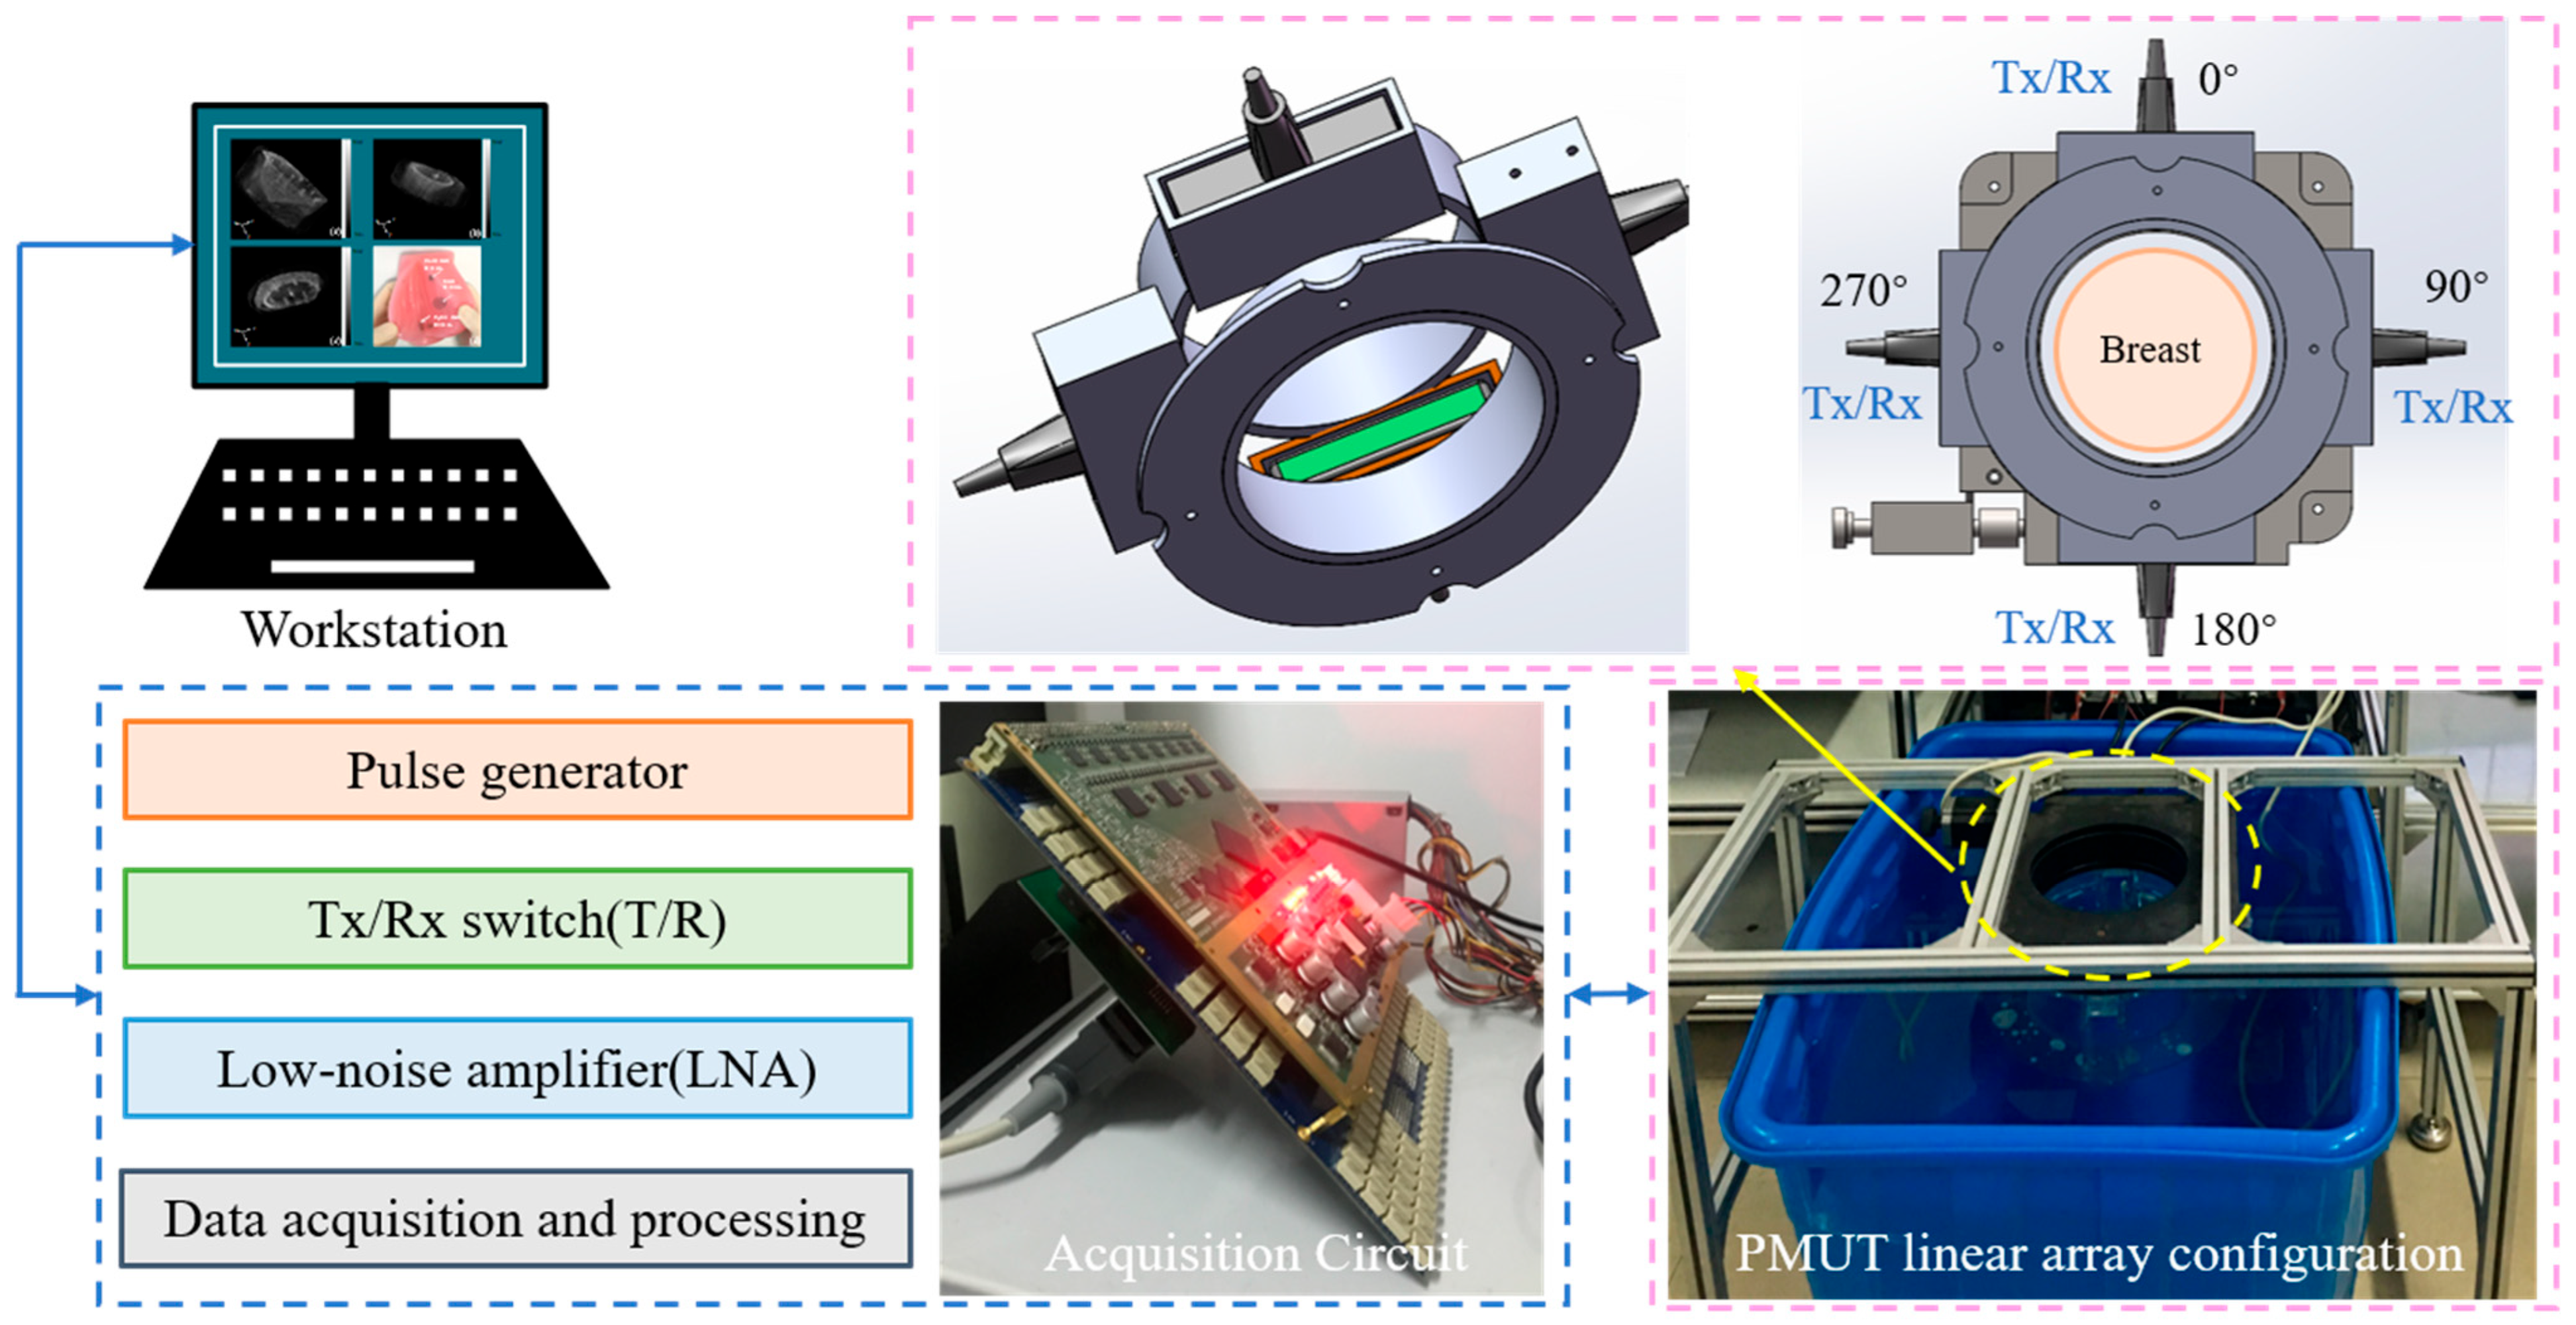
A USCT system based on dual-pair PMUT linear arrays was developed for quantitative breast imaging, as illustrated in Figure 1. The system consists of a dual-pair PMUT linear array, a multi-channel ultrasound transmitting and receiving circuit, a mechanical positioning structure, and a computer workstation [28]. The dual-pair PMUT linear array configuration consists of four PMUT linear arrays orthogonally arranged around the imaging region, forming two opposite array pairs for multi-directional ultrasound transmission and reception. Each opposite PMUT array pair operates in a transmit–receive configuration. During transmission imaging, one PMUT linear array transmits ultrasound waves, while the opposite array receives the signals transmitted through the breast tissue. The acquired transmission signals are used for quantitative reconstruction of sound speed and acoustic attenuation distributions [29]. Meanwhile, the echo signals received by the transmitting array are utilized to obtain acoustic impedance-related structural information, which is introduced as an auxiliary feature for tissue boundary enhancement. Breast tissue exhibits complex acoustic heterogeneity, resulting in multiple interactions between ultrasound waves and tissue structures, including attenuation, reflection, diffraction, and scattering. Therefore, a single acoustic parameter cannot fully characterize breast lesions, especially for small structures with weak contrast. By integrating complementary information from sound speed, attenuation, and impedance-related features, multi-parameter acoustic fusion can provide enhanced tissue characterization and lesion visualization.
Figure 1.
Schematic diagram of the dual-pair PMUT linear array-based USCT system.
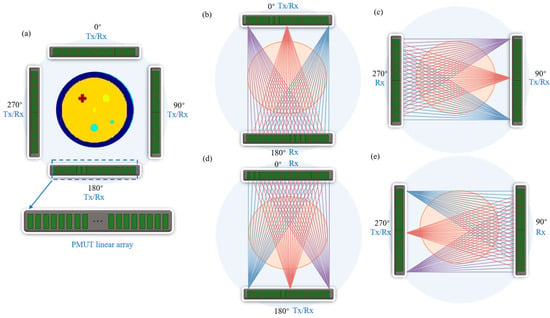
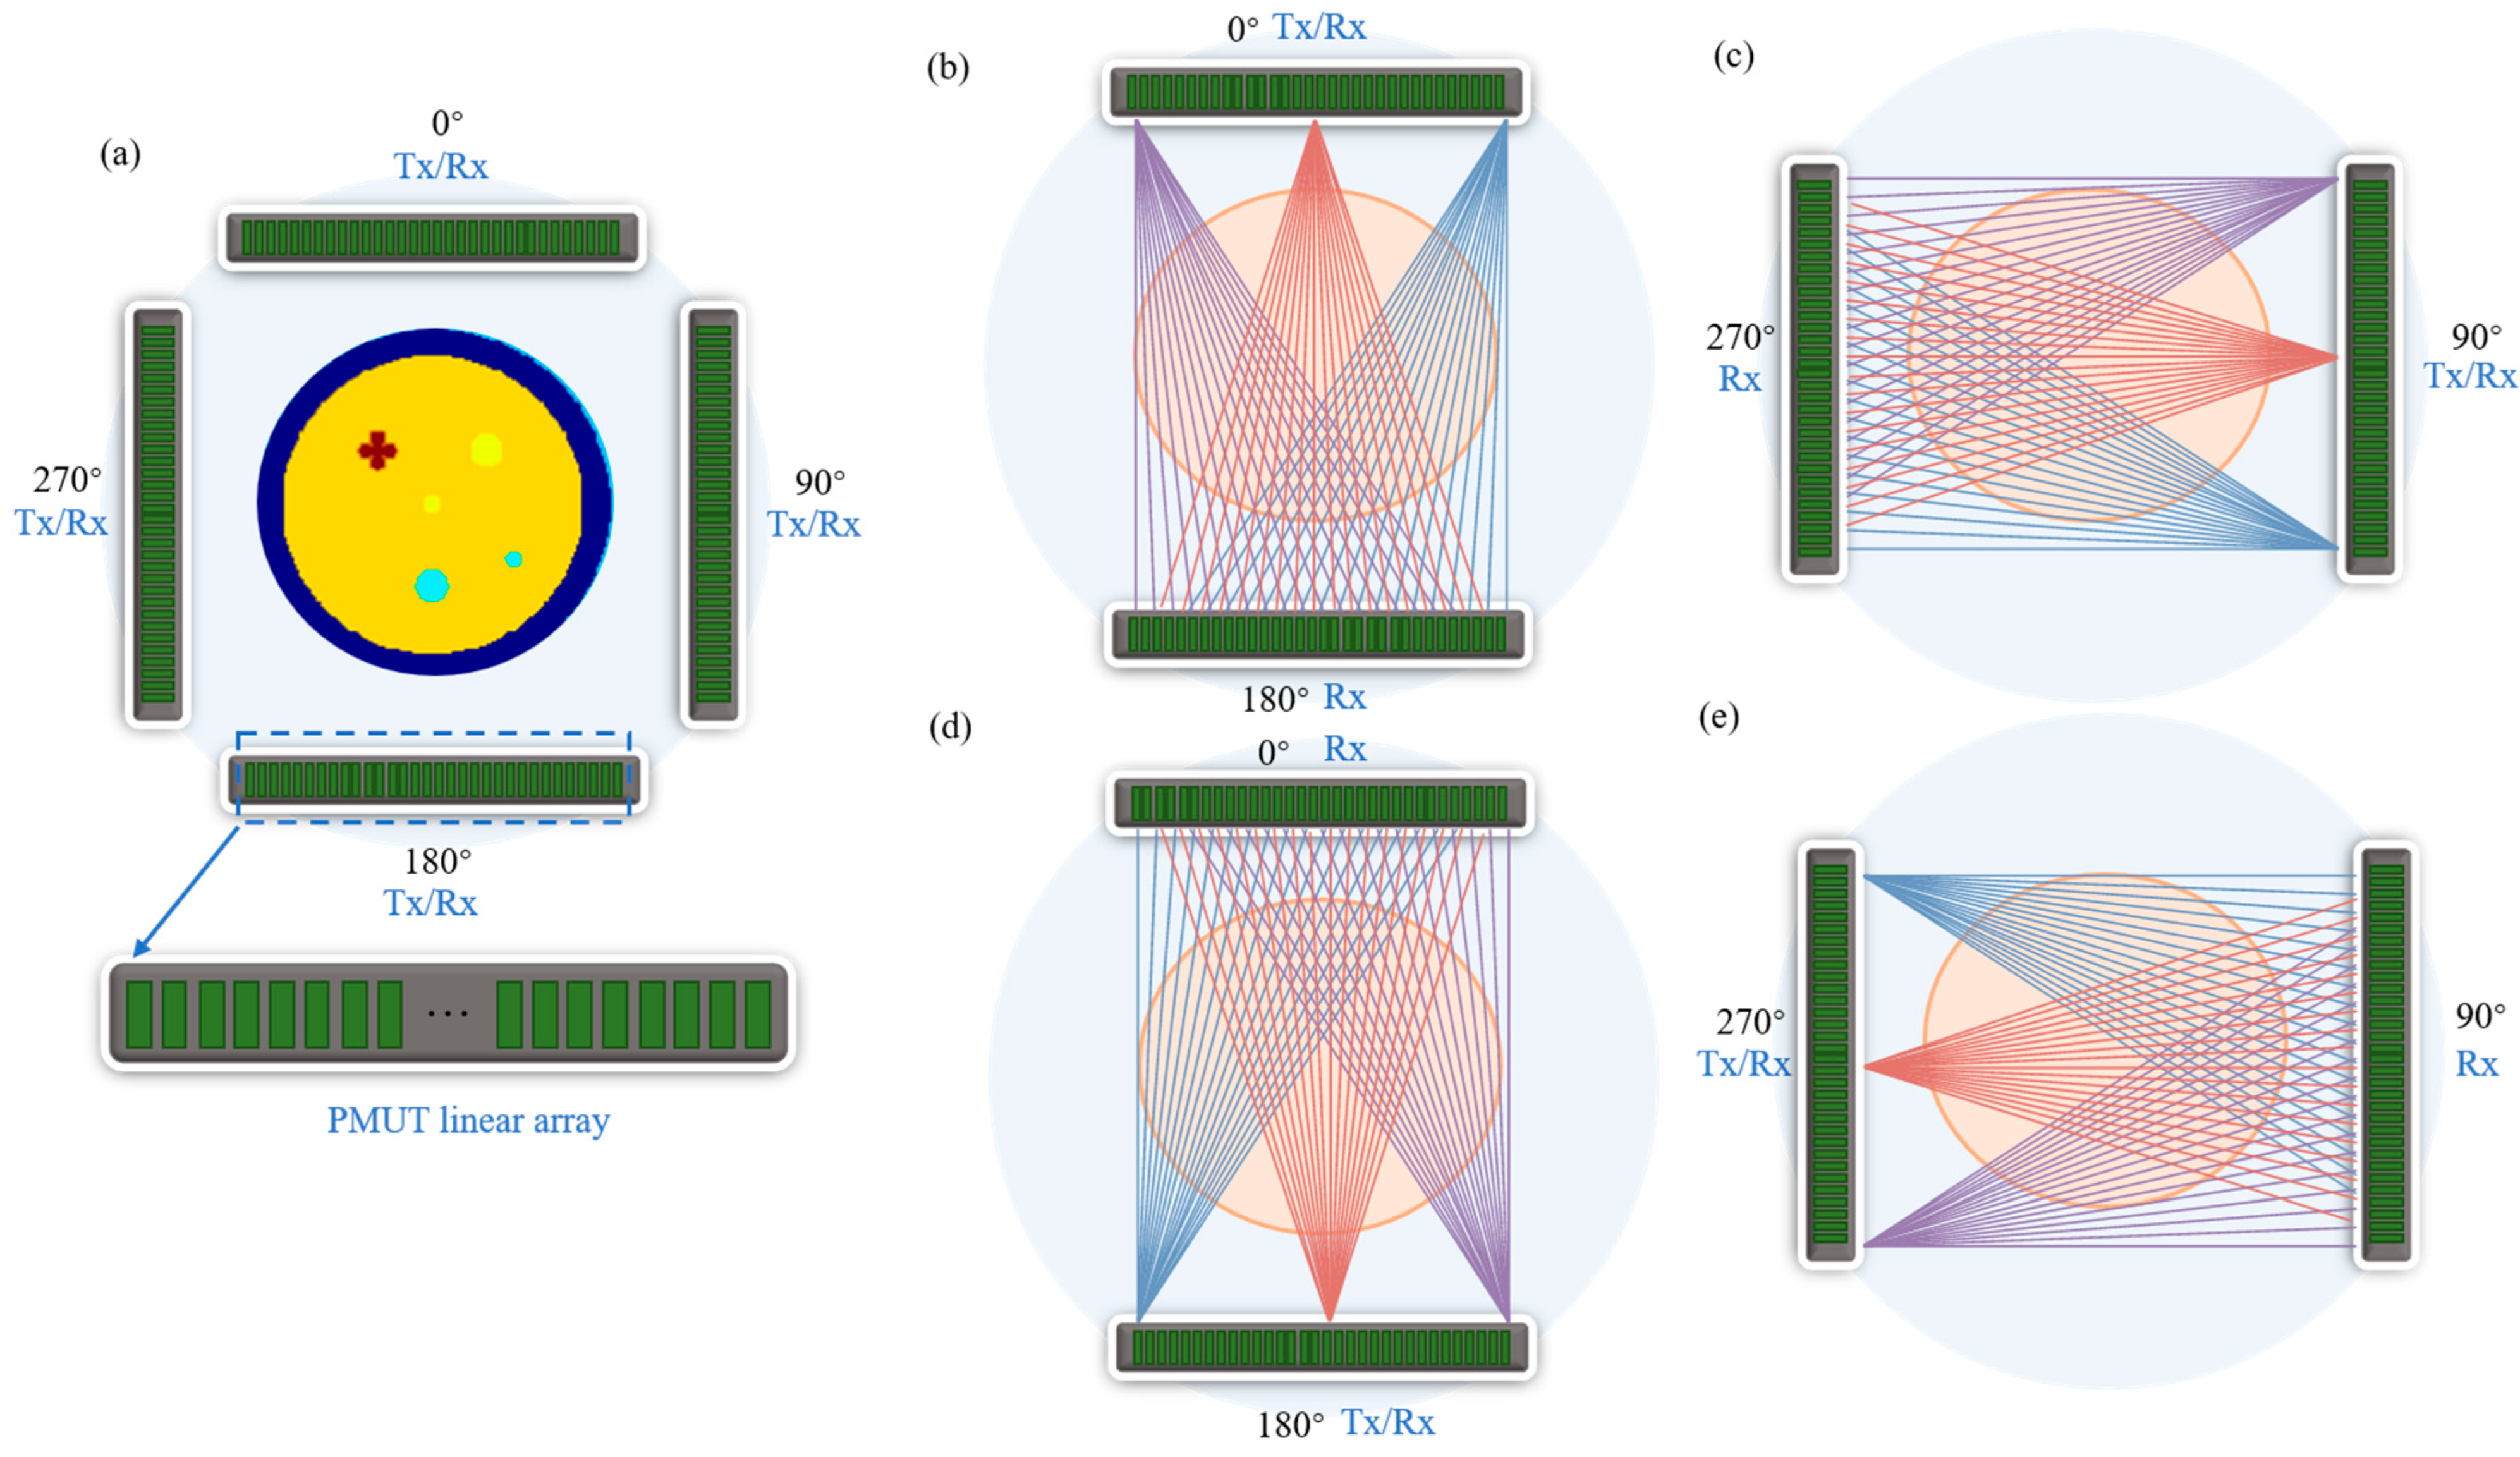
As shown in Figure 2, for each transmission acquisition, one PMUT linear array operates as the transmitter, while the opposite array serves as the receiver. The structure parameters of the PMUT linear array are summarized in Table 1. The transmitting elements are sequentially excited from element 1 to element 128, and all elements of the receiving array simultaneously record the transmitted signals. Therefore, each acquisition configuration generates a complete dataset containing 128 × 128 A-scan signals. Four transmission configurations, including 0–180°, 90–270°, 180–0°, and 270–90°, are employed to obtain complementary projection information from different propagation directions. These multi-directional datasets are subsequently used for spatial compounding and multi-parameter acoustic reconstruction.
Figure 2.
Configuration of the dual-pair PMUT linear array-based USCT system and ultrasound acquisition scheme. (a) Arrangement of the four PMUT linear arrays around the breast imaging region. (b–e) Four transmit-receive configurations between opposite PMUT linear arrays.
Table 1.
The structure parameters of the PMUT linear array.
The dual-pair PMUT linear array-based USCT system represents the physical imaging system developed in this study. The PMUT linear arrays were experimentally characterized. However, the breast imaging results reported in this study were obtained from numerical simulations rather than experimental imaging measurements. Specifically, no experimentally acquired breast or tissue-mimicking phantom imaging data were used for the reconstruction, spatial compounding, or multi-parameter fusion results presented in this study. Therefore, the numerical simulations were used as a proof-of-concept evaluation of the proposed imaging and reconstruction framework.
2.2. Multi-Parameter Acoustic Reconstruction and Fusion Method
In the proposed dual-pair PMUT linear array-based USCT system, each opposite PMUT linear array operates in a transmit-receive configuration. One PMUT linear array serves as the transmitter, with its elements sequentially excited, while the opposite array serves as the receiver. For each transmitting element, all elements of the receiving array simultaneously recorded the transmitted ultrasound signals, yielding a 128 × 128 A-scan dataset for each transmit-receive configuration. The transmission data provide two types of acoustic information, namely propagation time delay and amplitude attenuation, which are used for sound speed and attenuation reconstruction, respectively.
2.2.1. Transmission Signal Processing and Projection Data Extraction
(1) Time of flight (TOF) extraction and sound speed projection
Since the measured propagation time includes the delay caused by the water coupling medium and breast tissue, a water reference measurement was introduced to compensate for the background propagation time [10,30].
where represents water sound speed, represents breast tissue sound speed distribution [8].
The TOF difference was used as the projection data for sound speed reconstruction.
(2) Attenuation calculation
In addition to TOF information, the amplitude variation in the transmitted signals was used to extract attenuation projections [31,32,33].
where represents water reference spectrum, represents breast tissue spectrum. represents the attenuation coefficient of the organization.
The attenuation projection data were obtained from the frequency-dependent amplitude loss between the reference water medium and breast tissue.
(3) Projection data discretization
For image reconstruction, the continuous projection equations were discretized into a linear system. For an M × N image grid, the sound speed and attenuation projection data can be expressed as [34]:
The extracted projection data were subsequently reconstructed using the straight-line trajectory filtered back-projection (FBP) algorithm described in Section 2.2.2.
2.2.2. Straight-Line Trajectory FBP Reconstruction
The acquired transmission projection data were reconstructed using a FBP algorithm based on the straight-line trajectory scanning geometry. Unlike conventional ring-array USCT systems that employ circular scanning trajectories, the proposed system uses dual-pair PMUT linear arrays to acquire transmission data along multiple straight propagation paths. Therefore, a coordinate transformation was introduced to convert the conventional parallel-beam reconstruction model into an equivalent fan-beam formulation suitable for the linear array configuration [35].
Since the PMUT linear arrays perform straight-line transmission scanning, the detector coordinate was transformed from the parallel-beam coordinate system into an equidistant fan-beam coordinate system [36].
where represents the actual collected transmission projection data, t represents the position of the linear element.
Corresponding relation:
where D is the distance from the array to the imaging center, β represents the scanning direction angle.
After variable replacement and filter kernel scale transformation, the FBP reconstruction formula for the linear trajectory applicable to the dual-pair PMUT linear array-based USCT system can be obtained [37,38]:
Corresponding relation:
where represents the reconstruction filter kernel used in the filtered back-projection algorithm, denotes the transmission projection data acquired from the PMUT linear arrays. U is the geometric weighting factor introduced by the coordinate transformation.
After reconstruction, the four directional images obtained from the 0°, 90°, 180°, and 270° transmit–receive configurations were combined using pixel-wise arithmetic averaging with equal weights. Since all directional reconstructions were generated on the same Cartesian imaging grid with identical spatial dimensions and coordinates, no additional image registration was required. The same spatial compounding procedure was applied independently to both the sound-speed and attenuation images.
The straight-line trajectory FBP method was adopted because of its computational efficiency and straightforward implementation, providing a suitable framework for the proof-of-concept evaluation of the proposed dual-pair PMUT acquisition and multi-parameter imaging strategy. For soft breast tissues with moderate sound-speed variations, straight-ray propagation can be regarded as a first-order approximation. Nevertheless, this model does not explicitly account for refraction and ray bending caused by tissue heterogeneity and may therefore introduce reconstruction errors near interfaces with relatively large acoustic contrasts. Future work will incorporate bent-ray or full-wave reconstruction methods to improve quantitative imaging accuracy.
2.2.3. Multi-Parameter Acoustic Image Reconstruction
The reconstructed acoustic parameter images provide complementary information for breast tissue characterization. In this study, three types of acoustic images, including sound speed image , attenuation image , and impedance-related image , were obtained from the dual-pair PMUT linear array-based USCT system. The sound speed and attenuation images were reconstructed from the transmission measurements. The TOF information extracted from the transmitted signals was used to obtain the sound speed distribution, while the amplitude attenuation information was utilized to reconstruct the acoustic attenuation distribution. Both acoustic parameter images were reconstructed using the straight-line trajectory FBP algorithm described in Section 2.2.2. In addition, the pulse-echo signals acquired by the PMUT arrays were processed to extract impedance-related structural information. The impedance-related image was introduced as an auxiliary feature to enhance tissue boundaries and lesion structures, providing complementary structural information to the quantitative transmission-based images.
To integrate the complementary information from , , and , a wavelet-based fusion strategy was employed.
The sound speed, attenuation, and impedance-related images were decomposed using the Symlet-4 (sym4) wavelet with three decomposition levels [39]. The sym4 wavelet was selected because of its near-symmetry and favorable spatial localization, which are suitable for preserving structural boundaries during multi-parameter image fusion. Three decomposition levels were used to provide a balance between multi-scale information representation and preservation of spatial details. Before fusion, the sound speed, attenuation, and impedance-related images were independently normalized to the range [0, 1] using min–max normalization to account for their different physical units and numerical ranges. For quantitative evaluation, a reference fused image was generated from the ground-truth sound speed, attenuation, and acoustic impedance maps using the same normalization and wavelet fusion procedure as that applied to the reconstructed images.
where .
The low-frequency approximation coefficients mainly contain global tissue distribution information and were fused using weighted averaging:
where , and denote the low-frequency approximation coefficients of the sound speed, attenuation, and impedance-related images, respectively. , and are the corresponding fusion weights, satisfying . In this study, the weights were set to , , and .
The high-frequency detail coefficients mainly preserve edge and lesion boundary information. The maximum absolute value selection rule was adopted.
The final fused image was obtained through inverse wavelet transformation.
2.3. Quantitative Evaluation of Reconstruction Performance
To quantitatively evaluate the performance of the proposed multi-parameter acoustic reconstruction and fusion method, five evaluation metrics, including peak signal-to-noise ratio (PSNR), root mean square error (RMSE), structural similarity index (SSIM), correlation coefficient (Corr), and contrast-to-noise ratio (CNR), were employed.
PSNR was employed to evaluate the distortion between the reconstructed image and the reference image:
where represents the maximum gray level of the image. For normalized images, = 1, while for 8-bit grayscale images, = 255. A higher PSNR value indicates lower image distortion and better reconstruction quality.
RMSE quantifies the difference between the reconstructed image and the ground-truth image, and is defined as follows:
where represents the reconstructed image and denotes the corresponding ground-truth image. and represent the image dimensions. A lower RMSE value indicates a smaller reconstruction error and better quantitative consistency between the reconstructed image and the ground truth.
Corr was used to measure the linear correlation between the reconstructed image and the ground-truth image:
where and denote the mean intensity values of the reconstructed image and the reference image, respectively. The value of Corr ranges from −1 to 1, and a value closer to 1 indicates stronger similarity between the reconstructed image and the ground-truth image.
SSIM was employed to evaluate the structural consistency between the reconstructed image and the reference image. SSIM considers three important characteristics of image quality, including luminance, contrast, and structural information, and is defined as [30]:
where represents the reconstructed or fused image and denotes the ground-truth image. and are the mean intensity values, and are the variances, and represents the covariance between the two images. and are stability constants used to avoid numerical instability.
CNR was used to quantitatively evaluate the visibility of breast lesions in reconstructed images. It measures the contrast difference between the lesion region and the surrounding background tissue while considering image noise [40].
where and denote the mean intensity values of the lesion ROI and background ROI, respectively, while and represent their corresponding standard deviations. A higher CNR value indicates better contrast separation between the lesion and surrounding tissue, reflecting improved lesion visibility and contrast.
3. Results and Discussion
To evaluate the performance of the proposed dual-pair PMUT linear array-based USCT system and multi-parameter acoustic reconstruction method, a two-dimensional numerical breast phantom was established. The simulation study aimed to verify the capability of the proposed method for quantitative breast acoustic parameter imaging and to investigate the advantages of multi-angle acquisition and spatial compounding. All numerical simulations, image reconstruction, spatial compounding, multi-parameter fusion, and quantitative evaluations were implemented in MATLAB R2025a (MathWorks, Natick, MA, USA) under a 64-bit Windows 11 operating system. The computations were performed on a workstation equipped with a 12th Gen Intel® Core™ i7-12700 processor (2.10 GHz, Intel, Santa Clara, USA) and 32 GB RAM. The reconstruction and image-processing algorithms were implemented using custom MATLAB scripts.
3.1. Numerical Breast Phantom
A rectangular imaging region was used to represent the horizontal cross-sectional plane of the breast. The distance between two opposite PMUT linear arrays was set to 180 mm, consistent with the geometry of the proposed dual-pair PMUT linear array-based USCT system. The 180 mm × 180 mm imaging region was discretized into a 256 × 256 Cartesian grid, corresponding to a spatial sampling interval of approximately 0.703 mm in both directions. The numerical simulation adopted the same four-array configuration and transmit–receive scheme described in Section 2.1 to generate multi-directional transmission data. Synthetic projection data were generated using a simplified straight-ray model rather than explicit time-domain A-scan simulation. Therefore, temporal discretization and wave-related effects such as refraction, diffraction, and multiple scattering were not considered; noise and transducer bandwidth were also not explicitly modeled.
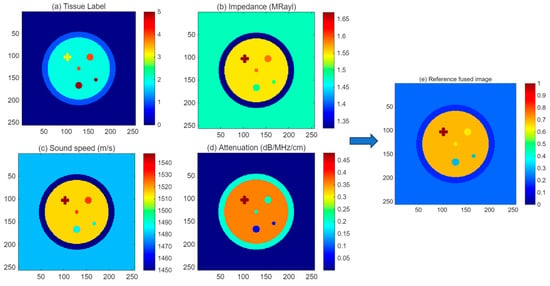
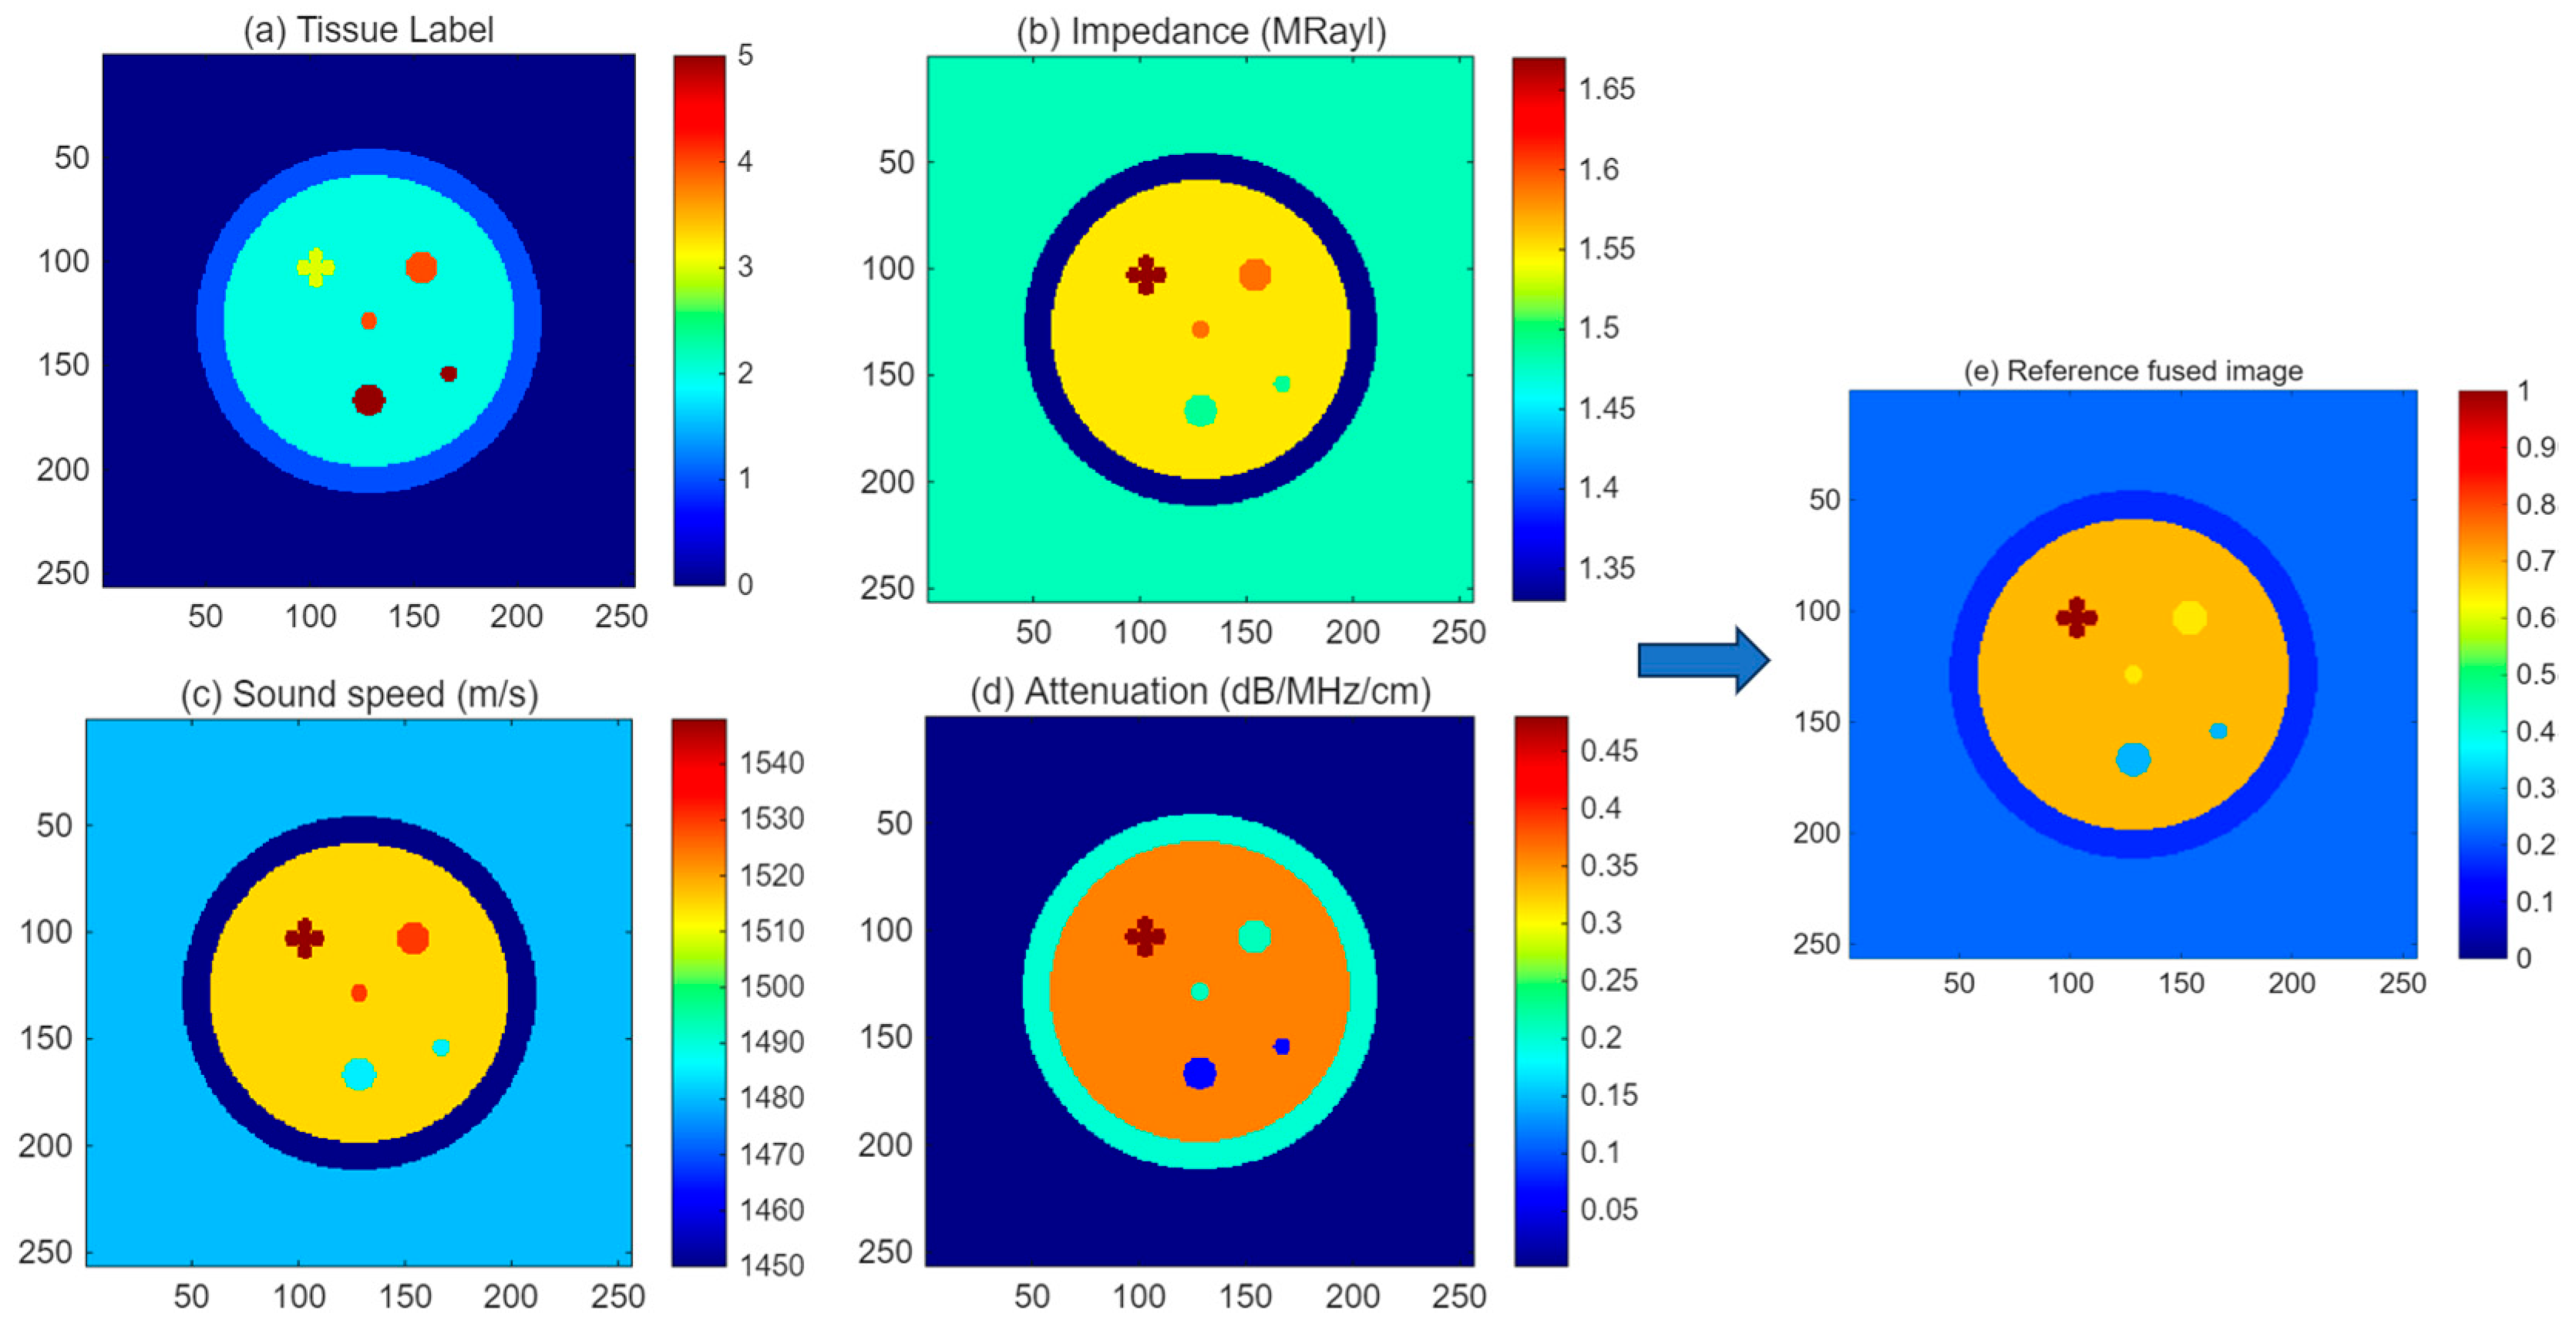
The numerical breast phantom consisted of several typical breast tissue components, including adipose tissue, glandular tissue, cancer, fibroadenoma, and cyst structures. Table 2 shows different acoustic parameters, including acoustic impedance, sound speed, and attenuation coefficient, were assigned to each tissue type according to their reported physical properties. The approximate diameters of the tissue and lesion structures were reasonably selected to represent typical breast tissue and lesion dimensions and were mapped to the 180 mm physical imaging region of the numerical breast phantom. Figure 3a shows the tissue label map of the numerical breast phantom, while Figure 3b–d present the corresponding distributions of acoustic impedance, sound speed, and attenuation coefficient, respectively.
Table 2.
Acoustic parameters assigned to different tissues in the numerical breast phantom.
Figure 3.
Numerical breast phantom model used for USCT simulation. (a) Tissue label map, (b) acoustic impedance distribution, (c) sound speed distribution, (d) attenuation coefficient distribution, and (e) reference fused image.
The constructed numerical phantom provides a realistic test platform for evaluating the reconstruction performance of different acoustic parameters and validating the effectiveness of the proposed multi-parameter fusion strategy for breast lesion visualization.
3.2. Sound Speed Reconstruction and Spatial Compounding
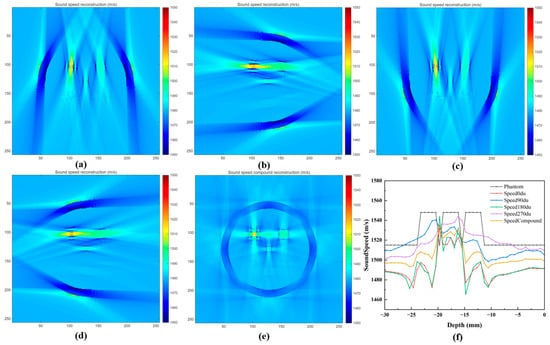
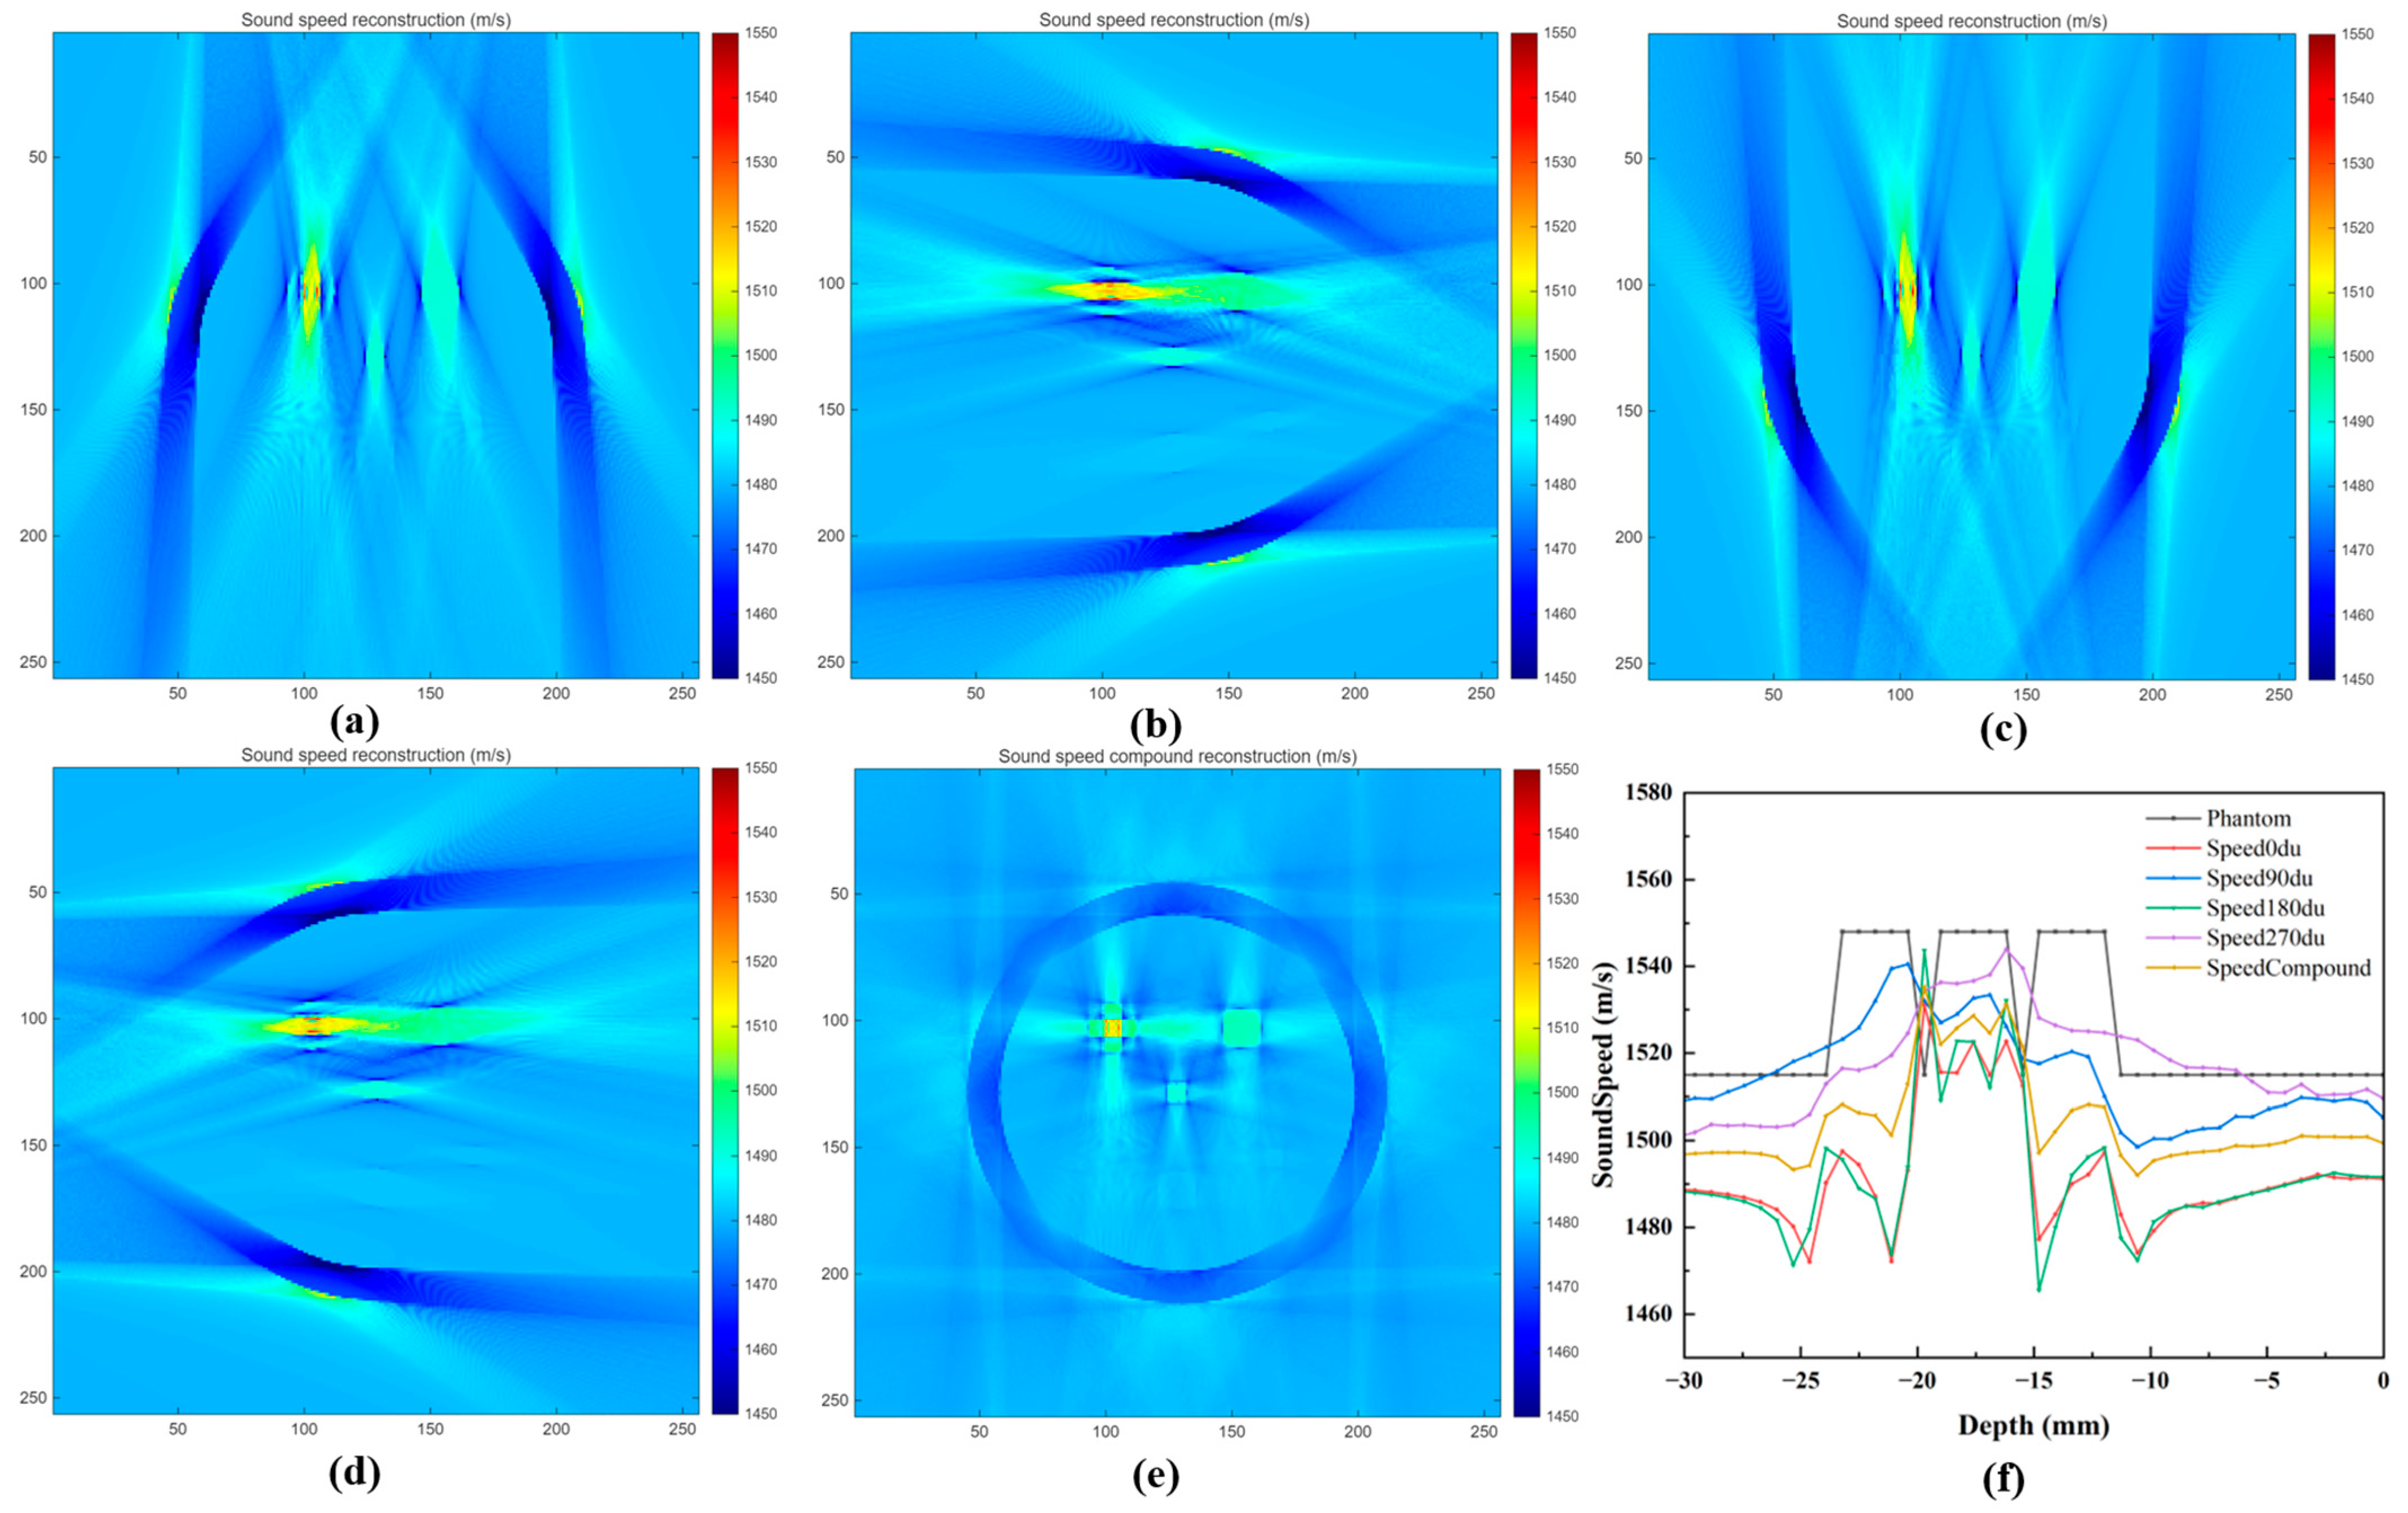
The sound speed reconstruction results obtained from different scanning configurations are presented in Figure 4. The transmission projection data acquired at 0°, 90°, 180°, and 270° were independently reconstructed using the proposed straight-line trajectory FBP algorithm. In addition, the four-directional reconstruction results were combined through spatial compounding to improve the completeness of acoustic information. As shown in Figure 4a–d, the sound speed images reconstructed from individual scanning directions can recover the general distribution of breast tissues and lesions. However, due to the limited projection information from a single direction, some artifacts and incomplete boundaries can be observed, especially in regions with complex tissue interfaces. The reconstructed images from different angles exhibit complementary characteristics because the ultrasound propagation paths are different.
Figure 4.
Sound speed reconstruction results using different scanning angles and spatial compounding. (a) 0°, (b) 90°, (c) 180°, (d) 270°, (e) spatially compounded reconstruction, and (f) sound speed profiles across the cancer lesion region at a detection depth of 70 mm.
After combining the four directional datasets, the spatially compounded sound speed image (Figure 4e) exhibits improved structural continuity and reduced directional artifacts. The boundaries between different tissue regions become clearer, and the lesion structures show better consistency with the numerical phantom. The sound speed profile along the detection depth of 70 mm (Figure 4f) further demonstrates that the compounded image provides a more accurate representation of the acoustic velocity variations compared with individual-angle reconstructions.
Quantitative comparisons of the reconstructed sound speed images are summarized in Table 3. The original physical parameter values were used, and the dynamic range was defined as the difference between the maximum and minimum values of the corresponding ground-truth parameter image. The spatially compounded reconstruction achieved improved PSNR, SSIM, and correlation coefficient values, while reducing RMSE compared with single-angle reconstruction results. These results indicate that multi-angle acquisition using the dual-pair PMUT linear array configuration can effectively improve the accuracy and stability of sound speed reconstruction.
Table 3.
Quantitative evaluation of sound speed reconstruction results under different scanning configurations.
3.3. Attenuation Reconstruction and Spatial Compounding
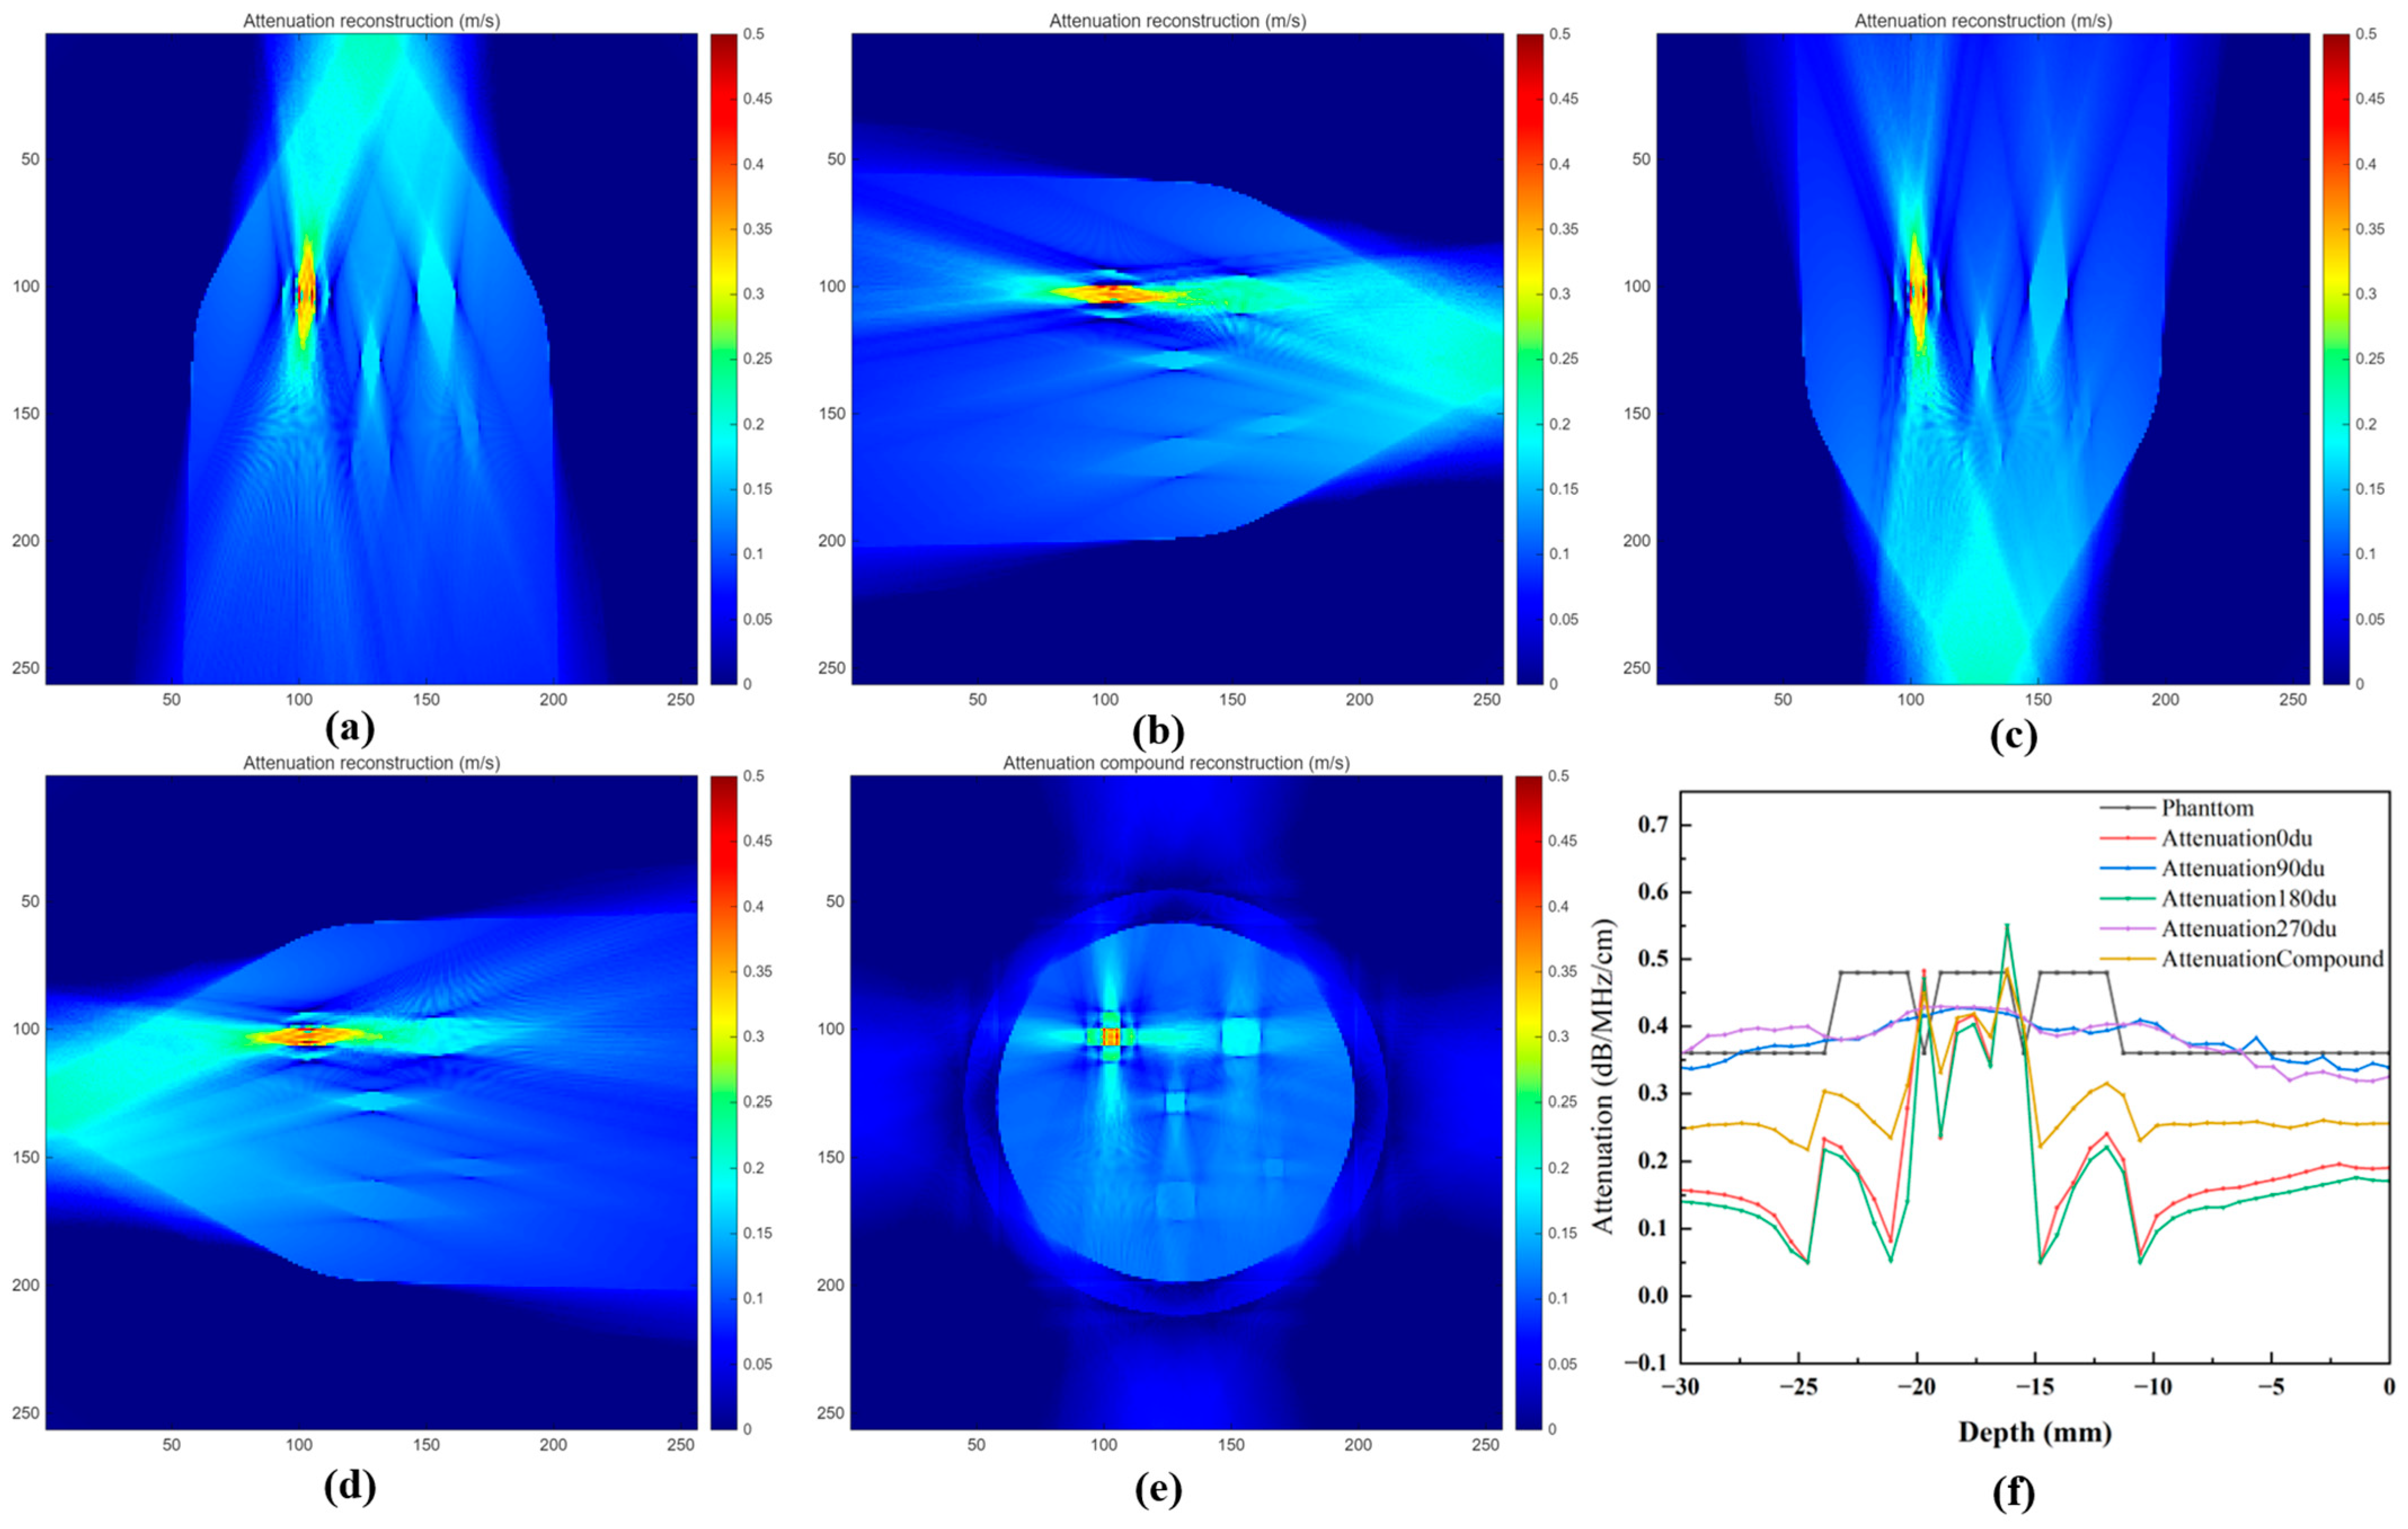
The attenuation reconstruction results obtained from different scanning configurations are presented in Figure 5. The attenuation projection data extracted from the amplitude decay of the transmitted ultrasound signals were reconstructed using the proposed straight-line trajectory FBP algorithm. Similar to the sound speed reconstruction, attenuation images were independently reconstructed from the four acquisition directions (0°, 90°, 180°, and 270°), and the final attenuation image was obtained through spatial compounding. As shown in Figure 5a–d, the attenuation images reconstructed from individual scanning directions can provide contrast variations among different breast tissue components. However, single-direction reconstruction suffers from incomplete projection information, resulting in nonuniform intensity distribution and residual artifacts in some regions. Due to the heterogeneous structure of breast tissue, the attenuation characteristics vary significantly among different tissues, providing complementary information to sound speed imaging.
Figure 5.
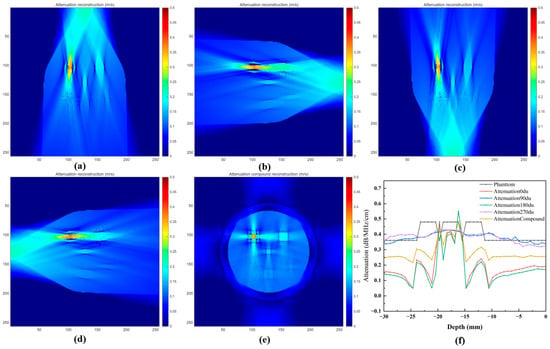
Attenuation reconstruction results using different scanning angles and spatial compounding. (a) 0°, (b) 90°, (c) 180°, (d) 270°, (e) spatially compounded reconstruction, and (f) attenuation profiles across the lesion region at a detection depth of 70 mm.
After combining the attenuation information from four different acquisition directions, the spatially compounded attenuation image (Figure 5e) exhibits improved contrast uniformity and reduced directional artifacts. The boundaries of lesion regions become clearer, and the attenuation distribution is more consistent with the numerical breast phantom. The attenuation profile across the lesion region at a detection depth of 70 mm (Figure 5f) demonstrates that the compounded reconstruction provides more stable attenuation variation compared with individual-angle reconstructions.
The quantitative evaluation results are summarized in Table 4. Compared with single-direction reconstruction, the spatially compounded attenuation image achieves improved image quality metrics, including higher PSNR, SSIM, and correlation coefficient, as well as lower RMSE. These results indicate that multi-angle acquisition using the dual-pair PMUT linear array configuration effectively improves the reliability of attenuation reconstruction.
Table 4.
Quantitative evaluation of attenuation reconstruction results under different scanning configurations.
3.4. Multi-Parameter Fusion and Lesion Visualization
The reconstructed sound speed, attenuation, and impedance-related images contain complementary acoustic information of breast tissues. However, each individual acoustic parameter provides only partial characterization of tissue properties, which may limit the visualization of complex breast lesions. Therefore, a wavelet-based multi-parameter fusion strategy was employed to integrate the complementary information from different acoustic images.
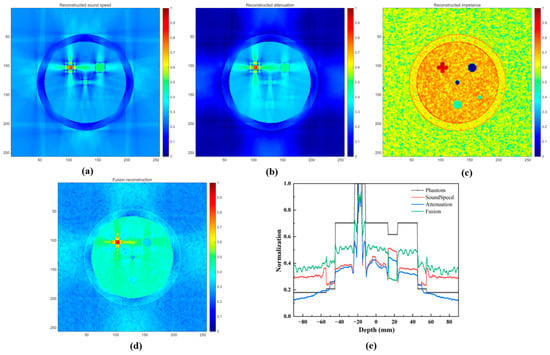
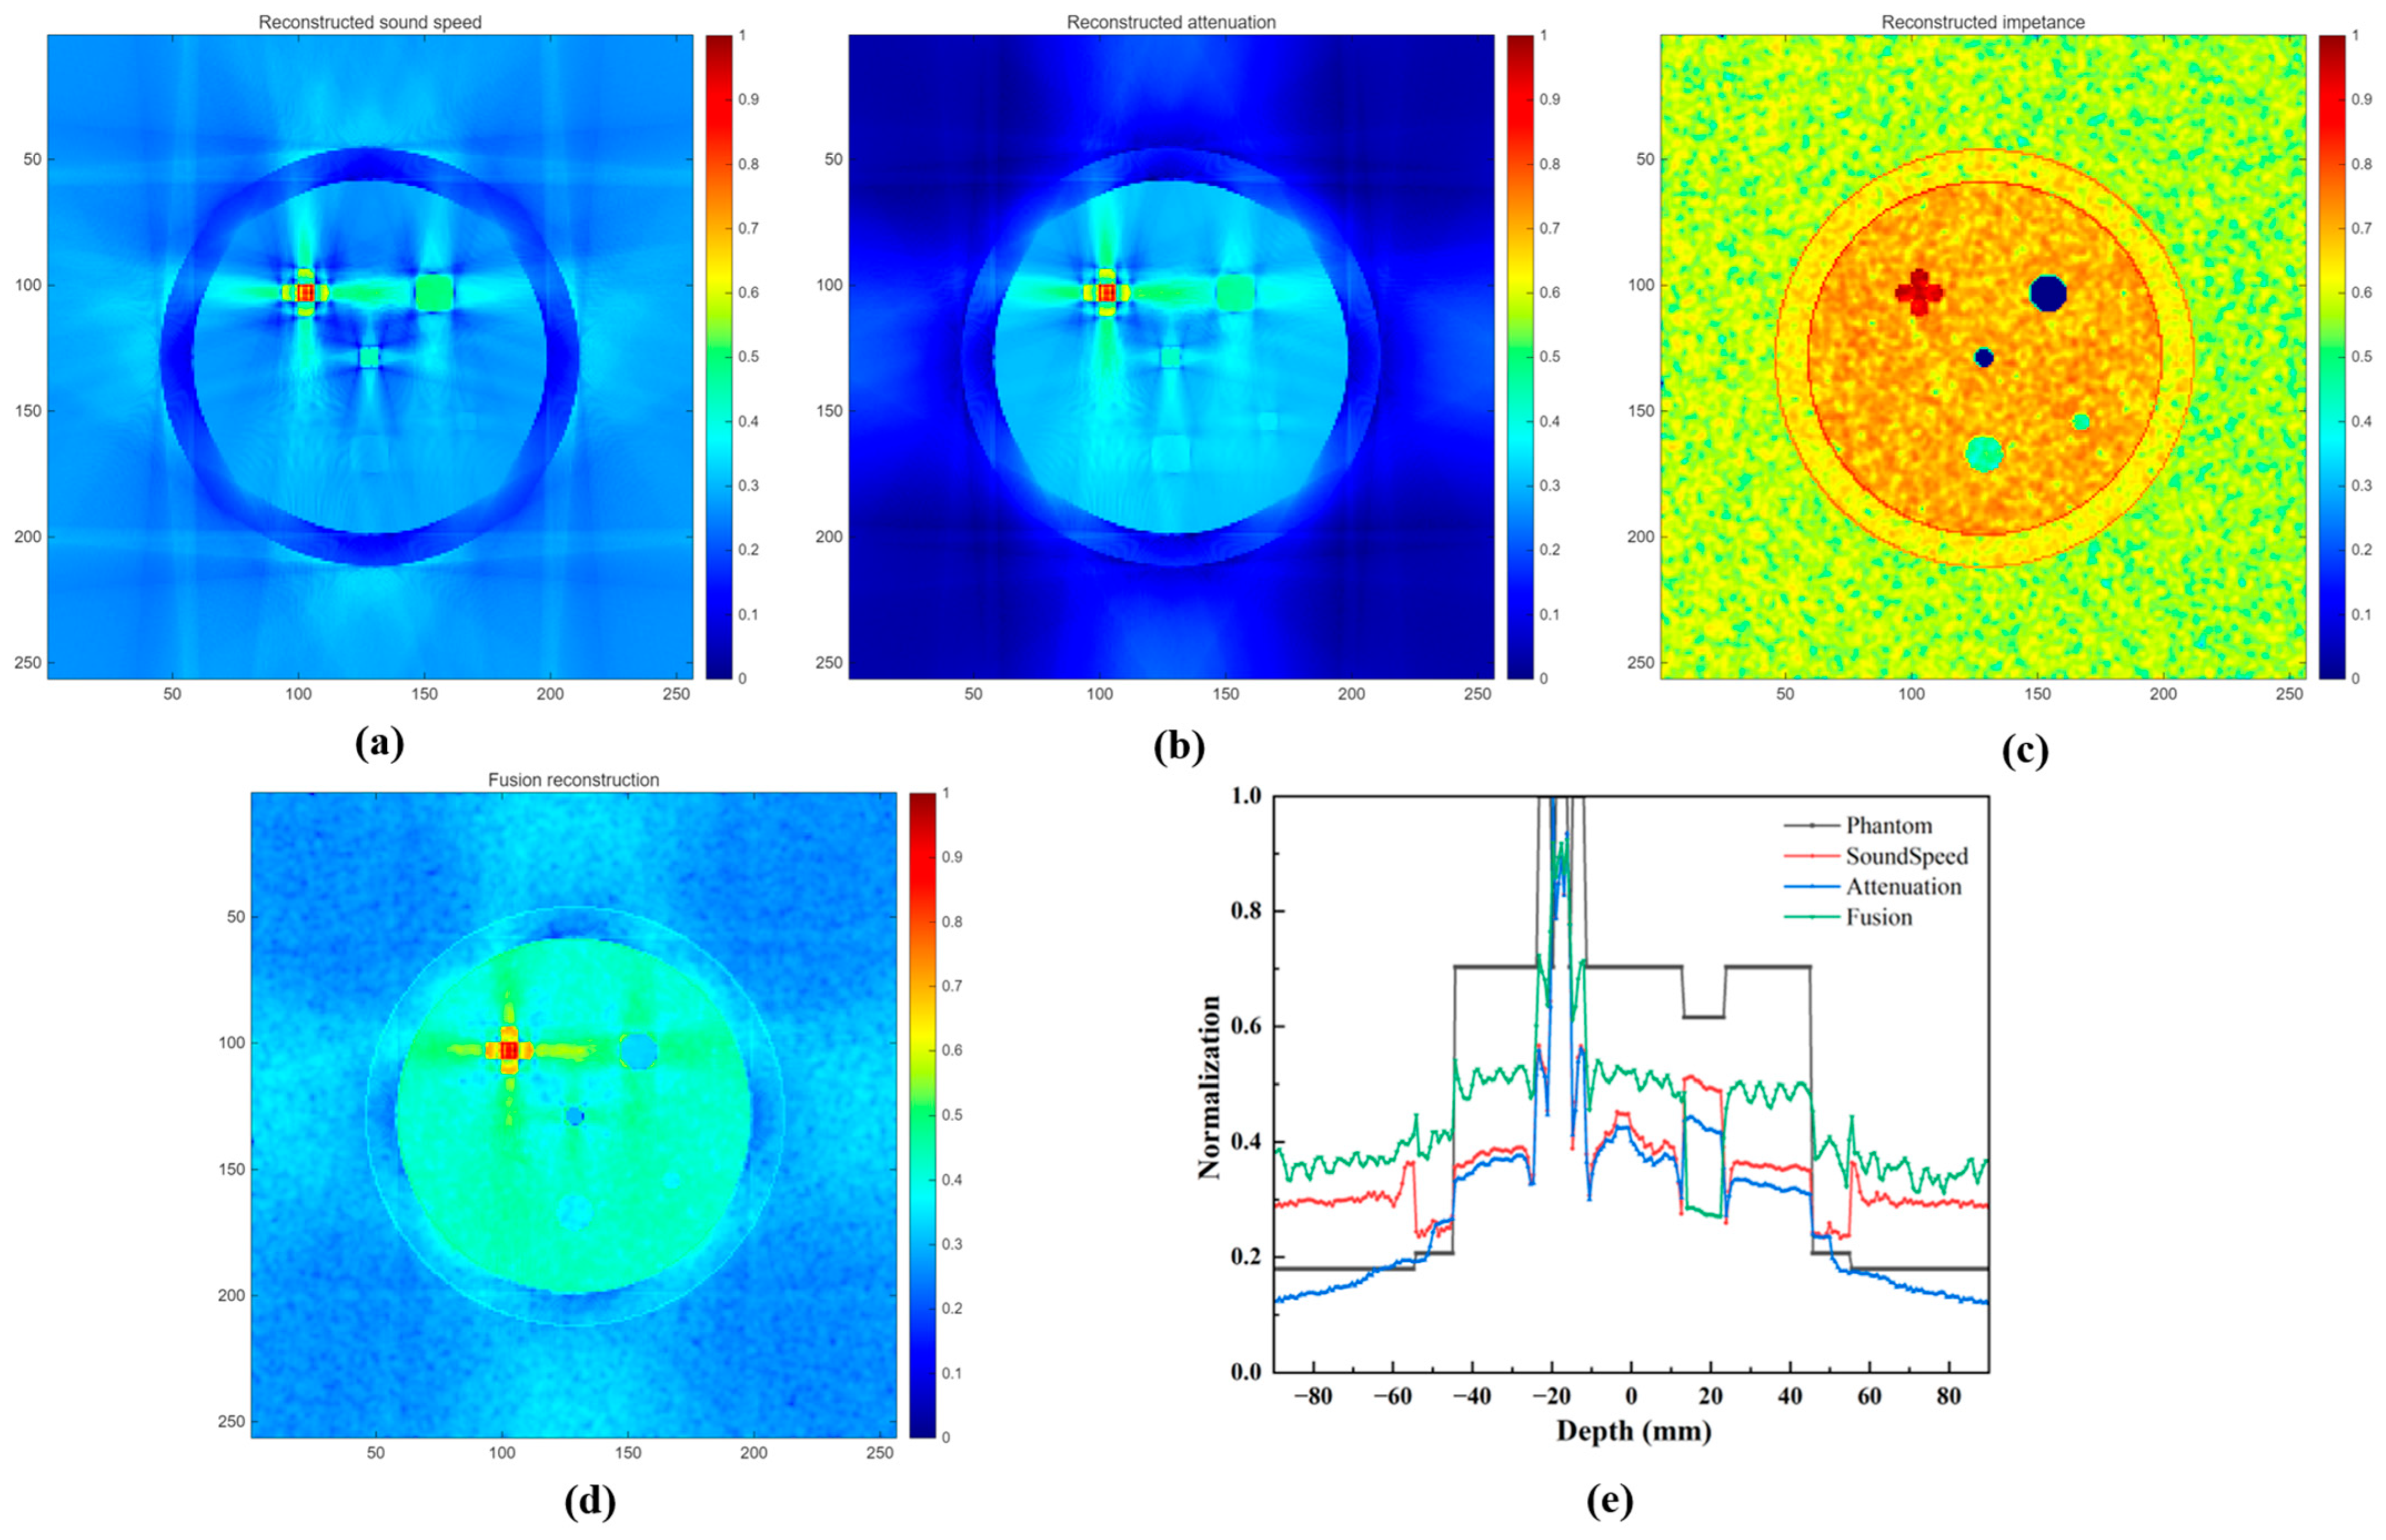
Figure 6 presents the comparison between individual acoustic images and the fused result. As shown in Figure 6a, the sound speed image provides clear information about tissue distribution and acoustic velocity variations, but the contrast between some lesion regions and surrounding tissues remains limited. The attenuation image (Figure 6b) provides enhanced intensity differences among different tissue types due to variations in ultrasound energy absorption. However, attenuation reconstruction alone may result in reduced structural details at some tissue boundaries. The impedance-related image obtained from pulse-echo signals provides additional boundary information, which is beneficial for identifying lesion contours. The impedance-related image (Figure 6c) was generated from the acoustic impedance distribution of the numerical breast phantom using a simplified reflection-based model. Local reflection coefficients along the two spatial directions were first calculated from the acoustic impedance differences between adjacent pixels, and the two directional components were combined to obtain the overall reflection response. Tissue-dependent scattering was approximated using a Gaussian-smoothed random texture with different relative scattering coefficients assigned to different tissue types. The reflection and scattering components were then combined, followed by depth-dependent attenuation, normalization, and logarithmic compression. The resulting image was used as an impedance-related structural image to provide complementary reflection and tissue-contrast information for multi-parameter fusion.
Figure 6.
Multi-parameter acoustic imaging and fusion results obtained using the proposed method. (a) Sound speed reconstruction image, (b) attenuation reconstruction image, (c) impedance-related reconstruction image, (d) fusion image, and (e) phantom profile along the detection depth 70 mm.
After wavelet-based fusion, the fused image (Figure 6d) combines the structural information from the impedance-related image with the quantitative acoustic characteristics from the sound speed and attenuation images. Compared with individual parameter images, the fused image exhibits improved tissue contrast and clearer lesion boundaries. The lesion profiles shown in Figure 6e further demonstrate that the fused image provides stronger intensity separation between lesion regions and surrounding tissues, indicating improved lesion visualization.
For quantitative evaluation of the fused image, the reference fused image shown in Figure 3e was used to calculate the SSIM and correlation coefficient. For CNR evaluation, separate lesion ROIs were defined for the cancer, fibroadenoma, and cyst regions, with corresponding local background ROIs selected from the surrounding non-lesion tissue. The same ROI locations were consistently applied to the corresponding reconstructed and fused images to ensure a consistent comparison. The quantitative comparison results are summarized in Table 5. The fused image achieves higher SSIM of 0.82 and correlation coefficient of 0.83 compared with individual acoustic parameter images, indicating better preservation of structural information and consistency with the reference distribution. In addition, the fused image obtains an improved CNR, demonstrating enhanced lesion visibility. These results confirm that the proposed multi-parameter fusion strategy effectively integrates complementary acoustic information and improves breast lesion visualization.
Table 5.
Quantitative comparison of different acoustic parameter images and the fused image.
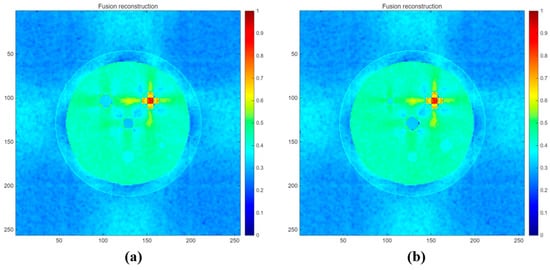
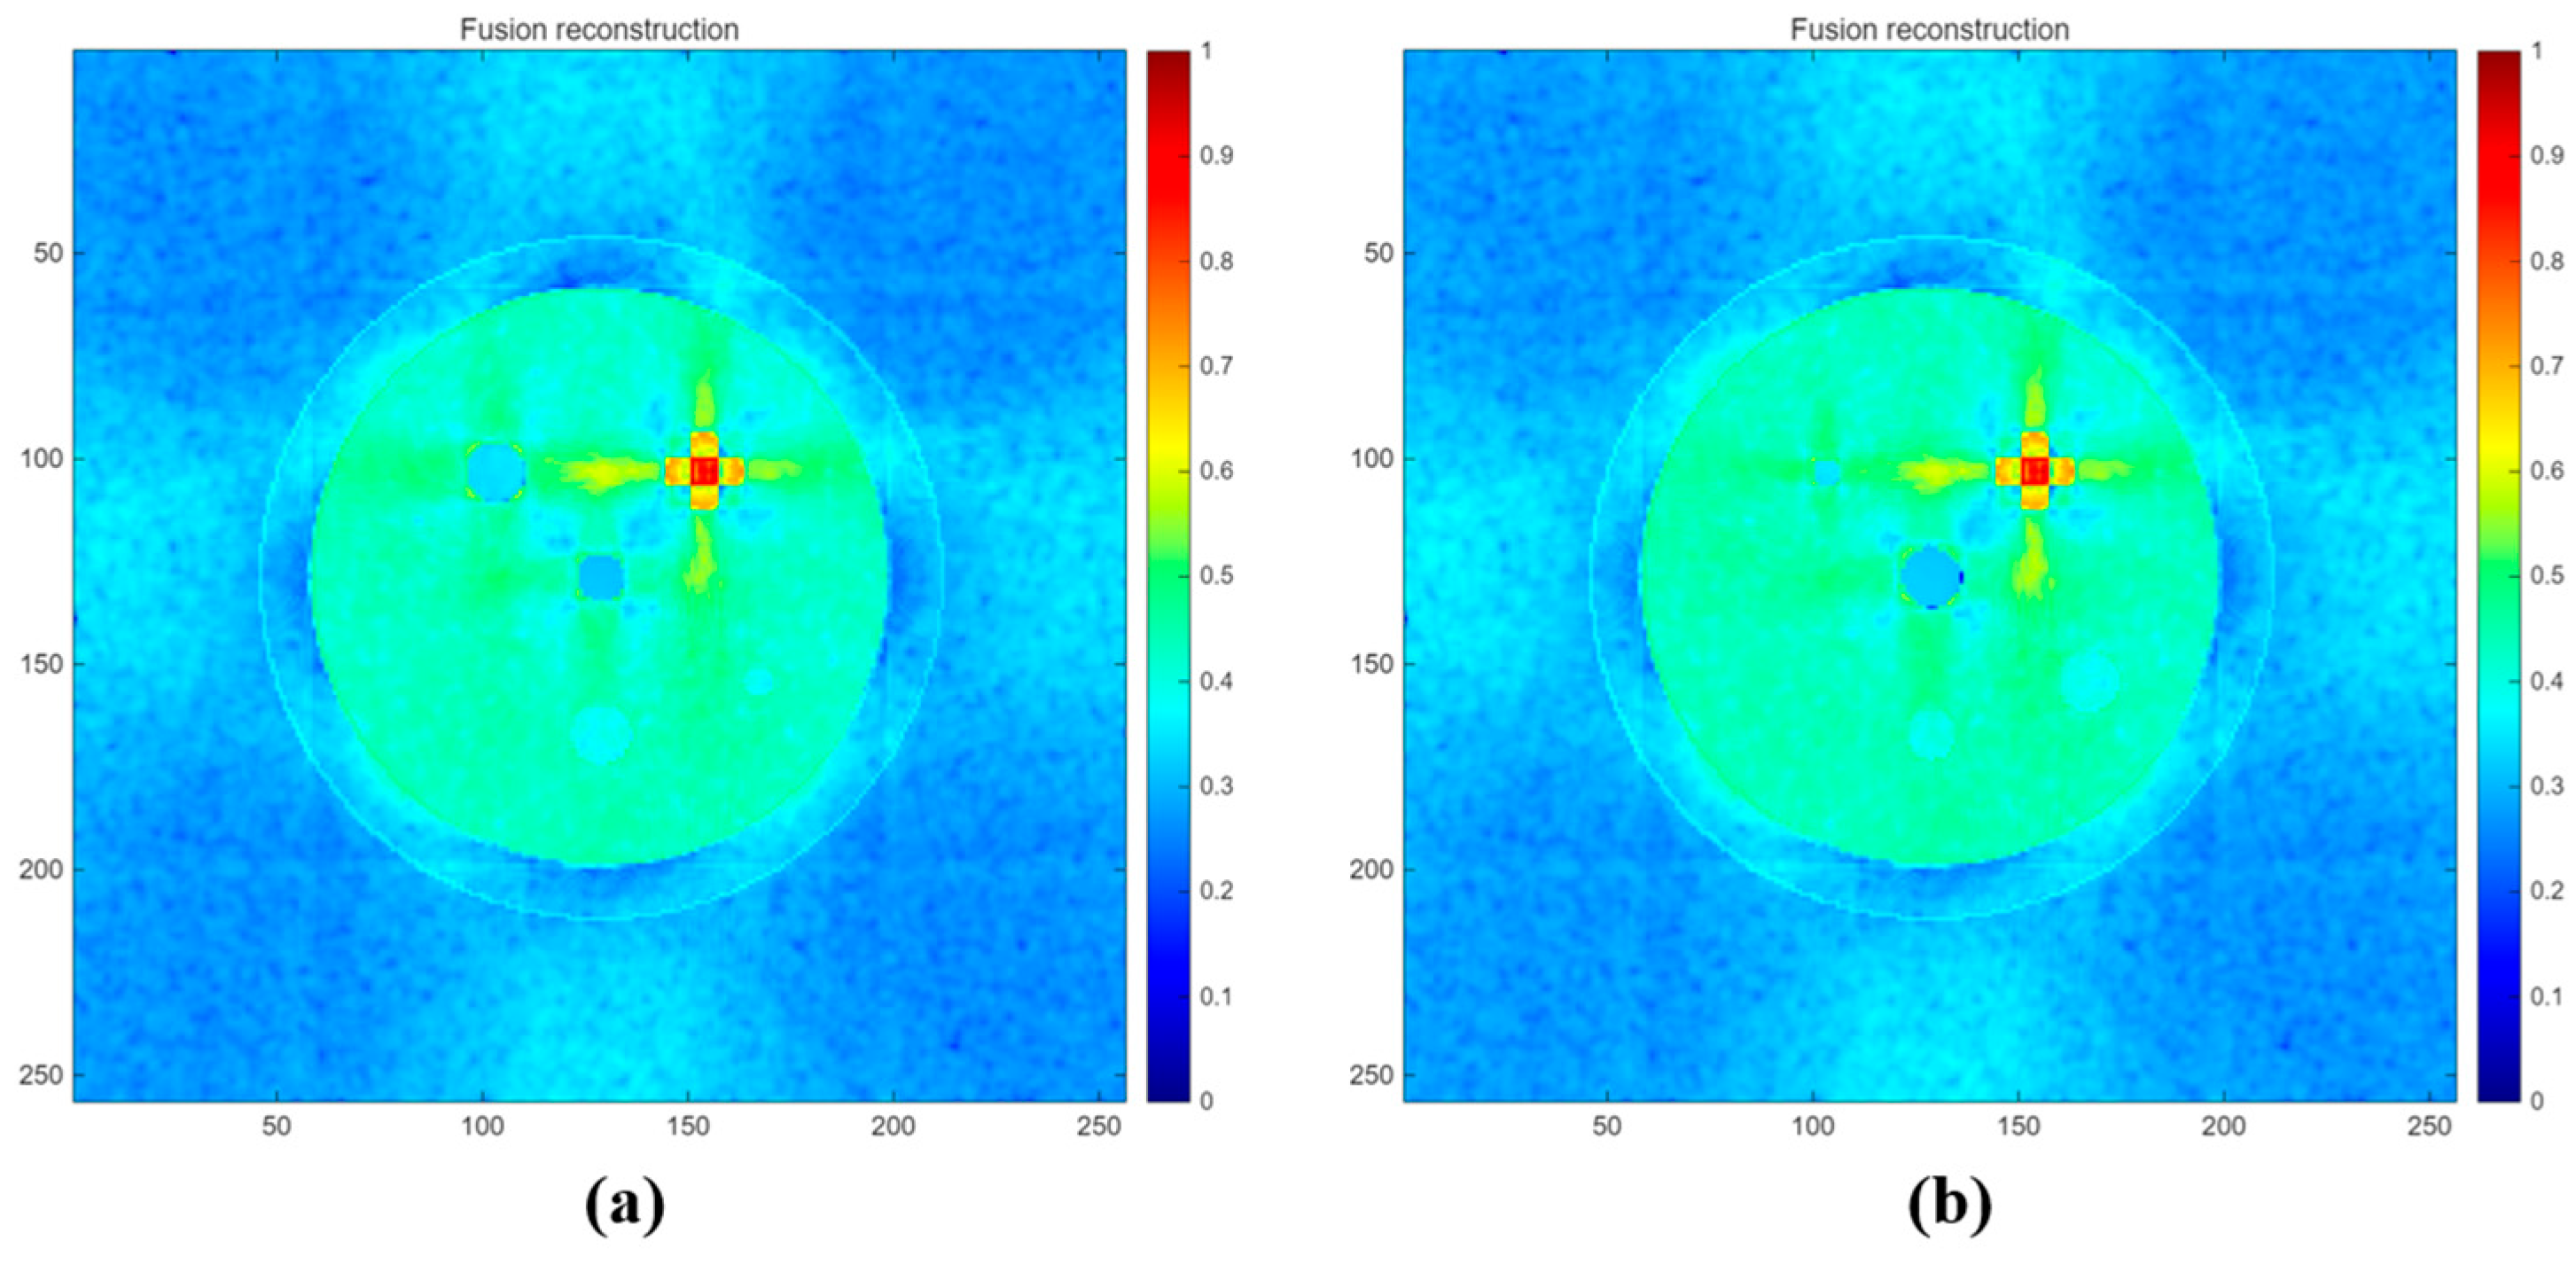
To further evaluate the advantage of the proposed wavelet-based fusion method, additional numerical simulations were performed using breast phantoms with different lesion sizes and shapes. The same reconstruction, spatial compounding, and multi-parameter fusion procedures were applied to all phantom configurations. As shown in Figure 7, the main tissue structures and lesions were consistently visualized under different lesion configurations, demonstrating the robustness of the proposed method in preserving lesion geometry across variations in lesion size and shape.
Figure 7.
Fusion reconstruction results for two numerical breast phantoms with different lesion sizes and shapes. (a) Phantom II and (b) phantom III.
A limitation of the present study is that the imaging performance of the physical PMUT-based USCT system has not yet been experimentally validated using a tissue-mimicking or physical breast phantom. Although the dual-pair PMUT linear array-based USCT system was physically implemented and the PMUT arrays were experimentally characterized, the breast imaging, reconstruction, spatial compounding, and multi-parameter fusion results presented in this study were obtained from numerical simulations. Therefore, the current results should be regarded as a numerical proof-of-concept evaluation of the proposed imaging framework rather than a complete experimental validation of the physical system. Future work will focus on tissue-mimicking breast phantom experiments using the physical PMUT system to evaluate the proposed method under more realistic acoustic propagation and measurement conditions.
4. Conclusions
In this study, a breast ultrasound computed tomography method based on a dual-pair PMUT linear array system and multi-parameter acoustic fusion was proposed. The proposed system enables multi-angle transmission and reflection ultrasound acquisition using four PMUT linear arrays, providing complementary acoustic information for quantitative breast imaging. A straight-line trajectory filtered back-projection reconstruction algorithm was employed to reconstruct sound speed and attenuation images from transmission measurements. In addition, impedance-related structural information extracted from pulse-echo signals was introduced as an auxiliary feature to enhance tissue boundaries. A wavelet-based fusion strategy was further developed to integrate the complementary information from sound speed, attenuation, and impedance-related images. Numerical breast phantom simulations demonstrated that multi-angle spatial compounding improved the stability and accuracy of sound speed and attenuation reconstruction compared with individual-angle reconstruction. Furthermore, the fused acoustic image achieved improved structural similarity, correlation, and contrast-to-noise ratio, resulting in enhanced visualization of breast lesions in the numerical phantom. These results provide a numerical proof of concept for the proposed dual-pair PMUT linear array-based USCT and multi-parameter fusion framework.
Author Contributions
Conceptualization, C.L.; methodology, C.L. and X.T.; software, L.W.; validation, C.L., X.T. and L.W.; formal analysis, C.L.; investigation, C.X.; resources, C.X.; data curation, C.L.; writing—original draft preparation, C.L.; writing—review and editing, X.T.; visualization, L.W.; supervision, C.L.; project administration, C.X.; funding acquisition, C.L. and L.W. All authors have read and agreed to the published version of the manuscript.
Funding
This research was funded by the fundamental research program of Shanxi province (20210302124099, 202403021222298) and the program for the discipline leaders of Taiyuan Institute of Technology.
Data Availability Statement
The data that support the findings of this study are available from the corresponding author upon reasonable request.
Conflicts of Interest
Author Xiaogang Tong was employed by the company Shanxi Tiancheng Semiconductor Material Co., Ltd. The remaining authors declare that the research was conducted in the absence of any commercial or financial relationships that could be construed as a potential conflict of interest.
References
- Siegel, R.L.; Miller, K.D.; Fuchs, H.E.; Jemal, A. Cancer statistics, 2022. CA Cancer J. Clin. 2022, 72, 7–33. [Google Scholar] [CrossRef] [Scilit] [PubMed]
- Gemmeke, H.; Ruiter, N.V. 3D ultrasound computer tomography for medical imaging. In Nuclear Instruments and Methods in Physics Research Section A: Accelerators, Spectrometers, Detectors and Associated Equipment; Elsevier: Amsterdam, The Netherlands, 2007; Volume 580, pp. 1057–1065. [Google Scholar] [CrossRef] [Scilit]
- Li, P.; Li, Y.; Su, C.; Dong, Z.; Lin, W. Sobolev space norm regularized full waveform inversion for ultrasound computed tomography. Chin. Phys. B 2025, 34, 054301. [Google Scholar] [CrossRef] [Scilit]
- Pei, Y.; Zhang, Y.; Hu, S.; Wang, Z.; Li, Y.; He, C.; Zhang, S.; Wang, R.; Zhang, W.; Zhang, G. Breast Transmission Ultrasound Tomography Based on Capacitive Micromachined Ultrasonic Transducer Linear Arrays. IEEE Sens. J. 2022, 22, 1209–1217. [Google Scholar] [CrossRef] [Scilit]
- Wiskin, J.; Malik, B.; Ruoff, C.; Pirshafiey, N.; Lenox, M.; Klock, J. Whole-Body Imaging Using Low Frequency Transmission Ultrasound. Acad. Radiol. 2023, 30, 2674–2685. [Google Scholar] [CrossRef] [Scilit] [PubMed]
- Duric, N.; Littrup, P.; Poulo, L.; Babkin, A.; Pevzner, R.; Holsapple, E.; Rama, O.; Glide, C. Detection of breast cancer with ultrasound tomography: First results with the Computed Ultrasound Risk Evaluation (CURE) prototype. Med. Phys. 2007, 34, 773–785. [Google Scholar] [CrossRef] [Scilit] [PubMed]
- Littrup, P.J.; Mehrmohammadi, M.; Duric, N. Breast Tomographic Ultrasound: The Spectrum from Current Dense Breast Cancer Screenings to Future Theranostic Treatments. Tomography 2024, 10, 554–573. [Google Scholar] [CrossRef] [Scilit] [PubMed]
- Sandhu, G.Y.; Li, C.; Roy, O.; Schmidt, S.; Duric, N. Frequency domain ultrasound waveform tomography: Breast imaging using a ring transducer. Phys. Med. Biol. 2015, 60, 5381–5398. [Google Scholar] [CrossRef] [Scilit] [PubMed]
- Duric, N.; Heyde, B.; Hopp, T.; You, W.; Zapf, M.; Tan, W.Y.; Gemmeke, H.; Ruiter, N.V. Automated breast segmentation in ultrasound computer tomography SAFT images. In Proceedings of the Medical Imaging 2017: Ultrasonic Imaging and Tomography, Orlando, FL, USA, 11–16 February 2017. [Google Scholar]
- Duric, N.; Heyde, B.; Sandhu, G.Y.; West, E.; Li, C.; Roy, O.; Duric, N. 3D frequency-domain ultrasound waveform tomography breast imaging. In Proceedings of the Medical Imaging 2017: Ultrasonic Imaging and Tomography, Orlando, FL, USA, 11–16 February 2017. [Google Scholar]
- D’Hooge, J.; Roy, O.; McAleavey, S.A.; Jovanović, I.; Hormati, A.; Parhizkar, R.; Vetterli, M. Sound speed estimation using wave-based ultrasound tomography: Theory and GPU implementation. In Proceedings of the Medical Imaging 2010: Ultrasonic Imaging, Tomography, and Therapy, San Diego, CA, USA, 13–18 February 2010. [Google Scholar]
- Fu, Y.; Sun, S.; Wang, Z.; Niu, P.; Zhang, M.; Chen, S.; Pang, W. Piezoelectric Micromachined Ultrasonic Transducer with Superior Acoustic Outputs for Pulse-Echo Imaging Application. IEEE Electron. Device Lett. 2020, 41, 1572–1575. [Google Scholar] [CrossRef] [Scilit]
- Hooi, F.M.; Carson, P.L. First-arrival traveltime sound speed inversion with a priori information. Med. Phys. 2014, 41, 082902. [Google Scholar] [CrossRef] [Scilit] [PubMed]
- Ruiter, N.V.; Zapf, M.; Hopp, T.; Dapp, R.; Kretzek, E.; Birk, M.; Kohout, B.; Gemmeke, H. 3D ultrasound computer tomography of the breast: A new era? Eur. J. Radiol. 2012, 81, S133–S134. [Google Scholar] [CrossRef] [Scilit] [PubMed]
- Huang, Y.; Zeng, Y.; Cui, S.; Liu, C.; Cai, X. Geometric a priori informed bent-ray tracing for accelerated sound speed imaging in ultrasound computed tomography. Ultrasonics 2025, 151, 107595. [Google Scholar] [CrossRef] [Scilit] [PubMed]
- Chang, L.; Yijun, C.; Chenyang, X. Design of AlN-Based PMUT with High Electromechanical Coupling Efficiency for Breast Cancer Diagnosis. Int. J. Eng. Technol. Innov. 2025, 15, 210–222. [Google Scholar] [CrossRef] [Scilit]
- Wang, Q.; Zhao, L.; Yang, T.; Liao, Z.; Xue, X.; Wu, B.; Zhang, W.; Zang, J.; Cui, D.; Zhang, Z.; et al. A Mathematical Model of a Piezoelectric Micro- Machined Hydrophone with Simulation and Experimental Validation. IEEE Sens. J. 2021, 21, 13364–13372. [Google Scholar] [CrossRef] [Scilit]
- Jia, L.; Shi, L.; Liu, C.; Sun, C.; Wu, G. Enhancement of Transmitting Sensitivity of Piezoelectric Micromachined Ultrasonic Transducers by Electrode Design. IEEE Trans. Ultrason. Ferroelectr. Freq. Control 2021, 68, 3371–3377. [Google Scholar] [CrossRef] [Scilit] [PubMed]
- Moisello, E.; Novaresi, L.; Sarkar, E.; Malcovati, P.; Costa, T.L.; Bonizzoni, E. PMUT and CMUT Devices for Biomedical Applications: A Review. IEEE Access 2024, 12, 18640–18657. [Google Scholar] [CrossRef] [Scilit]
- Jia, L.; Liang, Y.; Zhang, G.; Wang, R.; He, C.; Yang, Y.; Cui, J.; Wu, G.; Zhang, W. Design and characterization of a high performance transceiver integrated PMUTs array for breast cancer imaging. Measurement 2024, 238, 115318. [Google Scholar] [CrossRef] [Scilit]
- Joshi, S.V.; Sadeghpour, S.; Kuznetsova, N.; Wang, C.; Kraft, M. Flexible micromachined ultrasound transducers (MUTs) for biomedical applications. Microsyst. Nanoeng. 2025, 11, 9. [Google Scholar] [CrossRef] [Scilit] [PubMed]
- Bosch, J.G.; Duric, N.; Wang, K.; Matthews, T.; Anis, F.; Li, C.; Duric, N.; Anastasio, M.A. Breast ultrasound computed tomography using waveform inversion with source encoding. In Proceedings of the Medical Imaging 2015: Ultrasonic Imaging and Tomography, Orlando, FL, USA, 21–26 February 2015. [Google Scholar]
- Ozmen, N.; Dapp, R.; Zapf, M.; Gemmeke, H.; Ruiter, N.V.; van Dongen, K.W. Comparing different ultrasound imaging methods for breast cancer detection. IEEE Trans. Ultrason. Ferroelectr. Freq. Control 2015, 62, 637–646. [Google Scholar] [CrossRef] [Scilit] [PubMed]
- Yu, S.; Wu, S.; Zhuang, L.; Wei, X.; Sak, M.; Neb, D.; Hu, J.; Xie, Y. Efficient Segmentation of a Breast in B-Mode Ultrasound Tomography Using Three-Dimensional GrabCut (GC3D). Sensors 2017, 17, 1827. [Google Scholar] [CrossRef] [Scilit] [PubMed]
- Koch, A.; Stiller, F.; Lerch, R.; Ermert, H. An ultrasound tomography system with polyvinyl alcohol (PVA) moldings for coupling: In vivo results for 3-D pulse-echo imaging of the female breast. IEEE Trans. Ultrason. Ferroelectr. Freq. Control 2015, 62, 266–279. [Google Scholar] [CrossRef] [Scilit] [PubMed]
- Mercep, E.; Jeng, G.; Morscher, S.; Li, P.C.; Razansky, D. Hybrid optoacoustic tomography and pulse-echo ultrasonography using concave arrays. IEEE Trans. Ultrason. Ferroelectr. Freq. Control 2015, 62, 1651–1661. [Google Scholar] [CrossRef] [Scilit] [PubMed]
- Zhang, N.; Zhao, Y.; Yuan, Y.; Xiao, Y.; Qin, M.; Shen, Y. Cross-correlation adjustment full-waveform inversion with source encoding in ultrasound computed tomography. Ultrasonics 2024, 142, 107392. [Google Scholar] [CrossRef] [Scilit] [PubMed]
- Liu, C.; Xue, C.; Zhang, B.; Zhang, G.; He, C. The Application of an Ultrasound Tomography Algorithm in a Novel Ring 3D Ultrasound Imaging System. Sensors 2018, 18, 1332. [Google Scholar] [CrossRef] [Scilit] [PubMed]
- Liu, C.; Zhang, B.; Xue, C.; Zhang, W.; Zhang, G.; Cheng, Y. Multi-Perspective Ultrasound Imaging Technology of the Breast with Cylindrical Motion of Linear Arrays. Appl. Sci. 2019, 9, 419. [Google Scholar] [CrossRef] [Scilit]
- Wu, F.; Xue, R.; Meng, F.; Wang, R.; Zhang, G.; He, C.; Yang, Y.; Cui, J.; Zhang, W.; Jia, L. Research on high-resolution breast ultrasound imaging technology based on 1 × 256 ring transducer array. Measurement 2025, 253, 117391. [Google Scholar] [CrossRef] [Scilit]
- Chang, C.H.; Huang, S.W.; Yang, H.C.; Chou, Y.H.; Li, P.C. Reconstruction of ultrasonic sound velocity and attenuation coefficient using linear arrays: Clinical assessment. Ultrasound Med. Biol. 2007, 33, 1681–1687. [Google Scholar] [CrossRef] [Scilit] [PubMed]
- Qiu, Y.; Gigliotti, J.V.; Wallace, M.; Griggio, F.; Demore, C.E.; Cochran, S.; Trolier-McKinstry, S. Piezoelectric micromachined ultrasound transducer (PMUT) arrays for integrated sensing, actuation and imaging. Sensors 2015, 15, 8020–8041. [Google Scholar] [CrossRef] [Scilit] [PubMed]
- Samimi, K.; Varghese, T. Optimum Diffraction-Corrected Frequency-Shift Estimator of the Ultrasonic Attenuation Coefficient. IEEE Trans. Ultrason. Ferroelectr. Freq. Control 2016, 63, 691–702. [Google Scholar] [CrossRef] [Scilit] [PubMed]
- Li, C.; Duric, N.; Littrup, P.; Huang, L. In vivo breast sound-speed imaging with ultrasound tomography. Ultrasound Med. Biol. 2009, 35, 1615–1628. [Google Scholar] [CrossRef] [Scilit] [PubMed]
- Jeong, M.K.; Kwon, S.J. Multimode ultrasound breast imaging using a new array transducer configuration. Ultrasound Med. Biol. 2010, 36, 637–646. [Google Scholar] [CrossRef] [Scilit] [PubMed]
- Zhang, W.; Zhang, H.; Li, L.; Wang, L.; Cai, A.; Li, Z.; Yan, B. A promising limited angular computed tomography reconstruction via segmentation based regional enhancement and total variation minimization. Rev. Sci. Instrum. 2016, 87, 083104. [Google Scholar] [CrossRef] [Scilit] [PubMed]
- Cheng, Y.; Liu, C.; Xue, C.; Zhang, B. Ultrasound tomography reconstruction algorithm using two opposite rotatable linear arrays for breast cancer diagnosis. AIP Adv. 2021, 11, 055124. [Google Scholar] [CrossRef] [Scilit]
- Hirose, S.; Nishimoto, S.; Maruyama, T.; Nagata, Y. Improved ultrasonic SAFT imaging of flaws in structures with curved surfaces. In Proceedings of the 40th Annual Review of Progress in Quantitative Nondestructive Evaluation, Baltimore, MD, USA, 21–26 July 2013; pp. 36–41. [Google Scholar]
- Hopp, T.; Duric, N.; Ruiter, N.V. Image fusion of Ultrasound Computer Tomography volumes with X-ray mammograms using a biomechanical model based 2D/3D registration. Comput. Med. Imaging Graph. 2015, 40, 170–181. [Google Scholar] [CrossRef] [Scilit] [PubMed]
- Hollander, B.; Hendriks, G.A.; Mann, R.M.; Hansen, H.H.; de Korte, C.L. Plane-Wave Compounding in Automated Breast Volume Scanning: A Phantom-Based Study. Ultrasound Med. Biol. 2016, 42, 2493–2503. [Google Scholar] [CrossRef] [Scilit] [PubMed]

Disclaimer/Publisher’s Note: The statements, opinions and data contained in all publications are solely those of the individual author(s) and contributor(s) and not of MDPI and/or the editor(s). MDPI and/or the editor(s) disclaim responsibility for any injury to people or property resulting from any ideas, methods, instructions or products referred to in the content. |
© 2026 by the authors. Licensee MDPI, Basel, Switzerland. This article is an open access article distributed under the terms and conditions of the Creative Commons Attribution (CC BY) license.