


Abstract
Due to the high sensitivity of proton exchange membrane fuel cells (PEMFCs) to feed gas contamination through balance of plant (BOP) materials, in situ qualification plays a crucial role to secure performance, durability, and economic viability. To be able to deliver verified and accurate qualification results it is necessary to analyze the test method in detail and to perform repetitions on certain measurements. This work focuses on validation of an in situ material qualification test method in terms of measuring precision on a previously developed test bench and statistical significance of collected data. As a statistical approach t-test was used to calculate confidence intervals based on a sample size of 15 reference measurements with the same parameters and setup but variable membrane electrode assemblies (MEAs). The results show substantial reduction in confidence intervals with growing measurement’s sample size clearly quantifying accuracy of the analyzed methodology. The precision of the test method, as indicated by the calculated confidence intervals of irreversible voltage loss is approximately 1.21 mV, corresponding to a relative deviation of about 0.17% with respect to the calculated mean value across all steady-state phases (SSPs). This approach also provides an insight into the natural degradation behavior of the tested MEAs. The calculated effects can serve as a basis for design of experiments (DOE) in future test series.
1. Introduction
Proton exchange membrane fuel cells (PEMFCs) are considered a promising low-emission energy conversion technology for mobile and stationary applications due to their high efficiency and local zero-carbon operation. However, their performance and durability are highly sensitive to trace contaminants. Volatile and very volatile organic compounds (VOCs/VVOCs) released from polymeric materials of balance of plant (BOP) system components (e.g., sealings, hoses, connectors), as well as impurities in the reactant gas streams (atmospheric air and hydrogen) can reach the membrane electrode assembly (MEA) and poison the catalyst, leading to short-term voltage loss (reversible) and long-term performance-relevant degradation (irreversible). This subject is still rarely researched with a limited number of publications [1,2,3,4,5,6]. The severity of catalyst poisoning and the associated membrane degradation is strongly material-dependent. Materials with low emission potential may cause little or no desorption of performance-relevant species, but such materials are often expensive. Consequently, identifying lower-cost substitute materials without compromising fuel cell performance is essential for reducing system costs and supporting the broader market deployment of fuel cell technologies [7]. To analyze the direct link between desorbed emissions and reduction in electrochemical active area of the membrane electrode assembly (MEA), it is inevitable to focus on in situ test method with a fuel cell coupling. National Renewable Energy Laboratory (NREL) in cooperation with US universities has developed a test method to bring contaminants from assembly aids into a liquid phase using leaching and then introduce leachate to a performing fuel cell through an infusion directly into a gas feed stream [7,8,9]. Subsequently, the same approach was used to qualify polythalamide leachate from structural material [10]. Furthermore, the leaching approach was applied to quantify potential contaminant concentration in leachate from styrene-butadiene rubber (SBR) and neoprene via gas chromatography-mass spectrometry (GCMS) and Fourier transform infrared attenuated total reflectance (FTIR-ATR) [11]. Also, a slightly different concept of a cationic contaminants infusion was introduced with a separate air gas feed stream through the nebulizer [12]. As an extension to the quantification of extracted solutions, electrochemical characterization such as cyclic voltammetry has been performed on 3-electrode ex situ system to evaluate possible Pt catalyst poisoning due to leaching contaminants [13].
By producing aerosol with the help of a nozzle, it is possible to analyze voltage behavior of the cell in the presence of ions and trace particles from leachate, which can be brought into the system externally, e.g., through the air feed stream [14]. Gaseous emissions with high vapor pressure and a low boiling point, such as some of the VVOCs and VOCs, released due to a thermal activation occur internally from integrated polymer components in the system [15]. Accordingly, the general motivation for our in situ material qualification method arises from the recognition of this fact. The in situ examination of thermally activated desorption in gaseous phase of BOP materials, in particular ethylene-propylene diene monomer (EPDM) and fluoroelastomer-based materials (FKM), using eight parallel operated PEMFCs, was carried out to observe the degradation effect and to determine a potential voltage loss [1]. The experimental setup of the study consists of eight separately operating PEMFCs sharing a common air feed inlet. The air stream passes through a heated aluminum sample holder, which can be bypassed using a directional control valve to enable reference measurements. The sample holder accommodates various materials that release gaseous emissions upon thermal activation. As the air feed passes through the holder, it transports these emissions into the fuel cells, where the resulting voltage response is monitored [16,17]. This approach may offer advantages when analyzing the voltage behavior of individual cells supplied by a common gas inlet, particularly with respect to emission distribution, while investigating one material at a time. However, if the comparability between the cells is not verified, evaluating different material across multiple single cells becomes challenging and may introduce uncertainties. In contrast, applying a single-cell setup enables clearer interpretation of results, requiring less technical complexity while improving reliability. It is also noted that the referenced study includes a limited number of repetitions (n = 2 per material), which restricts the statistical validity of the findings. Therefore, our research addresses these limitations by applying a single-cell approach and systematically repeating experiments to validate the methodology, thereby improving reproducibility and ensuring methodological rigor.
2. Materials and Methods
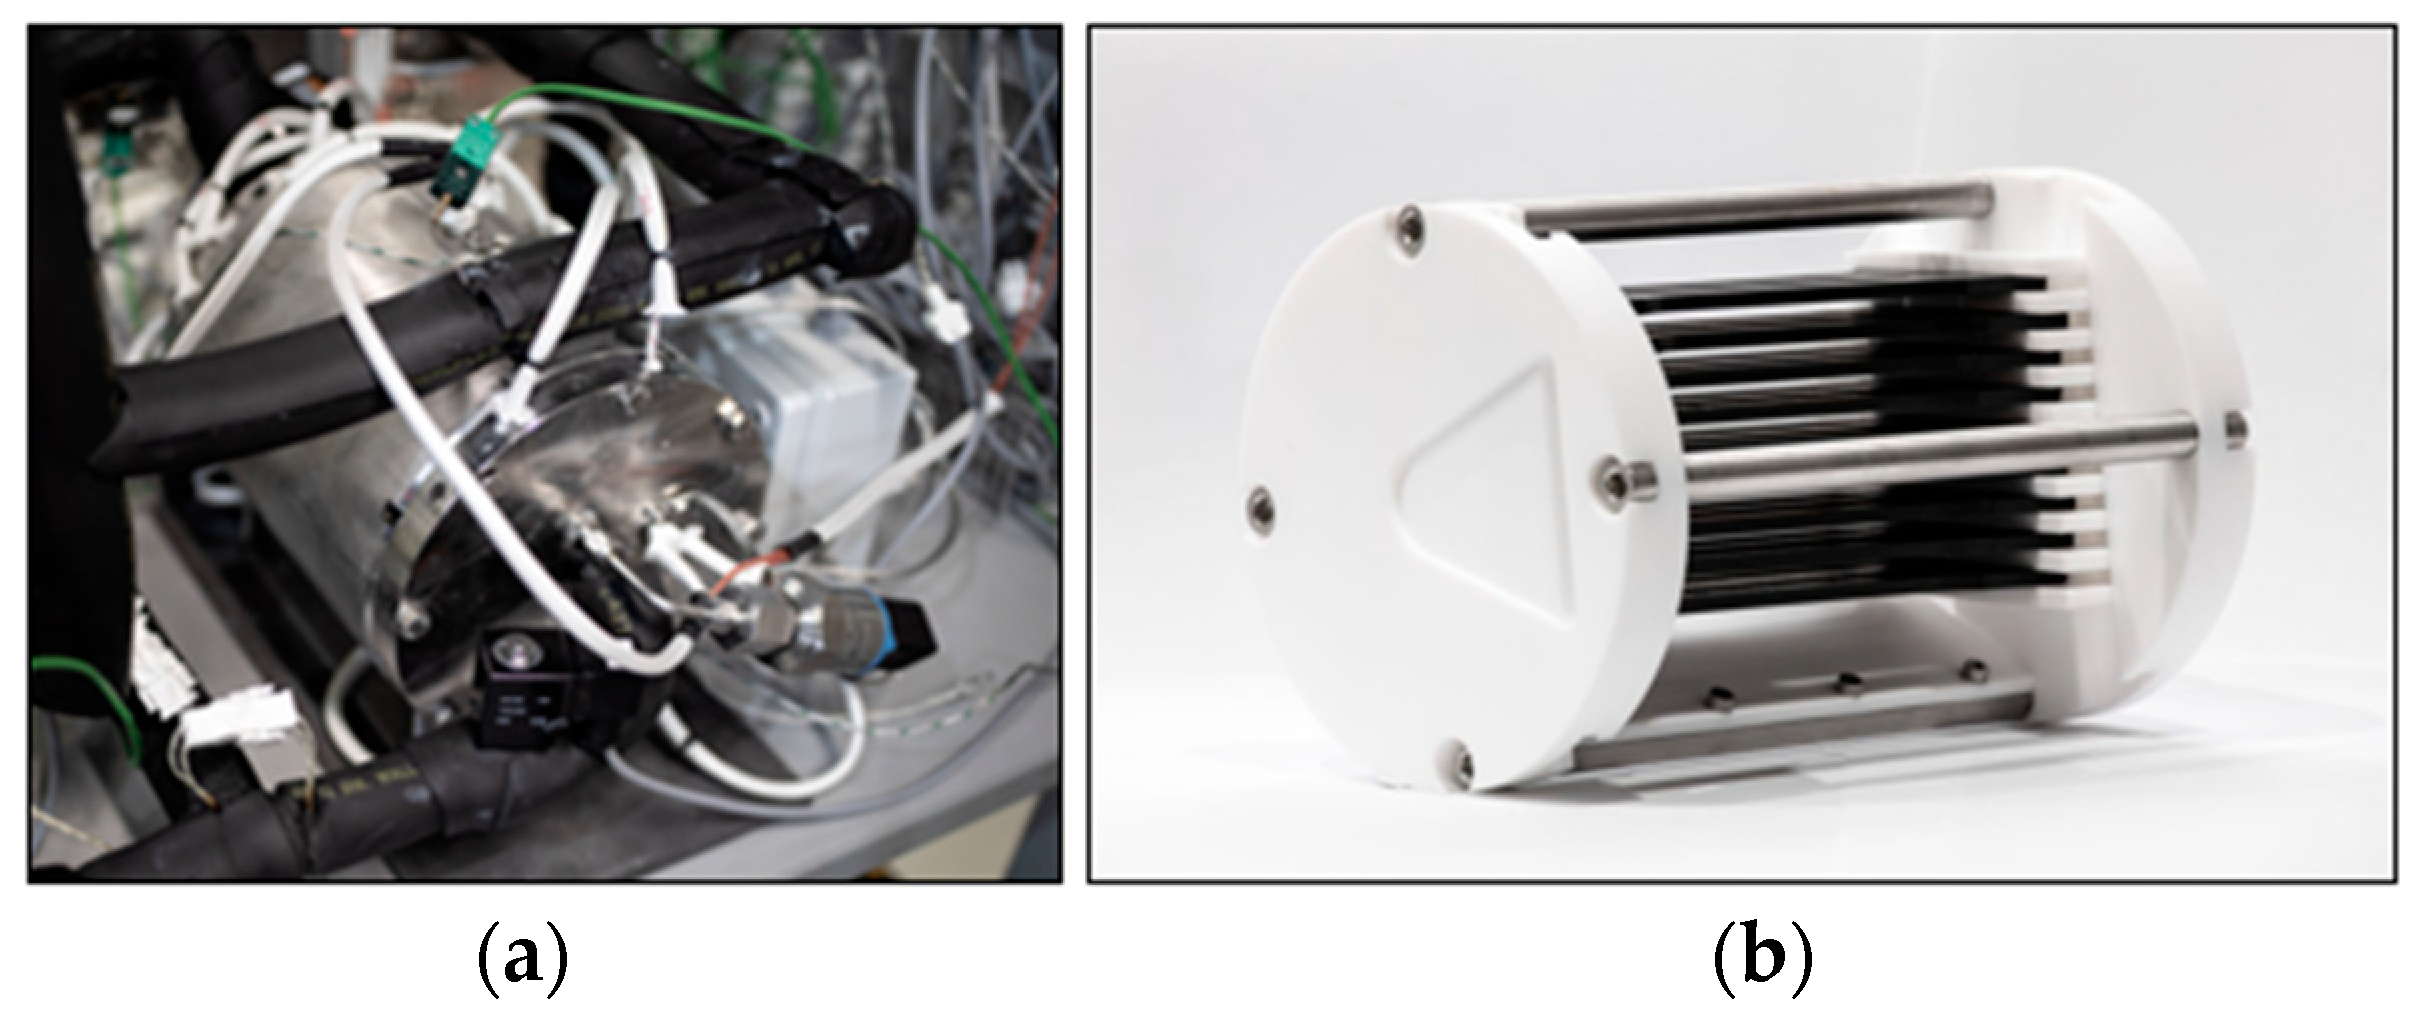
For the in situ qualification of BOP materials, PEMFC from balticFuelCells® (Schwerin, Germany) with a 25 cm2 electrochemical active area is used. In addition, 15 μm thick membranes (240 μm thick gas diffusion layers) from Wuhan University of Technology (Wuhan, Hubei, China) with a platinum loading of 0.4 mg/cm2 on both the anode and cathode sides are employed. The standard bipolar plates from the manufacturer are replaced by graphite-based plates developed at Zentrum für BrennstoffzellenTechnik GmbH (ZBT) (Duisburg, Germany), which feature a significantly finer flow field for improved gas distribution. An emission chamber has been developed for the accommodation of samples in a reasonable way to maximize gas-exposed material surface. It enables the positioning of tensile bars (DIN EN ISO 527-2 type 1A [18]), as well as auxiliary assembly materials, e.g., liquids or non-Newtonian fluids, using a custom-designed sample holder (Figure 1).
Figure 1.
(a) Emission chamber integrated in the test rig; (b) sample holder loaded with type 1A specimens (black).
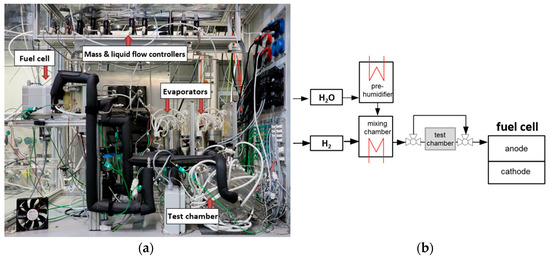
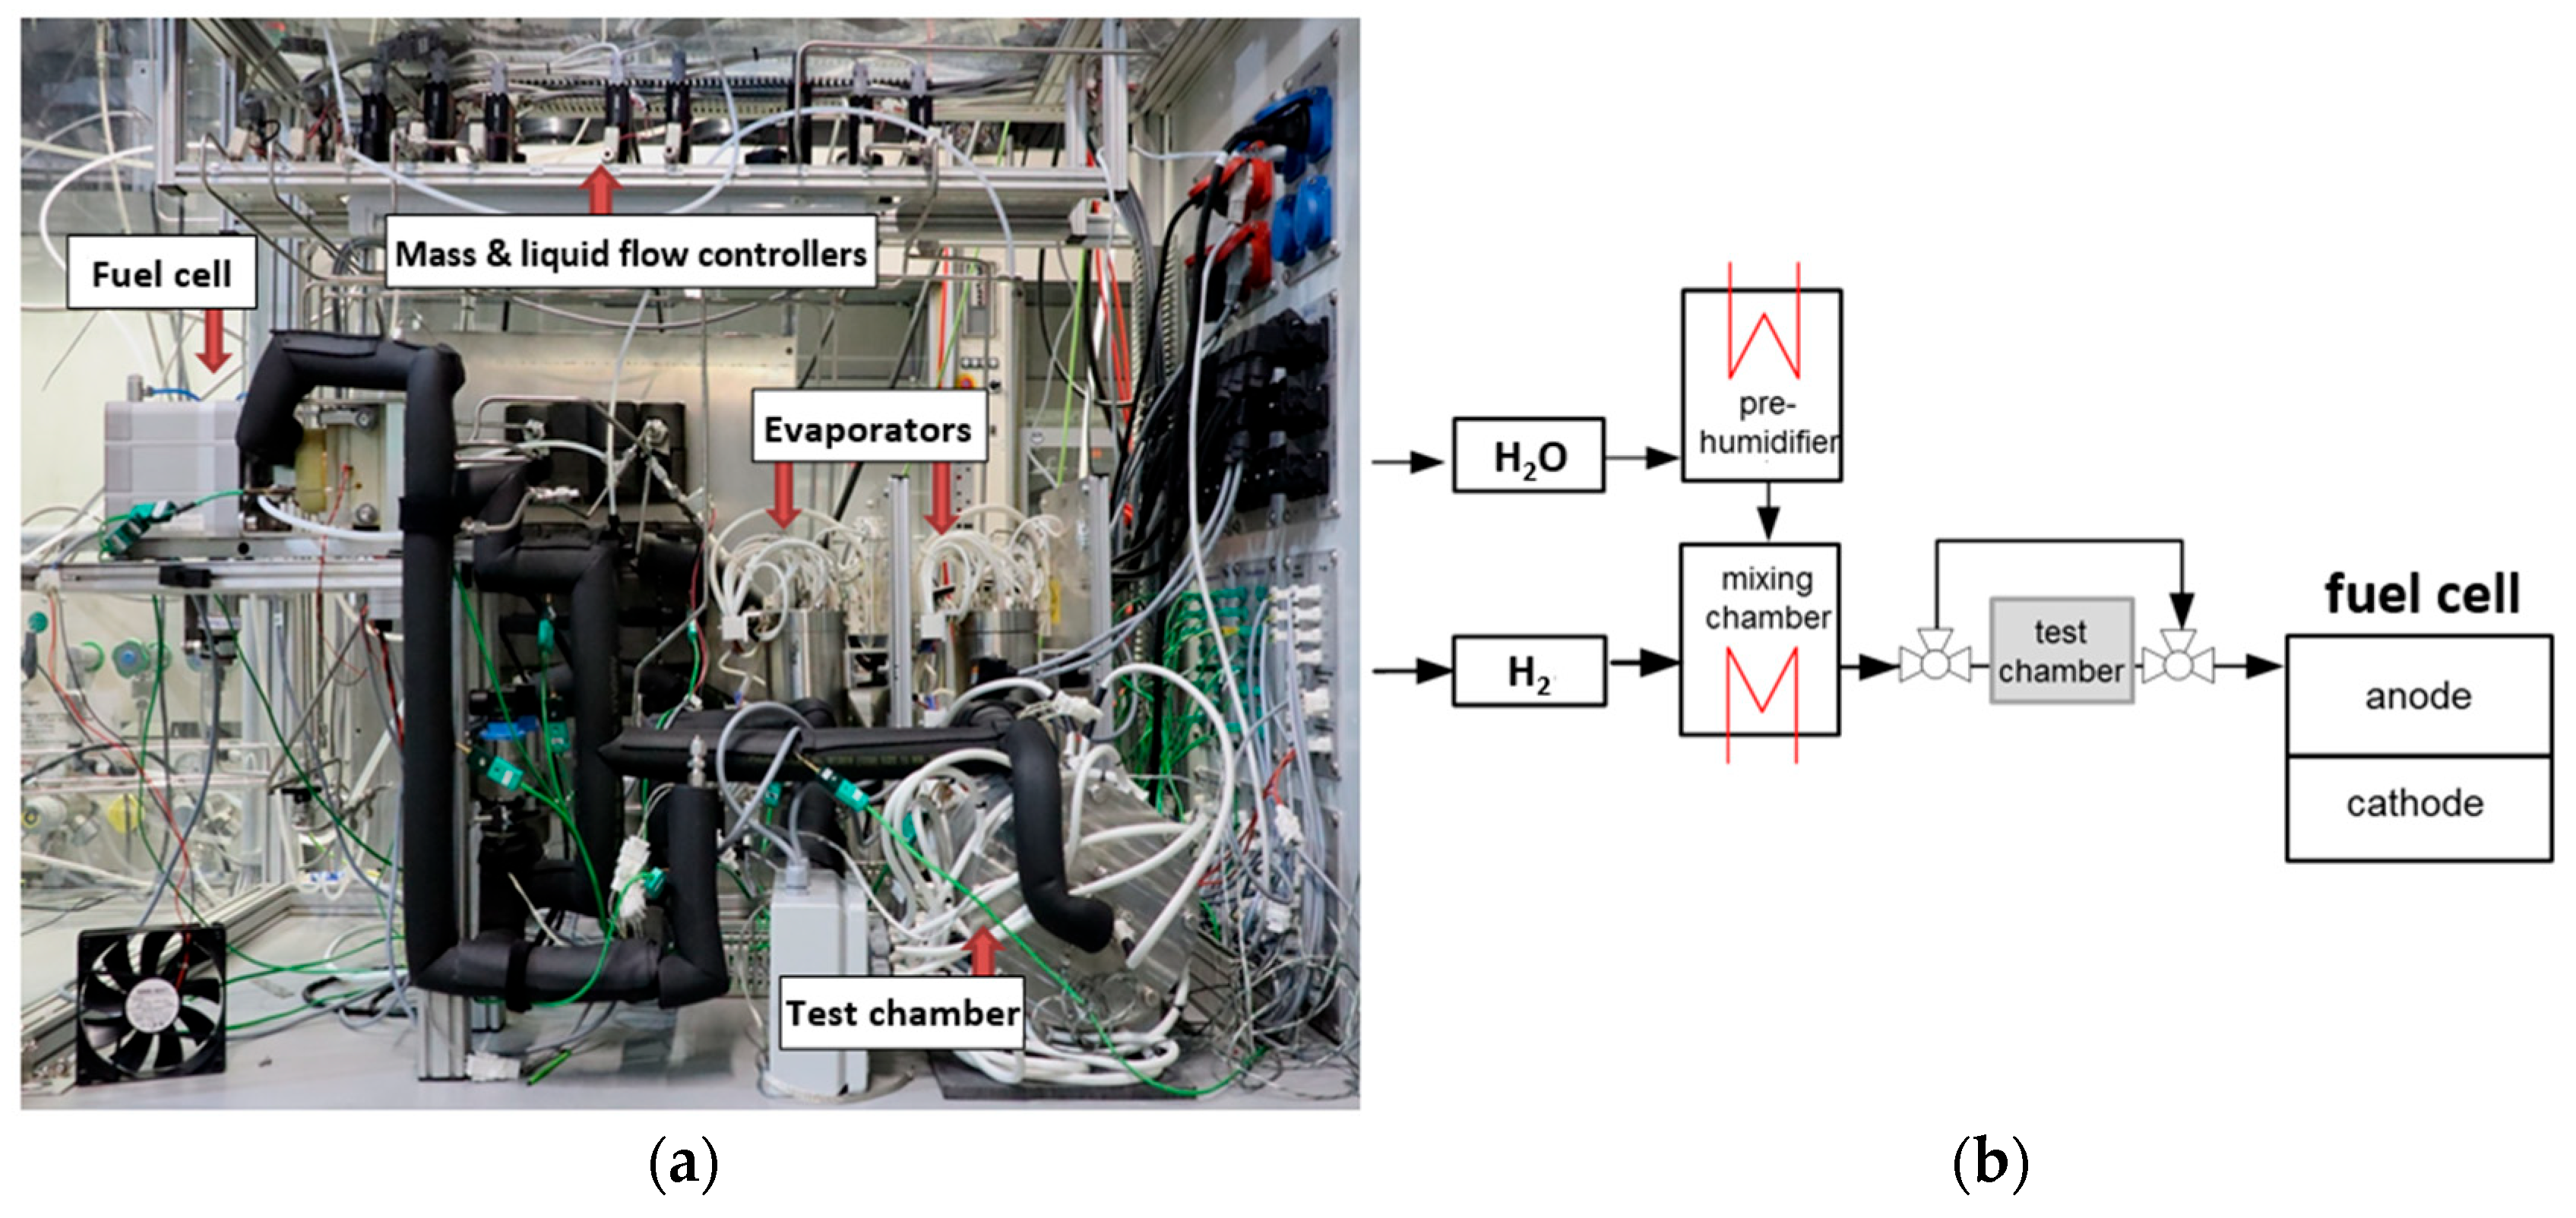
The emission chamber can be heated up to 120 °C (in further measurements this parameter was set to 90 °C to ensure realistic PEMFC conditions) to expose the materials to a thermal stress and to stimulate the desorption of VVOCs/VOCs. Furthermore, a bypass of the emission chamber is integrated into the test bench, which allows the performing of regeneration cycles by supplying fresh educt gas (hydrogen or air, depending on the placement of the chamber) after potential contamination of the MEA. The test fuel cell operates with humidified reactant gases (hydrogen and air). The gas flow rates are controlled via Alicat Scientific, Inc. (Tucson, AZ, USA) mass flow controllers and subsequently mixed with wet vapor from direct evaporators in a mixing chamber. Water injection dosing for the evaporators is managed via Bronkhorst High-Tech B.V. (Ruurlo, the Netherlands) liquid flow controllers and is linked to the National Instruments Corp. (Austin, TX, USA) compact data acquisition device (cDAQ) for precise humidity regulation of both gas feeds. The H&H GmbH PLI electronic load (Konzell, Germany) is used for precise current setting and voltage measurement. Operating parameters include a pressure of 2 bar(a) on both the anode and cathode sides, 80 °C cell temperature, and 90 °C temperature in the emission chamber. Relative humidity is set to 85% in the anode and 69% in the cathode line through all steady state phases (SSP). The emission chamber was integrated in the anode gas feed in all further executed measurements. The humidity level in the chamber was lower (approx. 57%) as in the gas line due to the higher temperature in comparison to the test cell. Hydrogen with a purity grade of 5.0 (≥99.999%) was used in all experiments. The setup as well as schematic piping and instrumentation diagram (P&ID) of the test bench are shown in Figure 2.
Figure 2.
(a) The setup of the test rig with the most relevant components shown; (b) schematic P&ID of the anode gas feed line with the emission chamber.
Deionized water is vaporized in the pre-humidifier and mixed with dry hydrogen in the mixing chamber. The humidified hydrogen then passes through the heated emission chamber containing the material samples, transporting potentially desorbed species directly to the anode side of the fuel cell. The selected sensors/controllers and their measurement accuracy are presented in Table 1.
Table 1.
Specifications of the sensors and controllers used in the test bench.
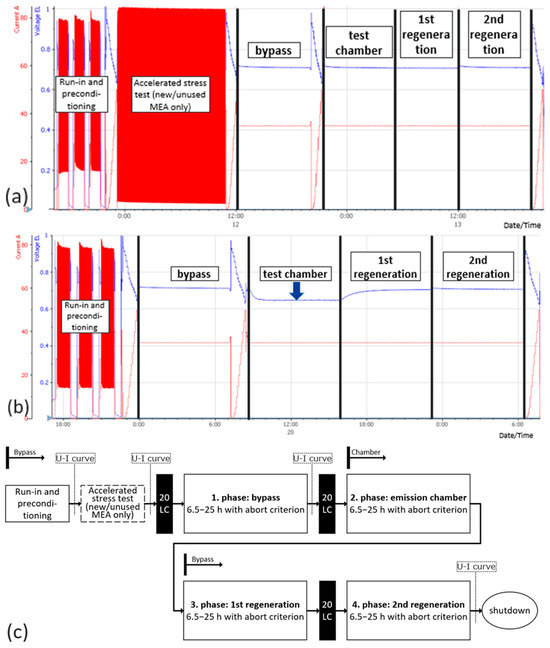
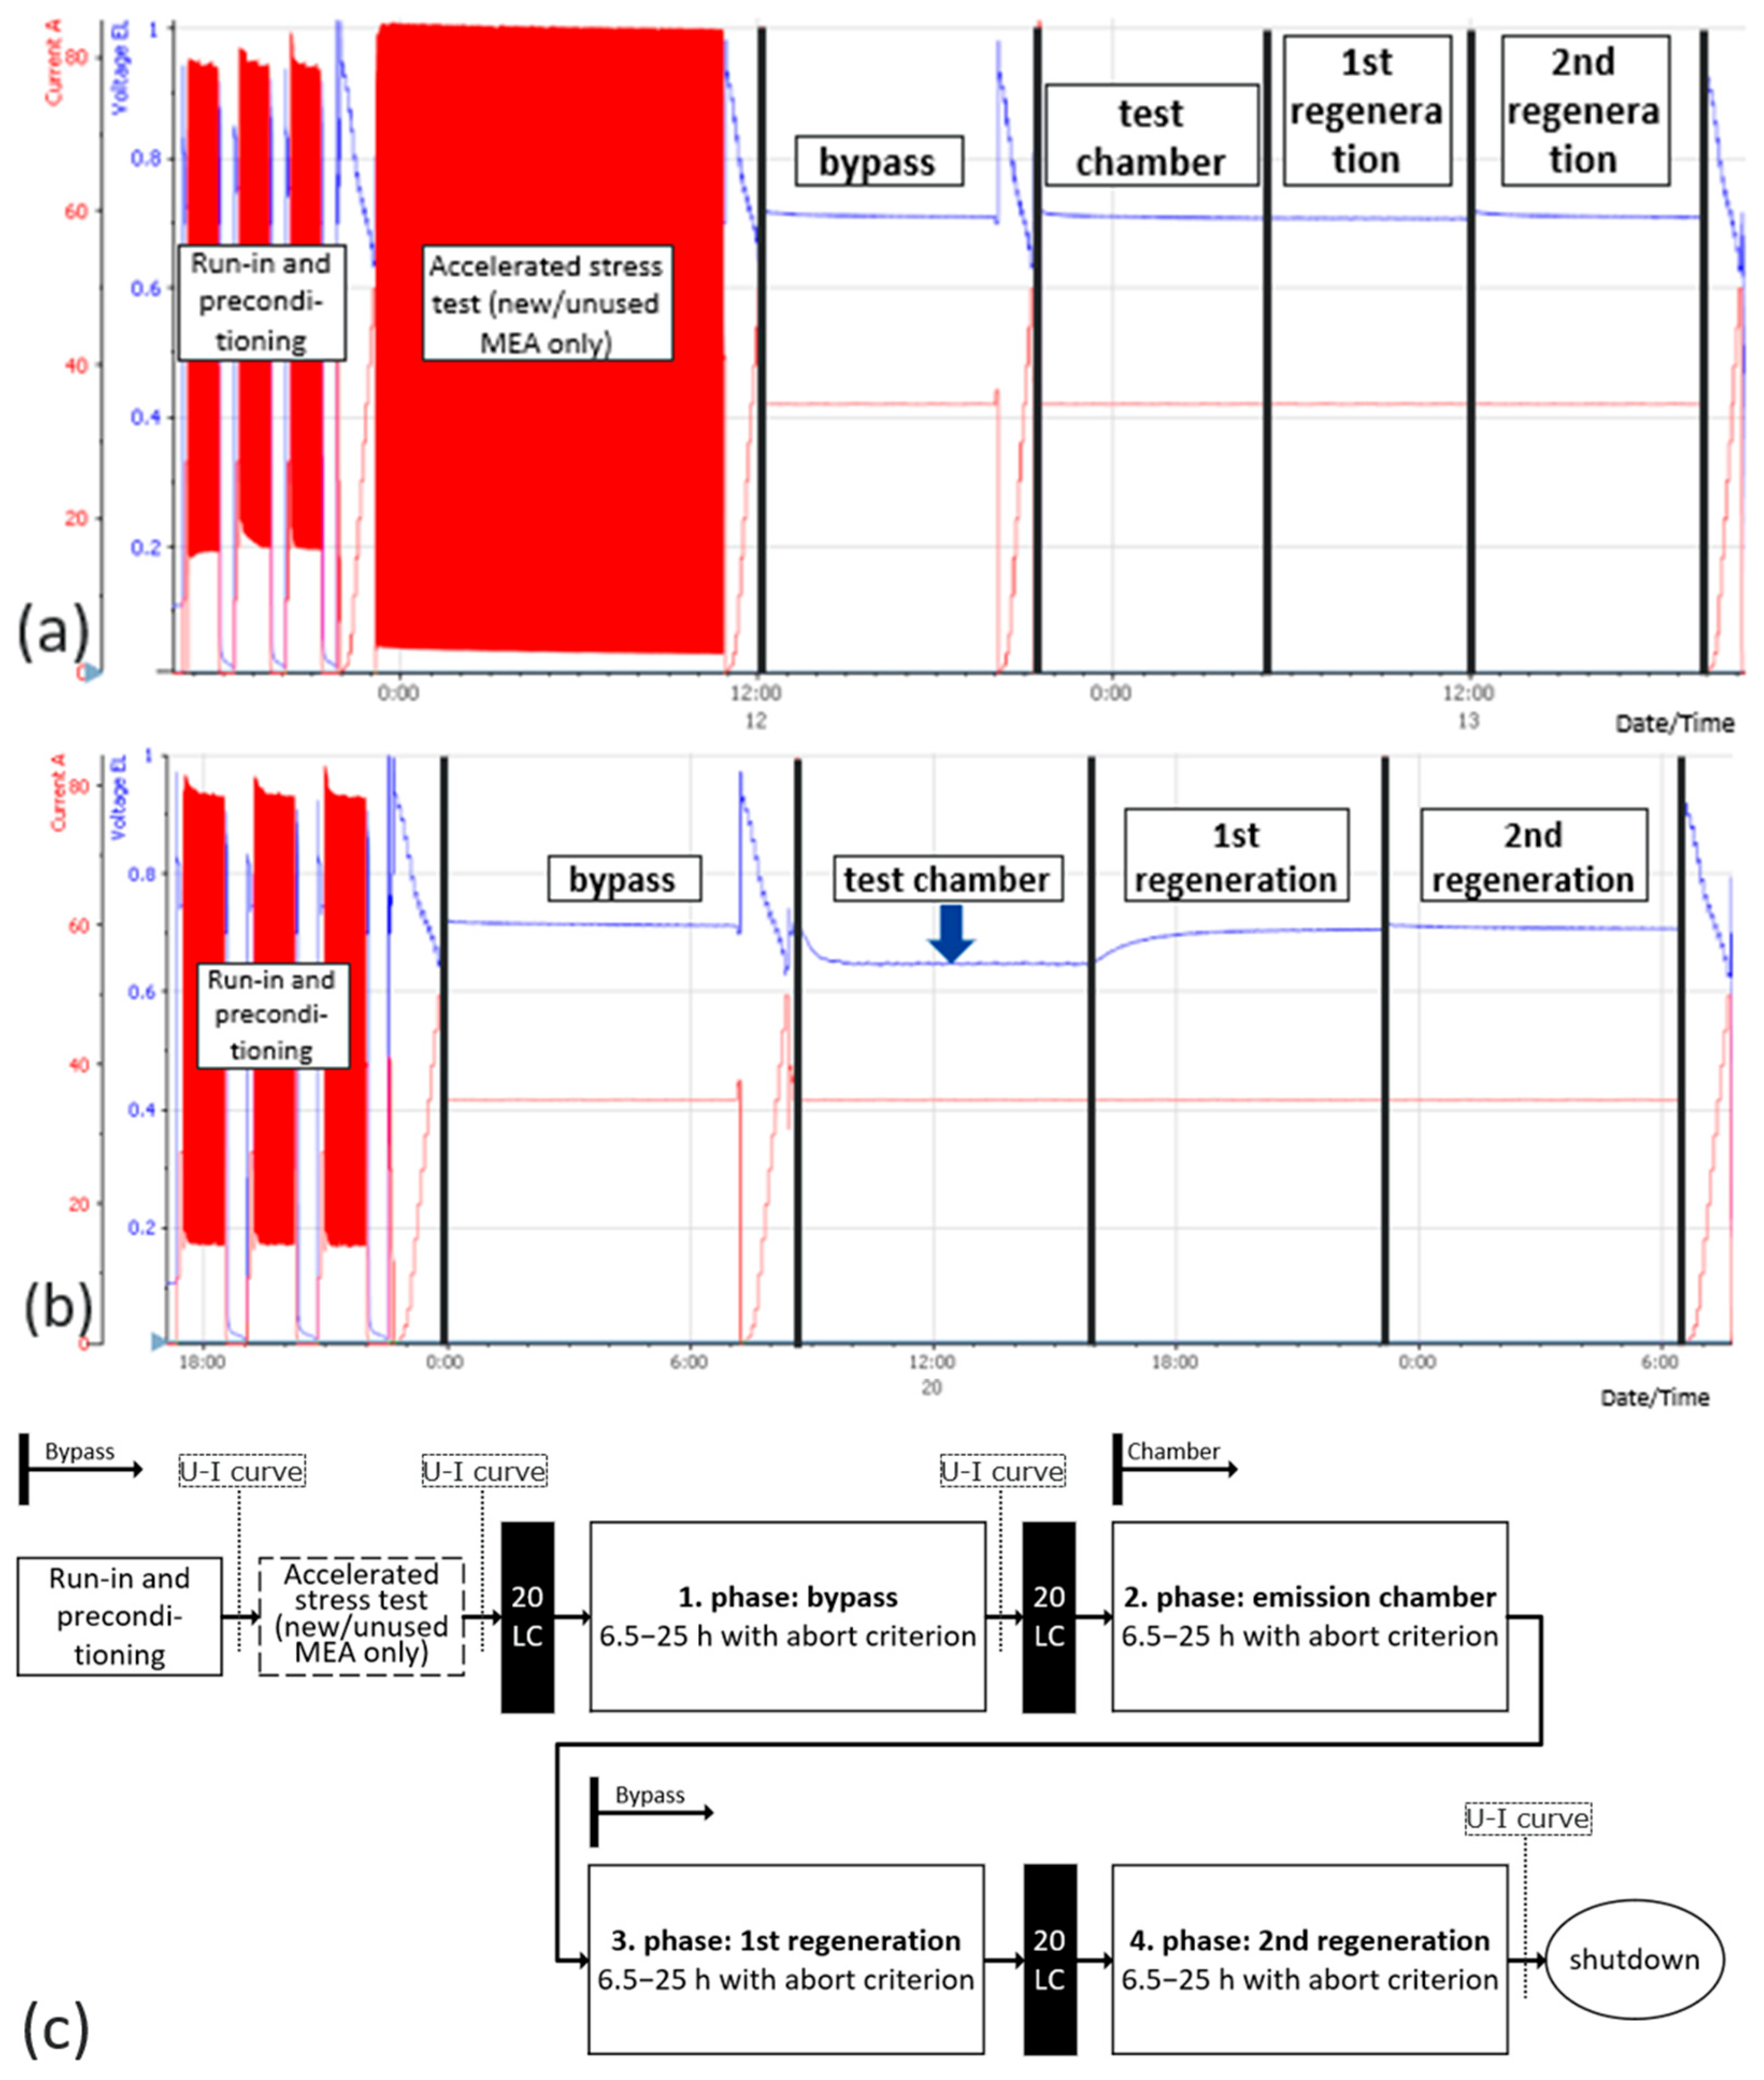
The test procedure for material measurements includes a reference measurement (see Figure 3a) with an empty sample holder, consisting of polytetrafluoroethylene (PTFE) and stainless steel (SS 316), as well as a sample measurement (Figure 3b) with the holder loaded with specimens based on shown test protocol (Figure 3c). The influence of the emitted substances on cell performance is evaluated based on the variable cell voltage and constant current as an online state-of-health monitoring method. In contrast, the literature describes a wider range of PEMFC health-monitoring approaches, including frequency response analysis, data-driven/model-based state-of-health prediction methods, electrochemical impedance spectroscopy and voltage–current characteristic model for online health state estimation [19,20,21,22]. The combination of complementary methods may allow a more detailed analysis of contamination effects. Figure 3b presents an exemplary voltage decrease in the test chamber phase relative to the reference measurement (Figure 3a). The test protocol (Figure 3c) comprises beginning of life (BOL) sequence with three loops of potential cycling from 0.3 to 0.8 V and cool-down intervals between the loops.
Figure 3.
(a) Raw current and voltage data profiles of a reference measurement with new/unused MEA (voltage [V] in blue, current [A] in red); (b) raw current and voltage data profiles of a sample measurement with a reused MEA (voltage [V] in blue, current [A] in red); (c) schematic test protocol with SSPs.
Following this, the first polarization curve is performed. Thereafter, an accelerated stress test (AST) with high frequent potential cycling from 0.25 to 0.9 V is executed (only when using a new MEA). Finally, the second polarization curve is performed. Next, four SSPs with constant current density of 1.4 A/cm2 and non-stoichiometric cell operation with 2.5 NL/min air and 0.5 NL/min hydrogen are imminent. The first SSP represents beginning of test (BOT). In this stage, 20 cycles of critical voltage alternation from 0.2 to 0.9 V are applied to the test cell to activate the catalyst and then the bypass measurement is executed to determine the actual performance of the MEA, which is followed by the third polarization curve. Before the test chamber phase (the second SSP), 20 critical potential cycles are performed again. The bypass line is closed and one of the reactant gases is directed through the chamber, transporting any potential contaminants desorbed from the materials to the test cell. The self-induced (SI) regeneration phase follows (the third SSP), using fresh gas via the bypass line while the emission chamber is shut. In the last SSP, 20 critical potential cycles are conducted, followed by alternate critical voltage (ACV) regeneration in the bypass. As an end of test (EOT), the fourth polarization curve is carried out. Each of the described SSPs lasts a minimum of 6.5 h, and depending on the measured voltage drop, each phase may last up to 25 h, in accordance with a termination criterion of 2 mV voltage loss within the last 30 min of a given phase. As long as no convergence in the voltage behavior is achieved, the operation time of a SSP will be automatically extended. For the statistical analysis, a parametric approach based on two-sample Welch’s t-test with unequal variances was applied using α (t) of 95% probability that the estimated mean of each sample will lay in the calculated confidence interval. For group comparisons, Welch’s two-sample t-test was applied a priori, as it does not assume equal variances and is more robust than Student’s t-test when variance homogeneity cannot be guaranteed. Additionally, the sample variances were calculated and reported descriptively. To assess whether the null hypothesis (no significant difference) could be rejected, the condition p < α (|t| > tcrit) was used, with calculated two-sided p-value (interpreted as probability) and defined α = 0.05 (significance level or cutoff threshold value, representing a 5% risk of falsely detecting a difference). Normality of each sample was examined using the Shapiro–Wilk test. To evaluate whether the null hypothesis (the data are normally distributed) could be retained, the condition p > α was used, with calculated p and defined α = 0.001 (0.1% risk of falsely rejecting normality). Moreover, the W values (test statistics) have been compared to ensure a normal distribution (criterion: Wcalc > Wp, crit) [23]. All calculations were performed manually in Microsoft 365 Excel using the built-in Analysis-ToolPak. For validation and comparison, results were cross-checked using the ‘Statistics Kingdom’ web application [24].
3. Results
The reference sample size (n = 15) was selected based on feasibility constraints within the funded project period, while ensuring that all measurements were carried out under identical experimental conditions to minimize additional sources of variability. All 15 reference measurements have been performed using different MEAs from the same batch with identical handling and an unchanged test bench setup. Six data extraction points (groups) have been defined:
- voltage in the beginning of the bypass UBB (reference dataset for the t-test),
- voltage in the end of the bypass UBE,
- voltage in the beginning of the emission chamber UCB,
- voltage in the end of the emission chamber UCE,
- voltage in the beginning of the regeneration (SI and ACV) URB,
- voltage in the end of the regeneration (SI and ACV) URE,depending on the SSP of each measurement for further analysis. Two datasets have been calculated:
- reversible voltage URev,from the voltage difference between the end of the regeneration and the end of the emission chamber (URE − UCE). Usually observed as a voltage gain, it indicates that part of the performance loss during the measurement, which can be recovered during the regeneration phases and is generally consistent with the reversible voltage loss recovery phenomena discussed in the literature [25]. Nevertheless, this study mainly focuses on PEMFC health monitoring and lifetime prediction under dynamic operation. The second dataset is
- irreversible voltage UIrrev,derived from the voltage difference between the end of the regeneration and the end of the bypass (URE − UBE). It describes the residual voltage loss remaining after the regeneration phases relative to the bypass phase and therefore represents the non-recoverable part of the performance loss during a measurement. UIrrev shows an insight into quantification of natural degradation of MEA, which refers to the intrinsic, operation-based performance loss of the MEA occurring even in the absence of additional contamination. This variable could also be used as an MEA exchange indicator in the next development stage of the method regarding material measurements with less reversible voltage behavior after contamination in the emission chamber SSP. Positive values for URev mean that voltage has been gained through the recovery phases. Negative values for UIrrev mean that voltage has been lost during a whole measurement (see Table 2).
Table 2.
Experimentally obtained and calculated data from the reference measurements. All voltages are measured in mV.
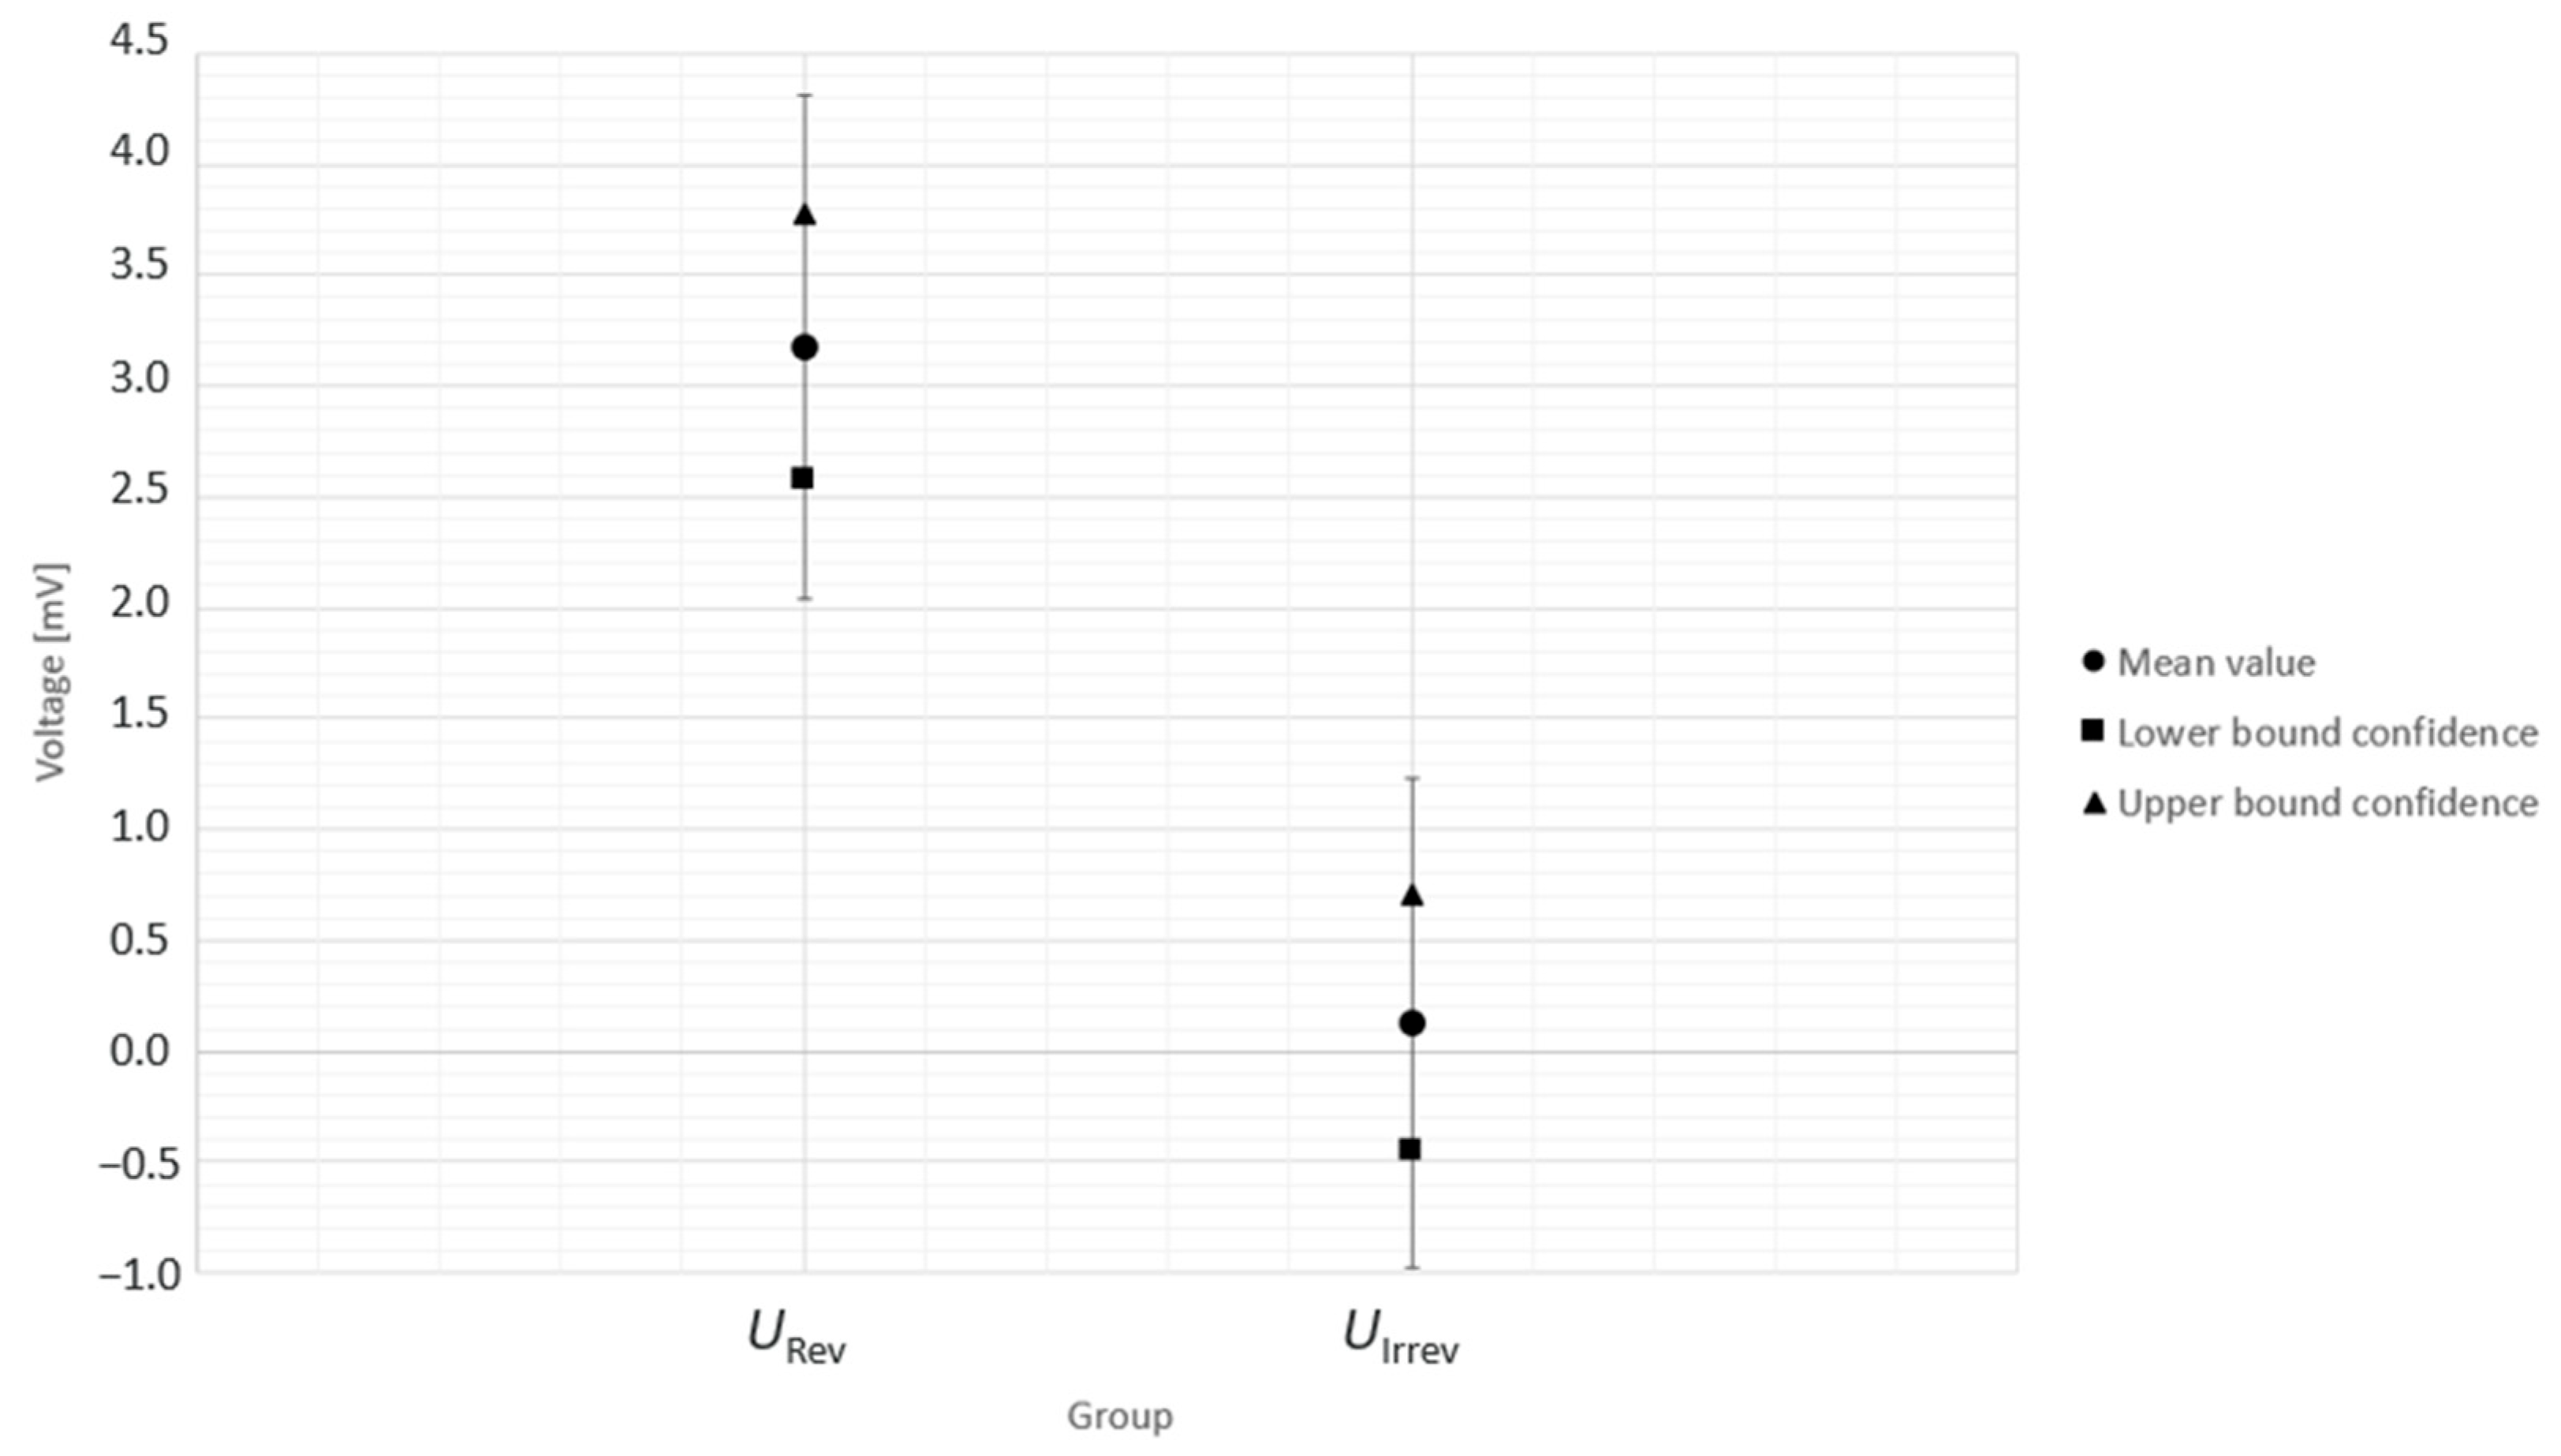
In the next step, normal distribution of each sample has been proven by means of the Shapiro–Wilk test. Subsequently, Welch’s two-sample t-test was performed, and each sample was compared with the reference dataset UBB. Under previously described conditions, no statistically significant differences were observed between the datasets, as expected for repeated reference measurements. Also, the confidence intervals for each sample have been calculated (Table 3), which are represented via confidence bounds for more detailed understanding of the measuring precision (see Figure A1 and Figure A2).
Table 3.
Calculated statistical data from the reference measurements. All voltages are measured in mV.
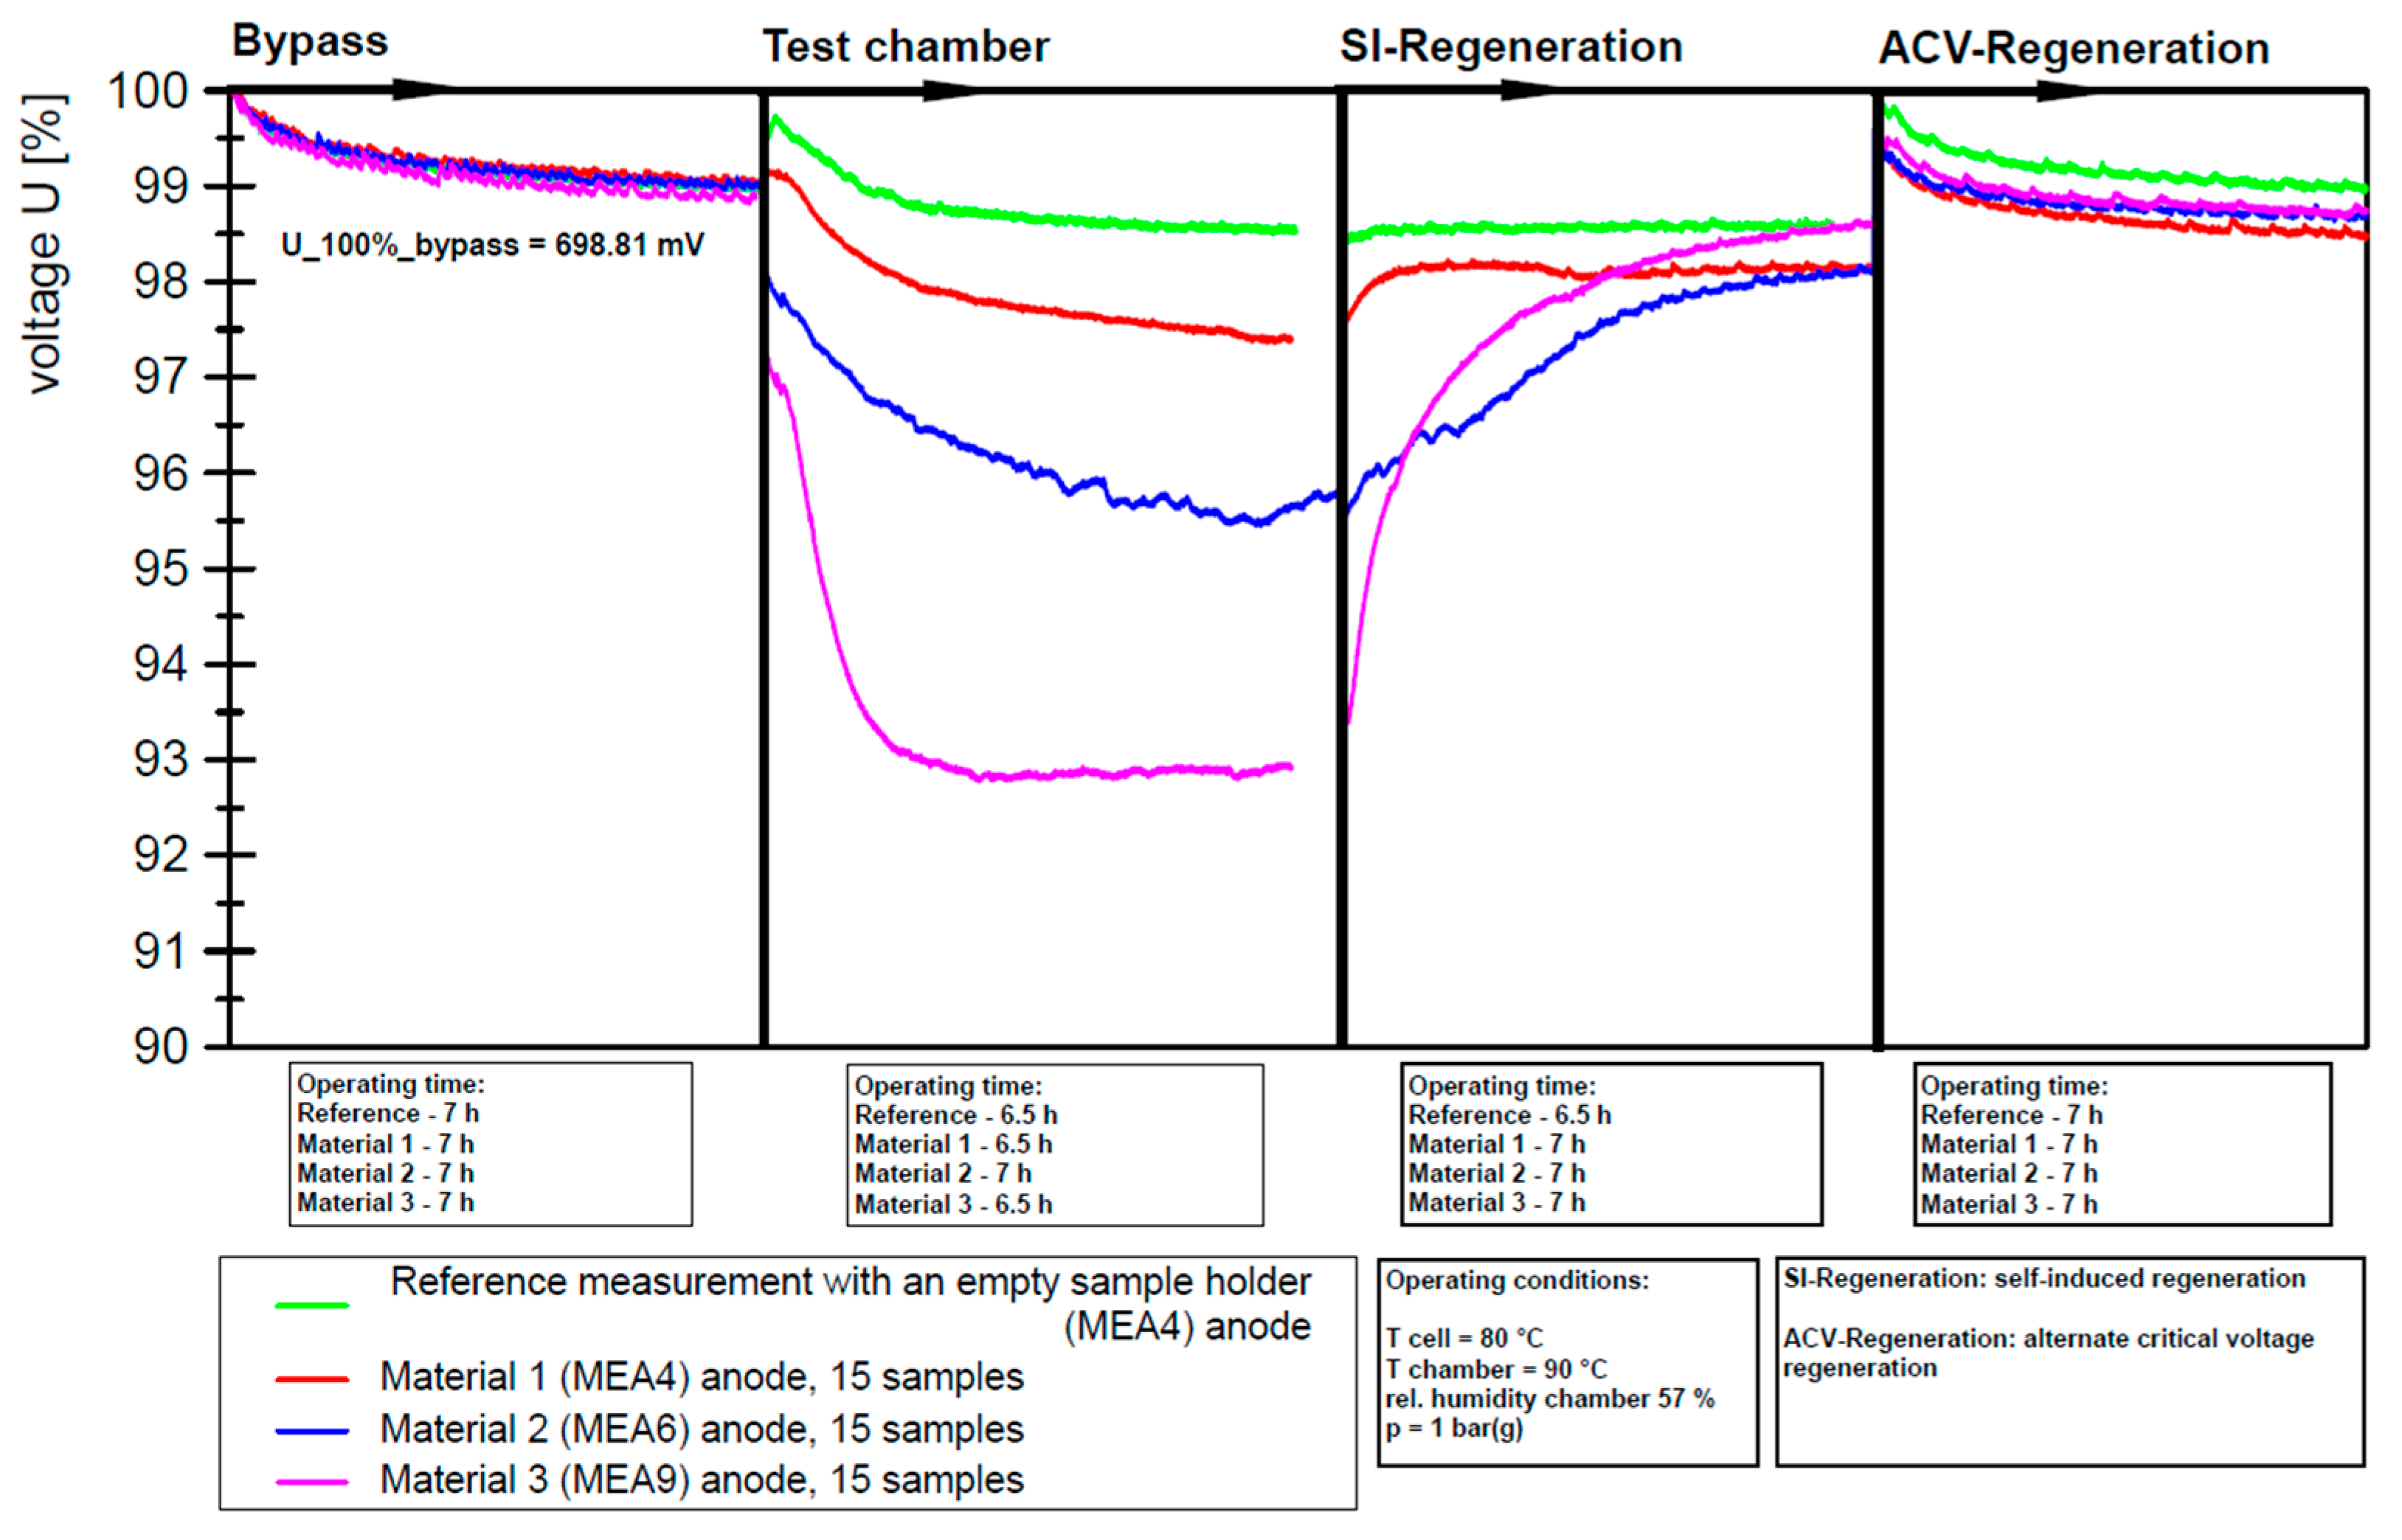
To provide a proof that the introduced in situ qualification method also applicable for material measurements, three different materials have been tested on three randomly picked MEAs directly after execution of the reference measurements. The materials used were selected by the industry stakeholders in support of the project and served only to demonstrate the general applicability of the test method. The specific trade names and suppliers of the materials are not disclosed for confidentiality reasons. No systematic selection strategy was applied, since the objective was a proof of concept rather than a representative material screening at the current stage, but it is intended to be developed into a meaningful material qualification method. The material measurements have also been performed with the previously introduced test protocol and the same setup. A total of 15 samples (DIN EN ISO 527-2 type 1A) of Material 1 have been tested on the MEA4, as well as Material 2 on the MEA6 and Material 3 on the MEA9 (Figure 4). Variations in sensor cell response to emissions from the tested materials indicate that the method is effective. The voltage on the diagram is presented in % and 100% correlates to the mean value of the first 100 data points of the bypass phase, which is 698.81 mV. Before the first, second and fourth SSP, critical potential cycling is applied, resulting in a decreasing voltage gradient during the initial hours of operation. The operating times of each SSP variate due to the previously described abort criterion.
Figure 4.
Visualized processed data of the three material measurements and a reference measurement.
The discontinuities in the plots are intentional and serve to enhance visualization and enable direct comparison of each SSP across the executed experiments. To improve clarity of the presented results, the data extraction points are summarized in Table 4.
Table 4.
Experimentally obtained and calculated data from the material measurements. All voltages are measured in mV.
4. Discussion
Despite the use of different MEAs, the test results show a high level of consistency across measurements. The narrow confidence intervals observed indicate minimal variation between individual datasets, suggesting that the influence of MEA variability appears to be small within the applied testing conditions. The confidence interval associated with the irreversible voltage loss is 1.21 mV, which should be interpreted as the total width of the 95% confidence interval of the mean, is based on the calculated lower- and upper confidence bounds of −0.48 and 0.73 mV. It corresponds to an interval half-width of approximately ±0.61 mV around the mean value of 0.13 mV. This confidence interval is also equivalent to a relative deviation of about 0.17% with respect to the mean cell voltage of around 694.42 mV across all SSPs, indicating that the contribution of natural degradation effect, during the relatively short testing period, is minimal as well. The high degree of reproducibility supports the robustness and precision of the measurement approach. Consequently, the results suggest that the validated method may serve as a suitable tool for assessing the impact of material emissions on fuel cell performance, although these measurements were conducted without repetitions. The material screening revealed distinct differences in voltage response among the tested polymers during the emission chamber SSP, reaching values of up to approximately 41 mV (≈6%). Material 1 exhibited the best performance, showing a voltage decrease of about 1.5%. Material 2 demonstrated moderate behavior with a voltage reduction of about 3%, while Material 3 showed the most pronounced effect, reaching a voltage loss of around 6%. Notably, all tested materials showed strong reversibility already in the subsequent SI regeneration SSP. After the ACV regeneration SSP, all material curves returned to approximately the same voltage level, just below the reference curve, indicating quite successful recovery. These materials indicate a material-dependent impact on fuel cell performance under the applied test conditions, which should be analyzed in greater depth. From a practical point of view, this precision level displays that the method is sufficiently sensitive to differentiate material-induced contamination effects, which are substantially larger than the baseline variability observed in the reference measurements. The material measurements showed voltage losses in the emission chamber phase corresponding to clearly larger effects than the confidence interval associated with UIrrev of the reference measurements. Moreover, the calculated irreversible voltage losses for the three material measurements with −3.94, −2.37 and −1.74 mV clearly do not lay in the confidence interval of −0.48 to 0.73 mV. This suggests that the measurement’s uncertainty of the validated setup is small enough to distinguish relevant material-dependent contamination effects from the intrinsic baseline degradation of the MEA and MEA-to-MEA variability within the investigated time frame. Accordingly, the 1.21 mV value should be interpreted as a measure of methodological resolution for detecting small irreversible voltage-loss effects within the present test protocol and 15 repetitions with one variable, rather than for example a general uncertainty of 32 mV of single-cell absolute voltage measurements across three identical repetitions [26]. Both values are not directly comparable, since the literature value refers more to the operating-parameter uncertainties. The low scatter of UIrrev suggests that the operating conditions were well controlled. However, the precision value represents the combined variability of the method with different MEAs and does not allow the contribution of operating-condition fluctuations and operator-dependent effects to be quantified separately.
Limitations of the present method lie in the relationship between the electrochemically active membrane area and the exposed material surface area in the emission chamber. The selection of 15 samples for material measurements was based on empirical experience from previous experimental work. This ratio should be generally defined more precisely through scalability considerations derived from real application in order to obtain results that are more quantitatively interpretable and comparable across experiments. After the executed validation through the performed reference measurements, the test method indicated significant potential to be further developed into a qualitative screening approach. The observed voltage loss cannot yet be directly transferred to real system operation or used for estimation of material durability under application-relevant conditions. It also cannot yet be used to derive general threshold values for material suitability, which will be an important objective of future work. Furthermore, the interindividual variability between MEAs cannot be separated from intraindividual changes within a single MEA, such as natural degradation in the executed reference measurements. A clearer analysis of the intraindividual effect would require repeated measurements under reference conditions using the same MEA.
5. Conclusions
The statistical validation of the presented in situ material qualification method demonstrates high measurement precision and reproducibility. The evaluation also provides an insight into the natural degradation behavior of the tested MEAs. Although the observed irreversible voltage losses were small within investigated timeframe, further repeated measurements with unchanged MEA are required to better characterize intrinsic degradation and to clearly separate it from contamination-induced effects. Methods such as polarization curve analysis, cyclic voltammetry and electrochemical impedance spectroscopy could provide valuable additional and deeper understanding. Material-specific voltage responses were observed, demonstrating the general applicability of the method. However, these measurements were conducted with a sample size of n = 1 per material and therefore lack statistical validity. Future work will include repeated measurements of identical materials, randomization of test sequences, and structured grouping of experiments. The executed experiments establish a foundation for subsequent DOE-based test planning, where statistical power analysis will be used to define appropriate repetition numbers and ensure statistically robust conclusions.
Author Contributions
Conceptualization, methodology, validation, formal analysis, investigation, data curation, writing—original draft preparation, visualization, D.G.; writing—review and editing, project administration, U.M. All authors have read and agreed to the published version of the manuscript.
Funding
This research was funded by Federal Ministry for Economic Affairs and Energy (German: Bundesministerium für Wirtschaft und Energie), grant number 03ETB001C and the APC was covered by ZBT.
Data Availability Statement
The original contributions presented in this study are included in the article. Further inquiries can be directed to the corresponding author.
Acknowledgments
During the preparation of this manuscript, the authors used ChatGPT-5 for the purposes of language improvement. The authors have reviewed and edited the output and take full responsibility for the content of this publication.
Conflicts of Interest
All authors were employed by the Hydrogen and Fuel Cell Center, ZBT GmbH. The authors declare that the research was conducted in the absence of any commercial or financial relationships that could be construed as a potential conflict of interest. This research was funded by Federal Ministry for Economic Affairs and Energy (German: Bundesministerium für Wirtschaft und Energie), and the APC was covered by ZBT. The funders had no role in the design of the study; in the collection, analyses, or interpretation of data; in the writing of the manuscript; or in the decision to publish the results.
Abbreviations
The following abbreviations are used in this manuscript:
| ACV | Alternate critical voltage |
| AST | Accelerated stress test |
| BOL | Beginning of life |
| BOP | Balance of plant |
| BOT | Beginning of test |
| cDAQ | Compact data acquisition device |
| DOE | Design of experiments |
| EPDM | Ethylene-propylene diene monomer |
| EOT | End of test |
| FKM | Fluoroelastomer-based materials |
| FTIR-ATR | Fourier transform infrared attenuated total reflectance |
| GCMS | Gas chromatography-mass spectrometry |
| MEA | Membrane electrode assembly |
| NREL | National renewable energy laboratory |
| P&ID | Piping and instrumentation diagram |
| PEMFCs | Proton exchange membrane fuel cells |
| PTFE | Polytetrafluoroethylene |
| SBR | Styrene-butadiene rubber |
| SI | Self-induced |
| SS 316 | Stainless steel 316 (1.4401) |
| SSP | Steady state phase |
| VOCs | Volatile organic compounds |
| VVOCs | Very volatile organic compounds |
| ZBT | Zentrum für BrennstoffzellenTechnik GmbH |
Appendix A
Figure A1.
Visualized confidence intervals of the obtained test groups with standard deviation error bars of the mean value.
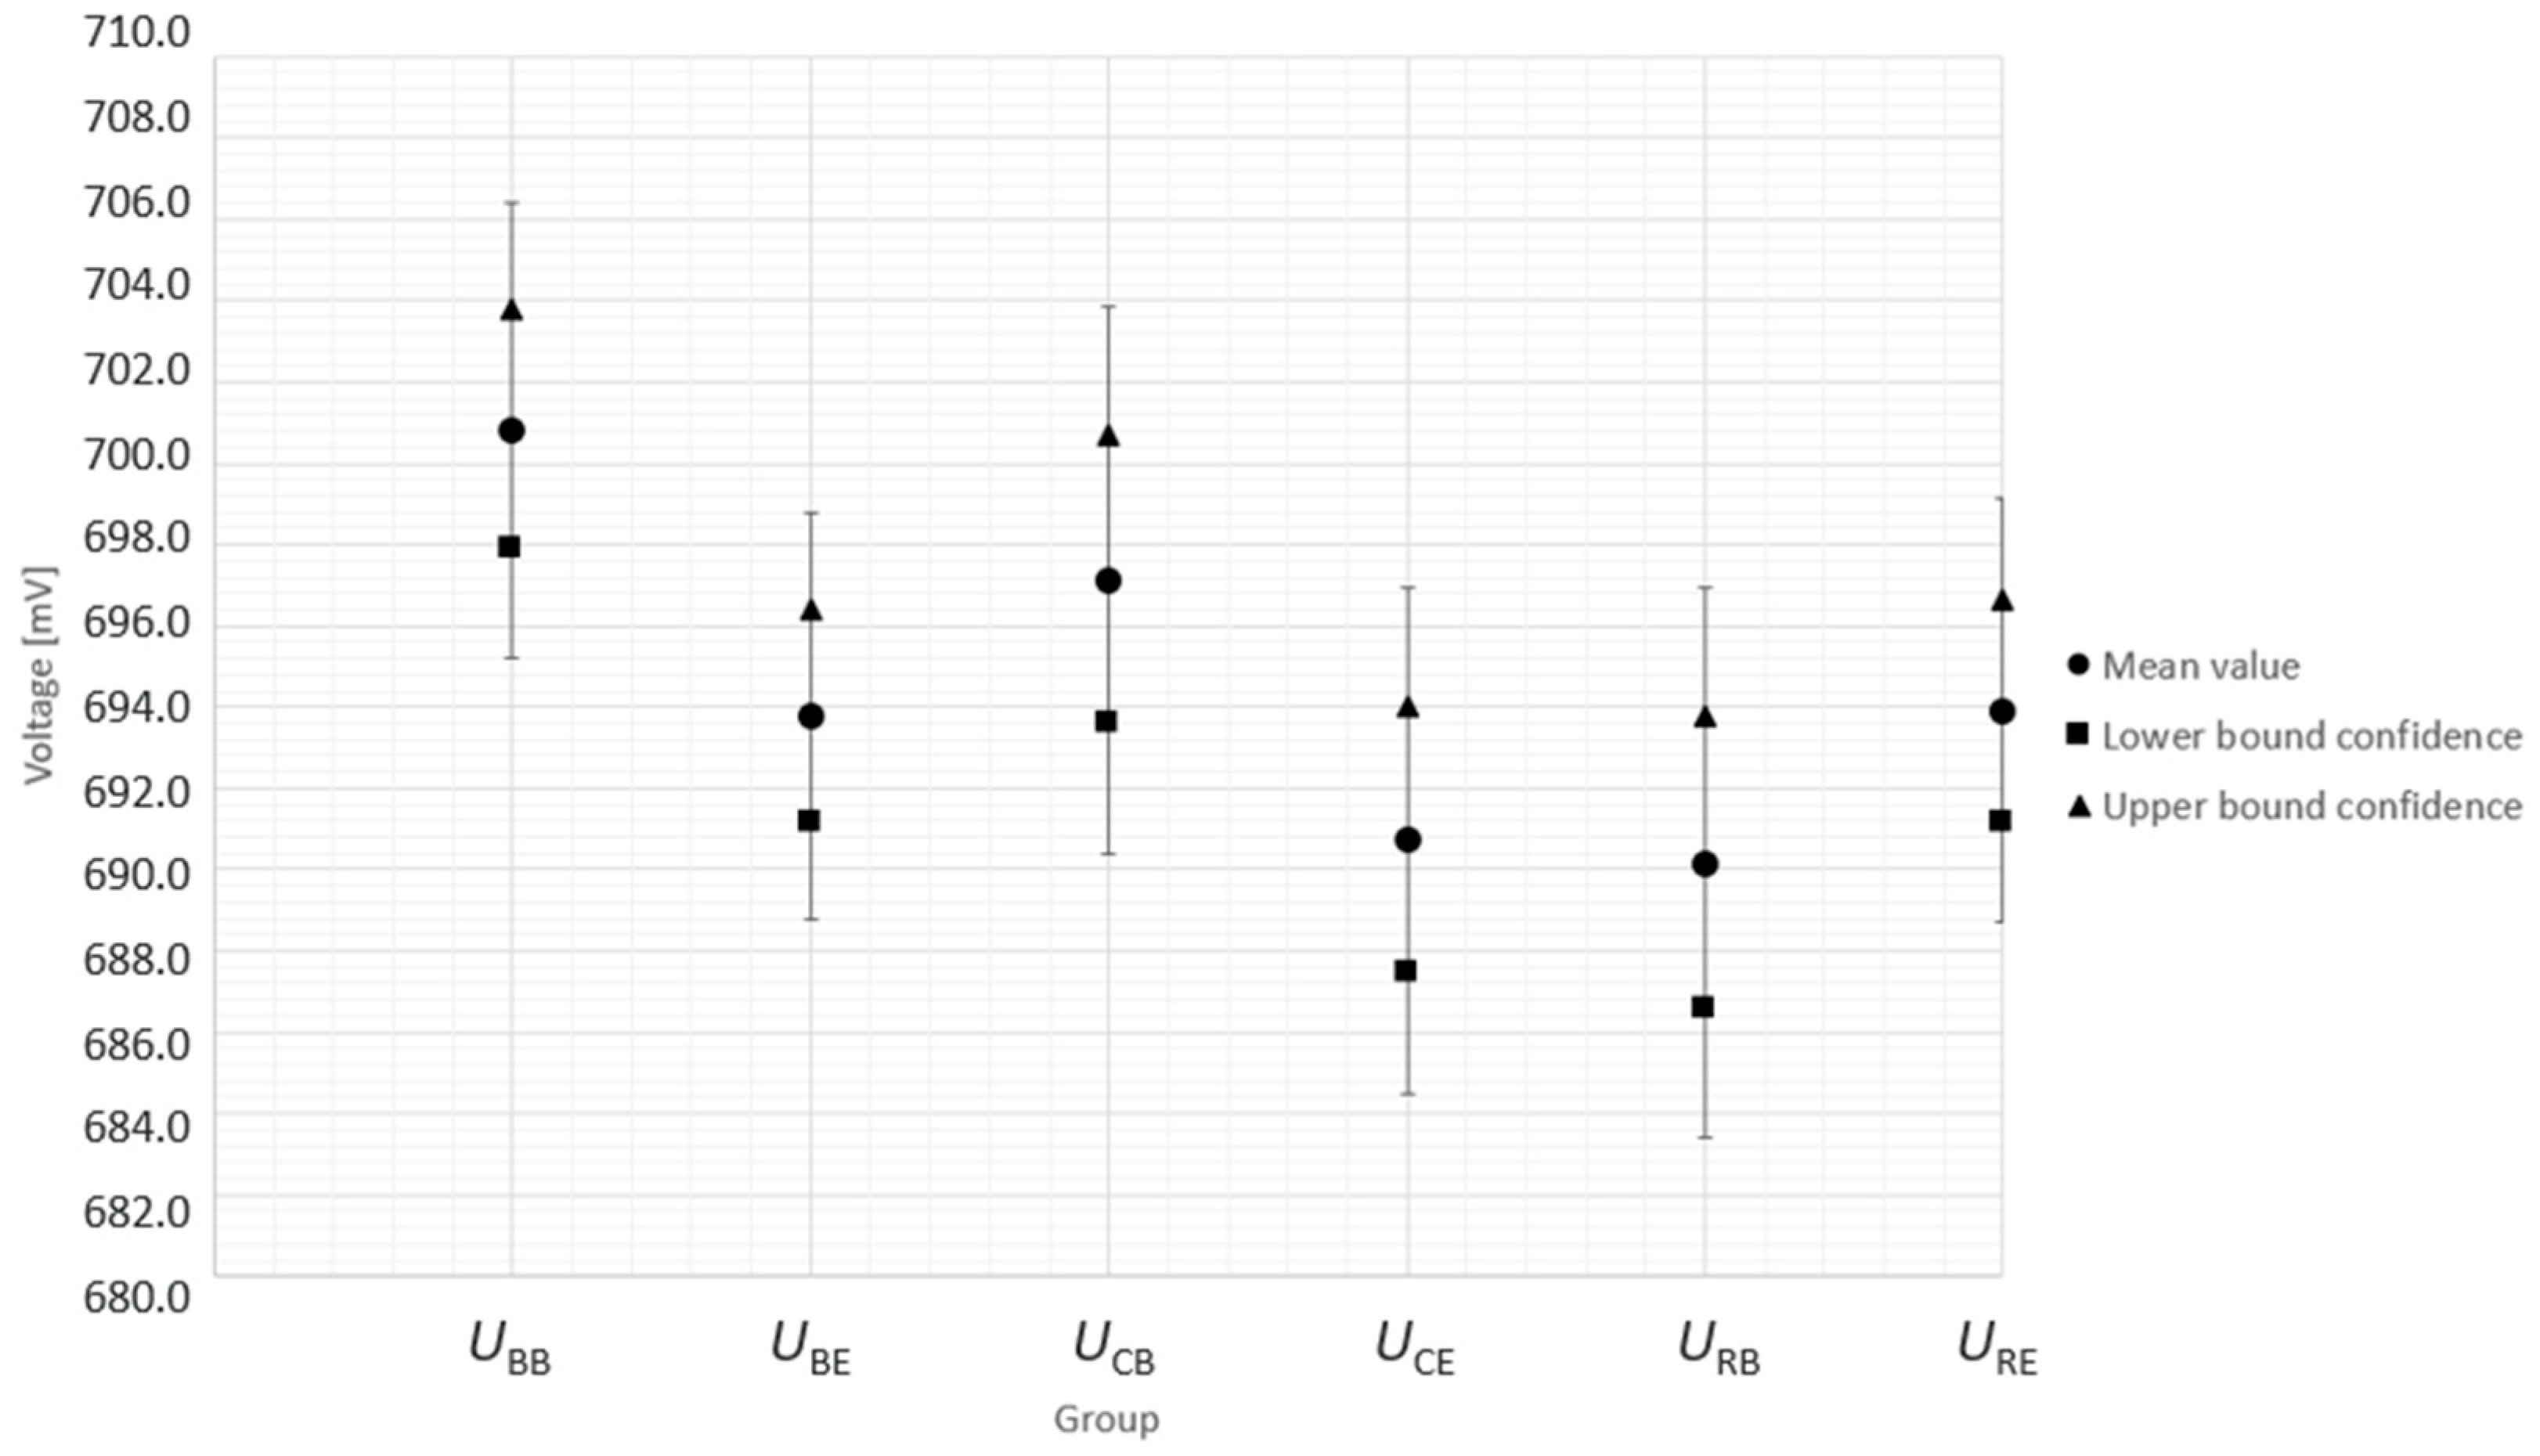
Figure A2.
Visualized confidence intervals of the calculated test groups with standard deviation error bars of the mean value.
References
- Ali, F.S.; Daniel, L.; Heikkinen, N.; Ihonen, J.; Rautanen, M. Influence of contaminants on PEMFC performance—A multisinglecell approach. Next Res. 2025, 2, 100209. [Google Scholar] [CrossRef] [Scilit]
- Moore, J.M.; Adcock, P.L.; Lakeman, J.B.; Mepsted, G.O. The effects of battlefield contaminants on PEMFC performance. J. Power Sources 2000, 85, 254–260 1999. [Google Scholar] [CrossRef] [Scilit]
- Morsbach, S.; Giersch, D.; Zhang, K.A.I.; Schüßling, A.; Weberskirch, D.; Börger, A. Hydrogen Compatibility of Polymers for Fuel Cell Vehicles. Energy Technol. 2022, 10, 2200018. [Google Scholar] [CrossRef] [Scilit]
- Mehrabadi, B.A.T.; Dinh, H.N.; Bender, G.; Weidner, J.W. Effect of System Contaminants on the Performance of a Proton Exchange Membrane Fuel Cell. J. Electrochem. Soc. 2016, 163, F1527–F1534. [Google Scholar] [CrossRef] [Scilit]
- Misz, U.; Acker, K. Collaborative Project: VALIDATE. Research on Validation Methods for Analyzing the Influence of Fluid Path Materials and on Fuel Cell Stack Degradation. Subproject: In-Situ Analyses and Identification of Suitable Materials. Project Report. 2020. Available online: https://www.tib.eu/de/suchen/id/TIBKAT:1809096561 (accessed on 23 December 2025).
- Finkenwirth, O.; Farajallah, H.; Frettlöh, V.; Frank, M.; Gärtner, L.; Runge, M.; Eiber, T. Bayerische Motoren Werke; Robert Bosch GmbH; Kunststoff-Institut Lüdenscheid; et al. Collaborative Project: FaeBS. Functional Design and Experimental Validation of an Innovative Fuel Cell System. Project Report. 2024. Available online: https://www.tib.eu/de/suchen/id/TIBKAT:1929238800 (accessed on 23 December 2025).
- Opu, M.; Bender, G.; Macomber, C.S.; van Zee, J.W.; Dinh, H.N. Understanding the Effects of PEMFC Contamination from Balance of Plant Assembly Aids Materials: In Situ Studies. J. Electrochem. Soc. 2015, 162, F1011–F1019. [Google Scholar] [CrossRef] [Scilit]
- Dinh, H.N.; Macomber, C.; Wang, H.; Bender, G.; O’Neill, K.; Pivovar, B. (V.B.1) Effect of System Contaminants on PEMFC Performance and Durability: DOE Hydrogen and Fuel Cells Program FY 2012 Annual Progress Report; Department of Energy: Washington, DC, USA, 2012. [Google Scholar]
- Dinh, H.N.; Bender, G.; Macomber, C.; Wang, H. (V.E.3) Effect of System Contaminants on PEMFC Performance and Durability: Fiscal Year Progress Report 2015; Department of Energy: Washington, DC, USA, 2015. [Google Scholar]
- Carey, C.T. Effect of Polythalamide Material Leachate on Platinum-alloy Polymer Electrolyte Membrane Performance; University of South Carolina: Columbia, SC, USA, 2016. [Google Scholar]
- Macomber, C.S.; Wang, H.; O’Neill, K.; Coombs, S.; Bender, G.; Pivovar, B.; Dinh, H.N. Characterizing Polymeric Leachants for Potential System Contaminants of Fuel Cells. ECS Trans. 2010, 33, 1637–1643. [Google Scholar] [CrossRef] [Scilit]
- Qi, J.; Wang, X.; Ozdemir, M.O.; Uddin, M.A.; Bonville, L.; Pasaogullari, U.; Molter, T. Effect of cationic contaminants on polymer electrolyte fuel cell performance. J. Power Sources 2015, 286, 18–24. [Google Scholar] [CrossRef] [Scilit]
- Wang, H.; Macomber, C.; Dinh, H.N. Evaluation of PEMFC System Contaminants on the Performance of Pt Catalyst via Cyclic Voltammetry; National Laboratory of the Rockies (NLR): Golden, CO, USA, 2012. [Google Scholar]
- Li, H.; Zhang, S.; Qian, W.; Yu, Y.; Yuan, X.; Wang, H.; Jiang, M.; Wessel, S.; Cheng, T.T.H. Impacts of operating conditions on the effects of chloride contamination on PEM fuel cell performance and durability. J. Power Sources 2012, 218, 375–382. [Google Scholar] [CrossRef] [Scilit]
- Moll, S. Study of the Impact of Thermal-Oxidative Exposure on the Emission Characteristics of ABS and PP and the Correlation with Material Aging. Ph.D. Dissertation, Friedrich-Alexander University, Erlangen-Nürnberg, Germany, 2017. [Google Scholar]
- Auvinen, S.; Tingelöf, T.; Ihonen, J.K.; Siivinen, J.; Johansson, M. Stainless Steel In-situ Corrosion Testing in a PEFC Multisinglecell. ECS Trans. 2009, 25, 1811–1821. [Google Scholar] [CrossRef] [Scilit]
- Auvinen, S.; Tingelöf, T.; Ihonen, J.K.; Siivinen, J.; Johansson, M. Cost Effective In-Situ Characterization of Coatings for PEFC Bipolar Plates Demonstrated with PVD Deposited CrN. J. Electrochem. Soc. 2011, 158, B550. [Google Scholar] [CrossRef] [Scilit]
- DIN EN ISO 527-2:2025-09; Plastics—Determination of Tensile Properties—Part 2: Test Conditions for Moulding and Extrusion Plastics (ISO 527-2:2025). Deutsches Institut für Normung e.V.: Berlin, Germany, 2025. [CrossRef] [Scilit]
- Ma, Y.; Wang, X.; Yuan, H.; Chang, G.; Zhu, J.; Dai, H.; Wei, X. Review of electrochemical impedance spectroscopy in fault diagnosis for proton exchange membrane fuel cells. Renew. Sustain. Energy Rev. 2025, 211, 115226. [Google Scholar] [CrossRef] [Scilit]
- Li, K.; Hong, J.; Zhang, C.; Liang, F.; Yang, H.; Ma, F.; Wang, F. Health state monitoring and predicting of proton exchange membrane fuel cells: A review. J. Power Sources 2024, 612, 234828. [Google Scholar] [CrossRef] [Scilit]
- Meng, X.; Liu, M.; Mei, J.; Li, X.; Grigoriev, S.; Hasanien, H.M.; Tang, X.; Li, R.; Sun, C. Polarization loss decomposition-based online health state estimation for proton exchange membrane fuel cells. Int. J. Hydrogen Energy 2025, 157, 150162. [Google Scholar] [CrossRef] [Scilit]
- Sorrentino, A.; Sundmacher, K.; Vidakovic-Koch, T. Polymer Electrolyte Fuel Cell Degradation Mechanisms and Their Diagnosis by Frequency Response Analysis Methods: A Review. Energies 2020, 13, 5825. [Google Scholar] [CrossRef] [Scilit]
- ISO 5479:1997-05; Statistical Interpretation of Data—Tests for Departure from the Normal Distribution. ISO: Geneva, Switzerland. Available online: https://www.iso.org/standard/22506.html (accessed on 5 January 2026).
- Shapiro-Wilk Test Calculator. Statistics Kingdom. 2017. Available online: https://www.statskingdom.com/shapiro-wilk-test-calculator.html (accessed on 5 January 2026).
- Meng, X.; Sun, C.; Mei, J.; Tang, X.; Hasanien, H.M.; Jiang, J.; Fan, F.; Song, K. Fuel cell life prediction considering the recovery phenomenon of reversible voltage loss. J. Power Sources 2025, 625, 235634. [Google Scholar] [CrossRef] [Scilit]
- Goh, J.; Al-Sikab, A.; Smith, G. Estimating the uncertainty on measurements of single cell PEMFC performance. Discov. Electrochem. 2026, 3, 25. [Google Scholar] [CrossRef] [Scilit]

Disclaimer/Publisher’s Note: The statements, opinions and data contained in all publications are solely those of the individual author(s) and contributor(s) and not of MDPI and/or the editor(s). MDPI and/or the editor(s) disclaim responsibility for any injury to people or property resulting from any ideas, methods, instructions or products referred to in the content. |
© 2026 by the authors. Licensee MDPI, Basel, Switzerland. This article is an open access article distributed under the terms and conditions of the Creative Commons Attribution (CC BY) license.