


Abstract
Against the backdrop of global energy landscape restructuring, the advancement of the “dual-carbon” goals, and escalating external uncertainties, coal, as the “ballast stone” of China’s new energy system, faces new challenges in terms of supply chain stability and security. Therefore, scientifically assessing China’s coal supply chain resilience (CSCR) is of significant theoretical and practical importance for systematically identifying its supply vulnerabilities and ensuring energy supply security under extreme conditions. In the paper, we construct a composite evaluation indicator system using national statistical data from 2010 to 2024. We operationalize resilience across the following four capacities: resistance, absorption, recovery, and adaptive capacity. Annual resilience levels are measured using an integrated framework. This framework combines an improved entropy weight method, TOPSIS, and gray relational analysis (GRA). We then use the indicator contribution degree and obstacle degree models to identify the most influential factors. The results indicate that China’s CSCR followed a fluctuating upward, W-shaped trajectory during 2010–2024, with a marked acceleration after 2020. Resistance and absorption capacities display pronounced volatility. Recovery and adaptation capacities improve steadily. The dominant obstacle factors include the share of intelligent coal production capacity, labor productivity per employee, the scale of workforce security, and the working-capital turnover ratio. These findings provide empirical evidence and policy-relevant insights for strengthening China’s CSCR and reinforcing national energy security.
1. Introduction
Energy is a fundamental pillar of economic development and a core component of national security. In China, coal remains the primary energy source and will continue to play an indispensable role for a considerable period, particularly in supporting power generation, industrial production, and overall energy-system stability [1,2,3,4]. At the same time, China is accelerating the transition toward its “dual-carbon” goals. As a result, the coal sector is no longer assessed only by output and supply scale but increasingly by its ability to operate safely, stably, and adaptively under tighter environmental, technological, and policy constraints [3,4]. Under these conditions, CSCR has become a strategic issue directly related not only to industrial continuity, but also to national energy security and the orderly advancement of the low-carbon transition [2,4].
This challenge has become more prominent as the operating environment of energy systems grows increasingly uncertain. External shocks such as geopolitical tensions, international market turbulence, extreme weather events, and global supply-chain disruptions have intensified the exposure of energy supply networks to interruption risk [5,6,7,8]. For China, the issue is especially significant because coal production and consumption are spatially mismatched: resources are concentrated mainly in the west and north, whereas demand is concentrated in the east and south [2]. This pattern necessitates long-distance, cross-regional transport and makes the coal supply chain highly dependent on large-scale logistics coordination. As a result, the system is vulnerable not only to supply shocks at the production end, but also to transport bottlenecks, market fluctuations, and cascading disruptions across interconnected nodes. Traditional supply-chain management approaches centered on efficiency maximization and cost minimization are therefore insufficient under contemporary energy-security constraints. A more appropriate analytical focus is whether the coal supply chain can resist disturbances, absorb shocks, recover functions, and adapt to structural change over time [5,9,10].
Against this background, the concept of resilience provides a useful analytical lens. Rather than asking only whether sufficient coal can be supplied at a given point in time, resilience-based analysis asks whether the coal supply chain can maintain critical functions, restore operations after disruption, and upgrade its structure under long-term transition pressure [5,9]. This perspective is particularly relevant for China, where coal still serves as the foundation of energy security while simultaneously facing the imperative of green transformation [3,4].
Accordingly, this study focuses on China’s CSCR. We define CSCR as the capacity of the coal supply chain to maintain, restore, and upgrade its core functions in the face of external shocks and long-term transition constraints. Based on resilience theory, we conceptualize CSCR through the following four interrelated dimensions: resistance, absorption, recovery, and adaptive capacity. Using national annual data for 2010–2024, we construct a multidimensional indicator system and evaluate the dynamic evolution of CSCR through an integrated improved entropy weight method–TOPSIS–GRA framework. We further employ contribution-degree and obstacle-degree models to identify the main drivers and constraints shaping resilience change.
The remainder of the paper is organized as follows. Section 2 reviews the relevant literature and identifies the main research gaps. Section 3 presents the data, evaluation indicator system, and methodology. Section 4 reports empirical results. Section 5 discusses the findings, policy implications, and limitations. Section 6 concludes the paper. The resilience evaluation procedure is shown in Figure 1.
Figure 1.
Flowchart of the comprehensive assessment framework for the China’s CSCR.
2. Literature Review
2.1. Coal Supply Chain Studies
Research on coal supply chains has gradually expanded from environmental optimization to broader concerns involving coordination, sustainability, risk, and resilience. Early studies mainly examined carbon-emission mitigation and low-carbon supply-chain optimization from the perspective of green production and network design [11,12]. Later work extended the analysis to coordination mechanisms under renewable-energy quota constraints and multidimensional sustainability assessment under China’s evolving development framework [13,14]. More recently, the literature has increasingly turned toward resilience and risk governance. Existing studies have proposed resilient and green coal supply-chain network designs under facility disruptions and demand volatility [15], conducted dynamic scenario analysis for power-coal supply chains under long-term low-carbon transition [16], and applied fuzzy-theory-based TOPSIS to evaluate the resilience of coal industrial and supply chains [17]. Other work has further examined the coordinated development of resilience and industrial efficiency under the dual-carbon goals [18]. In parallel, scholars have used AHP-fuzzy methods, fuzzy DEMATEL–ISM–ANP models, Petri-net analysis, and evolutionary-game approaches to identify supply-chain risks and resilience governance strategies in coal-related systems [19,20,21,22]. These studies have significantly enriched understanding of coal supply chains. However, the literature still tends to emphasize network optimization, governance mechanisms, or coordination effects, while systematic national-level measurement of China’s CSCR remains relatively limited.
2.2. Resilience Studies
In the wider resilience literature, the concept has evolved from engineering resilience and ecological resilience toward broader adaptive and evolutionary understandings. This conceptual shift highlights that resilience should not be understood merely as short-term stability or simple recovery, but as a multidimensional capability involving disturbance resistance, shock absorption, functional restoration, and longer-run adaptation [9,10]. Methodologically, resilience assessment has mainly followed two lines. One is the indicator-based approach, which constructs multidimensional composite frameworks and applies entropy weighting, TOPSIS, GRA, or similar methods for comparative evaluation [23,24,25]. The other is the model-based approach, which uses dynamic Bayesian networks, complex-network analysis, optimization models, and system-dynamics methods to capture uncertainty, interdependence, and dynamic response processes [26,27,28,29]. These methods have been applied to a wide range of systems and have substantially improved the measurement of resilience across different sectors.
2.3. Review
Although the resilience framework has been widely adopted in energy studies, most quantitative applications focus on power systems [30,31], natural gas [29,32], oil [7,33], critical minerals [34,35], and clean-energy infrastructure [8,36]. These studies demonstrate that energy resilience is dynamic, multidimensional, and highly sensitive to external shocks, and therefore cannot be adequately represented by static indicators of supply sufficiency alone [5,6,9]. However, China’s coal supply chain differs from these systems in important ways: it combines strong domestic resource dependence, large-scale cross-regional logistics, market and policy dual constraints, and the simultaneous pressure of ensuring energy security while advancing low-carbon transition. These features require a more targeted resilience-evaluation framework.
Accordingly, three research gaps remain. First, the coal supply chain literature still pays insufficient attention to resilience as an integrated staged capability [14,20]. Second, the broader energy resilience literature offers valuable theory and methods, but it does not yet provide an indicator framework sufficiently tailored to the institutional and operational characteristics of China’s coal supply chain [17,37]. Third, the existing literature has not adequately combined resilience measurement with diagnostic analysis of contribution and obstacle factors, making it difficult to identify where resilience improvement is coming from and where it is being constrained [18].
To fill these gaps, this study develops a multidimensional and diagnostic framework for evaluating China’s CSCR. It integrates stage-based resilience theory with the operational realities of China’s coal supply chain, constructs a 25-indicator system covering four core capacities, and combines improved entropy weight method with TOPSIS–GRA evaluation and contribution/obstacle diagnosis. In this way, the study provides a more policy-relevant understanding of how China’s CSCR evolves and what factors currently shape its improvement path.
3. Materials and Methods
3.1. Evaluation Indicator System of China’s Coal Supply Chain Resilience
Frontier research on energy supply chain resilience has shown that resilience is not determined by a single point in time or a single capability; rather, it represents an integrated, multi-stage performance spanning pre-shock, during-shock, and post-shock phases, commonly summarized as preparation, absorption, recovery, and adaptation [5,17,33,38]. On the basis of these stage-based concepts and the operational characteristics of China’s coal supply chain, we consolidated the “preparation–absorption–recovery–adaptation” stage framework into the following four core resilience dimensions: resistance capacity, absorption capacity, recovery capacity, and adaptive capacity. Indicator selection followed the following four principles: theoretical relevance to resilience capacities, institutional relevance to the operational reality of China’s coal supply chain, annual data continuity, and interpretability with limited redundancy. We established a comprehensive evaluation indicator system of China’s CSCR comprising these four dimensions, nine secondary indicators, and 25 tertiary indicators (Table 1). The indicator-selection rationale is detailed below. A detailed justification of indicator selection, polarity setting, and trade-off handling is provided in Supplementary Table S1.
Table 1.
China’s coal supply chain resilience comprehensive evaluation indicator system.
(1) Resistance capacity: Resistance capacity captures the foundational support and latent risk-mitigation capability of the coal supply chain before shocks occur. It reflects whether the system has sufficient resource support, external risk buffering, and financial robustness at the pre-shock stage. In this study, resistance capacity comprises resource guarantee, environmental risk, and economic foundation. For resource guarantee, the coal reserve-to-production ratio [39], fixed asset investment in the coal industry [40], production concentration, and emergency coal reserve scale [15] were selected to reflect resource sustainability, capacity-support intensity, spatial organization of production, and emergency assurance capability, respectively. The coal reserve-to-production ratio and the emergency coal reserve scale indicate the buffering space available under abrupt disruptions. Fixed asset investment in the coal industry reflects long-term support for production continuity. Production concentration is treated as a negative indicator because excessive concentration increases dependence on a limited number of major producing provinces and transport corridors, making localized disruptions more likely to escalate into system-wide risk. For environmental risk, a political risk index [18,23,41] was used to capture constraints arising from the external institutional environment and geopolitical uncertainty. For the economic foundation, industry profitability and industry debt levels [40] were selected to measure financial robustness and financial vulnerability, respectively. Together, these indicators reflect the coal industry’s capacity to withstand shocks and maintain stable operation.
(2) Absorption capacity: Absorption capacity reflects the coal supply chain’s ability to withstand and buffer supply–demand imbalances and market turbulence during shocks. It indicates whether the system can maintain stability once disruptions have emerged. In this study, absorption capacity consists of supply–demand structure and market stability. For the supply–demand structure, coal self-sufficiency rate [1,2], import concentration [41], and the share of substitutable energy consumption were selected to represent domestic supply support, diversification of import sources, and structural flexibility for energy substitution, respectively. A higher coal self-sufficiency rate implies stronger domestic support and lower dependence on external markets. Import concentration is treated as a negative indicator because greater concentration increases exposure to external supply shocks. By contrast, a higher share of substitutable energy consumption provides structural buffering against coal supply disturbances. For market stability, price volatility [42] and the supply–demand gap ratio were used to capture market fluctuation and supply–demand mismatch. Both are treated as negative indicators. Larger values indicate weaker market adjustment capacity and lower effectiveness in smoothing disruptions. Together, these indicators reflect the system’s ability to absorb shocks without generating large-scale instability.
(3) Recovery capacity: Recovery capacity refers to the ability of the coal supply chain to restore disrupted functions and re-establish normal operations after adverse events. It focuses on post-shock repair and circulation recovery. In China’s coal supply chain, this capacity depends mainly on logistics and transportation and production guarantee. Because coal production and consumption are spatially separated, logistics and transportation are critical to recovery. Railway network density and road network density were used to measure transport carrying capacity and accessibility, while logistics turnover capacity captured the efficiency of coal circulation from production sites to demand centers. Higher values indicate stronger ability to reconnect disrupted flows and reallocate coal resources. Production guarantee provides the operational basis for rapid recovery. The fatality rate per million tonnes [43] was used to represent work safety performance and is treated as a negative indicator, because poor safety conditions increase disruption risk and delay recovery. The mechanization level of coal mining [43,44] reflects technological support for stable production recovery. The average annual employment in the coal industry was used to measure workforce security scale [18,23] and is treated as positive, because a larger workforce provides personnel support for emergency repairs and production continuity. Finally, the working-capital turnover ratio reflects the efficiency with which firms mobilize short-term financial resources for self-repair. A higher value indicates stronger financial support for recovery.
(4) Adaptive capacity: Adaptive capacity emphasizes the coal supply chain’s ability to learn, innovate, and transform, thereby supporting sustained upgrading. It goes beyond short-term restoration and focuses on whether the system can strengthen future resilience under technological, environmental, and policy change. In this study, adaptive capacity consists of innovation-driven development and green transition. Innovation-driven development was treated as the main source of long-term adaptive potential. R&D expenditure intensity in the coal industry [18], the number of coal-industry patent applications [23], and labor productivity per employee were selected to reflect innovation input, innovation output, and efficiency improvement, respectively. Together, these indicators describe the technological and organizational basis for long-run adaptation. Because digital supply chains can strengthen resilience and sustainability [45], the share of intelligent coal production capacity was also included to capture the degree of digital transformation. Green transition reflects the development space of the coal supply chain under China’s dual-carbon targets. Carbon emissions intensity [3,39] and the comprehensive utilization rate of solid waste were used to capture low-carbon performance and resource-efficiency improvement [4]. Carbon emissions intensity is treated as a negative indicator because higher emissions imply weaker environmental adaptability and greater regulatory pressure. By contrast, a higher comprehensive utilization rate of solid waste indicates stronger circular-use capacity and better green transition performance. Overall, adaptive capacity reflects whether the coal supply chain can sustain resilience through innovation-led and low-carbon-oriented transformation.
3.2. Data Sources
Given data availability constraints, the study period was defined as 2010–2024. Data were collected primarily from authoritative public sources, including the China Statistical Yearbook, China Energy Statistical Yearbook, China Industrial Statistical Yearbook, China Environment Statistical Yearbook, the Annual Report on Coal Industry Development, the Statistical Report on Transport Industry Development, and the National Statistical Bulletin on Science and Technology Expenditure, among others. Coal industry CO2 emissions required to compute carbon emissions intensity were obtained from the CEIC database. Data on China’s major coal-importing countries and corresponding import volumes, used to construct the import concentration indicator, were retrieved from the BP Statistical Review of World Energy and the General Administration of Customs of the People’s Republic of China. Labor productivity per employee was sourced from the Wind database.
Missing values were extremely limited and occurred only in two indicators, namely C17 and C23. In the full panel, missingness affected 8 of 375 indicator-year observations (2.13%). For C17, only the 2024 endpoint value was completed by linear extrapolation based on the last two observed values. For C23, the early missing values from 2010 to 2016 were backfilled by linear interpolation of the annual percentage series between a conservative lower bound of 0 in 2010 and the first observed value in 2017. More complex spline-based or model-based imputation methods were not adopted because missingness was extremely limited, occurred in only two annual national series, and did not involve repeated interior gaps across the panel. The missing-data pattern, imputed values, and calculation details are reported in Supplementary Table S2.
3.3. Evaluation Methodology
The comprehensive evaluation indicator system of China’s CSCR is a multidimensional system involving 25 indicators that differ in variability, information content, and structural relevance. Under such conditions, equal weighting is difficult to justify because it assumes identical importance across all indicators [46]. Although entropy weight can reduce subjective bias, the conventional entropy method mainly reflects data dispersion and may overemphasize highly variable or partially redundant indicators [47]. To address this issue, this study combines entropy weights with indicator independence [23,48], so that the final weights can reflect both information variability and inter-indicator independence. This treatment is more suitable for the present indicator system and helps improve the structural rationality of the evaluation results.
At the evaluation stage, TOPSIS was adopted because it provides a clear ranking logic based on closeness to the ideal solution, which is appropriate for comparing annual resilience performance [24]. However, TOPSIS alone mainly captures geometric distance and may not fully reflect similarity in the overall development pattern of the system [49]. GRA complements this limitation by measuring relational closeness and trend consistency [50,51]. Therefore, the integrated improved entropy weight method–TOPSIS–GRA framework is adopted as the benchmark specification in this study, because it jointly incorporates information variability, redundancy correction, distance-to-ideal evaluation, and trend similarity.
3.3.1. Improved Entropy Weight Method
We first applied the entropy weight method to derive an objective, data-driven set of preliminary weights and to minimize subjective bias by capturing the information variability of each indicator. However, the conventional entropy weight method did not account for potential multicollinearity among indicators, which can lead multiple indicators to redundantly describe the same underlying dimension and thereby artificially inflate that dimension’s weight. To address this issue, we introduced an independence weight [23,48] to correct traditional entropy weights and constructed a combined weighting model adjusted by indicator independence, thereby improving the robustness and interpretability of the final weights. The procedure was implemented as follows.
Before normalization, all annual indicator series were screened for potential outliers using both the interquartile range rule and a standardized score test. Only 6 of the 375 indicator year observations (1.6%) were flagged by the interquartile range rule, and none showed an absolute z score above 3. The flagged observations were concentrated in indicators that are sensitive to policy shifts and market conditions, including import concentration, price volatility, work safety performance, and share of intelligent coal production capacity. In line with methodological guidance that distinguishes substantively meaningful extreme values from recording errors [52], these observations were not treated as erroneous data. Instead, they were considered to reflect genuine structural, market, and technological changes over the study period. They were therefore retained in the baseline dataset.
- (1)
- Data standardization.
Min–max normalization was used because it fits the TOPSIS–GRA framework adopted in this study. It transforms all indicators into a common bounded interval while preserving polarity, thereby facilitating the construction of ideal solutions and the calculation of distance- and relation-based proximity. Since the purpose here is to assess closeness to an ideal state rather than deviation from a sample mean, min–max normalization provides clearer interpretability in the present multi-criteria setting [49,53].
For year and indicator , the raw value was transformed into the standardized value ().
- (2)
- Information-content weights based on entropy.
The entropy formulation used in Equations (3)–(5) follows the standard Shannon entropy-based entropy-weight method widely used in composite indicator research, where the dispersion of normalized indicator values across evaluation objects is interpreted as information content.
Let denote the proportion of indicator in year . The information entropy of indicator was denoted by , and represented its divergence coefficient. The resulting entropy weight for indicator was . A larger indicated that the indicator contributed more information and therefore received a higher weight.
- (3)
- Correlation-based redundancy adjustment using independence weights.
To reduce redundant weighting caused by information overlap among highly correlated indicators, we introduced an independence weight [23,48]. Pairwise Pearson correlations were then calculated to characterize indicator similarity and to construct the correlation matrix:
where is the correlation coefficient between indicator and indicator ; if , its absolute value was used. We then quantified the degree of information redundancy for indicator as , which captured the extent to which indicator overlapped with other indicators. A larger implied higher redundancy and poorer independence; accordingly, the indicator should receive a lower weight. The corresponding independence weight was denoted by .
- (4)
- Determination of the combined weights.
To jointly consider indicator variability and independence, the two weights were linearly aggregated to obtain the final combined weight :
where and are preference coefficients satisfying . Following prior studies [23] and considering the characteristics of the indicator set, we set to reduce subjectivity while assigning equal importance to entropy weights and independence weights.
3.3.2. TOPSIS–GRA Method
Based on the indicator weights, TOPSIS was integrated with GRA to form a composite evaluation method. This approach simultaneously considered (i) the geometric distance to the optimal and worst solutions and (ii) the shape similarity of indicator sequences. TOPSIS ranks alternatives based on Euclidean distances to the positive and negative ideal solutions, providing intuitive interpretability. However, it primarily reflects positional proximity in the indicator space and does not explicitly capture similarity in the evolving patterns of indicator series. In contrast, GRA quantifies the strength of association and overall trend consistency between sequences. Their integration, therefore, provides complementary advantages. It preserves TOPSIS interpretability while incorporating the robustness of gray relational measures. The procedure was implemented as follows [24,53].
- (1)
- Construction of the weighted normalized matrix.
Let denote the number of indicators and denote the number of evaluation objects. After normalization, the weighted normalized value for indicator of object was computed as
where is the normalized value and is the weight of indicator .
- (2)
- Determination of the positive and negative ideal solutions.
The positive ideal solution and the negative ideal solution were defined as
where and denote, respectively, the positive and negative ideal values on indicator .
- (3)
- Euclidean distances to the ideal solutions.
For each evaluation object , the Euclidean distances to the positive and negative ideal solutions were calculated as
where smaller or indicated closer proximity to the corresponding ideal solution.
- (4)
- Gray relational coefficient matrices with respect to the ideal solutions.
Gray relational coefficients between each object and the ideal solutions were computed to form the coefficient matrices. The coefficient with respect to the positive and the negative ideal solution was
where and denote the gray relational coefficient matrices for the positive and negative ideal solutions, respectively. The distinguishing coefficient controlled discriminability; following common practice in gray system theory, a distinguishing coefficient of was adopted [24,54].
- (5)
- Gray relational degrees relative to the ideal solutions.
For each object , the gray relational degrees with respect to the positive and negative ideal solutions were obtained by averaging across indicators:
Here, larger (or ) indicated that the indicator profile of object was more similar in shape to the positive (or negative) ideal solution.
- (6)
- Normalization of distances and relational grades.
- (7)
- Composite closeness and decision rule.
A composite closeness index was then constructed, and the relative closeness of each evaluation object to the ideal state was computed as
where is the weight, and ; based on previous literature research [50,55], we set 0.5. and represent the normalized proximity measures to the positive and negative ideal solutions, respectively, after integrating distance and gray relational information. A larger indicated that object was closer to the ideal state. All evaluation objects were ranked according to , yielding the final comprehensive assessment results.
To disentangle the key drivers shaping the evolution of China’s CSCR, we established a dual diagnostic framework combining an indicator contribution degree model and an obstacle degree model. This framework quantified the time-varying role of each indicator in shaping resilience and enabled the identification of critical determinants from both positive and negative perspectives. Taken together, the two models provide two complementary perspectives for interpreting the determinants of CSCR. Although both are derived from the gap between observed indicator performance and the ideal state, they are not redundant. The contribution degree highlights the indicators that are already functioning as effective drivers of resilience, whereas the obstacle degree identifies the indicators that remain binding constraints on further improvement. In other words, the former shows where resilience gains come from, while the latter shows where resilience improvement is being blocked.
3.3.3. Indicator Contribution Degree Model
To identify the indicators that actively support the evolution of China’s CSCR, we introduced an indicator contribution degree coefficient [41,56]. In practical terms, the contribution degree model measures how much a given tertiary indicator helps to sustain or enhance the resilience performance of the corresponding dimension in a given year. It therefore captures the positive supporting effect of an indicator. An indicator with a higher contribution degree is closer to its desirable state and plays a stronger role in driving resilience improvement, whereas an indicator with a lower contribution degree contributes less to the resilience of the system. The contribution degree coefficient was calculated as follows:
where denotes the negative ideal solution, and represents the distance between evaluation object and the ideal value for indicator .
3.3.4. Obstacle Degree Model
While the contribution degree model identifies the factors that promote resilience, it does not reveal which weak links continue to restrict further improvement. For this reason, we further applied an obstacle degree model [57,58,59] to diagnose the factors that hinder resilience enhancement from the perspective of deviation from the ideal state. In practical terms, the obstacle degree model measures how much a given indicator acts as a constraint or bottleneck on the resilience of the system. A larger obstacle degree indicates that the indicator remains farther from its desirable state after accounting for its relative importance and therefore exerts a stronger inhibiting effect on resilience improvement.
Compared with the contribution degree, the obstacle degree focuses not on the sources of resilience growth, but on the factors that prevent the system from moving closer to the ideal state. It is therefore particularly useful for identifying binding constraints, latent weak links, and priority areas for policy intervention. The obstacle degree model was specified as follows:
where is the indicator deviation degree, used to quantify the distance between indicator for evaluation object and its standardized score; is the obstacle degree, with larger values indicating a stronger inhibitory effect on resilience and thus a more salient constraint; denotes the standardized value of indicator .
Taken together, the methodological design of this study is consistent with established good practice in composite indicator construction [60]. The framework incorporates explicit polarity assignment, purpose driven normalization, interpretable and redundancy aware weighting, and robustness checks under alternative specifications.
4. Results
4.1. Indicator-Weight Estimation
Using annual data for 2010–2024, Equations (1)–(9) were applied to compute the entropy weights, independence weights, and combined weights for the evaluation indicators of China’s CSCR. The results are reported in Table 2.
Table 2.
Weight of China’s coal supply chain resilience evaluation indicators.
4.2. Composite Evaluation of China’s Coal Supply Chain Resilience
As shown in Figure 2, the composite index of China’s CSCR followed a fluctuating upward, W-shaped trajectory during 2010–2024, ranging from 0.3906 to 0.6325 with a mean of 0.4907. Overall, the index suggests that China’s CSCR improved over the sample period, although the process was accompanied by substantial fluctuations. Based on local turning points in the index and its growth rate, the evolution of CSCR can be grouped, for descriptive purposes, into the following four broad phases: a volatility phase (2010–2013), a trough phase (2013–2016), a recovery phase (2016–2020), and an upswing phase (2020–2024). These phase labels are intended as descriptive summaries rather than formal econometric regime classifications.
Figure 2.
Resilience values and growth trends of China’s coal supply chain in 2010—2024.
Phase I: Volatility stage (2010–2013). The resilience index first declined and then increased, indicating an overall volatile pattern. This period broadly coincided with the implementation of the 12th Five-Year Plan for Energy Development, continued expansion of coal-related investment, and intensified industry consolidation through resource integration, mergers, and acquisitions. Between 2010 and 2011, downstream coal demand remained relatively strong, and fixed-asset investment in the coal industry stayed at a high level. This pattern is consistent with the continued influence of post-global-financial-crisis stimulus and domestic infrastructure expansion. However, resilience gains in this phase appear to have relied mainly on scale expansion rather than on internal upgrading mechanisms. In 2012, slower macroeconomic growth moderated the increase in coal demand. Rising coal imports also coincided with looser domestic supply–demand conditions and downward pressure on prices. By the end of this phase, the limitations of extensive growth became more visible, while structural optimization remained limited. The resilience index therefore showed signs of diminishing marginal improvement.
Phase II: Trough stage (2013–2016). The resilience index declined markedly and reached a trough, indicating a period of deep adjustment. This phase coincided with China’s transition to the “new normal”, weaker energy-intensity growth, and slower expansion in coal demand. In 2013, the State Council issued the Action Plan for Air Pollution Prevention and Control, which initiated a stricter cycle of environmental regulation. At the same time, key regions such as Beijing–Tianjin–Hebei imposed tighter controls on coal consumption. These developments were accompanied by accelerated pressure on the traditional coal supply chain. Meanwhile, the large amount of capacity built during the previous expansion stage contributed to oversupply and intensified supply–demand imbalance. The decline in the resilience index during this period was associated with falling coal prices, weaker profitability, and tighter financing conditions in the industry. Taken together, the observed pattern is consistent with the combined effects of market adjustment and regulatory tightening. At the same time, this period also created conditions for subsequent structural reform by accelerating the exit of inefficient capacity.
Phase III: Recovery stage (2016–2020). The resilience index gradually recovered from its lowest level. This phase broadly coincided with the implementation of supply-side structural reform. In 2016, the State Council issued the Opinions on Resolving Excess Capacity in the Coal Industry and Achieving Development out of Difficulties (Guofa [2016] No. 7), which marked the beginning of a new round of coal-sector restructuring. As capacity-reduction measures took effect, many small mines exited in an orderly manner, while higher-quality capacity was gradually released. Environmental regulation was further strengthened during this period. The Three-Year Action Plan for Winning the Blue Sky Defense War, launched in 2018, likely encouraged greater environmental investment and cleaner production upgrading. It may also have supported the expansion of coal washing and processing. Although stricter compliance requirements may have increased short-term pressure on some small and medium-sized firms, the broader trend was more consistent with structural optimization and quality improvement. In parallel, medium- and long-term coal contracts and the “benchmark price + floating price” mechanism helped reduce market volatility. These developments were associated with a more stable recovery in the resilience index.
Phase IV: Upswing stage (2020–2024). After a short-term disruption during the COVID-19 period, the resilience index rose markedly during 2020–2024, with an average annual growth rate of 5.96%. This phase coincided with the introduction of the “dual-carbon” targets and the 14th Five-Year Plan for a Modern Energy System, both of which reshaped the role of coal in China’s energy strategy. In this context, coal increasingly shifted from a dominant energy source to a stabilizing component of energy security and a supporting element in the green transition. In 2021, power shortages emerged in some regions, followed by the implementation of “supply assurance and price stabilization” measures. These measures were associated with stronger emergency-response and reserve-support functions in the coal supply chain. At the same time, the coal sector further integrated digital technologies such as 5G, industrial internet platforms, and big data applications. The accelerated rollout of smart mines coincided with improved visibility, coordination, and flexibility across parts of the supply chain. Despite continued energy-market volatility and tighter domestic carbon constraints, progress in clean coal technologies and multi-energy integration was also consistent with stronger resilience performance. Compared with earlier phases, the main sources of resilience improvement during this stage appear to have shifted away from factor-driven expansion and toward innovation-, digitalization-, and transition-oriented upgrading.
4.3. Robustness Analysis
4.3.1. Sensitivity of Indicator Combination Weights
To assess whether the combination weights are overly sensitive to the choice of preference coefficients, we conducted a sensitivity analysis by varying the combination parameters and in Equation (9) from (0.3,0.7) to (0.7,0.3) at intervals of 0.1, subject to the constraint . The baseline specification adopted in this study, , assigns equal importance to entropy weights and independence weights, with the aim of balancing information variability and inter-indicator independence. The corresponding results are reported in Table 3 and visually illustrated in Figure 3.
Table 3.
Sensitivity of combined indicator weights under alternative – specifications.
Figure 3.
Comparison of combination weights distributions under alternative – specifications.
As shown in Table 3, the baseline specification exhibits strong local stability. When the coefficients vary within a reasonable range around the benchmark, the resulting weight vectors remain highly consistent with the baseline specification. In particular, the schemes (0.4,0.6) and (0.6,0.4) produce Pearson correlations of 0.956 and 0.972, respectively, and Spearman rank correlations of 0.964 and 0.971. Moreover, the set of dominant indicators changes only marginally: the top five weighted indicators under (0.4,0.6) fully overlap with those under the baseline, while the overlap remains four out of five under (0.6,0.4). Even within the broader interval , the correlation with the baseline remains high, indicating that the overall weight structure is robust under reasonable alternative specifications.
This pattern is also clearly reflected in Figure 3. Most indicator weights fluctuate only slightly when and vary around the baseline, and the overall distributional pattern remains largely unchanged. Noticeable divergence appears mainly under extreme specifications, such as (0.3,0.7) or (0.7,0.3). Thess results suggest that substantial distortion arises only when either entropy-based variability or inter-indicator independence is overemphasized.
Taken together, the evidence from Table 3 and Figure 3 indicates that the equal-weight specification is not an arbitrary choice. Rather, it represents a balanced and empirically stable compromise between the two weighting logics. By avoiding excessive dominance of either entropy weights or independence weights alone, the baseline setting preserves the main high-weight indicators identified in Table 3 while maintaining the structural stability of the weighting system.
4.3.2. Sensitivity of TOPSIS–GRA Aggregation Weights
To test the robustness of the final composite resilience index, we varied the aggregation weights and in Equations (23) and (24) assigned to TOPSIS and GRA from (0.2,0.8) to (0.8,0.2). The baseline specification used in this study is (0.5,0.5), which gives equal importance to distance-based information from TOPSIS and relational similarity from GRA. The results are reported in Table 4 and illustrated in Figure 4.
Table 4.
Sensitivity of composite resilience scores under alternative TOPSIS–GRA aggregation weights.
Figure 4.
Comparison of annual composite resilience values under alternative TOPSIS–GRA aggregation weights.
As shown in Table 4, the annual composite resilience values are highly stable under alternative reasonable specifications. Relative to the baseline, Pearson correlation coefficients range from 0.9969 to 1.0000, and Spearman rank correlations range from 0.9857 to 1.0000. In particular, the neighboring specifications (0.4,0.6) and (0.6,0.4) produce almost identical score series and fully preserve the annual ranking structure of the baseline. Across all non-extreme specifications, the minimum value always occurs in 2016, the maximum value always occurs in 2024, and the top-ranked years remain unchanged.
This result is also evident in Figure 4. Although the resilience values shift slightly across specifications, the overall temporal pattern remains highly consistent. All reasonable specifications retain the same broad trajectory identified in the baseline results, namely a fluctuating upward path with a clear trough during 2015–2016 and a marked rise after 2020. In other words, under alternative TOPSIS–GRA aggregation weights, the trough year remains concentrated in 2016, the peak year remains in 2024, and the overall W-shaped trajectory is preserved.
Overall, these results indicate that the equal-weight specification is not arbitrary. Rather, it provides a balanced and empirically stable compromise between TOPSIS and GRA. Since the main trend and annual ranking remain substantively unchanged under nearby alternative specifications, the baseline setting of (0.5,0.5) can be regarded as a reasonable choice for the composite resilience evaluation.
4.3.3. Comparison of the Benchmark Specification with Standard Alternative Methods
In addition to parameter sensitivity, we further compared the benchmark specification with three standard alternative methods to examine whether the main trends in resilience depend on the choice of weighting and aggregation strategy. Specifically, the benchmark series obtained from the improved entropy weight–TOPSIS–GRA framework was compared with (i) a standard entropy–TOPSIS, (ii) an entropy-weighted, and (iii) an equal-weight. The standard entropy–TOPSIS method uses the entropy weights reported in Table 2 without the independence correction. The entropy-weighted method aggregates the normalized indicators directly using entropy weights. The equal-weight method assigns identical weights to all 25 indicators.
The comparison results are reported in Table 5, and the annual resilience values series are shown in Figure 5. Overall, the benchmark and alternative methods display strong consistency in the main temporal pattern. The Pearson correlations between the benchmark series and the standard entropy–TOPSIS, entropy-weighted additive, and equal-weight series are 0.901, 0.951, and 0.970, respectively. The corresponding Spearman rank correlations are 0.618, 0.843, and 0.907. In all cases, the minimum value occurs in 2016, the maximum value occurs in 2024, and the top three years remain 2024, 2023, and 2022.
Table 5.
Benchmark comparison of the baseline hybrid method and alternative evaluation methods.
Figure 5.
Comparison of annual composite resilience values under alternative evaluation methods.
These results indicate that the main findings of the study are not driven by a single methodological specification. Although the absolute score levels vary across methods, the substantive conclusions remain unchanged, including the trough in 2016, the marked improvement after 2020, and the overall fluctuating upward trajectory. This suggests that the benchmark framework improves diagnostic richness without materially changing the core empirical pattern identified in the data.
In addition, two further robustness checks are reported in the Supplementary Materials, including a conservative alternative missing-data completion scheme and an alternative normalization rule based on z-score transformation with positive translation. Both tests produced annual composite resilience series that were highly consistent with the baseline results, with the minimum year, maximum year, and overall W-shaped temporal pattern unchanged (Supplementary Tables S3 and S4).
4.4. Dimension-Specific Evaluation of China’s Coal Supply Chain Resilience
A dimension-specific composite evaluation was conducted across the four capacities of China’s CSCR. The results are presented in Figure 6.
Figure 6.
Resilience values of various dimensions of China’s coal supply chain in 2010–2024.
Resistance capacity exhibited an upward trend and remained at a relatively high level (>0.50) during 2010–2013. As the industry entered a capacity-reduction cycle coupled with stringent environmental regulation during 2014–2020, investment contraction coincided with a decline in the resistance index to 0.39. After 2021, under the new national energy-security strategy that reaffirmed coal as the system’s “ballast,” accelerated construction of modern mines was accompanied by a rapid rebound of the resistance capacity index to 0.59.
Absorption capacity showed the most pronounced volatility. The index remained high (0.68–0.73) during 2010–2013 but fell sharply to 0.39 in 2016. This trough coincided with the first year of supply-side structural reform: large-scale capacity cuts disrupted the prevailing supply–demand balance in the short run and may have weakened the supply chain’s immediate buffering capability. With the exit of inefficient capacity and the reconfiguration of the supply–demand structure, the absorption index rebounded rapidly after 2017 and stabilized at approximately 0.60.
Recovery capacity was comparatively stable throughout the study period, remaining within a narrow band of 0.41–0.57 and stabilizing around 0.56 from 2012 onward. Supported by China’s comprehensive coal industrial system and mature logistics corridors (e.g., west-to-east and north-to-south coal transport networks), the coal supply chain maintained effective repair mechanisms and ensured production continuity, providing sustained support for national energy security.
Adaptive capacity increased steadily. During 2010–2016, the index remained near 0.26, consistent with industry-wide path dependence on scale expansion rather than innovation and lagging progress in the green transition. A turning point emerged in the later period of the 13th Five-Year Plan, when smart-mine deployment and clean-utilization technologies expanded, and adaptive capacity began to rise. The increase was especially marked in 2021–2024, when the index surged from 0.48 to 0.75, representing the fastest average annual growth among the four dimensions.
Radar charts were constructed for four benchmark years (2010, 2015, 2020, and 2024) to visualize the evolution of China’s CSCR’s internal structure (Figure 7). In 2010, the resilience profile was strongly skewed toward absorption capacity, with an absorption capacity index of 0.68; the indices for resistance, recovery, and adaptive capacities were 0.51, 0.41, and 0.26, respectively. This configuration suggests that, at that stage, stability was maintained primarily through passive buffering under relatively slack market conditions. From 2015 to 2020, the resistance capacity index declined sharply from 0.51 to a trough of 0.40, producing a pronounced inward contraction along the resistance axis, whereas absorption capacity remained consistently above 0.60. Over the same period, recovery capacity progressively reduced its shortfall, stabilizing at approximately 0.55 (from 0.57 in 2015 to 0.55 in 2020), and adaptive capacity also began to rise gradually. By 2024, the radar profile expanded outward and was substantially reshaped. Adaptive capacity increased to 0.76, becoming the dominant dimension, while resistance capacity rebounded to 0.60. Recovery capacity remained high at 0.56, and absorption capacity declined slightly to 0.60. Overall, all four dimensions were positioned in a high-value range, with values more tightly clustered and less dispersed across dimensions, indicating a clearer tendency toward structural convergence. Taken together, these results show that the center of China’s CSCR shifted from early reliance on resource endowment and favorable market conditions toward a configuration increasingly driven by adaptation and innovation, with the overall structure evolving from single-dimension support to a more multidimensional, coordinated resilience profile.
Figure 7.
Radar chart of the evolution of China’s coal supply chain resilience in 2010–2024.
4.5. Determinants of China’s Coal Supply Chain Resilience
To further interpret the mechanisms underlying the evolution of China’s CSCR, this section reports the results of the dual diagnostic framework introduced in Section 3.2.
4.5.1. Contribution Analysis for Resistance Capacity
As shown in Figure 8, the diagram depicts the degree of influence of various factors on resistance capacity. During 2010–2015, fixed asset investment in the coal industry and industry debt levels were the dominant contributors to resistance capacity. Fixed asset investment in the coal industry peaked at CNY 537.02 billion in 2012, accounting for 22.29%. During 2016–2020, the coal reserve-to-production ratio maintained a persistently high contribution of 18–20%. Over the same period, industry debt levels remained stable, with a mean contribution of 18.25%, and continued to be a major contributor to resistance capacity. During 2021–2024, industry profitability became the leading driver: supported by “supply assurance” policies and coal prices returning to a more reasonable range, the industry profit margin reached 25.57% in 2022, and its contribution increased to 22.02%, indicating that stronger cash-flow generation provided material financial slack against external shocks. The contribution of fixed asset investment in the coal industry rose again to 22.75%, with the composition shifting toward higher-quality investment such as intelligent upgrading. In addition, the contribution of the emergency coal reserve scale increased steadily from 6.77% in the early period to 16.89%, underscoring the backstop role of physical reserves under heightened uncertainty.
Figure 8.
Contributions of individual indicators to resistance capacity.
4.5.2. Contribution Analysis for Absorption Capacity
As shown in Figure 9, during 2010–2015, import concentration and the supply–demand gap ratio were the primary contributors to absorption capacity. Import concentration contributed an average of 23% or more, reaching 35.18% in 2012. In that year, import concentration fell to a historical low of 0.0997, consistent with diversification of import channels that reduced single-source supply risk and strengthened the external buffer for the domestic market. The supply–demand gap ratio was 0.05% in 2014, accounting for 30.24%. After 2016, the share of substitutable energy consumption increased steadily; this share rose from 30.8% in 2010 to 46.8% in 2024, indicating that energy-structure adjustment increasingly offset coal supply pressure and improved substitutability under shocks through a more complementary multi-energy mix. Price volatility declined to 1.82% in 2024, with a contribution of 25.85%, indicating strengthened price stability under intensive “supply assurance and price stabilization” interventions.
Figure 9.
Contributions of individual indicators to absorption capacity.
4.5.3. Contribution Analysis for Recovery Capacity
As shown in Figure 10, during 2010–2015, the workforce security scale and working-capital turnover ratio were the leading contributors to recovery capacity. Workforce security scale accounted for 28.61% of total contributions in 2010, when average coal-industry employment was 5.27 million. The working-capital turnover ratio contributed 26.52% over the same period, capturing a recovery pattern characterized by a large workforce base and rapid capital cycling to restore production after disruptions. During 2016–2020, the contribution of work safety performance increased sharply; the fatality rate per million tonnes remained below 0.1 after 2017. This pattern aligned with intensified national coal-mine safety regulation and indicated that high safety assurance became a prerequisite for rapid recovery from shocks. During 2021–2024, the recovery capacity mechanism shifted toward logistics-based support. The contribution of logistics turnover capacity increased to 15.73%, and together with railway and road network density, these indicators accounted for more than 45% of the total contribution. This result may reflect the role of dense transport networks and dispatching capability in enabling rapid cross-regional reallocation and replenishment through multimodal logistics after disruptions.
Figure 10.
Contributions of individual indicators to recovery capacity.
4.5.4. Contribution Analysis for Adaptive Capacity
As shown in Figure 11, during 2010–2015, the comprehensive utilization rate of solid waste reached a peak contribution of 31.79% in 2010, corresponding to a utilization rate of 75.6%. Over this period, coal enterprises primarily relied on end-of-pipe measures—such as improving gangue and mine-water utilization—to adapt to tightening environmental regulation; the contribution of the number of coal-industry patent applications was only 7.13%, indicating a limited role of substantive technological innovation. During 2016–2020, as supply-side structural reform deepened, R&D expenditure intensity in the coal industry became the largest driver, consistent with a shift from capacity reduction toward structural optimization and increased investment in technological development to support endogenous growth. Meanwhile, the contribution of labor productivity per employee rose markedly to 17.73%, indicating efficiency gains associated with phasing out inefficient capacity and technical upgrading, and a departure from labor-intensive expansion. During the 14th Five-Year Plan period, the share of intelligent coal production capacity increased from 0% in the early years to 50% by 2024, reflecting deep integration of next-generation information technologies with the coal sector. Labor productivity per employee maintained a stable contribution above 14%, consistent with continued efficiency release from intelligent upgrading and a step change in adaptive capacity.
Figure 11.
Contributions of individual indicators to adaptive capacity.
4.5.5. Obstacle Degree Analysis
We used the obstacle degree model to quantify challenges for each indicator from 2010 to 2024 and identify key constraints on resilience improvement (Figure 12 and Figure 13). A larger obstacle degree indicates that the corresponding indicator remains farther from its desirable state after accounting for its importance in the evaluation system and therefore exerts a stronger constraining effect on the overall resilience level. The results showed clear structural shifts in constraints at different stages.
Figure 12.
Trends in obstacle levels across dimensions from 2010 to 2024.
Figure 13.
Trends in tertiary indicator obstacle levels from 2010 to 2024.
At the first-dimensional scale (Figure 12), adaptive capacity had the highest mean obstacle degree (33.97%) across the full sample, indicating that it was the most persistent binding constraint in the overall resilience system. This exceeded those of the other three subsystems and remained the primary bottleneck before 2020. Longer-term constraints in technological upgrading, intelligent transformation, and green transition were more prominent than the short-term issues of absorption and recovery capacity. After 2020, obstacles to adaptive capacity continued to decline. Recovery capacity ranked second, with a mean obstacle degree of 27.40%. This was mainly associated with workforce supply and logistics turnover efficiency. The degree of resistance capacity increased after 2021, showing new challenges in resource reserves and capacity succession due to higher “supply assurance” requirements. Absorption capacity had the lowest mean obstacle degree (13.84%). This is consistent with relatively robust buffering against supply–demand fluctuations, supported by market adjustments and a diversified, complementary energy system.
At the tertiary indicator scale (Figure 13), obstacles were highly concentrated from 2010 to 2015. The biggest ones were the share of intelligent coal production capacity (mean 11.55%), labor productivity per employee (mean 8.09%), R&D expenditure intensity in the coal industry (mean 7.48%), mechanization level of coal mining (mean 6.15%), and carbon emissions intensity (mean 6.07%). During 2016–2020, supply-side structural reform was fully implemented. Obstacle factors then became more differentiated. The share of intelligent coal production capacity (mean 10.19%) and labor productivity per employee (mean 6.54%) remained major constraints. Workforce security scale (mean 7.67%), comprehensive utilization rate of solid waste (mean 6.58%), and fixed asset investment in the coal industry (mean 6.45%) entered the top five. These changes are consistent with factor-supply pressures associated with investment contraction and workforce reallocation during the capacity-reduction period. From 2021 onward, the constraint structure reversed. The workforce security scale (mean 14.96%) ranked first for 4 years in a row. It was followed by the working-capital turnover ratio (mean 10.97%) and the coal reserve-to-production ratio (mean 9.25%). This suggests that labor force security, liquidity turnover, and resource–capacity continuity became the main constraints in the later period.
5. Discussion
5.1. Comparison with the Previous Literature
This study adds to the literature on coal supply chains, energy security, and resilience assessment by showing that China’s CSCR followed a fluctuating but overall upward W-shaped trajectory from 2010 to 2024, with a more evident increase after 2020. Even though there is currently limited research literature on China’s CSCR, we have found connections with some relevant research literature. This pattern is broadly consistent with the W-shaped evolution of China’s energy security reported by Wang et al. [3], suggesting that the temporal patterns of China’s CSCR and broader energy security are broadly comparable. The findings are also broadly in line with recent studies on the resilience of coal and mineral industrial and supply chains. Wu et al. identified a fluctuating upward trend in the resilience of China’s coal industrial chain and supply chain and highlighted recovery and renewal capacities as important drivers of long-term improvement [18]. Zhu et al. reported a similar pattern for China’s copper resource industrial chain and supply chain, where weak resistance constrained overall resilience and recovery and renewal became the main channels of improvement [23]. Taken together, these studies and our results suggest that fluctuating improvement is a common feature of resilience evolution in resource-based supply chains.
A further contribution of this study is that it links CSCR more directly to the broader energy resilience literature. Previous studies argue that resilience should be treated as a multidimensional property involving resistance, recovery, and longer-term adaptation, rather than as a single indicator of security [5,61]. Our findings support this view. Indicators related to resource guarantee, logistics and transportation, market stability, and innovation-driven development do not move in parallel, and their relative importance changes across policy stages. This helps explain why self-sufficiency or resource endowment alone cannot adequately capture supply security [1,62,63]. The obstacle analysis further shows that, under the dual-carbon agenda, the main constraints on resilience are shifting from traditional supply-side factors to innovation- and transition-related variables. This suggests that energy security and low-carbon transition should not be treated as inherently conflicting objectives in the coal sector. Instead, resilience increasingly depends on whether the system can adapt to simultaneous policy, technological, and market change. It is worth noting that the comprehensive evaluation indicator system for China’s CSCR constructed in this study aims to assess the structure and evolution of resilience capabilities at the national annual scale, rather than to identify resilience changes and causal relationships under a specific shock event. Even so, the consistency between our findings and those of related studies on coal industrial chain and supply chain [18], copper industrial chain and supply chain [23], and energy-system [3] resilience strengthens confidence in the pattern identified here and shows the value of a resilience-based approach for assessing coal supply security under conditions of transition.
5.2. Policy Implications
Based on the empirical evidence above, policy should prioritize an energy security-oriented transition pathway. The aim is to strengthen CSCR and advance China’s “dual-carbon” targets. This approach should maintain the coal industry and its supply system as autonomous, controllable, safe, and reliable.
Firstly, resilience-oriented policy should strengthen resistance capacity by institutionalizing appropriate redundancy. It should also establish a diversified resource-security architecture. Regulators should take advantage of the current profitability window to encourage firms to build adequate financial buffers. They should reduce leverage and improve liquidity management to help firms withstand extreme market shocks. At the same time, refine the capacity-reserve regime by planning and constructing dispatchable reserve capacity at core production bases, such as Shanxi, Shaanxi, Inner Mongolia, and Xinjiang. This would help ensure that output can be ramped up rapidly in the event of disruptions.
Secondly, policy should stabilize absorption capacity by upgrading market-adjustment mechanisms, thereby dampening the transmission of supply–demand fluctuations. The absorption phase shows high volatility, so the “production–transport–demand” coordination mechanism should be strengthened. Medium- and long-term contracts should serve as an institutional anchor. Enforcement of thermal-coal contract performance should be strengthened. A well-functioning “benchmark price + floating premium” pricing scheme should be consolidated to reduce the pass-through of international energy price shocks into the domestic market. In addition, by leveraging the Belt and Road Initiative, China should deepen strategic partnerships with coal-rich countries. It should expand import channels and build a diversified, decentralized import-supply network to avoid excessive reliance on a single source country.
Thirdly, policy should enhance recovery capacity by improving logistics resilience and emergency responsiveness. This will ensure uninterrupted production, transport, and sales circulation. Strategic corridors like “west-to-east coal transport” and “north-to-south coal transport” should be used to optimize the multimodal collection–distribution system and remove logistics bottlenecks. To address risks from extreme disruptions, a cross-regional and cross-agency supply chain emergency coordination mechanism should be established, supported by tiered contingency plans. Intensify risk monitoring at critical logistics nodes and strengthen rapid restoration capability under disaster weather. This helps quickly reconnect physical disconnections and safeguard energy-system stability. In parallel, a strategy to upgrade workforce quality should be implemented. As employment declines, training should accelerate for new industrial workers skilled in intelligent longwall mining and related digital operations.
Finally, policy should consolidate momentum behind resilience upgrading. This can be achieved by accelerating digital intelligence and the green transition, thereby strengthening adaptive capacity. Next-generation information technologies must be more deeply integrated with coal operations. Smart-mine deployment should expand from isolated intelligent working faces to include mine-wide and supply-chain-wide digital sensing and decision-making. Big-data platforms should enhance supply-chain transparency and response speed. Policy should address dual-carbon constraints and energy security in an integrated manner. It should also scale up breakthroughs in clean and efficient coal utilization, ecological restoration in mining areas, and comprehensive use of solid waste. These steps will expand the sector’s development space and reduce compliance risks as environmental regulation tightens.
5.3. Limitations
It is acknowledged that this study has several limitations. First, the analysis relies on annual national-level data and therefore cannot capture provincial heterogeneity, corridor-level disruptions, or short-term recovery dynamics. Second, owing to data availability constraints, this study covers only the period 2010–2024 and is therefore based on a relatively small sample. Although the number of missing data values is limited, some sensitivity to data completion cannot be fully ruled out. Third, the present study does not attempt formal time-series identification of dynamic dependence or structural breaks. More advanced time-series techniques, such as Box–Jenkins methods, ARIMA-type models, or structural break tests, may help identify the temporal mechanisms behind resilience change more explicitly, but they lie beyond the scope of the present composite-indicator study and are left for future research. Future research should also integrate provincial panel data, event-level disruption records, and network-based analysis to identify resilience mechanisms more precisely.
6. Conclusions
This study provides a rigorous, capacity-based assessment of China’s CSCR. It did so by (i) developing a four-dimensional framework—resistance, absorption, recovery, and adaptive—operationalized through 25 tertiary indicators; (ii) constructing an integrated evaluation model that coupled entropy weight corrected by independence weight with TOPSIS and GRA; and (iii) deploying indicator contribution degree and obstacle degree model to pinpoint, with temporal resolution, the factors that strengthen or constrain resilience. Using national data for 2010–2024, we delivered a quantitative reconstruction of resilience evolution and a mechanism-oriented explanation of its drivers. Five principal findings emerge from the analysis.
Firstly, the composite index of China’s CSCR ranged from 0.3906 to 0.6325. It followed a fluctuating, W-shaped trajectory, moving from low-level oscillations toward a mid-to-high range. The index bottomed out in 2015–2016, attaining its maximum in 2024.
Secondly, in terms of resistance capacity, early resilience mainly relied on fixed asset investment in the coal industry and industry debt levels. The coal reserve-to-production ratio contributed most during 2016–2020. Since the 14th Five-Year Plan period, industry profitability and emergency coal reserve scale have become decisive contributors.
Thirdly, absorption capacity stayed high but volatile. The supply–demand gap ratio remained low and was always a major factor. The share of substitutable energy consumption shifted from a constraint before 2016 to a contributor after 2016, as a multi-energy complementary structure developed. The coal self-sufficiency rate remained stable throughout.
Fourthly, recovery capacity increased steadily. Its dominant supports transitioned from workforce security scale inputs to logistics transportation capability and work safety performance. As labor shedding and efficiency gains progressed, the contribution of workforce security scale declined. Railway network density, logistics turnover capacity, and work safety performance became more important.
Fifthly, adaptive capacity was the most persistent long-run bottleneck, but it rose steadily and accelerated after 2020. Obstacle degree results show that before 2020, the share of intelligent coal production capacity was the main constraint. After it reached 50% in 2024, this share became the strongest contributor to adaptive resilience, marking a shift from incremental improvement to capability upgrading.
Supplementary Materials
The following supporting information can be downloaded at https://www.mdpi.com/article/10.3390/en19092095/s1, Table S1: Indicator theoretical role, polarity setting and directional rationale; Table S2: Missing-data pattern and imputation details; Table S3: Sensitivity of composite resilience scores under a conservative alternative missing-data completion scheme; Table S4: Sensitivity of composite resilience scores under alternative normalization schemes.
Author Contributions
Writing and editing of the paper, J.T.; visualization and review of the paper, G.J. proposal of the original idea, conception, J.Z. All authors have read and agreed to the published version of the manuscript.
Funding
This research and the Article Processing Charge (APC) were funded by the Science Foundation of Ministry of Education of China (22YJA630100).
Data Availability Statement
The data that support the findings of this study are available from the corresponding author upon reasonable request.
Conflicts of Interest
The authors declare no conflicts of interest.
References
- Ren, J.; Sovacool, B.K. Quantifying, Measuring, and Strategizing Energy Security: Determining the Most Meaningful Dimensions and Metrics. Energy 2014, 76, 838–849. [Google Scholar] [CrossRef] [Scilit]
- Zhang, Y.; Zhu, R. Energy Supply Security across Chinese Provinces: Assessing Regional Disparities and Convergence Dynamics. Sustain. Futures 2025, 10, 101522. [Google Scholar] [CrossRef] [Scilit]
- Wang, D.; Tian, S.; Fang, L.; Xu, Y. A Functional Index Model for Dynamically Evaluating China’s Energy Security. Energy Policy 2020, 147, 111706. [Google Scholar] [CrossRef] [Scilit]
- Zhou, H. Driving China’s Green, Low-Carbon and High-Quality Energy Development with New Quality Productive Forces. China Coal 2025, 51, 133–141. [Google Scholar] [CrossRef]
- Ahmadi, S.; Saboohi, Y.; Vakili, A. Frameworks, Quantitative Indicators, Characters, and Modeling Approaches to Analysis of Energy System Resilience: A Review. Renew. Sustain. Energy Rev. 2021, 144, 110988. [Google Scholar] [CrossRef] [Scilit]
- Su, R.; Chen, B.; Wang, S.; Duan, C. Energy Technical Resilience Assessment Based on Complex Network Analysis–A Case Study of China. Appl. Energy 2024, 364, 123231. [Google Scholar] [CrossRef] [Scilit]
- Liu, Y.; Wang, J. Risk Analysis and Resilience Assessment of China’s Oil Imports after the Ukraine Crisis: A Network-Based Dynamics Model. Energy 2024, 299, 131502. [Google Scholar] [CrossRef] [Scilit]
- Su, X.; Zhao, S.; Li, W.; Fan, W. Geopolitical Risks and Resilience Strategies in Driving Investment in Clean Energy Infrastructure along the Belt and Road Initiative. Int. Rev. Econ. Financ. 2025, 104, 104611. [Google Scholar] [CrossRef] [Scilit]
- Jasiūnas, J.; Lund, P.D.; Mikkola, J. Energy System Resilience–A Review. Renew. Sustain. Energy Rev. 2021, 150, 111476. [Google Scholar] [CrossRef] [Scilit]
- Fan, W.; Lv, W.; Wang, Z. How to Measure and Enhance the Resilience of Energy Systems? Sustain. Prod. Consum. 2023, 39, 191–202. [Google Scholar] [CrossRef] [Scilit]
- Cao, Y.; Zhao, Y.; Wen, L.; Li, Y.; Li, H.; Wang, S.; Liu, Y.; Shi, Q.; Weng, J. System Dynamics Simulation for CO2 Emission Mitigation in Green Electric-Coal Supply Chain. J. Clean. Prod. 2019, 232, 759–773. [Google Scholar] [CrossRef] [Scilit]
- Li, J.; Wang, L.; Tan, X. Sustainable Design and Optimization of Coal Supply Chain Network under Different Carbon Emission Policies. J. Clean. Prod. 2020, 250, 119548. [Google Scholar] [CrossRef] [Scilit]
- Wang, B.; Wang, Y.; Cui, L.; Xie, K. Supply Chain Coordination Mechanisms of Coal Power Enterprises under Renewable Energy Quota System: A Perspective of Game Analysis. J. Clean. Prod. 2023, 426, 139108. [Google Scholar] [CrossRef] [Scilit]
- Ma, J.; Yuan, Y.; Zhao, S.; Wu, W. Research on Sustainability Evaluation of China’s Coal Supply Chain from the Perspective of Dual Circulation New Development Pattern. Sustainability 2022, 14, 9129. [Google Scholar] [CrossRef] [Scilit]
- Zeng, L.; Liu, S.Q.; Kozan, E.; Burdett, R.; Masoud, M.; Chung, S.-H. Designing a Resilient and Green Coal Supply Chain Network under Facility Disruption and Demand Volatility. Comput. Ind. Eng. 2023, 183, 109476. [Google Scholar] [CrossRef] [Scilit]
- Yu, Z.; Li, Z.; Ma, L. Strategies for the Resilience of Power-Coal Supply Chains in Low-Carbon Energy Transition: A System Dynamics Model and Scenario Analysis of China up to 2060. Sustainability 2023, 15, 7154. [Google Scholar] [CrossRef] [Scilit]
- Wu, A.; Sun, Y.; Zhang, H.; Sun, L.; Wang, X.; Li, B. Research on Resilience Evaluation of Coal Industrial Chain and Supply Chain Based on Interval Type-2F-PT-TOPSIS. Processes 2023, 11, 566. [Google Scholar] [CrossRef] [Scilit]
- Wu, A.; Ma, D.; Sun, L.; Su, C.; Ma, X.; Wang, X. Coordinated Development of China’s Coal Industrial Chain and Supply Chain Resilience Evaluation and Industrial Efficiency under the Dual Carbon Goals. Sustain. Energy Technol. Assess. 2025, 81, 104434. [Google Scholar] [CrossRef] [Scilit]
- Yang, C.; Zheng, X.; Dai, C.; Li, D.; Liu, L.; Fang, L.; Tian, H.; Shao, T.; Zhang, J. Risk Assessment of Coal Supply Chain Based on Analytic Hierarchy Process and Fuzzy Comprehensive Evaluation. Heliyon 2025, 11, e42629. [Google Scholar] [CrossRef] [Scilit]
- Wang, Y.; Li, M.; Sun, L.; Liu, J.; Wang, Y. Resilience Factors and Mechanisms in the Coal Power Supply Chain: A Quantitative Analysis Using Fuzzy DEMATEL, ISM, and ANP Methods. PLoS ONE 2025, 20, e0322952. [Google Scholar] [CrossRef] [Scilit]
- Zhong, S.; Chen, J.; Ning, R. Analysis of Key Risk Factors in the Thermal Coal Supply Chain. Energies 2025, 18, 5800. [Google Scholar] [CrossRef] [Scilit]
- Zhang, Z.; Wang, X. Evolutionary Game Analysis of Coal Industry Chain Supply Chain Risk Prevention and Control from the Perspective of Resilience. Sustain. Futures 2025, 9, 100678. [Google Scholar] [CrossRef] [Scilit]
- Zhu, Y.; Zhang, W.; Wang, D.; Dou, S.; Xu, D. Resilience Evaluation of China’s Copper Resources Industrial Chain and Supply Chain. Resour. Sci. 2023, 45, 1761–1777. [Google Scholar] [CrossRef] [Scilit]
- Dai, R.; Xiao, C.; Liang, X.; Yang, W.; Chen, J.; Zhang, L.; Zhang, J.; Yao, J.; Jiang, Y.; Wang, W. Spatial-Temporal Evolution Law Analysis of Resource and Environment Carrying Capacity Based on Game Theory Combination Weighting and GMD-GRA-TOPSIS Model. Evidence from 18 Cities in Henan Province, China. J. Clean. Prod. 2024, 439, 140820. [Google Scholar] [CrossRef] [Scilit]
- Lan, T.; Shao, L. Resilience Evaluation of Industry and Supply Chains of Clean Energy Metals in China. Resour. Sci. 2025, 47, 891–906. [Google Scholar] [CrossRef] [Scilit]
- Chen, X.; Yu, L.; Lin, W.; Yang, F.; Li, Y.; Tao, J.; Cheng, S. Urban Resilience Assessment from the Multidimensional Perspective Using Dynamic Bayesian Network: A Case Study of Fujian Province, China. Reliab. Eng. Syst. Saf. 2023, 238, 109469. [Google Scholar] [CrossRef] [Scilit]
- Zhang, C.; Wang, Y.; Zheng, T.; Zhang, K. Complex Network Theory-Based Optimization for Enhancing Resilience of Large-Scale Multi-Energy System1. Appl. Energy 2024, 370, 123593. [Google Scholar] [CrossRef] [Scilit]
- Ding, Y.; Chen, S.; Zheng, Y.; Chai, S.; Nie, R. Resilience Assessment of China’s Natural Gas System under Supply Shortages: A System Dynamics Approach. Energy 2022, 247, 123518. [Google Scholar] [CrossRef] [Scilit]
- Yang, Z.; Li, X.; Xiang, Q.; He, Q.; Faber, M.H.; Zio, E.; Su, H.; Zhang, J. A Resilience Evaluation Method of Natural Gas Pipeline System Based on Uncertainty Analysis. Process. Saf. Environ. Prot. 2023, 177, 891–908. [Google Scholar] [CrossRef] [Scilit]
- Liang, H.; Moya, B.; Chinesta, F.; Chatzi, E. Quantifying the Value of Seismic Structural Health Monitoring for Post-Earthquake Recovery of Electric Power System in Terms of Resilience Enhancement. Reliab. Eng. Syst. Saf. 2026, 273, 112292. [Google Scholar] [CrossRef] [Scilit]
- Liu, X.; Owen, J.S.; Xie, Q.; Wang, T. Resilience Improvement Framework Based on Strategy Optimization of Power Systems to Typhoons. Reliab. Eng. Syst. Saf. 2026, 267, 111855. [Google Scholar] [CrossRef] [Scilit]
- Song, M.; Wang, Z.; Chi, L.; Wang, R.; Zhu, M. Study on Short-Term Natural Gas System Resilience under Import Shortage Shocks. Energy 2025, 328, 136643. [Google Scholar] [CrossRef] [Scilit]
- Chen, S.; Ding, Y.; Song, Y.; Zhang, M.; Nie, R. Study on China’s Energy System Resilience under the Scenarios of Long-Term Shortage of Imported Oil. Energy 2023, 270, 126831. [Google Scholar] [CrossRef] [Scilit]
- Botelho, A.B., Jr.; Kim, J. Recycling of Superalloys: Circular Strategies for Critical Mineral Supply Chain Resilience. Resour. Conserv. Recycl. 2026, 229, 108859. [Google Scholar] [CrossRef] [Scilit]
- Heydari, M.; Mitchell, P.; Cullen, L.; Andrieu, B.; Serrenho, A.C.; Cullen, J. A Systematic Review of Resilience in the Critical Minerals Supply Chains, Needed for the Low-Carbon Energy Transition. Renew. Sustain. Energy Transit. 2025, 8, 100127. [Google Scholar] [CrossRef] [Scilit]
- Dogan, M. From Risk to Resilience: Wavelet–Quantile Evidence on Geopolitical Shocks and Clean Energy Markets. J. Environ. Manag. 2025, 394, 127577. [Google Scholar] [CrossRef] [Scilit] [PubMed]
- Wu, A.; Li, P.; Sun, L.; Su, C.; Wang, X. Evaluation Research on Resilience of Coal-to-Liquids Industrial Chain and Supply Chain. Systems 2024, 12, 395. [Google Scholar] [CrossRef] [Scilit]
- Ding, Y.; Zhang, M.; Chen, S.; Nie, R. Assessing the Resilience of China’s Natural Gas Importation under Network Disruptions. Energy 2020, 211, 118459. [Google Scholar] [CrossRef] [Scilit]
- Li, P.; He, Q.; Zhang, J.; Xia, Q. Analyzing the Impact of Energy Synergy and Renewable Energy Generation on Energy Security: Empirical Evidence from China’s Yangtze River Delta Region. Energy 2024, 302, 131868. [Google Scholar] [CrossRef] [Scilit]
- Wang, J.; Shahbaz, M.; Song, M. Evaluating Energy Economic Security and Its Influencing Factors in China. Energy 2021, 229, 120638. [Google Scholar] [CrossRef] [Scilit]
- Chi, L.; Zhou, S.; Chen, C.; Wang, J.; Liang, Y. Evaluation method for the security resilience of China’s natural gas system. Oil Gas Storage Transp. 2025, 44, 1308–1319. [Google Scholar] [CrossRef]
- Elshkaki, A.; Shen, L. Energy-Material Nexus: The Impacts of National and International Energy Scenarios on Critical Metals Use in China up to 2050 and Their Global Implications. Energy 2019, 180, 903–917. [Google Scholar] [CrossRef] [Scilit]
- Li, P.; Yu, H.; Zhang, J.; Du, M.; Xiong, J. Coal Supply Sustainability in China: A New Comprehensive Evaluation Methodology. Front. Energy Res. 2021, 9, 701719. [Google Scholar] [CrossRef] [Scilit]
- Li, P.; Zhang, J.; He, Q.; Xia, Q. Security Assessment and Heterogeneity of China’s Energy Supply under Carbon Peaking Goals. J. Beijing Inst. Technol. (Soc. Sci. Ed.) 2024, 26, 51–63. [Google Scholar] [CrossRef]
- Atieh Ali, A.A.; Sharabati, A.-A.A.; Allahham, M.; Nasereddin, A.Y. The Relationship between Supply Chain Resilience and Digital Supply Chain and the Impact on Sustainability: Supply Chain Dynamism as a Moderator. Sustainability 2024, 16, 3082. [Google Scholar] [CrossRef] [Scilit]
- Ding, Y.; Fu, Y.; Lai, K.K.; John Leung, W.K. Using Ranked Weights and Acceptability Analysis to Construct Composite Indicators: A Case Study of Regional Sustainable Society Index. Soc. Indic. Res. 2018, 139, 871–885. [Google Scholar] [CrossRef] [Scilit]
- Chen, P. Effects of the Entropy Weight on TOPSIS. Expert Syst. Appl. 2021, 168, 114186. [Google Scholar] [CrossRef] [Scilit]
- Meng, S. Selection of Weighting Factors in Multi-Indicator Comprehensive Evaluation. Stat. Res. 1993, 69–71. [Google Scholar] [CrossRef]
- Tang, J.; Zhu, H.; Liu, Z.; Jia, F.; Zheng, X. Urban Sustainability Evaluation under the Modified TOPSIS Based on Grey Relational Analysis. Int. J. Environ. Res. Public Health 2019, 16, 256. [Google Scholar] [CrossRef] [Scilit]
- Dong, H.; Yang, K.; Bai, G. Evaluation of TPGU Using Entropy-Improved TOPSIS-GRA Method in China. PLoS ONE 2022, 17, e0260974. [Google Scholar] [CrossRef] [Scilit] [PubMed]
- Wang, K.; Feng, G.; Shi, Q.; Zeng, S. An Entropy-GRA-TOPSIS Model for Evaluating the Quality of Enterprises’ Green Information Disclosure from the Perspective of Green Financing. Granul. Comput. 2023, 8, 1783–1797. [Google Scholar] [CrossRef] [Scilit]
- Aguinis, H.; Gottfredson, R.K.; Joo, H. Best-Practice Recommendations for Defining, Identifying, and Handling Outliers. Organ. Res. Methods 2013, 16, 271–301. [Google Scholar] [CrossRef] [Scilit]
- Baranitharan, P.; Ramesh, K.; Sakthivel, R. Multi-Attribute Decision-Making Approach for Aegle marmelos Pyrolysis Process Using TOPSIS and Grey Relational Analysis: Assessment of Engine Emissions through Novel Infrared Thermography. J. Clean. Prod. 2019, 234, 315–328. [Google Scholar] [CrossRef] [Scilit]
- Jiang, S.; Xiao, S.; Chu, H.; Zhao, F.; Yu, Z.; Zhou, X.; Zhang, Y. Intelligent Mitigation of Fouling by Means of Membrane Vibration for Algae Separation: Dynamics Model, Comprehensive Evaluation, and Critical Vibration Frequency. Water Res. 2020, 182, 115972. [Google Scholar] [CrossRef] [Scilit] [PubMed]
- Shi, H.; Hu, Y.; Gan, L. Assessing urban resilience based on production-living-ecological system using degree of coupling coordination: A case of Sichuan. PLoS ONE 2024, 19, e0304002. [Google Scholar] [CrossRef] [Scilit] [PubMed]
- Feng, Z.; Yang, X.; Li, S. New Insights of Eco-Environmental Vulnerability in China’s Yellow River Basin: Spatio-Temporal Pattern and Contributor Identification. Ecol. Indic. 2024, 167, 112655. [Google Scholar] [CrossRef] [Scilit]
- Fan, Y.; Fang, C. Evolution Process and Obstacle Factors of Ecological Security in Western China, a Case Study of Qinghai Province. Ecol. Indic. 2020, 117, 106659. [Google Scholar] [CrossRef] [Scilit]
- Wang, D.; Shen, Y.; Zhao, Y.; He, W.; Liu, X.; Qian, X.; Lv, T. Integrated Assessment and Obstacle Factor Diagnosis of China’s Scientific Coal Production Capacity Based on the PSR Sustainability Framework. Resour. Policy 2020, 68, 101794. [Google Scholar] [CrossRef] [Scilit]
- Ou, Z.; Zhu, Q.; Sun, Y. Regional Ecological Security and Diagnosis of Obstacle Factors in Underdeveloped Regions: A Case Study in Yunnan Province, China. J. Mt. Sci. 2017, 14, 871–884. [Google Scholar] [CrossRef] [Scilit]
- Nardo, M.; Saisana, M.; Saltelli, A.; Tarantola, S.; Hoffmann, A.; Giovannini, E. Handbook on Constructing Composite Indicators: Methodology and User Guide; OECD Statistics Working Papers; OECD Publishing: Paris, France, 2005. [Google Scholar] [CrossRef]
- Sharifi, A.; Yamagata, Y. Principles and Criteria for Assessing Urban Energy Resilience: A Literature Review. Renew. Sustain. Energy Rev. 2016, 60, 1654–1677. [Google Scholar] [CrossRef] [Scilit]
- Ang, B.W.; Choong, W.L.; Ng, T.S. Energy Security: Definitions, Dimensions and Indexes. Renew. Sustain. Energy Rev. 2015, 42, 1077–1093. [Google Scholar] [CrossRef] [Scilit]
- Ang, B.W.; Choong, W.L.; Ng, T.S. A Framework for Evaluating Singapore’s Energy Security. Appl. Energy 2015, 148, 314–325. [Google Scholar] [CrossRef] [Scilit]
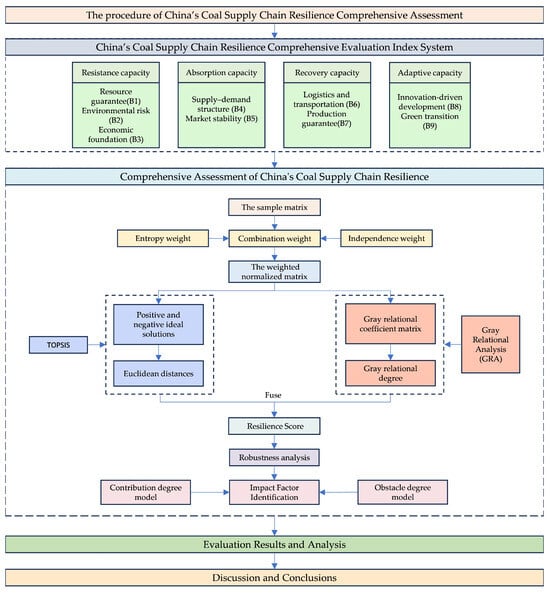
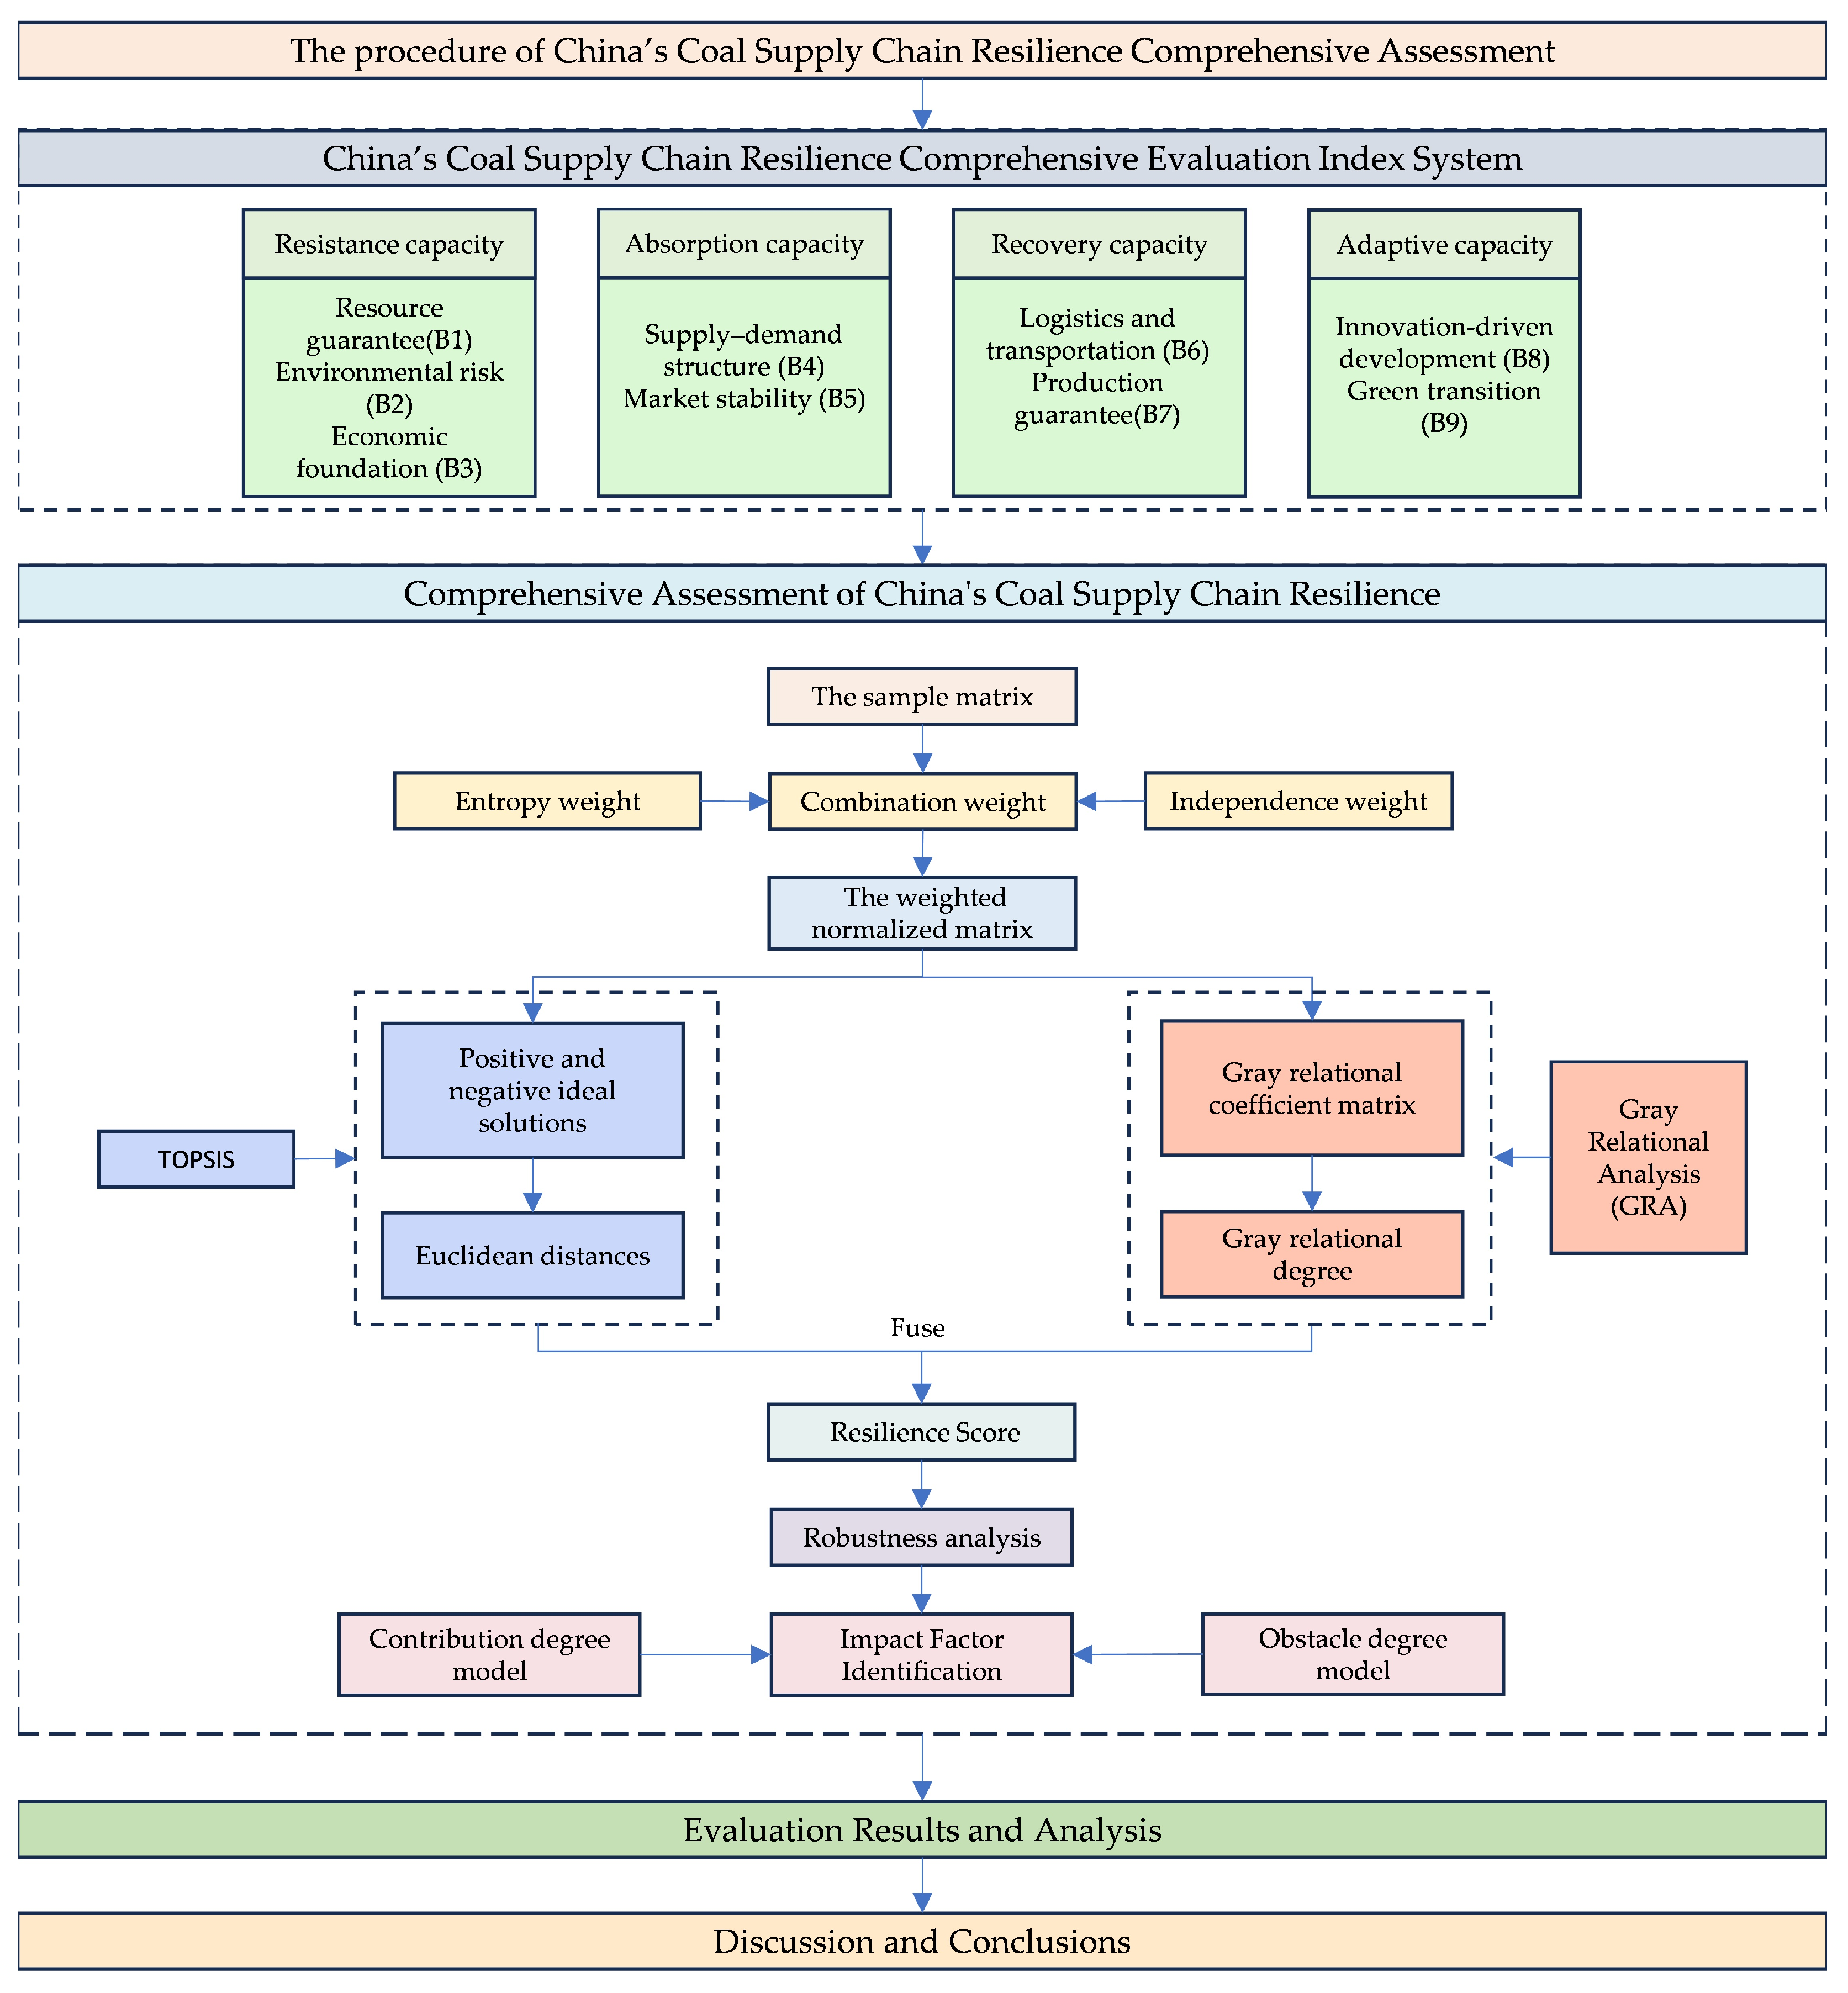
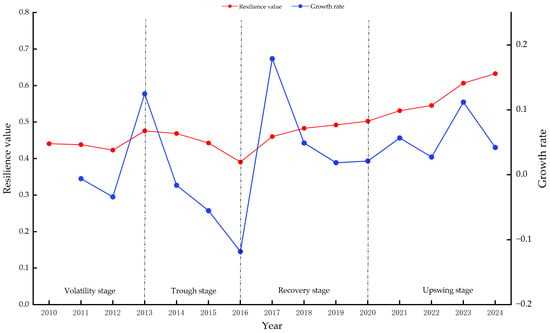
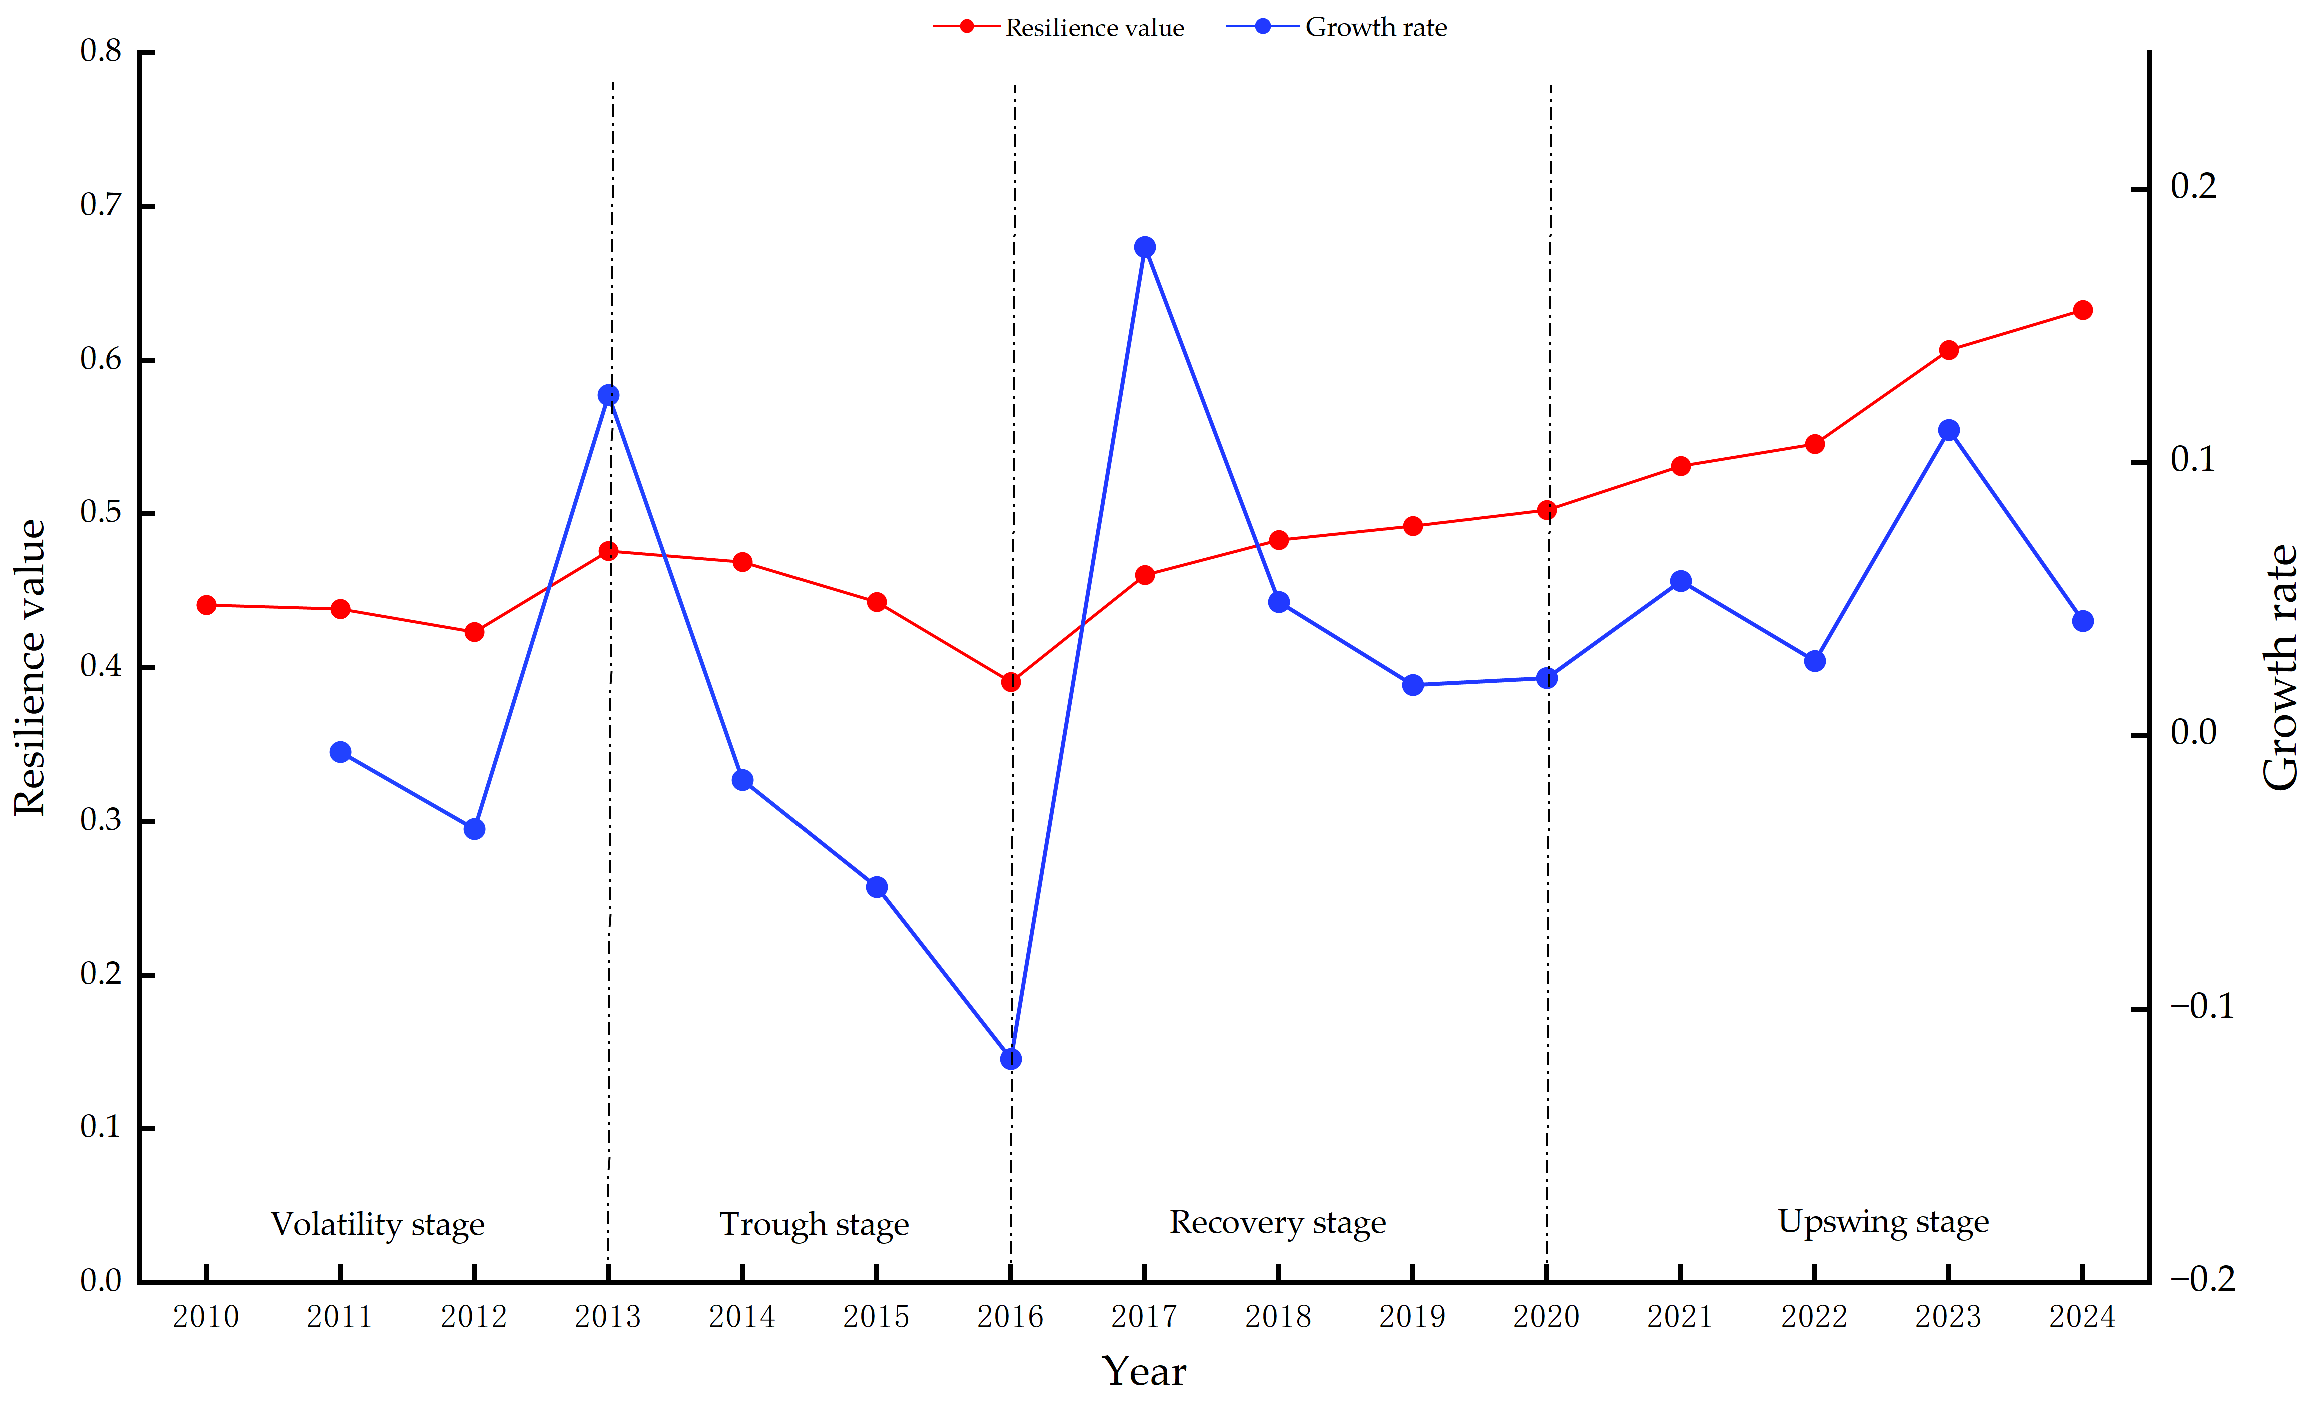
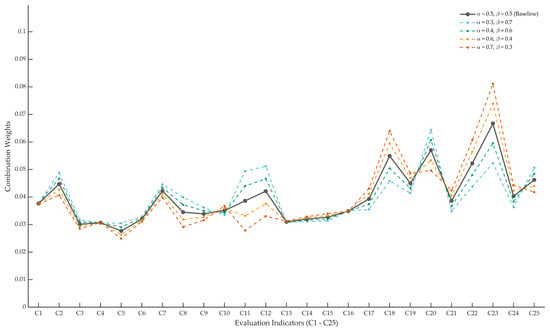
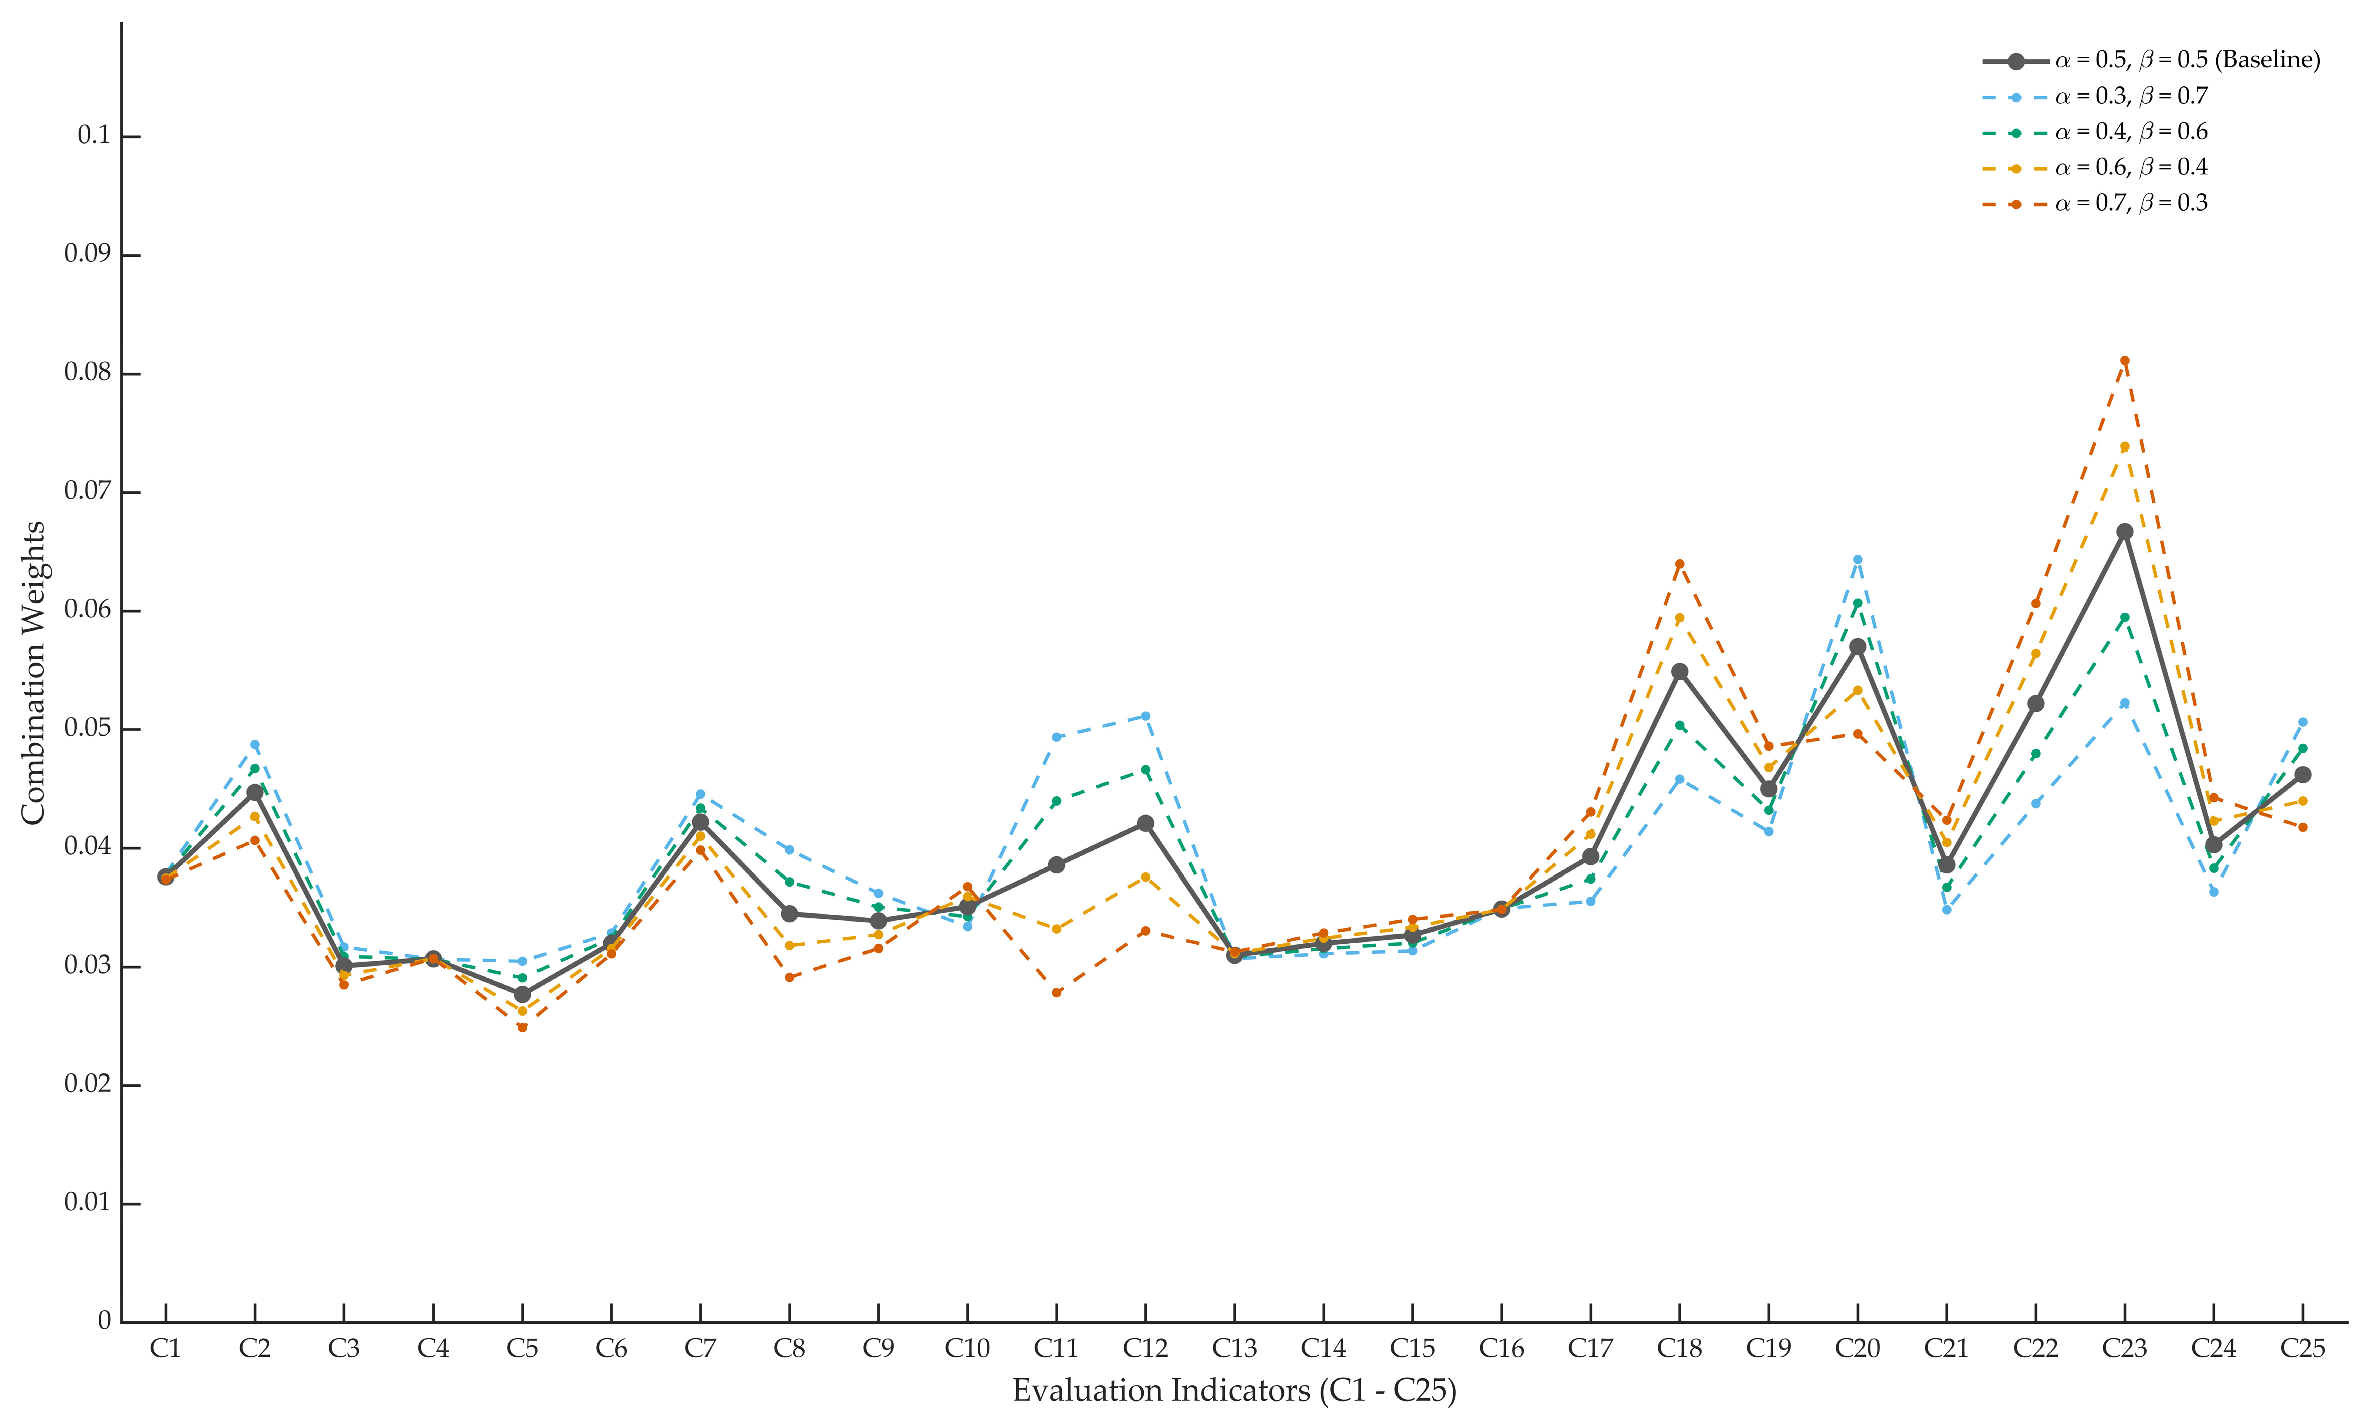
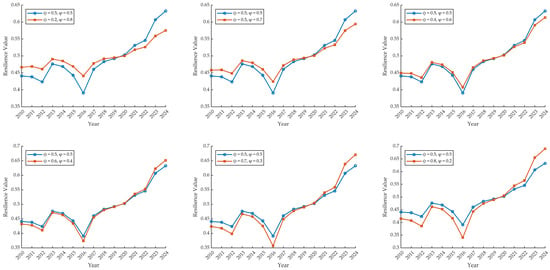
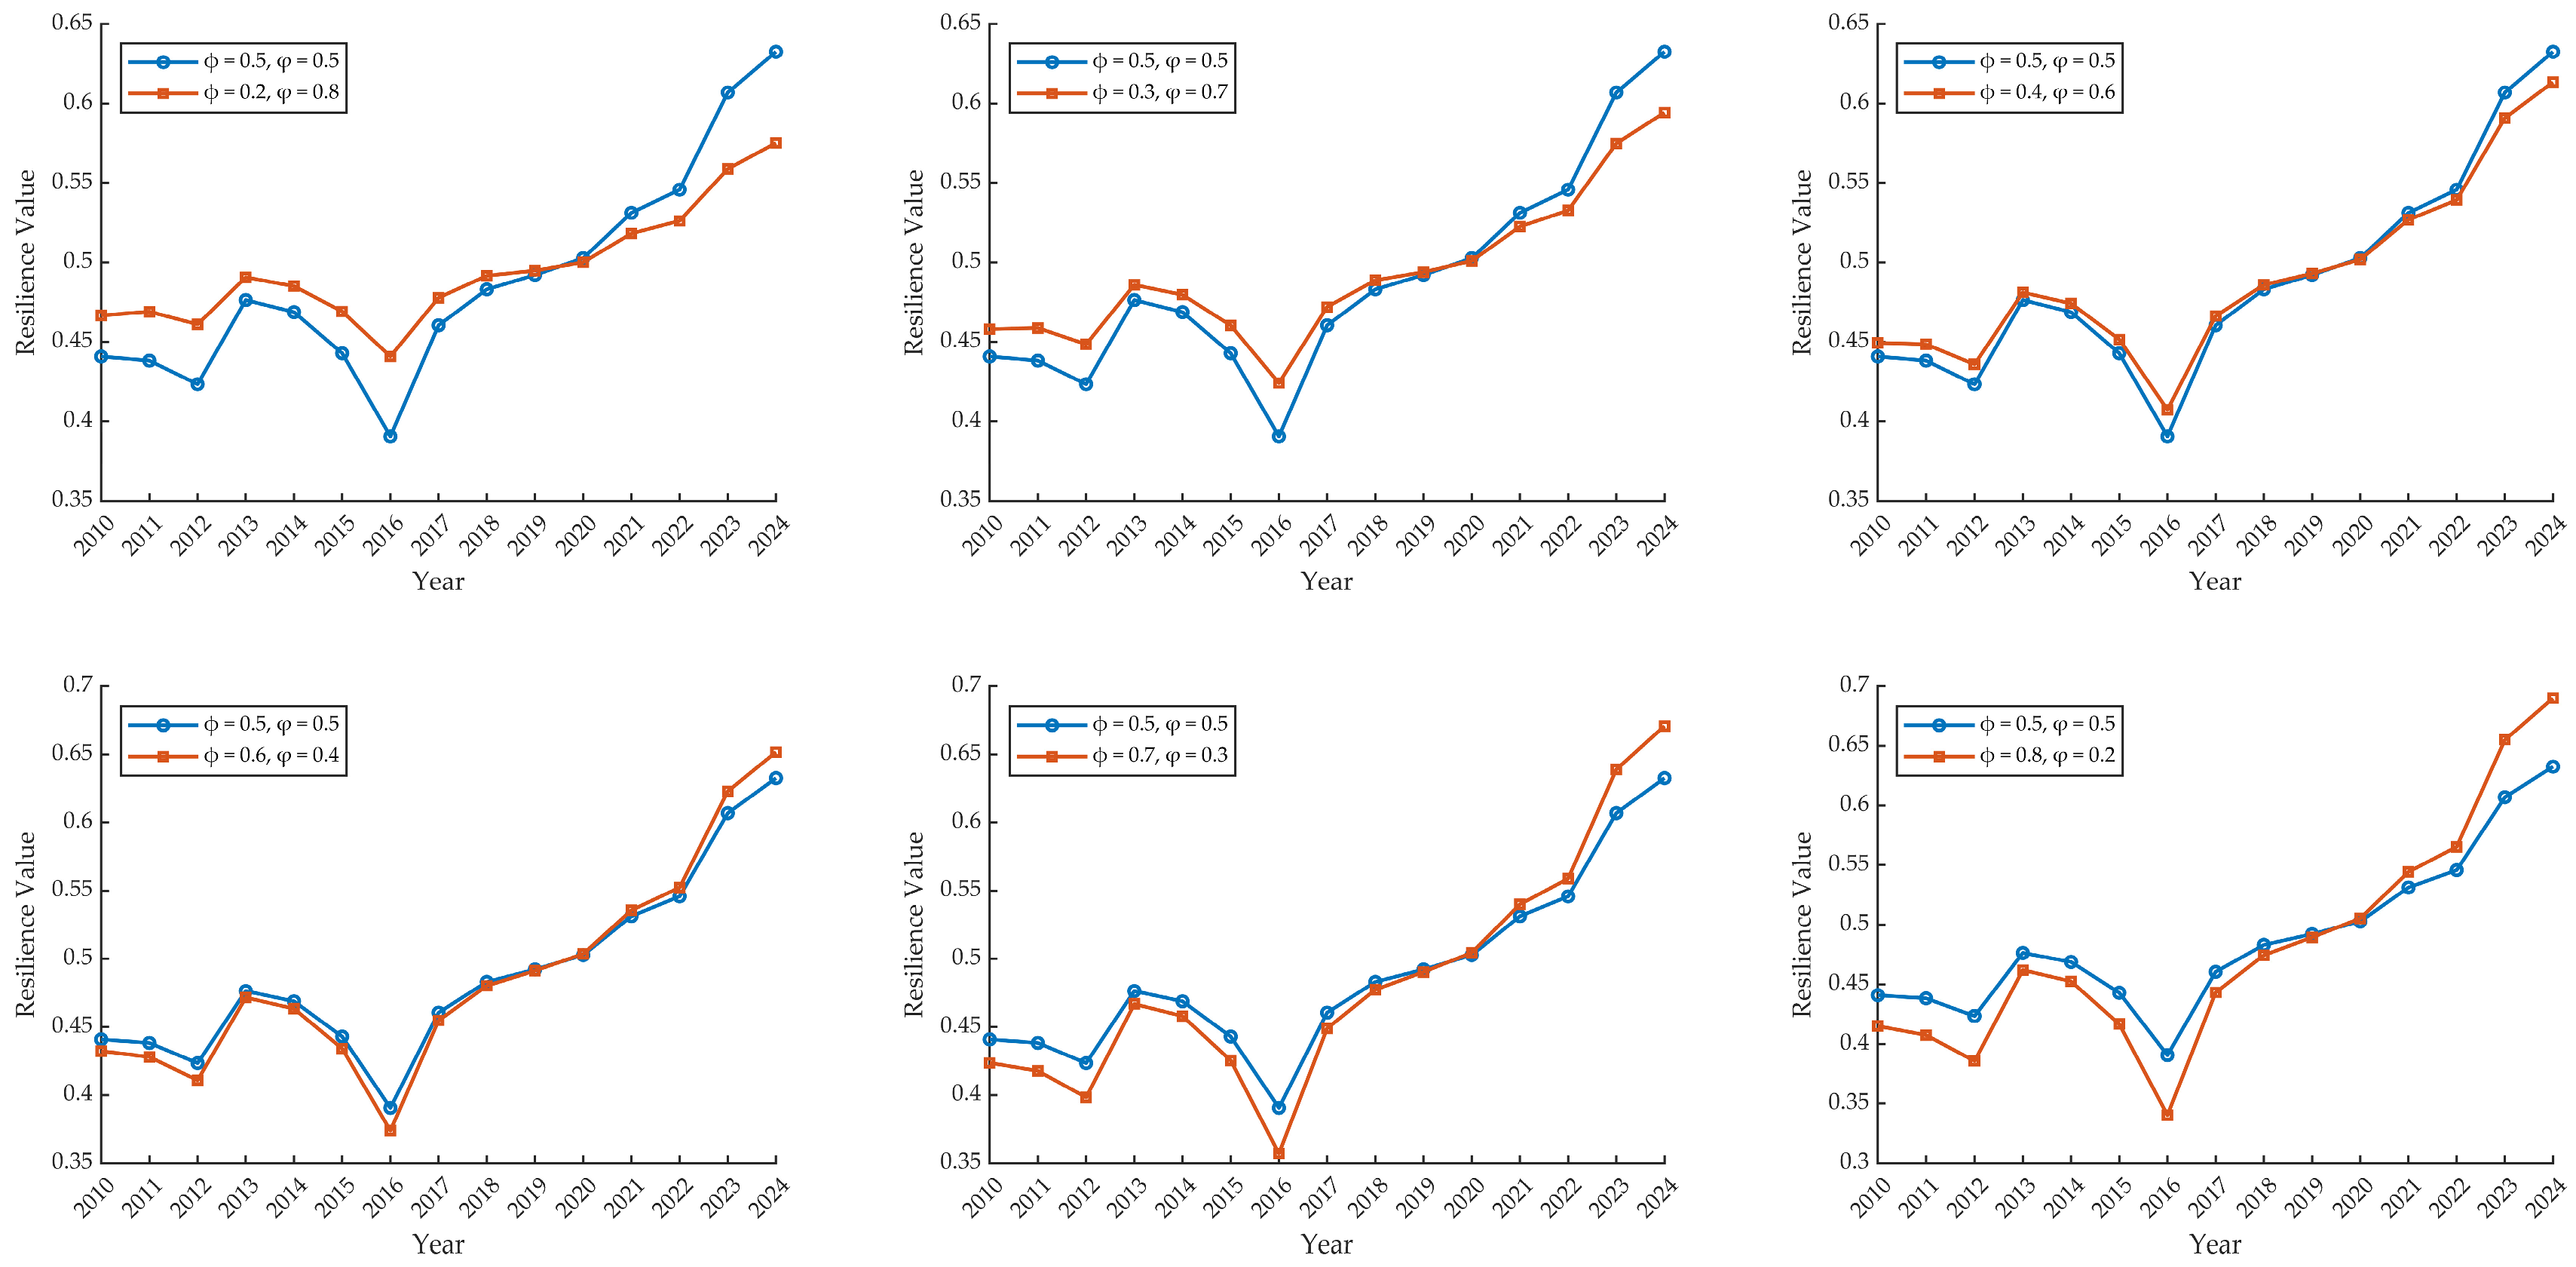
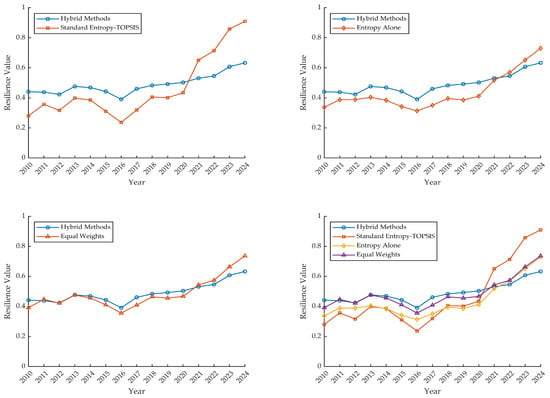
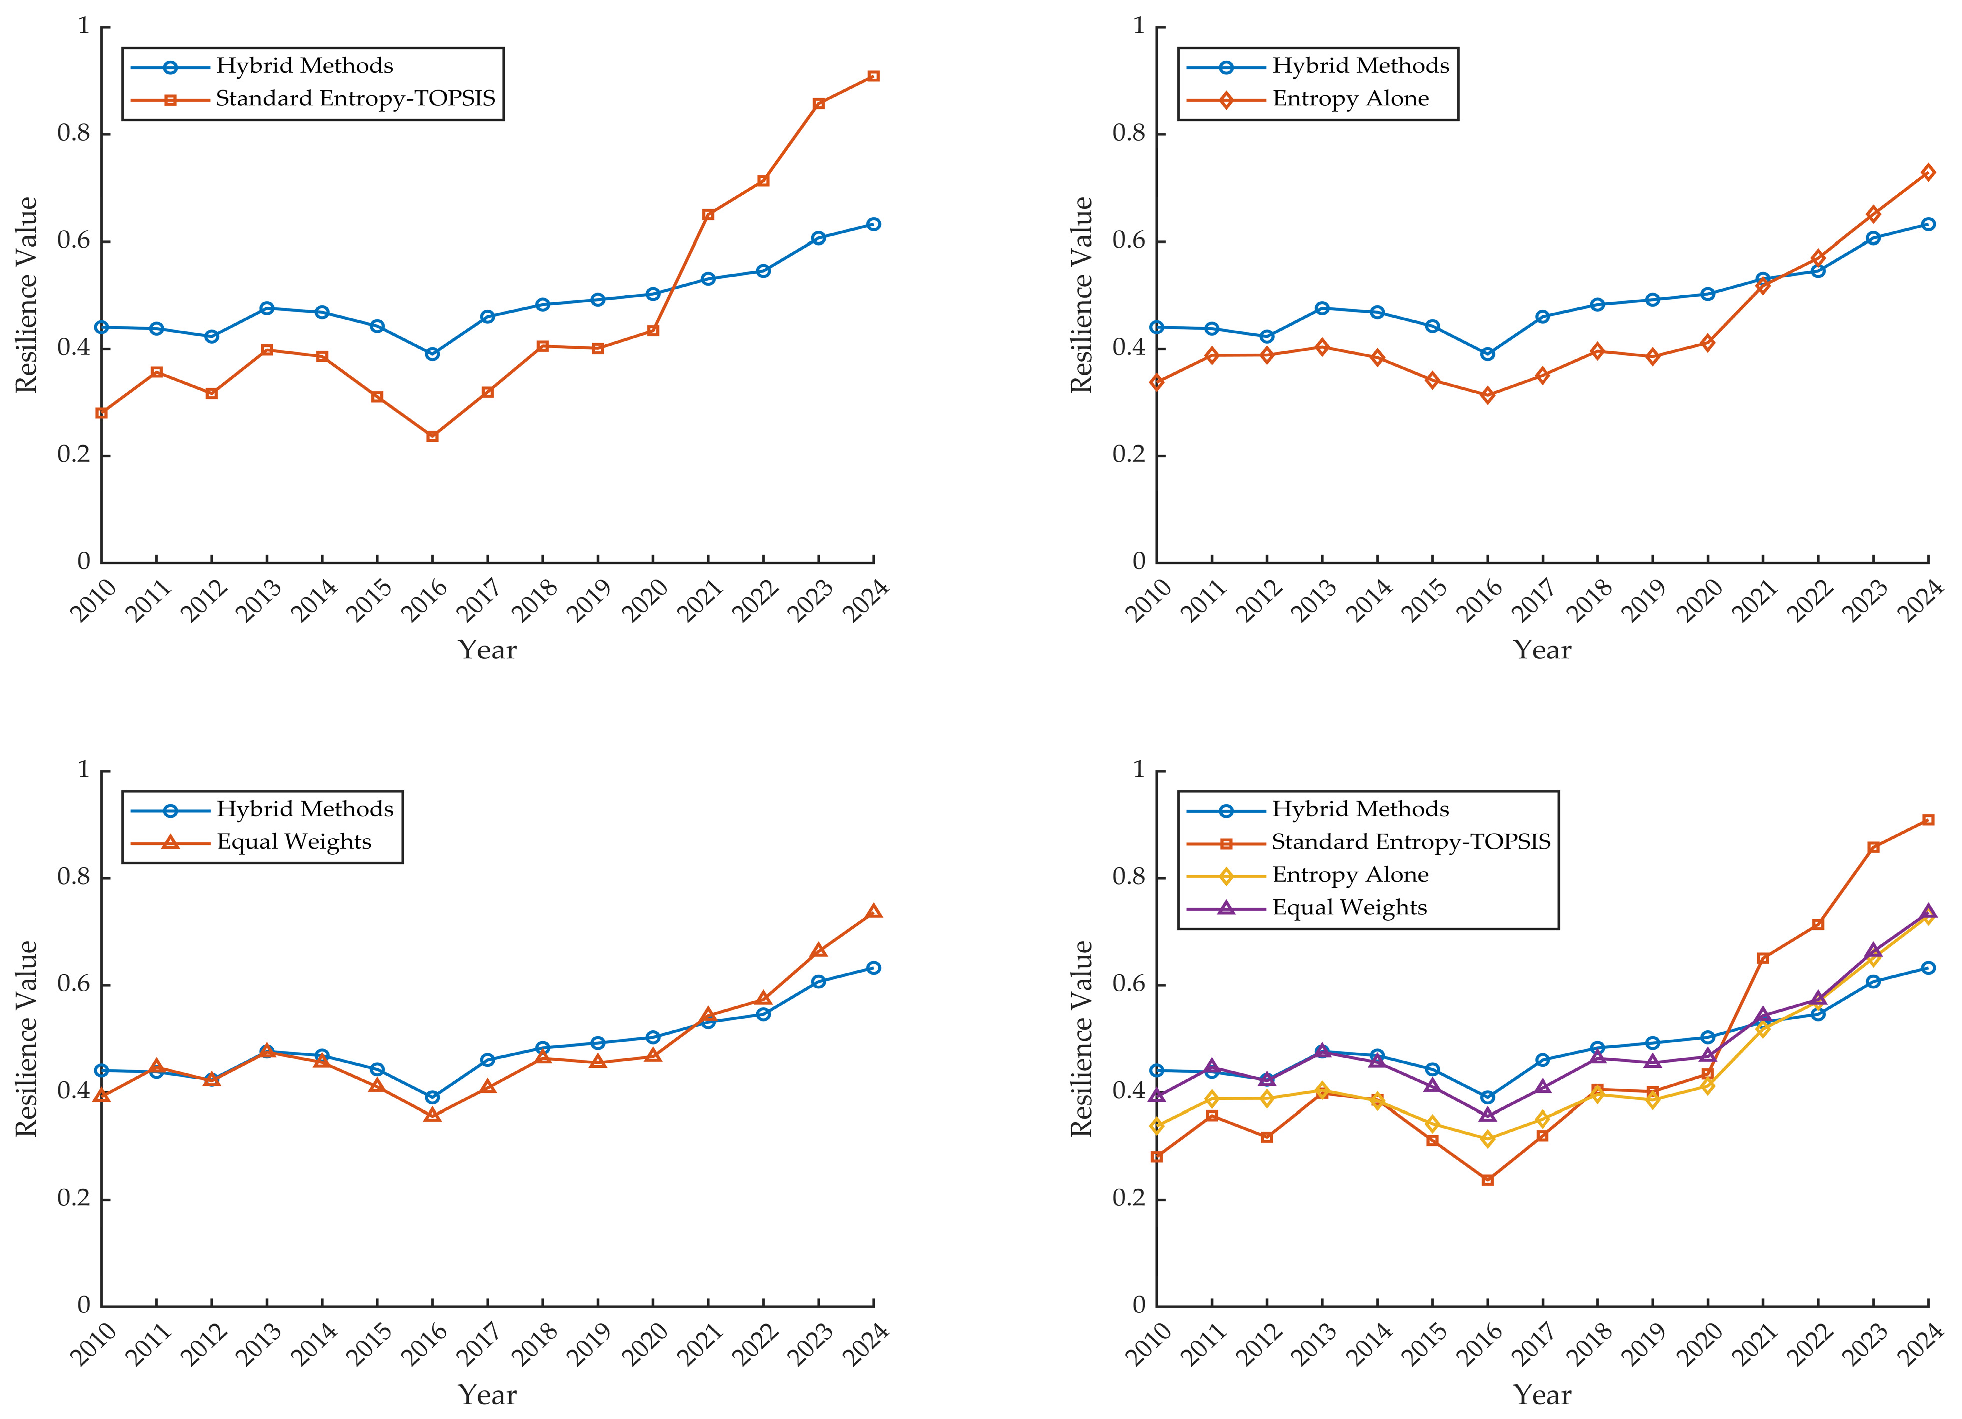
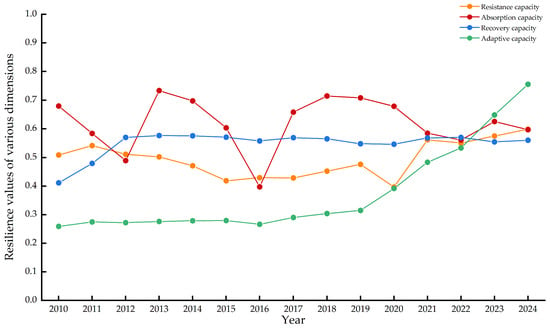
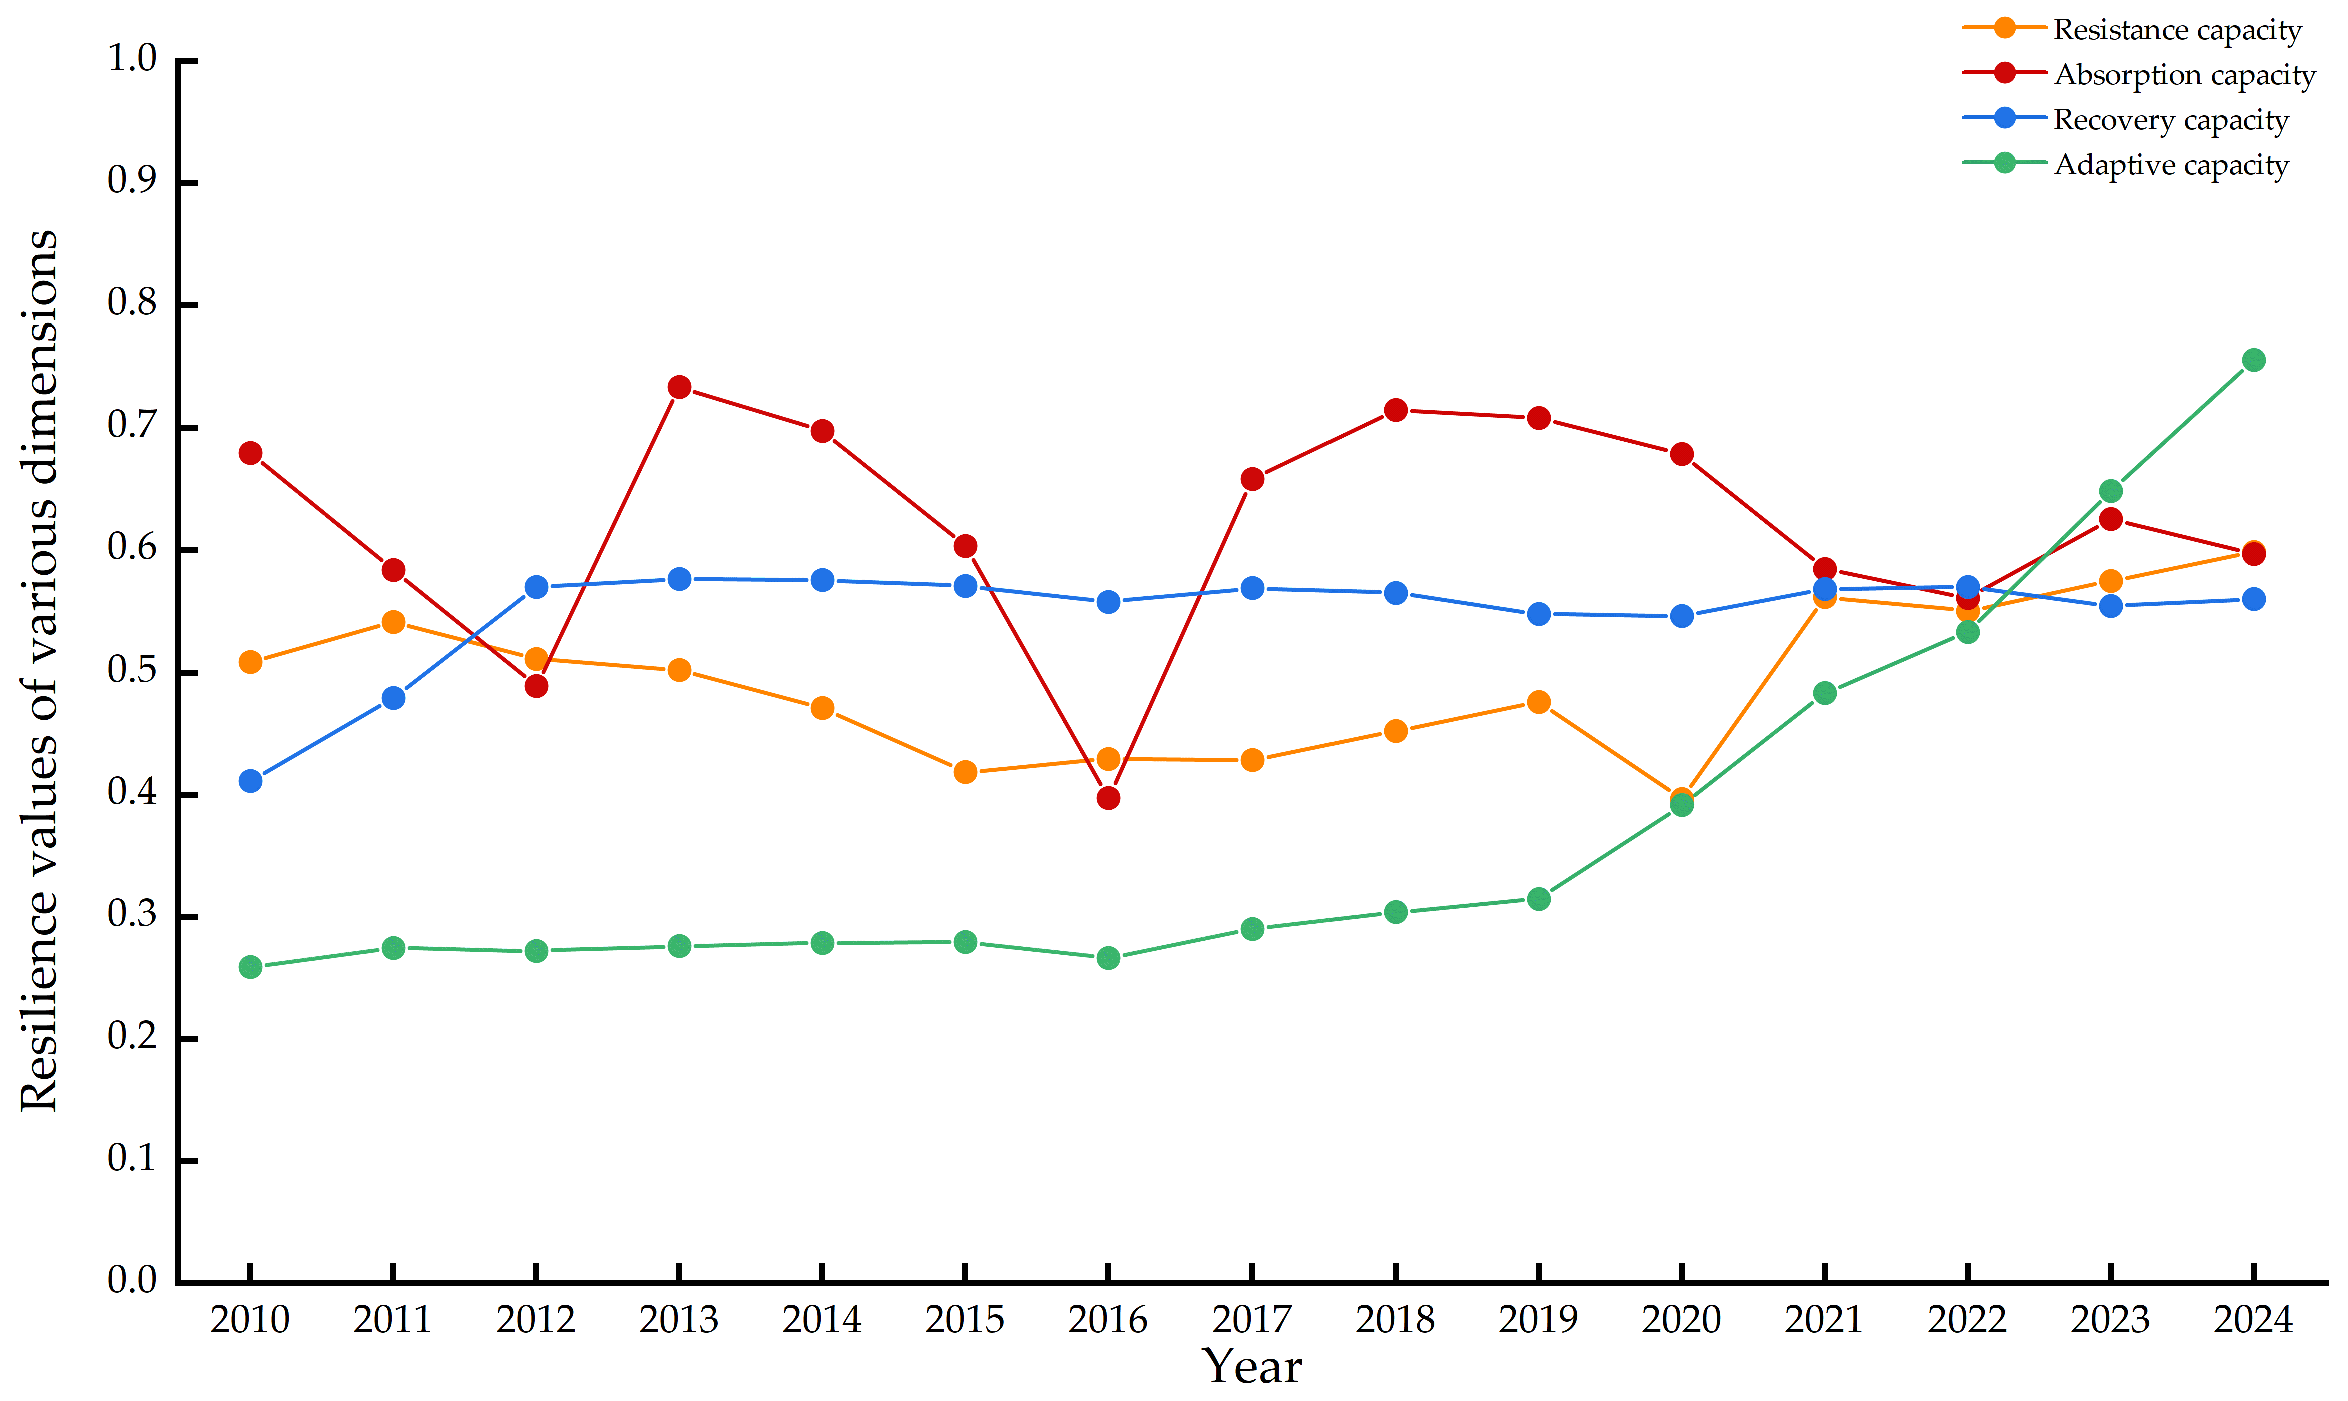
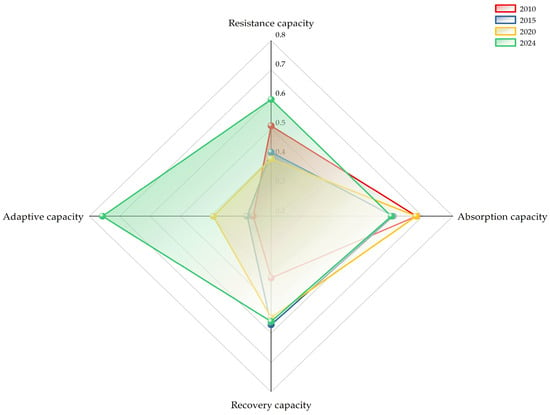
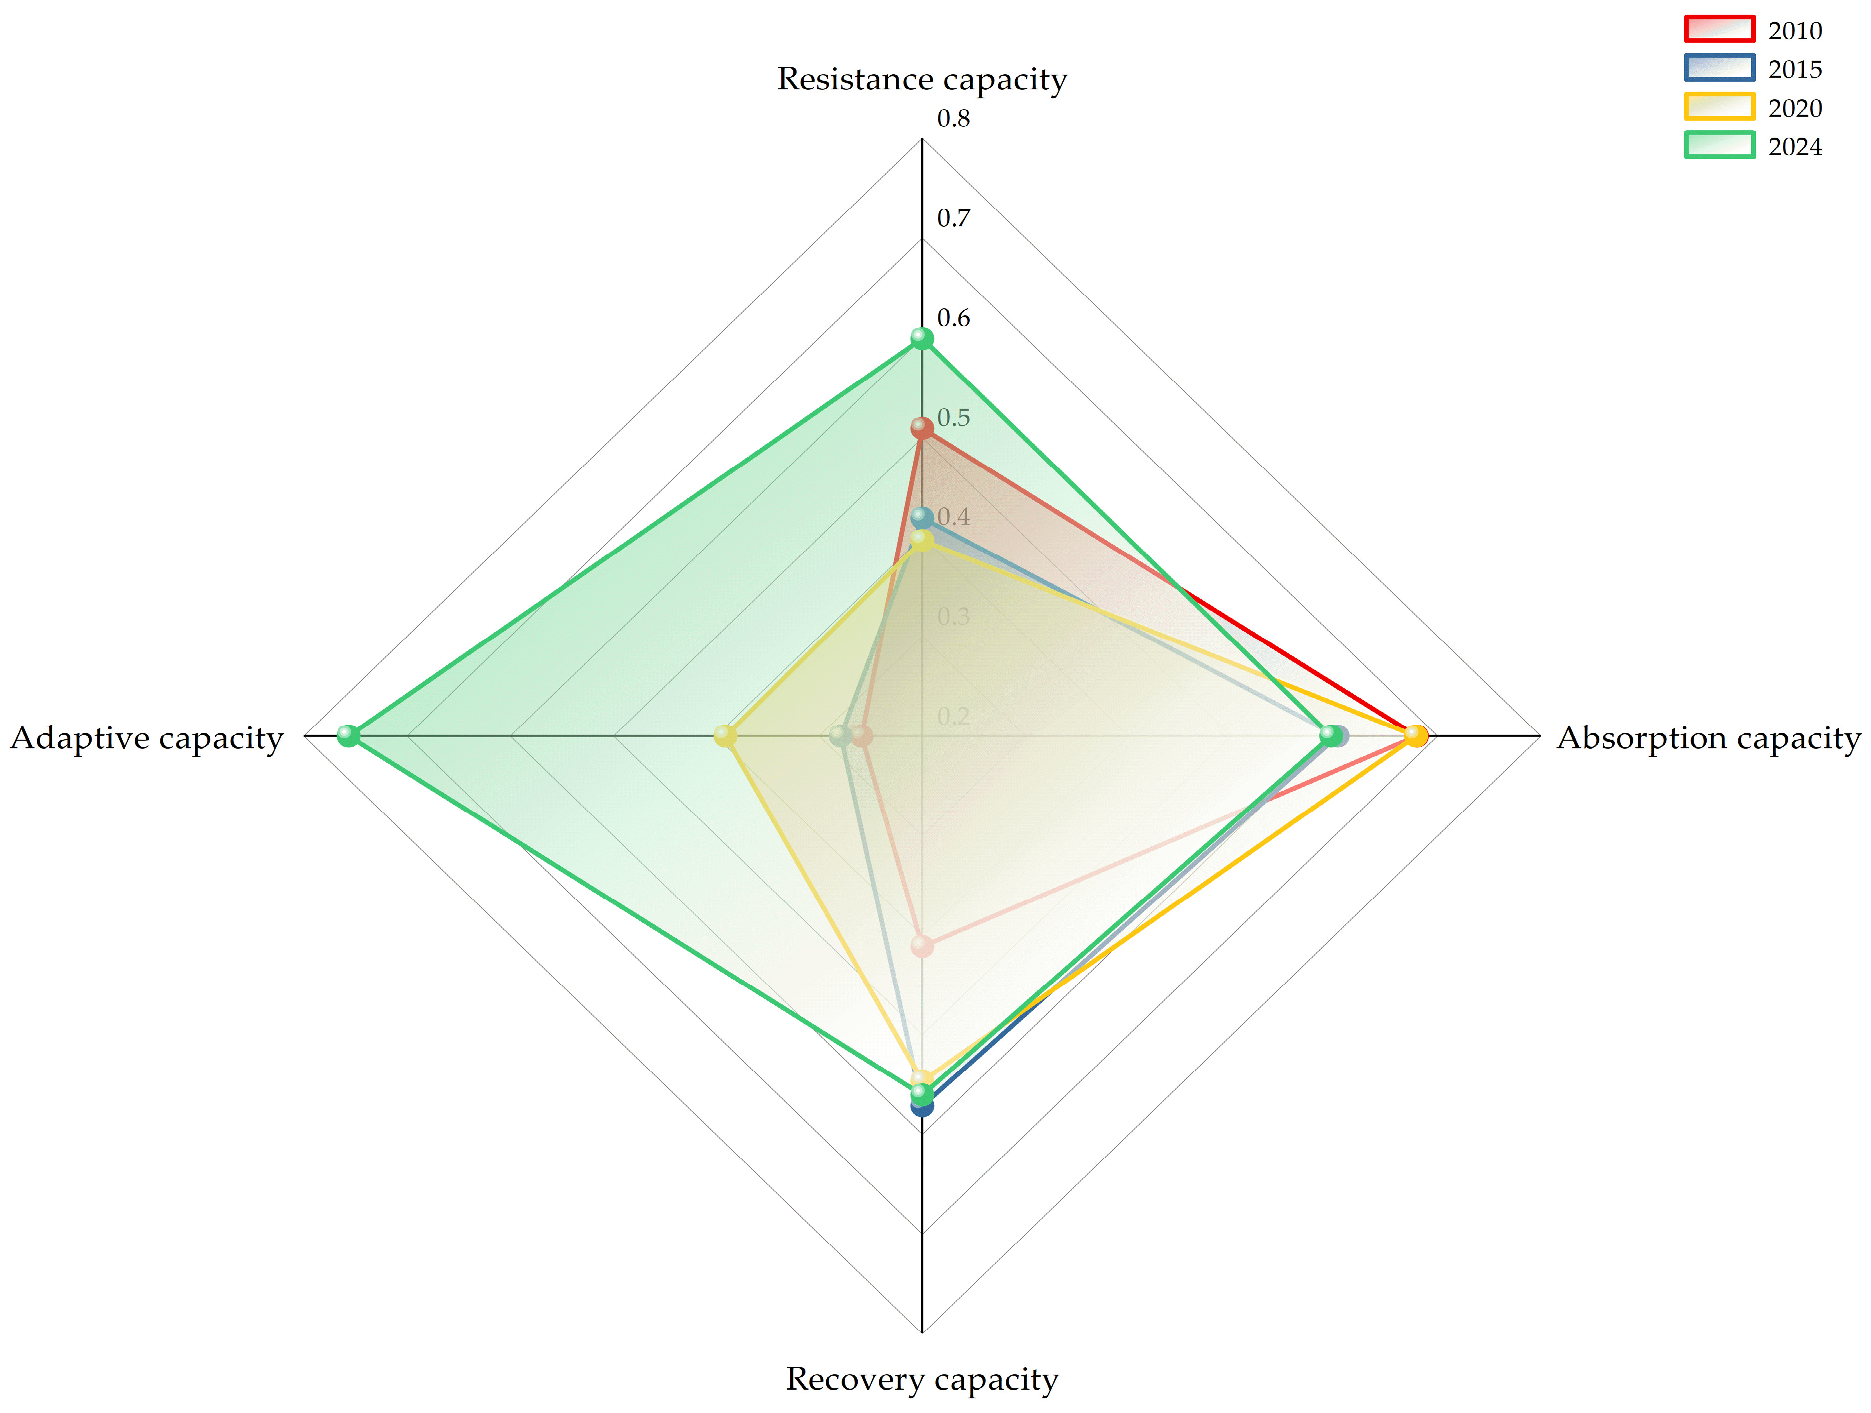
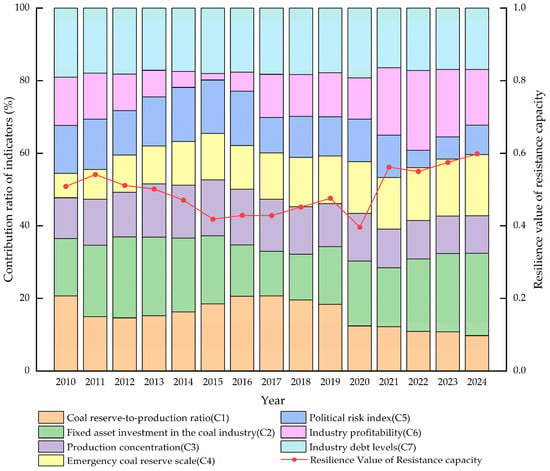
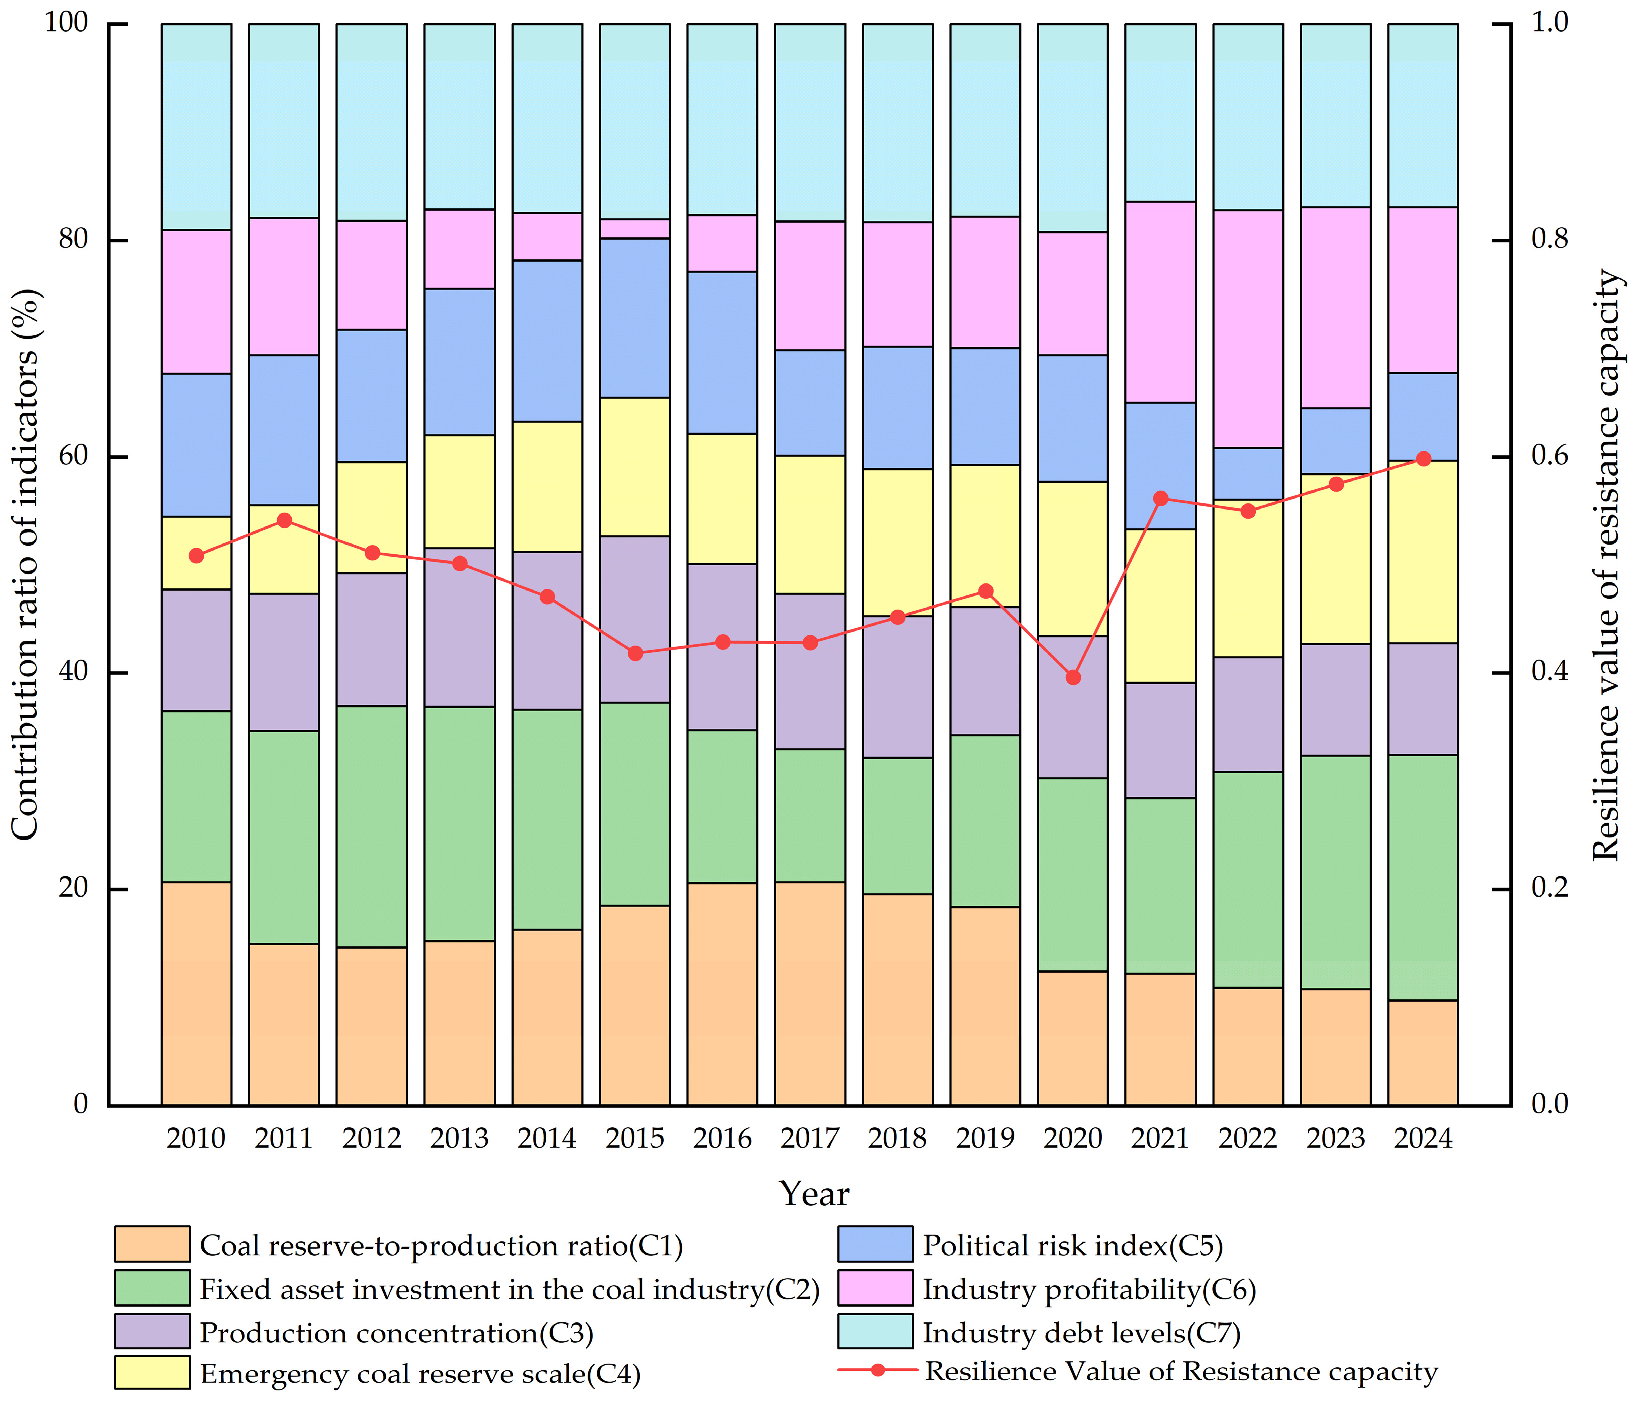
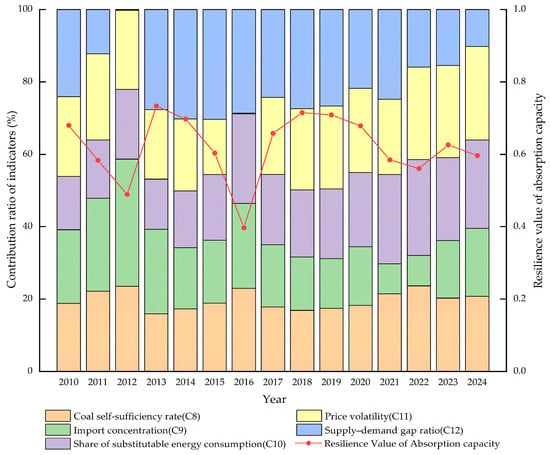
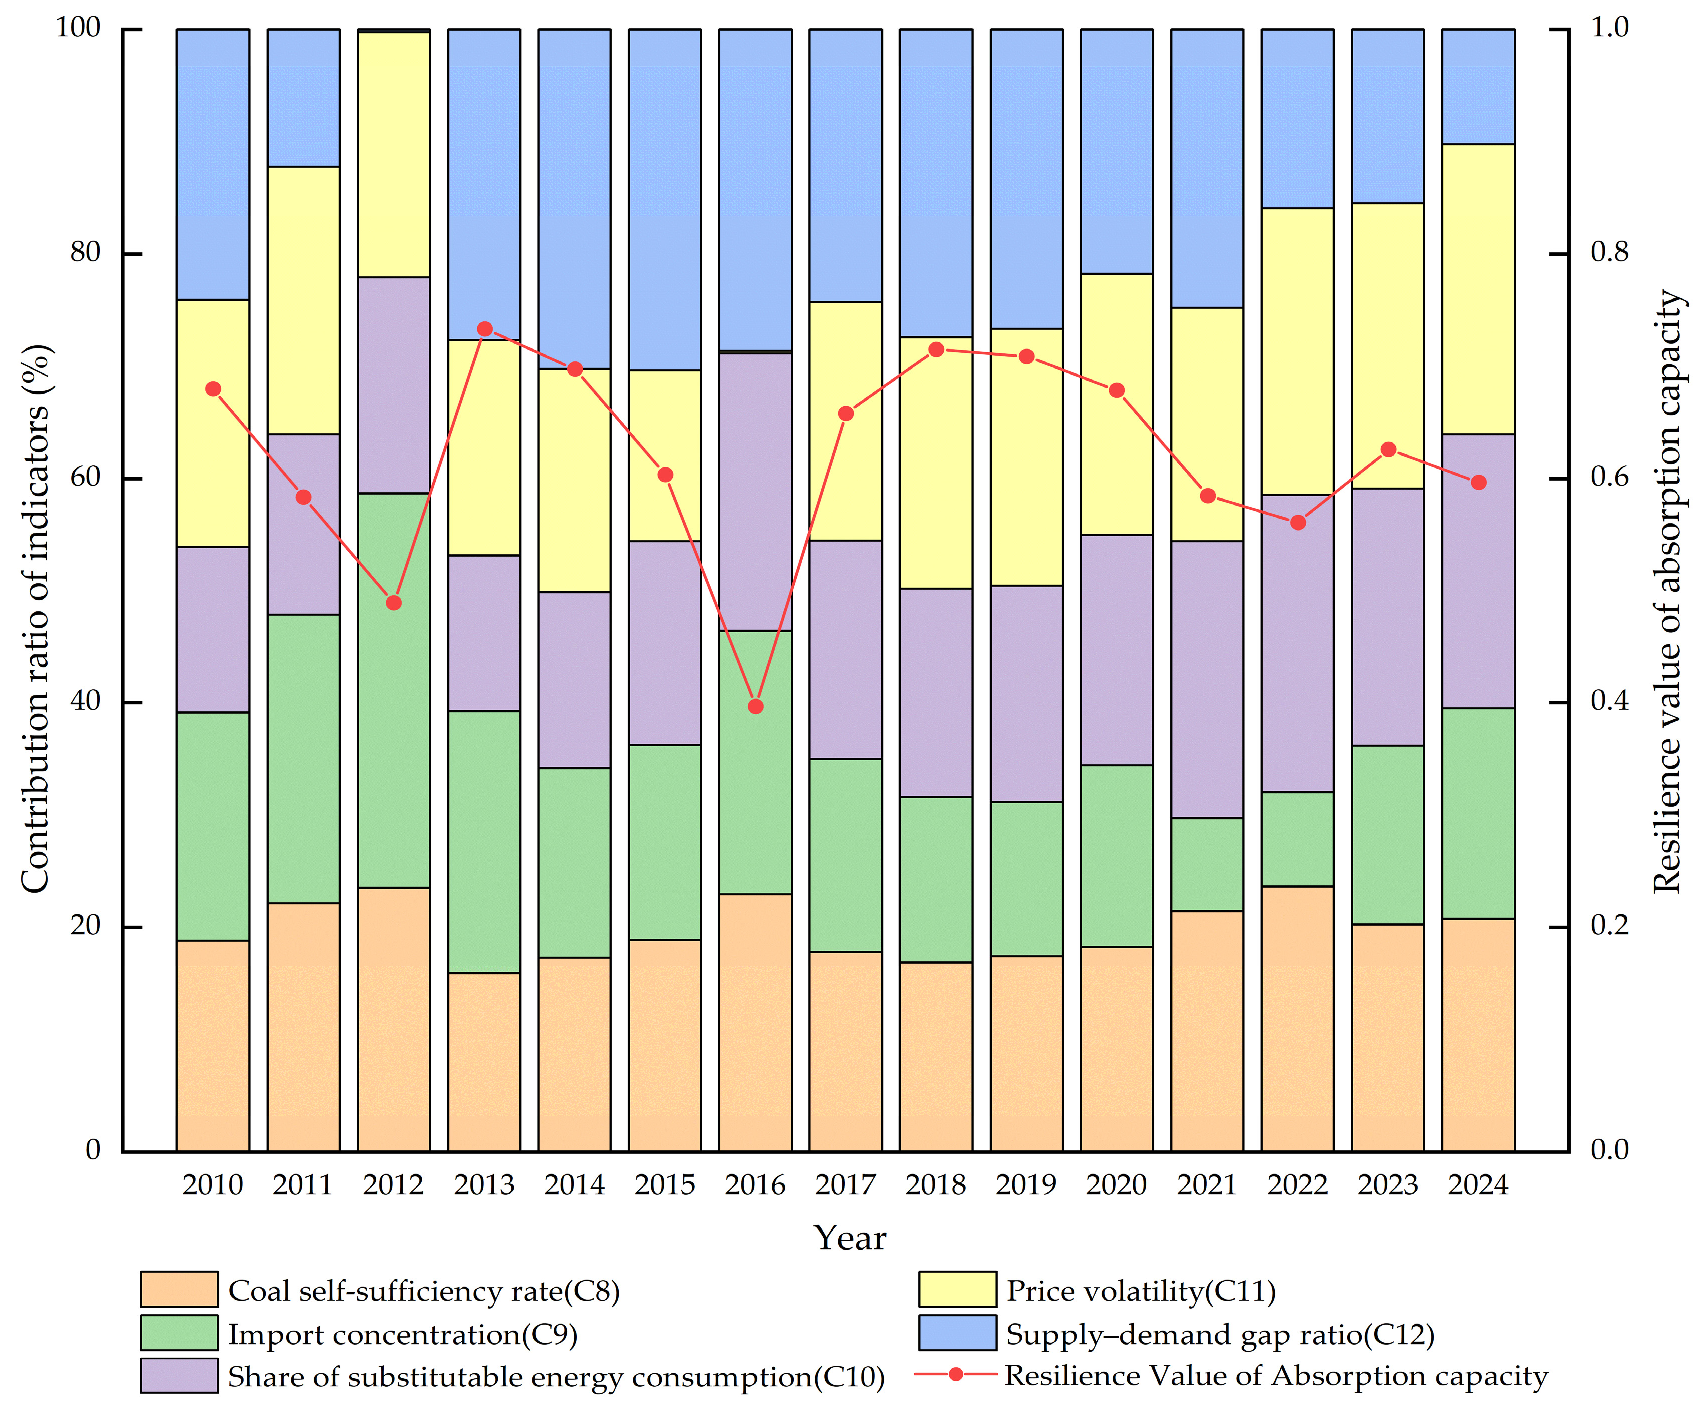
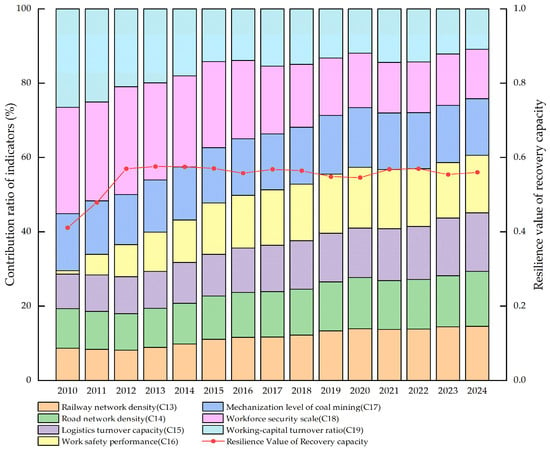
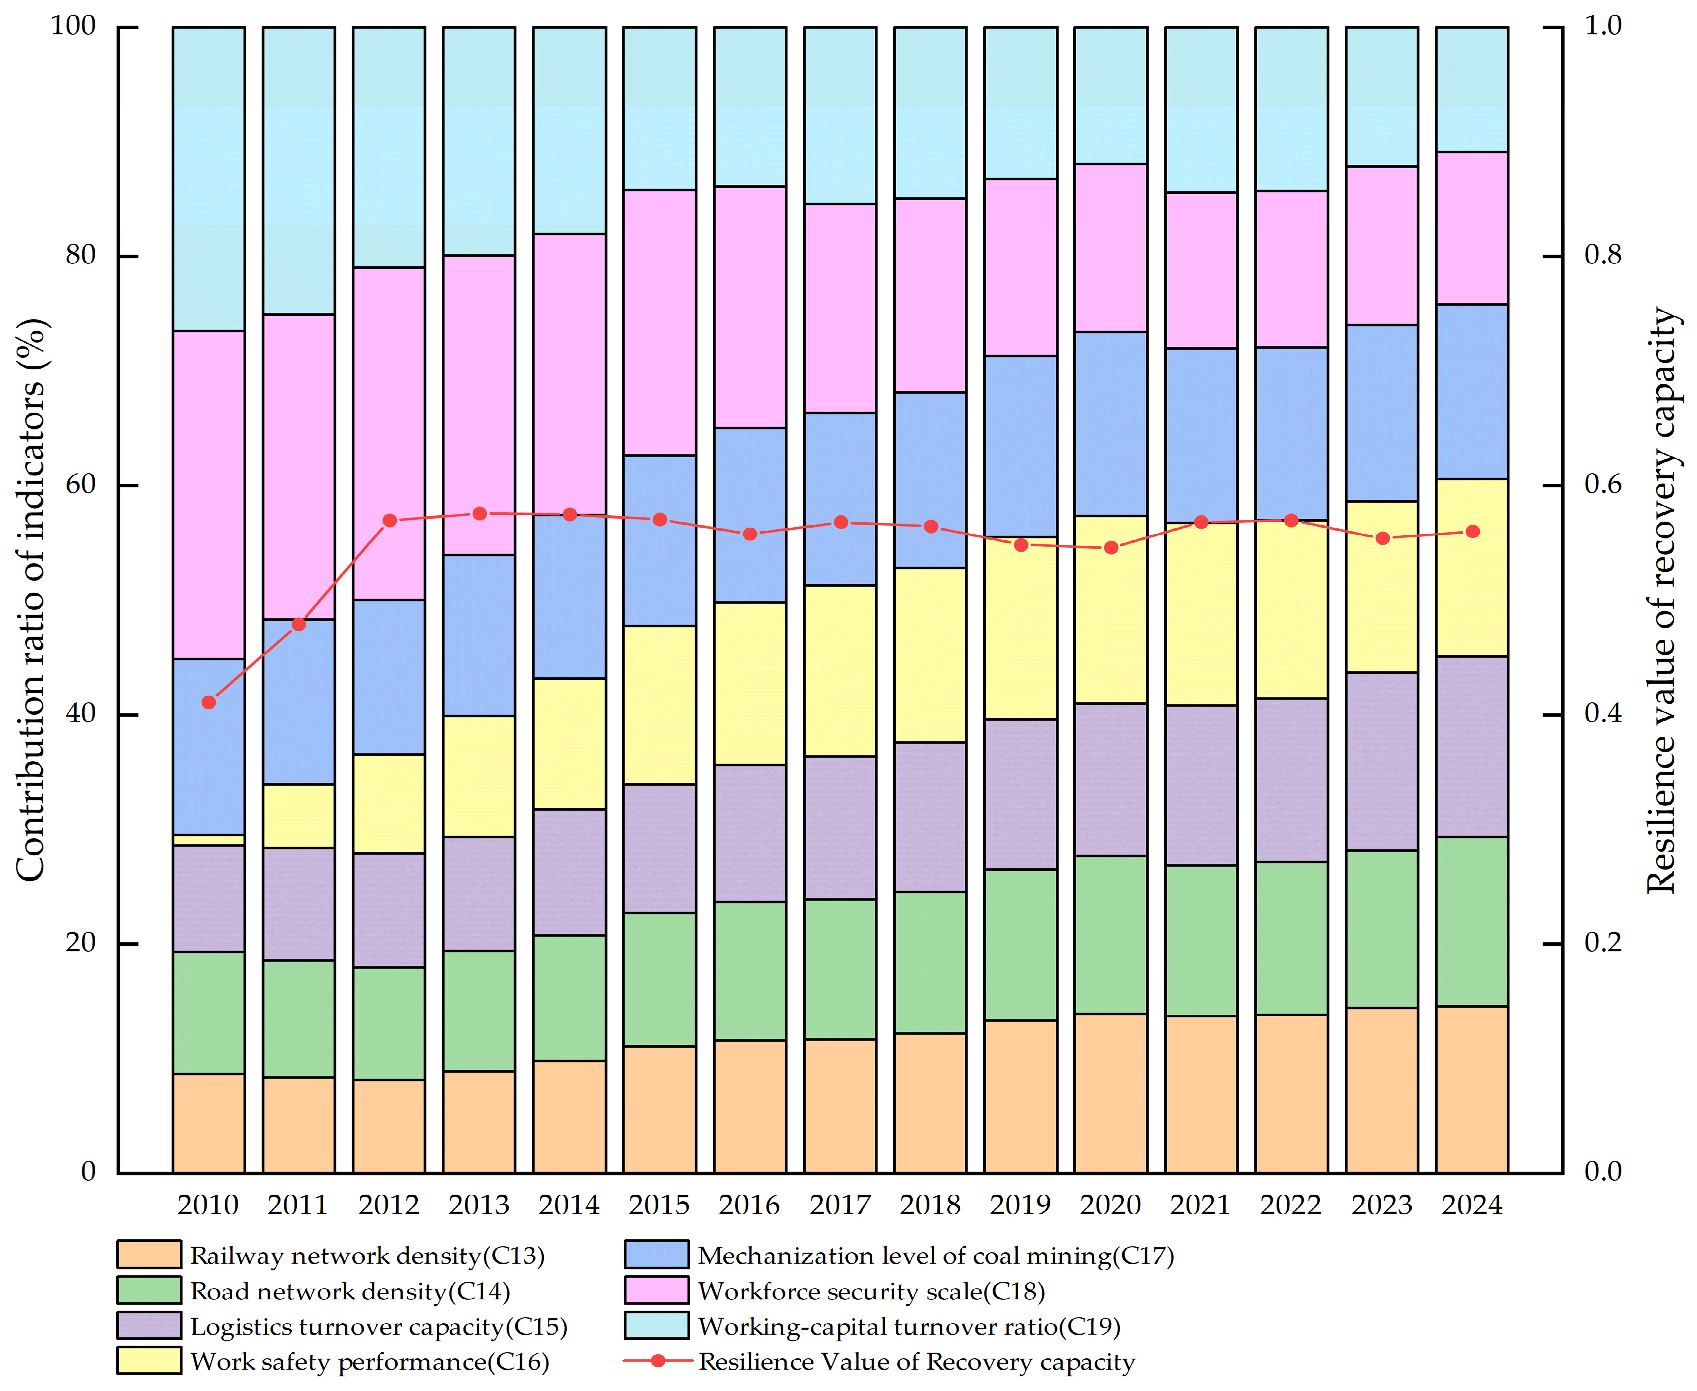
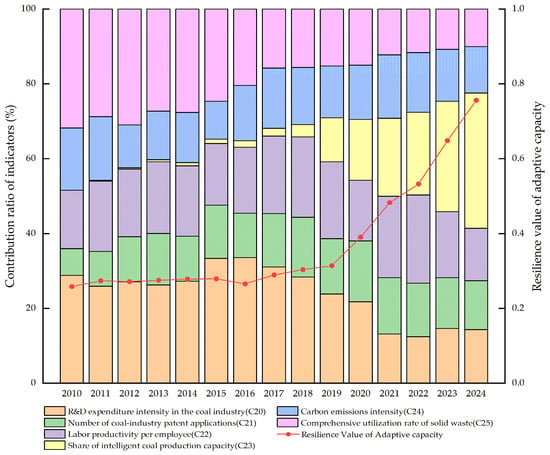
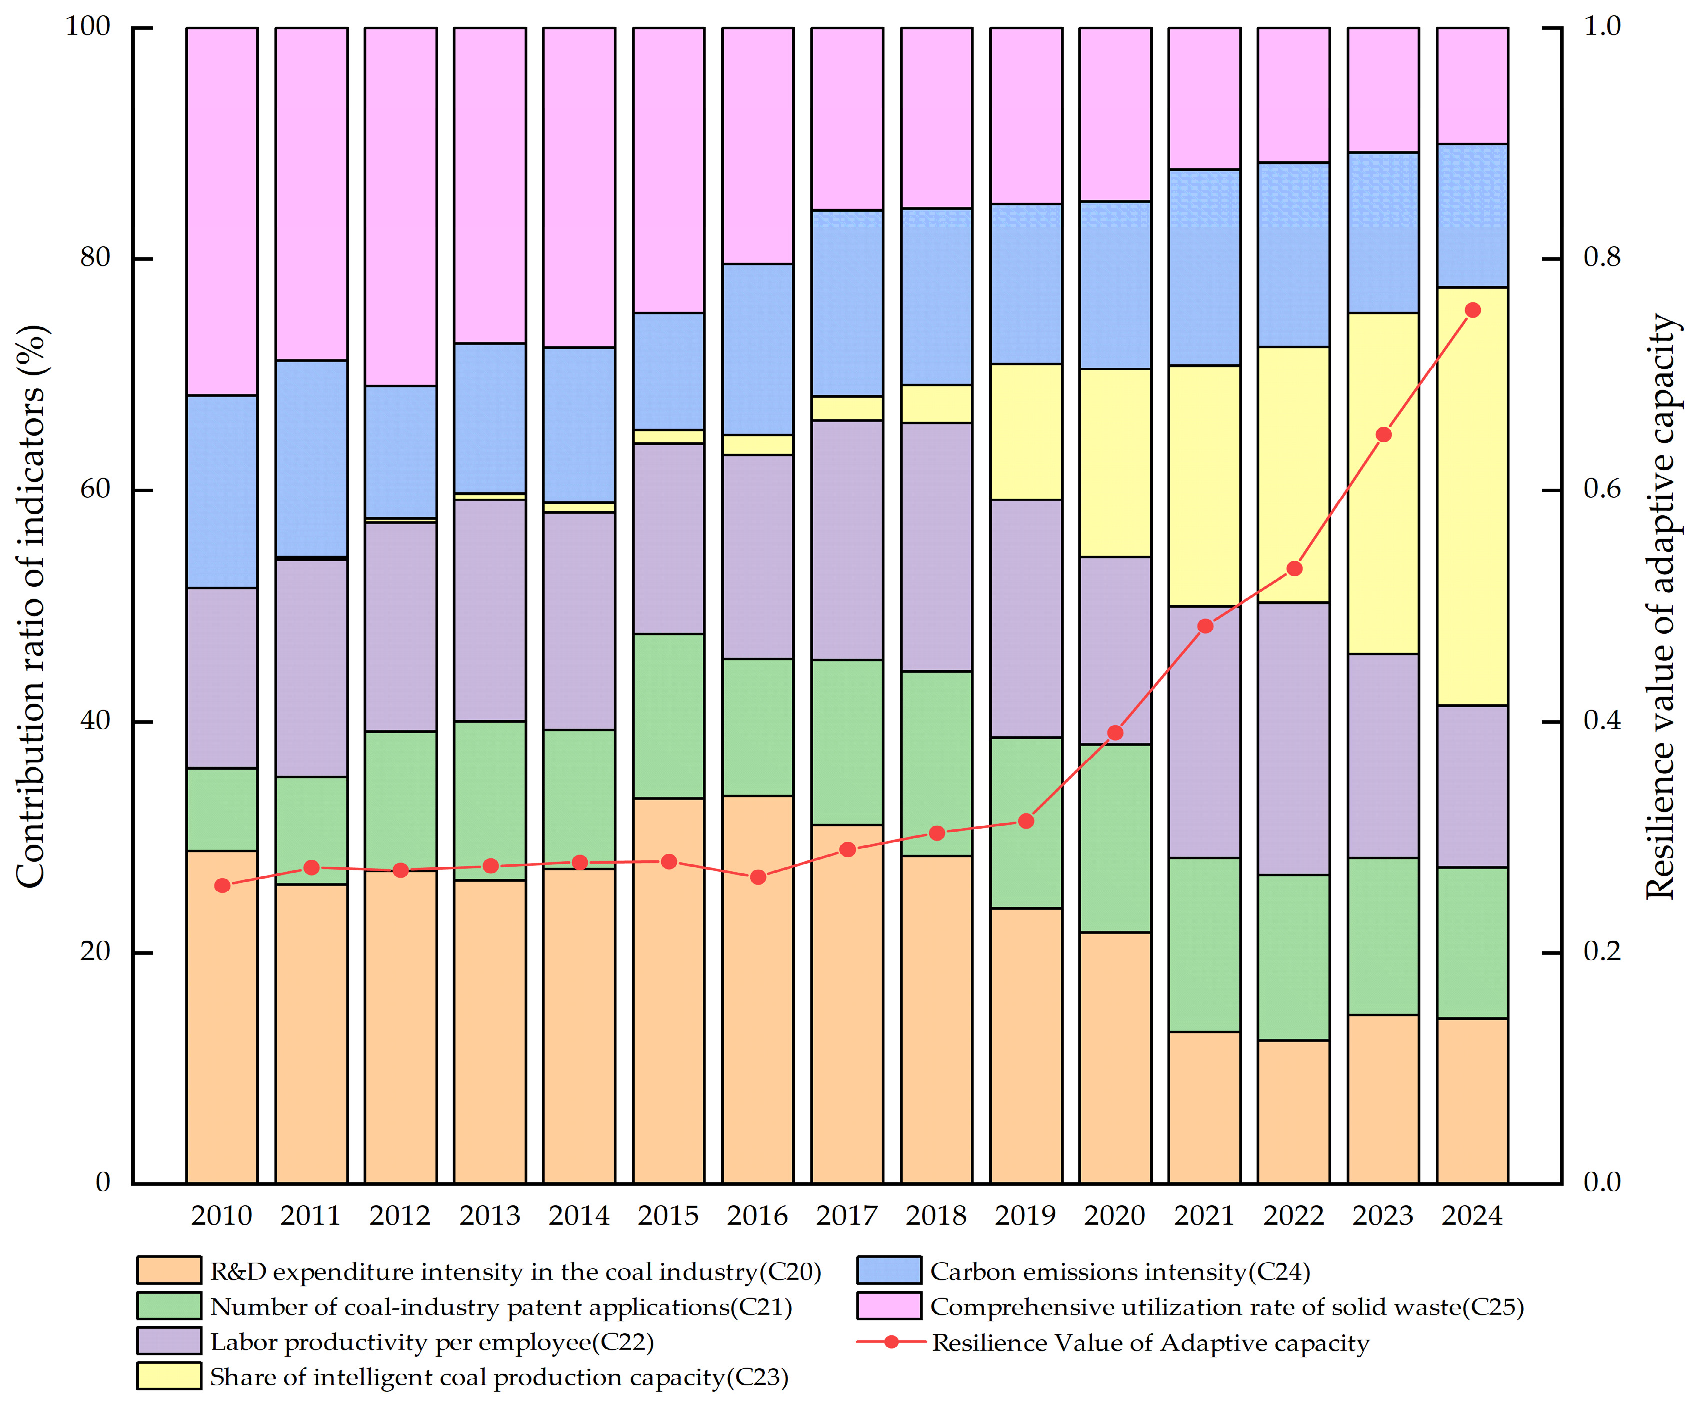
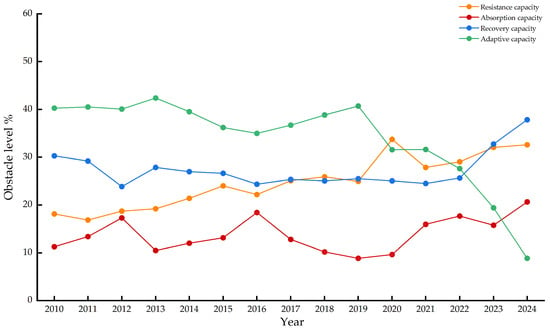
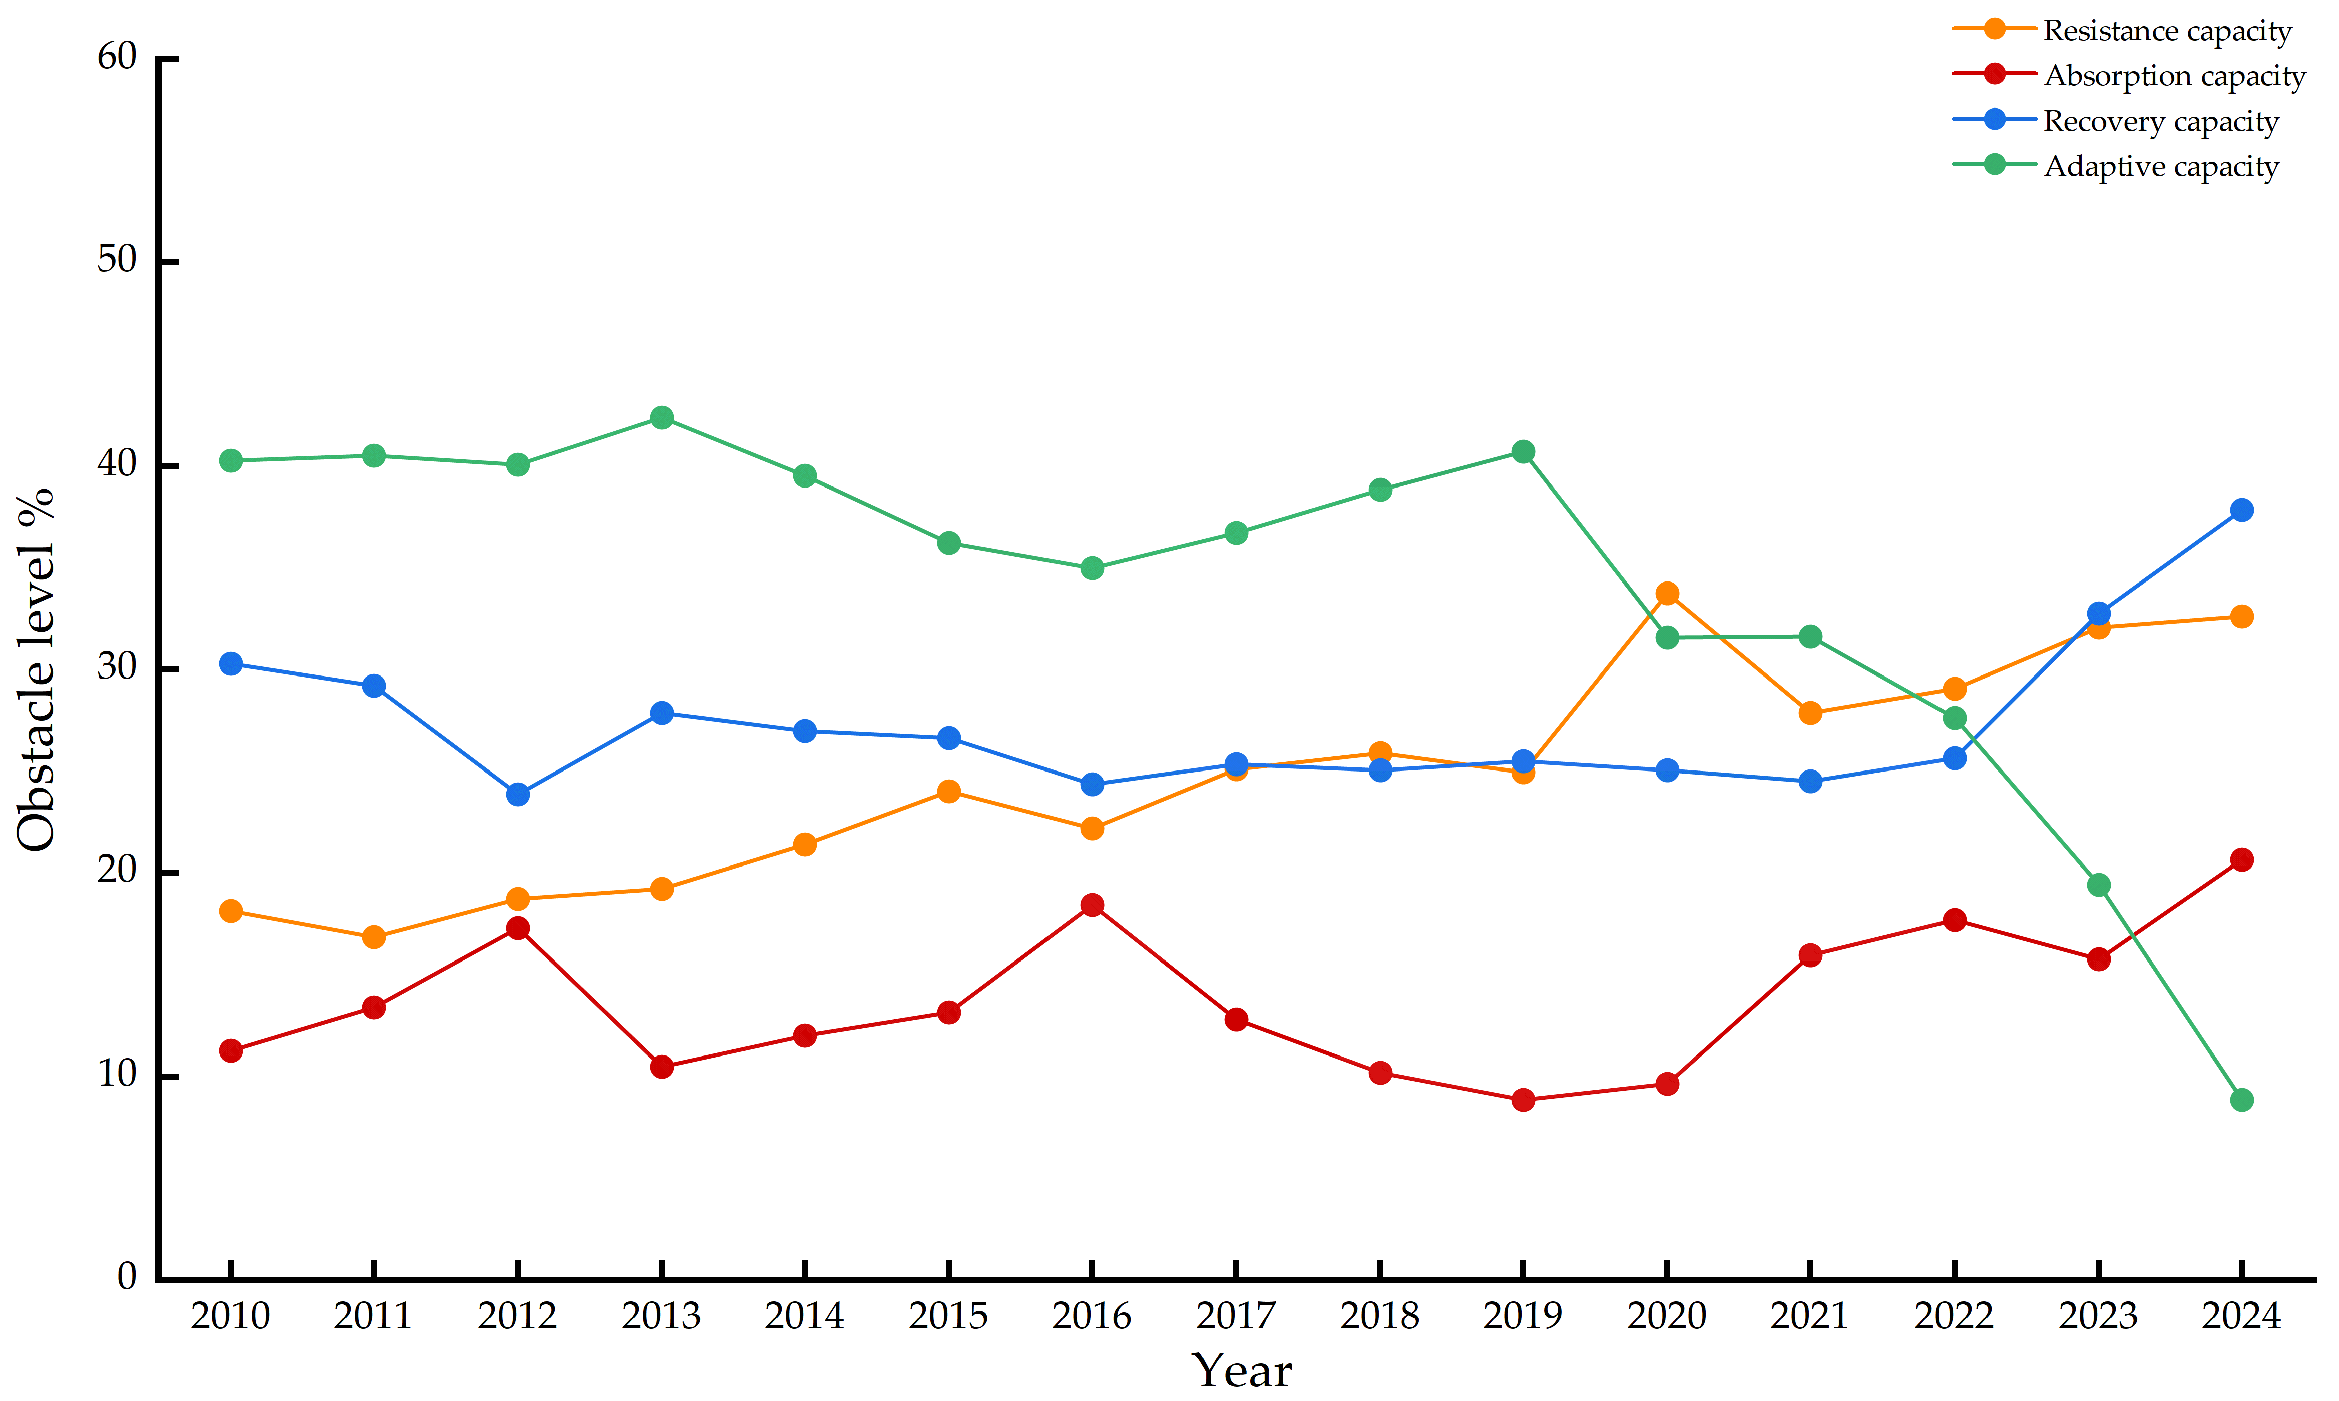
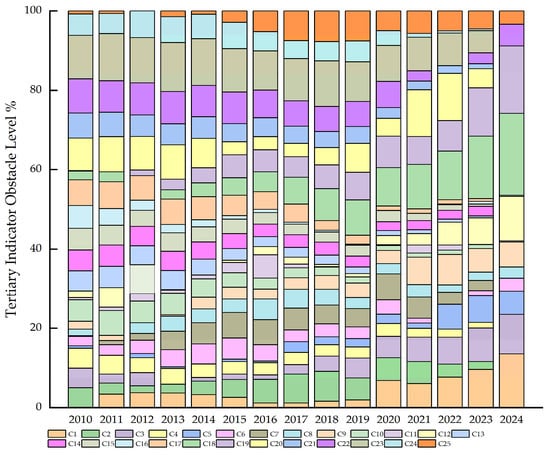
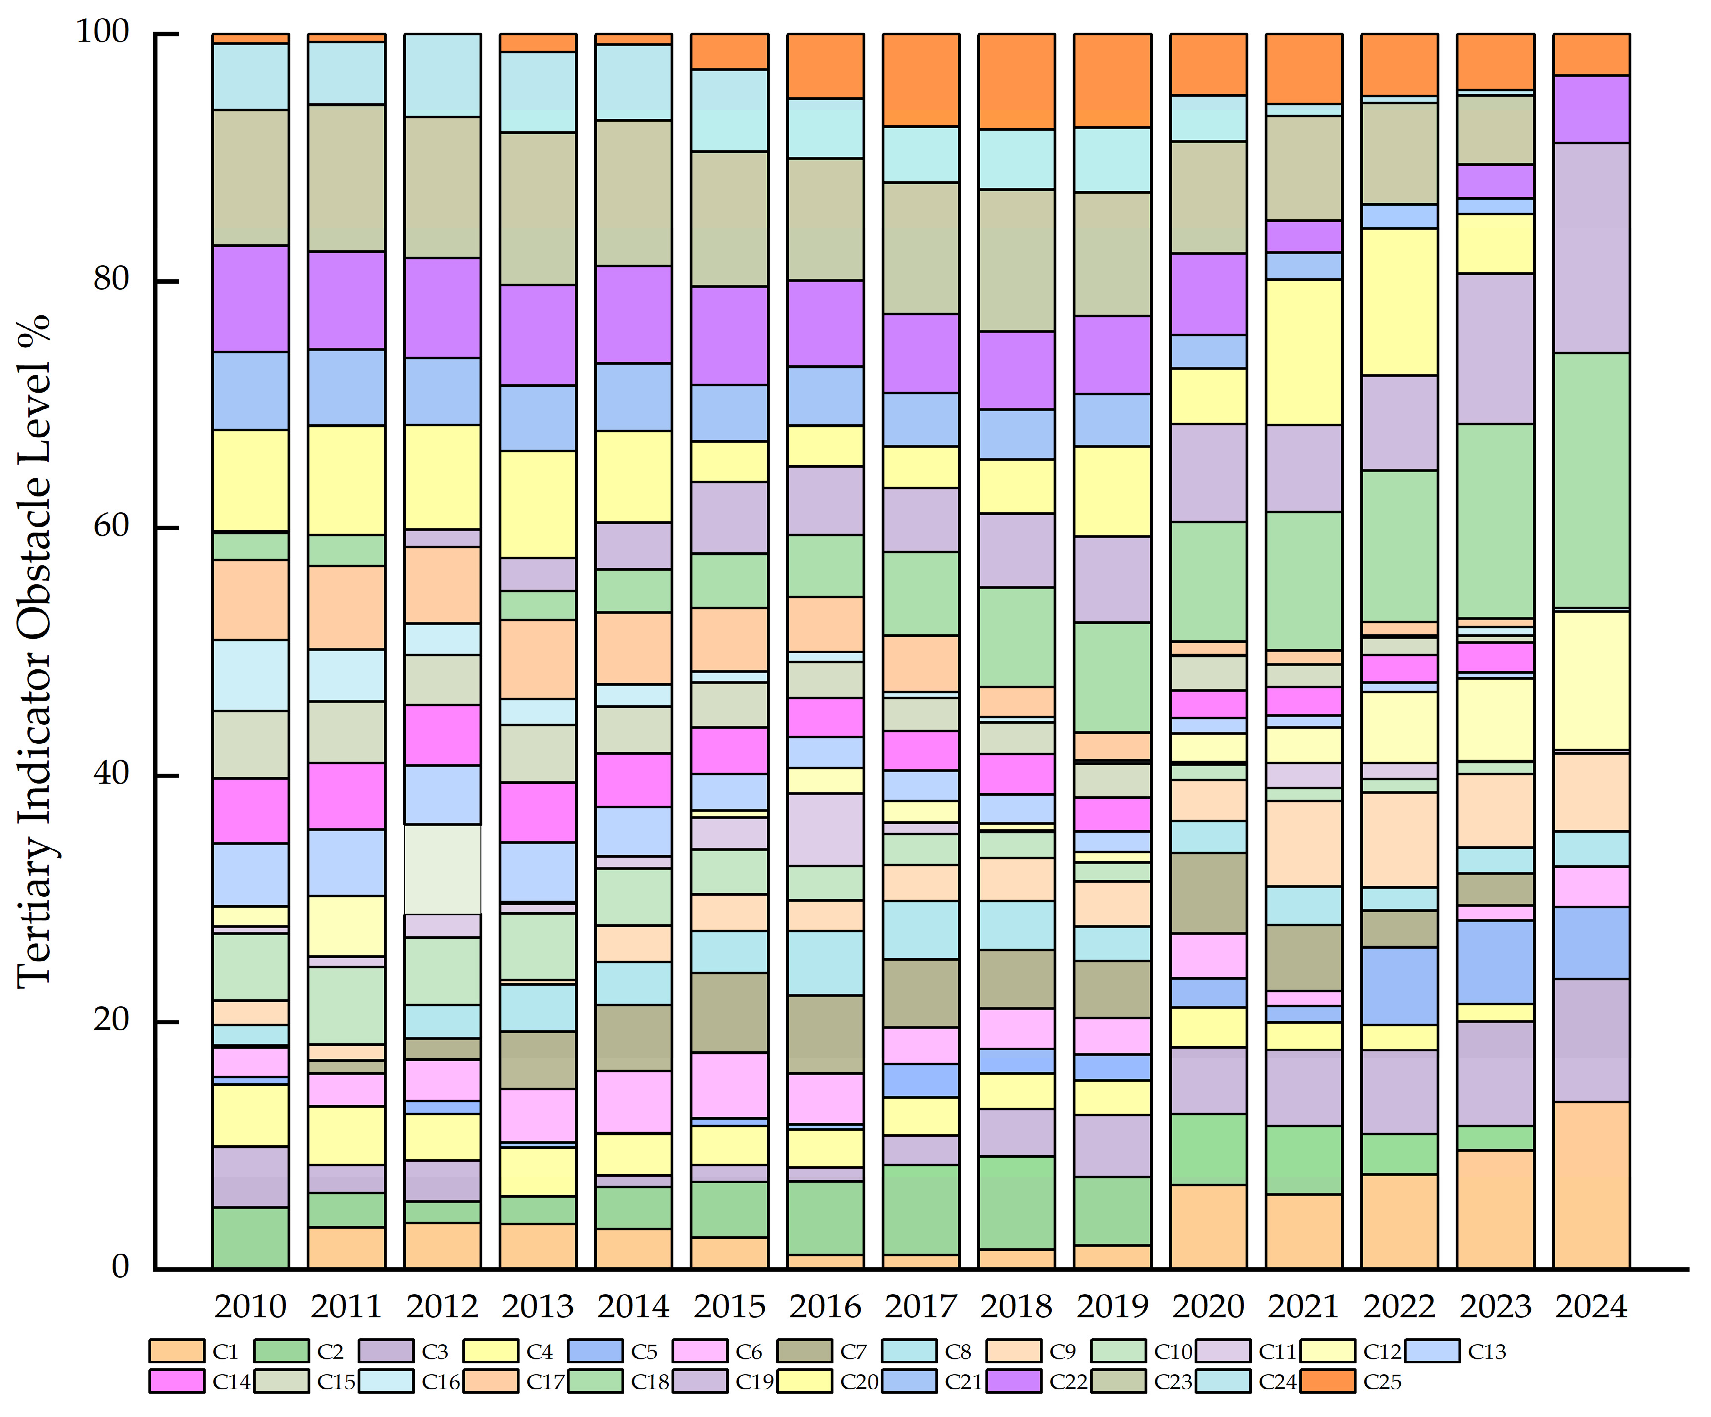

Disclaimer/Publisher’s Note: The statements, opinions and data contained in all publications are solely those of the individual author(s) and contributor(s) and not of MDPI and/or the editor(s). MDPI and/or the editor(s) disclaim responsibility for any injury to people or property resulting from any ideas, methods, instructions or products referred to in the content. |
© 2026 by the authors. Licensee MDPI, Basel, Switzerland. This article is an open access article distributed under the terms and conditions of the Creative Commons Attribution (CC BY) license.