1. Introduction
In the context of the ongoing energy transition, integrated energy systems (IESs) have become pivotal for the synergistic and efficient use of diverse regional energy resources [
1]. By leveraging advanced information management technologies, an IES orchestrates the entire lifecycle of multiple energy carriers (electricity, heat, cooling, natural gas) [
2], encompassing their production, transmission, conversion, storage, and consumption. The high degree of coupling between multiple energies, however, introduces significant complexity, characterized by energy coupling [
3], multi-timescale dynamics [
4], and the involvement of multiple agents [
5]. These features give rise to three critical challenges: achieving optimal coupling, coordinating across different timescales, and facilitating collaboration among stakeholders.
Attaining supply–demand equilibrium within an IES presents a scheduling dilemma, entailing the derivation of optimal strategies under intricate constraints, which has been demonstrated to be an NP-hard problem [
6]. In response, the academic community has developed a variety of optimization models. Fan et al. [
7] introduced a two-stage scheduling model using distributionally robust adaptive model predictive control to reconcile the trade-off between renewable energy uncertainty and economic efficiency. Nozari et al. [
8] enhanced both exergy efficiency and operating costs by integrating ammonia-based energy storage within a multi-objective optimization framework. To address energy supply uncertainty and improve performance in industrial parks, Zhu et al. [
9] and Wang et al. [
10] separately devised a fast, distributed multi-energy management framework using stochastic gradients and a multi-timescale scheduling framework based on a Stackelberg game. Meanwhile, Lin et al. [
11] concentrated on ultra-short-term scheduling, proposing a multi-timescale dynamic operation method that leverages the inherent flexibility of fluid networks and accounts for demand elasticity. The literature on IES scheduling has also introduced novel methods and concepts from the perspectives of optimization models [
12], algorithms [
13], uncertainty handling [
14], demand response [
15], and electricity markets [
16].
Despite this significant progress in cost, efficiency, and reliability, these studies typically concentrate on individual dimensions or a subset of these dimensions. A critical gap continues to be the absence of a unified framework that can comprehensively characterize the matching relationships between diversified resources and dynamic demands. Specifically, conventional models often fail in high-complexity scenarios where exergy degradation occurs, high-grade energy being wasted on low-grade demand, because they lack a rigorous “quality matching” logic. Furthermore, existing frameworks frequently decouple spatial transmission latency from dispatch signals, leading to temporal synchronization errors in large-scale networks.
The challenge of the matching relationship also occurs in a vastly different domain: modern military command and control (C2) [
17]. Modern warfare, defined by its rapid tempo and high-intensity offensive–defensive interactions, requires the seamless coordination of diverse operational assets across land, sea, air, and space. The central challenge of this endeavor can be formally framed as the classic weapon-target assignment (WTA) problem [
18]. As an NP-complete problem within operations research (OR), the objective of WTAs is to allocate heterogeneous weapon systems to a portfolio of targets to maximize overall combat effectiveness [
19]. In response, the military community has cultivated sophisticated joint command and control theories and the C4ISR (command, control, communications, intelligence, surveillance, and reconnaissance) framework. These advancements offer a powerful theoretical foundation and a technical paradigm for the efficient coordination of information flows and firepower allocation, especially within a cyber–physical system (CPS) context [
20,
21].
Research into the WTA optimization problem has predominantly centered on the development of novel algorithms and methods. Kong et al. [
19] introduced an improved multi-objective particle swarm optimization algorithm to tackle the dynamic weapon-target assignment (DWTA) problem. Silav et al. [
22] developed a novel bi-objective DWTA model that accounts for the disruption of initial allocation plans during an engagement, caused by factors such as target destruction, system failures, or the emergence of new targets. To address communication constraints, Hendrickson et al. [
23] formulated a distributed WTA method operable under asynchronous conditions. In pursuit of solutions that reflect decision-maker preferences, Wu et al. [
24] designed an enhanced algorithm based on the multi-objective evolutionary algorithm in a decomposition framework, which is applied in the multi-stage WTA problem. Furthermore, Kim et al. [
25] devised a WTA algorithm employing a rotation strategy and clustering to mitigate the reduction in kill probability from heading errors, which is solved using a mixed-integer linear programming framework. The applicability of reinforcement learning is explored by Liu et al. [
26], who demonstrated its feasibility for time-sampled dynamic weapon allocation. Extending this to complex scenarios, Wang et al. [
27] solved the multi-weapon-target assignment problem for unmanned ground combat vehicles in urban warfare by integrating a reinforcement learning framework with an improved multi-objective artificial bee colony algorithm.
While extensive research exists independently in both energy engineering and military science, the existing literature remains fragmented, with limited studies systematically addressing the integration of these two domains. This gap is not due to a lack of relevance, but rather the absence of a unified abstraction capable of bridging heterogeneous system characteristics across disciplines. Existing studies primarily rely on domain-specific formulations, which limit their transferability. Recent advances in CPS and cross-domain resource allocation provide a potential theoretical bridge. These studies highlight that structurally similar optimization problems may exist across different application domains, even when their physical interpretations differ. However, most existing studies focus on either standalone energy system design or military operational requirements, lacking a unified framework that simultaneously satisfies the dual constraints of energy efficiency and military operational reliability.
In this study, we move beyond a simple descriptive analogy between military and energy domains by identifying a fundamental structural isomorphism in their resource allocation logic. While IES focuses on matching multi-modal energy supply with heterogeneous demand, WTA is concerned with the strategic matching of weapon assets to hostile targets. We demonstrate that the effectiveness of matching in both domains is governed by a shared four-dimensional state-space: quantity, quality, space, and time. Correspondingly, we have explicitly emphasized that the mathematical framework is adapted from the WTA model’s optimization logic to avoid ambiguity about the research’s civilian focus.
Leveraging this insight, the “quantity–quality–spatiotemporal” (QQST) paradigm is systematically formalized. Unlike conventional multi-objective optimization that treats these constraints as additive or separable factors, the proposed QQST framework explicitly structures these dimensions into a unified, interdependent mathematical representation. Specifically, we define a generalized mapping function , where the four dimensions jointly determine the system utility . In this paradigm, supply–demand matching is reformulated as a multi-dimensional state-space mapping problem rather than a simple constraint satisfaction task.
The core contribution of this paper is the establishment of an explicit cross-domain transformation. We define a formal mapping where military weapon effectiveness corresponds to thermodynamic exergy , and target threat corresponds to demand-side quality requirements D. This mapping is formalized through equivalent constraint structures, ensuring that the military logic of preventing overkill is rigorously translated into the engineering goal of minimizing exergy destruction. The efficacy of this WTA-inspired methodology is validated using real-world industrial data from a steam-based energy network, demonstrating significant improvements in systemic exergy efficiency.
The remainder of this paper is organized as follows:
Section 2 details the comparative analysis between joint command and control and IESs, establishing the theoretical basis for the isomorphism.
Section 3 formalizes the proposed QQST mathematical framework and the cross-domain transformation functions.
Section 4 presents the industrial case study, quantitative results, and a critical discussion on practical applicability and sensitivity. Finally,
Section 5 concludes the paper.
2. Joint Command and Control Versus Integrated Energy Systems
To eliminate ambiguity and ensure reproducibility, a unified notation system is introduced for both WTA and IES formulations. All subsequent equations strictly follow this notation to avoid inconsistencies and indexing ambiguity (
Table 1).
2.1. Joint Command and Control
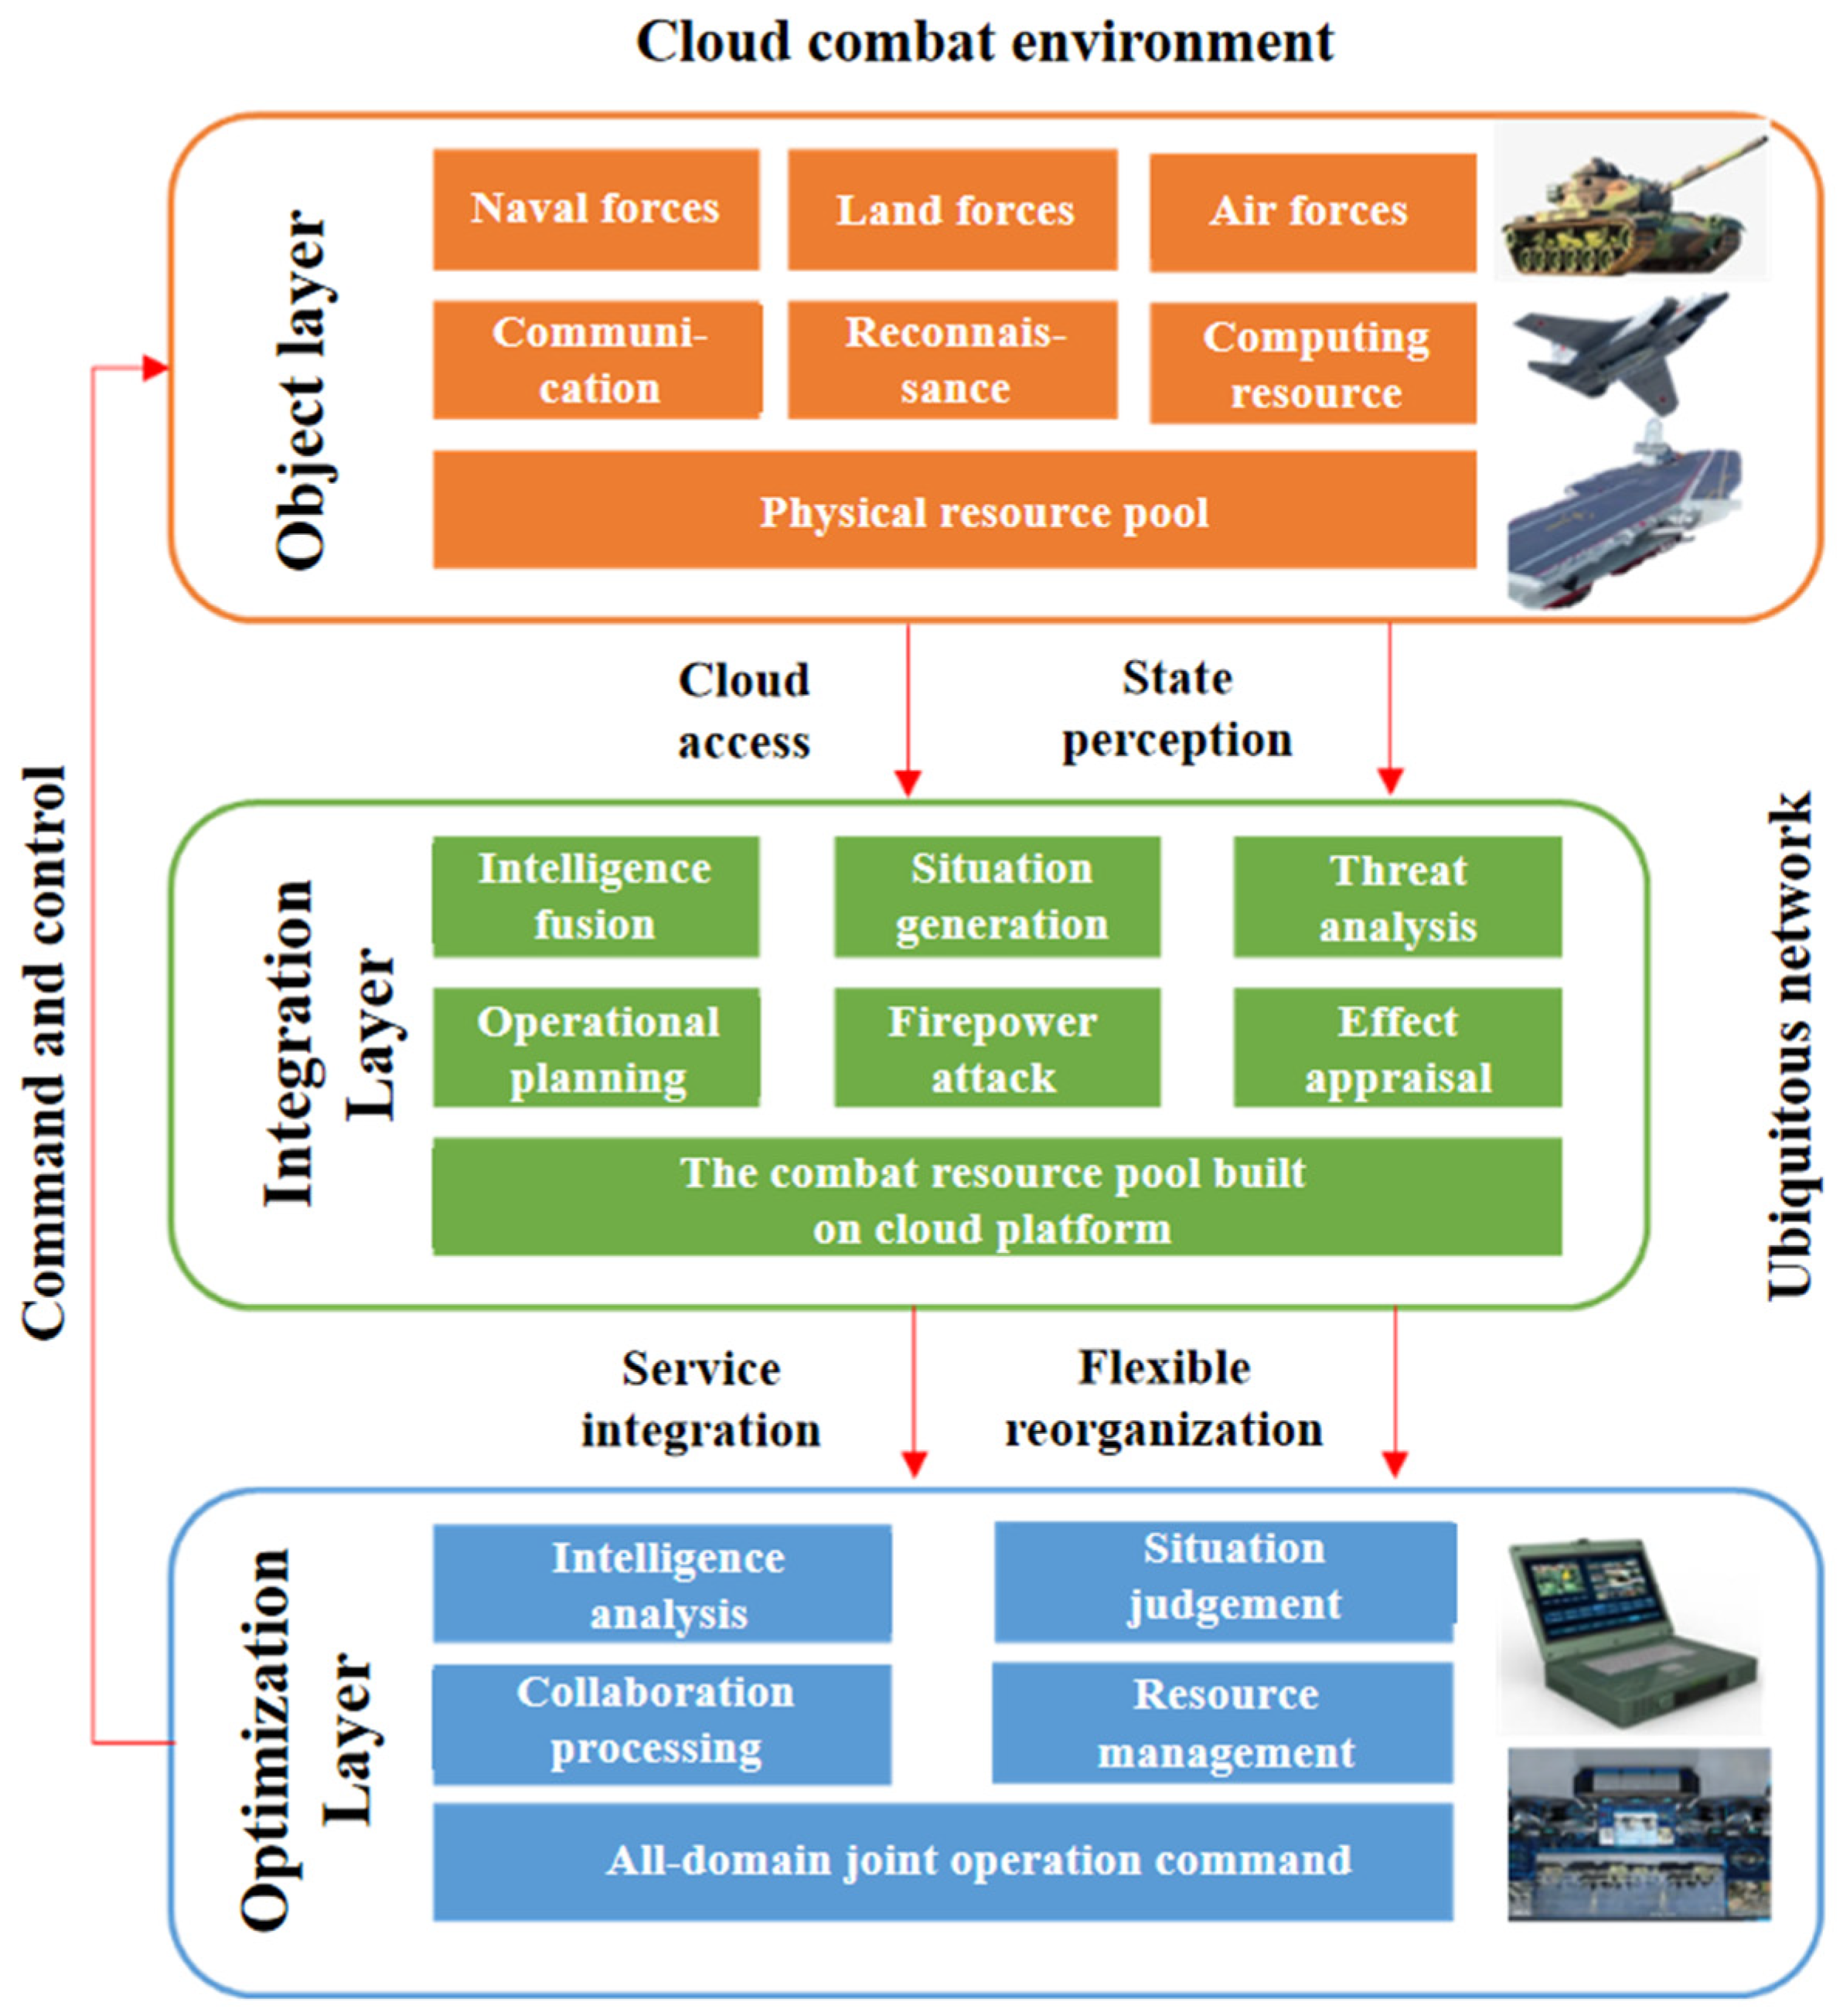
The architecture of C2 is a typical “cloud–network–edge” CPS [
28]. As illustrated in
Figure 1, the object layer (the cloud side) encompasses diverse operational environments characterized by cloud-based technologies. The physical resource pool serves as the foundation for the integration of naval, land, and air forces. It further incorporates communication, reconnaissance, early-warning, and computational resources to enable real-time simulation of the operational environment.
The integration layer (the network side) ensures connectivity and situational awareness, forming a cloud-based resource pool. This pool supports intelligence integration and operational planning, which in turn allows for the establishment of a global C2 system. A pervasive network connects disparate military assets to a unified cloud platform. These assets include naval, air, and ground forces, as well as surveillance equipment and communication nodes. This connection is possible regardless of geographical location or operational environment. Therefore, the integration layer ensures the true aggregation, integration, and sharing of information.
The optimization layer (the edge side) supports full-spectrum joint command functions, including intelligent intelligence analysis, comprehensive situational assessment, and real-time optimization of command strategies, which are subsequently transmitted to the object layer for execution.
The interaction among these layers is highly dynamic: the object layer executes physical strikes while transmitting real-time sensor data upward, the integration layer filters and synchronizes this data across disparate networks, and the optimization layer computes the allocation strategy based on the synthesized operational picture. Similarly, in IESs, the object layer executes flow adjustments, the integration layer aggregates multi-modal energy data, and the optimization layer resolves the QQST model to issue precise set-points, closing the feedback loop.
Leveraging a “cloud–network–edge” environment, the C2 system delivers global decision-making data. It employs intelligent algorithms to accelerate the decision cycle and integrates advanced decision-support tools to enable effective human–machine collaborative decision-making. The architecture ensures comprehensive all-domain situational awareness, on-demand resource aggregation, and agile command and control.
In the C2 architecture, the entire system comprises the integration of global resources at the cloud layer, the aggregation and sharing of information at the network layer, and the real-time optimization of command decisions at the edge layer. The C2 needs to be implemented during the execution phase of specific combat missions. Among these elements, the accurate matching between weapon systems and targets serves as the core support for translating the effectiveness of command decisions into actual combat effects. Only by dynamically adjusting the allocation strategy of weapon resources according to the battlefield situation can we achieve efficient strikes against threatening targets in complex adversarial environments, reduce resource waste, and ensure the overall accomplishment of combat missions. Therefore, it is essential to construct a scientific WTA model to quantitatively provide operable mathematical support for the decision-making execution of the C2 system.
The construction of the WTA model in C2 is based on weapon performance and target attributes, formulated as a supply–demand matching problem.
Suppose that, at time t, the enemy set WWTA consists of n threat targets, , while the weapon set BWTA includes m units across s categories, , and has the following relations: . The value of each threat target is derived from prior battlefield knowledge and operational rules. Denoting the threat degree of the j-th enemy target as Uj, the overall threat set can be represented as .
Define the weapon damage probability matrix as
QWTA = [
] and a strike decision matrix
XWTA = [
]. The combat effectiveness of the allocation scheme based on
XWTA is represented by the sum of all weapon damage probabilities in Equations (1) and (2).
where
is the probability that the
i-th weapon successfully damages the
j-th enemy target at time
t; the binary variable
indicates whether the
i-th weapon is assigned to target
j at time
t.
To ensure weapon resources are fully utilized, the cost of weapon consumption should also be considered in Equation (3).
where
Vi is the total unit cost for the
i-th weapon, and
vij is the unit cost of weapon
i to target
j. Since weapon costs may differ significantly [
29], normalization is applied, yielding
as the normalized unit cost of ammunition;
Vmin and
Vmax are the minimum and maximum of all weapon costs, respectively.
Accordingly, the WTA problem is formulated with the objective function in Equation (4) and constraints in Equation (5).
where
uj denotes the degree of threat of target
j; and
is the cumulative probability of damage inflicted on target
j;
is the damage probability threshold of target
j. The combined damage probability of assigned weapons against target
j should exceed
.
2.2. Integrated Energy Systems
In next-generation power systems, IESs are subject to strong fluctuations on both the supply and demand sides [
30]. The variability, which can occur on the order of minutes, complicates the allocation of multiple heterogeneous energy carriers. Consequently, the fluctuating conditions within IESs resemble the WTA problem.
The scheduling model of IESs can also be structured into three hierarchical layers: object, integration, and optimization layers. Each layer has relatively independent internal functions, while interaction between layers is achieved via automatic data flow [
31]. The automatic data flow includes four key stages: perception, analysis, decision-making, and execution.
At the object layer, intelligent devices collect operational status data, transforming energy flows into information flows. The integration layer processes the data using advanced control methods to provide references for decision-making. At the optimization layer, optimal strategies are generated under technical and economic constraints and transmitted to the object layer. Finally, the object layer executes the control commands, updates the system state, and ensures that the IES scheduling strategy evolves toward optimal operation.
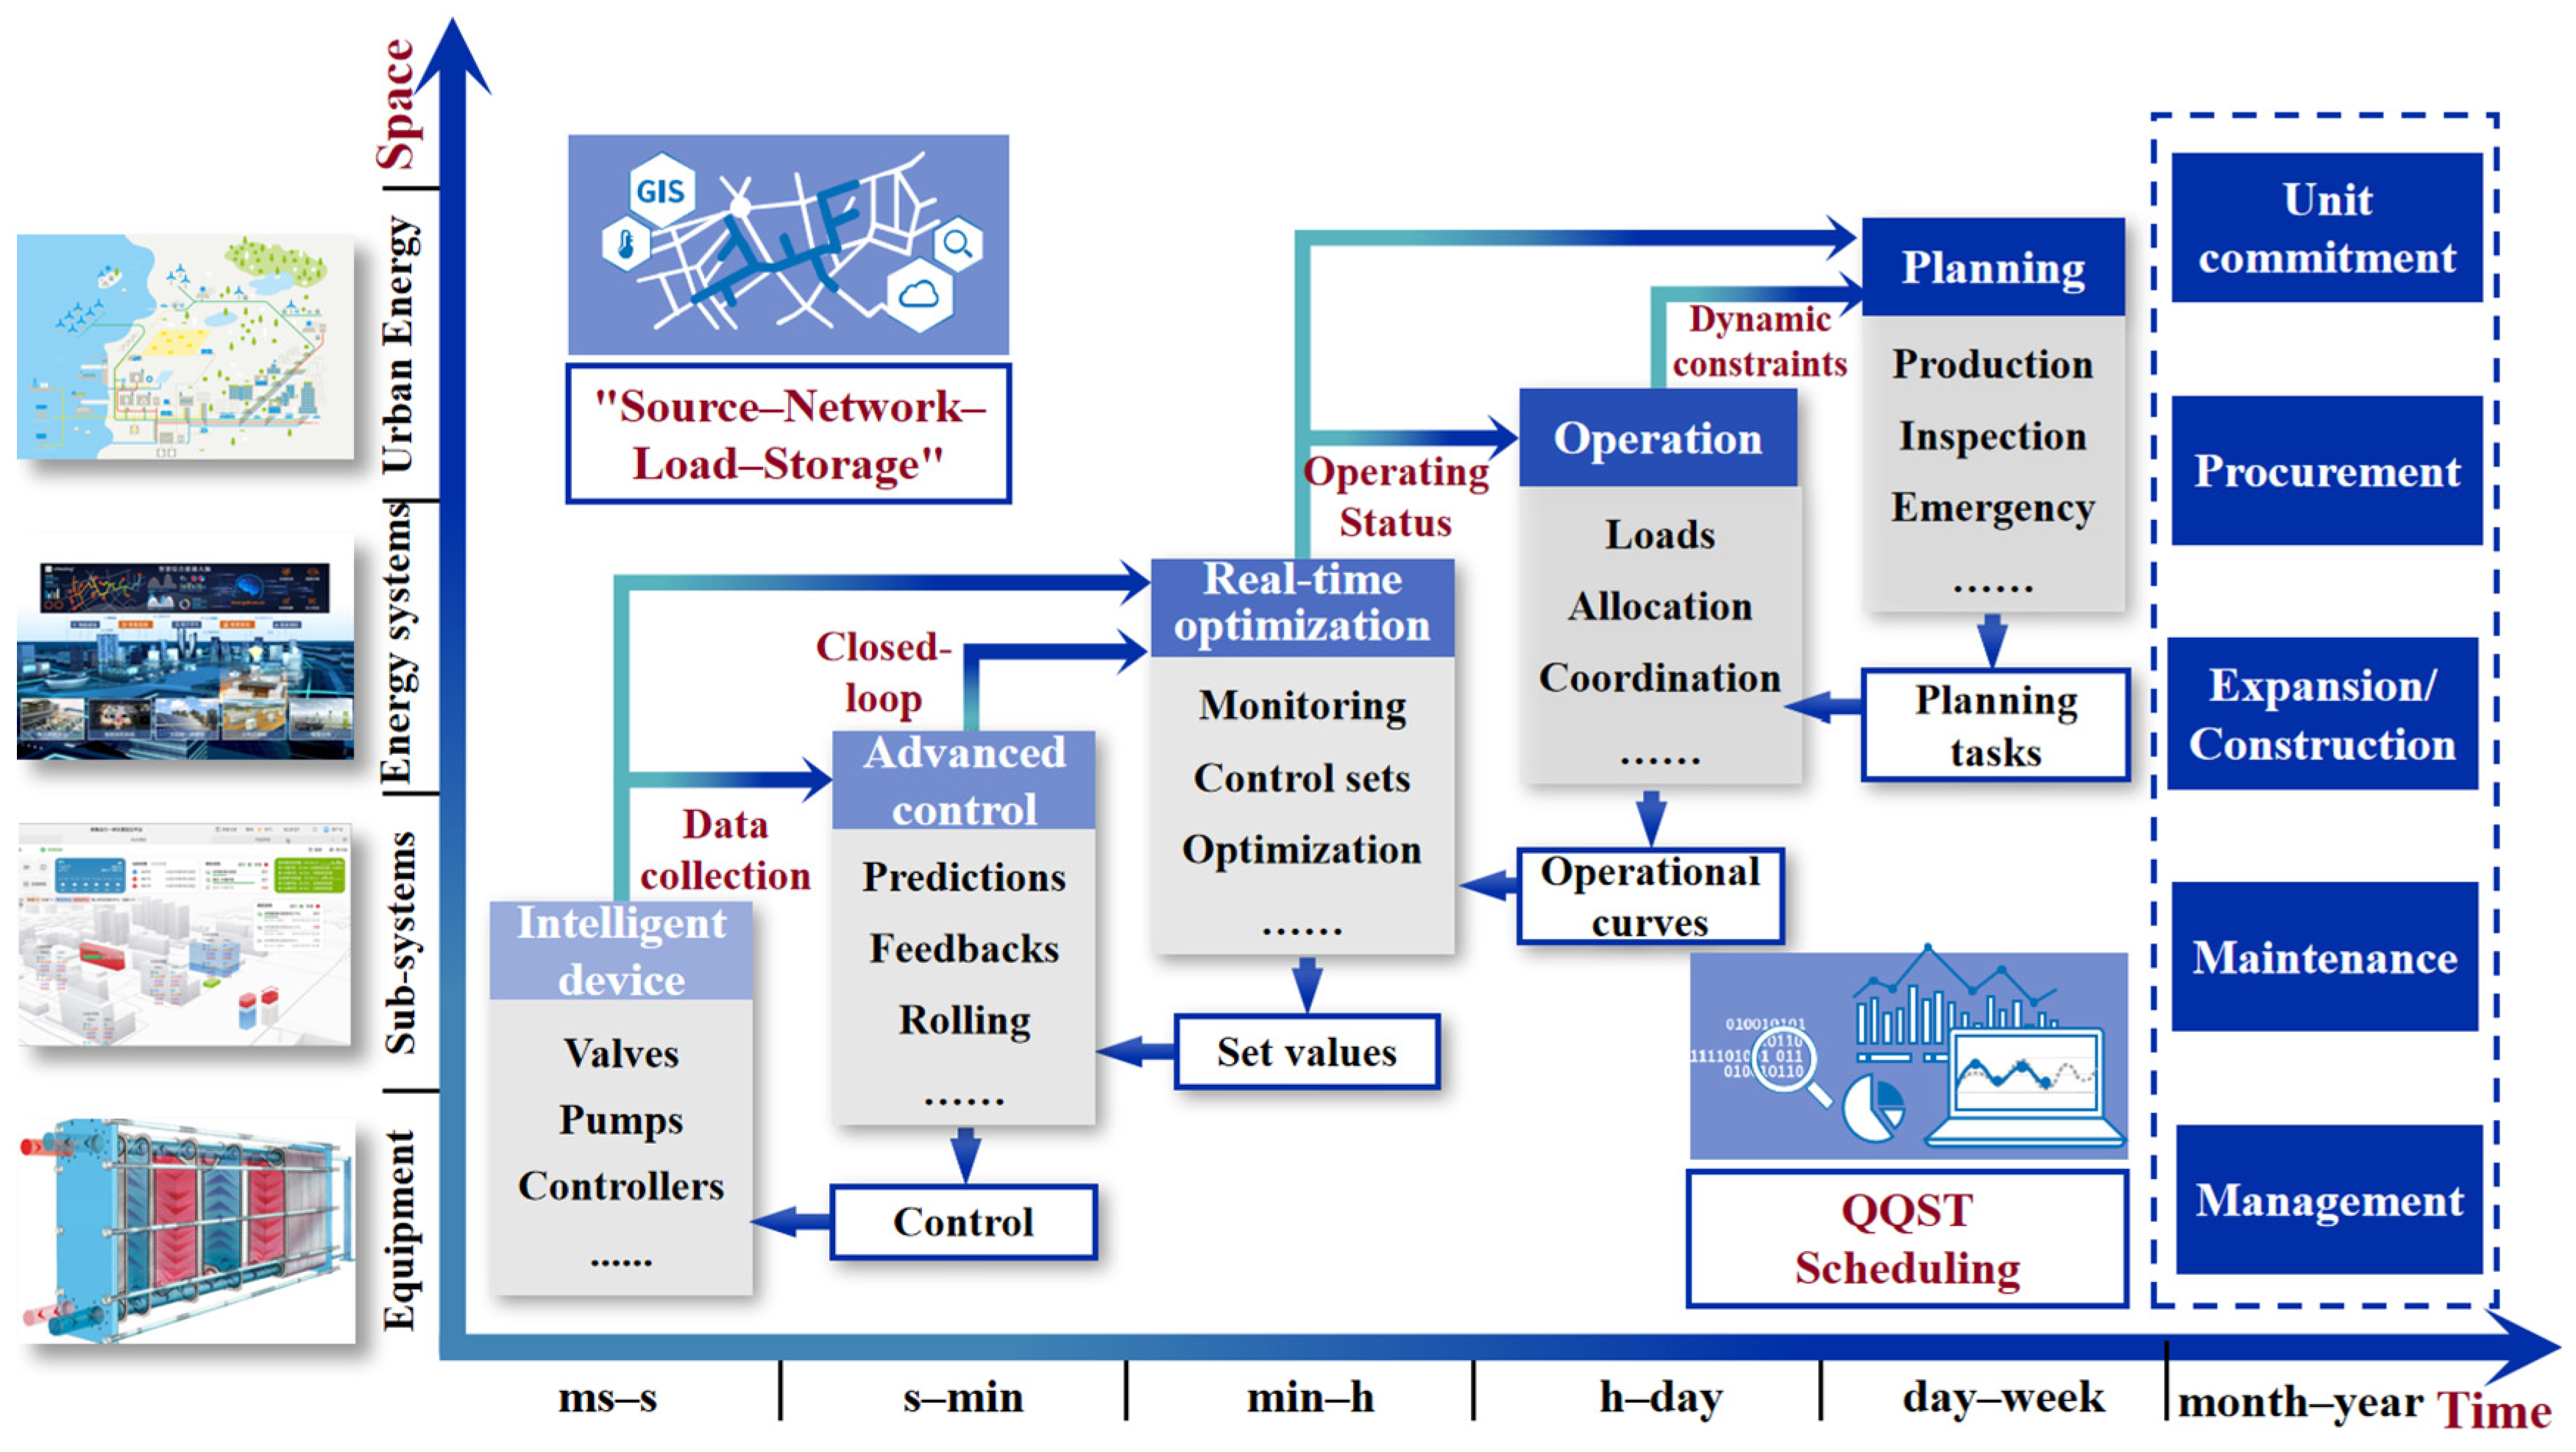
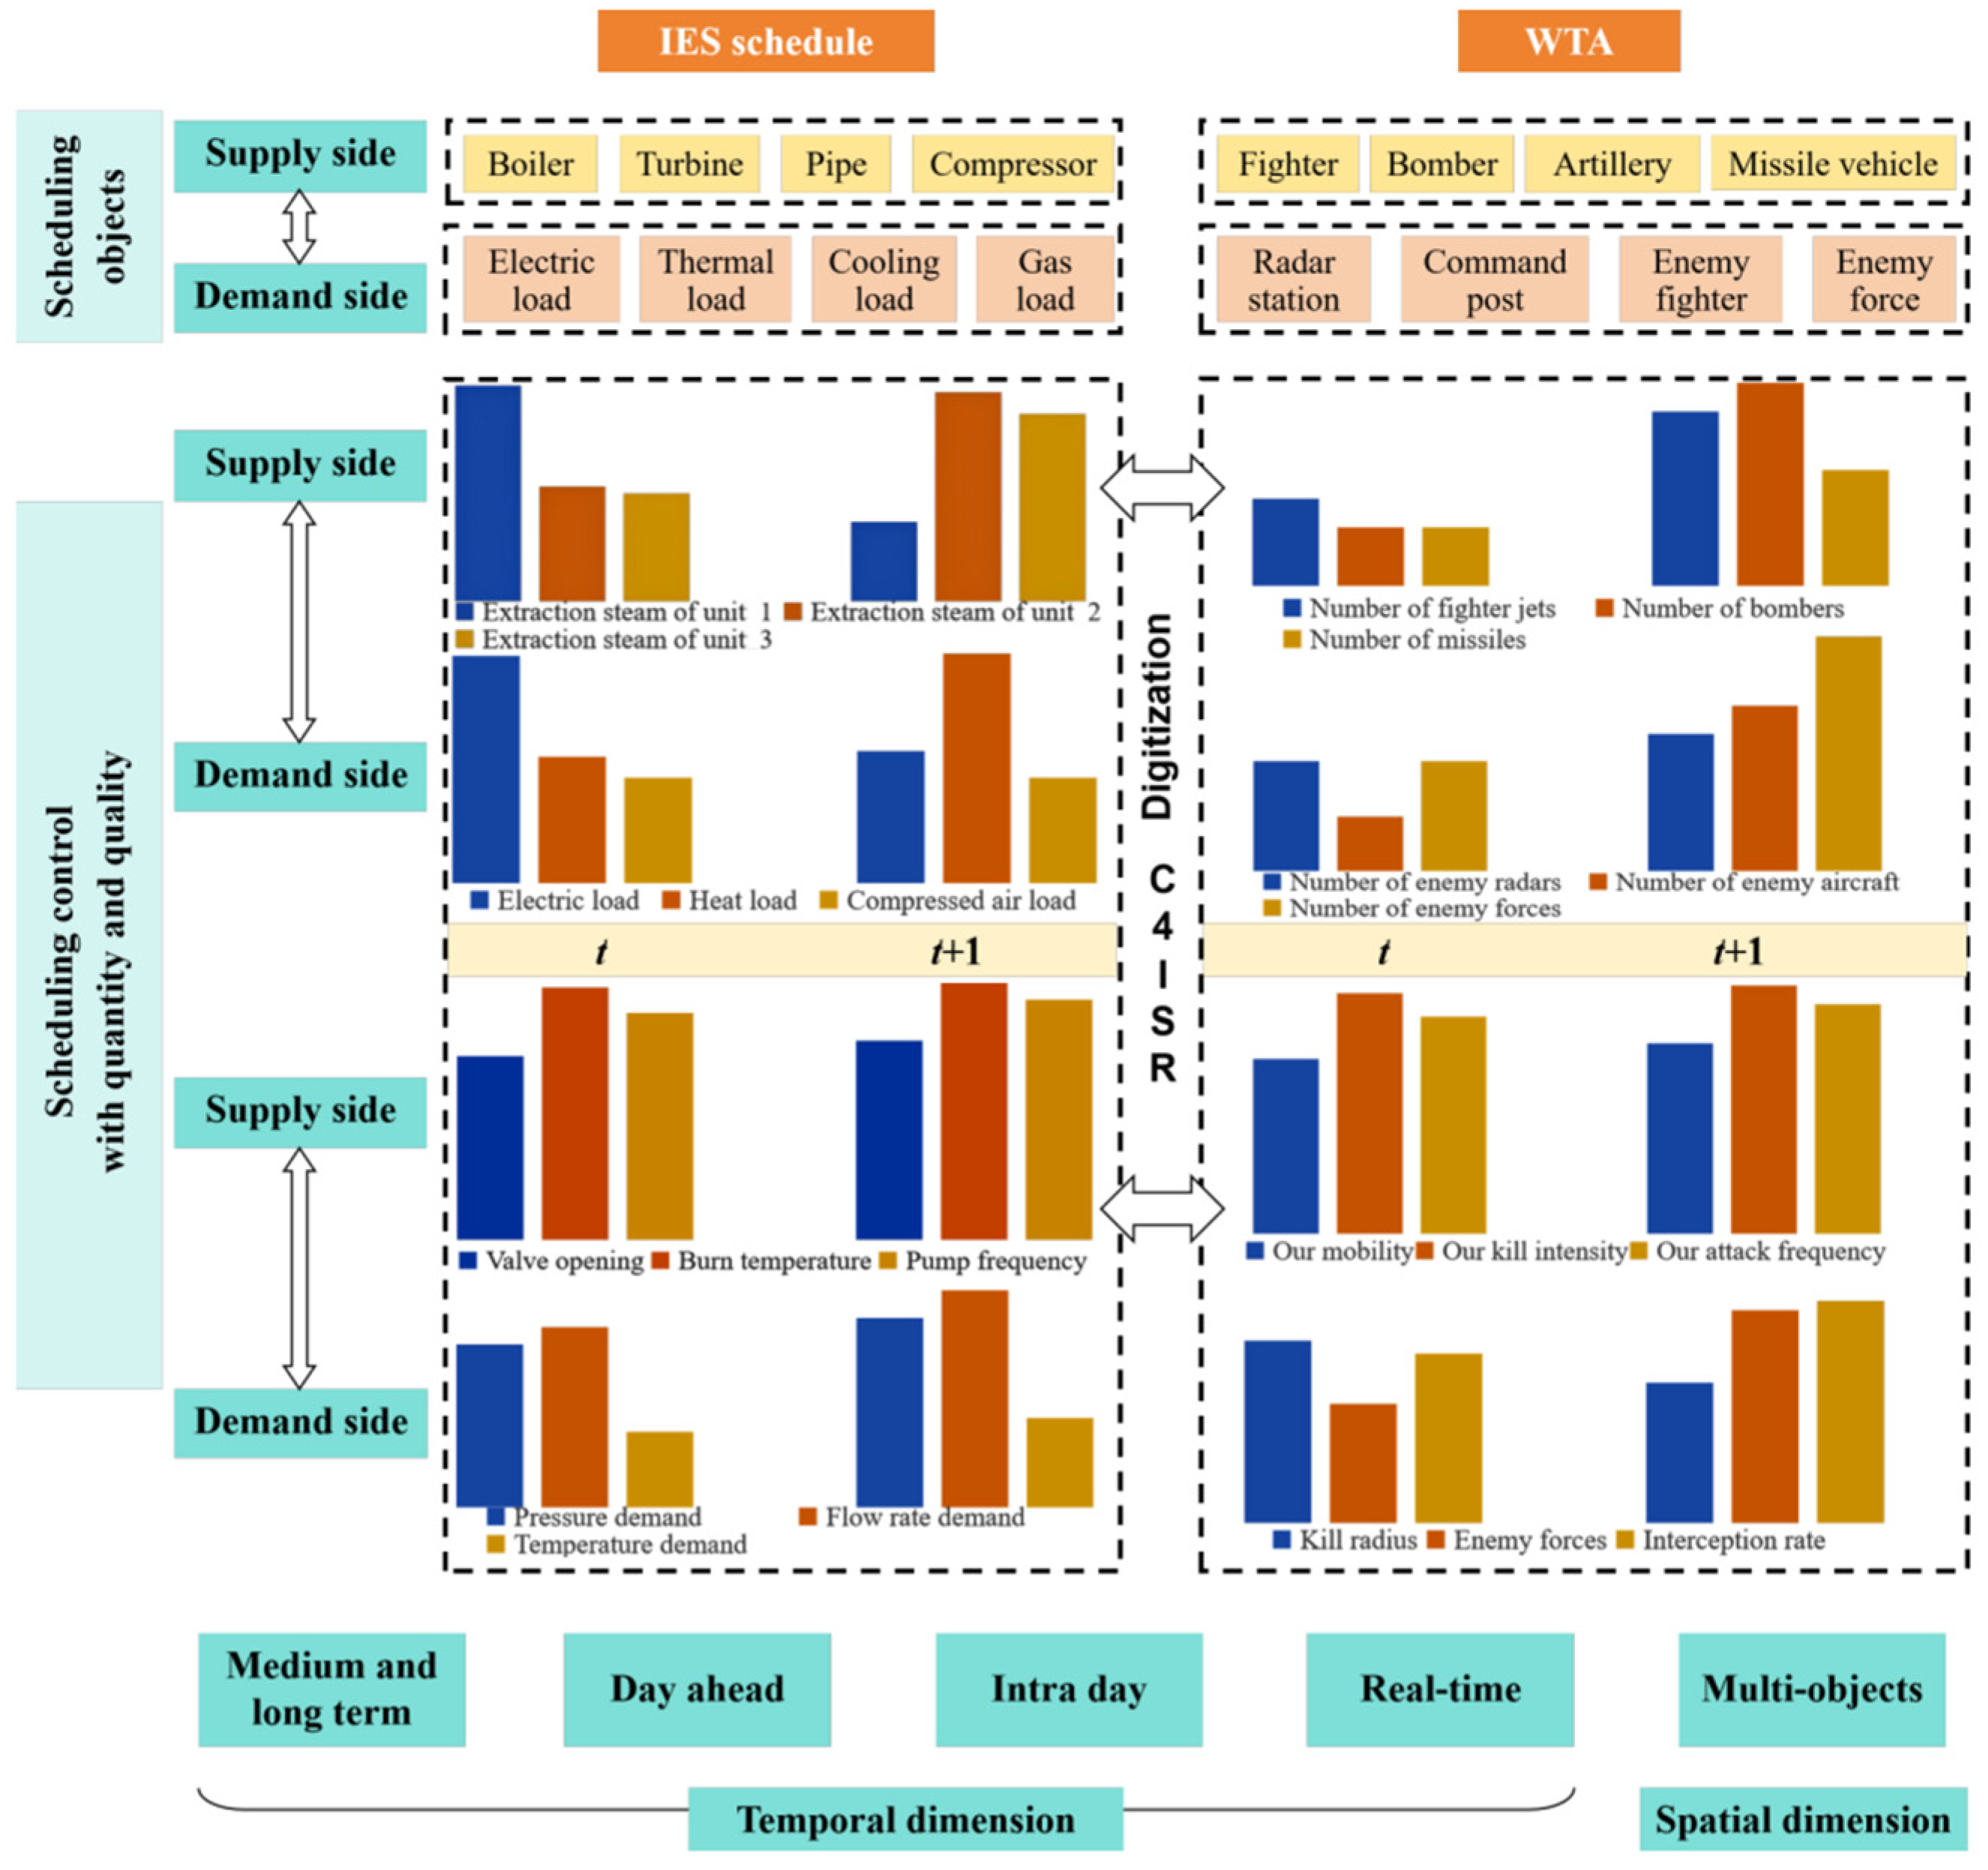
The IES scheduling corresponds to the dynamic assignment of energy demand and supply across spatiotemporal dimensions. Specifically,
Figure 2 demonstrates the hierarchical mapping mechanism inherent in the QQST framework. From a spatial perspective, the system transitions from localized device-level control (point) to regional multi-energy microgrids (surface), and eventually to city-wide integrated networks (volume), mirroring the tactical-to-strategic deployment in military C2. From a temporal perspective, the spatiotemporal dimension of the QQST paradigm is operationalized through a multi-layer feedback loop: high-frequency millisecond-level adjustments ensure quality stability, while hourly dispatch optimizes quantity distribution. This nested structure ensures that the heterogeneous resource allocation—a core tenet of WTA logic—is maintained even as the system scales. By decomposing the global optimization goal into coordinated sub-tasks across these dimensions, the framework effectively mitigates the computational burden while preserving the precision of the supply–demand matching.
A general IES model encompasses multiple dimensions, including energy carriers (electricity, heating, cooling, gas), devices, spatial distribution, and temporal variability. At time t, the demand set WIES consists of n demands, , while the supply set BIES consists of m energy sources across s energy types, , and has the following relations .
Define the efficiency of energy conversion and transmission matrix as
Q = [
] and a transfer decision matrix
X = [
]. The total profit based on
X and
Q is represented in Equations (6)–(8). It is noted that Equations (7) and (8) are represented for the constraints of IES scheduling, the demand satisfaction constraint, and the supply capacity constraint, respectively.
To ensure the energy consumption is minimized, the cost of energy should also be considered in Equation (9).
Therefore, the IES scheduling can be formulated with the objective function in Equation (10) and constraints in Equation (11).
2.3. Comparative Analysis
The architectural and operational similarities between command and control (C2) systems and integrated energy systems (IESs) suggest a shared underlying logic of resource allocation. However, to move beyond a purely conceptual metaphor, it is necessary to position the proposed QQST framework against existing state-of-the-art (SOTA) energy optimization methodologies, as shown in
Table 2.
As summarized in
Table 3, C2 and IESs exhibit common structural characteristics, including multi-objective coordination, multi-domain coupling, multi-constraint interactions, and fine-grained decision variables.
While C2 systems and IESs operate in distinct contexts—with C2 requiring high flexibility against adversarial battlefield dynamics [
32] and IESs prioritizing economic sustainability amidst market and renewable fluctuations [
33]—they converge at a fundamental level of resource allocation.
Beyond a purely conceptual analogy, these systems exhibit a structural isomorphism. Thus, we introduce a transformation operator
. This operator maps the probabilistic state-space of the weapon-target assignment (WTA) problem into the thermodynamic state-space of IES dispatch:
Under this transformation, the following functional equivalences are established:
Quality Equivalence: The weapon effectiveness/lethality index maps to the energy quality coefficient (EQC, ).
Demand Equivalence: The target threat level () maps to the load’s minimum quality requirement ().
Operational Logic: The objective of preventing overkill is mathematically translated into preventing exergy destruction.
The fundamental justification for this mapping lies in the non-linear degradation shared by both domains. In WTAs, the probability of destruction degrades with distance and counter-measures; in IESs, exergy degrades with transmission distance and entropy generation. By adopting the WTA-inspired QQST framework, IES scheduling can transition from simple quantity balancing to a strategic quality matching paradigm, ensuring optimal systemic efficiency under complex spatiotemporal constraints.
The classical WTA problem is a well-recognized NP-complete problem, which can be polynomially reduced to the set cover problem (a canonical NP-complete problem) as follows:
- (1)
Let each weapon correspond to a subset of targets that the weapon can destroy;
- (2)
The goal of selecting the minimum number of weapons to ensure all targets are destroyed is equivalent to the set cover problem (selecting the minimum number of subsets to cover the universal set).
By the structural isomorphism between WTAs and IESs, the QQST-based IES scheduling problem generalizes the WTA problem. Detailed proof can be found in
Supplementary Materials.
- (1)
Discrete binary allocation ∈ {0, 1} is extended to continuous flow allocation ∈ [0, 1];
- (2)
Kill probability constraints are extended to non-linear exergy degradation constraints .
Since NP-complete problems are a subset of NP-hard problems, and the generalized problem cannot be easier than the original NP-complete problem, the QQST-based IES scheduling problem is NP-hard. Notably, this is not a conversion of complexity classes but a reflection of the problem’s inherent generalization—continuous variables and non-linear constraints exclude it from the NP-complete class (restricted to discrete problems) but retain NP-hardness.
3. Quantity–Quality–Spatiotemporal Model
This section establishes the quantity–quality–spatiotemporal (QQST) framework as a structured optimization paradigm. Instead of treating quantity, quality, spatial, and temporal factors as loosely coupled constraints, the proposed approach reformulates the resource allocation problem as a unified multi-dimensional mapping, thereby explicitly capturing cross-dimensional interactions.
The QQST framework is defined over a state-space S = {Qs, Qq, S, T}, where Qs, Qq, S, and T denote quantity, quality, spatial, and temporal variables, respectively. The system objective is expressed as a non-separable mapping: U = (Qs, Qq, S, T), where U represents system utility. This formulation captures intrinsic coupling among dimensions, including quantity–quality compatibility, spatiotemporal interactions, and quality degradation during spatial transfer, thus transforming the problem into a structured multi-dimensional optimization model. The QQST model originates from command and control (C2) scheduling and is extended to integrated energy systems (IESs) through structural mapping, providing a unified representation of energy quantity, quality, spatial distribution, and temporal dynamics.
To ensure the mathematical tractability and structural isomorphism of the QQST framework, the following foundational assumptions are adopted for both the WTA and IES models:
Stationarity of Coefficients: It is assumed that effectiveness coefficients (kill probability in WTA and transfer efficiency in IES) remain constant within a single 15 min scheduling interval, neglecting ultra-fast transient fluctuations.
Deterministic Load/Threat Forecasts: The model assumes that short-term demand (energy loads) and operational environments (target threats) are known via high-fidelity forecasting systems, allowing for a deterministic optimization approach.
Linearized Network Constraints: While exergy degradation is non-linear, the physical flow constraints within the energy pipelines are linearized to maintain computational efficiency for real-time dispatch, assuming localized laminar flow conditions.
3.1. Quantity–Quality–Spatiotemporal Model for Weapon-Target Assignment
To clarify the theoretical positioning, QQST is not merely a decomposition of existing constraints, but a structured reparameterization of the optimization problem. By embedding physical and operational relationships into the mapping function F, the framework reduces the dimensional ambiguity present in conventional formulations and enables more consistent cross-domain modeling.
The WTA problem is NP-complete in its canonical form, which limits the applicability of optimization methods [
34]. To overcome this limitation and achieve higher solution precision with reduced computational time, an extension of the WTA problem into an NP-hard optimization framework is proposed. The new model is constructed upon a proposed QQST model. A key advantage of QQST is its ability to resolve the ambiguities inherent in traditional WTA models, which often oversimplify complex factors into a single probabilistic metric. By contrast, the QQST model offers a more granular and precise characterization by explicitly defining these factors across four independent dimensions. The proposed QQST model in WTAs is introduced sequentially below.
3.1.1. Quantity Model for Weapon-Target Assignment
In the quantity model of WTAs, there are two constraints, the firepower damage capability (Equation (12)) and ammunition limits for platforms (Equation (13)). Based on the supply–demand balance principles, Equation (12) considers enemy damage thresholds, while Equation (13) incorporates ammunition limitations for different weapons. Equation (12) ensures that the total expected damage inflicted on target j meets or exceeds its minimum required damage threshold. Equation (13) limits the total number of type-i weapons allocated to targets within its maximum available ammunition quantity. It can be observed that the quantity model for the WTA is derived from the original one from
Section 2.1.
where
wWTA j,min is the damage threshold for enemy target
j, and Λ
i,max is the maximum number of weapons of type
i.
Compared to the original model (Equation (1)), the quantity model strictly adheres to the principle of supply–demand matching, ensuring that the probability of all weapons failing is less than the 1 minus the damage threshold for enemy target j. Equation (13) is derived from Equation (12) through a natural logarithm transformation, which represents that the quantity of the i-th type of weapon cannot exceed its maximum quantity.
3.1.2. Quality Model for Weapon-Target Assignment
In WTAs, the Lanchester equation [
35,
36] (Equation (14)) is used to describe parameterized firepower predictions, but it does not account for weapon quality or target quality, which can lead to overkill or underkill and inefficient firepower use. To avoid the phenomenon, it is necessary to precisely match the quality of different weapons with the quality of targets, in order to maximize strike effectiveness while reducing dependence on high-quality weapons. A composite combat power index
is introduced based on indicators such as kill radius (
θ1), damage range (
θ2), attack frequency (
θ3), mobility (
θ4), interception rate (
θ5), kill intensity (
θ6), and hit rate (
θ7), as shown in Equation (15) [
37]. A constraint model is then developed in Equation (16). This constraint ensures that the combat capability of weapon i is sufficient to satisfy the quality requirement of target j. The indicators are selected based on
Table 3. These indicators comprehensively reflect the multi-dimensional combat capability of the weapon system, covering aspects such as attack, defense, and mobility, and can comprehensively evaluate weapon quality. The composite combat power index
θ constructed through these indicators can accurately quantify the matching degree between weapons and targets.
where
q,
λ and
A are damage probability, weapon damage rate parameter and weapon attack intensity, respectively;
ω represents the weight of each quality indicator, and
is the normalized value of each indicator. The weights
are determined using a hybrid Analytic Hierarchy Process (AHP) and Entropy Weight Method (EWM). AHP incorporates expert prior knowledge to establish the relative importance of operational indicators, while EWM objectively corrects these weights based on data variance.
Table 4 illustrates explanations of each indicator for a quality model in WTAs. A sensitivity analysis demonstrating the robustness of these assigned weights against a ±10% perturbation is detailed in
Section 4.
3.1.3. Spatiotemporal Model for Weapon-Target Assignment
The spatiotemporal model for WTAs involves time window constraints (Equation (17)), trajectory collision constraints (Equation (18)), and regional weapon capacity constraints (Equation (19)). These constraints restrict the engagement time of weapon i against target j within a predefined feasible time window, maintain a safe spatial distance between trajectories of different weapons to avoid mid-air collisions, and limit the number of weapons deployed in region z to not exceed its regional capacity limit.
The time window constraints stipulate that the engagement must occur within a predefined temporal interval. The trajectory collision constraints utilize three-dimensional spatial coordinates to calculate the distance between weapon trajectories, mandating that this distance remain below a designated safety radius
R to prevent potential collisions. Furthermore, the regional weapon capacity constraints impose limitations on the quantity of weapons deployed within a specific geographical area. Collectively, these constraints are employed to construct the spatiotemporal model for the WTA problem, ensuring the feasibility of weapon allocation schemes under temporal, spatial, and resource limitations.
where
X,
Y,
Z represent spatial coordinates,
R is the maximum radius of
m weapon units,
tij is the time at which weapon
i strikes enemy target
j, and Ω represents the regional weapon capacity. The indices in and out denote the entry and exit times of targets from the strike range, while
z indicates the region.
3.1.4. Optimization Model for Weapon-Target Assignment
By considering the QQST model, the WTA optimization function also can be rewritten as Equations (1), (3) and (20), with the overall optimization model formulated in Equation (21). In the model, Equation (1) maximizes the total strike damage probability, and Equation (18) minimizes the mismatch of weapon and target quality. These three objectives are in a trade-off relationship. Quality matching may reduce damage probability and increase ammunition consumption, while increasing damage probability may lead to excessive reliance on high-quality weapons, resulting in inefficiencies.
Through multi-objective optimization, the QQST model enables the balancing of multiple conflicting objectives. The QQST model can maximize damage probability while simultaneously minimizing weapon-target quality mismatch and controlling ammunition consumption. Traditional WTA models typically focus solely on maximizing damage probability; however, the QQST model can prevent the wasteful overuse of high-quality weapons, ensure proper matching between weapon quality and target threat levels, optimize overall combat effectiveness, and achieve optimal resource allocation while guaranteeing mission completion.
3.2. Quantity–Quality–Spatiotemporal Model for Supply–Demand Scheduling
On the supply side, IESs are characterized by multi-energy coupling, multi-scale temporal dynamics, and multi-agent participation. Accordingly, IES scheduling should consider the supply–demand characteristics of diverse energy carriers and the heterogeneous demands of loads, achieving supply–demand matching at the QQST level, which is inherently an NP-hard optimization problem.
Based on the aforementioned analysis of the WTA problem and the proposal of the QQST model-based WTA optimization model, the QQST model can be further extended to the IES schedule to achieve precise supply–demand matching under multi-energy coupling, multi-scale temporal dynamics, and multi-agent participation. The following sections will analyze the characteristics of QQST in the IES schedule and establish the QQST model.
3.2.1. Quantity Model for Supply–Demand Scheduling
The available weapon quantity in WTAs corresponds to the total energy supply capacity in IESs, while the damage threshold in WTAs corresponds to the load demand quantity in IESs. Furthermore, analogous to the situation in WTAs, where multiple weapons of diverse types can concurrently attack a single target, in IES scheduling, multiple energy supply devices and various forms of energy can, via conversion and transmission, concurrently supply a single demand-side user. Consequently, the two exhibit similarities in terms of quantity.
At time
t, the total energy demand of the system is denoted as
, while the total energy supply is
. Accordingly, the supply–demand balance at the quantity level satisfies the constraint in Equation (22), ensuring real-time balance between supply and demand across all demand nodes.
3.2.2. Quality Model for Supply–Demand Scheduling
Different types of energy in IESs have varying quality levels, expressed by exergy, which measures the maximum useful work attainable during a thermodynamic process. To avoid conceptual confusion often found in standard dispatch models, it is crucial to clarify that energy refers to the absolute quantity, whereas exergy denotes the energy quality. Electricity has the highest grade and can be converted into any form of energy; thus, its energy quality coefficient (EQC) is defined as 1 [
40]. Other carriers, such as cooling, heating, and natural gas, have lower EQC values depending on their thermodynamic state, as detailed in
Table 5.
Building upon the mathematical structure of the quantity model, we formalize the mapping between the WTA and IES quality dimensions. Rather than relying on a simple descriptive analogy, we define an explicit structural equivalence: the weapon quality index () in the WTA model maps directly to the comprehensive exergy coefficient of the energy supply () in the IES. Similarly, the target threat level maps to the minimum energy quality requirement of the load (). By doing so, the precise matching mechanics of WTA—which simultaneously prevent the overkill of targets and the overuse of high-value assets—are adapted to ensure that high-grade energy is not wasted on low-grade thermal demands.
During transmission, spatiotemporal latency and thermal dissipation cause additional losses, reducing the effective quality of the energy flow. The energy quality required by each demand node must not exceed the effective quality provided by its assigned supply sources, forming the structural quality constraint expressed in Equation (23). This constraint guarantees that the comprehensive energy quality provided to each load meets or exceeds its required energy quality level:
where
is the comprehensive quality coefficient of supply source i,
is the required quality coefficient of demand node j for energy type k, and
and
represent the EQC and other supplementary quality coefficients. Furthermore, to quantitatively evaluate the systemic performance of this quality matching paradigm, the overall exergy efficiency
is explicitly defined. It calculates the ratio of the total exergy effectively delivered to the loads against the total exergy supplied by the sources, formulated in Equation (24):
3.2.3. Spatiotemporal Model for Supply–Demand Scheduling
The spatiotemporal model encompasses both temporal scheduling and spatial allocation. The application of the spatiotemporal model in the IES schedule bears resemblances to the spatiotemporal strategies in WTAs. In the temporal domain, WTA necessitates the consideration of weapon deployment and response at different time points. Conversely, the IES attains temporal supply–demand equilibrium via energy storage devices, absorbing surplus energy when supply surpasses demand and releasing stored energy when demand exceeds supply.
In the spatial domain, WTA requires the consideration of weapon deployment and coordination across different geographical locations. Meanwhile, the IES realizes spatial energy optimal allocation through transmission networks and distributed facilities, minimizes transportation costs, and accounts for geographical disparities.
Moreover, renewable energy sources demonstrate spatiotemporal complementarity. Consequently, optimization demands the characterization of load variations in both time and space, as well as the variability of renewable energy generation, to achieve precise supply–demand matching. Therefore, in the IES schedule, by implementing the aforementioned spatiotemporal migration in energy transmission pipelines and energy storage equipment, it becomes feasible to achieve long-term scheduling across regions and time periods. Specifically, this implies satisfying the quantity model and quality model described in
Section 3.1.1 and
Section 3.1.2 in both the temporal and spatial dimensions.
3.2.4. Optimization Model for Supply–Demand Scheduling
Based on the QQST constraints, the optimization objectives of the IES schedule are formulated in Equations (25)–(27). Equation (26) quantifies the matching degree of the EQC between supply and demand. Equation (27) denotes the minimization of operational costs. Moreover, constraints such as device capacity, ramping limits, operational safety, energy balance, topology limits, and coupling relations are taken into account in the IES schedule.
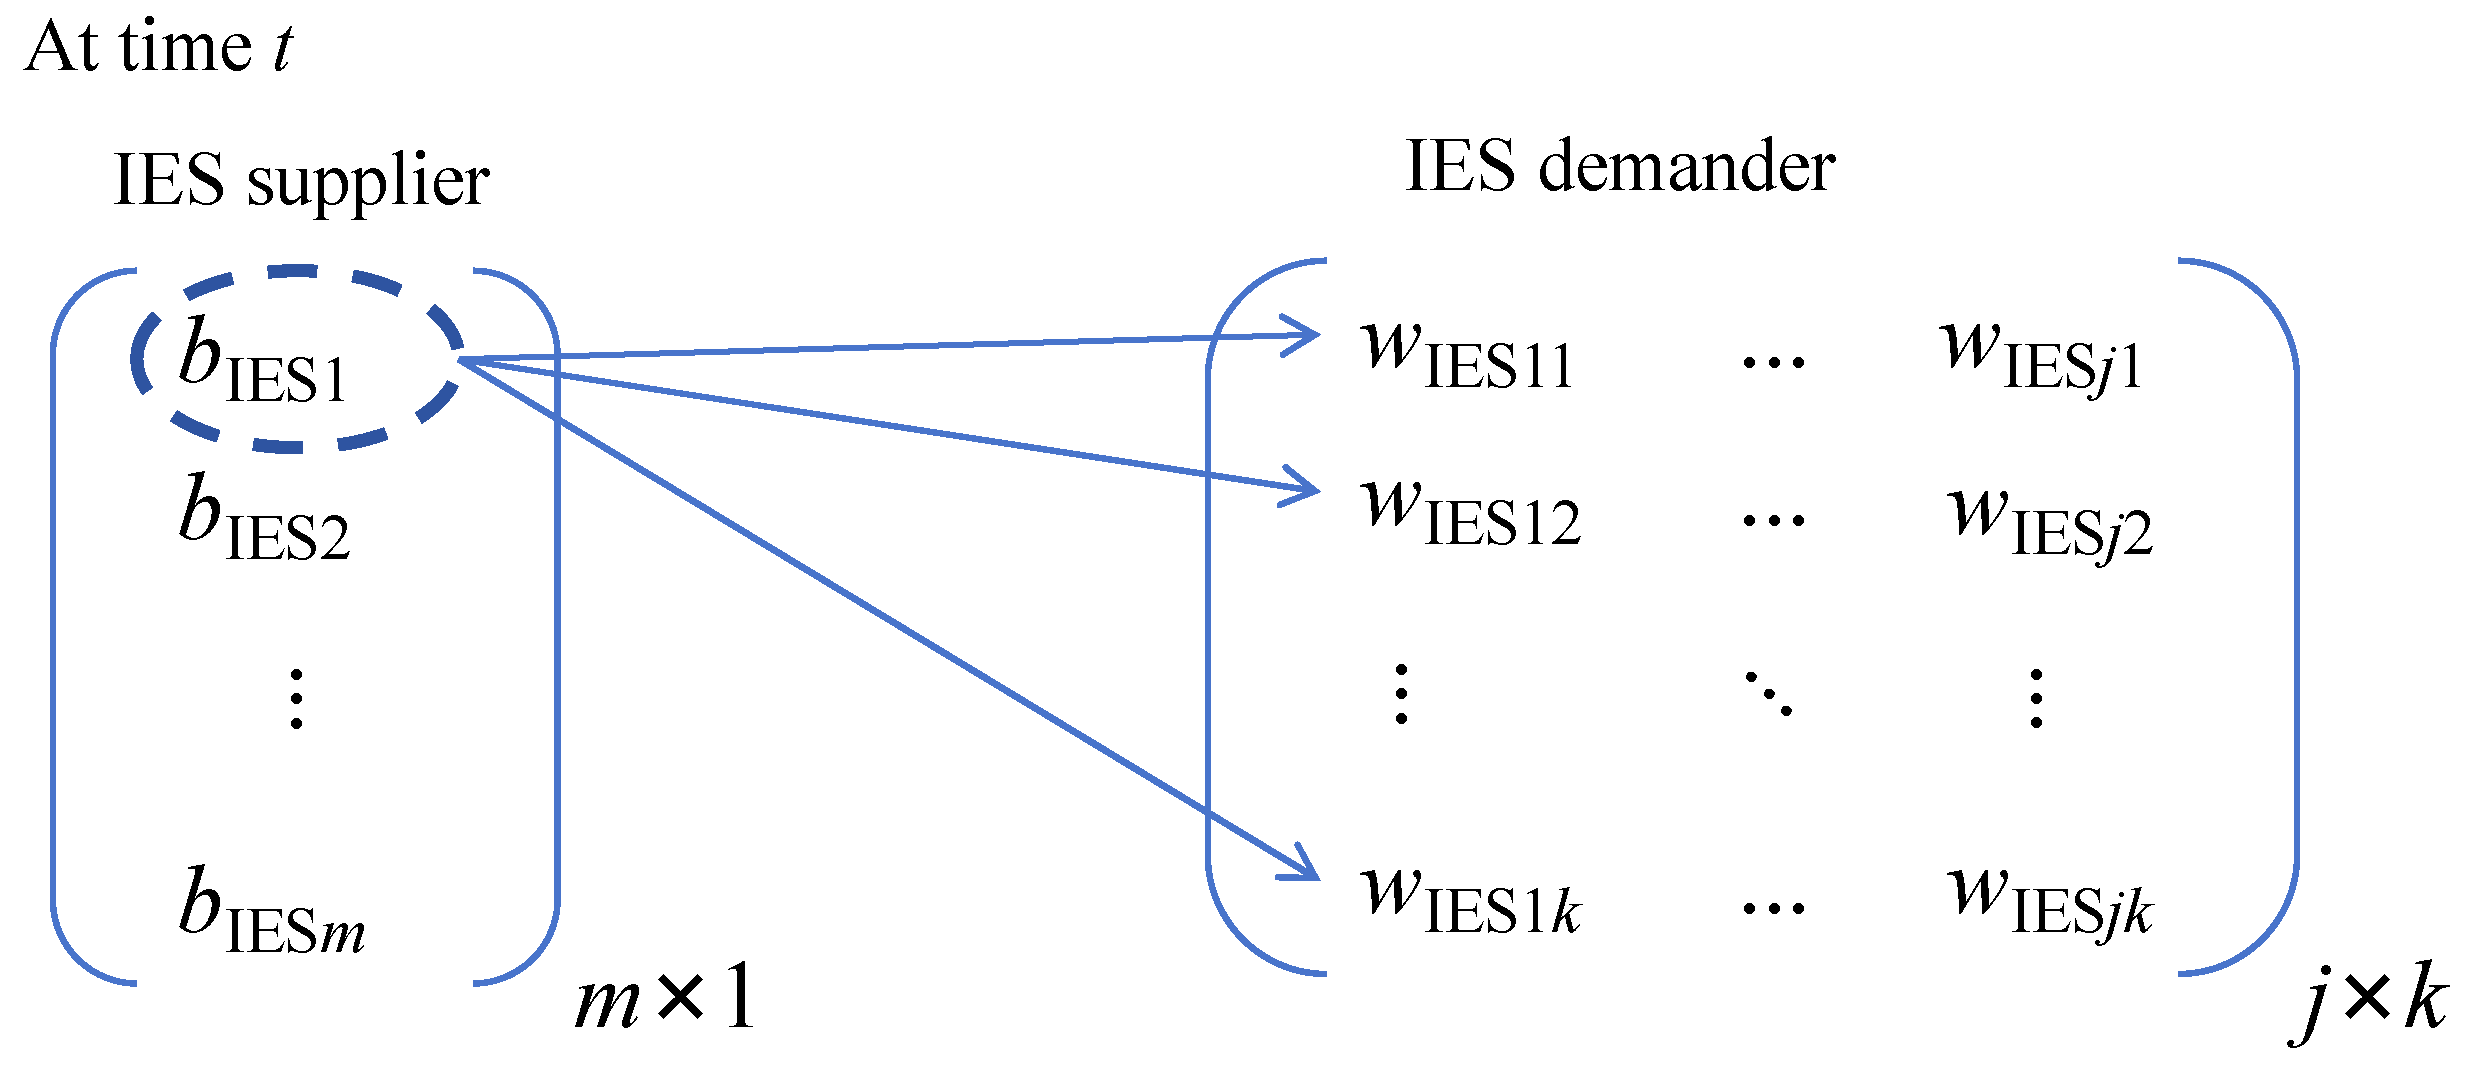
Figure 3 illustrates the EQC matching rules in the IES schedule, which are based on energy type conversion, depicting a scenario where one supplier corresponds to one demander with different energy types. In conclusion, the QQST model enables the simultaneous optimization of quantity–quality matching and spatiotemporal coordination in the IES schedule, thereby expanding the IES schedule methodology.
where
denotes the number of supply sources serving the demand node
j, with constraint
<
m, meaning not all supply units simultaneously provide energy to a single demand node.
3.3. Optimize Solution Settings
To ensure the commensurability of heterogeneous objective functions, namely the minimization of operational costs (in monetary units) and the maximization of exergy efficiency (as a ratio), a min–max normalization approach is employed. The normalized cost index is defined as follows: , where and represent the theoretical lower and upper bounds of operational costs or ammunition expenditure in WTAs determined by single-objective optimization under extreme scenarios. This transformation maps the cost into a dimensionless interval [0, 1], preventing the objective function from being dominated by variables with larger absolute numerical scales.
The computational complexity of the underlying problems should be clarified. The classical WTA problem is NP-complete, while the IES scheduling problem with mixed-integer and multi-objective characteristics is generally NP-hard. The proposed QQST framework does not alter these complexity classes. Instead, it provides a generalized reformulation that embeds quality and spatiotemporal coupling into the model structure, resulting in a mixed-integer optimization problem.
Although the worst-case complexity remains unchanged, the structured representation improves modeling clarity and facilitates solution strategies. In this study, the QQST-based model is solved using an MILP formulation with appropriate linearization, ensuring practical computational tractability.
To address the non-linear constraints in the QQST model, the linear approximation methods are adopted. For exponential non-linearity (the Lanchester equation in Equation (14)), A 1D piecewise linear approximation is employed, where the variable is partitioned into 3–5 segments to balance approximation accuracy and computational efficiency. For product-type non-linearities, including multiplicative terms in the WTA damage constraint (Equation (12)) and bilinear couplings in the ammunition limit constraint (Equation (13)), a 2D piecewise linear approximation is utilized to explicitly preserve the coupling relationship between variables. Specifically, for the Euclidean norm in the trajectory collision constraint (Equation (18)), the norm is first squared to eliminate the square root, converting it into a sum of quadratic terms; McCormick relaxation is then applied to these quadratic/product terms, generating linear constraints.
5. Conclusions
A comparison of the architectures of the C2 and the IES is presented. By proposing and comparing the WTA model for C2 with the IES schedule model, the inherent QQST characteristics within the WTA model are revealed. A QQST optimization model framework for WTA is established, and based on the structural isomorphism between C2 and IES, an analogous QQST optimization model for the IES schedule is formally developed. The QQST characteristics of IESs are then validated using a real-world industrial case study, with comparative experiments demonstrating that the proposed model outperforms the traditional MILP method by 8.4% in exergy efficiency and 18.2% in quality mismatch reduction, while maintaining computational tractability.
Despite the theoretical advancements proposed by the QQST framework, several practical limitations must be critically acknowledged. First, transforming the scheduling task into an MINLP problem introduces a substantial computational burden, which may challenge real-time operational feasibility under extreme or large-scale network conditions. Second, the framework relies heavily on high-fidelity, synchronous data acquisition; therefore, its effectiveness is highly sensitive to sensor latency and data availability. Finally, although the military analogy employed in this study offers robust optimization logic, our research is confined to civilian integrated energy systems (IESs) and thus cannot be directly applied to military scenarios without extensive reconfiguration and adaptation. Furthermore, the practical deployment of real-world civilian integrated energy systems is constrained by regulatory policies, economic limitations, and energy market dynamics, all of which are typically absent or differ substantially in military contexts.
Future research will focus on addressing these limitations by integrating stochastic optimization to better handle renewable uncertainty, developing distributed computing architectures to reduce computational burdens, and explicitly incorporating market mechanism constraints into the QQST multi-agent scheduling framework.




 ,
,