


Abstract
Dynamic wireless power transfer can reduce electric vehicles’ charging downtime and range anxiety, but its benefits depend on route characteristics and system design. This work develops an integrated numerical framework combining (i) route-specific drive-cycle analysis, (ii) identification of candidate charging segments based on speed, stops and slope constraints, (iii) a physics-informed inductive wireless power transfer model and (iv) a Matlab/Simulink vehicle energy model to quantify energy demand, transferred energy and state-of-charge evolution. Two vehicle types (a passenger light-duty vehicle and a light commercial van) and multiple Lisbon Metropolitan Area routes are analyzed, including commuting, ride-hailing and urban logistics operations. Results show that low-speed, stop-rich urban corridors achieve the highest transfer rates (typically 0.4 kWh/km and over 2 kWh for more than 15 stops in the analyzed cases), whereas expressway deployments are much less effective (down to 0.1 kWh/km and 0.5 kWh below 5 stops) unless congestion lowers average speeds. The proposed workflow provides a replicable basis to identify candidate segments and to size wireless power transfer and corridor length for city-scale deployment scenarios.
1. Introduction
The transport sector used circa 30% of the final energy consumption in the EU in 2021 and was responsible for circa 24% of greenhouse gas (GHG) emissions in 2021 [1,2]. Road transport represents more than 90% of the energy associated with this sector, with gasoline and diesel being the main energy vectors [1]. Consequently, road transportation represents 76.2% of the total transportation sector GHG emissions [1].
The recently introduced European Green Deal has a major focus on the transportation sector, setting a 55% reduction in CO2 emissions from cars and 50% reduction from vans in 2030 and sales of all new light-duty vehicles compliant with zero CO2 emissions in 2035 [3]. Moreover, it is expected that until 1 January 2030, an incentive mechanism will be deployed for zero and low emission (up to 50 gCO2/km), namely battery electric vehicles (BEVs), fuel-cell electric vehicles (FCEVs) and plug-in hybrid electric vehicles (PHEV) [4].
The adoption of light-duty passenger BEVs has risen over the last few years, reaching a market share of 15% of new vehicle sales in Europe in 2023, while BEV vans only have a 8% market share in the same time period [5]. A global review regarding the adoption of BEV [6] indicates that there are some factors contributing to its small adoption, namely the reduced availability of charging stations and charging times, limited driving range and high purchase cost, among other aspects. However, countries that adopted policy incentives, such as tax benefits, free parking or reduced charging costs, have contributed to boosting the sales of BEVs [6]. Psychological and situational aspects, such as practical experience with BEV prior to the purchase, reduced energy and air pollution awareness, contribute in a very positive way to adopting BEV technology [6].
The environmental and energy efficiency advantages of BEVs compared with ICEVs (internal combustion engine vehicles) are often shadowed by the range limitations and charging times, which are barriers to their adoption. The technology used to charge EVs currently available on the market is only plug-in charging and is based on the use of a charging system through a physical connection between the EV and the electric grid, and the charging modes are well defined by the IEC 61851-1 [7]. Consequently, not only the availability of the infrastructure, but also the charging type (slow, fast, rapid, ultra-rapid) deployed are important aspects regarding the operation of a BEV.
In this sense, Wireless Power Transfer (WPT) has emerged as an alternative way to charge BEVs. This system does not need cables and plugs; communication between the charger and the car is automatic, bypassing all the disadvantages of the traditional charging system (plug-in) [8]. The WPT system is also less prone to vandalism, safer in inclement weather and requires less maintenance than traditional plug-in charging [9]. However, the drawbacks of WPT are related to its efficiency, particularly for big air gaps and misalignments [9]. SAE J2954 Recommended Practice [10] introduces a classification for WPT considering the rated power, distance between ground assembly (GA) and vehicle assembly (VA) WPT elements, a range of misalignments and working frequency.
There are several available WPT technologies, although the most interesting for vehicles are inductive power transfer (IPT) and resonant inductive power transfer (RIPT) due to their high efficiency and capacity to transfer a range of power within an air gap suitable for vehicles [11]. There are three major application options that seem to be quite viable if directed and routed to the right target audience: static charging, quasi-static charging and dynamic charging [12].
The most challenging application of this technology would be dynamic charging. This concept entails the installation of numerous wireless chargers in sequence along a sufficiently long stretch of road. Here, an EV could travel at a certain speed without needing to stop or decelerate substantially for battery charging. This setup is envisioned for urban areas where the prevalence of EVs justifies the deployment of these chargers, and the low average vehicle speed in such zones would extend the duration of energy transfer. Conversely, this system is also apt for highways, where wireless charging could be implemented along even more extensive road sections to ensure substantial charging. Nonetheless, it was found that energy transfer decreases with increasing speed [13].
Inductive Power Transfer (IPT) is currently the most well-established method for Wireless Power Transfer (WPT) in Electric Vehicles (EVs). It operates on the principle of induction using a pair of air-core coils, one transmitter on the road (ground assembly—GA) and a receiver on the vehicle (vehicle assembly—VA). A dynamic magnetic field is created around the structure when a time-varying current is supplied to the transmitter coil, also known as the primary coil. If a receiver or secondary coil is positioned to intercept some of this flux, a voltage is induced, thereby transferring energy to the battery. Faraday’s Law states that the amount of energy transferred is proportional to the secondary coil’s ability to intercept as much magnetic flux as possible. The magnetic field flux in these systems is determined by the primary current and the relative position of the transmitter and receiver coils. The main strategies applied to maximize the magnetic field flowing through the secondary coil are advanced coil design and inclusion of compensation topologies [8].
RIPT is an advanced version of IPT, since it uses a compensation topology in both circuits (primary and secondary) to create resonance and to reduce power losses by limiting reactive power consumption. This requires the introduction of compensation topologies to align voltage and current towards a zero phase angle, or operating at resonant frequency [14]. However, like other WPT systems, the main AC current is converted into a high-frequency current, which feeds the primary wiring. The receiver power is converted to DC to feed the battery through additional electronics and filters in the receiver’s electrical circuit.
Based on the available literature, the vast majority of projects, research and studies on WPT use the RIPT system [15], as it is possible to significantly reduce energy losses and make this process more efficient by using the appropriate resonance frequency. There are four basic types of compensation topologies: series-series (SS), series-parallel (SP), series-parallel (PS) and parallel-parallel (PP). Primary compensation is necessary to eliminate the phase difference between current and voltage and to minimize the reactive power of the source. Additionally, using secondary compensation maximizes the power transfer and efficiency [16]. Furthermore, when choosing network topologies, it is crucial to consider the specific application of the WPT system and understand the requirements essential for its optimal functioning. For instance, SS and SP are suited for high power transfer [17] and have a decrease in total impedance, generating a higher current both in the load and the source, even with misalignment, which might be unsafe for the source [18]. Conversely, PS and PP topologies have an increase in total impedance with misalignment, which is safer for the source when there is no secondary coil [18].
The use of multiple elements in a series-parallel combination makes the compensation method effective in overcoming the challenges of basic compensation. Multi-resonant compensation topologies can reduce misalignment effects, improving coupling and global efficiency of the WPT [8]. However, additional elements can cause more losses compared to single-resonant compensation, especially for high-power applications.
The coil design can also contribute to improving the coupling coefficient between the charging coil (in the GA) and the pick-up coil (in the VA). Certain combinations of the shape and type of the coils may be more beneficial for static charging, and other combinations for dynamic charging. Taking into account the efficiency, the losses, the possibility of hot-spots, the minimization of space and weight of the structure, as well as the ease of installation of the coil design, it is concluded that a circular coil would be the most suitable for WPT [17]. A circular coil is more practical to implement in both EVs and on public roads due to its weight and cost advantages, compared with more sophisticated designs [19,20]. To enhance the efficiency of a coil, ferrite bars and an aluminum plate are commonly employed to create a low-reluctance flux path and minimize flux leakage. However, misalignment can significantly impact mutual inductance on circular coils [19].
In order to increase the energy transferred to EVs using WPT, one of the solutions is to install more than one receiver in the vehicle, and this way, the whole primary system is maintained; only the number of receiver systems in the EV chassis is changed. In this way, by having two receivers for each charger on the road, twice as much energy is transferred to the car battery as using only one receiver [21]. This technique is used in larger vehicles, such as goods and passenger heavy-duty vehicles, so that the charging power increases significantly. Companies such as WAVE [22] and Inductev [23] and pilot tests such as Smartroad in Gotland [24] or FABRIC [25] use inductive charging to achieve powers in the range of 20–450 kW.
The objective of this study is to quantify the energy and environmental impact of wireless charging across various types of trips and electric vehicles. Speed cycles for each trip from previous research enable route analysis to identify suitable stretches for wireless charging deployment. In parallel, a wireless charging system is developed to establish the relationship between charger power, number of receivers, coil design, current values and operating frequency. The gathered data is organized and implemented in a Matlab-Simulink model, where a specific route is simulated to determine the vehicle’s energy consumption and the energy transfer performance of the wireless charging system. Effective communication between all four modules—trip analysis, speed cycle, wireless charging system design and energy simulation—is essential to ensure the model operates under optimal conditions.
This work makes three main contributions: (1) it proposes an integrated numerical workflow that couples route definition and drive-cycle analysis with a physics-informed WPT module and a Matlab/Simulink vehicle energy model to quantify vehicle energy demand, wireless energy transfer and SOC evolution along real routes; (2) it defines a replicable, rule-based siting heuristic for dynamic WPT lanes using explicit operational and geometric thresholds (e.g., speed, stop events/traffic lights, speed limits and longitudinal slope) to generate a charging-availability profile along each route; and (3) it applies the framework to multiple Lisbon Metropolitan Area use cases (commuting, ride-hailing and urban logistics), providing quantitative evidence on where WPT is most effective and showing how transferred energy varies with average speed and stop density.
2. Materials and Methods
To evaluate the impact of WPT technology on EVs, a model was developed using Simulink, a toolbox within MATLAB (R2023a), to analyze the technology’s scalability and influence on a given trip, for a specific vehicle. The model focuses on assessing its effects on vehicle performance, extended driving range and other critical factors. Additionally, the study aims to determine the most suitable road types for wireless charging deployment—such as highways, residential streets, or secondary roads—towards achieving optimal energy transfer rates (kWh/km).
2.1. Numerical Tool
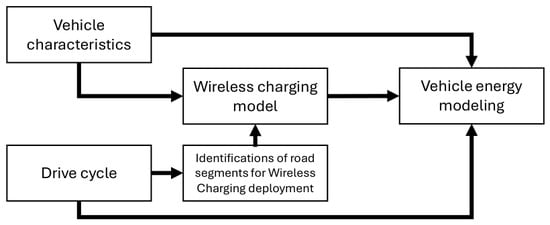
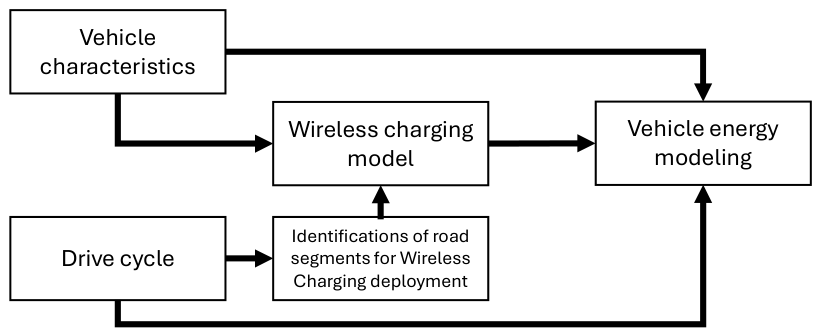
Figure 1 illustrates the relationship between the various modules, their inputs, outputs and how they collectively contribute to obtaining the results. The process requires selecting the vehicle and the drive cycle, containing second-by-second data about the trips (such as speed, time and distance-based elements such as crosswalks, traffic lights, etc.). This information is then passed to the Identification of suitable road segments Module, where the route is evaluated, and the specific zones suitable for Wireless Power Transfer (WPT) are identified. The Wireless Charging Module, implemented in Simulink, contains a mathematical model of the WPT system. This model accounts for factors such as transmitted power, coil design, the relative position of the primary and secondary coils, the number of receivers and the parameters of the electric circuit. Finally, the collected second-by-second data—comprising speed, acceleration, road slope, and wireless charging availability—feeds into the Vehicle Energy Module. This module, adapted from [26] and implemented in Simulink, simulates the proposed route for an EV, including energy transfer within designated wireless charging zones that meet the application’s requirements.
Figure 1.
Methodological approach for the impact of WPT technology on EVs.
2.2. Definition of Case-Study
Two vehicle types were selected to assess the implementation of wireless charging (WC) on public roads: a passenger car and a light commercial van. A Light-duty vehicle representative of the EV sales in Portugal and Europe was selected, considering market relevance, chassis height (a key factor affecting wireless power transfer efficiency) and battery capacity. The Light commercial vehicle studied is commonly used for mail delivery.
Because vehicle usage patterns strongly influence charging frequency and duration, multiple operational scenarios were defined for each model. The selection of two distinct categories also captures structural differences—particularly chassis height and vehicle length—which significantly affect energy transfer performance.
Furthermore, each vehicle represents a representative use case: the light-duty vehicle is widely used by private drivers and taxi/ride-hailing services, while the light commercial vehicle is part of the Portuguese mail delivery fleet, as referred to. These characteristics make both models suitable and relevant for evaluating WC applicability. Table 1 summarizes their key specifications.
Table 1.
Specifications of vehicles used for simulations. Source: [27,28].
The LDV was evaluated under two operating scenarios. The first reflects private use, focusing on daily commuting between home and work. Based on the spatial distribution of residential and employment zones, two representative routes were selected and further described in Section 3.2. One of these routes was also used to assess the impact of a 1 km wireless charging (WC) lane installed along a fast road within the Lisbon Metropolitan Area, examining its effect on energy consumption and battery state of charge (SOC). The 1 km length aligns with the Gotland pilot project, which deployed a 1.65 km dynamic WC lane and reported promising results [24]. The second scenario analyzes the LDV in professional passenger transport applications, such as taxi or ride-hailing services. To approximate real-world operation, several random routes within Lisbon were simulated.
For the LCV, the analysis considered a complete mail distribution route, beginning at a central warehouse and connecting multiple local delivery branches across the Lisbon Metropolitan Area. This scenario replicates typical logistics operations and evaluates the potential extension of driving range enabled by WC deployment along these routes.
2.3. Vehicle Simulation Tool
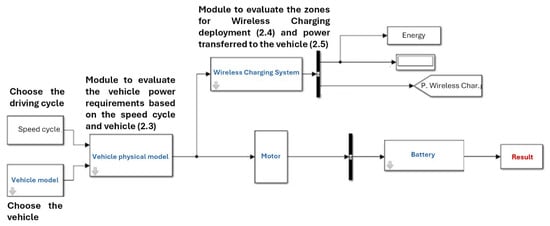
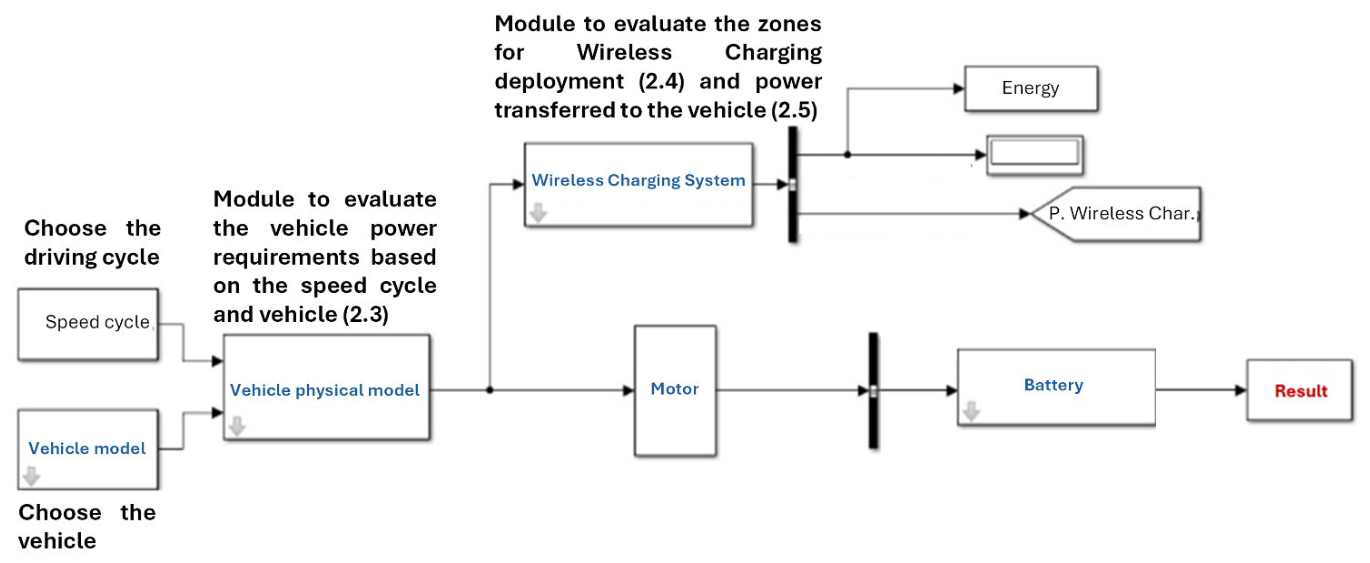
The Simulink model employed in this study is adapted from a previously developed work for simulating electric vehicle battery charging using a photovoltaic panel installed on board [26]. The model used within this work comprises seven subsystems, including the speed cycle, vehicle physical models, motor system, battery and the wireless charging system described in Section 2.5, as illustrated in Figure 2.
Figure 2.
Matlab/Simulink model was developed to simulate the introduction of wireless charging within a vehicle energy simulation tool.
Drive cycles from the “Speed cycle” subsystem and vehicle-specific data for the LDV and LCV were integrated into the “Vehicle model” and the “Wireless Charging” subsystems, the latter developed in this work following Section 2.4 and Section 2.5. The “Vehicle physical model” simulates vehicle dynamics along the selected route using a set of equations describing longitudinal motion. At each second, vehicle power demand is computed from speed, acceleration, road gradient, mass and auxiliary loads. These parameters are used to estimate the required traction force at 1 Hz resolution, in accordance with Equation (1).
In Equation (1), denotes vehicle mass (kg), acceleration (m·s−2), the rolling resistance coefficient, the aerodynamic drag coefficient, the air density, the vehicle frontal area (m2), gravitational acceleration (m·s−2), the instantaneous vehicle speed (m·s−1) and the road gradient.
The motor subsystem numerically models a permanent-magnet DC motor/generator, using the efficiency curve of the Nissan Leaf (80 kW), which is well described in [29] and assumed to be similar for the vehicles considered. Equations (2) and (3) describe regenerative and traction power, respectively, with regenerative operation occurring during braking phases. The total electric power demand at each second is given by the sum of traction power (), auxiliary loads (), and system losses (), as expressed in Equation (4), with more details in [26].
The last subsystem used from the original model [26] is the battery subsystem, which simulates energy flows based on motor power demand and energy recovered through regenerative braking. In this study, the battery subsystem was integrated with the wireless charging module to account for additional energy inputs during vehicle operation. The battery current, ,—both harvested during charging phases (regenerative braking and wireless charging) and used during discharge phases (acceleration)—is computed according to Equation (5), enabling a consistent representation of battery state evolution, by accounting for the terminal voltage () and internal resistance .
The battery state of charge (SOC), defined as the ratio between the available energy and its maximum capacity, where 100% corresponds to a fully charged battery and 0% to complete depletion. It is calculated using the coulomb counting method, as described in Equation (6), where is the current stored in the EV battery and is the current that is being extracted or introduced from the regenerative system and/or the wireless charging system, in the battery at that particular second.
The vehicle energy consumption can be obtained from the integration of the power deployed or introduced in the battery over time, and based on this information, the average energy consumption per unit distance and the driving range can be computed.
2.4. Identification of Best Segments for Wireless Charging Deployment
Using route data (including speed profiles, road gradient and other operational parameters), a tool was developed to identify the most suitable areas for deploying wireless charging (WC) infrastructure. Evidence from real-world applications shows that optimal locations correspond to segments where vehicles travel at low speeds [13] or remain stationary (several examples are placed near and/or on bus stops [22,23]), maximizing the duration available for energy transfer. Road sections with minimal longitudinal slope are also preferred, as near-zero gradients simplify installation and support stable system performance, following the real-world implementation cases in Gotland [24] and Versailles-Satory [25].
Accordingly, the initial prerequisites for WC deployment are: (i) low-speed or stationary vehicle operation, (ii) minimal road gradient, and (iii) adequate roadway geometry to accommodate WC components without compromising safety or traffic flow:
- Average speed < 30 km/h or <20 km/h (depending on the vehicle’s purpose);
- Maximum permitted speed < 50 km/h;
- Road slope < 3%;
- Presence or density of traffic signs, crossings, and stops (infrastructure elements); and
- Areas 30 m before and after traffic lights.
Although these parameters represent ideal prerequisites, additional WC simulations were conducted on roads with higher speed limits to assess the impact of road type on the wireless energy transfer rate. The average vehicle speed varies depending on its intended use: professional purposes (e.g., taxi or ride-hailing services) or private commuting (home-to-work trips). As a result, it was therefore considered to expand the range of eligible segments and enhance the overall opportunity for wireless charging. For instance, home-to-work routes typically involve higher average speeds than taxi or ride-hailing routes, which operate mainly in urban centers with lower speed zones.
Another way to increase charging time is by exploiting acceleration and deceleration phases. These were defined as the 30 m before and after specific events such as maneuvers, intersections, traffic lights, pedestrian crossings, roundabouts and stop signs. However, only traffic lights were ultimately considered, since they provide access to the electrical grid and are generally easier areas for WC installation due to the existing nearby infrastructure. To avoid excessively long charging sections in areas with high traffic light density, a maximum “charging lane” length of 150–200 m was established. Without this limitation, certain road segments could reach 2–3 km in length if all traffic lights were included. In cases where traffic lights were located very close to each other, multiple signals were integrated into a single charging section, resulting in overlapping sections of 200 m charging zones.
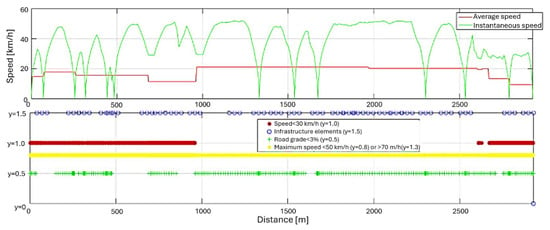
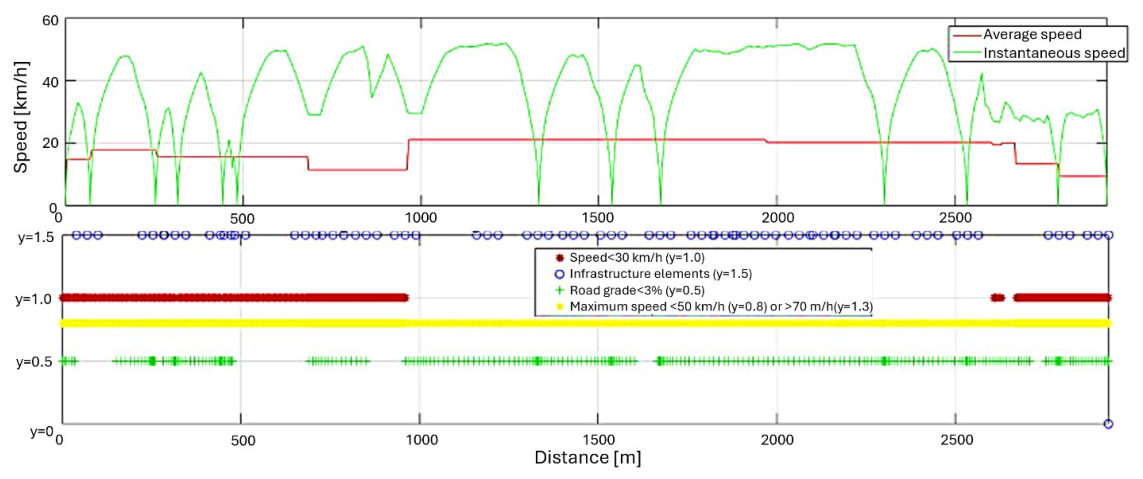
After thoroughly analyzing the route and potential locations for charger installation, a resultant charging status (“ON/OFF”) vector using binary values was obtained over the route distance; ON indicates segments where wireless chargers are installed and active, while OFF identifies non-charging zones, based on the predefined criteria. The set of rules defined to detect potential WC installation zones was implemented in Matlab/Simulink, namely in the Wireless Charging System block. Figure 3 presents an example of a sample route where the criteria defined were evaluated for further WC deployment.
Figure 3.
Methodological approach for the impact of WPT technology on EVs applied to a sample route.
To improve reproducibility, the identification of candidate WPT corridors is formulated as an explicit rule-based algorithm with fixed thresholds and precedence rules. The procedure operates on second-by-second route traces and road-attribute data to compute (i) average speed using a defined aggregation window (reported explicitly), (ii) longitudinal slope from the selected elevation/road-grade data source and resolution, and (iii) the presence/density of traffic control elements using georeferenced infrastructure layers (traffic lights, crossings, signs), including a consistent metric and buffer distance. Candidate charging segments are generated by applying the thresholds sequentially (speed/limit → slope → infrastructure proximity), and adjacent buffers around traffic lights are merged into continuous corridors with a maximum length of 150–200 m using a defined merging rule.
2.5. Wireless Charging Module
For each type of charging—static and dynamic—there are more suitable designs and operating modes. This project aims to use both types of charging for the same charger/receiver. The proposed technology is based on magnetic induction energy transfer, in which an alternating current flows through the primary coil, generating a magnetic field that simultaneously induces a voltage and current in the secondary coil, thereby supplying energy to the electric vehicle’s battery.
A design that promotes high system efficiency and energy transfer was evaluated, while enabling the development of a precise mathematical model to identify the variables and parameters that most significantly influence transfer performance. In this configuration, both the transmitter and receiver exhibit similar characteristics: each consists of a circular coil with a ferrite structure attached and protected with an aluminum plate. The ferrite structure’s function is to direct the flow of the magnetic field. In addition to protection, the aluminum sheet also reduces magnetic field leaks and improves the coupling coefficient between coils.
The design of the coils and the components used in the electrical circuit, both on the transmitter and receiver sides and the operating characteristics, as well as the AC current frequency, primary current amplitude and transmitted power, were chosen based on information collected from real-world pilots and literature [30].
The proposed mathematical model is based on the physical parameters of the coils, the electrical circuit and the (mis)alignment between the transmitting and receiving coils. The inductance of each coil depends only on its physical characteristics, namely the number of windings and the inner and outer diameter ( and , respectively), as can be seen in Equation (7), which derives from the Wheeler equation for inductance of circular coils [31].
Mutual inductance depends on the size of the coils as well as on the alignment and distance between the coils, according to Equation (8), where is the permeability of free space, assumed as a constant value of .
where:
The nomenclature used in Equations (8)–(12) follows the work of [32], where and are the primary and secondary coils’ radius, respectively, and are the angles of the coils against the horizontal plane for primary and secondary coils, respectively, is the angle between the coils, is the spatial distance between the coils, is the vertical height and is a variable parameter accounting for the motion (distance) between the center of the receiver and transmitter. The mathematical model of the wireless charging system was adapted from the existing model in the article [32] and assuming that the angles , and do not vary, Equation (8) can be simplified into Equation (13) and Equation (9) into Equation (14).
Induced current can be obtained from Equation (15) [33], based on the inductance of secondary coil and mutual inductance , from Equations (13) and (14):
In dynamic wireless charging, vehicle speed directly affects the energy transfer process. A charging lane consists of several transmitters connected in series, such that the vehicle-mounted receiver remains sequentially coupled with each charger while traveling along the track. Consequently, the mutual inductance—primarily governed by coil alignment—varies with the relative motion between transmitter and receiver and is therefore a function of vehicle speed ().
This effect is represented by a coupling factor , modeled as a sinusoidal function of time, where denotes perfect alignment and maximum coupling and indicates no coupling. The coupling evolution is thus characterized over the energy transfer interval , defined as the time required for the vehicle to traverse one charging unit [32]. This interval depends on the vehicle speed and the outer diameter of the primary coil, , which determines the effective interaction length between consecutive chargers, following Equations (16) and (17).
The induced voltage in the secondary coil depends on its electrical resistance (), which is a function of the operating frequency, coil length and wire diameter, following Equation (18) [32].
For dynamic wireless charging, the charging coils are installed consecutively with no spacing between units. Under these conditions, the coupling factor , originally defined as a sinusoidal function, repeats N times along the charging lane, where N is the number of chargers. Calculations are made on a 1 Hz basis (to cope with typical real-world driving cycles data acquisition and to reduce computational complexity, the integration of within the range [0, 1] was adopted, resulting in .
Additionally, the average power transferred to the vehicle battery is then evaluated using Equation (19), where denotes the phase shift between the induced voltage and the secondary current , and represents the number of receiver coils installed on the vehicle chassis. As verified in the literature [34,35,36,37], compensation topologies are used that aim to reduce, or even nullify, the phase shift angle between and . An SS (series–series) compensation topology was assumed for both the transmitter and receiver circuits, allowing the phase shift angle to be considered null and, consequently, = 1. Several studies demonstrate that SS compensation enables zero phase shift operation, including [36], which also employs a secondary-side converter to achieve this condition. This assumption preserves the overall energy transfer behavior while enabling fast computational vehicle simulation.
2.6. Limitations of the Work
This study focuses on the route-level energy impacts of dynamic wireless power transfer using a simplified, computationally efficient representation of the charging process at the vehicle–road interface. Therefore, the analysis does not explicitly model the full power-electronics chain (grid → inverter → coils → rectifier/DC–DC → battery) nor does it apply an overall transfer efficiency factor to account for inverter/rectifier losses, switching losses or control overheads; instead, the WPT module is formulated under idealized assumptions (e.g., negligible phase shift under SS compensation and constant operating conditions) to isolate the influence of route characteristics on energy transfer potential. Likewise, systematic parametric analyses of vertical air-gap variability and lateral misalignment were not carried out, and alignment is assumed to be sufficiently controlled within the selected low-speed charging segments. These aspects are acknowledged as important in real deployments and are left for future work, where detailed component-level models and experimentally calibrated efficiency and misalignment curves can be integrated once design-specific hardware data are available.
3. Results
3.1. Wireless Charging Operation
Table 2 provides information about the wireless charging components used within this work. The obtained values are consistent with the literature [9,31,32,33,36,38]. The higher self-inductances result from larger coil geometries, which require a greater number of windings.
Table 2.
Parameters of wireless charging components.
Moreover, future EV batteries are expected to operate at approximately 800 V due to their benefits [39]. Accordingly, the secondary-side voltage was assumed to be within this range, and the transmitted power was defined using the mathematical model described in Section 2.5. The two vehicles considered in the simulations have different secondary-circuit responses due to variations in chassis height and the number of installed receivers. In contrast, the primary circuit configuration (ground assembly) was kept identical for both vehicles. Mutual inductance is enhanced by similar characteristics of the primary and secondary coils and negligible lateral misalignment. The resulting electrical parameters adopted in the simulations are summarized in Table 3.
Table 3.
Primary and secondary circuit parameters.
To achieve the transmitted power values reported in Table 3, several assumptions were adopted, as previously discussed in Section 2.5 and Section 2.6. These include a zero-phase angle between the induced secondary voltage and current, enabled by the selected compensation topologies and negligible coil misalignment, given the low vehicle speed (<30 km/h) along charging lanes. Moreover, misalignment effects were assumed to be negligible even at higher speeds, up to 70 km/h [25].
3.2. Wireless Charging Implementation
3.2.1. Case Study 1: Home-to-Work Commuting Trips
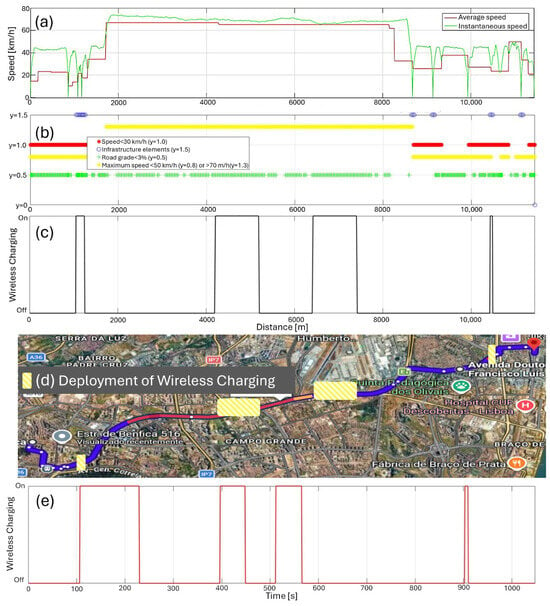
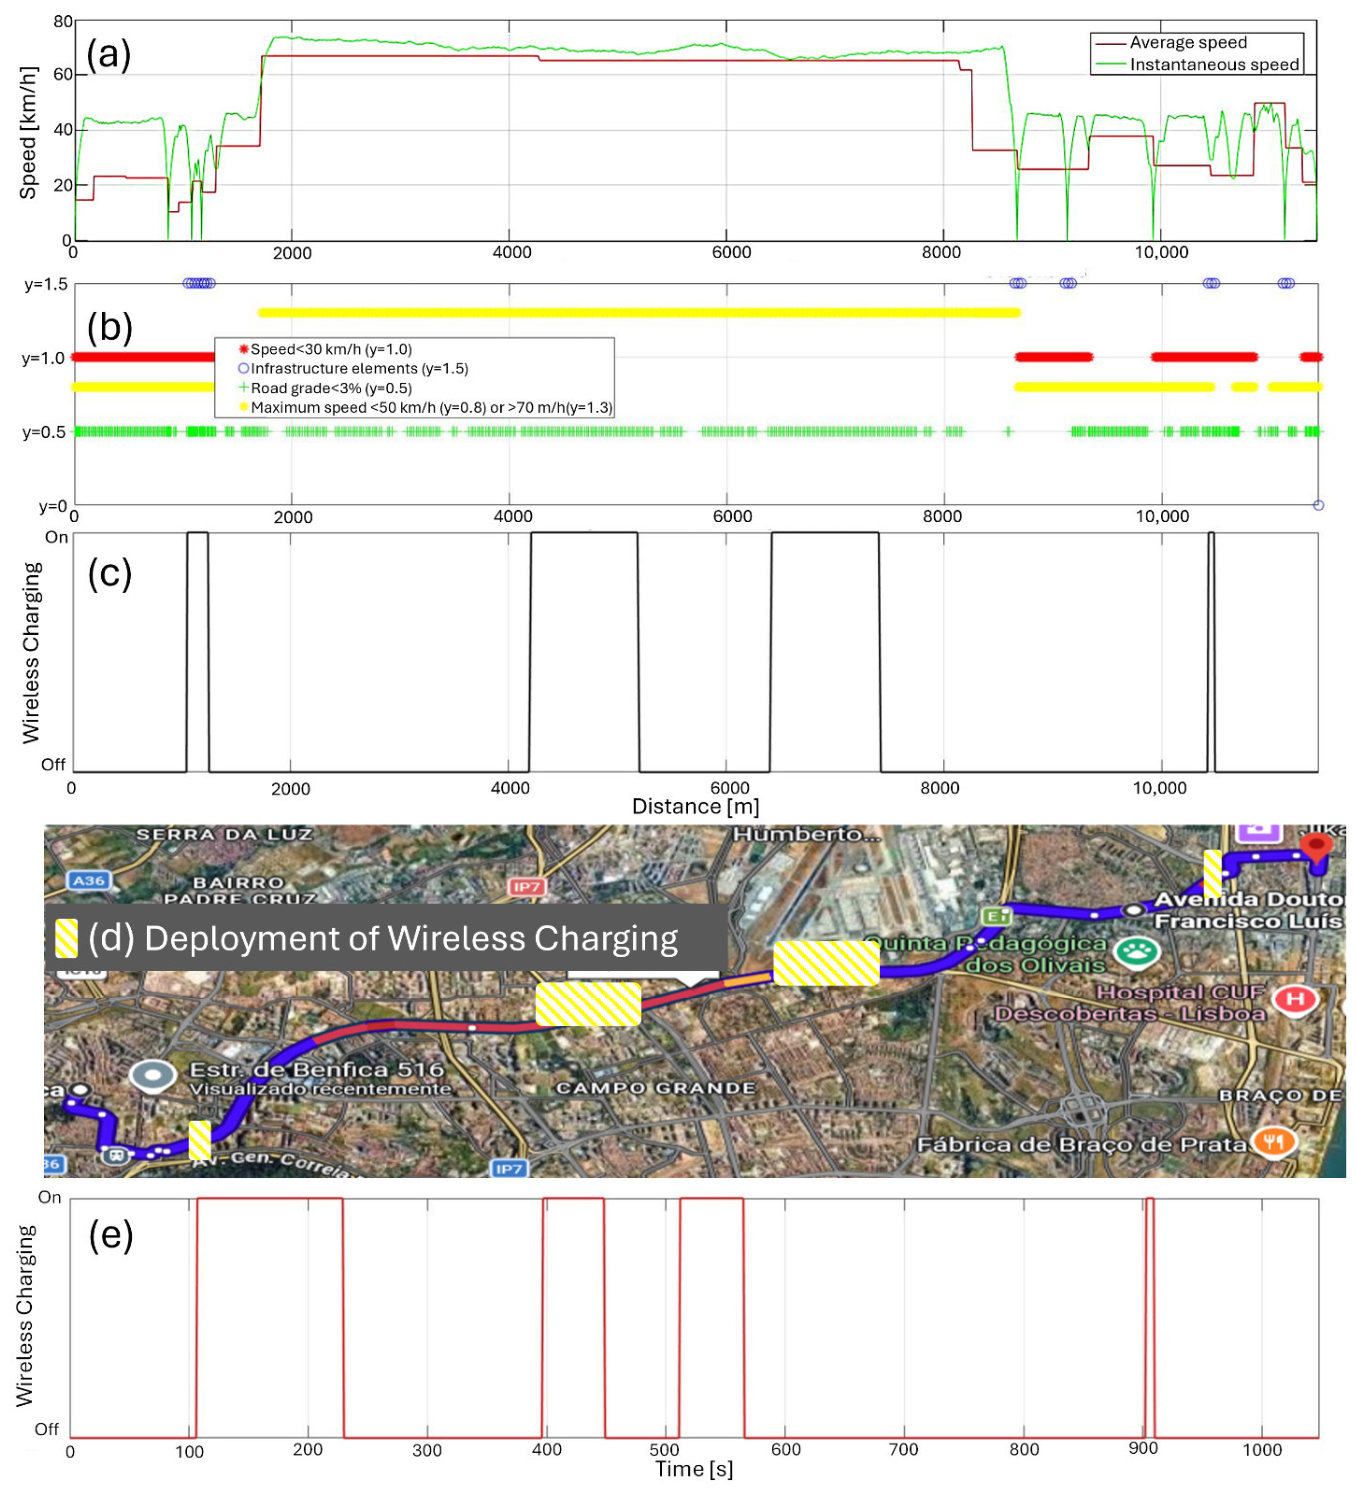
A typical commuting route (Route A) made by the LDV in the Lisbon Metropolitan Area was selected to include both residential streets and expressways. Figure 4a presents the information on the instantaneous and average speed cycle, which is important to identify suitable locations for wireless charging (WC) deployment. Using the criteria defined in Section 2.3, each route segment is evaluated based on average speed, instantaneous speed, road gradient, maximum allowed speed and the road infrastructure elements (crosswalks, traffic signs, etc.) to select candidate WC zones: These are identified by the simultaneous occurrence of average speeds below 30 km/h (red markers), road gradients under 3% (green markers) and proximity to road elements (blue markers) in Figure 4b. For each road element, three paired points are considered: the element location and positions 30 m upstream and downstream.
Figure 4.
Route A: (a) Driving cycle speed over distance; (b) identification of criteria for wireless charging ground assembly deployment over distance; (c) distance-based selected wireless charging deployment areas; (d) schematic representation of the zones of WC deployment (yellow color); (e) time-based selected wireless charging deployment areas.
From Figure 4b, a detailed analysis of the route details indicates that only two segments fully satisfy the predefined criteria, located between 1045 and 1250 m and 10,423–10,483 m. Additionally, despite a slight longitudinal slope, two expressway sections (4200–5200 m and 6400–7400 m) were also simulated with WC lanes to assess their potential impact. Both are identified in Figure 4c in a distance-based approach and in Figure 4e in a time-based approach to include the impact of vehicle speed. Figure 4d schematically presents the WC deployment in Route A. As charging power is assumed to be constant, energy transfer increases with time, making lanes with longer traversal times more impactful in terms of transferred energy per unit length [kWh/km].
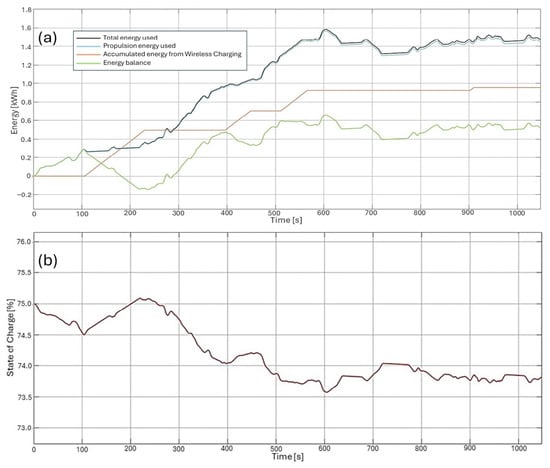
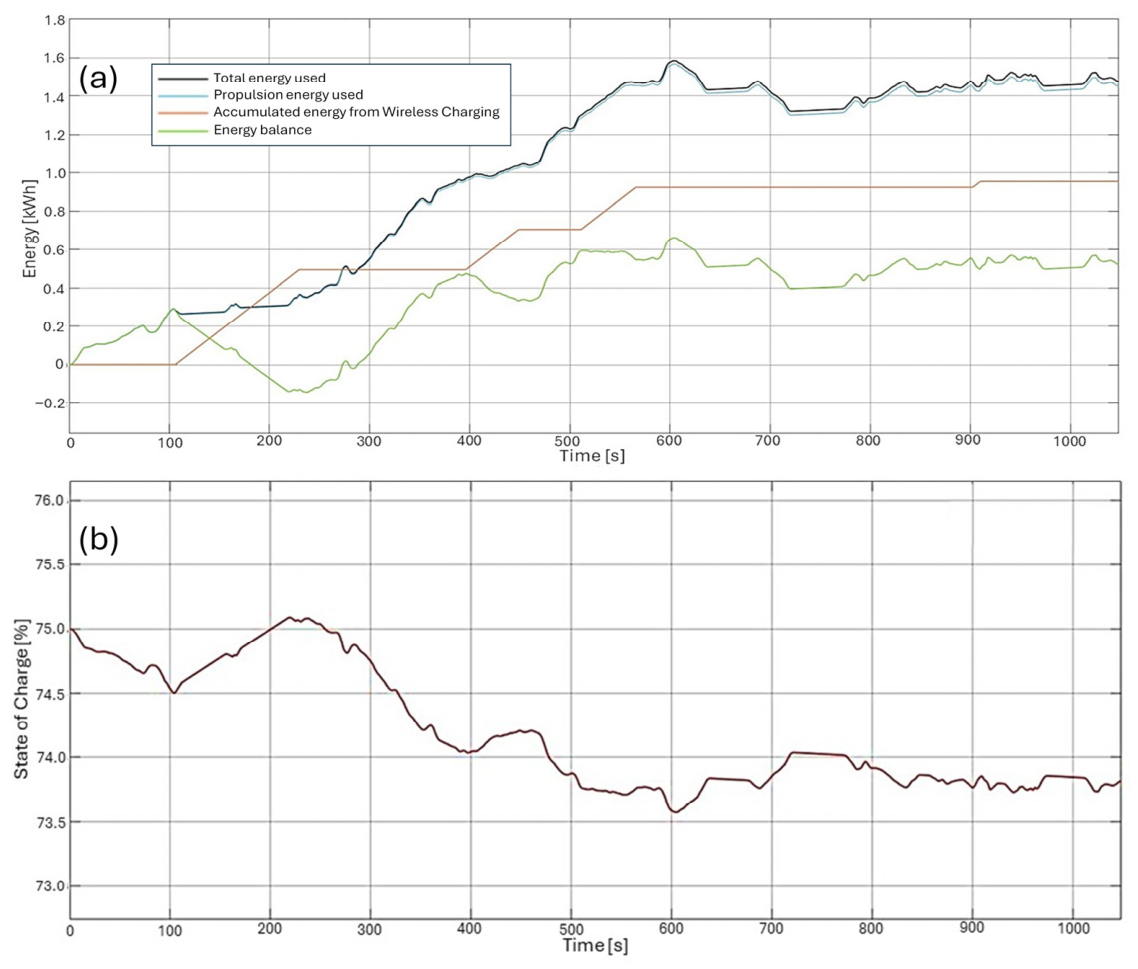
After defining the charging lane locations, simulations were performed using the Simulink model to estimate both vehicle energy consumption and energy transferred by the wireless charging system. Figure 5a presents the total energy used in the vehicle (i.e., including propulsion, auxiliaries and losses), energy used to move the vehicle, as well as the energy deployed from the wireless charging infrastructure. The green line presents the balance between total energy provided by the battery and the energy harvested from the WC system. This is better illustrated in Figure 5b, where the battery state of charge (SOC) is presented. Results indicate that WC significantly influences the EV’s energy balance throughout the trip. The WC transferred energy can eventually surpass the vehicle energy requirements and contribute to increasing SOC (e.g., 100–200 s) while the vehicle travels over charging lanes. Quantitatively, 0.95 kWh were wirelessly transferred over the 11.44 km route, which required 1.48 kWh in total, indicating that WC could provide approximately 65% of the EV’s required total energy.
Figure 5.
Route A: (a) Total energy used, energy required by the propulsion system, wireless charging energy harvested and energy balance (total energy minus accumulated wireless charging energy); (b) Vehicle battery state of charge.
The impact of WC can also be observed in battery SOC, namely around 100–200 s, 400–450 s and with less impact at 900 s. Around 500–550 s, WC has a very low impact on battery SOC (Figure 5b), but it can be observed in Figure 5a (green line) that the energy transferred by WC (orange line) is almost the necessary to replace the EV total energy (black line) requirements.
Another commuting trip (Route B) was simulated to better address the impacts of WC deployment, using the criteria of Section 2.3 and the rationale addressed for Route A.
Table 4 shows that, for both analyzed routes, the implementation of wireless charging (WC) has a significant impact on battery energy balance. Wireless charging accounts for 64.6% and 43.7% of the total energy used on routes A and B, respectively, confirming its strong contribution to energy management. The lower energy transfer per unit track length observed on route A is explained by the presence of charging lanes on expressway segments (between 400 and 550 s in Figure 4d), where the vehicle travels at average speeds close to 70 km/h, in contrast with urban sections characterized by low speed or idling.
Table 4.
Impacts of Wireless Charging deployment on two commuting routes in the Lisbon Metropolitan Area.
Average net battery energy demand is reduced by more than 50% on average when wireless charging (WC) corridors are available along the analyzed routes (Table 4). Under the modeling assumptions adopted in this study, the simulated WC supply can substantially offset traction energy on stop-rich urban segments and reduce net battery depletion over a trip. These results should be interpreted as an upper-bound indication of operational potential rather than a direct prediction of real-world range extension, since end-to-end conversion losses, utilization constraints and misalignment effects are not explicitly represented. Potential implications for battery sizing and CO2 impacts are therefore not quantified here and are left for future work.
3.2.2. Case Study 2: Passenger Transportation
In order to compare the impact of WC for professional passenger transport purposes or private purposes (commuting trips), the same LDV was simulated in a circular route with 5 random stops and with start and end at Lisbon Airport. Route 0-1 is from the airport to downtown Lisbon and is mainly downhill, Route 1-2 is generally uphill, while Routes 2-3 and 3-4 have small road grades, but low average speed. Routes 4-5 and 5-0 have small road grades, but higher average speeds. The main results are presented in Table 5.
Table 5.
Impacts of Wireless Charging deployment on round-trip for LDV passenger transport in Lisbon Metropolitan Area.
Except for trips 4–5 and 5–0, all analyzed segments exhibit a wireless charging (CW) potential ranging from 89.00% to 263.00% of the energy consumed. In several cases, the vehicle reached its destination with a higher state of charge (SOC) than at departure (Routes 0-1, 1-2 and 2-3). Considering the six trips composing the complete circular route, the energy collected from WC (~66% of total energy used) is large enough that, under the adopted assumptions, the end-of-cycle SOC remains close to the initial value, indicating the potential to reduce reliance on plug-in recharging for this stop-rich duty cycle. Simulation results show that, starting with 75% SOC, the EV returns to the Airport after completing the full 40.3 km route with 67.9% SOC.
The presence of WC corridors on public roads can reduce reliance on plug-in charging infrastructure and support longer operating periods on duty cycles characterized by frequent stops and low average speeds. In the analyzed routes and under the modeling assumptions adopted, WC can substantially offset traction energy and help maintain SOC throughout operation.
3.2.3. Case Study 3: Freight Transportation
A freight transport scenario was defined to evaluate the impact of WC on urban delivery operations. A circular route with five stops was developed, representing the main national postal and parcel distribution operator’s warehouse and local distribution points. The route was modeled using an LCV consistent with the type currently deployed in the operator’s urban delivery fleet. Owing to its greater length, higher ground clearance and increased mass (Table 1), a dual-receiver configuration was tested to enhance transmitted power. This approach is enabled by the chassis dimensions of the LCV and allows the vehicle’s energy requirements to be met by doubling the number of receivers [21].
Table 6 highlights a wide dispersion in wireless charging performance across the analyzed routes, ranging from no wireless energy transfer (route E–F) to cases where transmitted energy nearly doubles the vehicle’s consumption (route D–E). The absence of WC on route E–F is explained by sustained average speeds of 30–45 km/h and road gradients exceeding 3%, while route B–C offers only a single charging opportunity due to similar slope constraints.
Table 6.
Impacts of Wireless Charging deployment on round-trip for LCV mail distribution in the Lisbon Metropolitan Area.
Considering the complete circular route, 48.5% of the total energy demand is supplied by WC, significantly enhancing operational flexibility. Starting from an initial state of charge (SOC) of 75%, the LCV completes the ~30 km route with a final SOC of 60.1%, corresponding to a reduction in only 15 percentage points, even without accounting for potential static chargers at CTT facilities. Given its higher energy consumption and battery capacity (Table 1), the results indicate that WC can substantially reduce net battery depletion for this urban delivery duty cycle, potentially reducing reliance on conventional plug-in charging. Quantifying real-world autonomy gains and any implications for battery sizing would require modeling of end-to-end efficiency, utilization constraints and misalignment/air-gap variability, which are outside the scope of this work.
3.3. Global Analysis
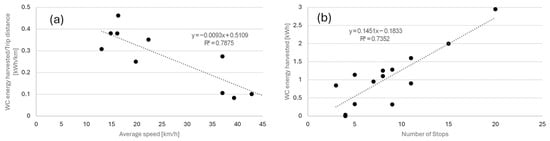
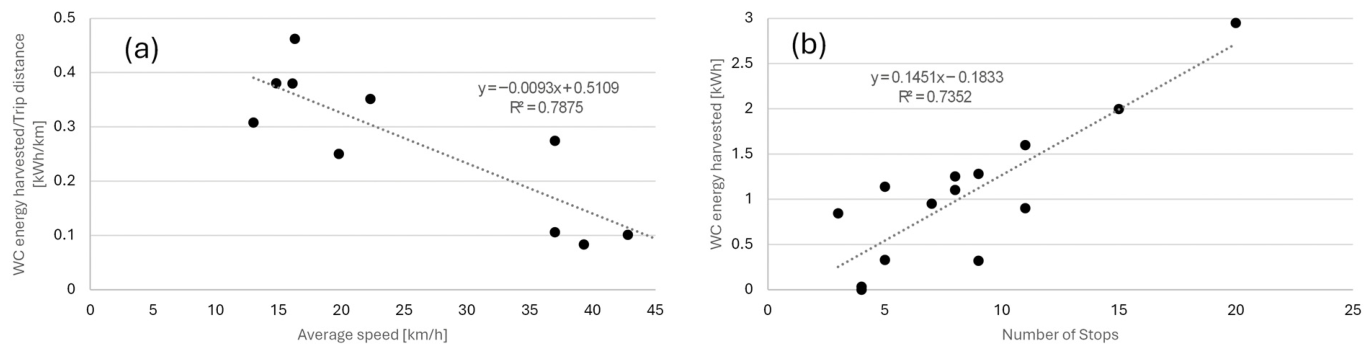
Across all simulations, independently of vehicle type or route, common factors strongly influence wireless energy transfer beyond power level and receiver count. Average speed directly determines residence time on charging lanes, while the number of stops indirectly increases transferred energy by reducing speed and enabling additional stopping charging opportunities. This relationship, illustrated in Figure 6a,b, is not strictly proportional, as stop occurrence depends on route characteristics and vehicle behavior.
Figure 6.
(a) Average Energy harvested by Wireless Charging, considering the total trip distance in kWh/km; (b) Energy harvested by Wireless Charging (in kWh), considering the number of stops.
As shown in Figure 6a, the wireless energy transferred per unit distance [kWh/km] exhibits an approximately linear decrease with increasing average speed, with an estimated reduction of about 4.03 ± 1.52% in charging rate per additional km/h in the range studied of 13 and 43 km/h of average speed. Deviations from the regression line correspond to scenarios where charging lanes were installed on expressways, confirming that dynamic wireless charging is most effective on routes characterized by low average speeds.
Assessing the influence of the number of stops on the energy transfer rate requires more nuanced analysis. As illustrated in Figure 6b, routes with a higher number of stops generally present longer charging lanes and lower average speeds. However, these relationships are not strictly linear, since the simulated routes include heterogeneous road types, such as expressways and residential streets. Within the range studied, energy harvested increases, on average, 22.35 ± 31.25% per stop number, between 3 and 20 stops. In some cases, routes with high average speeds may still exhibit many stops, particularly when traffic lights are concentrated at the beginning or end of the trip. Nevertheless, the overall trend indicates that an increased number of stops is associated with reduced average speed.
These results validate the criteria used for WC deployment. Higher energy transfer rates per kilometer and per trip are achieved on routes with frequent stopping events and low average speeds, typically found in urban and residential environments.
4. Conclusions
This paper presents the impacts of introducing wireless charging technology in light-duty electric vehicles. A numerical tool was developed to simulate the coil design and account for the air gap between the ground and vehicle assembly. Results reinforce that routes characterized by a high number of stops and low average speeds, typically urban and residential roads, present the highest wireless energy transfer rates per unit length. Conversely, the impact of WC on expressways is limited and only becomes relevant under high traffic density conditions, where average speeds are reduced. Across the three analyzed scenarios, the charging rate varies from approximately 0.1 kWh/km in the least favorable case (expressways) to 3.9 kWh/km in the optimal case, where WC is deployed exclusively in locations meeting the prerequisites defined in Section 2.3.
Overall, the simulations indicate that WC can substantially offset traction energy on stop-rich urban routes under optimistic alignment and efficiency assumptions, while its benefit on higher-speed expressway segments is limited unless congestion reduces average speed.
Potential secondary implications—such as changes in optimal battery capacity, lifecycle impacts and CO2 emissions—were not quantified in this study. Addressing these topics requires explicit representation of end-to-end efficiency (grid–inverter–coil–rectifier–battery), electricity carbon intensity and infrastructure utilization, as well as scenario assumptions on the electricity supply mix and any local renewable generation/storage. This has been left for future work.
Author Contributions
Conceptualization, G.O.D. and P.C.B.; methodology, J.C., G.O.D. and P.C.B.; software, J.C.; validation, J.C., G.O.D. and P.C.B.; formal analysis, G.O.D. and P.C.B.; investigation, J.C., G.O.D. and P.C.B.; data curation, J.C.; writing—original draft preparation, J.C. and G.O.D.; writing—review and editing, G.O.D. and P.C.B.; supervision, G.O.D. and P.C.B. All authors have read and agreed to the published version of the manuscript.
Funding
This research was funded by Fundação para a Ciência e Tecnologia through the following programs: IN+ Strategic Project (1801P.00962.1.01—IN+ UIDP/EEA/50009/2025—IST-ID).
Data Availability Statement
The dataset may be made available upon reasonable request.
Acknowledgments
The authors would like to acknowledge the Project BE.Neutral—Agenda de Mobilidade para a neutralidade carbónica nas cidades, contract number 35, funded by the Resilience and Recovery Plan (PRR) through the European Union under Next Generation EU, and by Fundo Ambiental, through Protocol 49—“Plataforma de Apoio à Rede de Cidades Portuguesas climaticamente neutras e inteligentes 2030”.
Conflicts of Interest
The authors declare no conflicts of interest.
References
- EU Transport in Figures: Statistical Pocketbook 2023; European Commission, Ed.; Publications Office: Luxembourg, 2023; ISBN 978-92-68-06324-8. [Google Scholar]
- European Commission. Eurostat Shedding Light on Energy in the EU; Publications Office: Luxembourg, 2023.
- European Commission. Delivering the European Green Deal—European Commission. Available online: https://commission.europa.eu/topics/climate-action/delivering-european-green-deal_en (accessed on 20 January 2026).
- European Parliament. Regulation (EU) 2023/851 of the European Parliament and of the Council of 19 April 2023 Amending Regulation (EU) 2019/631 as Regards Strengthening the CO2 Emission Performance Standards for New Passenger Cars and New Light Commercial Vehicles in Line with the Union’s Increased Climate Ambition. Off. J. Eur. Union 2023, 110, 5–20. [Google Scholar]
- The International Council on Clean Transportation. European Market Monitor Quarterly—European Car and van Market and Charging Infrastructure Development: January–December 2023; ICCT: Washington, DC, USA, 2024. [Google Scholar]
- Pamidimukkala, A.; Kermanshachi, S.; Rosenberger, J.M.; Hladik, G. Barriers and Motivators to the Adoption of Electric Vehicles: A Global Review. Green Energy Intell. Transp. 2024, 3, 100153. [Google Scholar] [CrossRef] [Scilit]
- IEC 61851-1 Ed. 3.0 b:2017; Electric Vehicle Conductive Charging System—Part 1: General Requirements. International Electrotechnical Commission: Geneva, Switzerland, 2017.
- Triviño, A.; González-González, J.M.; Aguado, J.A. Wireless Power Transfer Technologies Applied to Electric Vehicles: A Review. Energies 2021, 14, 1547. [Google Scholar] [CrossRef] [Scilit]
- Hwang, Y.J.; Jang, J.Y. Design and Analysis of a Novel Magnetic Coupler of an In-Wheel Wireless Power Transfer System for Electric Vehicles. Energies 2020, 13, 332. [Google Scholar] [CrossRef] [Scilit]
- J2954_202408; Wireless Power Transfer for Light-Duty Plug-In/Electric Vehicles and Alignment Methodology. Hybrid—EV Committee SAE International: Warrendale, PA, USA, 2024. [CrossRef] [Scilit]
- Niu, S.; Xu, H.; Sun, Z.; Shao, Z.Y.; Jian, L. The State-of-the-Arts of Wireless Electric Vehicle Charging via Magnetic Resonance: Principles, Standards and Core Technologies. Renew. Sustain. Energy Rev. 2019, 114, 109302. [Google Scholar] [CrossRef] [Scilit]
- Jang, Y.; Jeong, S.; Lee, M. Initial Energy Logistics Cost Analysis for Stationary, Quasi-Dynamic, and Dynamic Wireless Charging Public Transportation Systems. Energies 2016, 9, 483. [Google Scholar] [CrossRef] [Scilit]
- García-Vázquez, C.A.; Llorens-Iborra, F.; Fernández-Ramírez, L.M.; Sánchez-Sainz, H.; Jurado, F. Comparative Study of Dynamic Wireless Charging of Electric Vehicles in Motorway, Highway and Urban Stretches. Energy 2017, 137, 42–57. [Google Scholar] [CrossRef] [Scilit]
- Khalid, H.; Mekhilef, S.; Mubin, M.; Seyedmahmoudian, M. Advancements in Inductive Power Transfer: Overcoming Challenges and Enhancements for Static and Dynamic Electric Vehicle Applications. Energy Rep. 2023, 10, 3427–3452. [Google Scholar] [CrossRef] [Scilit]
- Subudhi, P.S.; Krithiga, S. Wireless Power Transfer Topologies Used for Static and Dynamic Charging of EV Battery: A Review. Int. J. Emerg. Electr. Power Syst. 2020, 21, 20190151. [Google Scholar] [CrossRef] [Scilit]
- Sabki, S.A.; Tan, N.M.L. Wireless Power Transfer for Electric Vehicle. In Proceedings of the 2014 IEEE 8th International Power Engineering and Optimization Conference (PEOCO2014), Langkawi, Malaysia, 24–25 March 2014; pp. 41–46. [Google Scholar]
- Kalwar, K.A.; Mekhilef, S.; Seyedmahmoudian, M.; Horan, B. Coil Design for High Misalignment Tolerant Inductive Power Transfer System for EV Charging. Energies 2016, 9, 937. [Google Scholar] [CrossRef] [Scilit]
- Villa, J.L.; Sallan, J.; Sanz Osorio, J.F.; Llombart, A. High-Misalignment Tolerant Compensation Topology For ICPT Systems. IEEE Trans. Ind. Electron. 2012, 59, 945–951. [Google Scholar] [CrossRef] [Scilit]
- Corti, F.; Grasso, F.; Paolucci, L.; Pugi, L.; Luchetti, L. Circular Coil for EV Wireless Charging Design and Optimization Considering Ferrite Saturation. In Proceedings of the 2019 IEEE 5th International forum on Research and Technology for Society and Industry (RTSI), Florence, Italy, 9–12 September 2019; pp. 279–284. [Google Scholar]
- Liu, C.; Jiang, C.; Qiu, C. Overview of Coil Designs for Wireless Charging of Electric Vehicle. In Proceedings of the 2017 IEEE PELS Workshop on Emerging Technologies: Wireless Power Transfer (WoW), Chongqing, China, 20–22 May 2017; pp. 1–6. [Google Scholar]
- Mohamed, N.; Aymen, F.; Alqarni, M.; Turky, R.A.; Alamri, B.; Ali, Z.M.; Abdel Aleem, S.H.E. A New Wireless Charging System for Electric Vehicles Using Two Receiver Coils. Ain Shams Eng. J. 2022, 13, 101569. [Google Scholar] [CrossRef] [Scilit]
- WAVE Charging. WAVE Wireless Charging Propels AVTA to Zero-Emission Milestone. Available online: https://wave-charging.cdn.prismic.io/wave-charging/aamd7VxvIZEnjXhQ_WAVECharging_AVTA-Case-Study.pdf (accessed on 16 April 2026).
- Keep Your Fleets Running 24 × 7 with Wireless Energy. Available online: https://electreon.com/ (accessed on 21 January 2026).
- Speed Week 2023: Six Ways the Swedish Island of Gotland Is Sustainable. Available online: https://www.topgear.com/car-news/speed-week-2023/speed-week-2023-six-ways-swedish-island-gotland-sustainable (accessed on 26 March 2026).
- Laporte, S.; Coquery, G.; Deniau, V.; De Bernardinis, A.; Hautière, N. Dynamic Wireless Power Transfer Charging Infrastructure for Future EVs: From Experimental Track to Real Circulated Roads Demonstrations. World Electr. Veh. J. 2019, 10, 84. [Google Scholar] [CrossRef] [Scilit]
- Sagaria, S.; Duarte, G.; Neves, D.; Baptista, P. Photovoltaic Integrated Electric Vehicles: Assessment of Synergies between Solar Energy, Vehicle Types and Usage Patterns. J. Clean. Prod. 2022, 348, 131402. [Google Scholar] [CrossRef] [Scilit]
- 2022 KIA EV6 Standard Range 2WD—Specifications. Available online: https://www.evspecifications.com/en/model/5782145 (accessed on 16 April 2026).
- Peugeot E-Expert Combi Standard 50 kWh. Available online: https://ev-database.org/car/1605/Peugeot-e-Expert-Combi-Standard-50-kWh (accessed on 16 April 2026).
- Burress, T. Benchmarking State-of-the-Art Technologies; Oak Ridge National Laboratory: Oak Ridge, TN, USA, 2013. [Google Scholar]
- Okasili, I.; Elkhateb, A.; Littler, T. A Review of Wireless Power Transfer Systems for Electric Vehicle Battery Charging with a Focus on Inductive Coupling. Electronics 2022, 11, 1355. [Google Scholar] [CrossRef] [Scilit]
- Aditya, K. Analytical Design of Archimedean Spiral Coils Used in Inductive Power Transfer for Electric Vehicles Application. Electr. Eng. 2018, 100, 1819–1826. [Google Scholar] [CrossRef] [Scilit]
- Mohamed, N.; Aymen, F.; Alharbi, T.E.A.; El-Bayeh, C.Z.; Lassaad, S.; Ghoneim, S.S.M.; Eicker, U. A Comprehensive Analysis of Wireless Charging Systems for Electric Vehicles. IEEE Access 2022, 10, 43865–43881. [Google Scholar] [CrossRef] [Scilit]
- Razu, M.R.R.; Mahmud, S.; Uddin, M.J.; Islam, S.S.; Bais, B.; Misran, N.; Islam, M.T. Wireless Charging of Electric Vehicle While Driving. IEEE Access 2021, 9, 157973–157983. [Google Scholar] [CrossRef] [Scilit]
- Mahesh, A.; Chokkalingam, B.; Mihet-Popa, L. Inductive Wireless Power Transfer Charging for Electric Vehicles–A Review. IEEE Access 2021, 9, 137667–137713. [Google Scholar] [CrossRef] [Scilit]
- Kavimandan, U.D.; Galigekere, V.P.; Onar, O.; Mohammad, M.; Ozpineci, B.; Mahajan, S.M. The Sensitivity Analysis of Coil Misalignment for a 200-kW Dynamic Wireless Power Transfer System with an LCC-S and LCC-P Compensation. In Proceedings of the 2021 IEEE Transportation Electrification Conference & Expo (ITEC), Chicago, IL, USA, 21–25 June 2021; pp. 1–8. [Google Scholar]
- Wang, C.-S.; Covic, G.A.; Stielau, O.H. Power Transfer Capability and Bifurcation Phenomena of Loosely Coupled Inductive Power Transfer Systems. IEEE Trans. Ind. Electron. 2004, 51, 148–157. [Google Scholar] [CrossRef] [Scilit]
- Roslan, M.A.A.; Nanda, N.N.; Yusoff, S.H. Series-Series and Series-Parallel Compensation Topologies for Dynamic Wireless Charging. IIUM Eng. J. 2021, 22, 199–209. [Google Scholar] [CrossRef] [Scilit]
- Yang, Y.; El Baghdadi, M.; Lan, Y.; Benomar, Y.; Van Mierlo, J.; Hegazy, O. Design Methodology, Modeling, and Comparative Study of Wireless Power Transfer Systems for Electric Vehicles. Energies 2018, 11, 1716. [Google Scholar] [CrossRef] [Scilit]
- Aghabali, I.; Bauman, J.; Kollmeyer, P.J.; Wang, Y.; Bilgin, B.; Emadi, A. 800-V Electric Vehicle Powertrains: Review and Analysis of Benefits, Challenges, and Future Trends. IEEE Trans. Transp. Electrif. 2021, 7, 927–948. [Google Scholar] [CrossRef] [Scilit]

Disclaimer/Publisher’s Note: The statements, opinions and data contained in all publications are solely those of the individual author(s) and contributor(s) and not of MDPI and/or the editor(s). MDPI and/or the editor(s) disclaim responsibility for any injury to people or property resulting from any ideas, methods, instructions or products referred to in the content. |
© 2026 by the authors. Licensee MDPI, Basel, Switzerland. This article is an open access article distributed under the terms and conditions of the Creative Commons Attribution (CC BY) license.