


Abstract
This study empirically isolates the marginal CO2 abatement efficiency of wind and solar power within the Greek electricity system, utilizing hourly dispatch data from August 2012 to December 2018—a period characterizing the grid’s “pre-saturation” technical potential. By employing an econometric framework to capture ex-post displacement dynamics, we identify a statistically significant but highly heterogeneous abatement impact across renewable technologies. Our analysis reveals that wind power consistently achieves higher carbon savings per MWh than solar photovoltaics, primarily by driving deeper displacement of carbon-intensive thermal baseload. Conversely, solar generation exhibits a stronger propensity to displace zero-carbon hydroelectric output and net imports, thereby dampening its domestic abatement efficiency. Furthermore, we demonstrate that the marginal emissions avoided are non-linear, fluctuating significantly with system load, interconnection flows, and renewable penetration levels. These findings establish an “unconstrained efficiency” benchmark for the Greek grid, providing the necessary counterfactual to evaluate the diminishing returns and curtailment penalties characterizing the high-penetration era of renewables.
1. Introduction
Mitigating climate change by stabilizing greenhouse gas (GHG) concentrations is the central pillar of the European Union’s energy policy. To achieve climate neutrality by 2050, the EU has escalated its ambitions, setting a binding target to reduce net GHG emissions by at least 55% by 2030 relative to 1990 levels [1]. A primary mechanism for this transition is the aggressive deployment of Renewable Energy Sources (RES), particularly wind and solar, driven by financial incentives and policy measures designed to displace carbon-intensive thermal generation [2].
Greece represents an interesting case study within this European framework. Historically reliant on indigenous lignite, which accounted for 33% of electricity generation and 40% of total national emissions as recently as 2018, the Greek power sector has undergone a rapid transformation. Since 2018, Greece has drastically reduced lignite generation to power mix to under 6% by 2024, with complete phase-out planned by 2028 under its decarbonization commitments. Renewable capacity has surged post-2018, with solar reaching 8.8 GW and wind 5.4 GW by end-2024—more than doubling from 2018 levels—now supplying over 50% of electricity demand. Power sector carbon intensity has fallen sharply from 0.65 tCO2/MWh in 2018 to 0.31 tCO2/MWh through 2023, driven by lignite displacement.
Since 2010, the country has seen robust growth in wind and solar capacity. However, the effectiveness of these variable renewable energy (VRE) sources in abating CO2 is not uniform; it depends critically on the specific “marginal fuel” displaced at any given moment, a dynamic that shifts with load, hydrological conditions, and interconnection flows.
This study employs a rigorous econometric framework to empirically isolate the marginal CO2 abatement coefficients of wind and solar photovoltaics (PV) within the Greek power system, utilizing hourly dispatch data from August 2012 to December 2018. While the national energy landscape has since undergone structural transformation, precipitated by the rapid decoupling from lignite, this specific temporal window constitutes a critical analytical baseline. It captures the grid’s operational dynamics in a pre-saturation state, largely devoid of the non-linear curtailment effects that distort contemporary efficiency signals. Consequently, these ex-post estimates provide a technical potential benchmark, enabling a precise evaluation of how abatement efficiency evolves—or degrades—under the congestion constraints and market frictions characteristic of the current, high-penetration era.
Utilizing hourly operational data spanning the entire electricity market (High and Medium Voltage), this study contributes to the literature by providing empirical ex-post estimates of the average CO2 emissions avoided through distinct RES technologies (wind and solar photovoltaics) in the Greek electricity system. Extending beyond earlier econometric analyses [3,4,5,6]—which predominantly focused on either singular RES types or were geographically concentrated in North American markets—this research offers one of the first comprehensive assessments of heterogeneous displacement patterns between wind and solar power within a European context characterized by high lignite dependence and cross-border interconnections. While our econometric framework builds on established methods, our study makes several substantive contributions beyond historical benchmarking. Prior European studies focused on countries with different fuel mixes [6,7,8]. Our study offers a rigorous comparison of wind and solar displacement in a lignite-dominated European system, revealing technology-specific heterogeneity that differs from gas-dominated systems.
This study represents among the earliest systematic investigations of the marginal abatement efficiency of utility-scale photovoltaic systems across varying production and load regimes, addressing a significant gap in the literature where solar displacement dynamics remain underexamined relative to wind [9,10]. Most prior studies focused exclusively on wind; systematic examination of solar PV marginal abatement across varying production and load regimes remains underexamined, while our analysis of solar and hydroelectric power interaction patterns is novel. We extend Novan’s [5] framework by incorporating simultaneous interactions between wind generation, solar generation, and load, rather than treating technologies separately. This captures potential interaction effects between wind and solar deployment.
Beyond estimating average avoided emissions coefficients, this work explicitly quantifies the composition of displaced generation—i.e., which thermal fuels and technologies are actually backed down by incremental RES injection—a methodological advance required for accurate carbon accounting and for understanding the merit-order effect across heterogeneous fuel sources with disparate emission intensities [11,12]. A particular innovation is our systematic treatment of net electricity imports and exports, recognizing that RES-driven displacement extends beyond domestic thermal plants to encompass emissions reduction in neighboring systems—a critical consideration in the era of integrated European Internal Energy Market [13,14]. In this context, we explicitly model and quantify displacement effects on neighboring systems through net import substitution, providing emission factors for cross-border effects.
Empirically, the analysis employs verified EU ETS emission factors disaggregated by generation unit, providing greater precision in abatement estimates than lifecycle-based estimates [15].
The temporal specificity of our dataset (August 2012–December 2018) provides a pre-saturation baseline of renewable abatement potential—a period when the Greek grid operated with negligible curtailment and a lignite-dominated marginal fuel. This ex-post benchmark proves essential for isolating the technical effectiveness of RES displacement from the economic and operational penalties that characterize the modern high-penetration era [16]. As contemporary literature increasingly documents the merit-order price cannibalization and grid saturation effects that reduce the effective environmental benefit of new renewable capacity [13,14], our historical analysis establishes the counterfactual against which the efficiency losses of current deployment can be precisely measured—a prerequisite for rational long-term energy system planning.
The structure of the paper is as follows. Section 2 provides a literature review on the impact of intermittent renewables on CO2 emissions within the electricity generation sector. It also offers insights into electricity generation and CO2 emissions in Greece, presents the data used in our analysis, delve into their descriptive statistics and outlines the methodology and the models employed in the analysis. Section 3 presents the results of the econometric analysis and Section 4 investigates the marginal emissions avoided across various penetration levels of wind and solar power generation. Lastly, Section 5 offers some conclusions and discusses policy implications.
2. Materials and Methods
2.1. Literature Review
The relationship between renewable energy penetration and CO2 abatement has been extensively studied, with methodologies shifting from ex-ante simulation models to ex-post econometric analyses that utilize historical data to capture real-world grid dynamics.
Early foundational studies established that the abatement efficiency of RES is highly heterogeneous. Kaffine et al. and Cullen [3,4] demonstrated that in the US (ERCOT/Texas), wind power’s emissions impact depends heavily on the relative price of coal versus gas, estimating abatement between 0.43 and 0.52 tCO2/MWh. Novan [5] expanded this by highlighting that the environmental benefit of RES varies even within the same system due to the temporal availability of different technologies, a finding later reinforced by [17], who argued that location and timing are as critical as capacity. Bushnell and Novan [11] further emphasized that as solar penetration rises, its marginal value shifts as it begins to depress daytime wholesale prices, altering the dispatch order of thermal units.
In Europe, the literature confirms these non-linearities. Abrell et al. [7], analyzing Germany and Spain, found that wind and solar subsidies yielded different abatement costs depending on the specific thermal mix displaced. Weigt et al. [8] similarly noted for Germany that renewable effectiveness is tightly linked to the flexibility of the remaining conventional fleet. The Irish market, often comparable to Greece due to its size and interconnection constraints, has been a key focus. Di Cosmo and Valeri [18] estimated wind displacement at 0.48 tCO2/MWh in Ireland, noting it primarily backed out gas (CCGT) rather than coal. Oliveira et al. [6] refined this by showing that including interconnection flows (imports/exports) significantly increases the calculated abatement value, as domestic wind often displaces emissions in neighboring grids. Conversely, Wheatley [19] warned that stochastic wind generation could reduce the thermal efficiency of baseload plants, potentially limiting abatement gains, though Kaffine et al. [20] found these cycling penalties to be generally modest (less than 5%).
Recent studies confirm the ongoing relevance of empirical RES abatement analysis. Kartal et al. [21] demonstrate that renewable electricity generation significantly reduces CO2 emissions in Europe using daily nonlinear analyses, confirming asymmetric abatement effects across countries. Zou et al. [22] emphasize high-resolution emission factors, showing that they are essential for accurate carbon accounting in buildings. Millstein et al. [23] quantify the climate benefits from wind and solar power from 2019 to 2022. Lorente-de-Las-Casas and Marrero [24] analyze the impact of renewable energy deployment on CO2 emissions across OECD countries, finding a substantial impact on total emissions.
This study fills a critical gap by rigorously quantifying the historical displacement coefficients (wind vs. solar) in Greece’s pre-saturation grid (2012–2018). Unlike forward-looking models, our analysis isolates the specific interaction between intermittent renewables and the thermal fleet during the “Lignite Era,” providing the empirical baseline against which modern “saturation-era” efficiency can be measured.
2.2. Data and Variables
In this section the data and the variables used to analyze the evolution of CO2 emissions from the Greek electricity generation sector are presented together with relevant descriptive statistics. The study covers the period from 1 August 2012 to 31 December 2018.
Gross electricity production within the Greek interconnected system (The Greek interconnected system serves the needs of the mainland and certain connected islands. The remaining non-interconnected islands constitute small autonomous electrical systems, where electricity production relies on units powered by oil and renewable energy sources (RES)) reached 44.4 TWh in 2018, representing a 13.5% reduction compared to 2012 (51.3 TWh). This decline is attributed to both reduced demand and increased electricity imports. The majority of electricity generation (65.4%) originated from thermal units fueled by lignite and natural gas, while the remaining one-third was produced by renewable energy sources (RES), High-Efficiency Cogeneration of Heat and Power plants (CHP) as well as hydroelectric power stations. The share of conventional units in the generation mix declined significantly due to lower demand and higher imports, together with the substantial expansion of RES, whose share nearly doubled in 2018 compared to 2012.
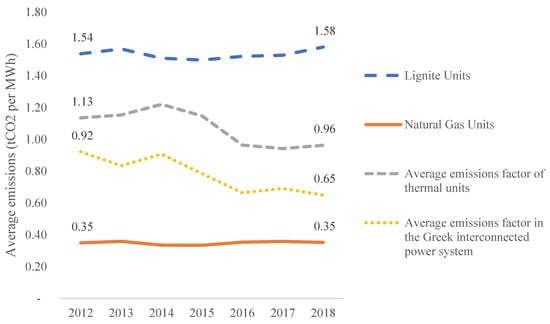
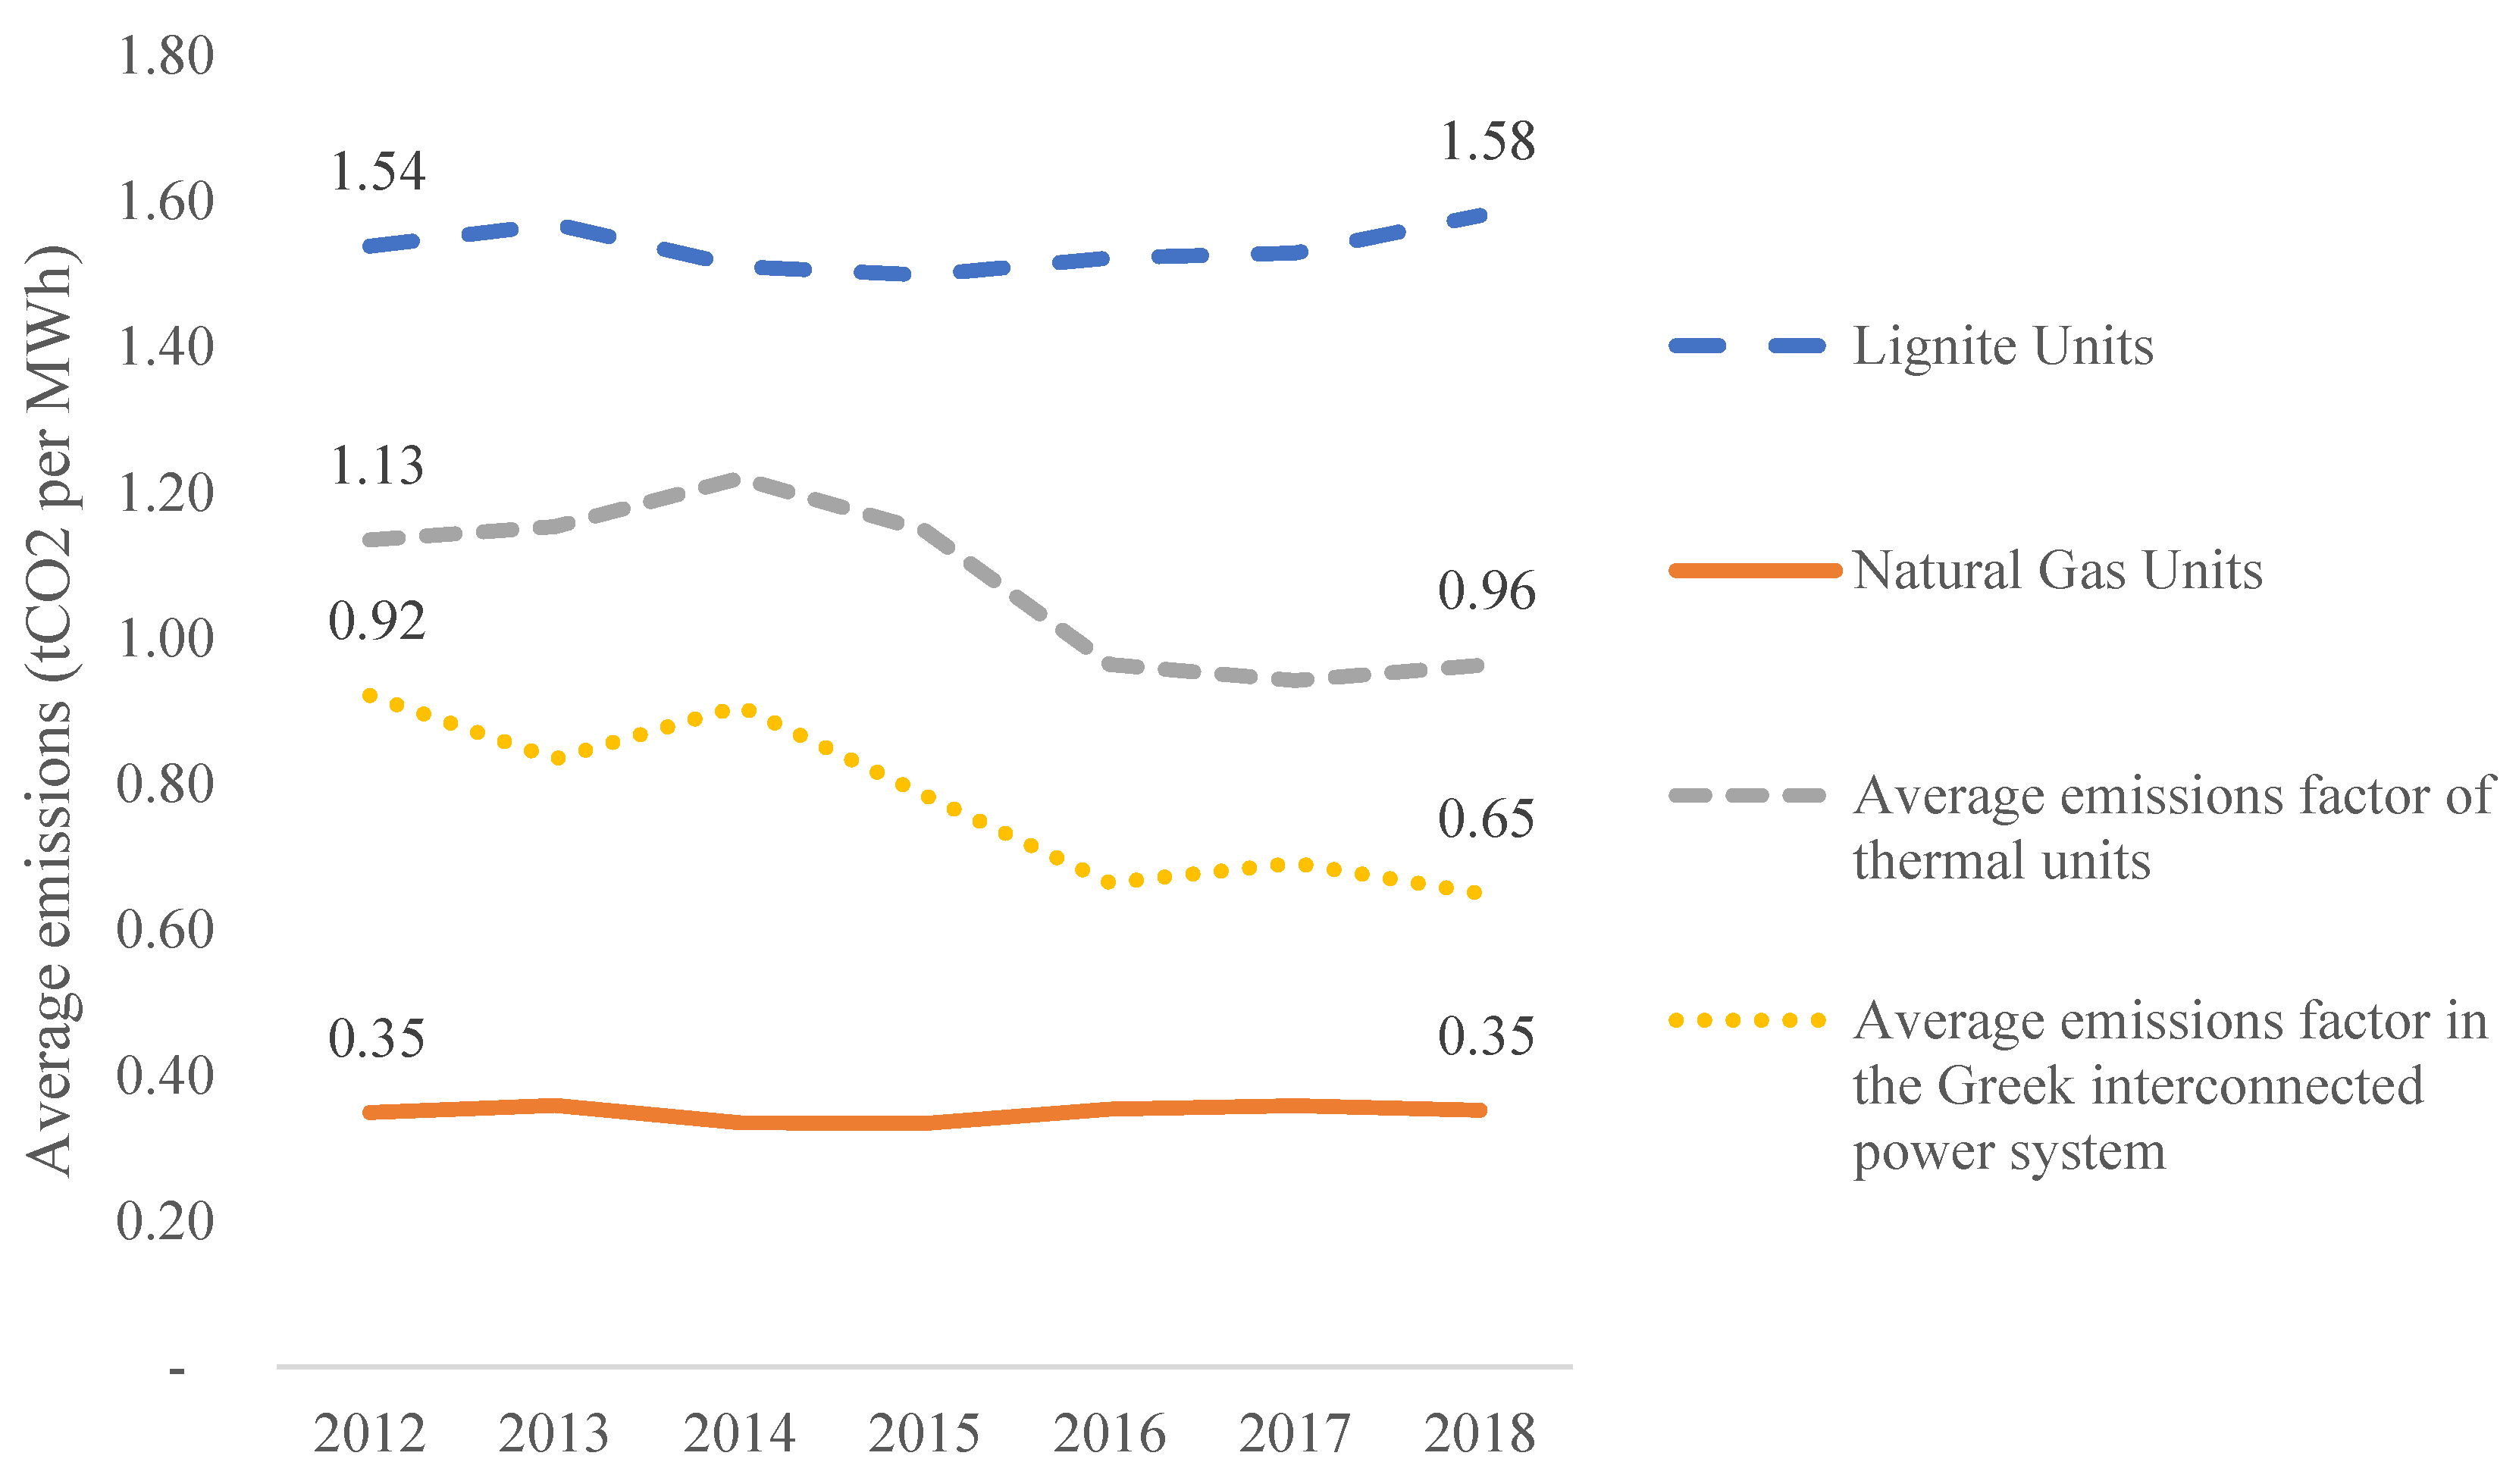
The sharp decline in thermal power generation, particularly from lignite units, combined with the expansion of renewable electricity generation, led to a significant reduction in total CO2 emissions in the Greek interconnected system. As the average CO2 emission factor of lignite units is considerably higher than that of natural gas units (1.54 tCO2/MWh for lignite units compared to 0.35 tCO2/MWh for natural gas units, on average during the period 2012–2018 based on verified emissions from electricity generation units), the relative stability of natural gas generation also contributed to this emissions reduction (with the exception of the intermediate years 2014 and 2015, when natural gas units generation declined substantially). Overall, between 2012 and 2018, annual emissions from the Greek electricity system decreased by 39%, falling from 47.3 million tons of CO2 in 2012 to 28.8 million tons in 2018. Consequently, the average CO2 emission factor of the system declined from 0.92 tCO2/MWh in 2012 to 0.65 tCO2/MWh in 2018 (Figure 1).
Figure 1.
Average CO2 emissions factor per type of thermal electricity generation unit. Source: Market Operator (LAGIE), Greek TSO (ADMIE) and EU Transactions Log. Authors’ calculations.
Our analysis uses hourly data obtained from the Greek Electricity System Operator (ADMIE). This dataset spans the period from 1 August 2012 to 31 December 2018, comprising 56,256 observations for each variable. The data include hourly electricity load, hourly electricity generation for each power station within the Greek interconnected system (including lignite, natural gas, oil, and hydroelectric units), net imports, actual wind power generation, and estimated hourly solar photovoltaic generation.
The use of forecasted rather than actual solar PV generation data stems from the institutional structure of the Greek electricity market during the study period. Most solar PV installations in Greece during 2012–2018 operated at the medium-voltage distribution level with feed-in tariffs. These installations did not participate in day-ahead market scheduling, and their real production data were not immediately included in system operation records. Actual production data for these units had significant time delays in clearance and reporting, making them unavailable for timely system analysis. Several previous studies have used forecasted or estimated renewable generation data due to data availability constraints [17], and this is widely recognized as a practical limitation in ex-post renewable studies. Forecast errors are largely unsystematic; periods of over-forecasting tend to offset periods of under-forecasting, particularly when aggregated to hourly system-wide data. Random measurement errors in solar generation would therefore tend to make our coefficient estimates conservative (biased toward zero). While we acknowledge this limitation, we do not expect it to affect the validity of our core findings.
We also incorporate data on verified CO2 emissions for each year of the study period, together with plant-level data for thermal power stations subject to the European Union Emissions Trading System (EU ETS). Using this information, we derive the average annual emission factor for each power plant by dividing the annual verified CO2 emissions by the plant’s annual gross generation. By multiplying hourly electricity generation of each station by its corresponding average annual emission factor, we estimate hourly CO2 emissions at both the plant level and for the system as a whole.
The use of average emission factors may not yield perfectly precise estimates of avoided CO2 emissions. Although emission factors remain relatively stable across most technologies, they can vary depending on the production level of each unit. Units operating close to their maximum capacity function more efficiently, while partial capacity utilization increases emission factors. During rapid ramping-up periods, emission factors tend to increase, while they decrease when production declines, although not necessarily in a symmetric manner [4]. Although the literature suggests that variation in emission factors across production levels may present a potential issue [25], a study by NREL [26] estimated that cycling induced by wind and solar generation had only a minor impact (less than 5%) on reductions in CO2, NOx, and SO2 emissions. For the average thermal unit, cycling caused by wind and solar photovoltaic generation could either increase or decrease emission factors, depending on the composition and penetration of renewable generation. Similarly, studies [18,20] found no significant impact of stochastic wind generation on CO2 emissions or on the operational efficiency of thermal generation units.
Given system load conditions, RES production leads to a reduction in conventional generation or electricity imports, while the absence of RES production requires an increase in conventional generation or imports. Reductions in conventional generation during ramping-down periods are associated with lower emission factors; however, the marginal unit may not operate close to its maximum capacity and may therefore exhibit higher emissions. In addition, changes in conventional generation may be distributed across multiple units. In day-ahead wholesale electricity markets, such as the Greek market during the study period, daily scheduling is determined through optimization processes, meaning that unexpected deviations in intermittent renewable generation are particularly relevant since dispatch decisions are determined one day in advance. If forecast errors in renewable generation remain relatively small, the use of average factors is unlikely to introduce significant bias. Furthermore, because emission factors are derived from verified emissions, both periods of higher and lower operational efficiency are implicitly captured. Bias would only arise if intermittent renewable generation systematically caused operation either above or below the production level corresponding to the average factor.
During the examined period, nineteen (19) thermal power plants (comprising one or more generating units) subject to emission control were operational in the Greek electricity generation sector. Of these, eight (8) were lignite-fired plants, nine (9) were newly constructed combined-cycle gas turbine (CCGT) plants, one (1) was an open-cycle gas turbine plant, and one (1) was a conventional thermal power plant with oil and natural gas. The emission factor of each unit depended not only on the carbon content of the fuel used but also on the plant’s operational level. Operation close to nominal installed capacity resulted in lower emission factor compared to operation at the technical minimum. As illustrated in Figure 1, the average emission factor of lignite-fired plants (calculated as a simple arithmetic mean) was approximately 1.58 tons of CO2 per MWh, with significant variation among the plants. By contrast, CCGT plants exhibited substantially lower emission rates, averaging around 0.37 tons of CO2 per MWh with limited dispersion among facilities. Because lignite plants had lower marginal costs than CCGT plants during the study period, combined with relatively low CO2 allowance price, they tended to operate closer to their full capacity [27,28]. Finally, simple gas and oil-fired power plants were less efficient and exhibited higher emission factors than modern gas-fired units; however, they were utilized only to a limited extent during the period under examination.
2.3. Descriptive Statistics
Table 1 presents summary statistics for CO2 emissions, electricity generation by unit type, electricity imports and exports, and total system load.
Table 1.
Summary statistics.
Hourly CO2 emissions in the Greek interconnected electricity system exhibited substantial variability during the study period. This variability arose because the fluctuating hourly load was served by power generation units with differing emission factors and production levels. Average hourly electricity generation from wind power amounted to 466 MWh, corresponding to 8.1% of the system’s average hourly demand. Although wind production followed an upward trend over time, hourly generation exhibited considerable fluctuations. Variability was even more pronounced for solar power generation due to the seasonal and diurnal availability of solar radiation. On average, hourly production from solar power units was 388 MWh, equivalent to 6.8% of the system’s average hourly demand.
Hourly electricity generation from lignite units, responsible for the highest share of CO2 emissions in Greece, displayed relatively limited variability. This pattern reflects the high capacity factors at which lignite plants operated during the study period, largely due to their low fuel costs and relatively low emission allowance prices. On average, lignite generation accounted for approximately 38.2% of total hourly system load, although it exhibited a clear declining trend over the examined period. Natural gas units also played an important role in meeting electricity demand. Average hourly generation from natural gas plants represented 24.4% of system load and increased over time, while displaying greater variability compared to lignite generation.
Average hourly electricity production from hydroelectric stations accounted for 9.3% of system demand and showed substantial variability depending on water availability. Hydropower was primarily used to meet intermediate and peak load. Electricity imports, on average, exceeded exports by a significant margin, representing 16.9% of the average hourly load compared to 3.8% for exports. Imports serve system load depending on operational requirements and within the limits imposed by interconnection capacity. As such, they do not contribute to domestic system emissions but instead contain them (During the period under examination, the Greek power transmission system was interconnected with Albania, North Macedonia, Bulgaria, and Turkey through five 400-kV alternating current lines with a total available transfer capacity of 1566 MW. Also, there is a connection with Italy via a 400-kV direct current link with a transfer capacity of 500 MW [29]). Consequently, to the extent that intermittent renewable generation replaces electricity imports, it contributes to emissions reductions in the systems from which those imports originate.
2.4. Econometric Approach
To estimate the CO2 emissions avoided due to electricity generation from wind and solar power units, we employ an econometric model similar to those used in previous studies [3,5,6,7] (With the exception of [7], these studies focused on wind energy). This model directly examines the relationship between CO2 emissions (dependent variable) and electricity generation from wind and solar power (independent variables), exploiting the exogenous and stochastic variability of renewable generation. However, because multiple factors influence CO2 emissions, it becomes necessary to introduce control variables to isolate the effect of renewable generation. Accordingly, we include total hourly system load as a control variable, along with a set of fixed effects to capture potential seasonality and other systematic influences on emissions from thermal electricity generation. To allow for nonlinear effects of system load to emissions, we include both the squared and cubed load terms (Some researchers [3,7] have used temperature (or heating and cooling degree days) raised to various powers as an explanatory variable to control for potential other effects (e.g., on the operational efficiency of units through the impact of temperature on the heat rates of units)). Equation (1) presents the model to be estimated:
where Emt denotes hourly CO2 emissions measured in tCO2; Windt stands for the hourly electricity generation from wind power units (MWh), PVt indicates the forecasted hourly electricity generation from solar power units (MWh), Loadt denotes hourly system load (MWh), Dt is a vector of fixed effects used to control for annual, monthly, daily, and hourly effects that may influence emission dynamics (There are 24 fixed effects for hours of the day, 7 fixed effects for days, 11 fixed effects for months, and 6 fixed effects for years of the examined period), and εt is the disturbance term, following a stationary AR(3) process: where uτ is i.i.d. with a zero mean. The coefficients of primary interest are β1 and β2, which represent the marginal change in CO2 emissions in the Greek interconnected electricity system resulting from variations in wind and solar power generation, respectively. Thus, for each additional MWh of wind and solar generation, these coefficients measure the quantity of CO2 emissions avoided.
Equation (1) is estimated both for the entire study period and separately for each year to identify temporal potential differences.
In addition to estimating the impact of intermittent renewable generation on CO2 emissions, we examine the types of conventional electricity generation displaced by wind and solar output [5,11]. This analysis provides further insight into the sources of avoided emissions. To do so, we estimate an additional set of econometric models similar to Equation (1), of the form:
where Qit denotes the hourly quantity of actual production or supply from conventional generation type i = 1, …, 4 corresponding to lignite, natural gas, hydroelectric stations, and net imports (imports minus exports).
Estimating the net imports equation is particularly important because it allows us to evaluate the extent to which wind and solar generation in Greece reduces emissions in neighboring electricity systems. This effect depends on the composition of imported electricity and the emission intensity of the exporting systems. Cross-border transmission interconnections represent an important source of flexibility for electricity systems, enabling them to integrate larger shares of intermittent renewable generation at relatively low cost [30]. Consequently, analyses that consider only domestic generation may underestimate the total emissions avoided by renewable electricity production. Part of the emissions reduction may occur in the systems from which imports originate or to which exports are directed, particularly when imports substitute for thermal generation.
Before conducting the empirical analysis, we perform standard tests to assess the stationarity of the time series used in the estimations. Specifically, we employed the Augmented Dickey–Fuller (ADF) test [31,32] to detect the presence of unit roots in the series, both with and without a linear trend. Lag length selection was based on the Schwarz information criterion. We also applied the Phillips-Perron test [33] to examine the presence of unit roots in the levels of the series levels and in levels with a linear trend. The Phillips-Perron test is robust to potential autocorrelation and heteroskedasticity in the residuals of the test equation. For all variables, the null hypothesis of a unit root is rejected at the 1% significance level across all relevant tests, indicating that the series are stationary (The results of these tests are available from the authors upon request).
For models (1) and (2) we also assume that all independent variables are determined exogenously. The exogeneity of wind and solar generation is justified by several factors specific to the Greek system during our study period. Wind and solar output is determined by exogenous meteorological conditions (wind speed, solar irradiance) that are not influenced by electricity market conditions or emissions levels. Also, during 2012–2018, RES units in Greece operated under a feed-in tariff (FiT) regime with guaranteed priority dispatch. System operators were legally required to accept all available RES generation, meaning production decisions were not influenced by market prices, emissions, or conventional plant operations. Moreover, renewables curtailment in Greece during this period was negligible (less than 1% of potential output), primarily due to low renewable penetration relative to system flexibility. The few instances of curtailment were driven by exogenous transmission constraints, not by systematic operational responses to emissions or conventional generation levels. Finally, electricity demand is determined by economic activity, weather (heating/cooling), and time patterns, not by supply-side emission levels or generation mix. This assumption follows established practice in the econometric literature on renewable displacement effects [3,4,5,6], which similarly exploit weather-driven variation in renewable output. It should be noted, however, that this exogeneity assumption is appropriate for the low-penetration conditions of the study period. Extending the methodology to later periods with higher renewable penetration would require addressing potential endogeneity arising from systematic curtailment.
3. Results and Discussion
In this section, we present the results of econometric estimations regarding the average impact of wind and solar power generation on the CO2 emissions and the displacement of conventional electricity generation in Greece.
3.1. CO2 Emissions Avoided
Table 2 reports the empirical results of Equation (1) estimating the average effect of electricity production from wind and solar power units on CO2 emissions. Results are presented separately for each calendar year (columns 1 to 7) and for the entire study period (column 8).
Table 2.
Results of Equation (1).
The estimates reveal that the coefficients of the main variables of interest are statistically significant at the 1% level. As expected, the coefficients for wind and solar generation are negative, confirming their emissions-reducing effect in Greece’s electricity sector. For the full study period, the results indicate that a 1 MWh increase in electricity generation from wind and solar power reduces CO2 emissions by 0.439 tCO2 and 0.353 tCO2, respectively, on average. This finding highlights differences across renewable technologies in terms of the emissions reductions associated with their output. Given that the average CO2 emission factor in the Greek interconnected electricity system during the study period was 0.782 tCO2/MWh, the estimated avoided emissions from renewables are substantially lower than the system average. The coefficient on system load is positive overall, indicating higher emissions at higher demand levels served by conventional generation units. Some nonlinear effects are also identified, although their magnitude is relatively small. While these results do not represent the current Greek electricity system, given the significant structural changes in the generation mix since the end of the study period, they provide the historical reference essential for evaluating more recent developments in grid saturation and renewable integration.
Year-specific estimates show that the average avoided emissions by wind generation are consistently higher than those from solar power generation but gradually decline over time, whereas avoided emissions from solar power increase. These trends reflect the importance of the temporal availability of renewables generation and the corresponding substitution of conventional units with different technologies and emission factors. The opposite trends are consistent with changes in the generation mix and operational patterns during the study period. Increasing wind capacity led to higher penetration levels, causing wind to increasingly displace lower-carbon marginal generation (more gas, less lignite) or zero-carbon sources (hydro, imports). As wind penetration grew, operational hours extended beyond peak lignite-displacement periods. Moreover, higher wind output compressed high-carbon generation toward technical minimums, making further displacement less carbon-intensive. On the other hand, solar’s increasing abatement is due to several factors. Solar power generation coincides with daytime demand peaks, when lignite and gas plants operated at higher capacities. Daytime generation patterns mean solar continued to displace thermal units operating at higher capacity factors with stable emission rates. Finally, the increase in emissions abatement from solar generation reflects reduced displacement of hydroelectric generation in later years, as natural gas-fired plants gained a larger share of electricity supply while imports declined.
3.2. Displaced Electricity Generation of Conventional Power Plants
Table 3 presents the estimates of Equation (2) for the displaced electricity generation from conventional power plants. On average, the results indicate that 1 MWh of electricity generated from wind power displaces 0.177 MWh of lignite generation, 0.457 MWh of natural gas generation, 0.178 MWh of hydroelectric generation, and 0.145 MWh of net imports. Similarly, 1 MWh of electricity produced by solar power units displaces, on average, 0.157 MWh of lignite generation, 0.339 MWh of natural gas generation, 0.408 MWh of hydroelectric generation, and 0.106 MWh of net imports. Based on these estimates, 1 MWh of wind power generation cumulatively replaces 0.96 MWh of conventional electricity generation, while 1 MWh of solar power replaces approximately 1.01 MWh. The finding that 1 MWh of solar replaces 1.01 MWh of conventional generation falls within the expected range and does not indicate a bias. The slight deviation above unity can be attributed primarily to statistical uncertainty. Because the coefficients are estimates with associated standard errors, the cumulative sum of 1.01 is statistically indistinguishable from 1.0 given the uncertainty in individual estimates. Following Novan [5], we interpret values close to unity as confirmation that our estimates do not exhibit significant bias. A cumulative value substantially different from 1.0, would instead suggest specification errors or omitted variables. Our results therefore lie well within the acceptable range.
Table 3.
Results of Equation (2).
These estimates help explain the differences observed in the quantity of emissions avoided by each intermittent renewable technology. In particular, wind generation displaces a larger share of thermal electricity generation from lignite and natural gas compared with solar generation. At the same time, wind power generation displaces smaller amounts of hydroelectric generation and net electricity imports, which are sources associated with either zero emissions or emissions originating outside the domestic electricity system. As a result, wind power generation yields greater domestic emission savings than solar power generation.
Several factors explain why hydroelectric power is more likely to be displaced by solar power than by wind power. In Greece hydropower is used mainly to meet intermediate or peak load. Consequently, its production profile coincides more closely with solar generation, which occurs during daytime hours when electricity demand is typically higher. Because system operators prioritize hydropower when water resources are available, the predictable midday increase in solar generation often leads to the curtailment of flexible hydroelectric output. This mechanism also helps explain why the domestic emission reductions associated with solar generation are lower than those associated with wind generation. Solar displaces tends to displace a larger share of zero-carbon hydroelectric output whereas wind generation more strongly displaces carbon-intensive thermal generation.
These results also help explain why the estimated average emissions reductions associated with wind and solar generation are lower than the average emission factor of the Greek interconnected system. Both renewable technologies substitute, to a considerable extent, electricity generation that is associated with zero emissions, such as hydroelectric production and electricity imports.
Furthermore, because wind and solar generation affect the volume of electricity imported from neighboring systems, they also contribute to emissions reductions in those systems. An indication of this effect is provided in the last column of Table 3 which presents estimates obtaining by converting the displaced quantity of net imports into avoided CO2 emissions using the average emission factor (0.665 tCO2/MWh) (Authors’ estimate based on Eurostat and IEA data. First, the average emission factors in each system for each year were calculated. Then, by weighting the emission factors with the amount of imports from each system, the average emission factor per year over the period 2012–2018 was calculated for all imports to Greece. Then, the arithmetic average of the annual emission factors for all of Greece’s imports was calculated at 0.665 tCO2/MWh) of the electricity systems interconnected with Greece (Italy, Albania, North Macedonia, Bulgaria, Turkey). These estimates suggest that, on average, 1 MWh from wind power units in Greece reduces emissions in interconnected electricity systems by 0.096 tCO2. Similarly, 1 MWh from solar generation reduces emissions in these systems by approximately 0.070 tCO2. It should be noted, however, that these estimates should be interpreted as indicative. As in the case of domestic emissions estimates, the average emission factor of each neighboring system may differ substantially from the average emissions avoided for each MWh of renewable generation. Although the use of country-specific hourly emission factors would improve precision, the relative modest magnitude of cross-border effects and the stability of regional emission factors during the study period (2012–2018 yearly average: 0.665 tCO2/MWh; standard deviation: 0.054) suggest that using a single average emission factor does not materially affect the main findings. However, we conducted an uncertainty analysis using two extreme-case scenarios. In the first, we used the minimum emission factor for each neighboring system combined with the lowest share of electricity imports to Greece observed during the study period; in the second, we used the corresponding maximum values. The results suggest that the average emission factor ranges between 0.34 and 1.01 tCO2/MWh. This implies that the total external effect of renewables in interconnected systems varies between 4% and 13%, compared with approximately 8% in the baseline specification.
It is also important to note that the analysis does not explicitly model operational constraints of the Greek electricity system, such as reserve requirements, ramping limits or transmission constraints. However, because the estimations are based on observed hourly system outcomes (ex-post), the results implicitly capture the actual operational conditions of the system during the study period, including the effects of such constraints on the displacement of conventional generation. These constraints may limit the extent to which renewable generation fully displaces thermal units at certain hours, as some conventional plants may need to remain online for system stability or flexibility reasons. Transmission constraints may also affect the ability of renewables generation to substitute for imports or generation located in other parts of the system. Nevertheless, during the study period transmission these constraints appear to have been relatively limited, as indicated by the minimal curtailment of renewables generation.
4. Marginal Emissions Avoided per Wind and Solar Power and Demand Levels
As discussed in the previous section, intermittent renewable generation displaces electricity that would otherwise be generated by conventional power plants (typically marginal units) or supplied through net imports. However, the specific marginal unit displaced can vary depending on system load and the level of renewable generation. Since each conventional unit has a different CO2 emission factor, the quantity of emissions avoided by a marginal increase in renewable generation, may vary depending on system conditions. In this section, we examine the marginal impact of wind and solar power generation on CO2 emissions in Greece’s electricity sector across different levels of electricity demand and renewable generation.
4.1. Econometric Specification
To assess the influence of a marginal increase in wind and solar power generation on CO2 emissions during periods of differing system demand and intermittent renewables production, we adopt the methodology proposed in [5], as extended in [6] and we expand upon it to encompass the effects of both wind and solar energy. Specifically, we estimate the following econometric model:
where Emt represents the hourly CO2 emissions of the system, and the pairs and denote the interaction between hourly wind power generation raised to the i-th power and demand raised to the j-th power, and likewise between hourly solar power generation and demand. The levels and powers of the load of the Greek interconnected system are included as control variables (accounting also for nonlinear effects). As previously mentioned, Dt is a vector of fixed effects used to control for annual, monthly, daily, and hourly effects that may influence emission dynamics, while εt is the disturbance term. Full coefficient estimates are provided in Table A1 in the Appendix A.
By partially differentiating Equation (3), we can calculate the marginal emissions avoided by an additional MWh of wind and solar power generation, given specific levels of wind or solar power (PV) unit generation, which are available when demand in the Greek interconnected system equals a specific load level. The marginal emissions avoided by wind and solar power generation, respectively, are determined by the following equations:
and
To further delineate the factors influencing the variation in emissions avoided, we analyze how net electricity imports change by reevaluating Equation (3). This involves replacing the dependent variable (CO2 emissions) with the hourly levels of net electricity imports. In this case, Equations (4) and (5) attribute the variation in net imports to the generation of an additional MWh of wind or solar energy during an hour when the system load and wind or solar power generation attain specific values.
4.2. Marginal Emissions Avoided
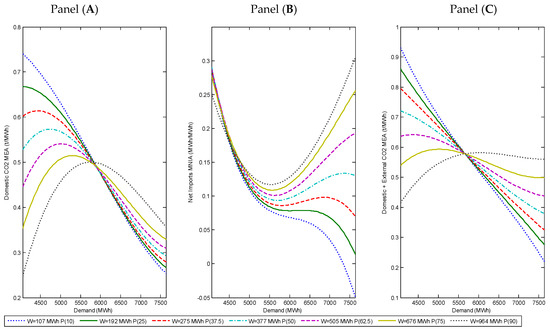
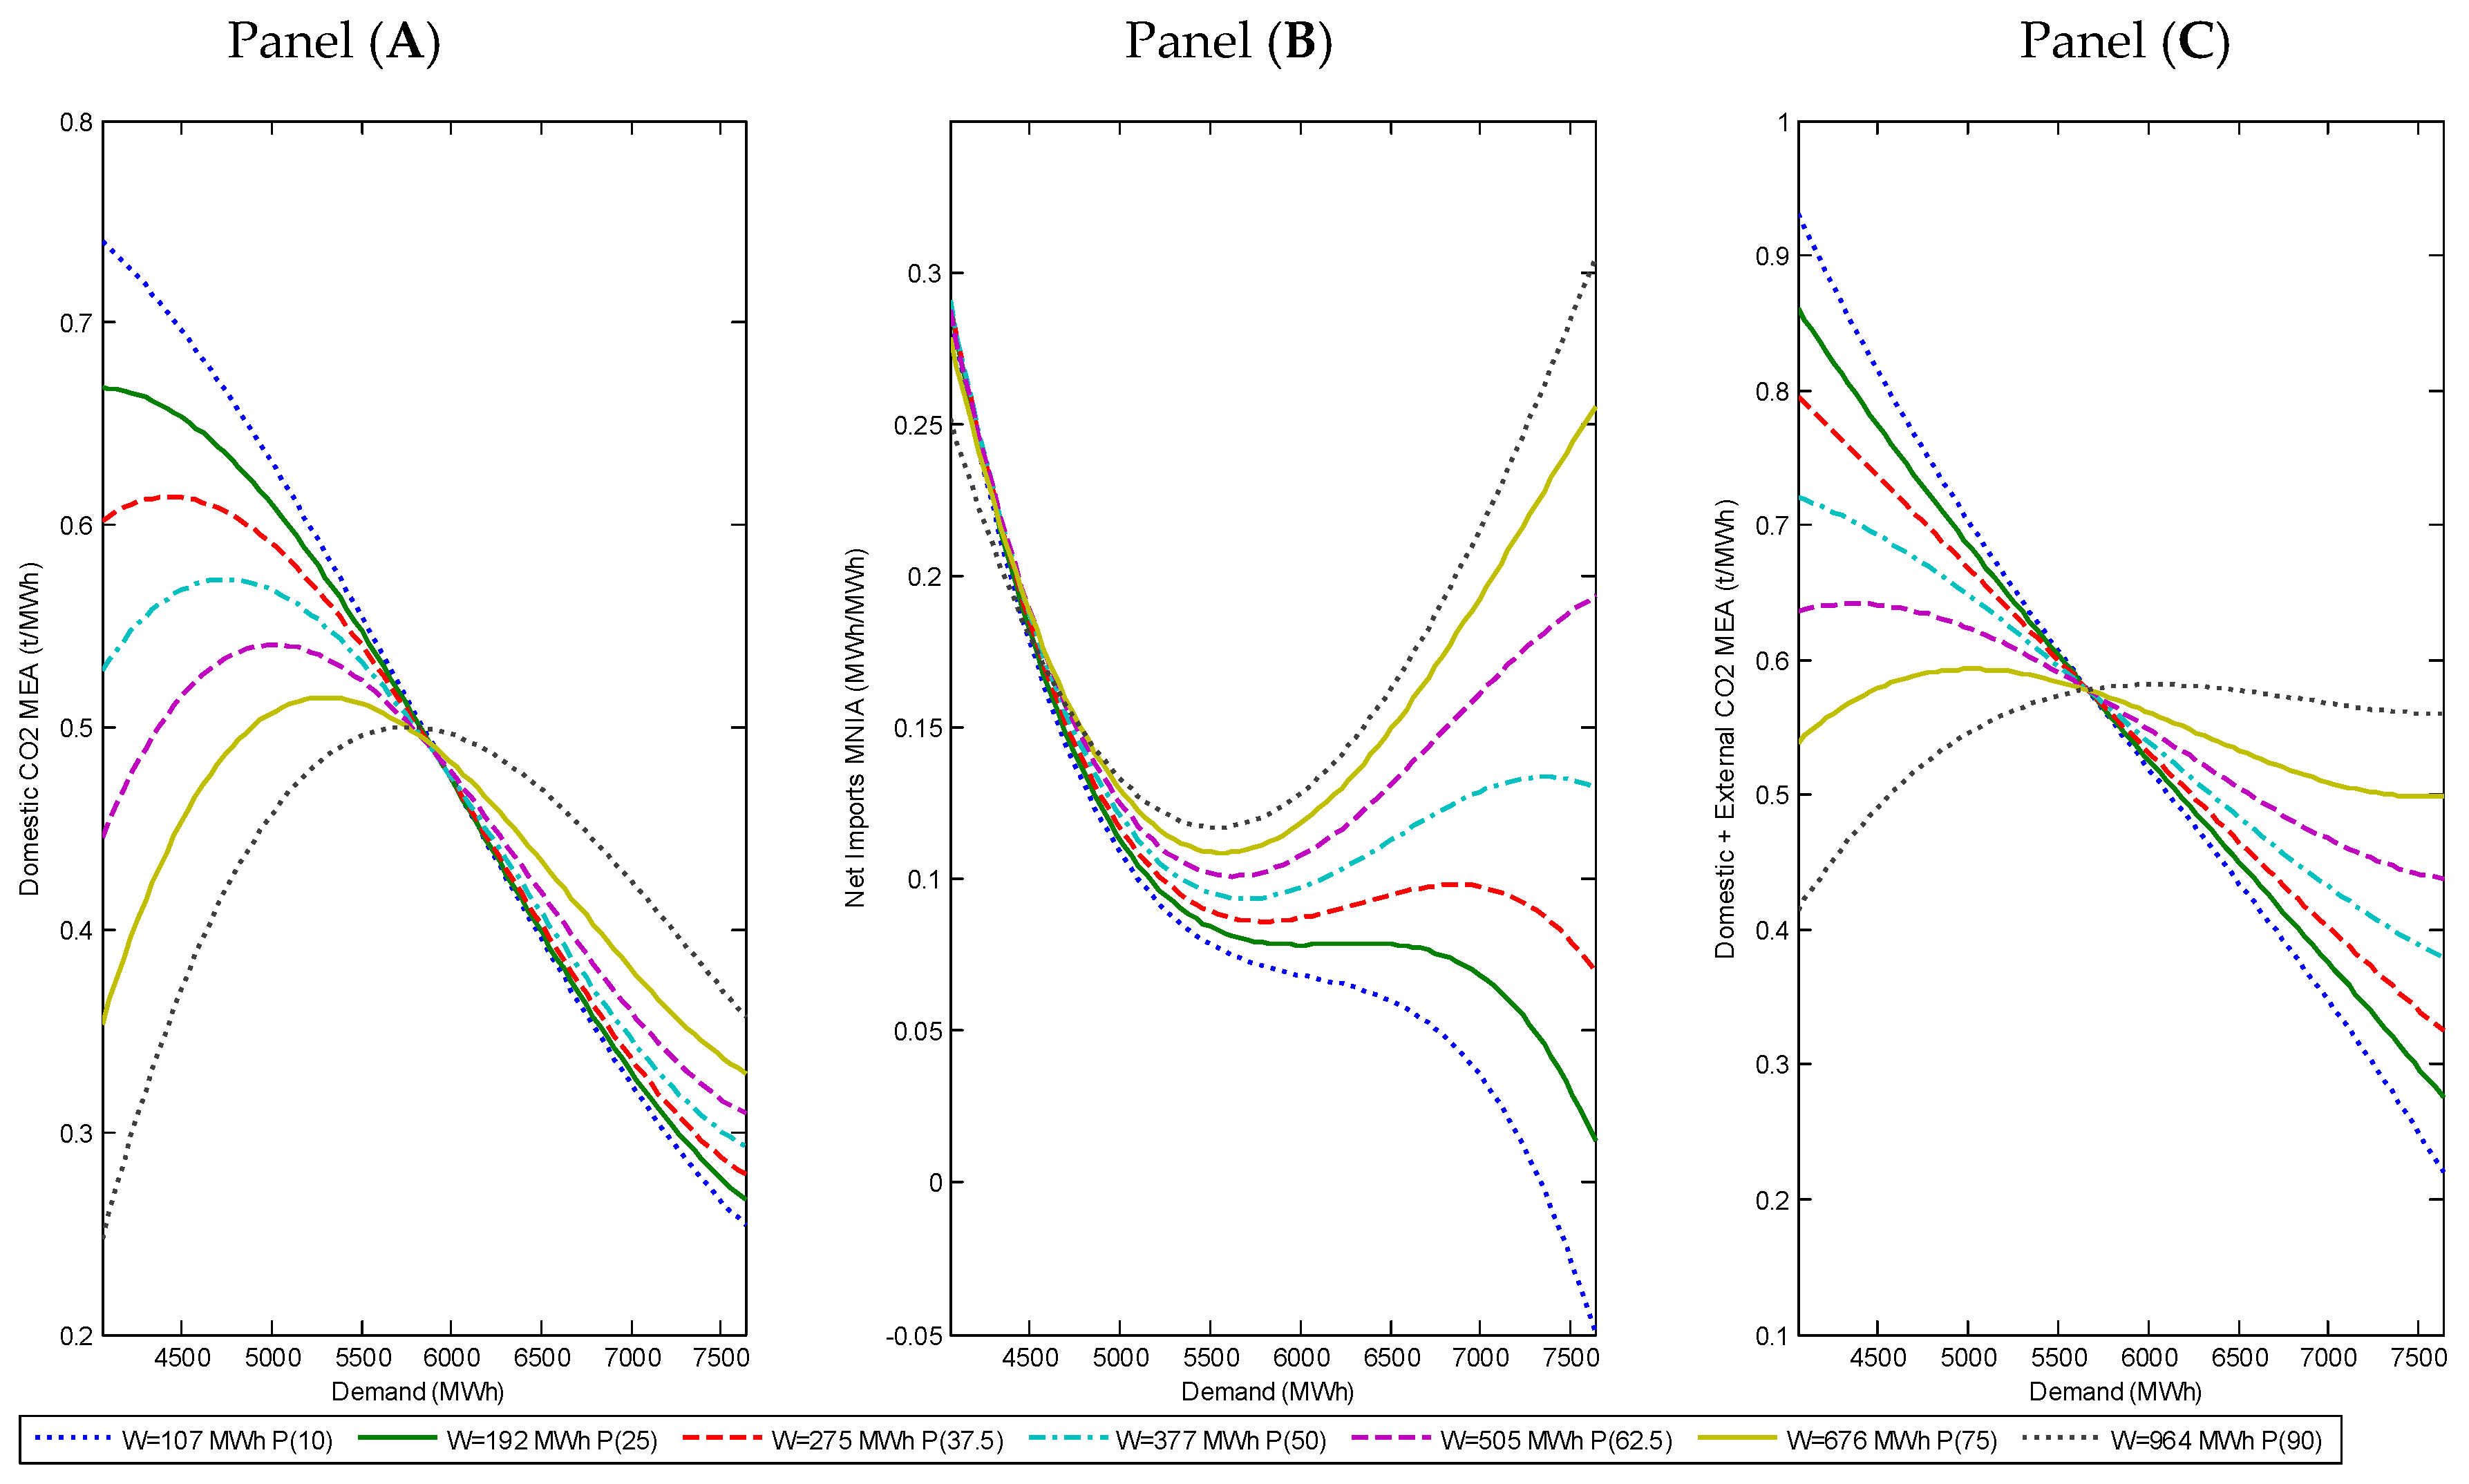
Estimates of the coefficients of Equation (3) for emissions and net electricity imports are provided in Table A1 in the Appendix A. Figure 2 illustrates the estimates of Equation (4) for marginal emissions avoided and the substitution of net imports by wind generation. The analysis considers hourly load levels ranging from approximately 4000 MWh to 7650 MWh, corresponding roughly to the fifth P(5) and ninety-fifth P(95) percentiles of the load distribution in the Greek interconnected system during the study period. The marginal emissions avoided by wind generation (MEAW) are shown in Panel A of Figure 2, while the marginal net imports avoided by wind generation (MNIAW) are shown in Panel B. The results are presented for seven wind generation levels corresponding to the tenth P(10) through the ninetieth P(90) percentiles of wind output. Panel C in Figure 2, presents the total marginal emissions avoided, calculated as the sum of the marginal emissions avoided of the Greek system (MEAW) and the emissions avoided through reduced net imports avoided (MNIAW) multiplied by the average emission factor of Greece’s interconnected systems (0.665 tCO2/MWh).
Figure 2.
(A) Domestic Marginal Emissions Avoided per MWh of wind generation, (B) Marginal Net Imports Avoided (MNIA) per MWh of wind generation, (C) Total Marginal Emissions Avoided per MWh of wind generation. P(x) denotes the xth percentile of the hourly wind generation distribution.
Panel A in Figure 2, which depicts the marginal emissions avoided within the Greek interconnected system due to wind generation, reveals substantial variation, depending on the combination of system load and wind output. Emissions avoided are relative low during hours with high wind generation and low demand, as well as during hours characterized by low wind generation and high demand. Interestingly, during low demand hours, emissions avoided tend to be higher when wind generation is relatively low. As demand increases, the difference in emissions avoided between low and high wind generation levels gradually diminishes. For demand levels above the median load (around 5700 MWh), emissions avoided increase with higher wind generation, although they gradually decline at higher load levels for each wind generation level, particularly when wind output is relatively low.
Panel B of Figure 2 presents the marginal net imports displaced by wind generation. As system load decreases, the amount of net imports displaced by wind generation increases, with relatively little variation across different wind output levels. However, for demand levels above approximately 5000 MWh, this pattern changes. In these cases, higher wind generation tends to displace larger volumes of net imports, while combinations of very low wind generation and high system load significantly reduce the displacement of net imports. This result is consistent with the role of net imports as a complementary source of electricity supply, particularly during periods when domestic demand is high and renewable generation is limited.
Panel C in Figure 2 presents an indicative estimate of the total emissions avoided due to wind generation, considering both the domestic electricity system and interconnected systems. The overall pattern is broadly similar to that observed for domestic emissions alone. However, because wind generation also reduces net imports, the total emissions avoided, including those occurring in interconnected systems, is larger at each load level.
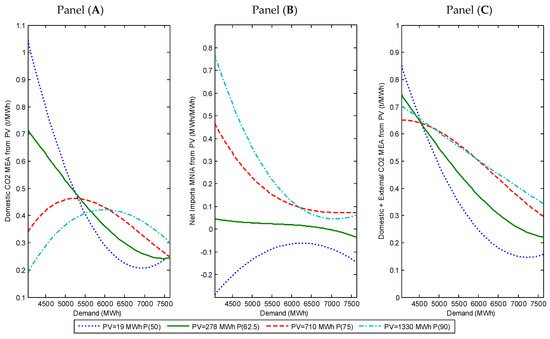
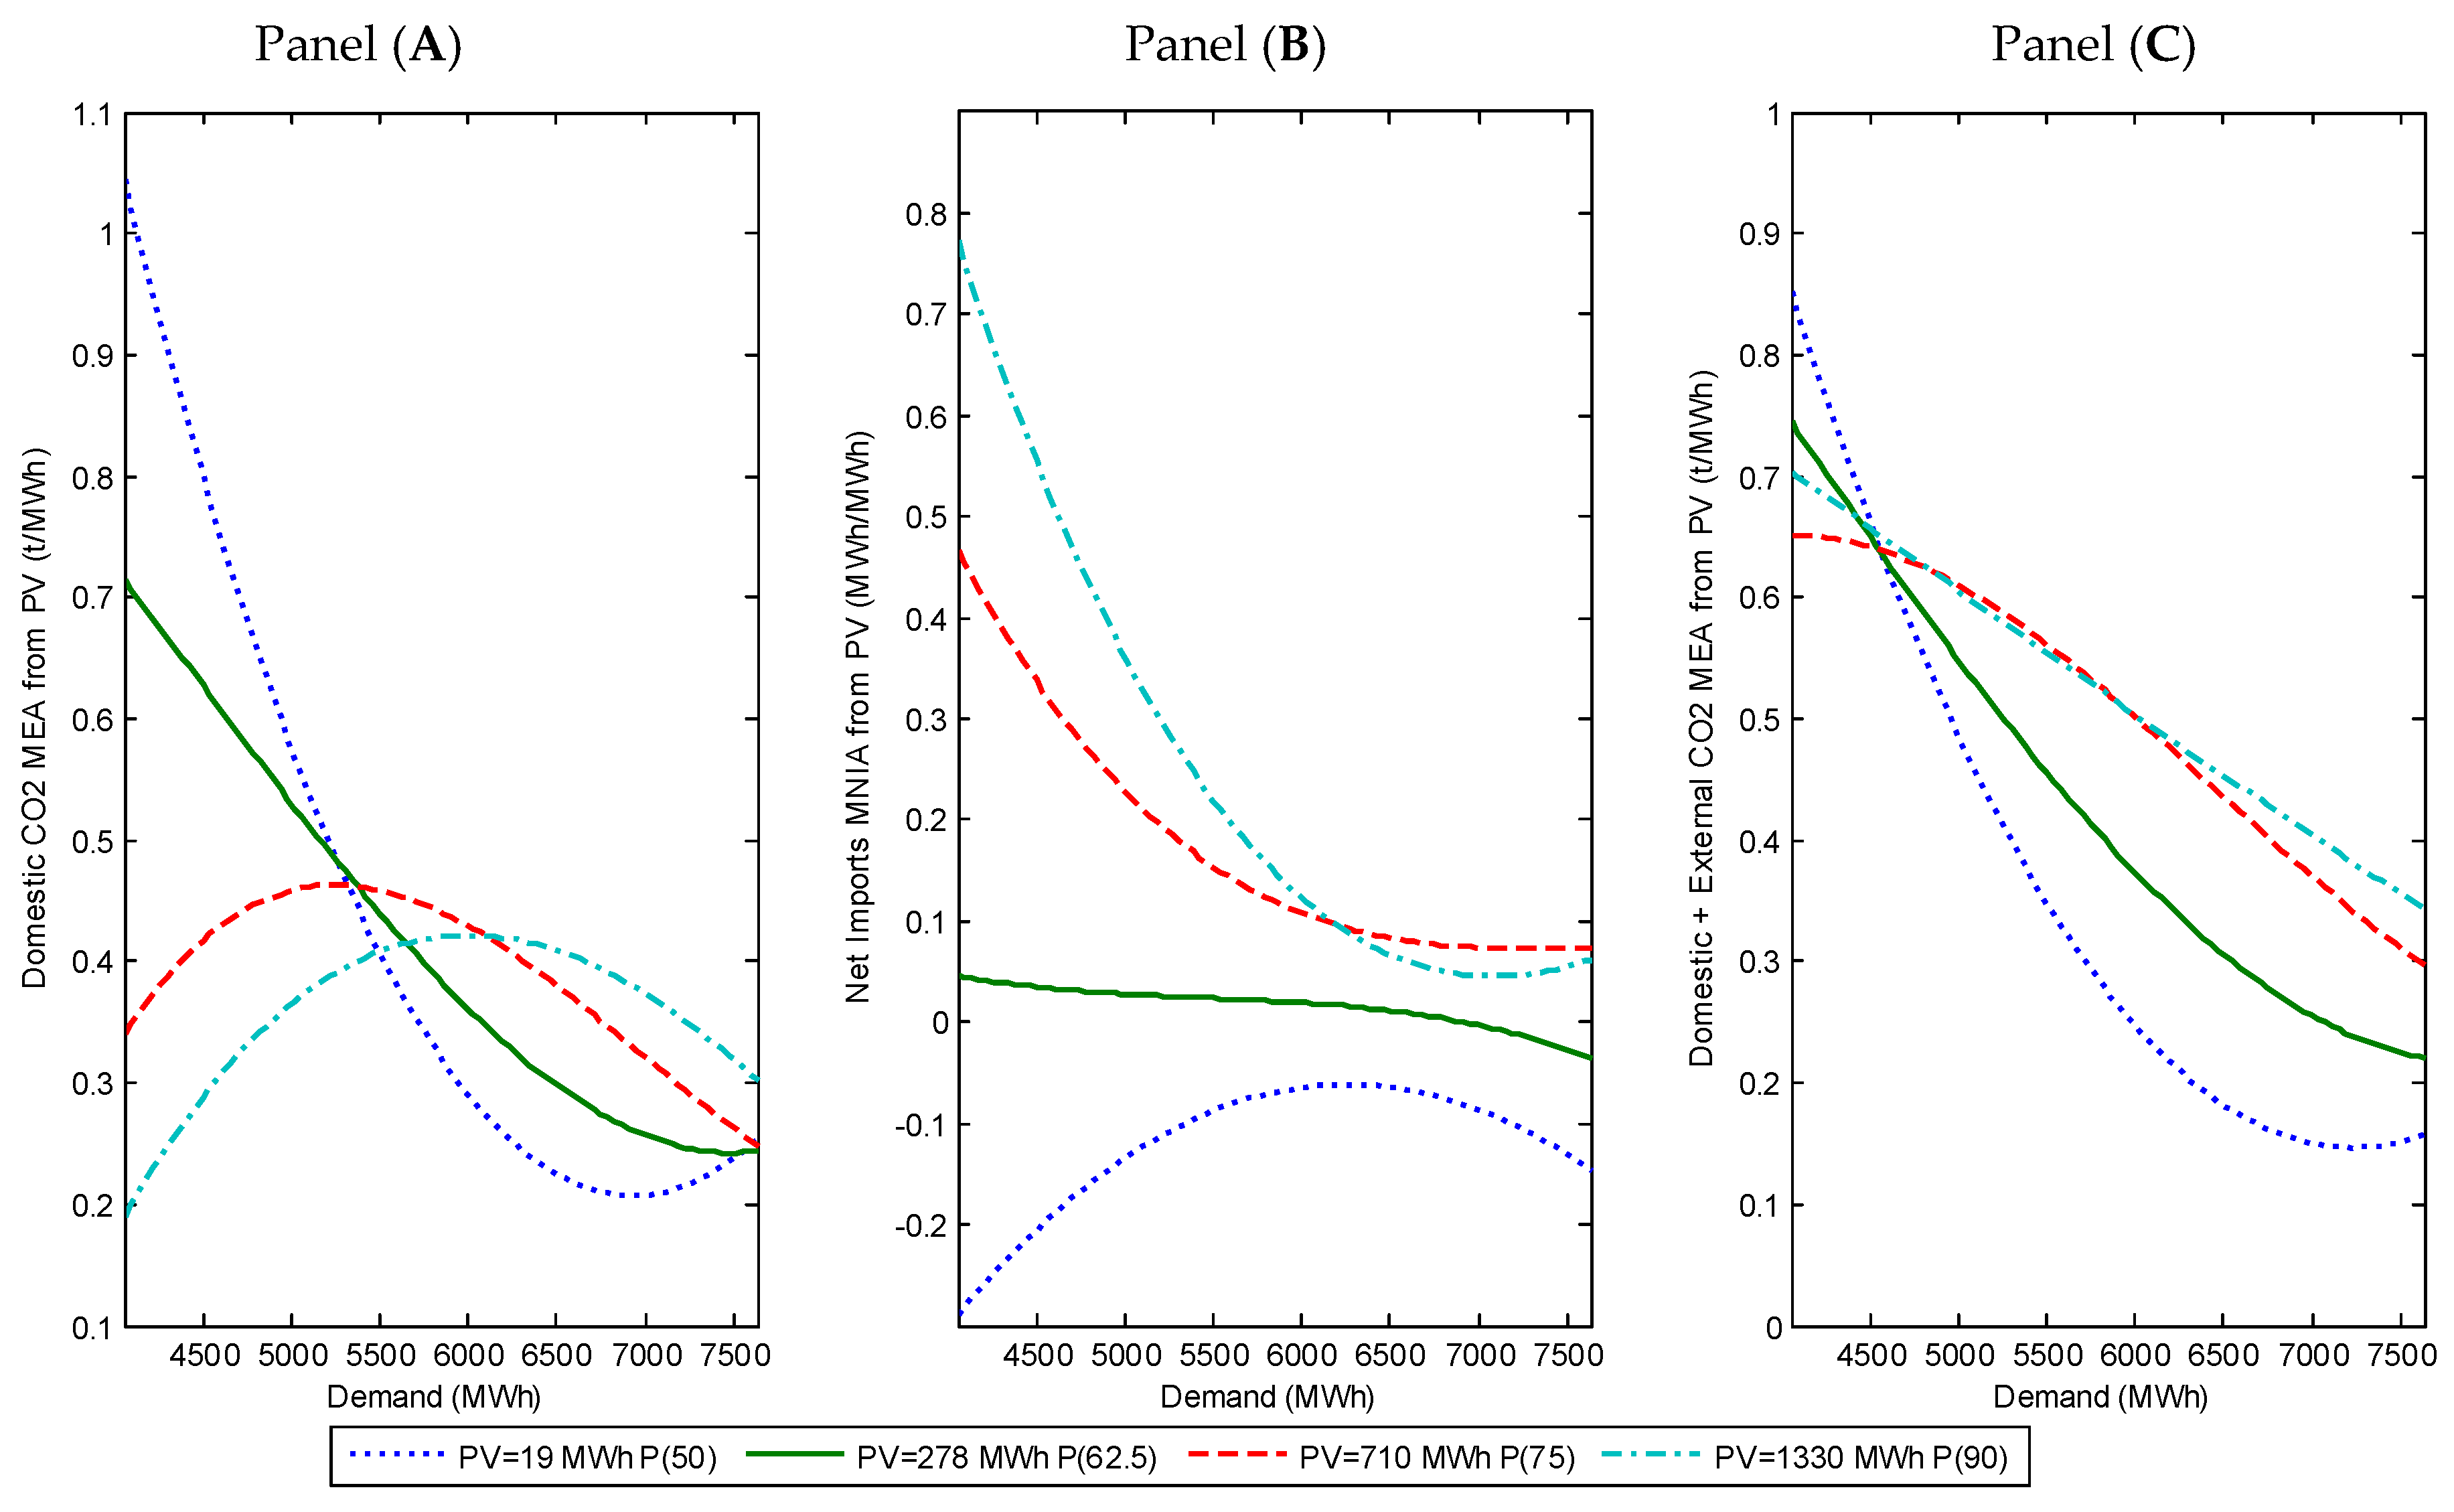
Figure 3 presents the estimates of Equation (5) for marginal emissions avoided and the substitution of net imports by solar power generation, using combinations of system load and solar output analogous to those used in the wind analysis. Panel A shows the marginal emissions avoided by solar generation (MEAPV) while Panel B presents the marginal net imports displaced by solar generation (MNIAPV). These results are shown for four levels of solar generation corresponding to the fiftieth P(50) through the ninetieth P(90) percentiles of solar generation distribution. Solar power generation’s distribution is heavily zero-bound due to nighttime hours, making lower percentiles (P10–P40) uninformative for marginal analysis. The P50–P90 range captures the meaningful variation in solar power production during daytime operational hours. Panel C presents the total emissions avoided, as the sum of the marginal emissions avoided of the Greek system (MEAPV) and the emissions avoided through reductions in net imports.
Figure 3.
(A) Domestic Marginal Emissions Avoided per MWh of solar power generation (B) Marginal Net Imports Avoided (MNIA) per MWh of solar power generation, (C) Total Marginal Emissions Avoided per MWh of solar power generation. P(x) denotes the xth percentile of the hourly solar power generation distribution. Note: Solar power generation’s distribution is heavily zero-bound due to nighttime hours, making lower percentiles (P10–P40) uninformative for marginal analysis. The P50–P90 range captures the meaningful variation in solar production during daytime operational hours.
Figure 3 (Panel A) illustrates the marginal emissions avoided by solar power generation in the Greek electricity system. The results indicate that emissions avoided are lowest when solar generation is high and system load is low. A similar pattern is observed during hours with high demand, regardless of the level of solar generation. A notable feature in the case of solar power is that during hours of low system load, emissions avoided are higher when solar generation are relatively low. As load gradually increases, the differences in marginal emissions avoided between hours of low and high solar generation diminishes. However, for demand levels exceeding the median load (approximately 5700 MWh), emissions avoided become higher at greater levels of solar generation, although they gradually decline with further increases in hourly demand, particularly at lower levels of solar generation.
Panel B of Figure 3 presents the marginal net imports displaced by solar generation. The results indicate that lower system load combined with higher solar generation leads to a greater displacement of net electric imports replaced. This pattern remains broadly consistent even at higher levels of demand. However, an important feature emerges at very low levels of solar generation. The marginal net imports displaced become negative. This result suggests that net imports complement solar generation when solar output is limited within the system. More specifically, negative marginal import displacement at very low solar generation levels indicates that when solar output is minimal or absent, typically during early morning, evening, or nighttime hours, the system relies more heavily on imports to meet demand, particularly during periods when import prices are competitive. This pattern reflects the complementary role of interconnections in the Greek electricity system. When solar generation is unavailable or very low, and domestic flexible generation (particularly hydroelectric and gas units) is insufficient or uneconomical, the system operator increases imports to balance supply and demand. Consequently, at these very low solar production levels, a marginal increase in solar output does not displace imports; rather, the system dynamics show that imports would need to increase further in the counterfactual absence of that marginal solar production. This finding underscores the importance of accounting for interconnection flows when evaluating renewable abatement efficiency, as it reveals that solar generation’s displacement effect varies not only by magnitude but potentially by direction depending on system conditions.
Overall, the emissions avoided from solar power generation in the domestic system and in the interconnected electricity systems (Panel C in Figure 3) tend to decrease significantly as hourly demand increases for all levels of solar power generation. This trend is more pronounced for lower levels of solar power generation.
In conclusion, the pattern observed—higher emissions avoided at lower RES levels during low-load hours—stems from the merit-order dispatch dynamics and the operational characteristics of lignite plants. During low-demand periods, lignite plants operated near their technical minimum output levels due to their (then) low marginal costs, and the costs associated with frequent start-up and shut-down cycles. When small increments of wind or solar generation became available during these hours, they displaced the marginal thermal units that would otherwise ramp up to meet incremental demand—typically the least efficient lignite units operating at sub-optimal capacity with higher emission factors, or gas units brought online for load-following.
Conversely, at higher RES penetration levels during low-load hours, the system had already significantly backed down thermal generation. Additional RES injection at these points increasingly displaced zero-carbon sources (hydroelectric power, which has operational flexibility) or reduced imports, rather than displacing high-carbon thermal generation. This explains why the marginal abatement efficiency diminishes at higher RES levels during low-load periods.
5. Conclusions
This study estimates the CO2 emissions avoided by wind and solar generation in the Greek interconnected electricity system during August 2012–December 2018. An additional MWh of wind generation reduces hourly CO2 emissions by 0.439 tons in the Greek interconnected electricity system and, indicatively, by 0.096 tons in interconnected systems. The corresponding reductions for solar generation are 0.353 and 0.070 tons, respectively. Avoided emissions per MWh of intermittent renewable generation are lower than the average emissions factor of the Greek electricity system during the period (0.782 tCO2/MWh), reflecting the mix of generation displaced when renewable energy is available. Wind generation displaces a larger share of thermal generation and a smaller share of hydroelectric generation and net imports—sources with zero emissions within the system or emissions occurring outside it—resulting in greater emissions reduction than solar. These findings highlight the importance of accounting for net electricity imports, consistent with [6].
These results provide a rare empirical benchmark for quantifying avoided CO2 emissions in the pre-transition phase of the Greek electricity sector—an era characterized by significant lignite dependence and the initial penetration of wind and solar power. These estimates capture the marginal emission profiles of an energy mix that no longer exists, offering a unique historical dataset for comparative and modeling purposes. Furthermore, the methodological framework developed here—combining hourly system data with generation mix and emission factors—can be directly replicated and extended to subsequent years, supporting consistent evaluation of carbon displacement effects over time. As such, the study contributes both to the historical documentation of the Greek power system’s evolution and to the methodological toolkit available for ex-post assessment of renewable energy’s climate impact.
The findings also offer several policy-relevant insights. By establishing the technical maximum abatement potential under unconstrained conditions, policymakers can quantify how much efficiency has been lost due to curtailment, grid saturation, and the shift away from high-carbon marginal fuels. Quantifying avoided CO2 emissions on an hourly and technology-specific basis enables policymakers to better understand the temporal effectiveness of renewable generation in reducing power sector emissions. Such metrics can support the ex-post evaluation of renewable support schemes, including feed-in tariffs and competitive auctions, by linking deployment outcomes with measurable climate benefits. Our finding that wind achieves significantly higher abatement than solar remains relevant for technology-specific support policies, even as the absolute values change. Also, the documented role of imports/exports in abatement accounting informs European-wide renewable policy coordination. As energy systems integrate higher shares of variable renewables, policy design must increasingly address the systemic factors that limit their carbon effectiveness, particularly curtailment, lack of flexibility, and insufficient grid capacity. Coordinated policies that align renewable deployment, storage incentives, and carbon pricing mechanisms can ensure that future investments continue to deliver maximum climate impact under evolving system conditions.
Since 2018, the Greek and broader European electricity systems have undergone profound transformations. The accelerated phase-out of lignite generation, the rapid increase in renewable capacity, and the greater interconnection of regional electricity markets have dramatically altered the carbon intensity of marginal generation. At the same time, steep declines in the capital cost of wind and solar technologies have made renewables the most competitive source of new capacity, reinforcing their central role in decarbonization strategies. However, the increasing share of variable renewables has amplified the need for flexibility resources, such as battery storage, demand-side management, and interconnections, to balance supply and demand in real time.
A growing challenge in this context is the rising curtailment of renewable generation due to intermittency, network constraints, and periods of low demand. Curtailment effectively reduces the realized carbon displacement potential of renewable energy, as part of the available zero-emission generation is not utilized to offset fossil-based production. The frequency and magnitude of these curtailments highlight the transition from a fuel-based to a system-based constraint on emissions reduction. Understanding how curtailment patterns evolve, and how they interact with flexibility resources, is thus essential for accurately estimating the marginal carbon benefits of additional renewable capacity.
The framework used in this study can be directly applied to post-2018 data to track temporal evolution of abatement efficiency but extending the methodology to high-penetration periods would require addressing potential endogeneity from systematic curtailment. Integrating more recent data and explicitly accounting for curtailment and storage dynamics would enable a longitudinal and systemic assessment of how emissions avoided evolve in a deeply decarbonized grid. This would provide critical insights for both policymakers and modelers, particularly in understanding how renewable electricity interacts with storage and grid flexibility to deliver optimal carbon reductions. In this sense, the findings presented here serve as a historical anchor for evaluating the ongoing transition, highlighting how the carbon value of renewable electricity evolves across different stages of energy system transformation.
Author Contributions
Conceptualization, G.I.M. and N.T.M.; data curation, G.I.M.; formal analysis, G.I.M. and N.T.M.; investigation, G.I.M.; methodology, G.I.M. and N.T.M.; project administration, N.T.M.; software, G.I.M.; supervision, N.T.M.; validation, N.T.M.; visualization, G.I.M.; writing—original draft, G.I.M.; writing—review and editing, N.T.M. All authors have read and agreed to the published version of the manuscript.
Funding
This research did not receive any specific grant from funding agencies in the public, commercial, or not-for-profit sectors.
Institutional Review Board Statement
Not applicable.
Informed Consent Statement
Not applicable.
Data Availability Statement
Data can be made available upon request.
Conflicts of Interest
The authors declare no conflicts of interest.
Appendix A
Table A1.
Results of Equation (3).
References
- European Commission. Stepping Up Europe’s 2030 Climate Ambition: Investing in a Climate-Neutral Future for the Benefit of Our People; COM(2020) 562 Final; European Commission: Brussels, Belgium, 2020. [Google Scholar]
- Del Río, P.; Mir-Artigues, P. Combinations of support instruments for renewable electricity in Europe: A review. Renew. Sustain. Energy Rev. 2014, 40, 287–295. [Google Scholar] [CrossRef] [Scilit]
- Kaffine, D.T.; McBee, B.J.; Lieskovsky, J. Emissions savings from wind power generation in Texas. Energy J. 2013, 34, 155–176. [Google Scholar] [CrossRef] [Scilit]
- Cullen, J. Measuring the environmental benefits of wind-generated electricity. Am. Econ. J. Econ. Policy 2013, 5, 107–133. [Google Scholar] [CrossRef] [Scilit]
- Novan, K. Valuing the wind: Renewable energy policies and air pollution avoided. Am. Econ. J. Econ. Policy 2015, 7, 291–326. [Google Scholar] [CrossRef] [Scilit]
- Oliveira, T.; Varum, C.; Botelho, A. Wind power and CO2 emissions in the Irish market. Energy Econ. 2019, 80, 48–58. [Google Scholar] [CrossRef] [Scilit]
- Abrell, J.; Kosch, M.; Rausch, S. Carbon abatement with renewables: Evaluating wind and solar subsidies in Germany and Spain. J. Public Econ. 2019, 169, 172–202. [Google Scholar] [CrossRef] [Scilit]
- Weigt, H.; Ellerman, D.; Delarue, E. CO2 abatement from renewables in the German electricity sector: Does a CO2 price help? Energy Econ. 2013, 40, S149–S158. [Google Scholar] [CrossRef] [Scilit]
- Biswas, A.; Qiu, M.; Braun, D.; Dominici, F.; Mork, D. Quantifying effects of solar power adoption on CO2 emissions reduction. Sci. Adv. 2025, 11, eadq5660. [Google Scholar] [CrossRef] [Scilit]
- Zhang, Z.; Qian, Z.; Chen, M.; Zhu, R.; Zhang, F.; Zhong, T.; Lin, J.; Ning, L.; Xie, W.; Creutzig, F.; et al. Worldwide rooftop photovoltaic electricity generation may avoid significant CO2 emissions. Nat. Clim. Change 2025, 15, 187–195. [Google Scholar] [CrossRef] [Scilit]
- Bushnell, J.; Novan, K. Setting with the sun: The impacts of renewable energy on wholesale power markets. J. Assoc. Environ. Resour. Econ. 2021, 8, 759–796. [Google Scholar]
- Zhu, Z.; Xu, Z.; Zhang, B.; Li, X. Shifting gears in thermal power: Displacement efficiency and environmental impact of wind and solar generation in China. Resour. Conserv. Recycl. 2025, 212, 107916. [Google Scholar] [CrossRef] [Scilit]
- International Energy Agency. Renewables 2025: Global Status Report; IEA: Paris, France, 2025. [Google Scholar]
- Glachant, J.-M.; Ruester, S.; Scheffer, A. The Merit Order and Price-Setting Dynamics in European Electricity Markets; JRC Technical Report JRC134300; European Commission: Brussels, Belgium, 2023. [Google Scholar]
- Smith, B.L.; Ramasamy, V.; Desai, U. An Updated Life Cycle Assessment of Utility-Scale Solar Photovoltaic Systems; NREL Technical Report NREL/TP-6A20-87372; National Renewable Energy Laboratory: Golden, CO, USA, 2024. [Google Scholar]
- Antweiler, W.; Muesgens, F. The new merit order: The viability of energy-only electricity markets with only intermittent renewable energy sources and grid-scale storage. Energy Econ. 2025, 145, 108439. [Google Scholar] [CrossRef] [Scilit]
- Callaway, D.S.; Fowlie, M.; McCormick, G. Location, location, location: The variable value of renewable energy and demand-side efficiency resources. J. Assoc. Environ. Resour. Econ. 2018, 5, 39–75. [Google Scholar] [CrossRef] [Scilit]
- Di Cosmo, V.; Valeri, L.M. How much does wind power reduce CO2 emissions? Evidence from the Irish single electricity market. Environ. Resour. Econ. 2018, 71, 645–669. [Google Scholar] [CrossRef] [Scilit]
- Wheatley, J. Quantifying CO2 savings from wind power. Energy Policy 2013, 63, 89–96. [Google Scholar] [CrossRef] [Scilit]
- Kaffine, D.T.; McBee, B.J.; Ericson, S.J. Intermittency and CO2 reductions from wind energy. Energy J. 2020, 41, 23–54. [Google Scholar] [CrossRef] [Scilit]
- Kartal, M.T.; Pata, U.K.; Alola, A.A. Renewable electricity generation and carbon emissions in leading European countries: Daily-based disaggregate evidence by nonlinear approaches. Energy Strategy Rev. 2024, 51, 101300. [Google Scholar] [CrossRef] [Scilit]
- Zou, A.; Raftery, P.; Roberts, M.; Wang, Y.; Lv, G.; Duarte, C.; Brager, G.; Schiavon, S. Temporal resolution matters: Evaluating carbon emission factors for accurate accounting in commercial buildings. Appl. Energy 2026, 412, 127655. [Google Scholar] [CrossRef] [Scilit]
- Millstein, D.; O’Shaughnessy, E.; Wiser, R. Climate and air quality benefits of wind and solar generation in the United States from 2019 to 2022. Cell Rep. Sustain. 2024, 1, 100105. [Google Scholar] [CrossRef] [Scilit]
- Lorente-de-Las-Casas, A.; Marrero, G.A. Impact of renewable energies on CO2 emissions in the OECD. Energy Sources Part B Econ. Plan. Policy 2025, 20, 2517325. [Google Scholar] [CrossRef] [Scilit]
- Inhaber, H. Why wind power does not deliver the expected emissions reductions. Renew. Sustain. Energy Rev. 2011, 15, 2557–2562. [Google Scholar] [CrossRef] [Scilit]
- NREL. The Western Wind and Solar Integration Study Phase 2; National Renewable Energy Laboratory: Golden, CO, USA, 2013. [Google Scholar]
- Fabra, N.; Reguant, M. Pass-through of emissions costs in electricity markets. Am. Econ. Rev. 2014, 104, 2872–2899. [Google Scholar] [CrossRef] [Scilit]
- Dagoumas, A.; Polemis, M. Carbon pass-through in the electricity sector: An econometric analysis. Energy Econ. 2020, 86, 104621. [Google Scholar] [CrossRef] [Scilit]
- International Energy Agency. Energy Policies of IEA Countries: Greece 2017 Review; IEA: Paris, France, 2017. [Google Scholar]
- Akrami, A.; Doostizadeh, M.; Aminifar, F. Power system flexibility: An overview of emergence to evolution. J. Mod. Power Syst. Clean Energy 2019, 7, 987–1007. [Google Scholar] [CrossRef] [Scilit]
- Dickey, D.A.; Fuller, W.A. Distribution of the estimators for autoregressive time series with a unit root. J. Am. Stat. Assoc. 1979, 74, 427–431. [Google Scholar] [PubMed]
- Dickey, D.A.; Fuller, W.A. Likelihood ratio statistics for autoregressive time series with a unit root. Econometrica 1981, 49, 1057–1072. [Google Scholar] [CrossRef] [Scilit]
- Phillips, P.C.B.; Perron, P. Testing for a unit root in time series regression. Biometrika 1988, 75, 335–346. [Google Scholar] [CrossRef]

Disclaimer/Publisher’s Note: The statements, opinions and data contained in all publications are solely those of the individual author(s) and contributor(s) and not of MDPI and/or the editor(s). MDPI and/or the editor(s) disclaim responsibility for any injury to people or property resulting from any ideas, methods, instructions or products referred to in the content. |
© 2026 by the authors. Licensee MDPI, Basel, Switzerland. This article is an open access article distributed under the terms and conditions of the Creative Commons Attribution (CC BY) license.