


Abstract
This study evaluates the technical feasibility of deploying containerized oxy-combustion power modules with integrated CO2 capture in remote Ecuadorian Amazon oil fields. Associated petroleum gas is conditioned with a 35 wt.% diethanolamine (DEA) sweetening stage specifically implemented to remove H2S and reduce acid-gas loading prior to combustion, improving fuel quality and protecting downstream equipment while increasing methane mole fraction for combustion. System efficiency is governed by stoichiometric oxygen demand, with methane requiring 2 mol O2/mol fuel and hexane requiring 11 mol O2/mol fuel; favoring methane-rich streams reduces ASU energy demand, enhances combustion performance, and lowers separation costs. The combined oxy-combustion cycle attains a thermal efficiency of 33.10% and an exergetic efficiency of 39.98%. Major energy penalties arise from the cryogenic air separation unit and the CCS train, yet operational tuning of CO2 recirculation and steam flow could raise thermal efficiency by up to 2%. The ASU produces oxygen at 96.67% purity with an energy consumption of 0.385 kWh/kg O2, while the CCS achieves 99.99% CO2 capture at 0.41 kWh/kg CO2. Sourcing gas from three production blocks provides flexibility to accommodate supply variability. The modular 272 MW unit demonstrates viability for off-grid power supply, routine flaring reduction, and scalable acid-gas valorization in frontier oilfields.
1. Introduction
1.1. Global Flaring Practices and Regulatory Gaps in Developing Regions
Routine flaring of associated petroleum gas (APG) remains a significant and ongoing issue in oil-producing regions worldwide [1,2]. Countries like Russia, Iraq, Iran, the USA, Algeria, Venezuela, and Nigeria produce about 40% of the world’s oil annually, and they account for nearly two-thirds (65%) of the world’s gas flaring [3]. On the other hand, strict permitting and prohibition clearly specify that flaring and venting must be solely for safety reasons and require explicit permits in Norway, the United Kingdom, and Canada [4,5]. Saudi Arabia is presented as a case study of successful flaring/venting reduction, moving from very high flaring before 1975 to effectively zero routine flaring after building the Master Gas System [6,7,8]. In the same region, the UAE highlights as a state with advanced scientific, technical and administrative systems for hydrocarbon exploitation, implying more developed regulatory and APG management [9,10].
Globally, despite regulatory efforts and technological advances [11,12], large amounts of APG are still flared [13], causing environmental, economic, and health issues. The challenge is worsened by infrastructure, financial, and policy barriers [14], particularly in developing countries with limited technology or regulatory enforcement [15,16,17]. The World Bank reports that in 2023, global gas flaring volumes reached 148 billion cubic meters (bcm) according to satellite-based estimates. This represents a 7% increase from 139 bcm in 2022 [18]. This results in over 500 million tonnes of CO2 equivalent emissions (CO2eq).
Table 1 compares APG flaring intensity across major oil-producing countries, highlighting the coexistence of high flaring levels in both developed (e.g., the USA) and developing (e.g., Iran, Iraq) economies [19]. It contrasts these with countries such as Norway, which have implemented stringent APG regulations and enforcement, resulting in very low flaring. This analysis illustrates how policy design, regulatory oversight, and enforcement effectiveness are often more decisive for flaring performance than income level or production volume alone. Specific regions, including sub-Saharan Africa, the Middle East (e.g., Iran and Iraq), and Latin America, have seen gas flaring and venting become the cheapest option in the absence of economic incentives and control policies [20].
Table 1.
Global Associated Petroleum Gas (APG) Flaring Intensity by Country and Regulatory Stringency.
In regions like the Niger Delta [30], Venezuela, and the Ecuadorian Amazon [31], flaring is frequently concentrated near vulnerable indigenous and rural communities. The combustion of APG produces harmful byproducts, including black carbon (BC), nitrogen oxides (NOx), sulfur gases, and volatile organic compounds (VOCs) [32,33,34]. These byproducts contribute to localized air quality degradation, respiratory illnesses, and ecosystem disruption. A study conducted between 2003 and 2012 in the northeastern Ecuadorian Amazon, a region rich in biodiversity and cultural significance, revealed that a total of 7.6 (Gm3) of gas was flared. This translates to an average of 782 million cubic meters (Mm3) per year, which is equivalent to 3.7 to 4.5 kilotonnes (kt) of BC annually [35,36].
Primarily, weak enforcement, limited institutional capacity, and inadequate monitoring systems lead to the ineffective implementation of anti-flaring laws in developing countries [37,38]. Outdated or fragmented legal frameworks, coupled with policy instability, undermine long-term compliance and investment [39]. Infrastructure constraints, such as insufficient pipelines and processing facilities, often make flaring the default option, while weak economic incentives discourage the utilization of gas [40,41]. Additionally, poor data transparency, corruption, and lack of political will further erode regulatory effectiveness, perpetuating high flaring volumes compared to the more coherent and enforced systems in developed nations [39].
1.2. Energy Waste and Underutilization of Associated Gas Resources
From both a thermodynamic and economic perspective, the routine flaring of APG results in a significant loss of high-calorific-value hydrocarbons [32,33]. APG typically contains substantial amounts of methane, ethane, propane, and heavier hydrocarbons, making it a valuable resource for electricity generation, chemical feedstock, or hydrogen production via steam methane reforming (SMR) [42,43]. However, in isolated oilfields, such as those in the Ecuadorian Amazon, logistical challenges and limited capital create barriers to commercializing gas via pipelines or liquefied natural gas (LNG) infrastructure [44]. Consequently, the energy that could be used to power operations, electrify nearby communities, or supply hydrogen value chains is wasted. This not only increases the carbon and energy intensity of the oil production cycle but also contradicts the objectives of the Sustainable Development Goals (SDG 7 and SDG 13) and Ecuador’s National Climate Change Mitigation Plan [45]. These initiatives aim to reduce GHG emissions in the energy sector from 20,321 kt CO2eq in 2018 to 19,039 kt CO2eq by 2035 and 16,808 kt CO2eq by 2050.
1.3. Environmental Risks of Incomplete Combustion in Flaring Systems
Beyond energy loss, a significant environmental liability stems from the incomplete combustion of CH4, the primary constituent of APG. CH4 has a global warming potential (GWP) approximately 28–36 times greater, when averaged over 100 years, than that of CO2. In poorly maintained or improperly operated flare systems—common in remote or informal sites—combustion efficiencies can fall below 90%, allowing substantial quantities of unburned CH4, sulfur compounds, and VOCs to escape directly into the atmosphere [46]. Complex modeling has demonstrated that incomplete combustion also results in the emission of carbon monoxide (CO), BC, and partially oxidized hydrocarbons. These emissions exacerbate the radiative forcing effect and increase health risks for nearby populations [47]. The combined effect of CH4 leakage and BC deposition on sensitive climate systems, such as the Andean glacier, could cause up to 22% of albedo reduction and make flaring a complex environmental threat [48]. Moreover, these emissions are often not accounted for in national inventories, making mitigation strategies ineffective or misaligned with the actual atmospheric burden [45].
1.4. Policy Initiatives and Innovation Pathways for Decentralized Gas Utilization
Global initiatives like “Zero Routine Flaring by 2030” (ZRF2030) are crucial efforts aimed at reducing associated gas flaring. The World Bank leads this program and has been endorsed by over 80 governments, including Ecuador, as well as various oil companies. It sets clear reduction targets and transparency frameworks for APG flaring. While these initiatives have yielded measurable progress in regions with robust regulatory systems, their effectiveness in Ecuador is hindered by weak enforcement, fragmented governance, and institutional inertia. Importantly, APG flaring in frontier areas is connected to the pace of upstream oil expansion. As new wells are drilled in ecologically sensitive or logistically challenging locations, the likelihood of stranded gas and subsequent flaring increases unless modular valorization solutions are implemented near the source.
1.5. Ecuador APG Flaring Situation and Challenges
In Ecuador, the routine venting and flaring of associated gas remains a persistent challenge, particularly in the remote production fields of the Amazon region [35]. Ecuador’s oil production averaged ≈ 485,000 bbl per day in 2022, 85% of which was located in the remote north-eastern Amazon (Sucumbíos, Orellana, and Pastaza) [49]. Roughly 94% of those wells are gas-constrained: either the flow lines are too short (≲3 MMscf per day) [50] to justify dedicated gathering, or the gas quality is too sour to meet National Interconnected System (SIN) pipeline specifications (CO2 < 2 mol%, H2S < 4 ppm) [51]. Typically, APG wells have H2S content that ranges from moderate (sweetening advisable): H2S ≈ 4–1000 ppm (0.0004–0.1 vol%) to high (sweetening required): H2S > 1000 ppm (≥0.1 vol%). In this case, removing H2S is compulsory to meet turbine/pipeline specs and to avoid corrosion and catalyst poisoning. Consequently, operators default to venting or flaring (Table 2).
Table 2.
Gas flaring reports in Ecuador.
Among the chemical challenges, typical associated gas streams from the Amazon contain 12–18 mol% CO2, 600–2500 ppm H2S, and 45–60 g/m3 of C5+ condensate (at 45 °C and 1 bar pressure). Treating this gas to meet sales quality standards may require a complex setup that includes a series of three-phase separators, TEG dehydration, DEA sweetening, and often involves a molecular-sieve polishing bed. The cost of such equipment can range from $15 to $25 million USD, even at a micro-scale of 5 MMscf per day. Operating expenses are primarily driven by chemical usage and energy consumption, estimated at approximately 0.9 kWh per Nm3 of sweet gas [52]. Regarding environmental concerns, 65% of flaring clusters are located within or near IUCN Category II reserves. Linear infrastructure projects necessitate ecological impact statements, prior consultations with 11 Kichwa-speaking communities [53,54], and a presidential decree if they intersect national parks. Current policies also present a challenge; for example, Executive Decree 1215 (2012) limits flaring to 3% of produced gas yet does not provide effective price signals or penalties. Enforcement audits cover less than 40% of active flares, and carbon tax proposals, such as Proyecto 138/2021, have stalled in the National Congress [55]. Monitoring satellite data (TROPOMI NO2 columns) has revealed gas plumes extending up to 60 km downwind from the Shushufindi-56 and Ishpingo-B stations. Measurements of PM2.5 at the Limoncocha Biological Reserve have peaked at 38 µg/m3 during periods of high flaring, which is three times higher than the World Health Organization’s guideline. Additionally, PM10 measurements have shown elevated levels of barium, cadmium, chromium, and molybdenum in soils, crops, water, and air. These findings correlate with a 27% increase in acute respiratory consultations at the Lago Agrio Hospital from 2016 to 2021 [55]. Regarding H2S content, there are documented acute and chronic health risks from hydrogen sulfide and evidence of plume-driven community exposure near oilfield operations; therefore, we include DEA-based sweetening for APG streams with H2S concentrations exceeding 2500 ppm to protect downstream equipment and minimize public-health impacts in adjacent communities.
To harness energy and reduce environmental and social impacts, we propose evaluating technological advancements in micro-scale gas processing with a binary power generation cycle [56]. These include containerized oxy-combustion (OXC) units with integrated carbon capture (CC), field-deployable liquefaction systems, and low-footprint amine sweetening modules. In this study, amine-based sweetening upstream of combustion is mainly proposed to remove H2S and to meet pipeline or engine fuel specifications; the primary drivers are safety, corrosion control, and combustion quality rather than reducing the downstream CO2 capture burden.
The goal is to identify viable opportunities for decentralized gas valorization in regions lacking infrastructure. When configured properly, these systems can convert chemically degraded APG into dispatchable power or thermal energy while significantly decreasing GHG emissions. Key challenges to address include parasitic energy loads, oxygen supply logistics, sour gas content, maintenance in high-humidity environments, and the trade-offs between CO2 capture efficiency and energy return on investment (EROI) [57]. This study aims to fill that gap by assessing the feasibility and carbon mitigation potential of containerized oxy-combustion and CO2 capture modules deployed in the Ecuadorian Amazon, considering site-specific gas compositions, climatic variables, and techno-economic constraints.
2. Materials and Methods
The methodology employed in this study encompasses a comprehensive multi-criteria analysis to evaluate the feasibility of utilizing APG for power generation. This process includes identifying optimal locations for power plant installation and an in-depth assessment of the integrated processes required for efficient power production and subsequent CO2 capture via compression. Initially, operational parameters—temperatures, pressures, and flow rates—are defined for each system component, including separators, mixers, and absorbers, using material and energy balances. Subsequently, preliminary thermodynamic analyses are conducted using Engineering Equation Solver® V9.944 to determine the available thermal energy and estimate the amount of CO2 that can be reinjected into geological formations. Following this, baseline estimates of energy output are established, providing a foundational basis for subsequent system optimization. The integrated system architecture features a two-stage gas expansion process, heat recovery steam generators (HRSG), and recirculation loops, with detailed documentation of equipment specifications and operational parameters. The supporting Supplementary Materials contains extensive data—including 53 tables and three detailed flow diagrams with unique equipment identifiers—covering energy and mass balances, component conditions, and performance metrics. Notably, these data demonstrate that the system can produce up to 4000 tonnes of oxygen daily, ensuring continuous operational capacity. The high-purity oxygen stream produced is seamlessly integrated into the Oxygen-Enhanced Combustion (OXC) system to optimize combustion conditions and minimize emissions. This newly developed system is intended for deployment within specific operational blocks managed by E.P. PETROECUADOR (the National Hydrocarbons Company) in the Ecuadorian Amazon, aligning with regional strategic development goals.
2.1. Evaluation of Associated Gas Potential Using Multi-Criteria Analysis (MCA)
This subsection allowed us to select the most suitable APG stream for electricity production by evaluating its energetic potential against defined technical criteria. The chosen criteria comprise (1) Composition and Quality: Emphasizing high methane content and low levels of impurities (CO2, H2S, and heavy hydrocarbons), which ensures efficient combustion and minimizes equipment fouling. (2) Lower Heating Value (LHV): Higher LHV results in increased energy output per unit of gas. (3) Daily Production Volume: Ensures a steady and adequate gas supply. Two stakeholders participated: the operator E.P. PETROECUADOR and the university project team (process and systems experts). Each stakeholder group completed independent pairwise comparisons of the three primary criteria. Pairwise comparison matrices from all respondents were aggregated using the geometric mean of individual judgments to produce a single group comparison matrix. Local priorities were derived from the principal eigenvector of the aggregated matrix and normalized to a unit sum, yielding final criterion weights: Composition and quality = 0.40; Heating value = 0.30; Volume per day = 0.30. The aggregated matrix passed the consistency test with a ratio = 0.07, confirming acceptable internal consistency. The selected criteria are grounded in thermodynamic and operational theory: a higher methane-rich composition improves combustion stoichiometry and reduces ASU energy demand; a higher LHV increases plant output per unit of feed; and a sufficient daily volume ensures economic and operational continuity for containerized OXC + CCS modules (Table S3). As a result, we selected production blocks 57, 60, and 61 due to their combined high LHV and production volume, with overall scores exceeding six on the evaluation scale.
2.2. Power Plant Location
The APG data were collected from nine production blocks—B18, B12, B43, B56, B60, B61, B07, B15, and B57—which include geographic coordinates, topography-related access constraints, and proximity to protected areas. This information was sourced from E.P. PETROECUADOR’s exploration and production maps spanning 2021 to 2024. Validation involved GIS overlays with IDE Ecuador and Sentinel-2 satellite imagery at 10 m resolution. The analysis also considered gas quality, logistical efficiency, and regulatory compliance. Using GIS tools such as QGIS and Google Earth, the proximity of blocks 57, 60, and 61 was evaluated to optimize pipeline routes and avoid environmentally sensitive zones. The selected site emphasizes shorter transportation distances and improved safety by avoiding flood- and landslide-prone areas.
Figure 1 illustrates the spatial scope of an APG harnessing study in Ecuador. The top-left panel situates Ecuador within South America, while the top-right zooms into national oil block distribution, highlighting blocks B1 through B17 across the Amazon region. The bottom panel focuses on study-specific zones, distinguishing purple “Study Blocks” from yellow “Oil Blocks”—suggesting a targeted assessment of APG recovery potential. The map’s layered design enables baseline definition, site prioritization, and regulatory traceability, serving as a strategic tool for environmental planning, infrastructure logistics, and audit compliance.
Figure 1.
Geospatial Distribution of Selected Oil Blocks for Oxy-Combustion with CCS Integration in the Ecuadorian Amazon.
2.3. Analysis and Processes Definition for the Integrated Power Generation System
The design of the integrated system includes natural gas treatment, power generation, and CO2 capture to maximize efficiency and minimize emissions Tables S13–S32. The proposed scheme combines OXC with a combined cycle unit, an ASU, and natural gas sweetening processes. We created detailed flow diagrams to illustrate the interconnected steps, from gas pre-conditioning to final energy conversion and CO2 compression. The design was validated through thermodynamic simulations using Aspen HYSYS v12.1 to establish mass and energy balances across the system modules, ensuring that the overall performance meets the required specifications.
Simulation Environment and Thermodynamic Models. All process simulations were performed in Aspen HYSYS v12.1 under steady-state conditions (25 °C, 1 atm reference). Property packages were selected according to subsystem requirements:
- APG and combustion streams: Peng–Robinson EOS for hydrocarbon-rich mixtures.
- DEA sweetening: Kent–Eisenberg amine model for acid gas absorption/regeneration.
- ASU: Soave–Redlich–Kwong EOS for cryogenic air separation.
- CO2 compression/liquefaction: GERG-2008 for dense-phase CO2.
Stream convergence tolerances were set to 1 × 10⁻⁶ for mass and energy balances. Equipment efficiencies, pressure drops, and pinch points were calibrated against vendor data and validated with literature benchmarks.
Gas Availability and Physicochemical Properties: The gas composition parameters include molar fractions of CH4–C6+, CO2, H2S, N2, and water vapor, as provided by E.P. PETROECUADOR (Tables S1 and S2). We directly estimate the gross calorific value (GCV), dew point, specific gravity, and Wobbe index. Daily flaring volumes (MMscfd) and utilization ratios were sourced from E.P. PETROECUADOR and were validated against World Bank GGFR VIIRS satellite flaring estimates for 2022. The analysis includes variability due to seasonal flooding and maintenance outages, which are factored into the uncertainty bounds.
Natural Gas Sweetening Process. The primary objective of the sweetening stage is H2S removal (H2S, measured between 600 and 2500 ppm in the sampled APG); however, as a side effect, CO2 levels will also decrease. This step can be skipped if the inlet sulfur content drops below 10 ppm of H2S. Sweetening, together with water and condensable hydrocarbons treatments, meets combustion-related fuel-quality requirements, protects cryogenic and compression equipment, and reduces public-health risks to nearby communities.
Chemical absorption with 35 wt.% DEA was selected for its proven performance in efficiently capturing H2S at the moderate–high concentrations observed in the feeds, its manageable regeneration energy requirements, and its lower corrosivity to alternatives. Typical targets for this unit are reducing H2S to single-digit ppm levels and removing free water and C5+ condensates that can foul heat-exchange surfaces and impair cryogenic separation. Literature and simulation studies report DEA removal efficiencies above 80% for combined acid gases under comparable conditions [58,59,60,61,62]. The sweetening sequence implemented in the flowsheet comprises inlet conditioning and liquid knockout, amine contactor absorption, and a regeneration (desorption) column to recover solvent and strip absorbed H2S and CO2.
Solvent makeup, reboiler duty, stage efficiencies, and pressure-drop assumptions used in the DEA model are provided in the Supplementary Materials (Tables S4–S12). Stream targets and verification checks (post-sweetening H2S, water dew point, and hydrocarbon condensate content) are reported to ensure compatibility with downstream ASU, turbine combustion requirements, and CO2 compression. Key assumptions:
- Feed composition: H2S between 600 and 2500 ppm, CO2 up to 18 mol%, with C5+ condensates.
- Absorber design: Packed column, stage efficiency 0.75.
- Performance targets: Reduce H2S to <10 ppm, remove free water and heavy hydrocarbons.
- Energy demand: Reboiler duty ≈ 3.2 MJ/kg acid gas; solvent circulation adjusted for ≥80% removal efficiency.
Representative balance data (Table S7–S12) show inlet molar flows of 8.97 × 10⁶ kmol/h and outlet flow of 8.08 × 10⁶ kmol/h, with heat duties around −2.91 × 10⁹ kJ/h. These values confirm compatibility with downstream cryogenic separation and turbine combustion requirements.
Oxygen Supply (Cryogenic Air Separation Unit, ASU). We designed a system to generate high-purity oxygen (approximately ≈ 96.7%) needed for the OXC process using ambient air. Our proposed method involves cryogenic distillation, comprising several key stages: air compression, cooling, flow splitting, and distillation in two columns (high- and low-pressure).
- Oxygen purity: 96.7% mol.
- Specific energy consumption: 0.385 kWh/kg O2.
- Operating pressures: 5–6 bar (HP column), 1.2–1.5 bar (LP column).
- Cooling duty: Intercooling stages minimize compressor work.
Simulation results align with vendor data, confirming energy penalties are consistent with industrial benchmarks.
Power Generation and CO2 Capture System (OXC). Using high-purity oxygen eliminates nitrogen from the combustion process, thus producing a flue gas stream rich in CO2 and steam. This simplification enhances the efficiency of downstream CO2 separation. Table 3 benchmarks the proposed OXC system against selected gas turbines and combined cycle configurations, including a natural gas combined cycle (NGCC) without capture, a semi-closed OXC combined cycle (SCOC-CC), the NET Power cycle, a modified S-Graz cycle, and the CES supercritical system. The comparison includes net electrical output, specific CO2 capture rate per unit of electricity generated, LHV-based thermal efficiency, and efficiency reduction relative to the NGCC reference Tables S33–S52.
Table 3.
Comparative Performance of Oxy-Combustion and Conventional Power Cycles with and without CO2 Capture.
Power Generation. After evaluating various technologies suitable for low- to medium-BTU gas, such as gas engines, turbines, and Rankine-cycle combined modules, the combustion system was modeled as a semi-closed oxy-combustion combined cycle (SCOC-CC) with integrated CO2 capture.
- Stoichiometry: CH4 requires 2 mol O2/mol fuel; heavier hydrocarbons adjusted per corresponding molecular weight Tables S15–S18.
- Recirculation: CO2 recycled as a temperature moderator, maintaining turbine inlet ≈ 1200–1399 °C.
- Heat recovery: Two-stage gas expansion with HRSG producing steam for a reheat bottoming cycle.
- Performance: Thermal efficiency 33.1%, exergetic efficiency 39.98%.
- CO2 capture: 99.99% removal efficiency, compression demand 0.41 kWh/kg CO2.
Mass and energy balances (Tables S16–S22) confirm flue gas compositions dominated by CO2 and H2O, with expansion work ≈ −7.51 × 10⁹ kJ/h and HRSG recovery ≈ 1.11 × 10⁹ kJ/h. These values validate the modeled efficiency and capture rates.
CO2 Capture, Compression, and Liquefaction for Storage: We employed a multistage compression scheme with inter-stage, followed by liquefaction. Complementary, we use diaphragm pumps to achieve the required pipe pressure. The process is optimized to minimize energy consumption and reduce the risk of equipment corrosion. We considered capture efficiency (greater than 90%), purity (at least 95% mol CO2), energy demand (kWh per ton of CO2), and operational robustness in high-humidity conditions.
- Energy demand: 5.13 × 10⁷ to 1.31 × 10⁸ kJ/h per stage (Tables S30 and S31).
- Corrosion control: Stream conditioning ensured compatibility with dense-phase CO2 transport.
2.4. System Integration and Regulations
Layouts for containerized OXC and CO2 capture skids were modeled using Aspen HYSYS v12.1. This analysis encompassed combustion stoichiometry, heat recovery, auxiliary power requirements, and dynamic responses to variations in gas flow. Mass and energy balances were validated using vendor performance data. Legal and regulatory constraints were extracted from national technical standards (NTE INEN 2261:2015 [51] and NTE INEN 2489:2019 [64]), Executive Decrees (e.g., Decreto 1215/2012), and the draft of Reglamento de Eliminación Progresiva de Quemas de Gas [45]. Environmental licensing procedures and flaring fee structures were also reviewed. A conceptual PFD was developed to illustrate the interconnections between components. This includes APG inlet conditioning, oxygen supply modules, combustion and energy conversion subsystems, CO2 compression units, and off-take points for electricity and CO2.
2.5. Technoeconomic Implications
Although a full techno-economic assessment is beyond the scope of this document and will be treated in the next stage, the following table summarizes the key techno-economic characteristics of the main subsystems based on documented industrial practice and literature benchmarks. The objective is to contextualize the feasibility of the proposed configuration rather than to provide project-specific cost estimates. The analysis highlights that the air separation unit and CO2 compression account for the bulk of auxiliary energy consumption, while modularization and heat recovery partially offset these penalties, particularly in remote fields where flaring alternatives entail high environmental and regulatory costs.
Table 4 summarizes the principal techno-economic characteristics of each major subsystem comprising the proposed modular APG valorization configuration, including technology maturity, qualitative capital and operating cost implications, and energy penalty or efficiency impact. Technology readiness levels (TRLs) are reported to indicate the degree of industrial maturity and associated investment risk: subsystems with TRL 8–9 (e.g., DEA sweetening, HRSG bottoming cycle, CO2 compression) correspond to commercially established technologies with predictable CAPEX and OPEX profiles, while lower-TRL components (notably oxy-combustion turbines) imply higher uncertainty but enable system-level performance advantages such as near-total CO2 capture. The column “energy penalty/efficiency impact” highlights the dominant role of auxiliary power consumption—particularly from the cryogenic air ASU and CO2 compression—in governing net cycle efficiency, consistent with the results presented in Section 3. Although these subsystems increase both capital intensity and operating electricity demand, their integration enables deep decarbonization and compliance with flaring-reduction and climate policies. Conversely, heat recovery through a steam bottoming cycle partially offsets these penalties, improving overall energy utilization and strengthening the feasibility of decentralized deployment in remote fields.
Table 4.
Summary of key techno-economic characteristics of the proposed modular APG valorization system.
3. Results
Blocks with a total score greater than six will be selected, as outlined in Table S3. This includes blocks 57, 60, and 61 for electric power generation. The selection process is based on an MCA gradation specified in Table 5. This facilitates complex decision-making by considering multiple criteria with specific weights.
Table 5.
Comparative results of MCA among all the blocks.
The proposed plant location leverages the proximity of the highly productive oil blocks 57, 60, and 61, which helps minimize infrastructure needs. This clustering decreases both construction and maintenance costs related to long gas transport pipelines. For example, Block 57 (Shushufindi—Libertador) is strategically situated just 28.79 km from Block 60 and 55.70 km from Block 61, ensuring that the available gas resources remain closely grouped.
Block 60 (Sacha) in Orellana offers a good balance of high productivity and manageable safety risks. Conversely, while Block 61 has higher safety risks, it benefits from strong transportation infrastructure and pipeline links to key facilities. The proximity of these blocks enables more efficient collection and use of associated gas, while also easing the logistical and operational challenges typically faced in remote field development.
Table 6 below shows that the DEA-based gas sweetening process is effective at removing H2S and, to some extent, other impurities. As a result, this process produces a higher-quality fuel stream with increased methane concentration and a significant reduction in acid gases. These improvements are crucial for efficient combustion and for extending the equipment’s lifespan.
Table 6.
Sweetening gas process parameters.
Following, Table 7 summarizes the composition changes in three principal air components (N2, O2, and Ar) across two consecutive distillation stages.
Table 7.
Cryogenic distillation unit parameters.
The high-pressure stage of the process achieves initial fractionation, isolating a moderately enriched oxygen stream containing 41% O2 from a nitrogen-rich stream composed of 94% N2. The subsequent low-pressure stage further purifies the oxygen, resulting in a stream with 97% purity and a complementary nitrogen stream with 96.7% purity. These results demonstrate the process’s capability of producing streams with nearly ideal compositional purity, which is essential for OXC. The following Table 8 summarizes the composition of the inlet streams and the final flue gas in an OXC process that uses Associated Petroleum Gas (APG) as fuel. Three feed streams are involved:
Table 8.
Flow composition of the recirculation loop.
APG Inlet: This stream is rich in hydrocarbons, consisting of 50.3% CH4, 10.2% C2H6, 16.9% C3H8, and other heavier hydrocarbons. It also contains minor amounts of inert nitrogen (4.2%), CO2 (1.7%), and water (0.1%). These values represent the unrefined fuel mixture, which typically possesses a significant hydrocarbon fraction that drives the combustion process.
Oxygen Inlet: A nearly pure oxygen stream enters the reactor, containing 96.7% O2 and 3.3% argon. The use of a high-purity oxygen inlet eliminates atmospheric nitrogen from the combustion zone, facilitating easier management of CO2 production, minimizing the formation of NOx, and allowing for better control over flame temperature.
CO2 Recirculation: A stream of pure CO2 is recirculated. This recirculation is a strategic element in OXC, as it helps moderate flame temperatures, stabilize combustion, and enrich the final flue gas with CO2, making it easier to capture. This structured approach ensures a proper combustion process while addressing environmental concerns.
3.1. Summary Results
- Containerized 272 MW oxy-combustion + CCS module achieves 33.1% thermal and 39.98% exergetic efficiency.
- Air separation unit produces 96.67% O2 at 0.385 kWh/kg, cutting energy demand by ~20% and lowering costs.
- CO2 capture system sequesters 99.99% CO2 at 0.41 kWh/kg, matching top benchmarks and minimizing emissions.
- Modular 272 MW units deliver off-grid power, scalable through multi-block sourcing and 2% efficiency gains.
- Global scale: 220 modules valorize 148 bcm APG, producing ~520 TWh electricity and sequestering 381 Mt CO2.
A containerized 272 MW oxy-combustion module integrates a low-energy ASU (0.385 kWh/kg O2) and near-total CO2 capture (99.99% at 0.41 kWh/kg), achieving 33.1% thermal efficiency and 39.98% exergetic efficiency. Scalable multi-block deployment enables off-grid power generation, valorizes associated petroleum gas, and supports global decarbonization—up to 220 modules can supply ~520 TWh·year−1 while sequestering 381 Mt of CO2 (Figure 2).
Figure 2.
System schematic representation: 272 MW Modular Oxy-Combustion Power Block With Integrated CO2 Capture and ASU Optimization.
3.2. Sensitivity Analysis of APG Composition
To evaluate the robustness of the proposed system under realistic variations in APG composition, a first-order sensitivity analysis was conducted focusing on the methane mole fraction, which is the dominant driver of fuel heating value and oxygen demand. The analysis considers representative CH4 mole fractions ranging from 0.70 to 0.95, with CO2 treated as an inert diluent, while maintaining fixed equipment performance and cycle configuration.
Results in Table 9, shows a near-linear increase in net electrical efficiency with increasing methane content, rising from approximately 28% at YCH4 = 0.70 to 38% at YCH4 = 0.95. This trend is primarily explained by the combined effect of higher effective lower heating value and reduced stoichiometric oxygen demand per unit of energy, which lowers the parasitic energy consumption of ASU. Conversely, heavier hydrocarbons, despite higher intrinsic heating values, exhibit reduced net efficiencies due to significantly higher oxygen requirements and associated ASU energy penalties.
Table 9.
Sensitivity Analysis parameters APG.
This sensitivity analysis confirms that methane-rich APG streams are intrinsically better suited for oxy-combustion-based valorization and that fuel composition variability can materially affect net cycle performance. The results support the robustness of the proposed configuration across a realistic range of APG compositions, while highlighting composition as a key design and site-selection parameter (Table 10).
Table 10.
Efficiency Sensitivity relation O2/fuel.
4. Discussion
4.1. Technical Implications
The system is designed to generate electricity using OxyC integrated with CC, an ASU, and a DEA-based gas sweetening system. This integrated approach aims to efficiently convert APG, a fuel typically vented or flared in remote oil fields, into a low-carbon power source. The system’s design was developed by evaluating multiple technologies under various operational conditions (such as pressure and temperature, for details see Complementary Material), always within the ranges documented for industrial plants. Through a series of simulations, the most efficient and feasible configuration was identified.
MCA is a valuable tool for identifying suitable locations for industrial activities. The analysis revealed three blocks—Block 57 (score: 8.15), Block 60 (score: 6.56), and Block 61 (score: 6.29)—that exceeded the cutoff value of 6, making them the most promising candidates for gas valorization. Block 57 emerged as the leader due to its outstanding combination of the highest heating value (10.00) and maximum available volume (10.00), compensating for a slightly lower, yet still favorable, composition score. Block 60 ranked second, primarily because of its excellent heating value (9.25) and substantial daily volume (6.31), despite having a moderate composition score. Block 61 demonstrated a balanced performance across all three criteria, with high scores in composition (6.71) and heating value (8.83), although its volume (3.19) was lower than that of Block 60. In contrast, the remaining blocks scored below six due to significant deficiencies in at least one category. These included low volumes in Blocks 43, 56, and 15; poor heating values in Blocks 12 and 07; and inadequate composition in Block 18. These findings highlight that sustained gas availability and high calorific content are crucial factors for assessing the feasibility of OXC and CO2 capture applications. Blocks with insufficient volumes or poor gas quality are unsuitable for practical use. This careful selection process ensures a consistent gas supply aligned with energy demand, providing operational flexibility and resilience against disruptions [73,74]. Notably, Block 60 (Sacha), situated in Orellana province, represents a strategic site due to its high associated gas production and well-developed hydrocarbon infrastructure. It also boasts advantageous access to the National Interconnected System (SNI) and geological formations suitable for CO2 storage in saline aquifers and depleted reservoirs.
The gas sweetening process using 35 wt.% DEA was proposed to improve the quality of associated gas by removing H2S. The process achieved an H2S removal efficiency of 90.62% [61,62,75] (from 0.0015 to ~0.0001%vol), well within the expected range of 85–95% reported for amine-based absorption systems. Compared to monoethanolamine, DEA has lower corrosivity, which helps extend equipment lifespan and enhances operational sustainability. Additionally, the process showed an outstanding solvent regeneration efficiency of 99.99% [76], a vital factor for ensuring long-term process viability, energy efficiency, and economic competitiveness in large-scale gas treatment operations.
The developed ASU exhibited excellent performance, achieving an oxygen recovery of 99.79%, a molar purity of 96.67%, and a specific energy consumption of 0.385 kWh/kg O2. These values demonstrate a highly efficient and competitive operation when compared with benchmark data reported in the literature. It is important to note that increasing oxygen purity beyond 99.5% mol would substantially raise energy consumption due to the additional separation required to remove argon, negatively impacting the system’s net power output, which is currently sustained at 272 MW reported specific energy requirements in the range of 0.400–0.580 kWh/kg O2 to achieve purities up to 99.99%, underscoring the efficiency of the present system. More recent studies highlight the potential of next-generation ASUs [77], reporting energy consumptions as low as 0.160 kWh/kg O2, reflecting the progress in advanced cryogenic and process-integration designs. Oxygen production at 95% mol purity typically requires 0.200–0.240 kWh/kg O2 under moderate operating pressures (~17 bar). In contrast, natural gas processing plants operating at higher pressures (up to 40 bar) can reach energy consumptions of 0.320 kWh/kg O2, a value comparable to that observed in the present work. ASU emerged as the most energy-intensive component, accounting for 52.8% of the net input work demand. However, the adoption of next-generation ASU technologies is expected to reduce this energy burden, potentially increasing the net cycle efficiency to around 40%. The value of 272 MW is not sufficient to meet the power demands of Pichincha province, but it is important for increasing Ecuador’s power generation and diversifying the energy mix.
The developed system includes a CO2 liquefaction unit for geological storage, achieving a specific energy consumption of 0.4148 kWh/kg CO2 and a recovery efficiency of 99.99%. These results are in close agreement with the previous findings [78], that reported specific consumptions ranging from 0.378 kWh/kg CO2 at 80% capture rates up to 0.48 kWh/kg CO2 for capture rates above 97.5%, similarly, semi-closed OXC cycles (SCOC-CC), which employ high-purity oxygen, can demand up to 0.467 kWh/kg CO2 when targeting capture efficiencies near 100%, primarily influenced by the oxygen purity in the combustion process.
Moreover, the high capture efficiency aligns the system with stringent climate policy requirements, positioning Ecuador to move beyond passive compliance toward active leadership in emissions reduction. By deploying such technologies, the country can not only meet its commitments under the Paris Agreement and the World Bank’s “Zero Routine Flaring by 2030” initiative but also strengthen its regulatory credibility. Rather than being a subject of international concern due to persistent flaring, Ecuador could leverage this technology to demonstrate tangible progress in decarbonizing its oil and gas sector. This would enhance its capacity to advocate for stronger global climate governance and access to climate finance mechanisms, such as carbon credits or Just Energy Transition Partnerships (JETPs), while setting a precedent for sustainable hydrocarbon development in ecologically sensitive regions like the Amazon.
The OXC efficiency accounts for a combined Brayton–Rankine cycle (Tables S14–S30). It corresponds to 53.79%, excluding the energy demand of the ASU, the CCS unit, and the gas sweetening process. This figure aligns well with literature reports for combined OXC cycles [63], typically ranging between 50% and 55%. When accounting for the integrated energy demands of all units, the system’s thermal efficiency decreased to 33.10%, a decline consistent with the expected energy penalties of 6–12% reported for OXC systems with CCS. From an exergy perspective, the developed system achieved an exergetic efficiency of 40% [79], which is competitive compared to conventional technologies such as IGCC (27%) and Rankine cycles (32%). Nevertheless, it remains below more advanced technologies, including SOFCs (56%) and electrolysis systems (78%) [79,80]. Despite this, the system demonstrates a favorable balance between sustainability and energy utilization by transforming associated gas—traditionally flared—into an efficient source of electricity with integrated carbon capture. A particularly relevant reference is the pilot oxycombustion plant in Schwarze Pumpe [81,82] in Germany, which has provided a performance benchmark for these technologies. In that installation, CO2 capture rates near 90% were achieved, and energy penalties remained within the margins expected for contemporary systems—yielding a cycle efficiency of approximately 33% when accounting for the energy demands of the ASU and the CCS unit [83,84].
The use of OXC offers significant benefits over traditional cycles by removing nitrogen from the combustion process, which reduces irreversibilities and allows for more effective CO2 capture. These features align the system with Ecuador’s NDCs, emphasizing reductions in GHG emissions, especially in the energy sector, which is responsible for 46.63% of the country’s emissions [45]. By supporting both associated gas utilization and carbon capture, the project directly aids Ecuador’s climate targets, contributing to the unconditional 9% and conditional 20.9% emission reductions by 2025. Moreover, the system supports international efforts such as the Paris Agreement and the World Bank’s “Zero Routine Flaring by 2030” initiative.
Finally, the use of geospatial tools such as QGIS and Google Earth was critical for identifying the most suitable plant locations, minimizing risks from natural hazards, and ensuring geological stability. The integration of geospatial data into decision-making reflects best practices in large-scale energy projects, ensuring that the proposed system is both geologically and logistically robust.
4.2. Capex/Opex Considerations
Although a detailed techno-economic assessment is planned for the next stage of the project, a screening-level techno-economic evaluation is provided in Table 11 to contextualize feasibility. The literature consistently identifies the cryogenic ASU and CO2 compression as the dominant contributors to both capital intensity and auxiliary power consumption in oxy-combustion systems, a trend consistent with the energy penalty distribution observed in this study. Conversely, heat recovery through a bottoming steam cycle and modular deployment mitigate these penalties by improving net efficiency and reducing infrastructure requirements in remote fields. The sensitivity of net efficiency to methane content further implies a strong coupling between fuel composition and economic performance, as higher efficiencies directly translate into lower electricity generation costs per unit of flared gas recovered.
Table 11.
Screening-level techno-economic relevance of the proposed modular APG oxy-combustion system.
Technology maturity and qualitative CAPEX/OPEX relevance are reported to indicate the relative investment intensity, operational cost sensitivity, and economic risk associated with each subsystem, based on documented industrial practice and literature benchmarks. The energy penalty or efficiency impact column highlights the role of auxiliary power demand—particularly from the ASU and CO2 compression—in governing net system efficiency, consistent with the thermodynamic results presented in this study.
4.3. Global Implications APG
The World Bank’s 2024 report reveals a troubling reversal in the trend of flaring reductions. In 2023, global gas flaring at upstream oil and gas facilities increased by 7%, reaching 148 bcm, the highest level in five years. This increase occurred despite a 1% rise in global oil production, which pushed flaring intensity up by 5% to 5.0 m3 per barrel of oil produced. The flared gas represents a lost market value of $9–48 billion, resulting in 381 million tonnes of CO2 equivalent emissions annually, including 45 million tonnes from unburned methane. Nine countries —Russia, Iran, Iraq, the U.S., Venezuela, Algeria, Libya, Nigeria, and Mexico—accounted for 75% of global flaring but only 46% of oil production. Russia remains the top flaring country, with a 2.9 bcm increase in 2023 despite declining oil output, suggesting systemic infrastructure deterioration. Iran and Libya experienced a rise in flaring intensities to 15.4 and 15.2 m3/bbl, respectively, driven by increased oil production without corresponding investment in gas recovery. The U.S. experienced a 21% increase in flaring, primarily concentrated in the Permian and Eagle Ford basins, which was attributed mainly to grid stress and midstream infrastructure failures during extreme heat events. Conversely, Algeria and Venezuela achieved modest reductions in flaring volumes and intensity, reflecting targeted efforts to recover. However, Venezuela still ranks among the highest in flaring intensity globally. The Imported Flare Gas Index highlights how crude oil imports expose countries—especially in Europe—to embedded flaring emissions. This metric is becoming increasingly relevant in the context of emerging carbon border adjustment mechanisms (CBAM) and methane regulations, such as those adopted by the EU. Technically, satellite-based VIIRS Nightfire data and methane detection systems (Carbon Mapper, UNEP IMEO) quantify flaring and identify unlit flares. A novel methodology is presented to attribute methane emissions to these events, offering early warning capabilities and enhancing transparency. The findings underscore the urgent need for integrated flaring reduction strategies, especially as the 2030 Zero Routine Flaring target approaches. The World Bank’s Global Flaring and Methane Reduction (GFMR) Partnership expands support across the oil and gas value chain, aiming to help countries monetize associated gas, reduce emissions, and improve energy access. In this sense, let us walk through the numbers: if a module produces 272 MW and reduces emissions by 0.4 Mt of CO2 per year, we can use global flaring data. With 148 bcm yielding 381 Mt CO2, the system could capture 99.99% of that, translating to 520 TWh of energy, worth approximately $52 billion annually. However, deploying these modules would avoid roughly 381 million tons of CO2eq emissions annually, nearly 10% of global power sector emissions, which is significant. We will also acknowledge that engineering cannot work in isolation, so we propose policies like feed-in tariffs, mandatory flaring reduction laws, tax credits for MWh, and even international standards.
Deploying modular oxy-combustion and CCS units, like the one we modeled in Ecuador, could transform global flaring into a dispatchable clean-energy resource. In 2023, upstream operators flared 148 billion m3 of associated gas—equivalent to about 1570 TWh of gross thermal energy, or 520 TWh of electricity at our cycle’s 33.1% thermal efficiency. Each 272 MW module, running 8760 h per year, can generate ~2.38 TWh, so roughly 220 such units could valorize the entire global flared volume. At a CO2 capture rate of 99.99% and an energy penalty of 0.41 kWh/kg CO2, the system would sequester ~381 million tons of CO2—eliminating a significant source of emissions while delivering clean power. Scaling this concept globally hinges on three enablers. First, financial incentives: feed-in tariffs or auctions that award premium prices for electricity from captured-gas modules, paired with carbon credits for each tonne of CO2 sequestered. Second, regulation: updating oil-field permits to mandate zero routine flaring, with exemptions only when modular recovery units are deployed within a defined timeline. Third, international climate finance: channeling World Bank GFMR and Just Energy Transition Partnership (JETP) funds toward capital-cost subsidies for containerized APG valorization in frontier basins (e.g., Nigeria, Venezuela, Kazakhstan). Three policy measures could catalyze adoption: 1. Mandatory Flaring Intensity Caps. Require operators to reduce flaring intensity below 1 m3/barrel by 2027 or face escalating penalties. This drives uptake of modular gas-to-power systems in fields where pipeline build-out is uneconomic. 2. Carbon Border Adjustment Mechanisms (CBAM). Tie crude-import levies to embedded flaring emissions (the report’s Imported Flare Gas Index). Nations that supply “low-flaring” barrels—verified by satellite and module telemetry—could access lower CBAM rates, incentivizing upstream investment in APG recovery. 3. Gas Monetization Credits. Under Article 6, carbon markets or national carbon taxes award credits for each MWh generated and each t CO2 captured from associated gas. At $50–100/t CO2, capturing 381 Mt/year yields $19–38 billion in potential credits—enough to underwrite multiple module rollouts.
By reframing flaring as a resource rather than a disposal problem, these policies align operator economics with climate goals. They can spur decentralized, off-grid power for local communities, reduce black-carbon and methane hazards, and leverage existing petroleum infrastructure. When combined with rigorous MRV—using satellite Nightfire data alongside plant SCADA streams—this framework would ensure transparency and accelerate progress toward the “Zero Routine Flaring by 2030” target. Ultimately, modular APG valorization could become a global standard, cutting CO2 emissions by hundreds of millions of tonnes and unlocking over half a petawatt-hour of clean energy annually (Figure 3).
Figure 3.
Integrated simulation framework and global APG valorization strategy. Schematic representation of a modular APG valorization system integrating oxy-fuel combustion, air separation, combined-cycle power generation, and CCS. (A) Process configuration: APG is combusted with high-purity oxygen produced in a cryogenic ASU, enabling the generation of a concentrated CO2 stream suitable for compression and geological storage. Heat recovery is achieved through a combined Brayton–Rankine cycle for electricity generation. (B) System-level performance metrics based on global flaring data (2023), including electricity generation potential (520 TWh·year−1), equivalent continuous capacity (272 GW), and avoided CO2 emissions (381 Mt CO2·year−1). (C) Global context of APG flaring, highlighting major contributing regions and the mitigation potential of deploying modular oxy-combustion and CCS technologies.
5. Conclusions
This study demonstrates the technical feasibility and energy performance of an OXC power cycle combined with carbon capture and an air separation unit. Results show that fuel composition significantly influences oxygen demand: lighter hydrocarbons, especially methane, not only reduce the amount of oxygen needed but also lessen the operational burden of air separation, enhancing system efficiency. The resulting thermal efficiency (33.10%) and exergetic efficiency (39.98%) fall within expected ranges, though they are constrained by the parasitic energy consumption of both the ASU and CCS systems. Process simulations indicate that minor adjustments in CO2 recirculation and turbine steam distribution could boost thermal efficiency by roughly 2%, emphasizing the potential for operational improvements.
The ASU operated at an oxygen purity of 96.67% with a specific energy consumption of 0.385 kWh/kg O2, while the CCS achieved 99.99% capture efficiency at 0.41 kWh/kg CO2. These values align with benchmarks reported in the literature, confirming the validity of the integrated system design. However, the disproportionate energy penalty of CCS—nearly half of the total auxiliary demand—poses a significant bottleneck for efficiency improvements.
If APG H2S concentrations are confirmed below 4 ppm, upstream DEA sweetening can be omitted; before removing the amine train, implement continuous H2S monitoring, revise the process basis and control logic, and retune the CO2 recirculation loop to maintain combustor temperature, residence time, and flue-gas CO2 composition within validated limits; update ASU loading and cold-box duty to reflect the higher hydrocarbon mole fraction, recompute mass-energy and exergy balances to quantify changes in net output and parasitic loads, and retain contingency procedures and periodic sulfur sampling to protect equipment integrity and ensure rapid reinstatement of sweetening should H2S excursions occur.
The flexibility gained from operating three separate gas blocks proved valuable in adapting to changing energy needs and supports sustainable design principles. The integrated system, which combines gas sweetening, air separation, OXC, and CO2 capture, not only improves energy efficiency but also extends equipment lifespan by removing acidic and inert impurities. Additionally, the multigeneration scheme enables the simultaneous production of electricity and compressed CO2, offering options for both decarbonized power generation and resource utilization.
Overall, the system shows promise for use in Ecuador’s Amazon region, where utilizing locally available associated gas can enhance energy security, environmental compliance, and climate mitigation goals. Future research should focus on reducing CCS energy needs, exploring advanced ASU configurations, and evaluating scalability under real operational conditions.
Supplementary Materials
The supporting information can be downloaded at https://www.mdpi.com/article/10.3390/en19081949/s1.
Author Contributions
Conceptualization, G.C. and B.N.; methodology, G.C. and B.N.; software, B.N. and C.G.; validation, C.M.-C., C.G. and C.A.; formal analysis, G.C. and C.M.-C.; investigation, B.N., C.M.-C. and C.G.; resources, C.A. and M.A.V.; data curation, B.N. and C.G.; writing—original draft preparation, G.C. and B.N.; writing—review and editing, C.M.-C., C.A. and M.A.V.; visualization, G.C.-C.; supervision, G.C.; project administration, G.C.; funding acquisition, G.C. All authors have read and agreed to the published version of the manuscript.
Funding
The authors received funding from the Direction of Investigation from the Central University of Ecuador under the CODE: DI-CONV-2023-026 “Economía Circular en los Reservorios Hidroeléctricos del Ecuador”.
Data Availability Statement
The data presented in this study are openly available in [Calculation and Simulation Data for Modular Oxy-Combustion and Carbon Capture in Associated Petroleum Gas Valorization] at [https://doi.org/10.5281/zenodo.18806107], reference number [85].
Acknowledgments
The authors express their sincere gratitude to the Faculty of Chemical Engineering of the Central University of Ecuador for the academic, technical, and logistical support provided throughout the development of this study. The collaborative environment, TICs laboratory assistance, and analytical capabilities offered by the faculty were essential for the methodological development, simulation validation, and multidisciplinary integration required for the modeling of the oxy-combustion, air separation, and CO2 capture systems. The authors also gratefully acknowledge the Directorate of Research of the Central University of Ecuador for the financial support provided under the project code DI-CONV-2023-026, which enabled access to specialized software, computational resources, and complementary analytical tools that were indispensable for conducting high-fidelity thermodynamic simulations and multi-criteria analyses. Additionally, the authors extend deep appreciation to EP Petroecuador for its valuable technical collaboration, particularly for granting access to operational data from the Amazonian production blocks, supplying gas composition and flaring information, and facilitating geospatial and logistical insights essential for the assessment of associated petroleum gas valorization potential. The cooperation of EP Petroecuador was fundamental to grounding the study in realistic operational conditions and ensuring the applicability of the proposed modular oxy-combustion and CO2 capture strategy within the Ecuadorian Amazon.
Conflicts of Interest
The authors declare no conflicts of interest. The funders had no role in the design of the study, in the collection, analysis, or interpretation of data, in the writing of the manuscript, or in the decision to publish the results.
Abbreviations
The following abbreviations are used in this manuscript:
| AHP | Analytic Hierarchy Process |
| APG | Associated Petroleum Gas |
| ASU | Air Separation Unit |
| BC | Black Carbon |
| bcm | Billion cubic meters (gas volume) |
| CBAM | Carbon Border Adjustment Mechanism |
| CC | Carbon Capture |
| CCS | Carbon Capture and Storage |
| CES | Clean Energy Systems |
| DEA | Diethanolamine (amine solvent used for sweetening) |
| EES | Engineering Equation Solver |
| EROI | Energy Return on Investment |
| GCV | Gross Calorific Value |
| GFMR/GGFR | Global Flaring and Methane Reduction/Global Gas Flaring Reduction |
| GHG | Greenhouse Gas |
| GIS | Geographic Information System |
| GWP | Global Warming Potential |
| HRSG | Heat Recovery Steam Generator |
| IGCC | Integrated Gasification Combined Cycle |
| JETP | Just Energy Transition Partnership |
| LHV | Lower Heating Value |
| MAATE | Ministerio del Ambiente, Agua y Transición Ecológica (Ecuador) |
| MCA | Multi-Criteria Analysis |
| MRV | Monitoring, Reporting, and Verification |
| NDCs | Nationally Determined Contributions |
| NGCC | Natural Gas Combined Cycle |
| OXC/OxyC | Oxy-Combustion (term used for the power cycle) |
| PSA | Pressure Swing Adsorption |
| SCOC-CC | Semi-Closed Oxy-Combustion Combined Cycle |
| SIN | Sistema Nacional Interconectado |
| SMR | Steam Methane Reforming |
| SOFC | Solid Oxide Fuel Cell |
| TEG | Triethylene Glycol (dehydration unit) |
| TRLs | Technology readiness levels |
| TROPOMI | TROPOspheric Monitoring Instrument (Sentinel-5P) |
| VIIRS | Visible Infrared Imaging Radiometer Suite |
| VOC(s) | Volatile Organic Compounds |
| WI | Wobbe Index |
References
- Franklin, M.; Chau, K.; Cushing, L.J.; Johnston, J.E. Characterizing Flaring from Unconventional Oil and Gas Operations in South Texas Using Satellite Observations. Environ. Sci. Technol. 2019, 53, 2220–2228. [Google Scholar] [CrossRef] [Scilit] [PubMed]
- Heim, I.; Vigneau, A.C.; Kalyuzhnova, Y. Environmental and Socio-Economic Policies in Oil and Gas Regions: Triple Bottom Line Approach. Reg. Stud. 2023, 57, 181–195. [Google Scholar] [CrossRef] [Scilit]
- Al-Rubaye, A.H.; Jasim, D.J.; Jassam, S.A.; Jasim, H.M.; Ameen, H.F.M.; Khoshnaw, F.A. Associated Petroleum Gas: Environmental, Utilization, and Economic Rationale. IOP Conf. Ser. Earth Environ. Sci. 2023, 1262, 022026. [Google Scholar] [CrossRef] [Scilit]
- Guerin, A.; Ho, P.; Najjar, N.; Schaufele, B. Lessons for regulating flaring and venting: Results from Alberta, Canada. Energy Policy 2025, 206, 114774. [Google Scholar] [CrossRef] [Scilit]
- Banet, C. Regulation of Flaring and Venting of Natural Gas from Petroleum Activities in Norway. Prepr.—SSRN Electron. J. 2025. [Google Scholar] [CrossRef] [Scilit]
- Carpenter, C. Saudi Arabia Case Study Illustrates Road to Zero Routine Gas Flaring. J. Pet. Technol. 2023, 75, 55–57. [Google Scholar] [CrossRef] [Scilit]
- Albakjaji, M.; Alhussein, H.S.; Baroudy, J. El Legal and Policy Frameworks for Climate and Air Protection in Saudi Arabia: A Review of Progress. J. Posthumanism 2025, 5, 4820–4840. [Google Scholar] [CrossRef] [Scilit]
- Olujobi, O.J.; Irumekhai, O.S.; Odjugo, O. Petroleum Laws, Regulations, And Sustainable Development: Oil And Gas Perspectives From Nigeria, Norway, And Saudi Arabia. J. Sustain. Dev. Law Policy 2025, 16, 22–47. [Google Scholar] [CrossRef] [Scilit]
- Esfandiari, A.; Raissi, S. Preventing Fugitive Emissions Through Advanced Valve Sealing Technologies in Hydrocarbon Facilities. In Proceedings of the Abu Dhabi International Petroleum Exhibition and Conference; SPE: Richardson, TX, USA, 2025. [Google Scholar]
- Alshamaa, H.A.; Hamza, W.M. Legislative Regulation of Oil and Gas Facilities in Iraqi Administrative Law. J. Pet. Res. Stud. 2023, 13, 1–14. [Google Scholar] [CrossRef] [Scilit]
- Wen, Y.; Xiao, J.; Peng, J. The Effects of the “Zero Routine Flaring by 2030” Initiative: International Comparisons Based on Generalized Synthetic Control Method. Environ. Impact Assess. Rev. 2023, 100, 107095. [Google Scholar] [CrossRef] [Scilit]
- Calel, R.; Mahdavi, P. The Unintended Consequences of Antiflaring Policies—And Measures for Mitigation. Proc. Natl. Acad. Sci. USA 2020, 117, 12503–12507. [Google Scholar] [CrossRef] [Scilit]
- Blundell, W.; Kokoza, A. Natural Gas Flaring, Respiratory Health, and Distributional Effects. J. Public Econ. 2022, 208, 104601. [Google Scholar] [CrossRef] [Scilit]
- Hamidzadeh, Z.; Sattari, S.; Soltanieh, M.; Vatani, A. Development of a Multi-Objective Decision-Making Model to Recover Flare Gases in a Multi Flare Gases Zone. Energy 2020, 203, 117815. [Google Scholar] [CrossRef] [Scilit]
- Crowley-Vigneau, A. The Global Norm on Combatting Flaring and Russian Decrees 7 and 1148. In The National Implementation of International Norms: Transnational Networks and Local Content Policy; Springer: Berlin/Heidelberg, Germany, 2022; pp. 141–196. [Google Scholar]
- Babalola, A.A.; Olawuyi, D.S. Overcoming Regulatory Failure in the Design and Implementation of Gas Flaring Policies: The Potential and Promise of an Energy Justice Approach. Sustainability 2022, 14, 6800. [Google Scholar] [CrossRef] [Scilit]
- Vorobev, A.; Shchesnyak, E. Associated Petroleum Gas Flaring: The Problem and Possible Solution. In International Congress on Applied Mineralogy; Springer: Cham, Switzerland, 2019; pp. 227–230. [Google Scholar]
- World Bank Global Gas Flaring Data. Global Flaring and Methane Reduction Partnership (GFMR). 2025. Available online: https://www.worldbank.org/en/programs/gasflaringreduction/global-flaring-data (accessed on 8 February 2025).
- Alola, A.A.; Onifade, S.T.; Magazzino, C.; Obekpa, H.O. The Effects of Gas Flaring as Moderated by Government Quality in Leading Natural Gas Flaring Economies. Sci. Rep. 2023, 13, 14394. [Google Scholar] [CrossRef] [Scilit]
- Beltrán-Jiménez, K.; Chávez-Rodríguez, M.F.; Szklo, A. Associated Natural Gas Flare in the Integrated Market of the Southern Cone. Energy Strategy Rev. 2018, 22, 337–347. [Google Scholar] [CrossRef] [Scilit]
- Alsuwailem, M. The Road to Zero Routine Gas Flaring: A Case Study from Saudi Arabia. In Proceedings of the International Petroleum Technology Conference; IPTC: London, UK, 2021. [Google Scholar]
- Aigbe, G.O.; Stringer, L.C.; Cotton, M. Optimizing Policies and Regulations for Zero Routine Gas Flaring and Net Zero. Climate 2025, 13, 178. [Google Scholar] [CrossRef] [Scilit]
- PourMirza, A. Gas Flaring Status, Trend and Policy around the Persian Gulf. Energy Sources Part B Econ. Plan. Policy 2017, 12, 250–259. [Google Scholar] [CrossRef] [Scilit]
- Ndunagu, P.N.; Joel, O.F.; Oji, A.A. Comparative Analysis of Satellite and Regulatory Based Gas Flare Volumes in the Niger Delta Region. Niger. J. Technol. Dev. 2022, 18, 279–287. [Google Scholar] [CrossRef] [Scilit]
- Elvidge, C.D.; Bazilian, M.D.; Zhizhin, M.; Ghosh, T.; Baugh, K.; Hsu, F.-C. The Potential Role of Natural Gas Flaring in Meeting Greenhouse Gas Mitigation Targets. Energy Strategy Rev. 2018, 20, 156–162. [Google Scholar] [CrossRef] [Scilit]
- Tran, H.; Polka, E.; Buonocore, J.J.; Roy, A.; Trask, B.; Hull, H.; Arunachalam, S. Air Quality and Health Impacts of Onshore Oil and Gas Flaring and Venting Activities Estimated Using Refined Satellite-Based Emissions. Geohealth 2024, 8, e2023GH000938. [Google Scholar] [CrossRef] [Scilit] [PubMed]
- Shahab-Deljoo, M.; Medi, B.; Kazi, M.-K.; Jafari, M. A Techno-Economic Review of Gas Flaring in Iran and Its Human and Environmental Impacts. Process Saf. Environ. Prot. 2023, 173, 642–665. [Google Scholar] [CrossRef] [Scilit]
- Soltanieh, M.; Zohrabian, A.; Gholipour, M.J.; Kalnay, E. A Review of Global Gas Flaring and Venting and Impact on the Environment: Case Study of Iran. Int. J. Greenh. Gas Control. 2016, 49, 488–509. [Google Scholar] [CrossRef] [Scilit]
- Shamlan, M. Associated Petroleum Gas Flaring in Yemen: Current Status and Potential Utilization. Stardom Sci. J. Nat. Eng. Sci. 2025, 3, 1–24. [Google Scholar] [CrossRef] [Scilit]
- Osuoha, C.A.; Fakutiju, M.A. Gas Flaring in Niger Delta Region of Nigeria: Cost, Ecological and Human Health Implications. Environ. Manag. Sustain. Dev. 2017, 6, 390. [Google Scholar] [CrossRef] [Scilit]
- Rodrigues, A.C.C. Decreasing Natural Gas Flaring in Brazilian Oil and Gas Industry. Resour. Policy 2022, 77, 102776. [Google Scholar] [CrossRef] [Scilit]
- Faruolo, M.; Caseiro, A.; Lacava, T.; Kaiser, J.W. Gas Flaring: A Review Focused On Its Analysis From Space. IEEE Geosci. Remote Sens. Mag. 2021, 9, 258–281. [Google Scholar] [CrossRef] [Scilit]
- Davoudi, M.; Rahimpour, M.R.; Jokar, S.M.; Nikbakht, F.; Abbasfard, H. The Major Sources of Gas Flaring and Air Contamination in the Natural Gas Processing Plants: A Case Study. J. Nat. Gas Sci. Eng. 2013, 13, 7–19. [Google Scholar] [CrossRef] [Scilit]
- Weyant, C.L.; Shepson, P.B.; Subramanian, R.; Cambaliza, M.O.L.; Heimburger, A.; McCabe, D.; Baum, E.; Stirm, B.H.; Bond, T.C. Black Carbon Emissions from Associated Natural Gas Flaring. Environ. Sci. Technol. 2016, 50, 2075–2081. [Google Scholar] [CrossRef] [Scilit]
- Facchinelli, F.; Pappalardo, S.E.; Codato, D.; Diantini, A.; Della Fera, G.; Crescini, E.; De Marchi, M. Unburnable and Unleakable Carbon in Western Amazon: Using VIIRS Nightfire Data to Map Gas Flaring and Policy Compliance in the Yasuní Biosphere Reserve. Sustainability 2019, 12, 58. [Google Scholar] [CrossRef] [Scilit]
- Durango-Cordero, J.; Saqalli, M.; Parra, R.; Elger, A. Spatial Inventory of Selected Atmospheric Emissions from Oil Industry in Ecuadorian Amazon: Insights from Comparisons among Satellite and Institutional Datasets. Saf. Sci. 2019, 120, 107–116. [Google Scholar] [CrossRef] [Scilit]
- Nwaogu, D.C.; Akpoghome, T.U. Ending Gas Flaring in the Nigerian Oil and Gas Industry: The Need for Strict Regulatory Enforcement. J. Environ. Law Policy 2022, 02, 79–101. [Google Scholar] [CrossRef] [Scilit]
- Olawuyi, D.S. Overcoming Regulatory Failure in the Design and Implementation of Gas Flaring Policies: The Potential and Promise of an Energy Justice Approach. SSRN Electron. J. 2022. [Google Scholar] [CrossRef] [Scilit]
- Duren, R.; Gordon, D. Tackling Unlit and Inefficient Gas Flaring. Science 2022, 377, 1486–1487. [Google Scholar] [CrossRef] [Scilit]
- Aoun, A.E.; Rasouli, V.; Khetib, Y. Assessment of Advanced Technologies to Capture Gas Flaring in North Dakota. Arab. J. Sci. Eng. 2023, 48, 16507–16525. [Google Scholar] [CrossRef] [Scilit]
- Omobolanle, O.C.; Ikiensikimama, S.S. Gas Flaring: Technicalities, Challenges, and the Economic Potentials. Environ. Sci. Pollut. Res. 2024, 31, 40838–40850. [Google Scholar] [CrossRef] [Scilit] [PubMed]
- Tavallaei, M.; Farzaneh-Gord, M.; Moghadam, A.J. 4E Analysis and Thermodynamic Optimization of Flaring Associated Gas Recovery Using External Firing Recuperative Gas Turbine. Energy Convers. Manag. 2022, 266, 115836. [Google Scholar] [CrossRef] [Scilit]
- Ilyin, V.B.; Yakovenko, R.E.; Belashov, D.M.; Zemlyakov, N.D.; Savost’yanov, A.P. Thermodynamic Study of Associated Petroleum Gas Reforming to Methane. Pet. Chem. 2019, 59, 641–649. [Google Scholar] [CrossRef] [Scilit]
- Wilcox, A. Flaring Issues, Solutions & Technologies-2019; National Energy Technology Laboratory: Pittsburgh, PA, USA; Morgantown, WV, USA, 2019.
- MAATE. Plan Nacional de Mitigación del Cambio Climático Ecuador 2024–2070; Public Policy, Ministery of Environment: Quito, Ecuador, 2024. [Google Scholar]
- Mansoor, R.; Tahir, M. Recent Developments in Natural Gas Flaring Reduction and Reformation to Energy-Efficient Fuels: A Review. Energy Fuels 2021, 35, 3675–3714. [Google Scholar] [CrossRef] [Scilit]
- Burtt, D.C.; Corbin, D.J.; Armitage, J.R.; Crosland, B.M.; Jefferson, A.M.; Kopp, G.A.; Kostiuk, L.W.; Johnson, M.R. A Methodology for Quantifying Combustion Efficiencies and Species Emission Rates of Flares Subjected to Crosswind. J. Energy Inst. 2022, 104, 124–132. [Google Scholar] [CrossRef] [Scilit]
- Gilardoni, S.; Di Mauro, B.; Bonasoni, P. Black Carbon, Organic Carbon, and Mineral Dust in South American Tropical Glaciers: A Review. Glob. Planet. Change 2022, 213, 103837. [Google Scholar] [CrossRef] [Scilit]
- The World Bank and the Global Gas Flaring Reduction Partnership’s. Trading Economics Ecuador Crude Oil Production; National Statistics World Bank: Washington, DC, USA; U.S. Energy Information Administration: Washington, DC, USA, 2023.
- GGFR. GGFR Technology Overview—Utilization of Small-Scale Associated Gas; GGFR: Washington, DC, USA, 2021. [Google Scholar]
- NTE INEN 2261; Tanques para Gases a Baja Presión. Requisitos e Inspección, Primera Revisión. INEN: Quito, Ecuador, 2015. Available online: https://solsegsa.com/wp-content/uploads/2022/05/nte-inen-2261-1TANQUE-PARA-GASES-A-BAJA-PRESION.pdf (accessed on 8 February 2025).
- Aspen Technology Inc. Aspen HYSYS, Version 14. 2024. Available online: https://www.aspentech.com (accessed on 8 February 2025).
- Maldonado-Erazo, C.P.; Tierra-Tierra, N.P.; del Río-Rama, M.d.l.C.; Álvarez-García, J. Safeguarding Intangible Cultural Heritage: The Amazonian Kichwa People. Land 2021, 10, 1395. [Google Scholar] [CrossRef] [Scilit]
- Etchart, L. Biodiversity, Global Governance of the Environment, and Indigenous Peoples. In Governance, Development, and Social Inclusion in Latin America; Palgrave Macmillan, C., Ed.; Springer Nature: Berlin/Heidelberg, Germany, 2022; pp. 157–183. [Google Scholar]
- Douros, J.; Eskes, H.; van Geffen, J.; Boersma, K.F.; Compernolle, S.; Pinardi, G.; Blechschmidt, A.-M.; Peuch, V.-H.; Colette, A.; Veefkind, P. Comparing Sentinel-5P TROPOMI NO2 Column Observations with the CAMS Regional Air Quality Ensemble. Geosci. Model Dev. 2023, 16, 509–534. [Google Scholar] [CrossRef] [Scilit]
- Morenov, V.; Leusheva, E.; Buslaev, G.; Gudmestad, O.T. System of Comprehensive Energy-Efficient Utilization of Associated Petroleum Gas with Reduced Carbon Footprint in the Field Conditions. Energies 2020, 13, 4921. [Google Scholar] [CrossRef] [Scilit]
- Hall, C.A.S.; Powers, R.; Schoenberg, W. Peak Oil, EROI, Investments and the Economy in an Uncertain Future. In Biofuels, Solar and Wind as Renewable Energy Systems; Springer: Dordrecht, The Netherlands, 2008; pp. 109–132. [Google Scholar]
- Abdulrahman, R.K.; Zangana, M.H.S.; Ali, K.S.; Slagle, J.C. Utilizing Mixed Amines in Gas Sweetening Process: A Kirkuk Field Case Study and Simulation. In Proceedings of the 2017 International Conference on Environmental Impacts of the Oil and Gas Industries: Kurdistan Region of Iraq as a Case Study (EIOGI); IEEE: Piscataway, NJ, USA, 2017; pp. 5–8. [Google Scholar]
- Naji, S.Z.; Abd, A.A. Sensitivity Analysis of Using Diethanolamine Instead of Methyldiethanolamine Solution for GASCO’S Habshan Acid Gases Removal Plant. Front. Energy 2019, 13, 317–324. [Google Scholar] [CrossRef] [Scilit]
- Ferreira, A.F.B.; Da Silva, J.A.P.; Da Silva, M.R.; De Matos, O.B.; de Souza Freitas Filho, A.; Dantas, B.C.; Oliveira, K.B.; Amorim, N.d.S. Absorption of the Acid Gases CO2 and H2S from a Natural Gas Stream Using the Aspen Plus® Simulator. Obs. Econ. Latinoam. 2024, 22, e3113. [Google Scholar] [CrossRef] [Scilit]
- Darani, N.S.; Behbahani, R.M.; Shahebrahimi, Y.; Asadi, A.; Mohammadi, A.H. Simulation and Optimization of the Acid Gas Absorption Process by an Aqueous Diethanolamine Solution in a Natural Gas Sweetening Unit. ACS Omega 2021, 6, 12072–12080. [Google Scholar] [CrossRef] [Scilit] [PubMed]
- Babakhani Samani, M.H.; Toghraie, D.; Mehmandoust, B.; Niknejadi, M.; Fazilati, M.A. Investigating the Effect of Absorbent Material and Heat Flux in Natural Gas Sweetening Process Using Molecular Dynamics Simulation. Case Stud. Therm. Eng. 2024, 61, 105081. [Google Scholar] [CrossRef] [Scilit]
- Ferrari, N.; Mancuso, L.; Davison, J.; Chiesa, P.; Martelli, E.; Romano, M.C. Oxy-Turbine for Power Plant with CO2 Capture. Energy Procedia 2017, 114, 471–480. [Google Scholar] [CrossRef] [Scilit]
- NTE INEN 2489; Gas Natural—Requisitos en Ecuador, Primera Revisión. INEN: Quito, Ecuador, 2019.
- Mohamadi-Baghmolaei, M.; Hajizadeh, A.; Zahedizadeh, P.; Azin, R.; Zendehboudi, S. Evaluation of Hybridized Performance of Amine Scrubbing Plant Based on Exergy, Energy, Environmental, and Economic Prospects: A Gas Sweetening Plant Case Study. Energy 2021, 214, 118715. [Google Scholar] [CrossRef] [Scilit]
- Young, A.F.; Villardi, H.G.D.; Araujo, L.S.; Raptopoulos, L.S.C.; Dutra, M.S. Detailed Design and Economic Evaluation of a Cryogenic Air Separation Unit with Recent Literature Solutions. Ind. Eng. Chem. Res. 2021, 60, 14830–14844. [Google Scholar] [CrossRef] [Scilit]
- Brigagão, G.V.; de Medeiros, J.L.; Araújo, O.d.Q.F. A Novel Cryogenic Vapor-Recompression Air Separation Unit Integrated to Oxyfuel Combined-Cycle Gas-to-Wire Plant with Carbon Dioxide Enhanced Oil Recovery: Energy and Economic Assessments. Energy Convers. Manag. 2019, 189, 202–214. [Google Scholar] [CrossRef] [Scilit]
- Hanak, D.P.; Powell, D.; Manovic, V. Techno-Economic Analysis of Oxy-Combustion Coal-Fired Power Plant with Cryogenic Oxygen Storage. Appl. Energy 2017, 191, 193–203. [Google Scholar] [CrossRef] [Scilit]
- Yadav, S.; Mondal, S.S. A Review on the Progress and Prospects of Oxy-Fuel Carbon Capture and Sequestration (CCS) Technology. Fuel 2022, 308, 122057. [Google Scholar] [CrossRef] [Scilit]
- Akrami, E.; Ameri, M.; Rocco, M.V. Integration of Biomass-Fueled Power Plant and MCFC-Cryogenic CO2 Separation Unit for Low-Carbon Power Production: Thermodynamic and Exergoeconomic Comparative Analysis. Energy Convers. Manag. 2020, 223, 113304. [Google Scholar] [CrossRef] [Scilit]
- Dwiyantoro, B.A.; Wattimena, J.G.J.; Kurniawan, H. A Techno-Economic Feasibility and Performance Analysis of the CO2 Capture Process Using Supersonic Separator and Methyldiethanolamine Sweetening. Eng. Technol. Appl. Sci. Res. 2025, 15, 25864–25871. [Google Scholar] [CrossRef] [Scilit]
- Tafone, A.; Dal Magro, F.; Romagnoli, A. Integrating an Oxygen Enriched Waste to Energy Plant with Cryogenic Engines and Air Separation Unit: Technical, Economic and Environmental Analysis. Appl. Energy 2018, 231, 423–432. [Google Scholar] [CrossRef] [Scilit]
- Bhattacharyya, S.C. Energy Data and Energy Balance. In Energy Economics; Springer: London, UK, 2019; pp. 7–40. [Google Scholar]
- Bhattacharyya, S.C. Energy Access Programmes and Sustainable Development: A Critical Review and Analysis. Energy Sustain. Dev. 2012, 16, 260–271. [Google Scholar] [CrossRef] [Scilit]
- Eletta, O.A.A.; Awotoye, D.T.; Zubairu, A.A. Investigation of Alkanol-Amine Solvents and Their Blends for CO2 Removal from Natural Gas Using Aspen-Hysys. Niger. J. Technol. Dev. 2022, 18, 268–278. [Google Scholar] [CrossRef] [Scilit]
- Soo, X.Y.D.; Lee, J.J.C.; Wu, W.-Y.; Tao, L.; Wang, C.; Zhu, Q.; Bu, J. Advancements in CO2 Capture by Absorption and Adsorption: A Comprehensive Review. J. CO2 Util. 2024, 81, 102727. [Google Scholar] [CrossRef] [Scilit]
- Leiva, C.A.; Poblete, D.A.; Aguilera, T.L.; Acuña, C.A.; Quintero, F.J. Air Separation Units (ASUs) Simulation Using Aspen Hysys at Oxinor I of Air Liquid Chile S.A Plant. Pol. J. Chem. Technol. 2020, 22, 10–17. [Google Scholar] [CrossRef] [Scilit]
- Mletzko, J.; Ehlers, S.; Kather, A. Comparison of Natural Gas Combined Cycle Power Plants with Post Combustion and Oxyfuel Technology at Different CO2 Capture Rates. Energy Procedia 2016, 86, 2–11. [Google Scholar] [CrossRef] [Scilit]
- Dincer, I.; Bicer, Y. Energy, Environment and Sustainable Development. In Integrated Energy Systems for Multigeneration; Elsevier: Amsterdam, The Netherlands, 2020; pp. 1–31. [Google Scholar]
- Dincer, I. The Role of Exergy in Energy Policy Making. Energy Policy 2002, 30, 137–149. [Google Scholar] [CrossRef] [Scilit]
- Strömberg, L.; Lindgren, G.; Jacoby, J.; Giering, R.; Anheden, M.; Burchhardt, U.; Altmann, H.; Kluger, F.; Stamatelopoulos, G.-N. Update on Vattenfall’s 30 MWth Oxyfuel Pilot Plant in Schwarze Pumpe. Energy Procedia 2009, 1, 581–589. [Google Scholar] [CrossRef] [Scilit]
- Liu, Z.; Zhang, T. Pilot and Industrial Demonstration of Oxy-Fuel Combustion. In Oxy-Fuel Combustion; Elsevier: Amsterdam, The Netherlands, 2018; pp. 209–222. [Google Scholar]
- Buhre, B.J.P.; Elliott, L.K.; Sheng, C.D.; Gupta, R.P.; Wall, T.F. Oxy-Fuel Combustion Technology for Coal-Fired Power Generation. Prog. Energy Combust. Sci. 2005, 31, 283–307. [Google Scholar] [CrossRef] [Scilit]
- White, V.; Wright, A.; Tappe, S.; Yan, J. The Air Products Vattenfall Oxyfuel CO2 Compression and Purification Pilot Plant at Schwarze Pumpe. Energy Procedia 2013, 37, 1490–1499. [Google Scholar] [CrossRef] [Scilit]
- Gonzalo, C. Calculation and Simulation Data for Modular Oxy-Combustion and Carbon Capture in Associated Petroleum Gas Valorization [Data Set]. Zenodo. 2026. Available online: https://zenodo.org/records/18806107 (accessed on 8 February 2025). [CrossRef]
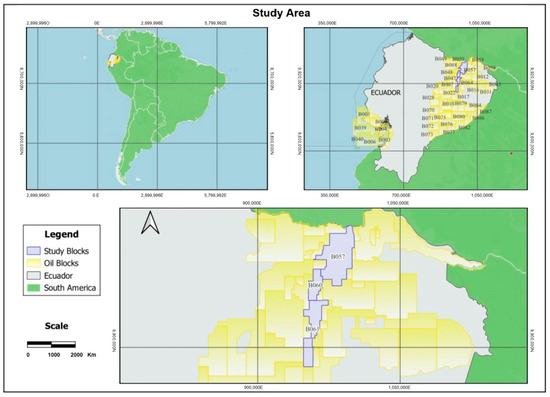
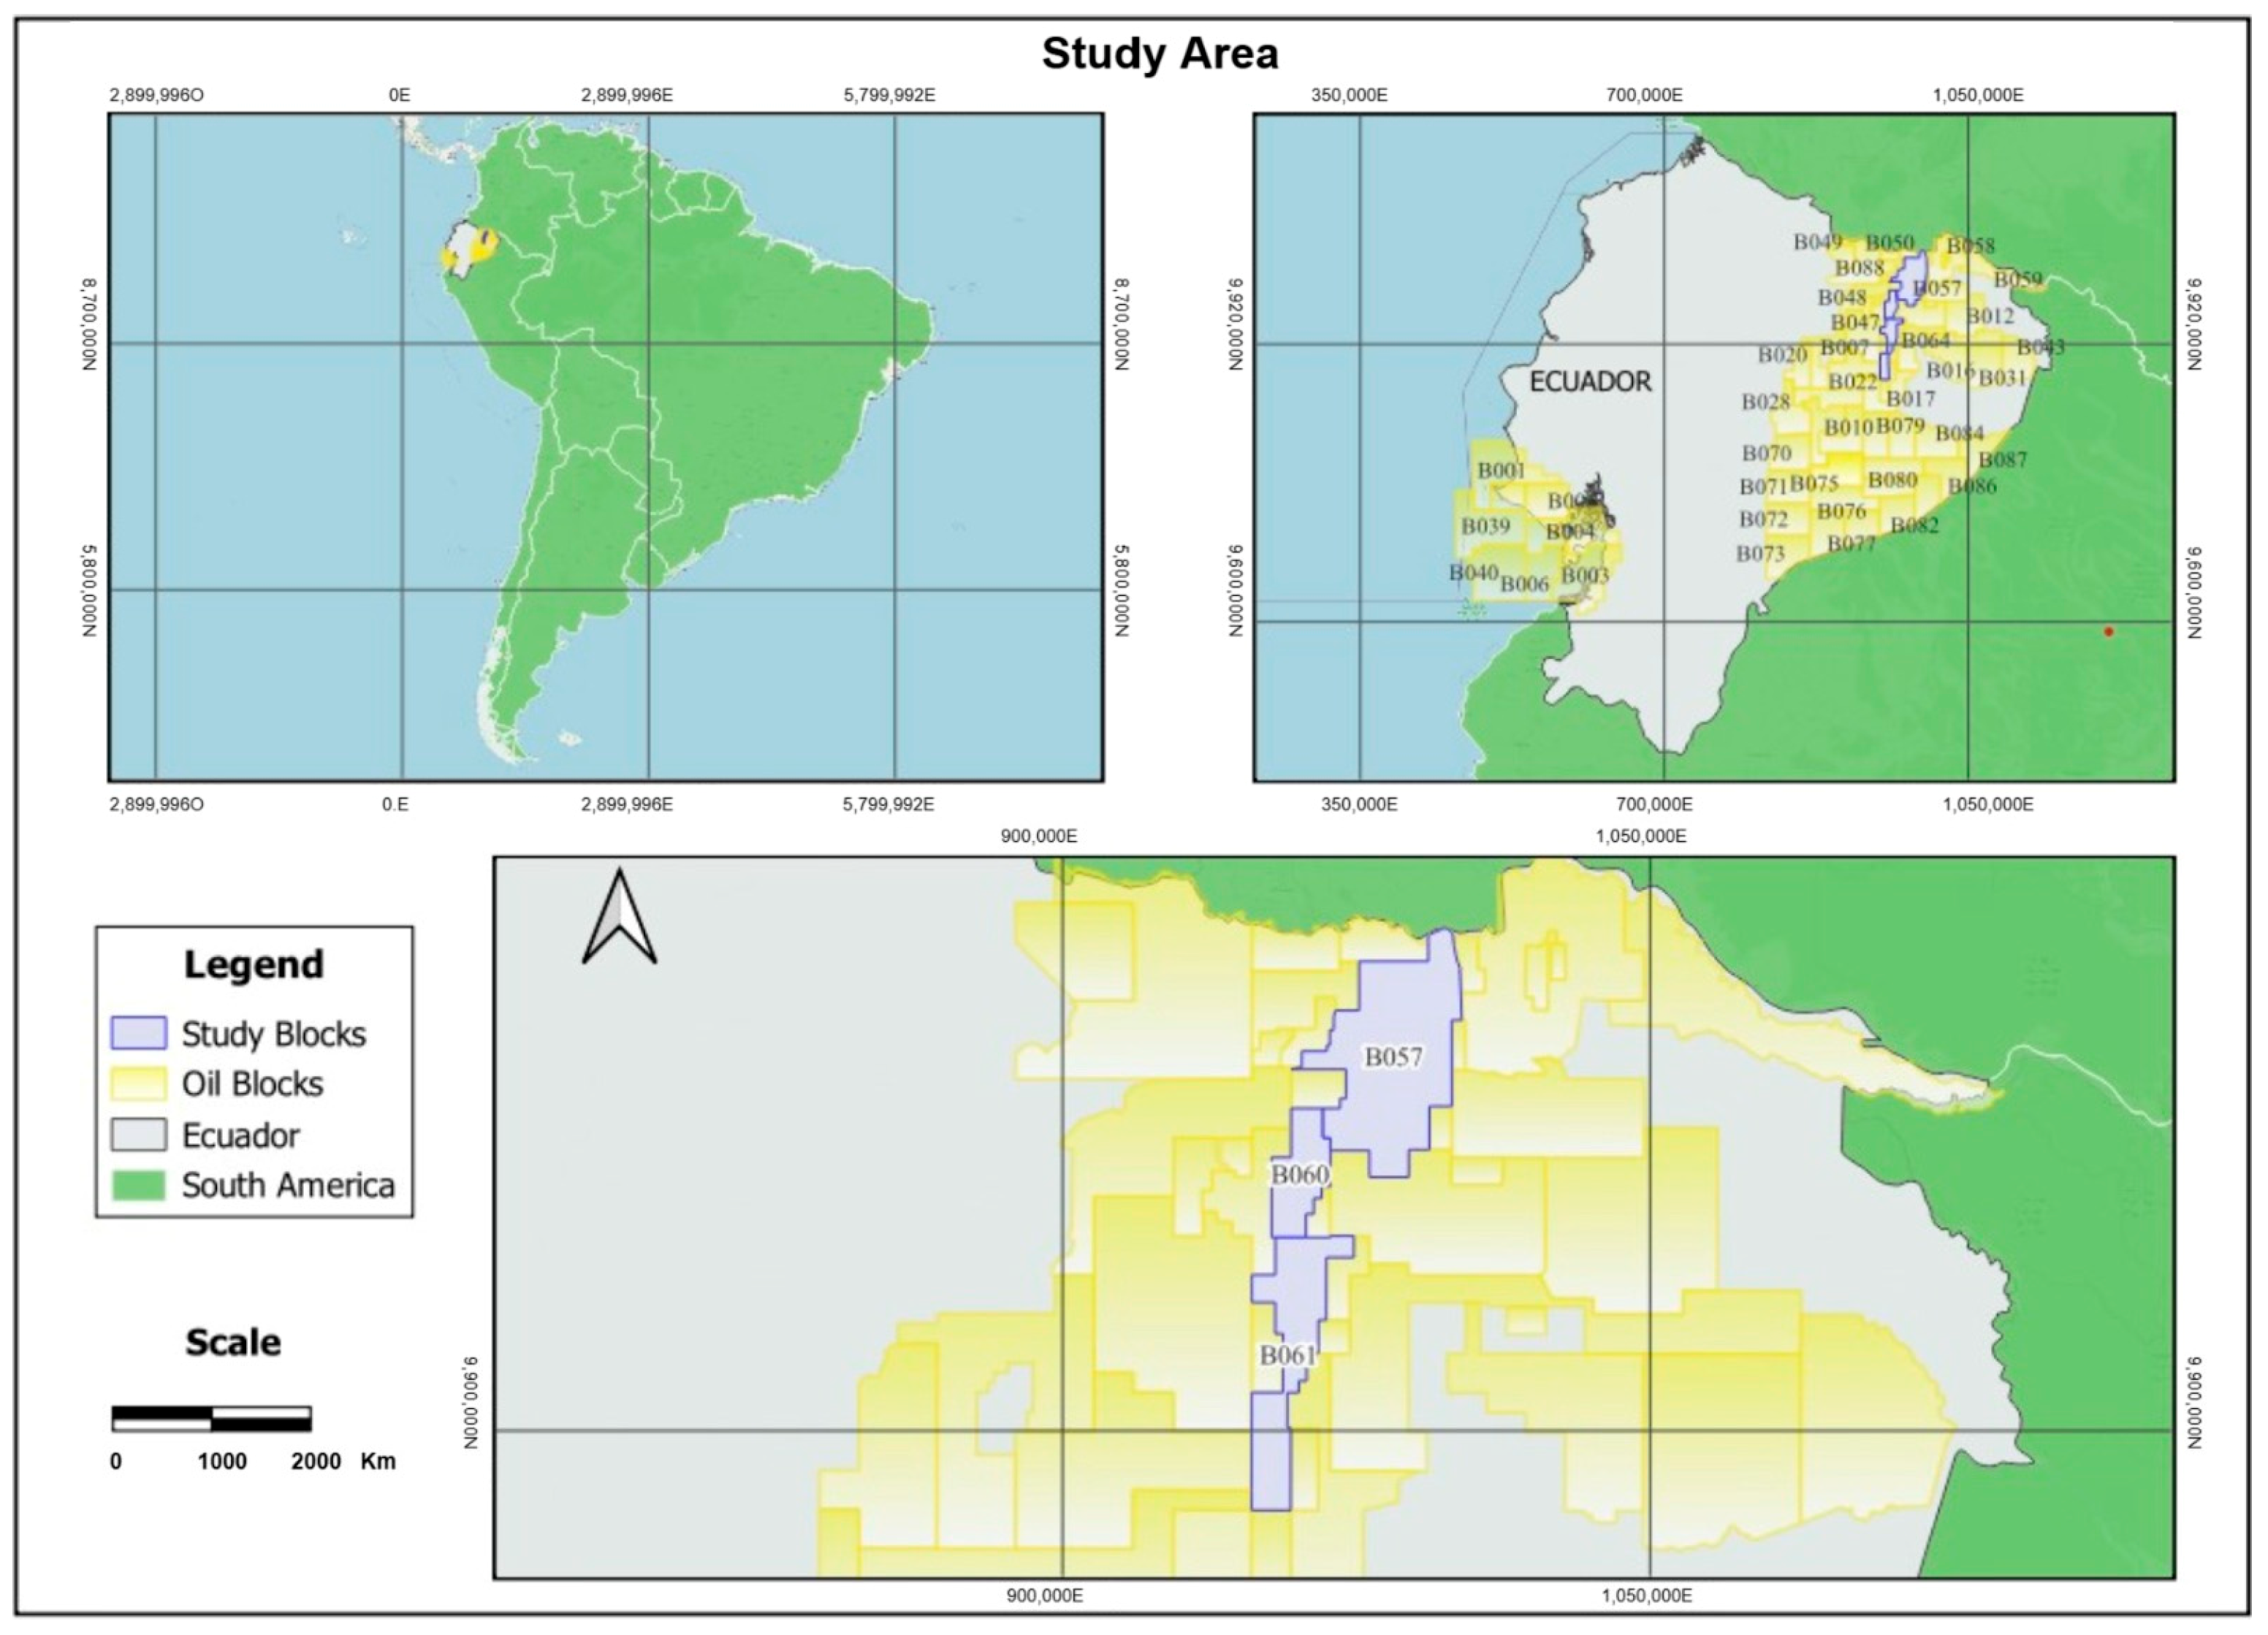
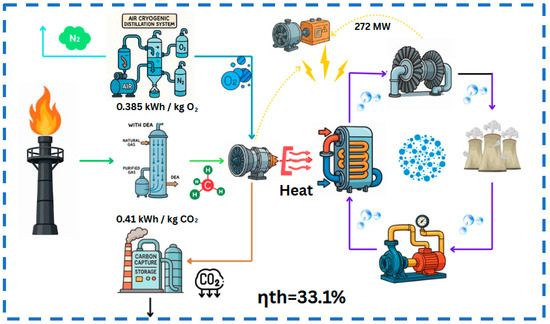
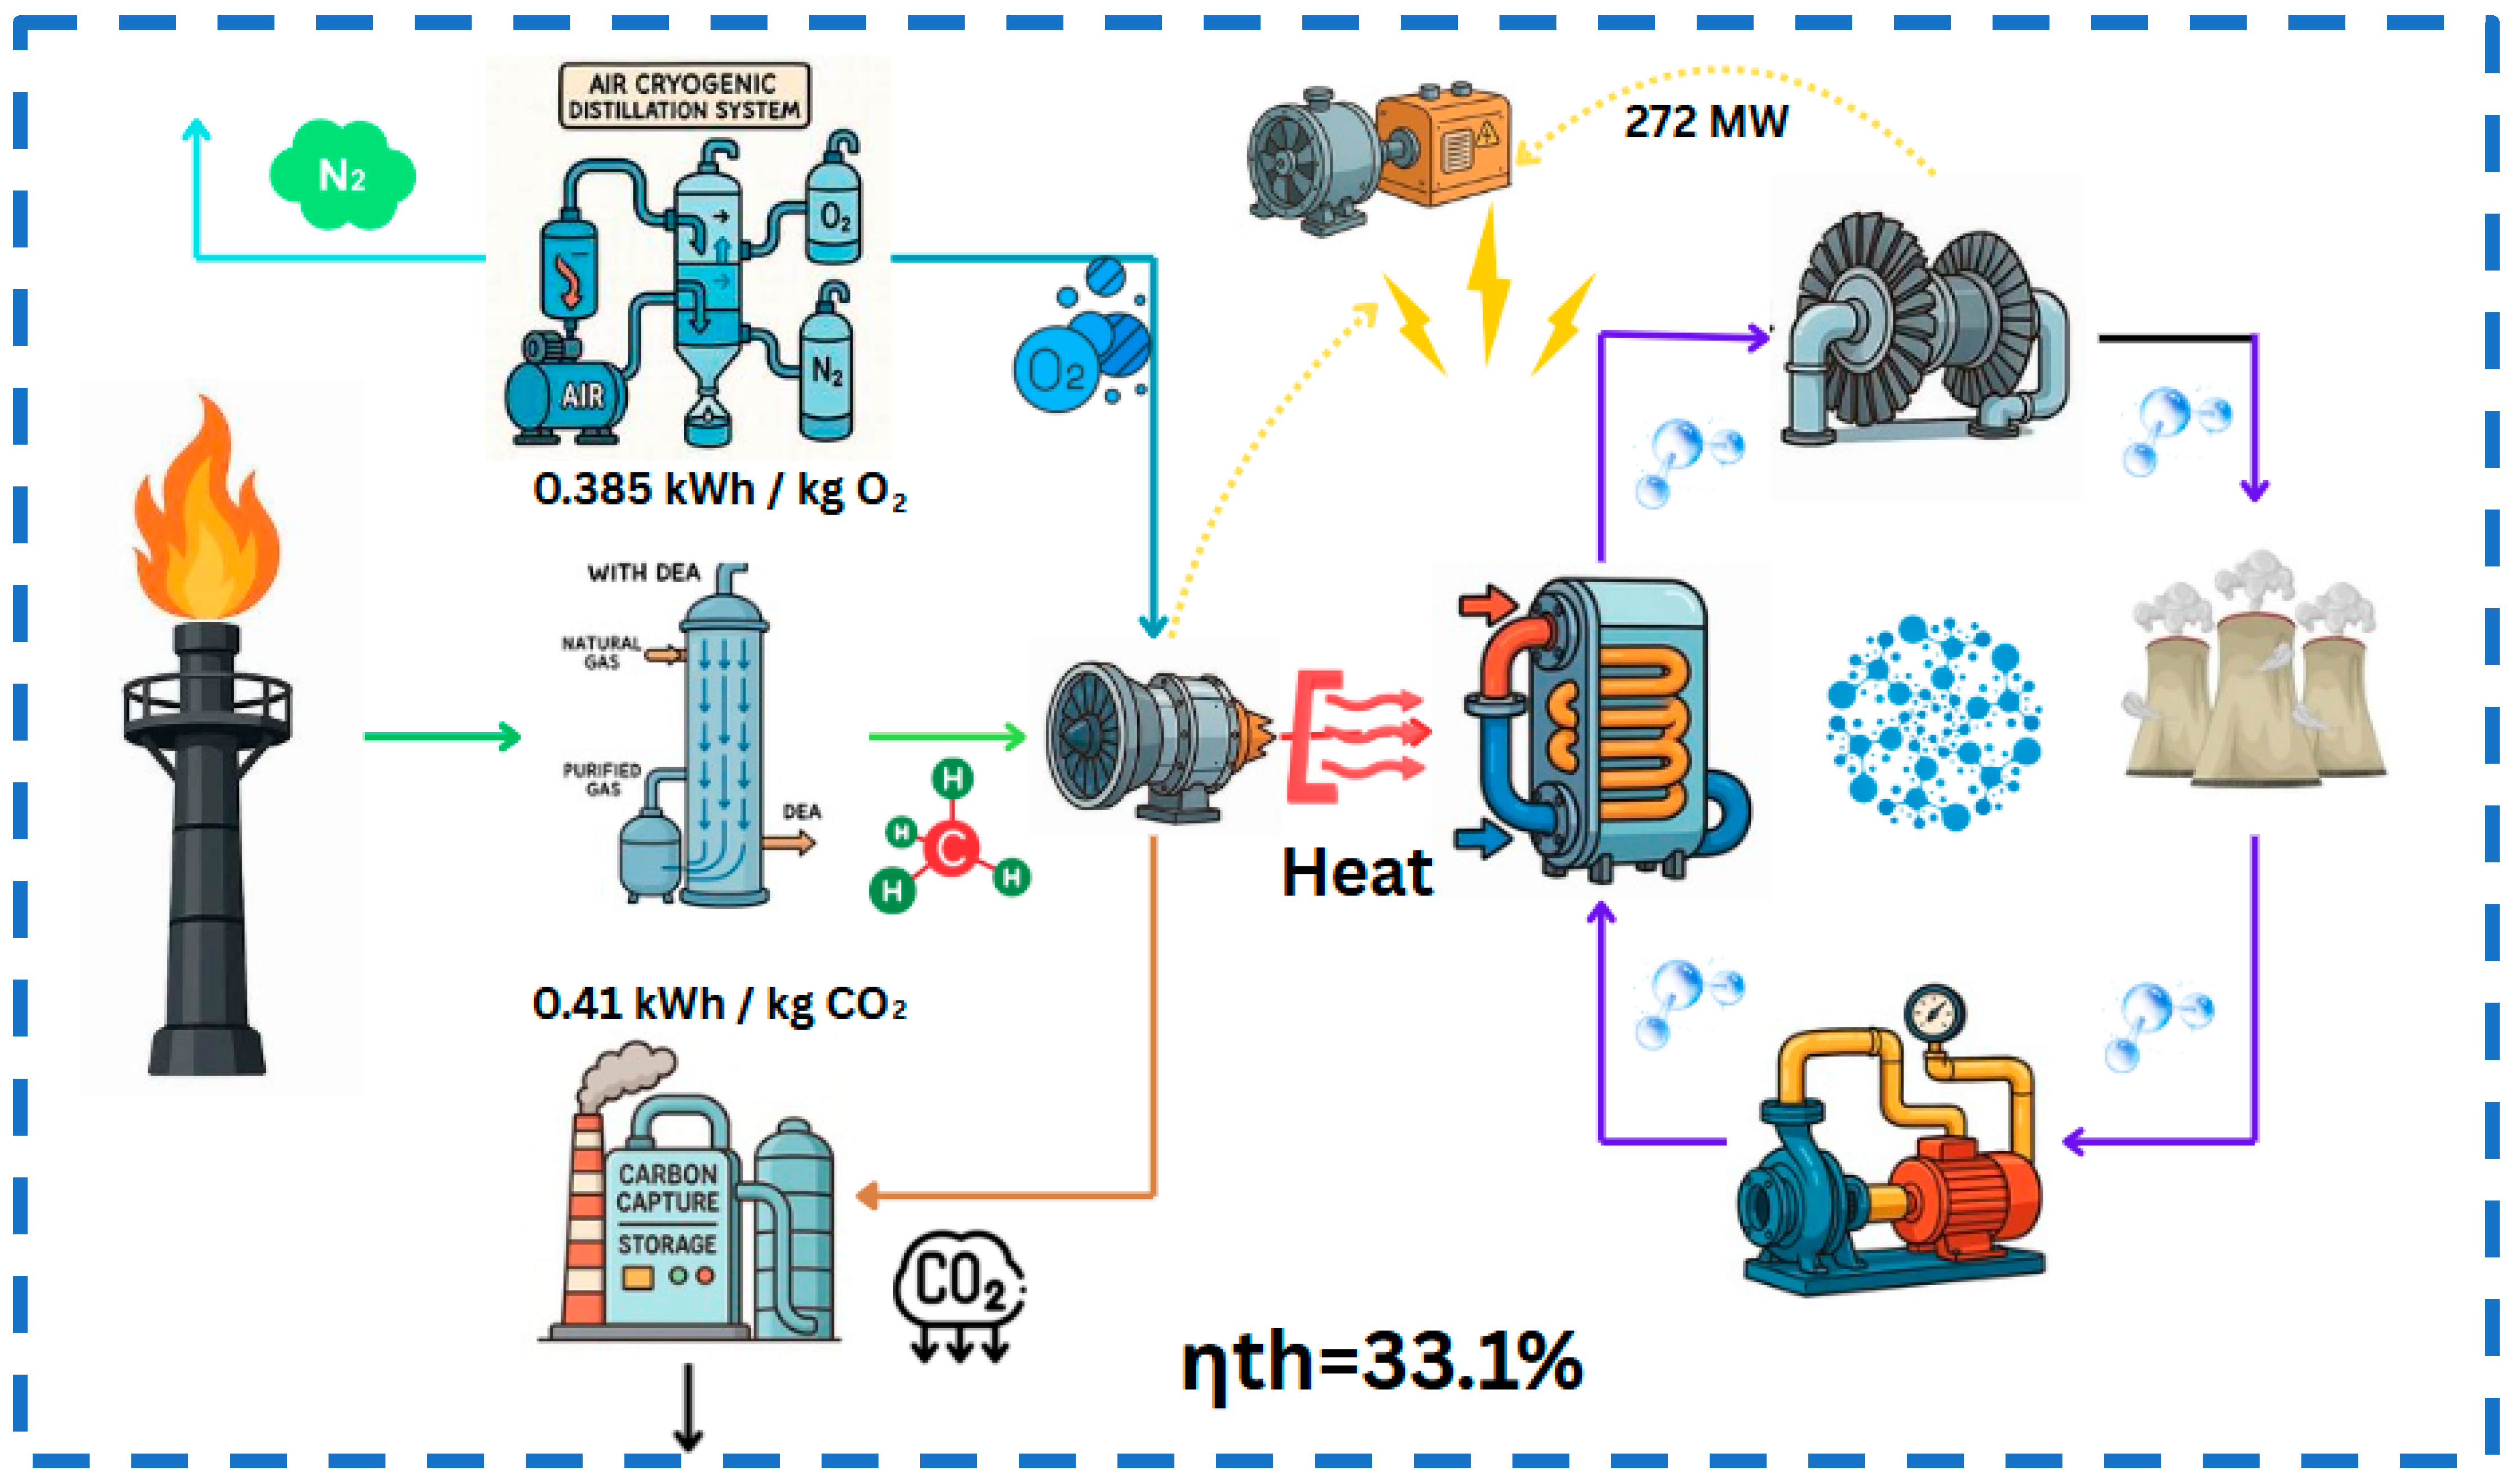
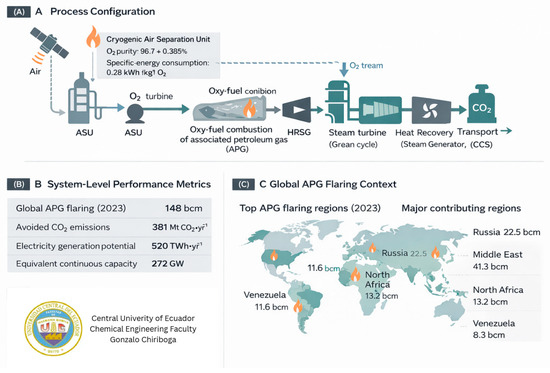

Disclaimer/Publisher’s Note: The statements, opinions and data contained in all publications are solely those of the individual author(s) and contributor(s) and not of MDPI and/or the editor(s). MDPI and/or the editor(s) disclaim responsibility for any injury to people or property resulting from any ideas, methods, instructions or products referred to in the content. |
© 2026 by the authors. Licensee MDPI, Basel, Switzerland. This article is an open access article distributed under the terms and conditions of the Creative Commons Attribution (CC BY) license.