Decentralized Valorization of Associated Petroleum Gas via Modular Oxy-Combustion and Carbon Capture: A Scalable Strategy for Global Flaring Reduction
 , , , , and
Abstract
1. Introduction
1.1. Global Flaring Practices and Regulatory Gaps in Developing Regions
1.2. Energy Waste and Underutilization of Associated Gas Resources
1.3. Environmental Risks of Incomplete Combustion in Flaring Systems
1.4. Policy Initiatives and Innovation Pathways for Decentralized Gas Utilization
1.5. Ecuador APG Flaring Situation and Challenges
2. Materials and Methods
2.1. Evaluation of Associated Gas Potential Using Multi-Criteria Analysis (MCA)
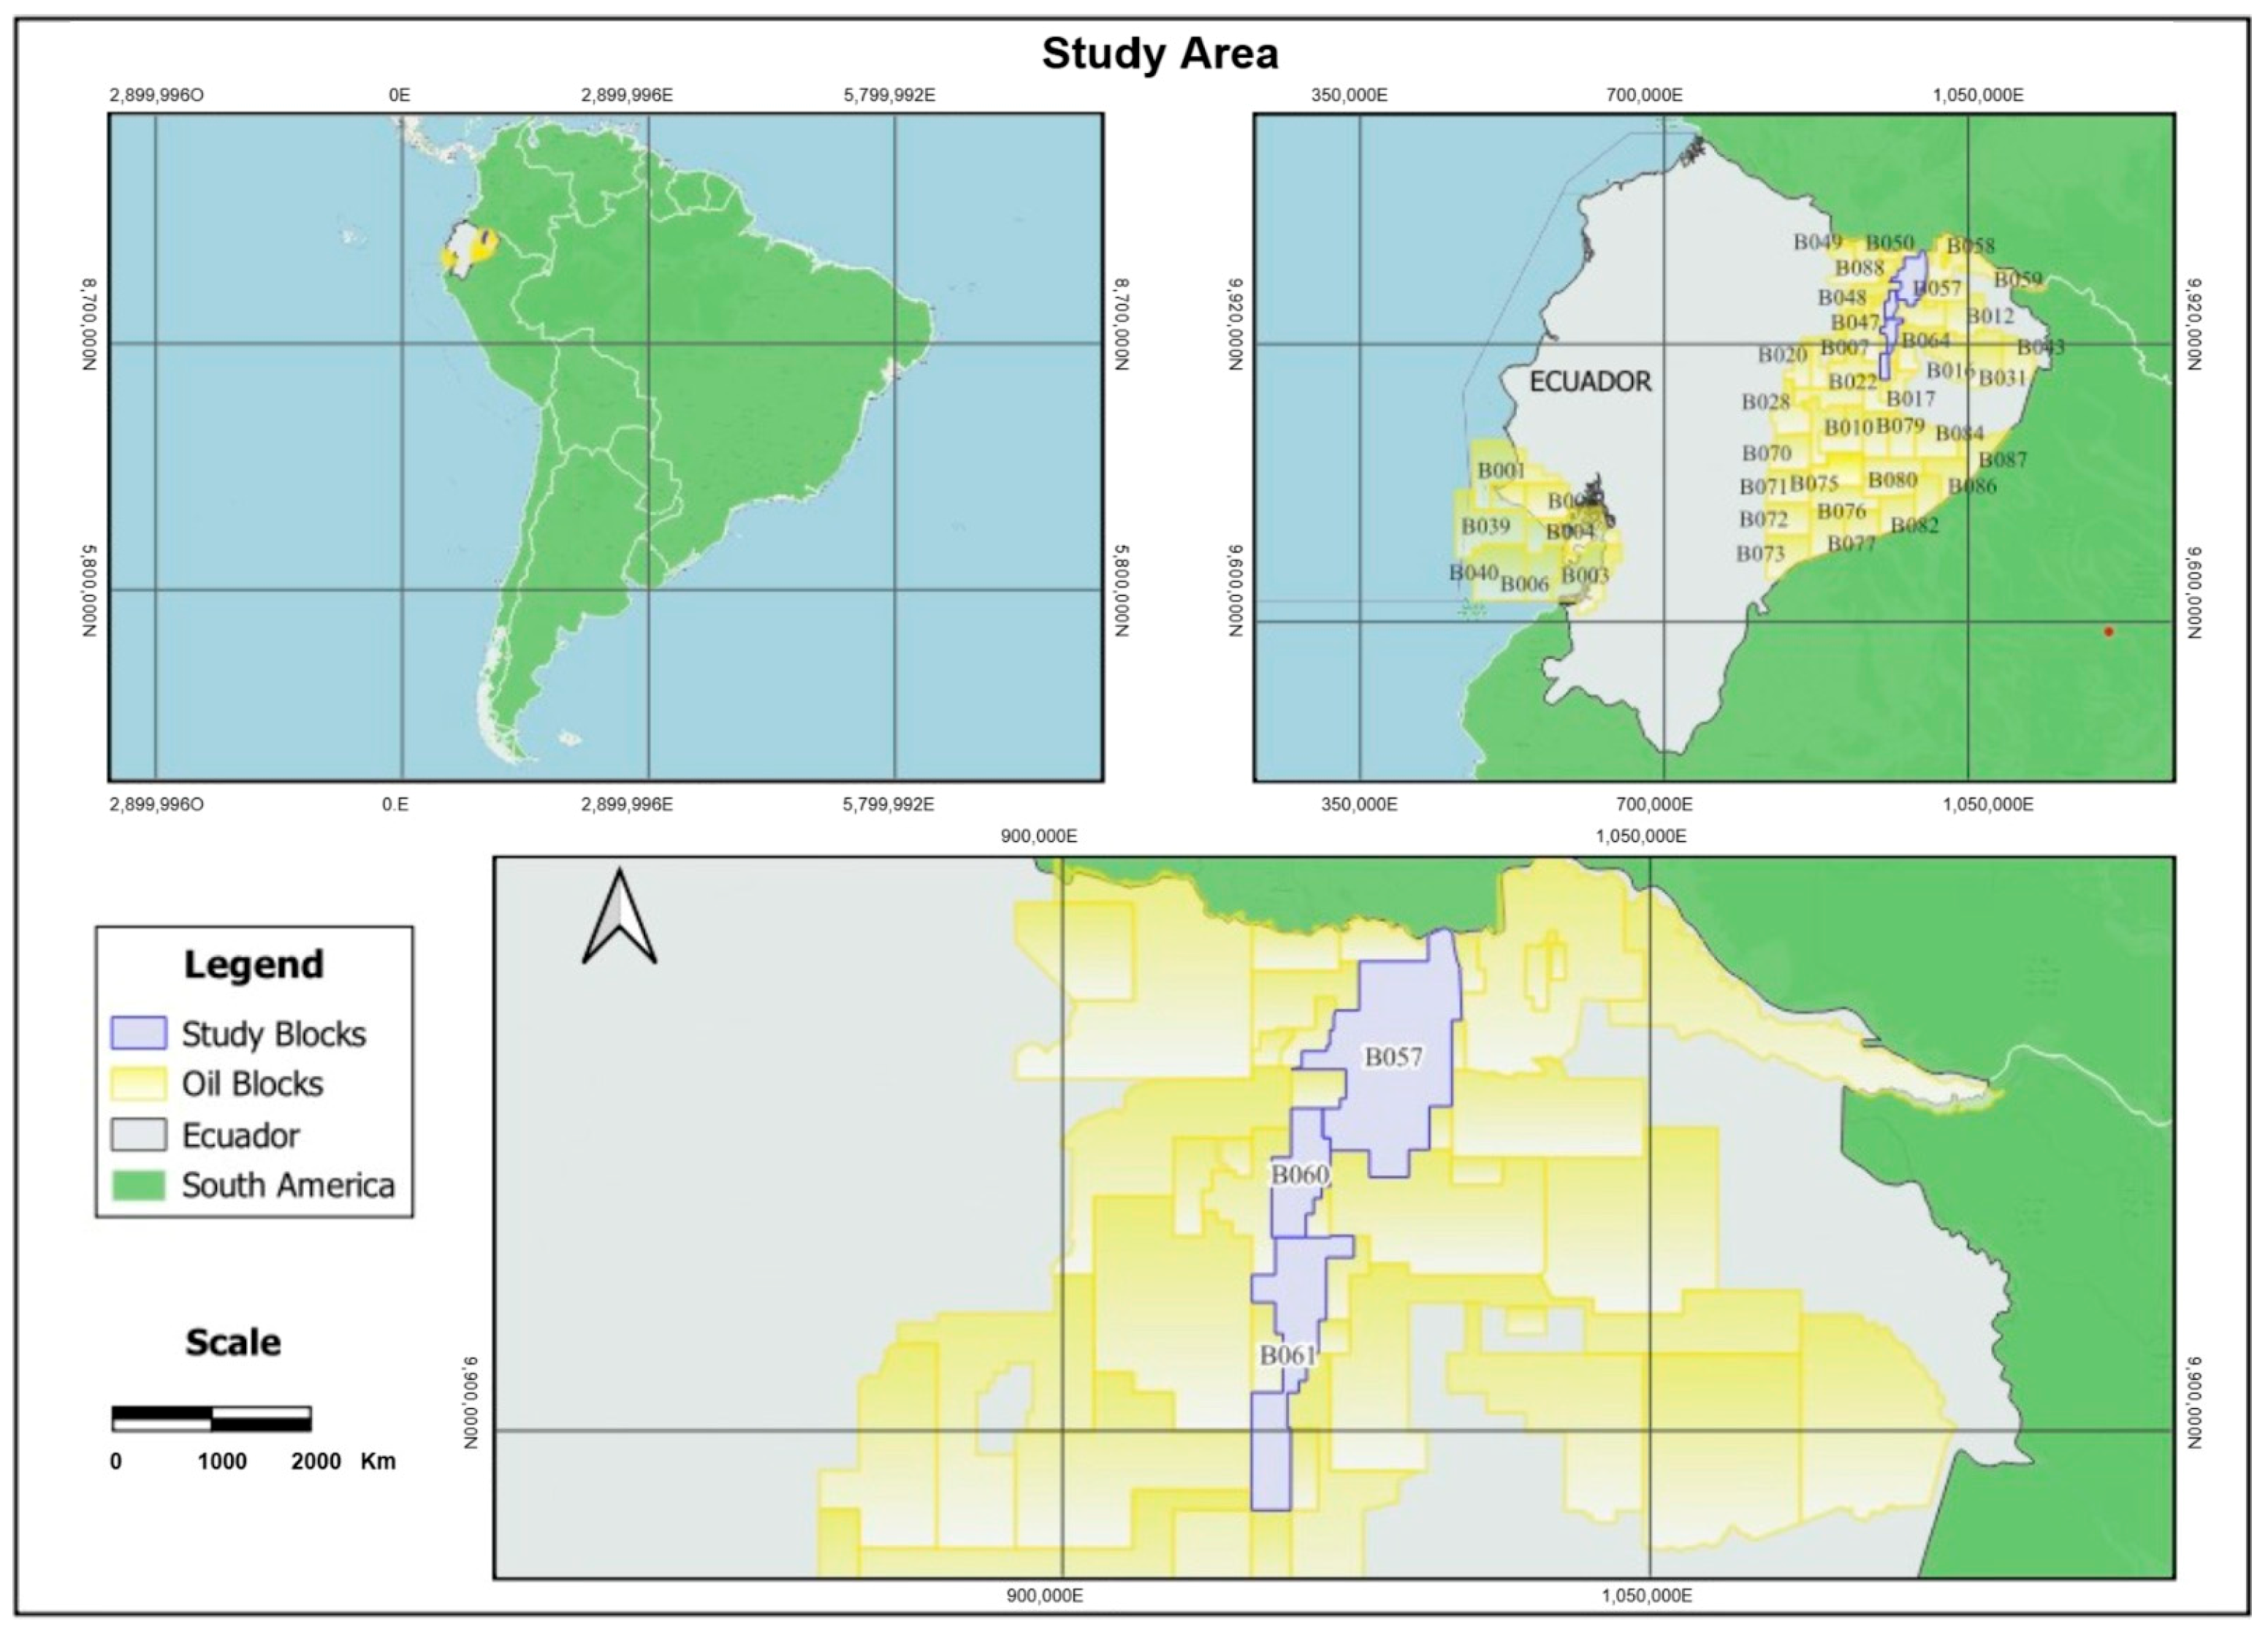
2.2. Power Plant Location
2.3. Analysis and Processes Definition for the Integrated Power Generation System
- APG and combustion streams: Peng–Robinson EOS for hydrocarbon-rich mixtures.
- DEA sweetening: Kent–Eisenberg amine model for acid gas absorption/regeneration.
- ASU: Soave–Redlich–Kwong EOS for cryogenic air separation.
- CO2 compression/liquefaction: GERG-2008 for dense-phase CO2.
- Feed composition: H2S between 600 and 2500 ppm, CO2 up to 18 mol%, with C5+ condensates.
- Absorber design: Packed column, stage efficiency 0.75.
- Performance targets: Reduce H2S to <10 ppm, remove free water and heavy hydrocarbons.
- Energy demand: Reboiler duty ≈ 3.2 MJ/kg acid gas; solvent circulation adjusted for ≥80% removal efficiency.
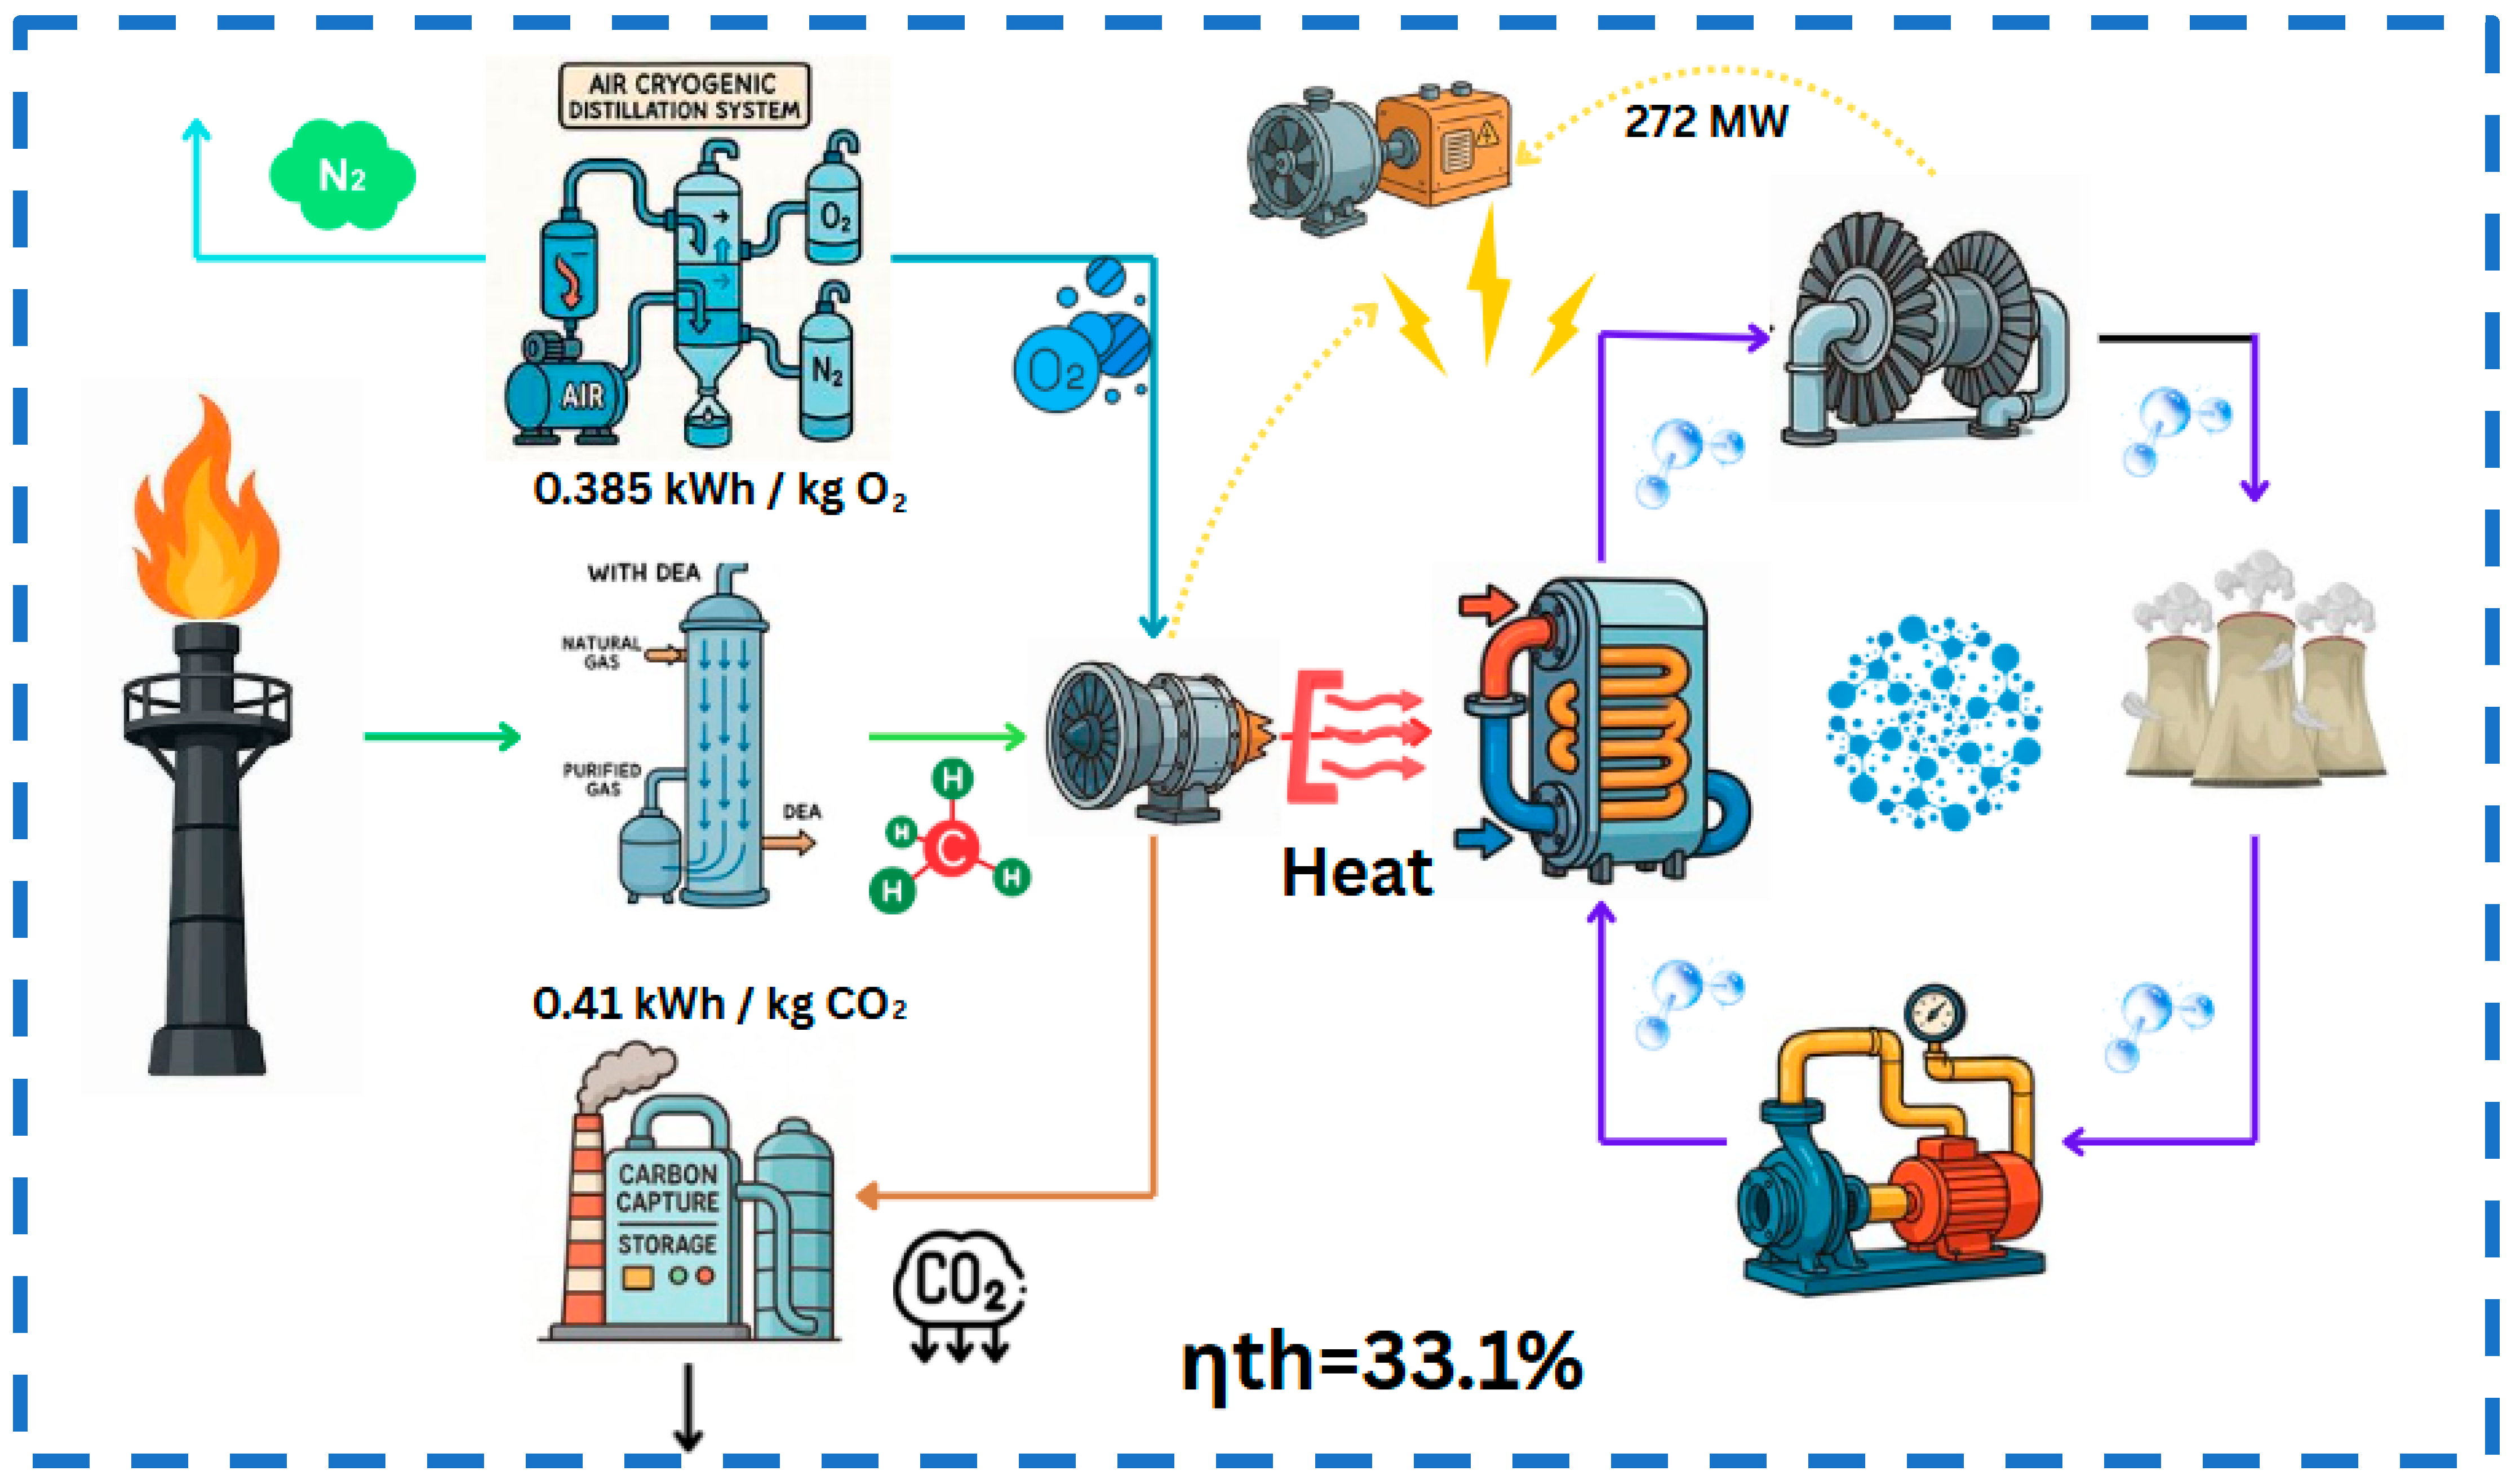
- Oxygen purity: 96.7% mol.
- Specific energy consumption: 0.385 kWh/kg O2.
- Operating pressures: 5–6 bar (HP column), 1.2–1.5 bar (LP column).
- Cooling duty: Intercooling stages minimize compressor work.
- Stoichiometry: CH4 requires 2 mol O2/mol fuel; heavier hydrocarbons adjusted per corresponding molecular weight Tables S15–S18.
- Recirculation: CO2 recycled as a temperature moderator, maintaining turbine inlet ≈ 1200–1399 °C.
- Heat recovery: Two-stage gas expansion with HRSG producing steam for a reheat bottoming cycle.
- Performance: Thermal efficiency 33.1%, exergetic efficiency 39.98%.
- CO2 capture: 99.99% removal efficiency, compression demand 0.41 kWh/kg CO2.
- Energy demand: 5.13 × 10⁷ to 1.31 × 10⁸ kJ/h per stage (Tables S30 and S31).
- Corrosion control: Stream conditioning ensured compatibility with dense-phase CO2 transport.
2.4. System Integration and Regulations
2.5. Technoeconomic Implications
3. Results
3.1. Summary Results
- Containerized 272 MW oxy-combustion + CCS module achieves 33.1% thermal and 39.98% exergetic efficiency.
- Air separation unit produces 96.67% O2 at 0.385 kWh/kg, cutting energy demand by ~20% and lowering costs.
- CO2 capture system sequesters 99.99% CO2 at 0.41 kWh/kg, matching top benchmarks and minimizing emissions.
- Modular 272 MW units deliver off-grid power, scalable through multi-block sourcing and 2% efficiency gains.
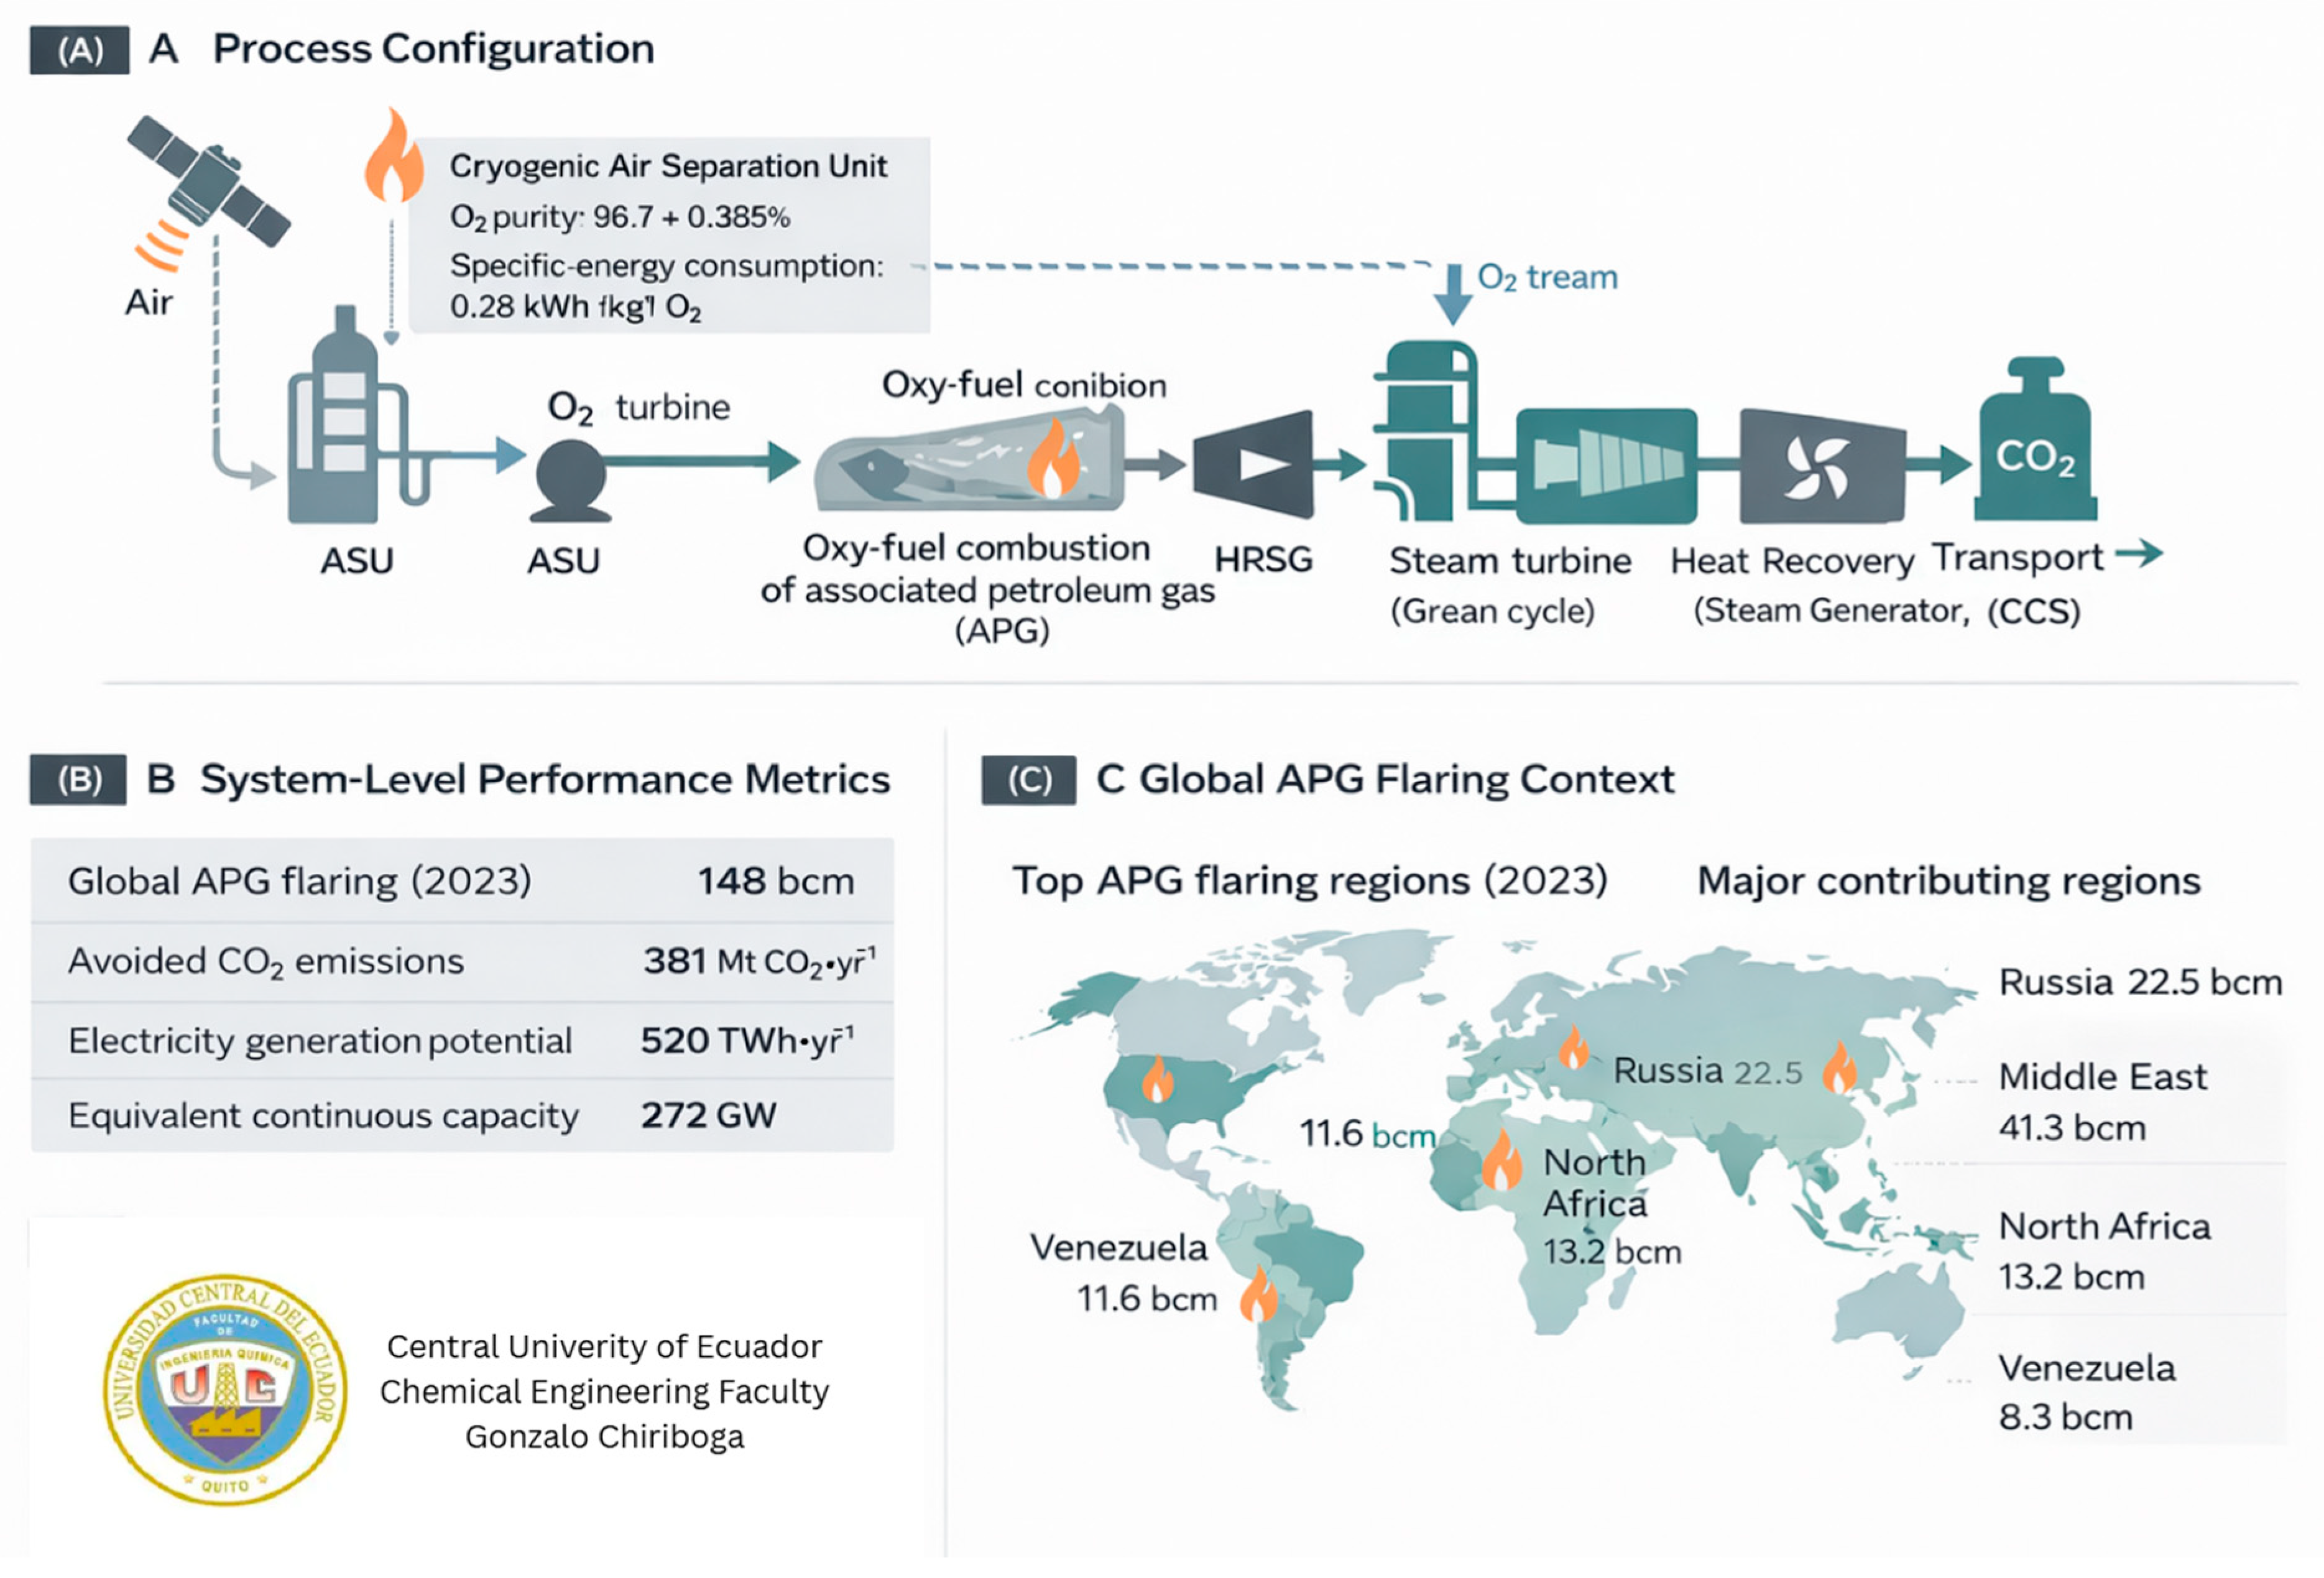
- Global scale: 220 modules valorize 148 bcm APG, producing ~520 TWh electricity and sequestering 381 Mt CO2.
3.2. Sensitivity Analysis of APG Composition
4. Discussion
4.1. Technical Implications
4.2. Capex/Opex Considerations
4.3. Global Implications APG
5. Conclusions
Supplementary Materials
Author Contributions
Funding
Data Availability Statement
Acknowledgments
Conflicts of Interest
Abbreviations
| AHP | Analytic Hierarchy Process |
| APG | Associated Petroleum Gas |
| ASU | Air Separation Unit |
| BC | Black Carbon |
| bcm | Billion cubic meters (gas volume) |
| CBAM | Carbon Border Adjustment Mechanism |
| CC | Carbon Capture |
| CCS | Carbon Capture and Storage |
| CES | Clean Energy Systems |
| DEA | Diethanolamine (amine solvent used for sweetening) |
| EES | Engineering Equation Solver |
| EROI | Energy Return on Investment |
| GCV | Gross Calorific Value |
| GFMR/GGFR | Global Flaring and Methane Reduction/Global Gas Flaring Reduction |
| GHG | Greenhouse Gas |
| GIS | Geographic Information System |
| GWP | Global Warming Potential |
| HRSG | Heat Recovery Steam Generator |
| IGCC | Integrated Gasification Combined Cycle |
| JETP | Just Energy Transition Partnership |
| LHV | Lower Heating Value |
| MAATE | Ministerio del Ambiente, Agua y Transición Ecológica (Ecuador) |
| MCA | Multi-Criteria Analysis |
| MRV | Monitoring, Reporting, and Verification |
| NDCs | Nationally Determined Contributions |
| NGCC | Natural Gas Combined Cycle |
| OXC/OxyC | Oxy-Combustion (term used for the power cycle) |
| PSA | Pressure Swing Adsorption |
| SCOC-CC | Semi-Closed Oxy-Combustion Combined Cycle |
| SIN | Sistema Nacional Interconectado |
| SMR | Steam Methane Reforming |
| SOFC | Solid Oxide Fuel Cell |
| TEG | Triethylene Glycol (dehydration unit) |
| TRLs | Technology readiness levels |
| TROPOMI | TROPOspheric Monitoring Instrument (Sentinel-5P) |
| VIIRS | Visible Infrared Imaging Radiometer Suite |
| VOC(s) | Volatile Organic Compounds |
| WI | Wobbe Index |
References
- Franklin, M.; Chau, K.; Cushing, L.J.; Johnston, J.E. Characterizing Flaring from Unconventional Oil and Gas Operations in South Texas Using Satellite Observations. Environ. Sci. Technol. 2019, 53, 2220–2228. [Google Scholar] [CrossRef] [Scilit] [PubMed]
- Heim, I.; Vigneau, A.C.; Kalyuzhnova, Y. Environmental and Socio-Economic Policies in Oil and Gas Regions: Triple Bottom Line Approach. Reg. Stud. 2023, 57, 181–195. [Google Scholar] [CrossRef] [Scilit]
- Al-Rubaye, A.H.; Jasim, D.J.; Jassam, S.A.; Jasim, H.M.; Ameen, H.F.M.; Khoshnaw, F.A. Associated Petroleum Gas: Environmental, Utilization, and Economic Rationale. IOP Conf. Ser. Earth Environ. Sci. 2023, 1262, 022026. [Google Scholar] [CrossRef] [Scilit]
- Guerin, A.; Ho, P.; Najjar, N.; Schaufele, B. Lessons for regulating flaring and venting: Results from Alberta, Canada. Energy Policy 2025, 206, 114774. [Google Scholar] [CrossRef] [Scilit]
- Banet, C. Regulation of Flaring and Venting of Natural Gas from Petroleum Activities in Norway. Prepr.—SSRN Electron. J. 2025. [Google Scholar] [CrossRef] [Scilit]
- Carpenter, C. Saudi Arabia Case Study Illustrates Road to Zero Routine Gas Flaring. J. Pet. Technol. 2023, 75, 55–57. [Google Scholar] [CrossRef] [Scilit]
- Albakjaji, M.; Alhussein, H.S.; Baroudy, J. El Legal and Policy Frameworks for Climate and Air Protection in Saudi Arabia: A Review of Progress. J. Posthumanism 2025, 5, 4820–4840. [Google Scholar] [CrossRef] [Scilit]
- Olujobi, O.J.; Irumekhai, O.S.; Odjugo, O. Petroleum Laws, Regulations, And Sustainable Development: Oil And Gas Perspectives From Nigeria, Norway, And Saudi Arabia. J. Sustain. Dev. Law Policy 2025, 16, 22–47. [Google Scholar] [CrossRef] [Scilit]
- Esfandiari, A.; Raissi, S. Preventing Fugitive Emissions Through Advanced Valve Sealing Technologies in Hydrocarbon Facilities. In Proceedings of the Abu Dhabi International Petroleum Exhibition and Conference; SPE: Richardson, TX, USA, 2025. [Google Scholar]
- Alshamaa, H.A.; Hamza, W.M. Legislative Regulation of Oil and Gas Facilities in Iraqi Administrative Law. J. Pet. Res. Stud. 2023, 13, 1–14. [Google Scholar] [CrossRef] [Scilit]
- Wen, Y.; Xiao, J.; Peng, J. The Effects of the “Zero Routine Flaring by 2030” Initiative: International Comparisons Based on Generalized Synthetic Control Method. Environ. Impact Assess. Rev. 2023, 100, 107095. [Google Scholar] [CrossRef] [Scilit]
- Calel, R.; Mahdavi, P. The Unintended Consequences of Antiflaring Policies—And Measures for Mitigation. Proc. Natl. Acad. Sci. USA 2020, 117, 12503–12507. [Google Scholar] [CrossRef] [Scilit]
- Blundell, W.; Kokoza, A. Natural Gas Flaring, Respiratory Health, and Distributional Effects. J. Public Econ. 2022, 208, 104601. [Google Scholar] [CrossRef] [Scilit]
- Hamidzadeh, Z.; Sattari, S.; Soltanieh, M.; Vatani, A. Development of a Multi-Objective Decision-Making Model to Recover Flare Gases in a Multi Flare Gases Zone. Energy 2020, 203, 117815. [Google Scholar] [CrossRef] [Scilit]
- Crowley-Vigneau, A. The Global Norm on Combatting Flaring and Russian Decrees 7 and 1148. In The National Implementation of International Norms: Transnational Networks and Local Content Policy; Springer: Berlin/Heidelberg, Germany, 2022; pp. 141–196. [Google Scholar]
- Babalola, A.A.; Olawuyi, D.S. Overcoming Regulatory Failure in the Design and Implementation of Gas Flaring Policies: The Potential and Promise of an Energy Justice Approach. Sustainability 2022, 14, 6800. [Google Scholar] [CrossRef] [Scilit]
- Vorobev, A.; Shchesnyak, E. Associated Petroleum Gas Flaring: The Problem and Possible Solution. In International Congress on Applied Mineralogy; Springer: Cham, Switzerland, 2019; pp. 227–230. [Google Scholar]
- World Bank Global Gas Flaring Data. Global Flaring and Methane Reduction Partnership (GFMR). 2025. Available online: https://www.worldbank.org/en/programs/gasflaringreduction/global-flaring-data (accessed on 8 February 2025).
- Alola, A.A.; Onifade, S.T.; Magazzino, C.; Obekpa, H.O. The Effects of Gas Flaring as Moderated by Government Quality in Leading Natural Gas Flaring Economies. Sci. Rep. 2023, 13, 14394. [Google Scholar] [CrossRef] [Scilit]
- Beltrán-Jiménez, K.; Chávez-Rodríguez, M.F.; Szklo, A. Associated Natural Gas Flare in the Integrated Market of the Southern Cone. Energy Strategy Rev. 2018, 22, 337–347. [Google Scholar] [CrossRef] [Scilit]
- Alsuwailem, M. The Road to Zero Routine Gas Flaring: A Case Study from Saudi Arabia. In Proceedings of the International Petroleum Technology Conference; IPTC: London, UK, 2021. [Google Scholar]
- Aigbe, G.O.; Stringer, L.C.; Cotton, M. Optimizing Policies and Regulations for Zero Routine Gas Flaring and Net Zero. Climate 2025, 13, 178. [Google Scholar] [CrossRef] [Scilit]
- PourMirza, A. Gas Flaring Status, Trend and Policy around the Persian Gulf. Energy Sources Part B Econ. Plan. Policy 2017, 12, 250–259. [Google Scholar] [CrossRef] [Scilit]
- Ndunagu, P.N.; Joel, O.F.; Oji, A.A. Comparative Analysis of Satellite and Regulatory Based Gas Flare Volumes in the Niger Delta Region. Niger. J. Technol. Dev. 2022, 18, 279–287. [Google Scholar] [CrossRef] [Scilit]
- Elvidge, C.D.; Bazilian, M.D.; Zhizhin, M.; Ghosh, T.; Baugh, K.; Hsu, F.-C. The Potential Role of Natural Gas Flaring in Meeting Greenhouse Gas Mitigation Targets. Energy Strategy Rev. 2018, 20, 156–162. [Google Scholar] [CrossRef] [Scilit]
- Tran, H.; Polka, E.; Buonocore, J.J.; Roy, A.; Trask, B.; Hull, H.; Arunachalam, S. Air Quality and Health Impacts of Onshore Oil and Gas Flaring and Venting Activities Estimated Using Refined Satellite-Based Emissions. Geohealth 2024, 8, e2023GH000938. [Google Scholar] [CrossRef] [Scilit] [PubMed]
- Shahab-Deljoo, M.; Medi, B.; Kazi, M.-K.; Jafari, M. A Techno-Economic Review of Gas Flaring in Iran and Its Human and Environmental Impacts. Process Saf. Environ. Prot. 2023, 173, 642–665. [Google Scholar] [CrossRef] [Scilit]
- Soltanieh, M.; Zohrabian, A.; Gholipour, M.J.; Kalnay, E. A Review of Global Gas Flaring and Venting and Impact on the Environment: Case Study of Iran. Int. J. Greenh. Gas Control. 2016, 49, 488–509. [Google Scholar] [CrossRef] [Scilit]
- Shamlan, M. Associated Petroleum Gas Flaring in Yemen: Current Status and Potential Utilization. Stardom Sci. J. Nat. Eng. Sci. 2025, 3, 1–24. [Google Scholar] [CrossRef] [Scilit]
- Osuoha, C.A.; Fakutiju, M.A. Gas Flaring in Niger Delta Region of Nigeria: Cost, Ecological and Human Health Implications. Environ. Manag. Sustain. Dev. 2017, 6, 390. [Google Scholar] [CrossRef] [Scilit]
- Rodrigues, A.C.C. Decreasing Natural Gas Flaring in Brazilian Oil and Gas Industry. Resour. Policy 2022, 77, 102776. [Google Scholar] [CrossRef] [Scilit]
- Faruolo, M.; Caseiro, A.; Lacava, T.; Kaiser, J.W. Gas Flaring: A Review Focused On Its Analysis From Space. IEEE Geosci. Remote Sens. Mag. 2021, 9, 258–281. [Google Scholar] [CrossRef] [Scilit]
- Davoudi, M.; Rahimpour, M.R.; Jokar, S.M.; Nikbakht, F.; Abbasfard, H. The Major Sources of Gas Flaring and Air Contamination in the Natural Gas Processing Plants: A Case Study. J. Nat. Gas Sci. Eng. 2013, 13, 7–19. [Google Scholar] [CrossRef] [Scilit]
- Weyant, C.L.; Shepson, P.B.; Subramanian, R.; Cambaliza, M.O.L.; Heimburger, A.; McCabe, D.; Baum, E.; Stirm, B.H.; Bond, T.C. Black Carbon Emissions from Associated Natural Gas Flaring. Environ. Sci. Technol. 2016, 50, 2075–2081. [Google Scholar] [CrossRef] [Scilit]
- Facchinelli, F.; Pappalardo, S.E.; Codato, D.; Diantini, A.; Della Fera, G.; Crescini, E.; De Marchi, M. Unburnable and Unleakable Carbon in Western Amazon: Using VIIRS Nightfire Data to Map Gas Flaring and Policy Compliance in the Yasuní Biosphere Reserve. Sustainability 2019, 12, 58. [Google Scholar] [CrossRef] [Scilit]
- Durango-Cordero, J.; Saqalli, M.; Parra, R.; Elger, A. Spatial Inventory of Selected Atmospheric Emissions from Oil Industry in Ecuadorian Amazon: Insights from Comparisons among Satellite and Institutional Datasets. Saf. Sci. 2019, 120, 107–116. [Google Scholar] [CrossRef] [Scilit]
- Nwaogu, D.C.; Akpoghome, T.U. Ending Gas Flaring in the Nigerian Oil and Gas Industry: The Need for Strict Regulatory Enforcement. J. Environ. Law Policy 2022, 02, 79–101. [Google Scholar] [CrossRef] [Scilit]
- Olawuyi, D.S. Overcoming Regulatory Failure in the Design and Implementation of Gas Flaring Policies: The Potential and Promise of an Energy Justice Approach. SSRN Electron. J. 2022. [Google Scholar] [CrossRef] [Scilit]
- Duren, R.; Gordon, D. Tackling Unlit and Inefficient Gas Flaring. Science 2022, 377, 1486–1487. [Google Scholar] [CrossRef] [Scilit]
- Aoun, A.E.; Rasouli, V.; Khetib, Y. Assessment of Advanced Technologies to Capture Gas Flaring in North Dakota. Arab. J. Sci. Eng. 2023, 48, 16507–16525. [Google Scholar] [CrossRef] [Scilit]
- Omobolanle, O.C.; Ikiensikimama, S.S. Gas Flaring: Technicalities, Challenges, and the Economic Potentials. Environ. Sci. Pollut. Res. 2024, 31, 40838–40850. [Google Scholar] [CrossRef] [Scilit] [PubMed]
- Tavallaei, M.; Farzaneh-Gord, M.; Moghadam, A.J. 4E Analysis and Thermodynamic Optimization of Flaring Associated Gas Recovery Using External Firing Recuperative Gas Turbine. Energy Convers. Manag. 2022, 266, 115836. [Google Scholar] [CrossRef] [Scilit]
- Ilyin, V.B.; Yakovenko, R.E.; Belashov, D.M.; Zemlyakov, N.D.; Savost’yanov, A.P. Thermodynamic Study of Associated Petroleum Gas Reforming to Methane. Pet. Chem. 2019, 59, 641–649. [Google Scholar] [CrossRef] [Scilit]
- Wilcox, A. Flaring Issues, Solutions & Technologies-2019; National Energy Technology Laboratory: Pittsburgh, PA, USA; Morgantown, WV, USA, 2019.
- MAATE. Plan Nacional de Mitigación del Cambio Climático Ecuador 2024–2070; Public Policy, Ministery of Environment: Quito, Ecuador, 2024. [Google Scholar]
- Mansoor, R.; Tahir, M. Recent Developments in Natural Gas Flaring Reduction and Reformation to Energy-Efficient Fuels: A Review. Energy Fuels 2021, 35, 3675–3714. [Google Scholar] [CrossRef] [Scilit]
- Burtt, D.C.; Corbin, D.J.; Armitage, J.R.; Crosland, B.M.; Jefferson, A.M.; Kopp, G.A.; Kostiuk, L.W.; Johnson, M.R. A Methodology for Quantifying Combustion Efficiencies and Species Emission Rates of Flares Subjected to Crosswind. J. Energy Inst. 2022, 104, 124–132. [Google Scholar] [CrossRef] [Scilit]
- Gilardoni, S.; Di Mauro, B.; Bonasoni, P. Black Carbon, Organic Carbon, and Mineral Dust in South American Tropical Glaciers: A Review. Glob. Planet. Change 2022, 213, 103837. [Google Scholar] [CrossRef] [Scilit]
- The World Bank and the Global Gas Flaring Reduction Partnership’s. Trading Economics Ecuador Crude Oil Production; National Statistics World Bank: Washington, DC, USA; U.S. Energy Information Administration: Washington, DC, USA, 2023.
- GGFR. GGFR Technology Overview—Utilization of Small-Scale Associated Gas; GGFR: Washington, DC, USA, 2021. [Google Scholar]
- NTE INEN 2261; Tanques para Gases a Baja Presión. Requisitos e Inspección, Primera Revisión. INEN: Quito, Ecuador, 2015. Available online: https://solsegsa.com/wp-content/uploads/2022/05/nte-inen-2261-1TANQUE-PARA-GASES-A-BAJA-PRESION.pdf (accessed on 8 February 2025).
- Aspen Technology Inc. Aspen HYSYS, Version 14. 2024. Available online: https://www.aspentech.com (accessed on 8 February 2025).
- Maldonado-Erazo, C.P.; Tierra-Tierra, N.P.; del Río-Rama, M.d.l.C.; Álvarez-García, J. Safeguarding Intangible Cultural Heritage: The Amazonian Kichwa People. Land 2021, 10, 1395. [Google Scholar] [CrossRef] [Scilit]
- Etchart, L. Biodiversity, Global Governance of the Environment, and Indigenous Peoples. In Governance, Development, and Social Inclusion in Latin America; Palgrave Macmillan, C., Ed.; Springer Nature: Berlin/Heidelberg, Germany, 2022; pp. 157–183. [Google Scholar]
- Douros, J.; Eskes, H.; van Geffen, J.; Boersma, K.F.; Compernolle, S.; Pinardi, G.; Blechschmidt, A.-M.; Peuch, V.-H.; Colette, A.; Veefkind, P. Comparing Sentinel-5P TROPOMI NO2 Column Observations with the CAMS Regional Air Quality Ensemble. Geosci. Model Dev. 2023, 16, 509–534. [Google Scholar] [CrossRef] [Scilit]
- Morenov, V.; Leusheva, E.; Buslaev, G.; Gudmestad, O.T. System of Comprehensive Energy-Efficient Utilization of Associated Petroleum Gas with Reduced Carbon Footprint in the Field Conditions. Energies 2020, 13, 4921. [Google Scholar] [CrossRef] [Scilit]
- Hall, C.A.S.; Powers, R.; Schoenberg, W. Peak Oil, EROI, Investments and the Economy in an Uncertain Future. In Biofuels, Solar and Wind as Renewable Energy Systems; Springer: Dordrecht, The Netherlands, 2008; pp. 109–132. [Google Scholar]
- Abdulrahman, R.K.; Zangana, M.H.S.; Ali, K.S.; Slagle, J.C. Utilizing Mixed Amines in Gas Sweetening Process: A Kirkuk Field Case Study and Simulation. In Proceedings of the 2017 International Conference on Environmental Impacts of the Oil and Gas Industries: Kurdistan Region of Iraq as a Case Study (EIOGI); IEEE: Piscataway, NJ, USA, 2017; pp. 5–8. [Google Scholar]
- Naji, S.Z.; Abd, A.A. Sensitivity Analysis of Using Diethanolamine Instead of Methyldiethanolamine Solution for GASCO’S Habshan Acid Gases Removal Plant. Front. Energy 2019, 13, 317–324. [Google Scholar] [CrossRef] [Scilit]
- Ferreira, A.F.B.; Da Silva, J.A.P.; Da Silva, M.R.; De Matos, O.B.; de Souza Freitas Filho, A.; Dantas, B.C.; Oliveira, K.B.; Amorim, N.d.S. Absorption of the Acid Gases CO2 and H2S from a Natural Gas Stream Using the Aspen Plus® Simulator. Obs. Econ. Latinoam. 2024, 22, e3113. [Google Scholar] [CrossRef] [Scilit]
- Darani, N.S.; Behbahani, R.M.; Shahebrahimi, Y.; Asadi, A.; Mohammadi, A.H. Simulation and Optimization of the Acid Gas Absorption Process by an Aqueous Diethanolamine Solution in a Natural Gas Sweetening Unit. ACS Omega 2021, 6, 12072–12080. [Google Scholar] [CrossRef] [Scilit] [PubMed]
- Babakhani Samani, M.H.; Toghraie, D.; Mehmandoust, B.; Niknejadi, M.; Fazilati, M.A. Investigating the Effect of Absorbent Material and Heat Flux in Natural Gas Sweetening Process Using Molecular Dynamics Simulation. Case Stud. Therm. Eng. 2024, 61, 105081. [Google Scholar] [CrossRef] [Scilit]
- Ferrari, N.; Mancuso, L.; Davison, J.; Chiesa, P.; Martelli, E.; Romano, M.C. Oxy-Turbine for Power Plant with CO2 Capture. Energy Procedia 2017, 114, 471–480. [Google Scholar] [CrossRef] [Scilit]
- NTE INEN 2489; Gas Natural—Requisitos en Ecuador, Primera Revisión. INEN: Quito, Ecuador, 2019.
- Mohamadi-Baghmolaei, M.; Hajizadeh, A.; Zahedizadeh, P.; Azin, R.; Zendehboudi, S. Evaluation of Hybridized Performance of Amine Scrubbing Plant Based on Exergy, Energy, Environmental, and Economic Prospects: A Gas Sweetening Plant Case Study. Energy 2021, 214, 118715. [Google Scholar] [CrossRef] [Scilit]
- Young, A.F.; Villardi, H.G.D.; Araujo, L.S.; Raptopoulos, L.S.C.; Dutra, M.S. Detailed Design and Economic Evaluation of a Cryogenic Air Separation Unit with Recent Literature Solutions. Ind. Eng. Chem. Res. 2021, 60, 14830–14844. [Google Scholar] [CrossRef] [Scilit]
- Brigagão, G.V.; de Medeiros, J.L.; Araújo, O.d.Q.F. A Novel Cryogenic Vapor-Recompression Air Separation Unit Integrated to Oxyfuel Combined-Cycle Gas-to-Wire Plant with Carbon Dioxide Enhanced Oil Recovery: Energy and Economic Assessments. Energy Convers. Manag. 2019, 189, 202–214. [Google Scholar] [CrossRef] [Scilit]
- Hanak, D.P.; Powell, D.; Manovic, V. Techno-Economic Analysis of Oxy-Combustion Coal-Fired Power Plant with Cryogenic Oxygen Storage. Appl. Energy 2017, 191, 193–203. [Google Scholar] [CrossRef] [Scilit]
- Yadav, S.; Mondal, S.S. A Review on the Progress and Prospects of Oxy-Fuel Carbon Capture and Sequestration (CCS) Technology. Fuel 2022, 308, 122057. [Google Scholar] [CrossRef] [Scilit]
- Akrami, E.; Ameri, M.; Rocco, M.V. Integration of Biomass-Fueled Power Plant and MCFC-Cryogenic CO2 Separation Unit for Low-Carbon Power Production: Thermodynamic and Exergoeconomic Comparative Analysis. Energy Convers. Manag. 2020, 223, 113304. [Google Scholar] [CrossRef] [Scilit]
- Dwiyantoro, B.A.; Wattimena, J.G.J.; Kurniawan, H. A Techno-Economic Feasibility and Performance Analysis of the CO2 Capture Process Using Supersonic Separator and Methyldiethanolamine Sweetening. Eng. Technol. Appl. Sci. Res. 2025, 15, 25864–25871. [Google Scholar] [CrossRef] [Scilit]
- Tafone, A.; Dal Magro, F.; Romagnoli, A. Integrating an Oxygen Enriched Waste to Energy Plant with Cryogenic Engines and Air Separation Unit: Technical, Economic and Environmental Analysis. Appl. Energy 2018, 231, 423–432. [Google Scholar] [CrossRef] [Scilit]
- Bhattacharyya, S.C. Energy Data and Energy Balance. In Energy Economics; Springer: London, UK, 2019; pp. 7–40. [Google Scholar]
- Bhattacharyya, S.C. Energy Access Programmes and Sustainable Development: A Critical Review and Analysis. Energy Sustain. Dev. 2012, 16, 260–271. [Google Scholar] [CrossRef] [Scilit]
- Eletta, O.A.A.; Awotoye, D.T.; Zubairu, A.A. Investigation of Alkanol-Amine Solvents and Their Blends for CO2 Removal from Natural Gas Using Aspen-Hysys. Niger. J. Technol. Dev. 2022, 18, 268–278. [Google Scholar] [CrossRef] [Scilit]
- Soo, X.Y.D.; Lee, J.J.C.; Wu, W.-Y.; Tao, L.; Wang, C.; Zhu, Q.; Bu, J. Advancements in CO2 Capture by Absorption and Adsorption: A Comprehensive Review. J. CO2 Util. 2024, 81, 102727. [Google Scholar] [CrossRef] [Scilit]
- Leiva, C.A.; Poblete, D.A.; Aguilera, T.L.; Acuña, C.A.; Quintero, F.J. Air Separation Units (ASUs) Simulation Using Aspen Hysys at Oxinor I of Air Liquid Chile S.A Plant. Pol. J. Chem. Technol. 2020, 22, 10–17. [Google Scholar] [CrossRef] [Scilit]
- Mletzko, J.; Ehlers, S.; Kather, A. Comparison of Natural Gas Combined Cycle Power Plants with Post Combustion and Oxyfuel Technology at Different CO2 Capture Rates. Energy Procedia 2016, 86, 2–11. [Google Scholar] [CrossRef] [Scilit]
- Dincer, I.; Bicer, Y. Energy, Environment and Sustainable Development. In Integrated Energy Systems for Multigeneration; Elsevier: Amsterdam, The Netherlands, 2020; pp. 1–31. [Google Scholar]
- Dincer, I. The Role of Exergy in Energy Policy Making. Energy Policy 2002, 30, 137–149. [Google Scholar] [CrossRef] [Scilit]
- Strömberg, L.; Lindgren, G.; Jacoby, J.; Giering, R.; Anheden, M.; Burchhardt, U.; Altmann, H.; Kluger, F.; Stamatelopoulos, G.-N. Update on Vattenfall’s 30 MWth Oxyfuel Pilot Plant in Schwarze Pumpe. Energy Procedia 2009, 1, 581–589. [Google Scholar] [CrossRef] [Scilit]
- Liu, Z.; Zhang, T. Pilot and Industrial Demonstration of Oxy-Fuel Combustion. In Oxy-Fuel Combustion; Elsevier: Amsterdam, The Netherlands, 2018; pp. 209–222. [Google Scholar]
- Buhre, B.J.P.; Elliott, L.K.; Sheng, C.D.; Gupta, R.P.; Wall, T.F. Oxy-Fuel Combustion Technology for Coal-Fired Power Generation. Prog. Energy Combust. Sci. 2005, 31, 283–307. [Google Scholar] [CrossRef] [Scilit]
- White, V.; Wright, A.; Tappe, S.; Yan, J. The Air Products Vattenfall Oxyfuel CO2 Compression and Purification Pilot Plant at Schwarze Pumpe. Energy Procedia 2013, 37, 1490–1499. [Google Scholar] [CrossRef] [Scilit]
- Gonzalo, C. Calculation and Simulation Data for Modular Oxy-Combustion and Carbon Capture in Associated Petroleum Gas Valorization [Data Set]. Zenodo. 2026. Available online: https://zenodo.org/records/18806107 (accessed on 8 February 2025). [CrossRef]



| Country/Region | Status | Refs. |
|---|---|---|
| Norway/UK | Near-zero routine flaring, “best practice” benchmark | [6] |
| Saudi Arabia | Master Gas System saves 4.2 billion scf/day from flaring, ~80 Mt CO2/year avoided [historic] | [6,21] |
| Qatar/Oman/UAE | Practices aligned with World Bank GGFR; lower regional flaring than Iran/Iraq | [22,23] |
| Russia | Top flarer; 95% APG-utilization rule on paper, but persistent large flaring | [24,25] |
| USA | Top flarer; flaring cuts would cover only 0.1% of the NDC target; emissions up to 15× higher than the inventory | [25,26] |
| Iran | 17.4 billion m3/year flared (3rd globally, 2021); flaring reduction could meet 34–95% of its NDC target | [25,27,28] |
| Iraq | 4th largest flarer; weak laws and conflict hinder implementation; flaring cuts could meet 136% of its NDC target | [22,23,29] |
| Yemen | ~40% of APG is wasted annually; infrastructure and policy gaps | [29] |
| Year | Oil Production (kbbl/Day) | Gas Flared (Million m3/Year) | Flaring Intensity (m3/bbl) |
|---|---|---|---|
| 2015 | 80,630 | 145,639 | 4.95 |
| 2018 | 82,833 | 145,000 | 4.80 |
| 2022 | 80,547 | 138,539 | 4.71 |
| 2024 | 81,825 | 150,999 | 5.06 |
| Technology | Net Power (MWe) | CO2 Captured (kg/MWh) | Efficiency (LHV Based %) | Efficiency Reduction Due to Capture % |
|---|---|---|---|---|
| NGCC reference | 904 | - | 58.8 | - |
| SCOC-CC | 757 | 377 | 49.3 | 9.5 |
| NET Power | 846 | 336 | 55.1 | 3.7 |
| S-Graz Modified | 756 | 375 | 49.2 | 9.6 |
| CES Supercritical | 751 | 379 | 18.9 | 9.9 |
| Subsystem | Technology Maturity | Typical Scale | Energy Penalty/Efficiency Impact | Economic Implication (Qualitative) | Notes |
|---|---|---|---|---|---|
| DEA gas sweetening | Commercial (TRL 9) | 1–50 MMscfd | Moderate auxiliary energy demand | Increases CAPEX/OPEX but avoids corrosion, downtime, and safety risks | Standard upstream practice for sour APG [65] |
| Cryogenic ASU | Commercial (TRL 8–9) | 100–300 MWe O2 demand | Largest parasitic load (≈40–55% of auxiliaries) | Dominant cost driver in OXC systems | Cost sensitive to O2 purity and integration [66,67] |
| Oxy-combustion turbine | Demonstration–early commercial (TRL 6–7) | 100–300 MWe | Higher efficiency than air-fired with CCS | Enables near-total CO2 capture | Limited commercial references [68,69] |
| HRSG + steam bottoming cycle | Commercial (TRL 9) | Utility scale | +5–10% net efficiency gain | Improves energy recovery and economics | Well-established technology [68,70] |
| CO2 compression & liquefaction | Commercial (TRL 8–9) | ≥1 MtCO2/year | Significant electric demand | Cost depends on capture rate and pressure | Required for transport/storage [67,69] |
| Modular integration | Emerging | Containerized units | Reduces infrastructure losses | Lowers upfront investment and deployment risk | Key advantage for remote fields [71,72] |
| Block | Volume (MSCFD) | LHV (BTU/lbm) | Mf CH4 (-) | Score |
|---|---|---|---|---|
| Weight | 0.40 | 0.30 | 0.30 | 10.0 |
| B18 | 6240.96 | 18,707 | 0.043 | 2.96 |
| B12 | 4381.15 | 18,168 | 0.247 | 2.13 |
| B43 | 2053.74 | 19,298 | 0.558 | 5.43 |
| B56 | 1003.30 | 19,171 | 0.401 | 4.55 |
| B60 | 18,696.64 | 19,369 | 0.297 | 6.56 |
| B61 | 9806.84 | 19,314 | 0.562 | 6.29 |
| B07 | 704.70 | 18,330 | 0.473 | 2.79 |
| B15 | 3459.79 | 19,085 | 0.389 | 4.58 |
| B57 | 29,240.52 | 19,466 | 0.383 | 8.15 |
| Compound | DEA Inlet Xi | APG Inlet Yi | APG Outlet Yi |
|---|---|---|---|
| N2 | - | 0.032 | 0.042 |
| CO2 | 0.002 | 0.185 | 0.017 |
| CH4 | - | 0.385 | 0.503 |
| C2H6 | - | 0.078 | 0.102 |
| C3H8 | - | 0.129 | 0.169 |
| iC4H10 | - | 0.031 | 0.040 |
| nC4H10 | - | 0.061 | 0.079 |
| iC5H12 | - | 0.022 | 0.028 |
| nC5H12 | - | 0.012 | 0.015 |
| nC6H14 | - | 0.003 | 0.004 |
| nC7H14 | - | 0.000 | 0.001 |
| H2O | 0.648 | 0.060 | 0.001 |
| H2S | - | 0.002 | 0.000 |
| DEA | 0.35 | - | - |
| Compound | Yi High-Pressure Distillation | Yi Low-Pressure Distillation | ||||
|---|---|---|---|---|---|---|
| Inlet | Outlet N2 Rich | Outlet O2 Rich | Inlet | Outlet N2 Rich | Outlet O2 Rich | |
| N2 | 0.78 | 0.94 | 0.58 | 0.58 | 0.99 | 0.00 |
| O2 | 0.21 | 0.06 | 0.41 | 0.41 | 0.00 | 0.97 |
| Ar | 0.01 | 0.00 | 0.00 | 0.01 | 0.00 | 0.03 |
| Compound | APG Inlet | Oxygen Inlet | CO2 Recirculation | Flue Gas |
|---|---|---|---|---|
| N2 | 0.042 | - | - | 0 |
| CO2 | 0.017 | - | 1 | 0.75 |
| CH4 | 0.503 | - | - | - |
| C2H6 | 0.102 | - | - | - |
| C3H8 | 0.169 | - | - | - |
| iC4H10 | 0.04 | - | - | - |
| nC4H10 | 0.079 | - | - | - |
| iC5H12 | 0.028 | - | - | - |
| nC5H12 | 0.015 | - | - | - |
| nC7H14 | 0.004 | - | - | - |
| iC7H14 | 0.001 | - | - | - |
| H2O | 0.001 | - | - | 0.13 |
| O2 | - | 0.967 | - | 0.10 |
| Ar | - | 0.033 | - | 0.01 |
| Scenario | CH4 (Yi) | CO2 (Yi) | Yi × LHV | Efficiency |
|---|---|---|---|---|
| 1 | 0.70 | 0.30 | 561,763.3 | 0.28 |
| 2 | 0.75 | 0.25 | 601,889.25 | 0.30 |
| 3 | 0.80 | 0.20 | 642,015.2 | 0.32 |
| 4 | 0.85 | 0.15 | 682,141.15 | 0.34 |
| 5 | 0.90 | 0.10 | 722,267.1 | 0.36 |
| 6 | 0.95 | 0.05 | 762,393.05 | 0.38 |
| Component | LHV [kJ/kmol] | kmol O2/Kmolfuel | Consume ASU (kWh/kmol Fuel) | Efficiency (%) |
|---|---|---|---|---|
| Methane | 802,519 | 2.0 | 24.84 | 0.38 |
| Ethane | 1,430,000 | 3.5 | 43.47 | 0.33 |
| Propane | 2,040,000 | 5.0 | 62.10 | 0.28 |
| i-butane | 2,650,000 | 6.5 | 80.73 | 0.24 |
| n-butane | 2,660,000 | 6.5 | 80.73 | 0.24 |
| i-pentane | 3,270,000 | 8.0 | 99.36 | 0.19 |
| n-pentane | 3,270,000 | 8.0 | 99.36 | 0.19 |
| Hexane+ | 3,890,000 | 9.5 | 117.99 | 0.14 |
| Heptane+ | 4,500,000 | 11.0 | 136.62 | 0.10 |
| Subsystem | CAPEX | OPEX | Economic Role |
|---|---|---|---|
| DEA sweetening | Moderate | Moderate (solvent, heat) | Enables equipment protection and fuel quality |
| Cryogenic ASU | High | High (electricity) | Primary cost and efficiency driver |
| Oxy-combustion turbine | High | Moderate | Enables near-zero-emission power generation |
| HRSG + steam cycle | Moderate | Low | Improves net efficiency, offsets penalties |
| CO2 compression & storage | High | Moderate–High | Required for deep decarbonization |
| Modular integration | Low–Moderate | Low | Reduces infrastructure CAPEX and deployment risk |
Disclaimer/Publisher’s Note: The statements, opinions and data contained in all publications are solely those of the individual author(s) and contributor(s) and not of MDPI and/or the editor(s). MDPI and/or the editor(s) disclaim responsibility for any injury to people or property resulting from any ideas, methods, instructions or products referred to in the content. |
© 2026 by the authors. Licensee MDPI, Basel, Switzerland. This article is an open access article distributed under the terms and conditions of the Creative Commons Attribution (CC BY) license.
Share and Cite
Chiriboga, G.; Núñez, B.; Montero-Calderón, C.; Gutiérrez, C.; Almeida, C.; Vega, M.A.; Carvajal-Chávez, G. Decentralized Valorization of Associated Petroleum Gas via Modular Oxy-Combustion and Carbon Capture: A Scalable Strategy for Global Flaring Reduction. Energies 2026, 19, 1949. https://doi.org/10.3390/en19081949
Chiriboga G, Núñez B, Montero-Calderón C, Gutiérrez C, Almeida C, Vega MA, Carvajal-Chávez G. Decentralized Valorization of Associated Petroleum Gas via Modular Oxy-Combustion and Carbon Capture: A Scalable Strategy for Global Flaring Reduction. Energies. 2026; 19(8):1949. https://doi.org/10.3390/en19081949
Chicago/Turabian StyleChiriboga, Gonzalo, Brandon Núñez, Carolina Montero-Calderón, Christian Gutiérrez, Carlos Almeida, Michael A. Vega, and Ghem Carvajal-Chávez. 2026. "Decentralized Valorization of Associated Petroleum Gas via Modular Oxy-Combustion and Carbon Capture: A Scalable Strategy for Global Flaring Reduction" Energies 19, no. 8: 1949. https://doi.org/10.3390/en19081949
APA StyleChiriboga, G., Núñez, B., Montero-Calderón, C., Gutiérrez, C., Almeida, C., Vega, M. A., & Carvajal-Chávez, G. (2026). Decentralized Valorization of Associated Petroleum Gas via Modular Oxy-Combustion and Carbon Capture: A Scalable Strategy for Global Flaring Reduction. Energies, 19(8), 1949. https://doi.org/10.3390/en19081949