


Abstract
Non-Intrusive Load Monitoring (NILM) enables appliance-level classification from aggregate electrical measurements and supports efficient energy management in smart buildings. However, the accuracy of existing NILM methods is often limited by the inability of conventional feature extraction techniques to capture nonlinear steady-state behavior. This study proposes a novel feature extraction framework for appliance classification, which integrates phase-space reconstruction (PSR) with 2-D Fourier series to derive geometry-based descriptors of appliance current waveforms. Unlike traditional signal-processing methods, the proposed approach utilizes the nonlinear geometric structure revealed by PSR and encodes it through Fourier descriptors, offering a discriminative, low-dimensional feature space suitable for classification using supervised machine learning algorithms. The method is evaluated on the high-resolution controlled single-appliance recordings from the COOLL dataset using the K-Nearest Neighbor (KNN) classifier. Extension to aggregated multi-appliance NILM scenarios would require additional stages such as event detection and load separation. Sensitivity analysis demonstrates that classification performance depends strongly on the choice of time delay and harmonic order, with optimal settings yielding an accuracy of up to 99.52% using KNN. The results confirm that larger time delays and a small number of harmonics effectively capture appliance-specific signatures. The findings highlight the effectiveness of PSR–Fourier-based geometric features as a robust alternative to conventional NILM feature extraction strategies.
1. Introduction
Non-Intrusive Load Monitoring (NILM) technology has emerged as a crucial tool in managing energy consumption without the need for installing dedicated sensors on individual appliances. By analyzing the aggregated electrical signal from a single measurement point, NILM enables the monitoring of appliance-level energy usage in residential, commercial, and industrial settings, facilitating improved energy efficiency, demand-side management, and reduced wastage [1]. The concept was first introduced by George W. Hart in the 1980s [2], who demonstrated that variations in aggregate current and voltage could be used to infer the operational states of individual household loads.
One of the main challenges of NILM lies in extracting distinctive appliance signatures from aggregated power signals to enable accurate classification. The quality of the extracted load signatures directly determines the performance of appliance classification. To address this challenge, a wide range of feature extraction techniques have been developed, which broadly fall into two categories: traditional signal-processing-based methods and more recent data-driven deep learning approaches [3,4]. In this study, therefore the emphasis is placed on developing an effective feature extraction method for reliable appliance classification.
Signal-processing-based NILM systems derive discriminative characteristics from appliances by transforming aggregated voltage and current signals into informative representations in the time/frequency domains. The extracted features are then classified using optimization algorithms or machine learning methods. These approaches rely on the assumption that each appliance exhibits a distinctive electrical signature characterized by parameters such as active/reactive power, harmonic content, voltage–current (V–I) trajectory, or transient behavior [5,6].
Previous studies have explored statistical and harmonic feature extraction to characterize steady-state load behavior. Chowdhury et al. [7] extracted statistical descriptors such as mean, variance, skewness, and kurtosis from current envelopes and demonstrated that simple time-domain features could yield competitive results when combined with machine learning classifiers like K-Nearest Neighbors (KNNs), Support Vector Machines (SVMs), or Decision Trees (DTs). Using the Controlled On/Off Loads Library (COOLL) dataset with multiple appliance types, KNNs achieved the highest classification accuracy of 98.41%, highlighting its effectiveness for low-complexity NILM applications. Similarly, Jiang et al. [8] utilized steady-state current waveform features such as crest factor, form factor, and harmonic distortion for appliance classification, achieving reliable performance with minimal computational cost. Gray and Morsy [9] analyzed harmonic power features of current signals to detect appliance events and classify multi-state devices. Their approach decomposed aggregate signals into harmonic spectra and used selected harmonic orders as discriminative features. However, as different appliances produce harmonic distortions at varying frequency ranges, the relevant harmonic frequency ranges had to be manually tuned for each device, limiting generalizability across diverse household loads.
Subsequent research explored wavelet-based and hybrid feature extraction techniques to jointly capture steady-state and transient behavior. Himeur et al. [10] applied Discrete Wavelet Transform (DWT) to transient current signals and demonstrated that wavelet coefficients could serve as distinctive signatures for different load types. Ancelmo et al. [11] further employed a multi-scale wavelet packet tree combined with an ensemble bagging tree classifier, achieving robust event recognition in noisy environments. Reddy et al. [12] utilized Prony’s method to extract both steady-state and transient features, effectively modeling dynamic load responses with high temporal resolution. Hybrid approaches that combine information from multiple domains have also shown strong performance. Drouaz et al. [13] developed a feature fusion framework integrating steady-state and transient descriptors, yielding 9–15% higher classification accuracy than single-domain methods using KNN and Random Forest classifiers. Lu et al. [14] extracted time–frequency features using the Stockwell transform, achieving classification rates of 99.52% and 96.92% on the COOLL and HELD1 datasets, respectively. While highly effective for feature extraction, these methods required manual calibration of parameters for each dataset and do not capture nonlinear load behavior.
While signal-processing-based feature extraction techniques have achieved substantial success in NILM, they still face some challenges. The most important challenge is their limited ability to capture nonlinear temporal dependencies, as classical transforms (e.g., Fourier, wavelet, and Stockwell) are inherently linear and cannot fully describe the time-varying dynamics of modern nonlinear loads. Consequently, such handcrafted descriptors often overlook temporal correlations between voltage and current changes, leading to degraded classification performance when appliances exhibit nonlinear characteristics.
This limitation has motivated researchers to explore techniques that capture nonlinear dynamical representations. In this regard, trajectory-based and phase-oriented feature extraction has emerged as a powerful and physically interpretable approach for NILM. These methods exploit the geometric relationship between voltage and current waveforms, where the V–I trajectory encodes both the linear and nonlinear behavior of electrical loads [15,16]. Liu et al. [17] introduced binary V–I trajectory mapping, representing current–voltage loops as binary images whose shapes capture load types such as resistive, inductive, and nonlinear. Although computationally efficient, this method relied on handcrafted descriptors. Building upon this concept, Mulinari et al. [18] employed transfer learning on V–I trajectory images, achieving 98% classification accuracy across datasets and demonstrating that trajectory-based features generalize well across datasets. Mulinari et al. [19] later proposed a combined steady-state and transient V–I trajectory feature set, emphasizing that geometric variations in the trajectory during switching events could significantly enhance classification. Extending this concept, Himeur et al. [20] reported that representing V–I trajectory contours using 2-dimensional (2-D) Fourier descriptors achieved good classification performance with reduced memory usage and execution time. Their evaluation under different noise levels further showed that limiting the number of harmonics improves robustness, as the truncated Fourier representation attenuates high-frequency distortions. These results indicate that spectral contour encoding provides a compact and structured alternative to pixel-based trajectory images, preserving the essential geometric characteristics of the trajectory while reducing dimensionality and sensitivity to noise. Stanescu et al. [21] presented a 2-D phase encoding of power signals, achieving over 98% accuracy on multiple public datasets, while Cavalca et al. [22] demonstrated through phase diagram analysis that appliances trace distinct nonlinear trajectories in phase space. Despite these advances, the potential of phase-space-based and reconstructed trajectory analysis in NILM remains largely underexplored.
In recent years, deep learning (DL) particularly convolutional neural networks (CNNs) has been increasingly applied to NILM due to its ability to automatically learn hierarchical features from 2-D representations such as V–I trajectories, spectrograms, and phase-space diagrams. Several studies have demonstrated CNN-based models achieving state-of-the-art performance for appliance recognition [23,24,25,26,27]. For instance, Yu et al. [26] proposed a Mel spectrogram-based CNN framework for lightweight appliance classification. Likewise, Ghosh et al. [27] introduced a multi-timescale shapelet-based feature extraction approach, which learns discriminative temporal patterns directly from current waveforms and achieved high accuracy on the COOLL dataset. Similarly, a recent study has shown that deep networks can utilize phase-space reconstruction (PSR) to learn nonlinear relationships directly from reconstructed trajectories [28]. However, despite their high accuracy, deep learning models remain computationally expensive, requiring substantial training data, high-end hardware, and significant training time. They are also prone to overfitting when data are limited and often lack interpretability, making them less practical for lightweight NILM.
Table 1 summarizes the previously discussed studies in terms of feature type, signal modality, time-domain state, computational complexity, and implementation characteristics. As shown, existing approaches typically rely on one or more of the following: (i) transient-based analysis (ii) V–I trajectory representations, (iii) image-based encoding combined with deep learning models, or (iv) multi-stage preprocessing pipelines that increase computational complexity. Although PSR has been applied for appliance classification [28], it has primarily been used to generate image-based representations processed using CNNs. Furthermore, Fourier-based contour encoding has been applied to V–I trajectories [20], but not in combination with PSR applied directly to steady-state current signals. To the best of the authors’ knowledge, no prior NILM study has applied PSR directly to steady-state current signals with 2-D Fourier contour encoding for appliance classification. While PSR has been explored in other domains, such as biomedical signal analysis [29,30], its integration with Fourier-based geometric modeling for steady-state appliance classification has not been investigated.
Table 1.
Comparative summary of NILM feature extraction approaches.
Motivated by these observations, the present work proposes a PSR–Fourier descriptor–based feature extraction method, followed by appliance classification using the KNN algorithm. The method utilizes the geometric properties of PSR trajectories to capture the temporal and geometric structure of an appliance’s current signals and encodes them compactly using 2-D Fourier series. This integrated representation combines the strengths of both techniques: PSR provides a nonlinear state-space representation of steady-state current behavior, while Fourier descriptors offer a structured contour-based encoding. By generating PSR contours at multiple time delays, the method captures delay-induced geometric variations that enhance separability in the feature space. The resulting Fourier descriptors form a compact and discriminative representation suitable for traditional classifiers such as KNNs.
The main contributions of this work are as follows:
- A feature extraction framework for appliance classification within the NILM context is introduced, which applies PSR to steady-state current cycles and encodes the resulting trajectories using low-order 2-D Fourier descriptors. PSR captures the nonlinear geometric structure of the current signal, while Fourier encoding provides a compact, low-dimensional representation of the reconstructed contours. Their integration enhances class separability and enables efficient classification without the need for deep learning models or extensive preprocessing.
- Extensive experiments are conducted on the high-frequency COOLL dataset (100 kHz) under controlled single-appliance switching conditions. A detailed sensitivity analysis of key parameters including time delay, harmonic count, and neighborhood size demonstrates that the proposed PSR–Fourier feature extraction framework produces highly separable feature spaces with minimal computational cost.
The remainder of this paper is organized as follows. Section 2 describes the proposed PSR–Fourier-based NILM methodology, including dataset preprocessing, phase-space reconstruction, Fourier descriptor feature extraction, and classification. Section 3 presents the simulation results, including sensitivity analysis of key parameters and comparison with existing NILM approaches. Finally, Section 4 concludes the paper by summarizing the main findings and outlining future research directions.
2. Proposed Methodology
This study explores the use of PSR as a feature extraction technique for appliance classification, by integrating it with 2-D Fourier series to characterize steady-state current waveforms. PSR is advantageous because it reveals underlying temporal relationships within steady-state current waveforms that are not typically evident in conventional time- or frequency-domain analyses. By transforming a one-dimensional current time series into a two-dimensional trajectory, PSR highlights the nonlinear structure and temporal dependencies present in the signal. Moreover, by varying the time-delay parameter, PSR generates multiple contour representations for each appliance, offering complementary views of its steady-state behavior and enhancing the distinctiveness of its load signature. The proposed framework therefore evaluates how effectively the combined PSR–Fourier approach captures the underlying temporal and geometric characteristics of steady-state current signals and enhances class separability.
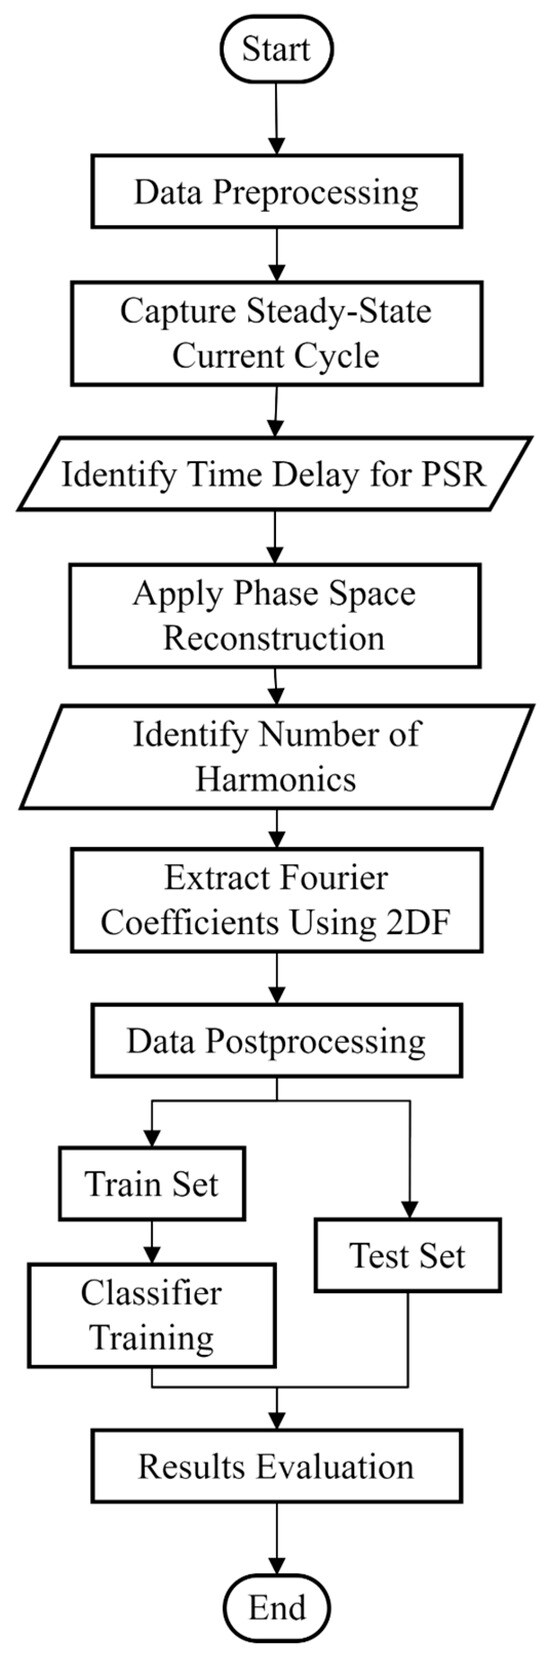
Figure 1 illustrates the workflow adopted in this research. The process begins with dataset preprocessing, during which current waveforms are refined to extract a clean, steady-state cycle for each switching event. This cycle is then passed through the PSR module, where different time delays are applied to generate distinct two-dimensional contour patterns. The contours are subsequently analyzed using the 2-D Fourier (2DF) stage to obtain a set of Fourier coefficients that describe the geometric structure of the PSR trajectory for use in load classification. Following feature extraction, a postprocessing step normalizes the features and prepares the dataset for classification using the KNN classifier. The final stage evaluates the effectiveness of the proposed PSR–Fourier feature extraction approach using standard performance metrics.
Figure 1.
Architecture of the proposed PSR–Fourier feature extraction and classification framework.
2.1. Dataset Description and Data Preprocessing
This study uses the COOLL dataset, which provides high-resolution current and voltage measurements recorded at 100 kHz [31]. The dataset consists of 6 s voltage and current waveforms collected from 42 appliances of 12 distinct types. Each appliance is recorded under 20 controlled switching events, meaning that only one appliance is active during each recording. This controlled single-appliance configuration allows precise extraction of steady-state operating segments without requiring an event detection stage. A complete list of the appliances used in the study, adapted from the COOLL dataset description [32], is presented in Table 2.
Table 2.
COOLL dataset appliances [32].
In the context of present work, data preprocessing is performed to prepare the current signal for feature extraction using PSR and 2DF. The preprocessing involves extracting a single, steady-state current cycle following the appliance turn-on event. The exact appliance switching-on instant is determined using parameters provided in the dataset: the pre-turn-on delay (), the zero-cross detection delay () and the action delay (). The dataset specifies a pre-turn-on delay, , of 1 s, during which the appliance remains off before the turn-on event. After this period, the system checks for the first zero crossing of the voltage waveform, introducing a small random delay, , less than one 50 Hz mains cycle (20 ms). Following this detection, the system waits for an additional action delay, , which specifies how long after the zero crossing the appliance is turned on.
Given these parameters, the switching-on time is calculated as follows:
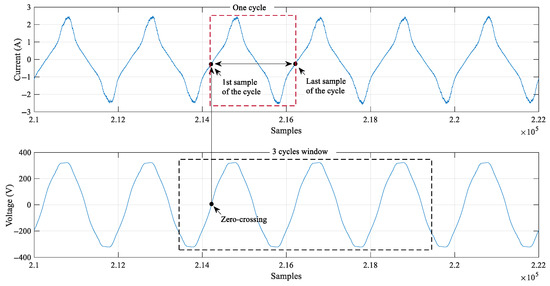
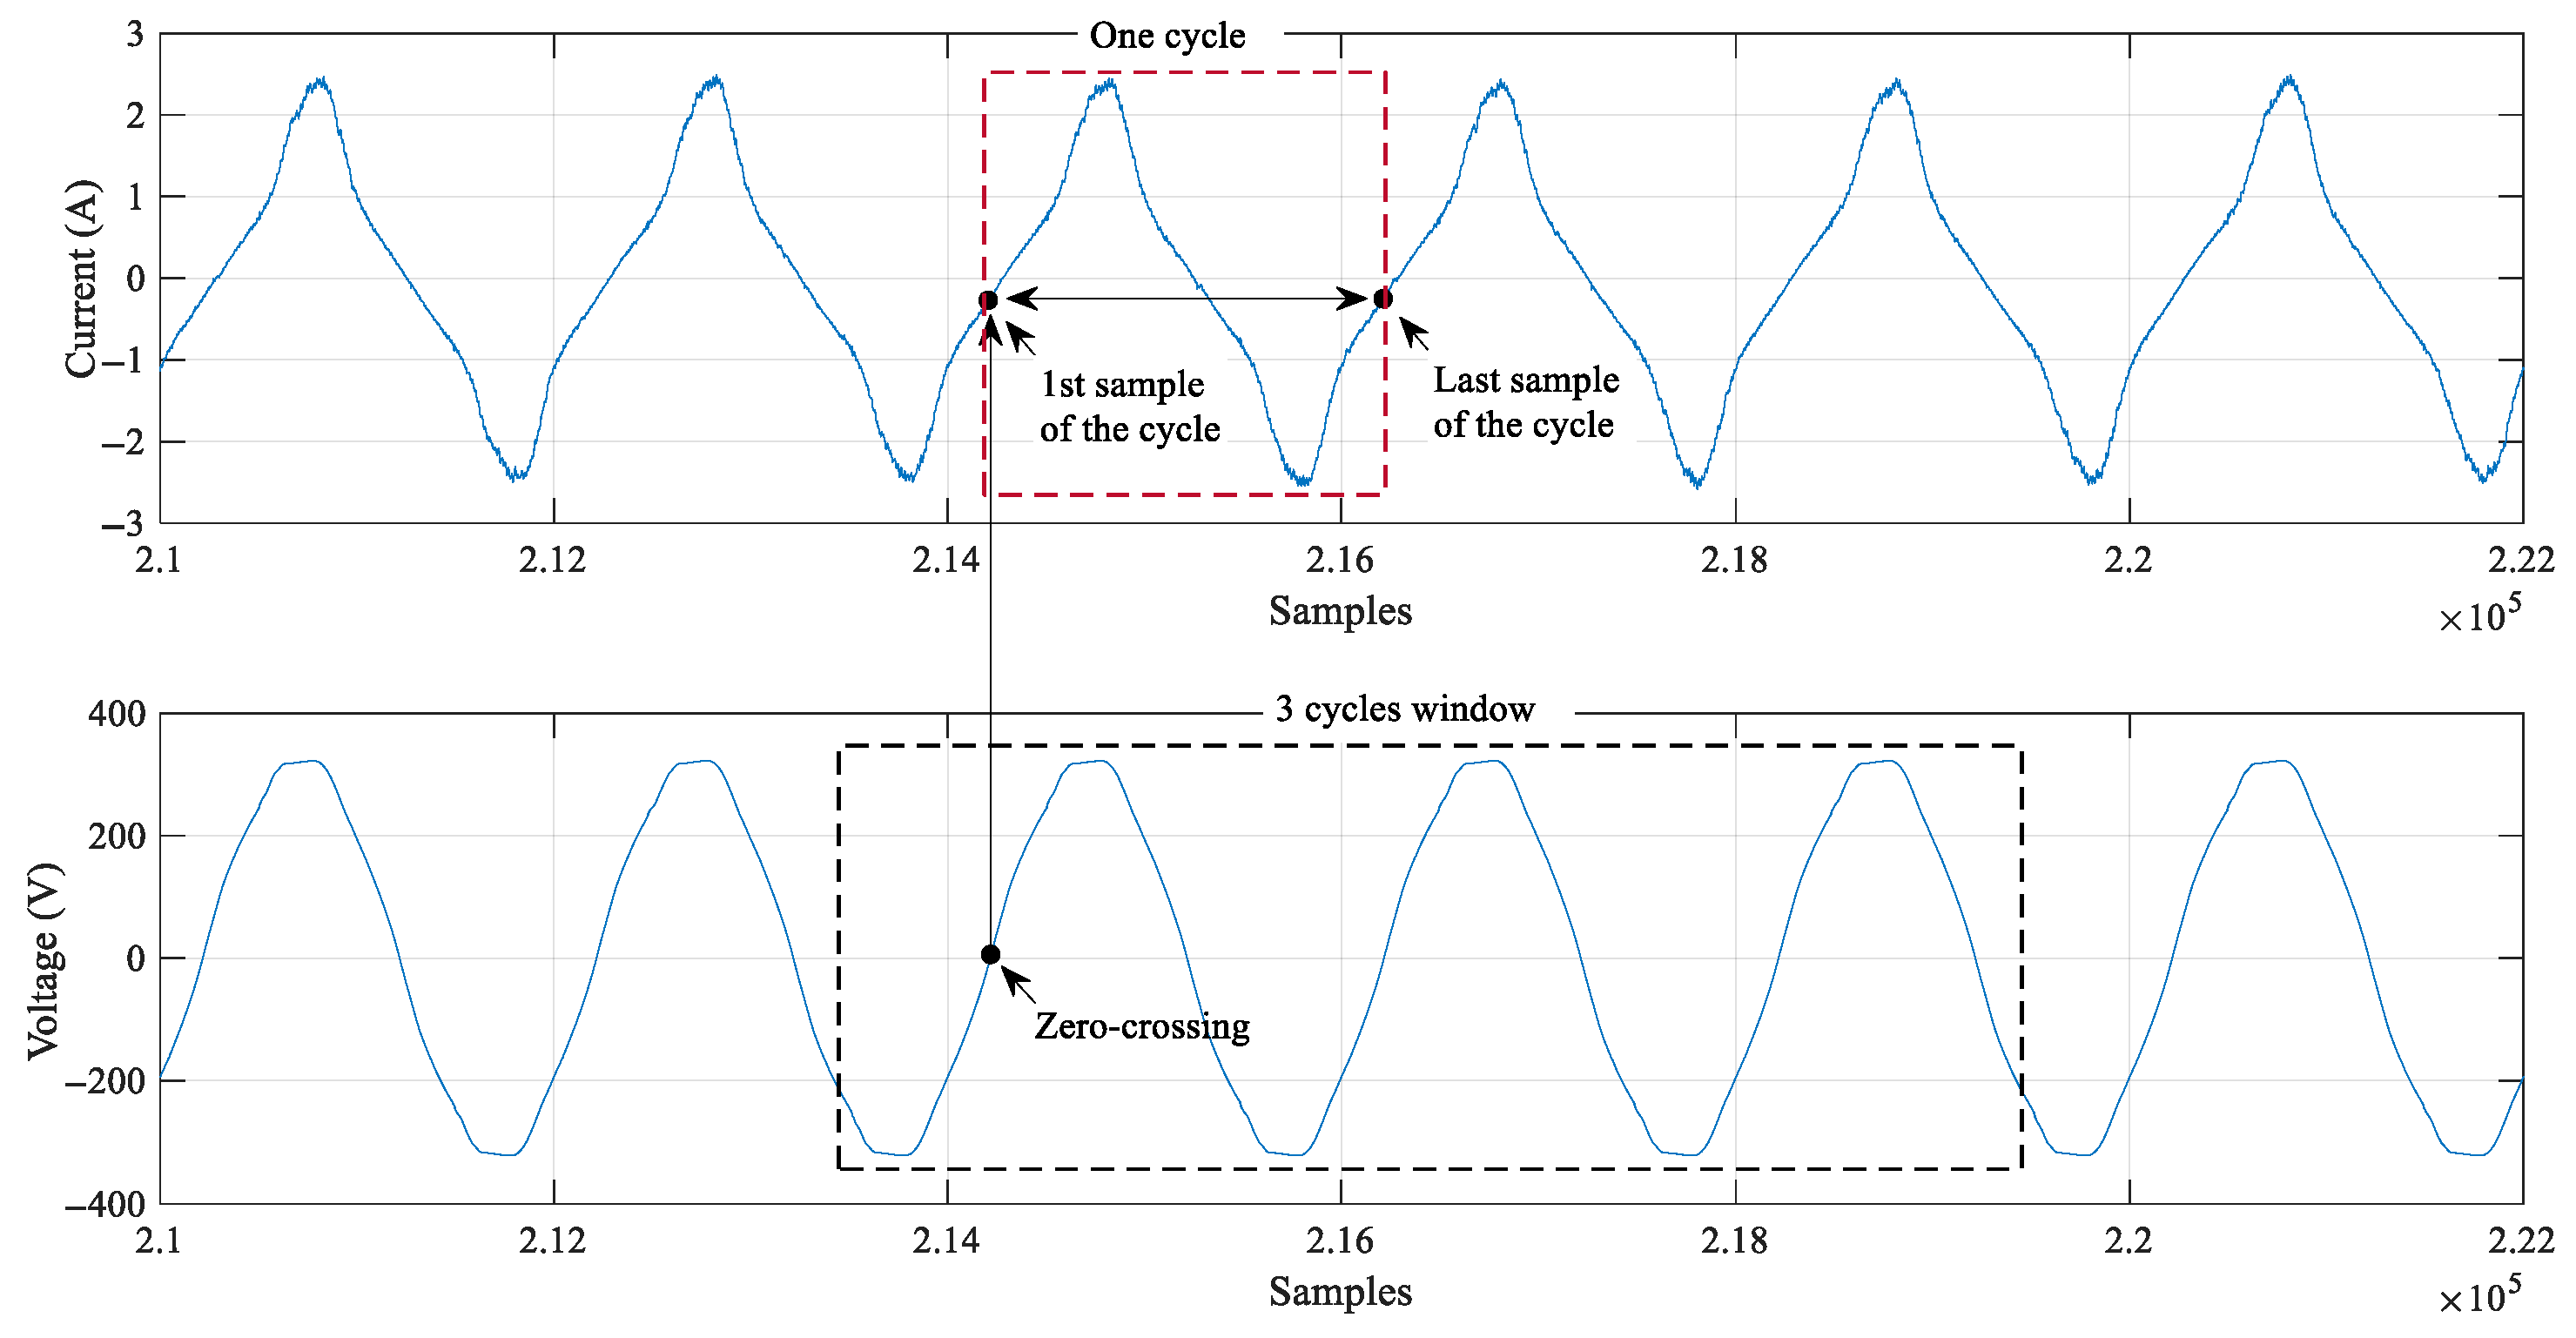
To exclude transient effects, only the steady-state portion of each signal starting approximately one second after the appliance’s switching-on instant, , is analyzed. Within this window, the voltage waveform is examined to identify the next zero crossing, which serves as the reference point for extracting one full steady-state current cycle. The extraction process is illustrated in Figure 2.
Figure 2.
Extraction of one cycle from the current waveform after the turn-on event.
It is important to note that the COOLL dataset used here was recorded under controlled laboratory conditions, where external noise and grid disturbances are limited. In practical deployments, measurement noise may influence the reconstructed PSR trajectories, as phase-space representations can be sensitive to signal perturbations. To address this, standard preprocessing techniques such as low-pass filtering, wavelet-based denoising, or adaptive smoothing can be applied prior to PSR construction. The proposed framework is compatible with such preprocessing steps and can be extended to noisier operating environments.
2.2. Phase-Space Reconstruction (PSR)
The phase-space reconstruction method embeds a signal’s information into a multidimensional phase space for classification and pattern recognition tasks. Although the present study focuses on steady-state current cycles, many of the considered appliances, particularly motor-driven tools and vacuum cleaners, exhibit nonlinear electrical behavior, primarily due to motor dynamics and commutation effects. These mechanisms introduce harmonic distortion and waveform asymmetry, causing the steady-state current to deviate from a purely linear or sinusoidal form. When reconstructed in phase space, these nonlinear characteristics produce distinctive geometric signatures that facilitate effective discrimination and modeling of nonlinear load behaviors [33]. Supported by Takens’ Theorem, PSR guarantees that the reconstructed dynamics remain topologically identical to the true dynamics of the system when appropriate embedding parameters are used [34]. In this work, the PSR method is applied using the standard time-delay embedding approach to generate discriminative geometric patterns that serve as useful features for appliance classification.
Let a univariate time-series current signal of length be represented as . Using the time-delay embedding method, the signal is mapped into a dimensional phase space, , by generating delayed copies of the signal. The reconstructed vector, is defined as follows:
Here, denotes the time delay (number of delayed samples) and is the embedding dimension. denotes the number of valid phase points given by . Appropriate selection of these parameters ensures that the reconstructed phase space preserves the essential temporal dependencies and geometric structure of the signal.
The trajectory matrix for PSR is constructed by combining these reconstructed vectors as follows:
For NILM applications, previous studies have shown that = 2 provides sufficiently distinctive geometric representations for steady-state appliance signatures [28]. Accordingly, the present work adopts = 2 to construct 2-D PSR trajectories. The motivation for selecting = 2 is to ensure compatibility with the adopted 2-D Fourier descriptor, which operates on planar contours. Increasing the embedding dimension to ≥ 3 would produce higher-dimensional phase-space trajectories (e.g., 3-D or 4-D), which would require multi-dimensional shape descriptors and introduce additional computational complexity. Within this 2-D framework, the time delay, , is varied to generate multiple PSR representations per appliance. This approach enriches the geometric information extracted from the steady-state current waveform [28]. The motivation for generating multiple PSRs is to capture a broader range of the dynamical characteristics present in the load signature, as different delay values emphasize different aspects of the signal’s temporal structure. These additional representations contribute to a more discriminative feature set for classification.
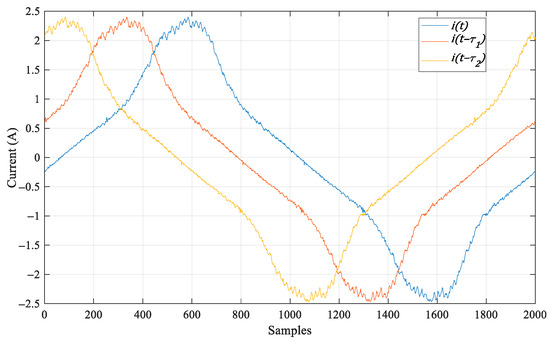
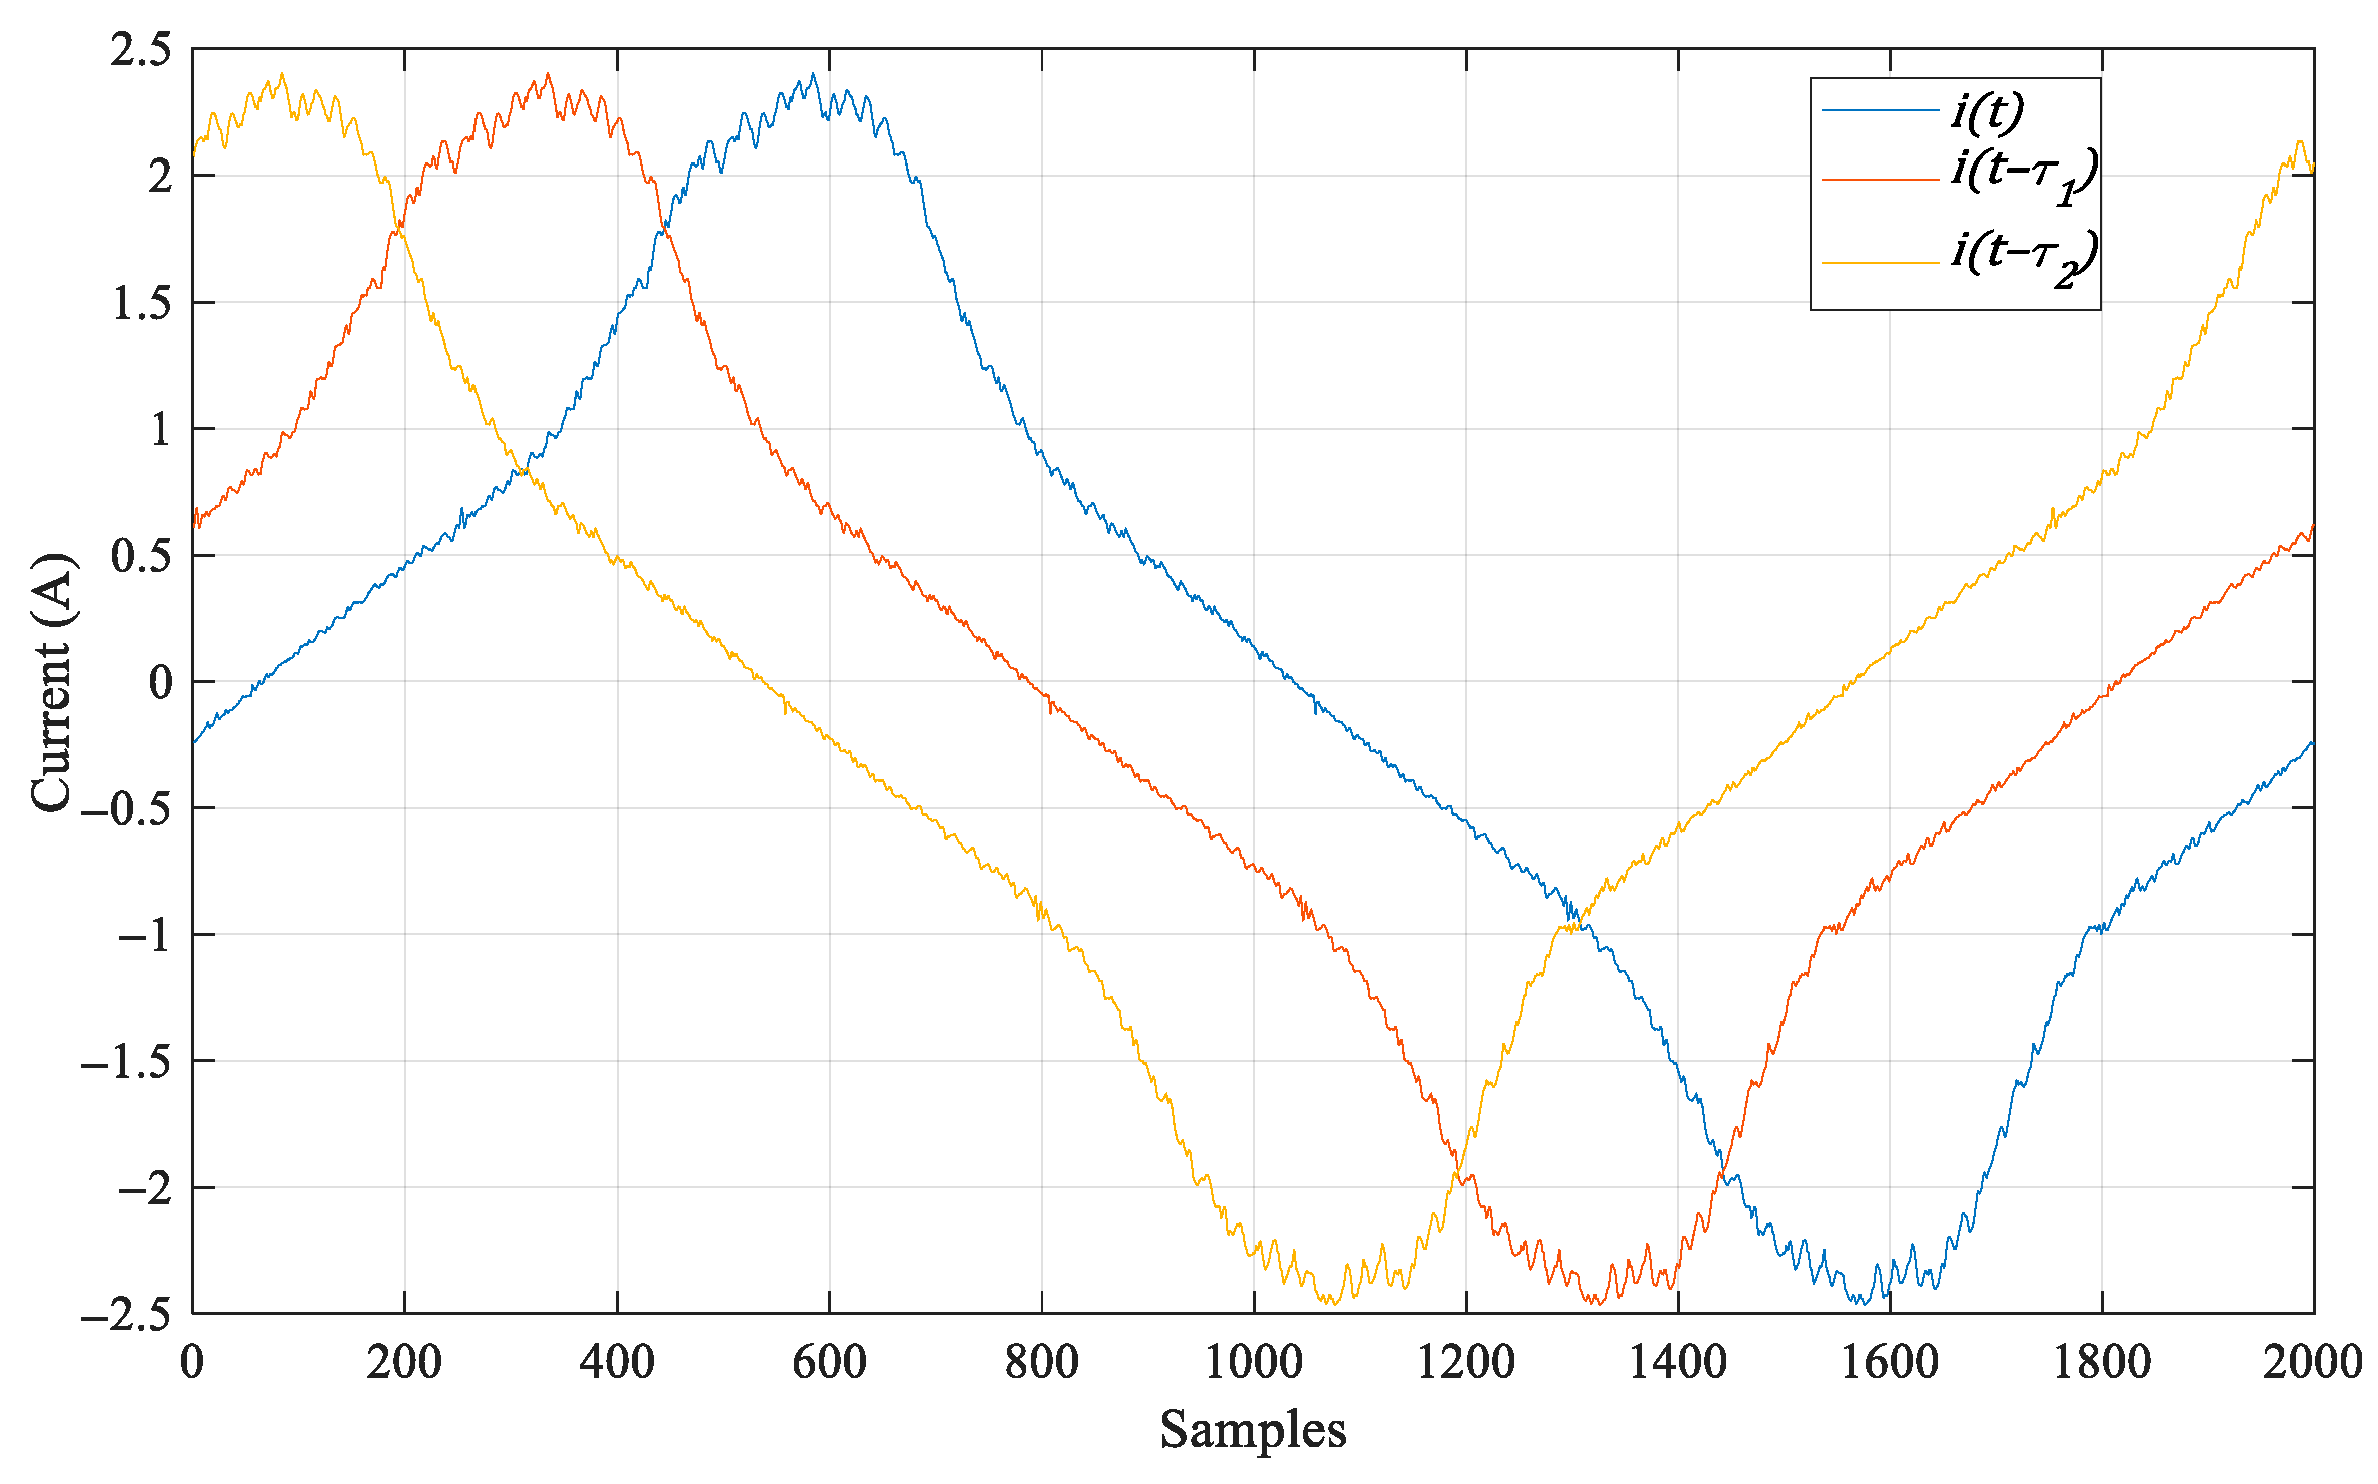
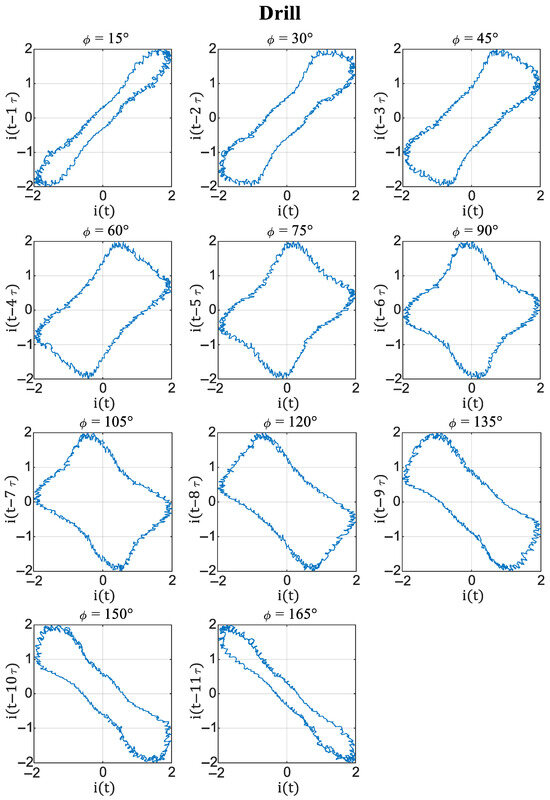
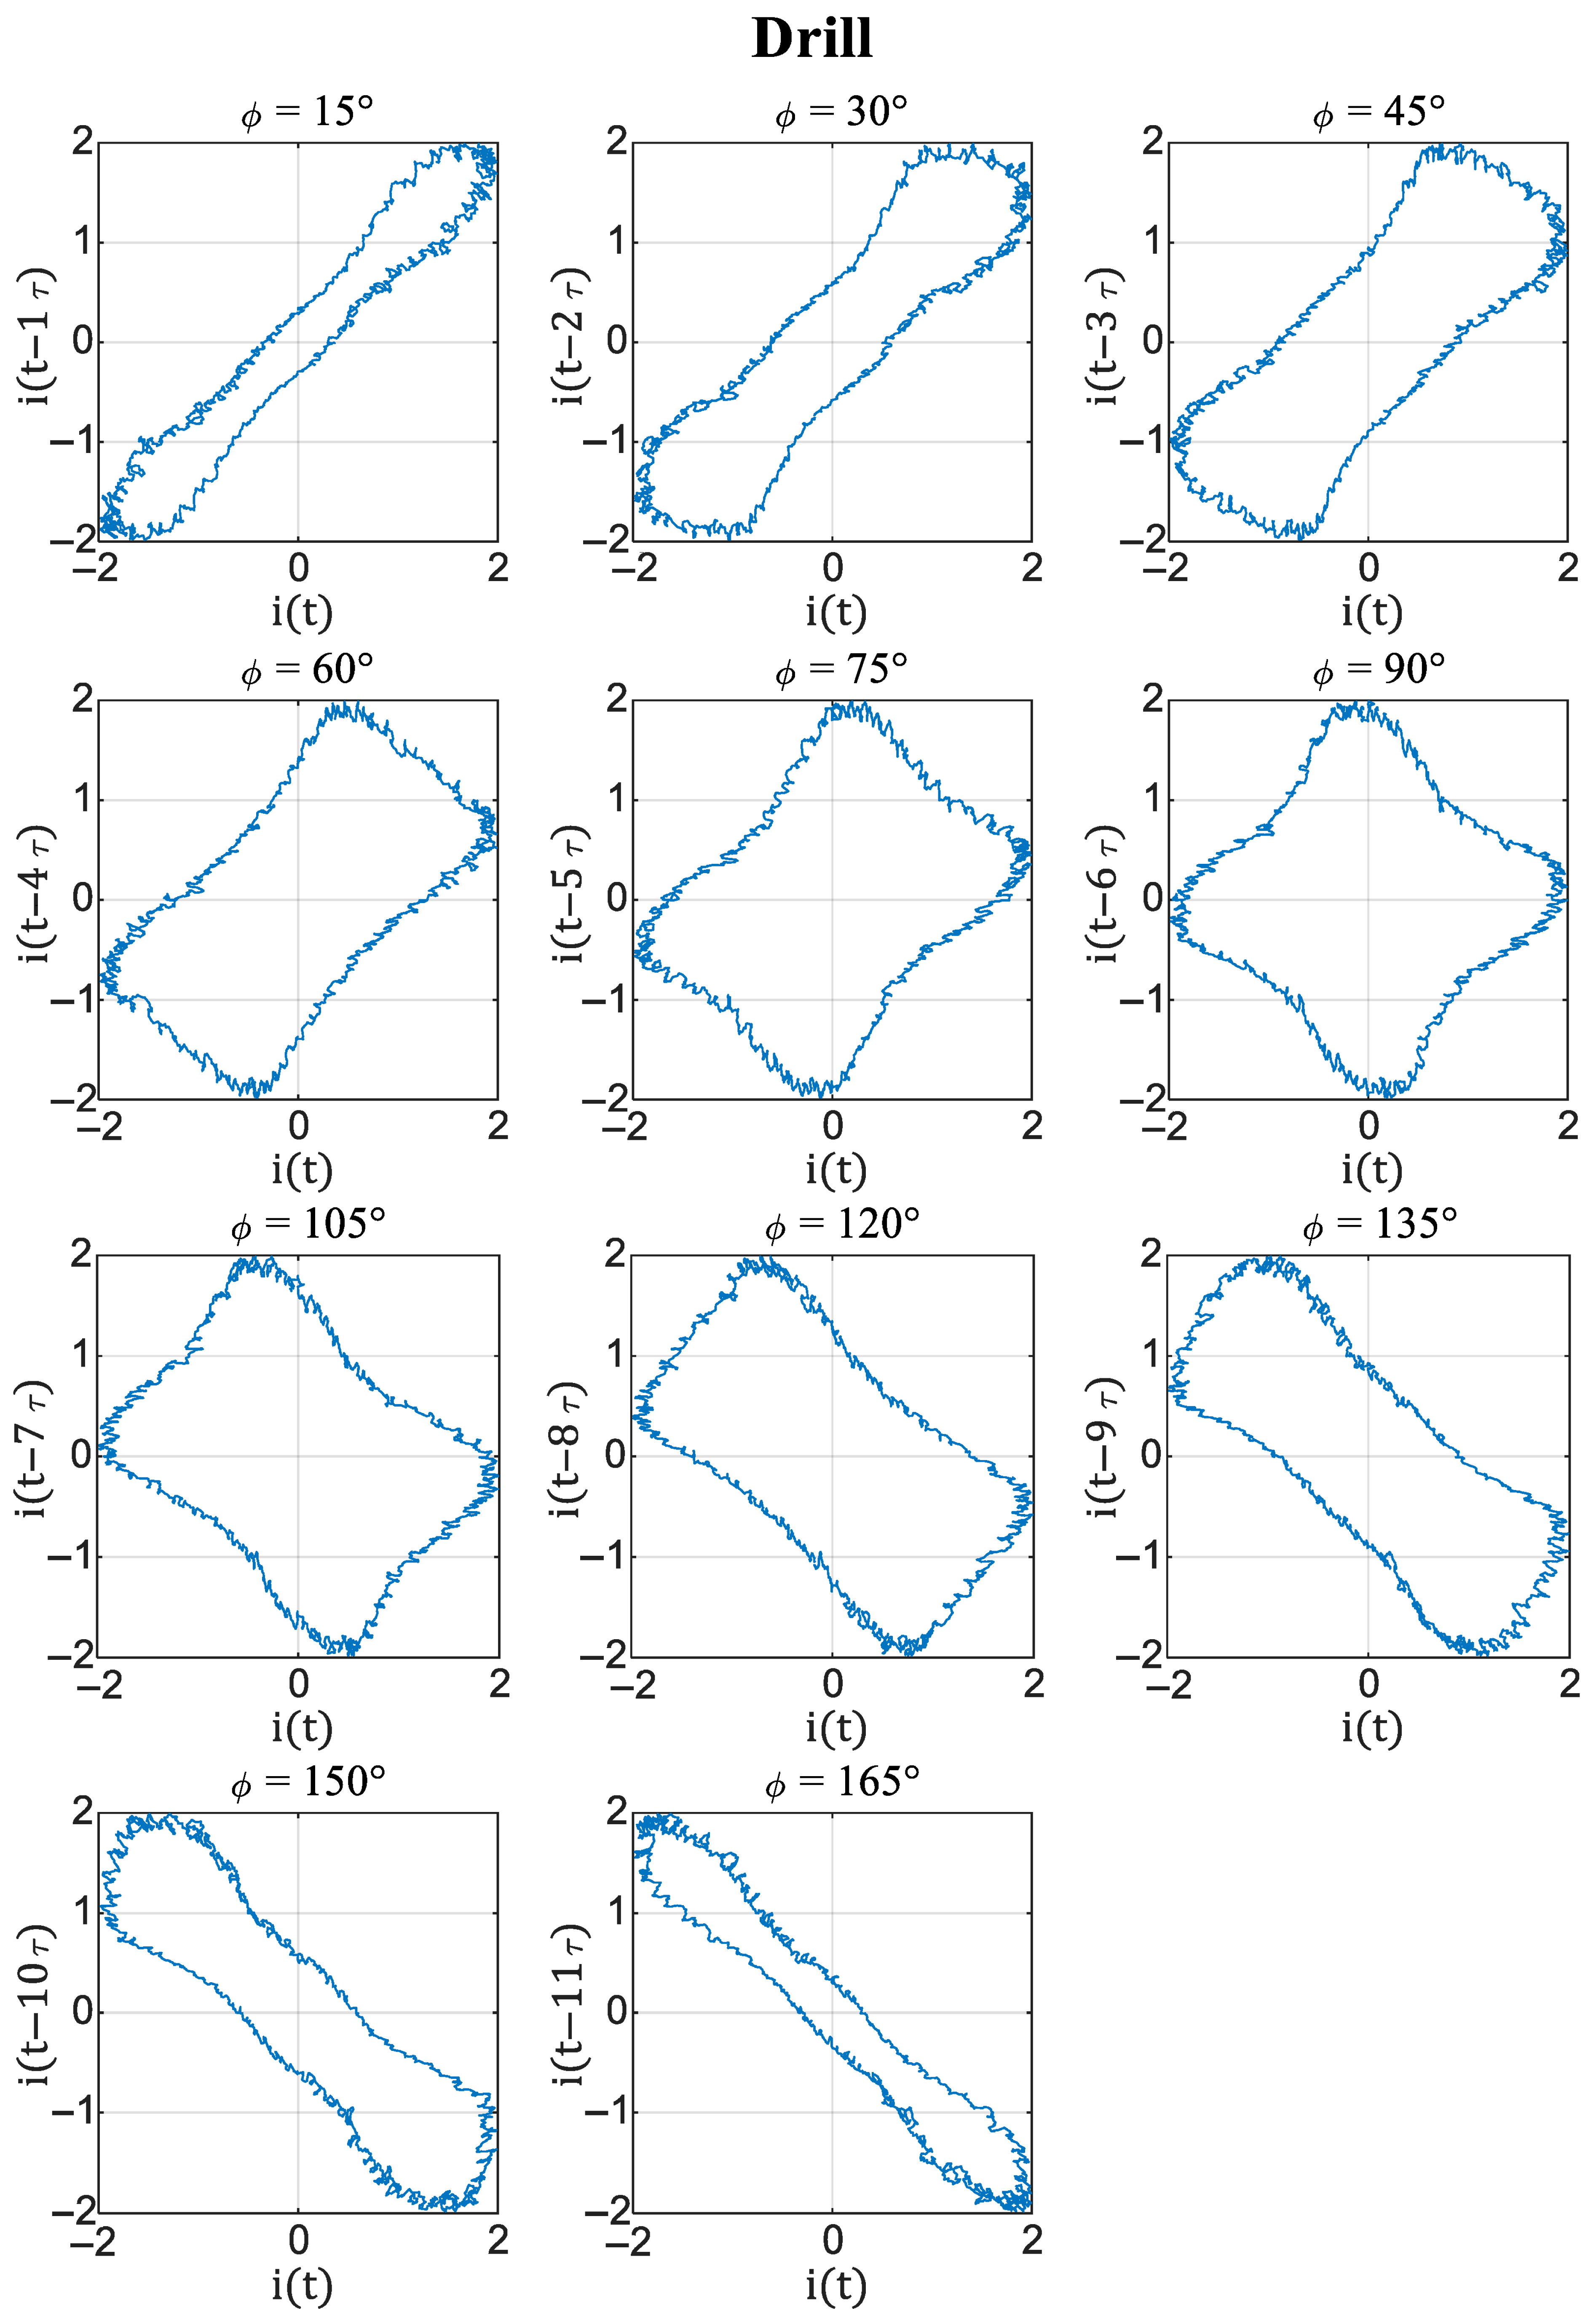
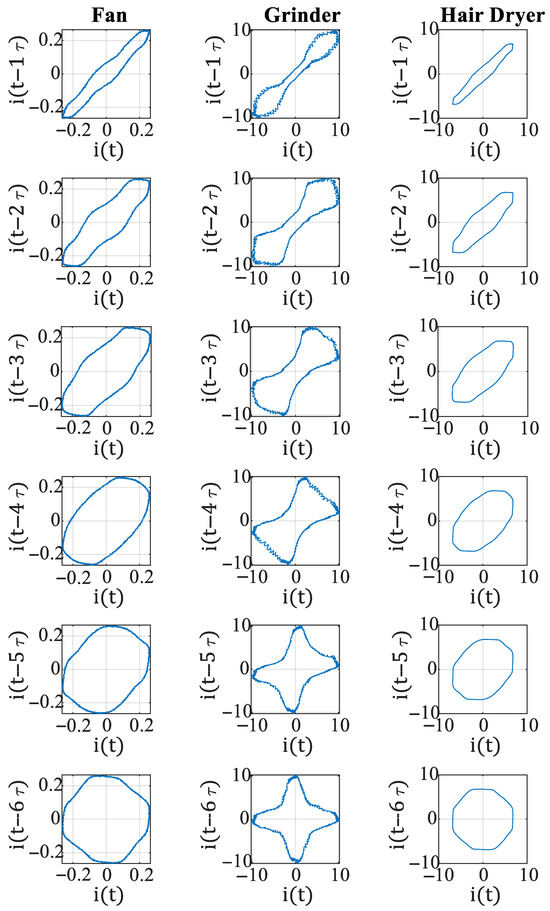
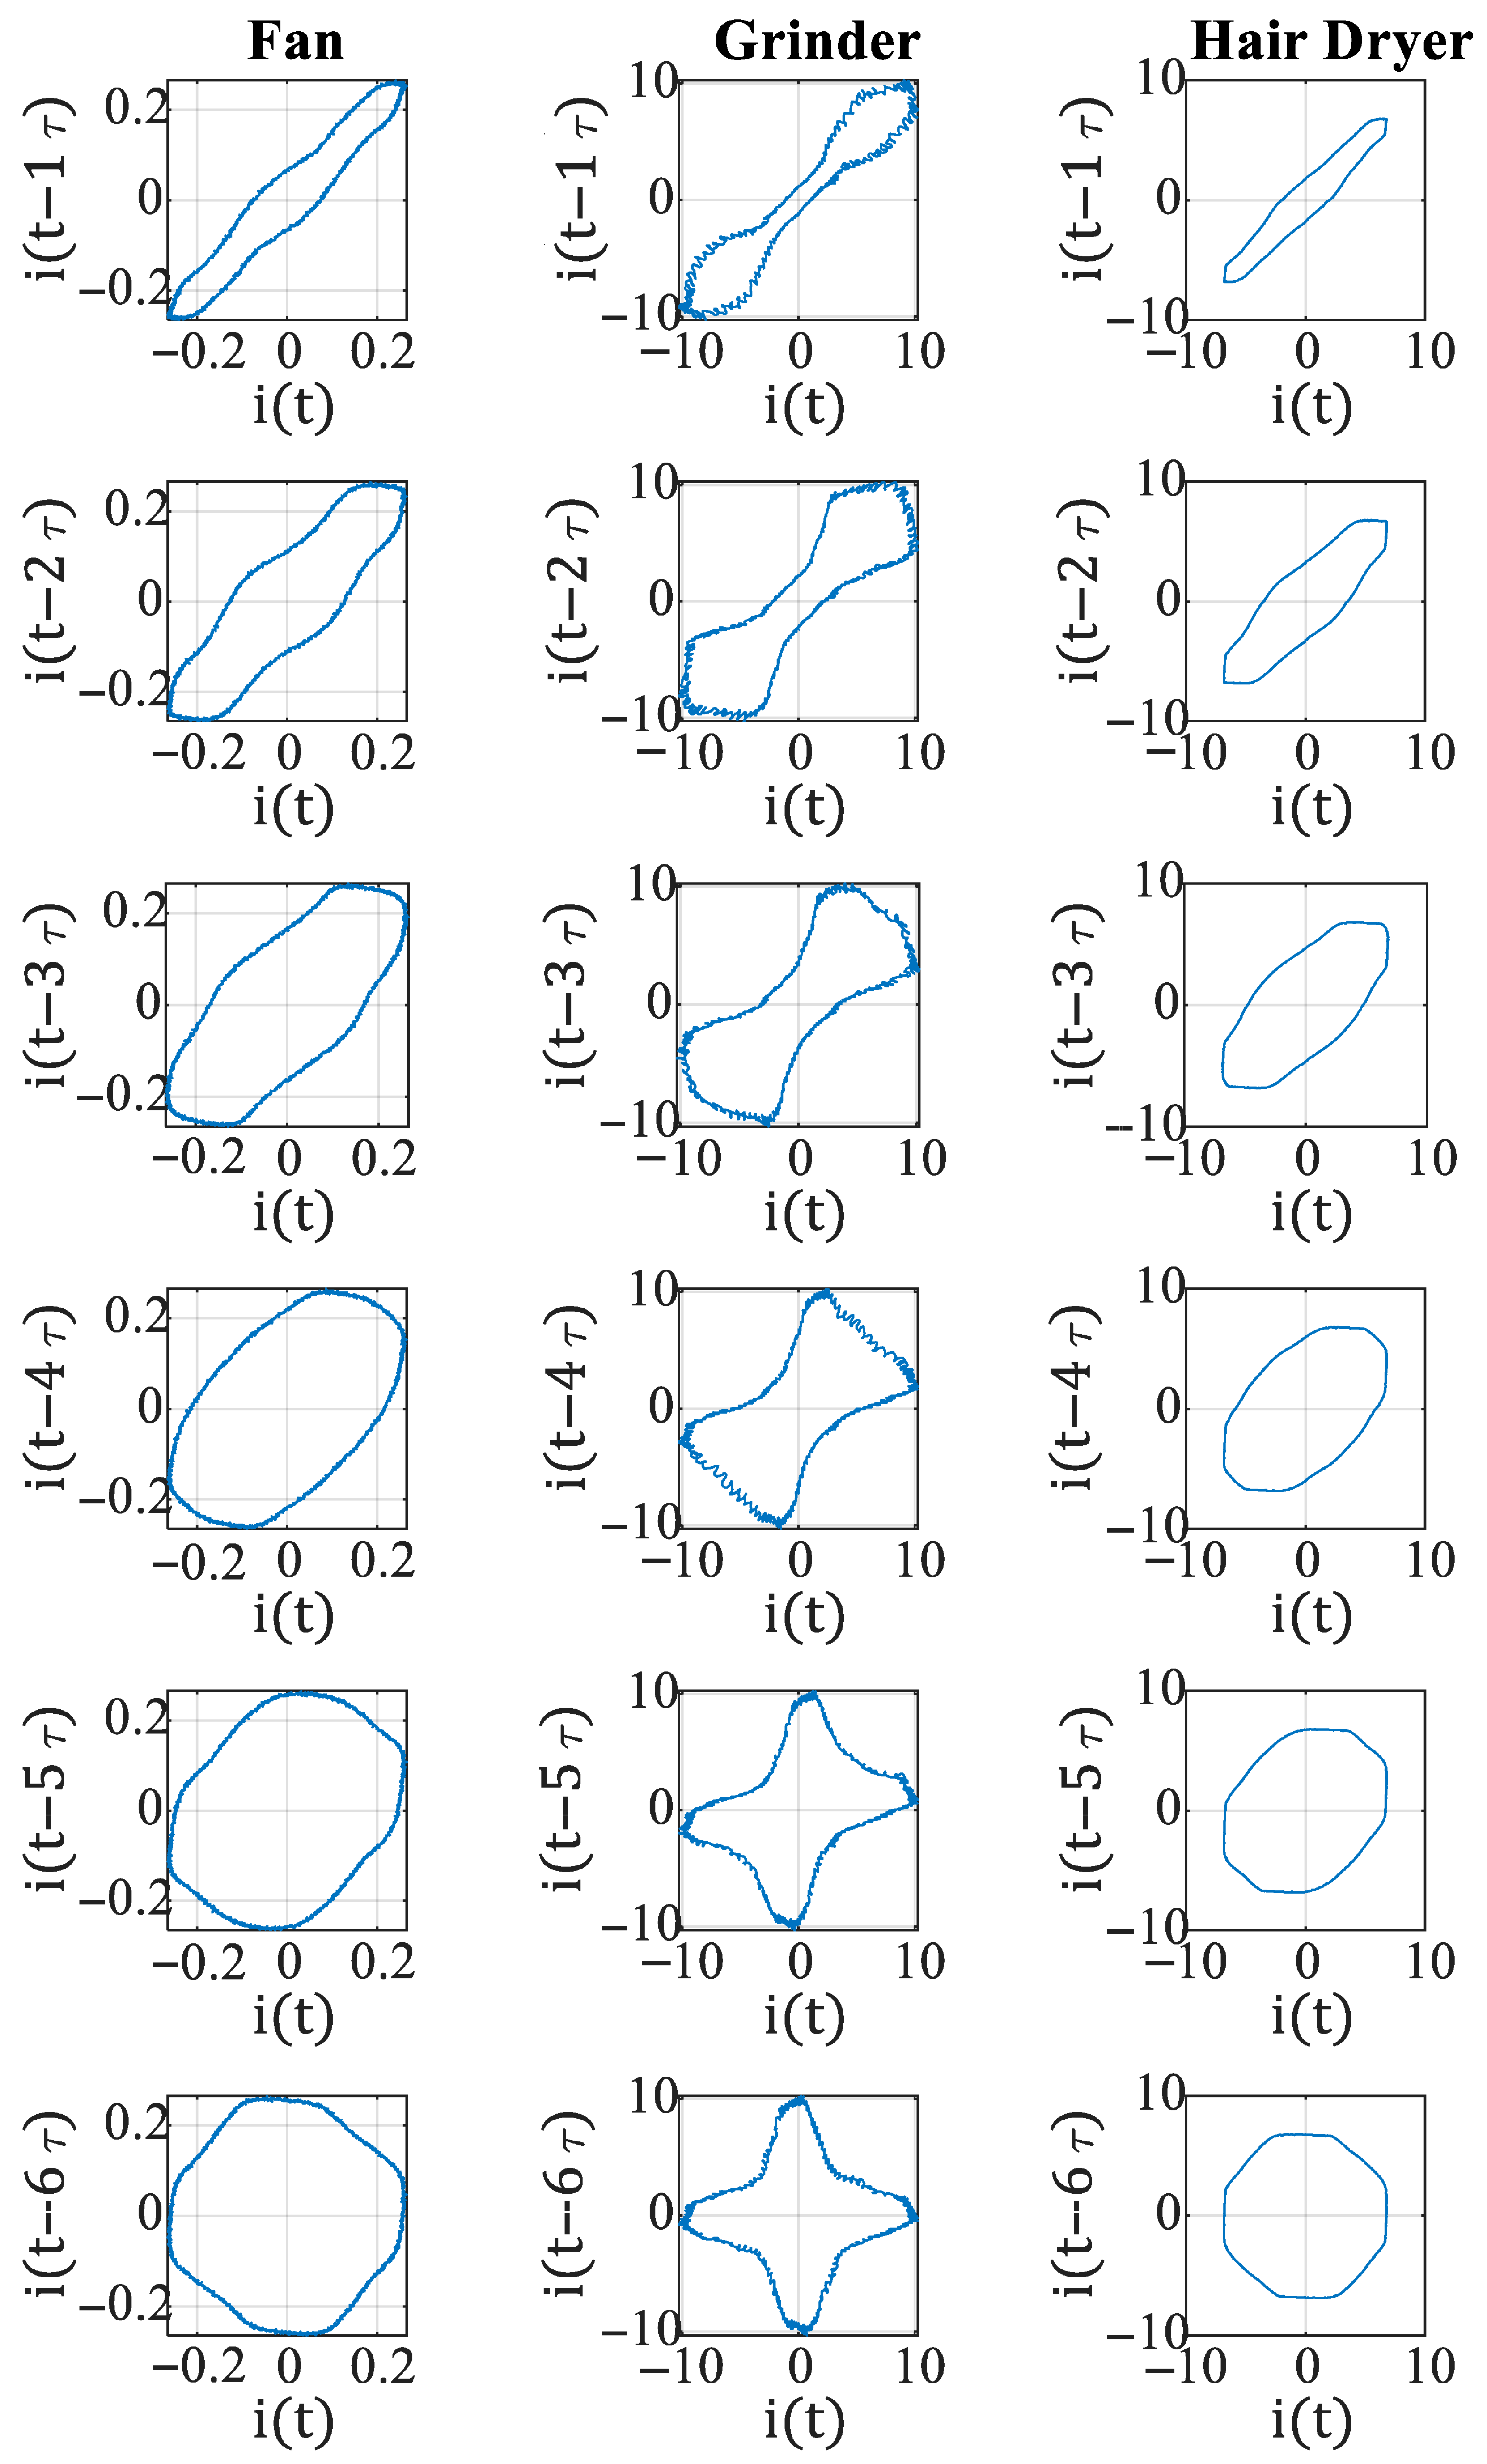
Figure 3 illustrates the steady-state current signal of a drill in the COOLL dataset, along with its time-delayed versions for two selected delays and . These time-shifted signals are used to construct the phase-space vectors that form the foundation of PSR. The corresponding PSR trajectories for a sequence of delays are shown in Figure 4. For visualization, each delay is expressed in the figure as an equivalent phase shift , where larger values correspond to a greater displacement of the waveform within its cycle. Since the current cycle consists of 2000 samples, setting a delay of 500 samples induces a 90-degree phase shift in the signal. It can be seen in Figure 4 that the PSR diagrams begin to repeat in the other orientation after a 90-degree phase shift. This variation demonstrates that different delays extract different dynamical structures from the same signal. Consequently, the proposed method evaluates delay values up to 1000 samples (≈180° shift) to identify the delay that yields the most discriminative representation. The selected optimal delay is then used for final feature extraction and classification. Figure 5 presents the PSR diagrams of different appliances from the COOLL dataset.
Figure 3.
The steady-state current signal of a drill from the COOLL dataset ( = 250, = 500).
Figure 4.
The PSR trajectories of a drill current signal (COOLL dataset) for multiple time delay values.
Figure 5.
PSR trajectories of the current signals of a fan, grinder, and hair dryer (COOLL dataset) for multiple time delay values.
2.3. Feature Extraction Using 2-D Fourier Series
Once the two-dimensional PSR trajectories are generated, Fourier series analysis is applied to extract a compact set of Fourier descriptors, which are used as input features for appliance classification. Fourier descriptors are widely used for representing 2-D closed shapes [35], making them well suited for describing the closed PSR contours reconstructed from steady-state current waveforms.
A 2-D PSR contour can be represented as the following coordinates:
The PSR trajectory can be expressed as a complex valued function as follows:
Since is periodic over one cycle of the load current waveform, each coordinate can be expanded into a discrete Fourier series as follows:
The Fourier coefficients, and , are obtained as follows:
Here, denotes the harmonic index, and is the number of samples in one current cycle. Due to symmetry properties of real-valued periodic contours, the coefficients satisfy the following symmetry relations:
Thus, the contour can be reconstructed from a finite set of harmonics:
A key advantage of Fourier descriptors is their ability to represent a contour using only a limited number of harmonics, enabling significant data reduction while preserving the dominant geometric features of the PSR contour. Lower-order harmonics capture the global structure of the contour, while higher-order harmonics provide finer refinement.
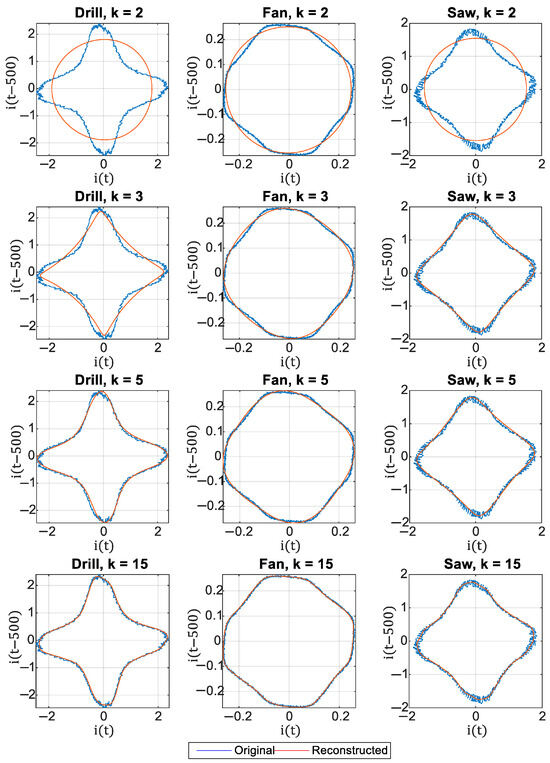
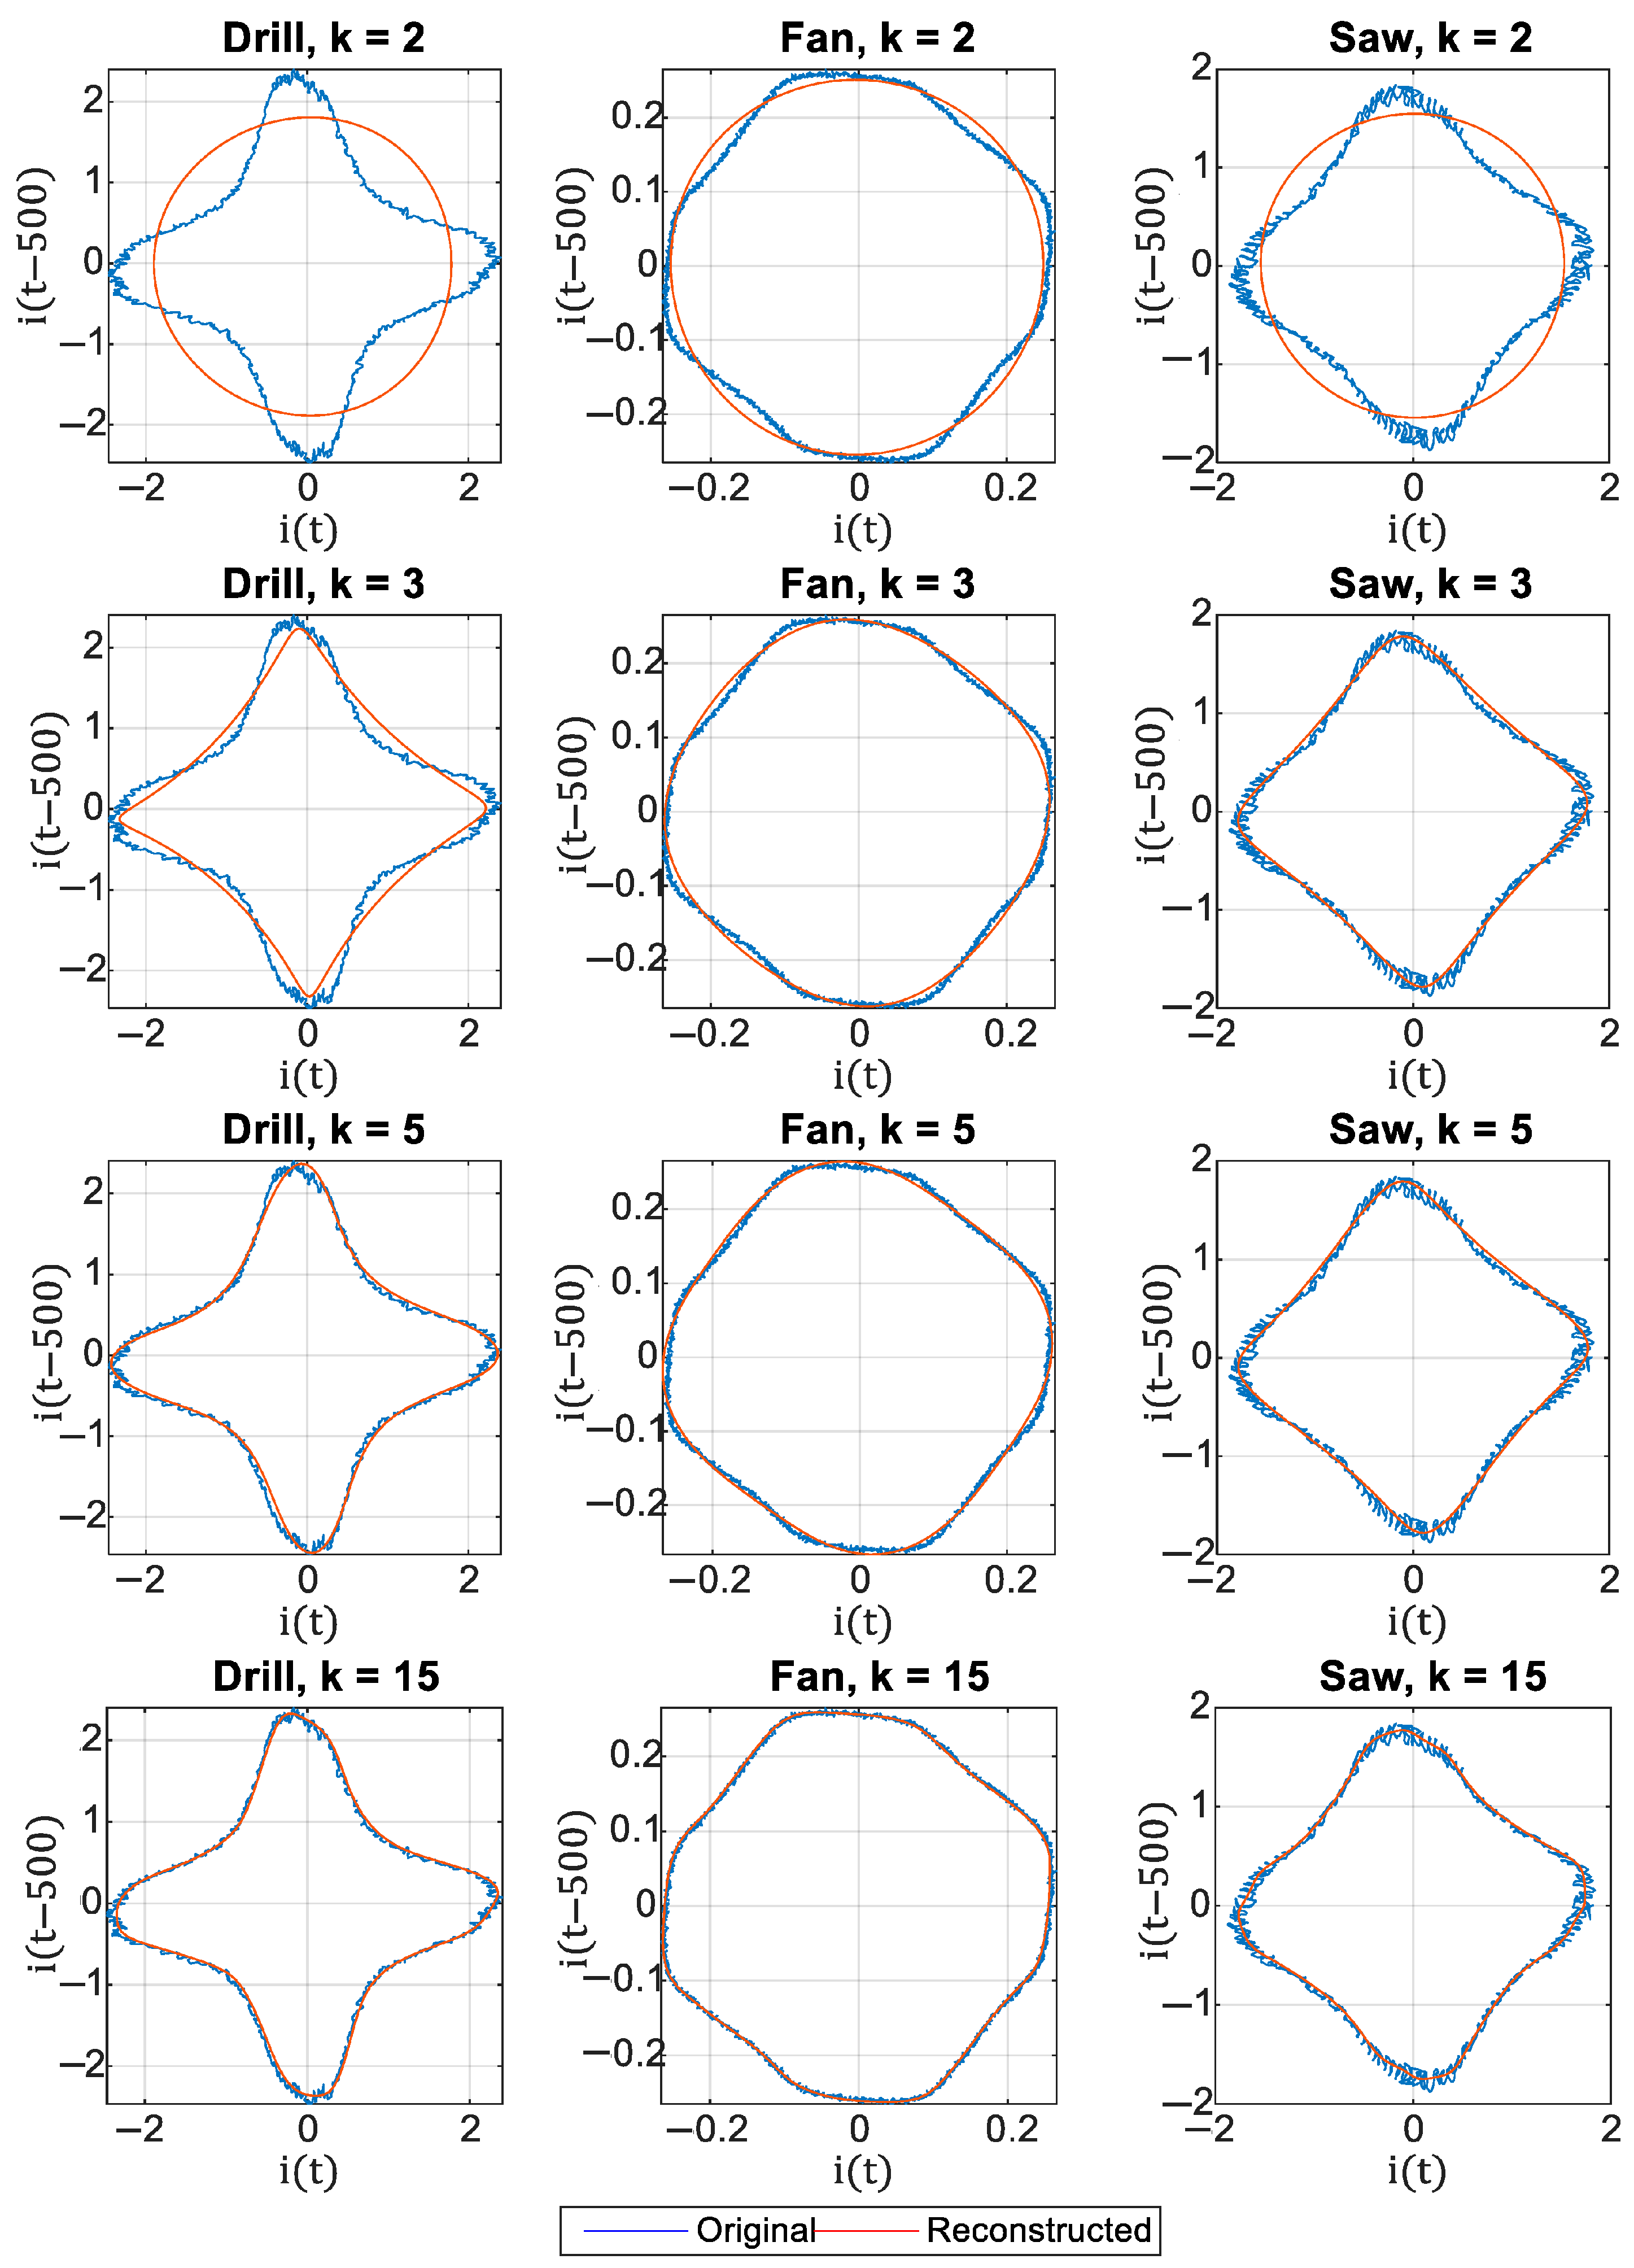
Figure 6 demonstrates the effect of harmonic order on contour reconstruction. Here, the original PSR contours for a drill, fan, and saw are compared with their Fourier reconstructions using harmonic orders = 2, 3, 5 and 15. As observed, the contour shape becomes progressively more accurate as the harmonic order increases; however, improvements beyond the fifth harmonic are minimal. Based on this observation, the present work employs the first five harmonics as Fourier descriptors for appliance classification, with additional harmonics used only for comparative evaluation.
Figure 6.
Effect of harmonic order on Fourier reconstruction of PSR contours for a drill, fan, and saw from the COOLL dataset.
Based on this selected harmonic order, the construction of the PSR–Fourier feature vector for each appliance sample is described below in Algorithm 1.
| Algorithm 1: PSR–Fourier Feature Extraction Procedure |
| Input: Steady-state current cycle , time delay , number of harmonics, Output: Feature vector Steps:
where the final feature vector has 20 elements per sample. |
2.4. Appliance Classification Using KNN Classifier
Following feature extraction, appliance classification is performed using the KNN algorithm. It is adopted due to its simplicity, low computational cost, and proven effectiveness in previous NILM applications. Since KNN determines class membership based on distance metrics in the feature space, it is particularly suitable when the extracted features preserve geometric and structural relationships.
The input to the KNN classifier is the fixed-length PSR–Fourier feature vector, , constructed from the retained Fourier coefficients of the PSR contour, as described in Algorithm 1. The output of the classifier is the predicted appliance class label corresponding to each sample in the dataset.
Before classification, the extracted feature set undergoes preprocessing, including normalization and data partitioning, to ensure consistent and unbiased performance evaluation.
2.4.1. Feature Normalization
Normalization is an essential preprocessing step to ensure that all features contribute equally to the distance metric used in KNN. Without normalization, features with larger numerical ranges may dominate the classification decision. In this study, Min–Max normalization is applied to scale each feature to the interval [−1,1], computed as follows:
where is the value of the feature, and and are the minimum and maximum values of that feature computed from the training subset within each cross-validation fold. For every fold, the normalization parameters are estimated exclusively from the training data and subsequently applied to both the training and corresponding test data. This procedure prevents information leakage and ensures unbiased performance evaluation. The normalization step serves only to balance feature scaling prior to classification and does not alter the geometric information encoded in the Fourier descriptors.
2.4.2. Data Splitting and Cross-Validation
To assess the classifier’s performance, 10-fold cross-validation is employed. The dataset is partitioned into ten equal folds. For each iteration, nine folds are used for training and one fold is used for testing. This process is repeated ten times so that every sample is used exactly once for testing. The final performance metrics are obtained by averaging across all folds. In addition, the hyperparameters of both the feature extraction and classification stages, namely the time delay, the number of Fourier harmonics, and the number of neighbors in KNNs, were selected based on cross-validation performance trends and then fixed before computing the final performance metrics. These parameters were not re-optimized separately within each fold during the final evaluation.
To address potential optimistic bias arising from non-nested hyperparameter tuning, an additional 5 × 5 nested cross-validation experiment was conducted. In this framework, a 5-fold outer loop was used for performance estimation, while hyperparameters (time delay, harmonic order, and number of neighbors) were selected using an independent 5-fold inner loop. The final performance was computed by averaging the accuracy obtained on the outer test folds. This protocol ensures strict separation between model selection and evaluation.
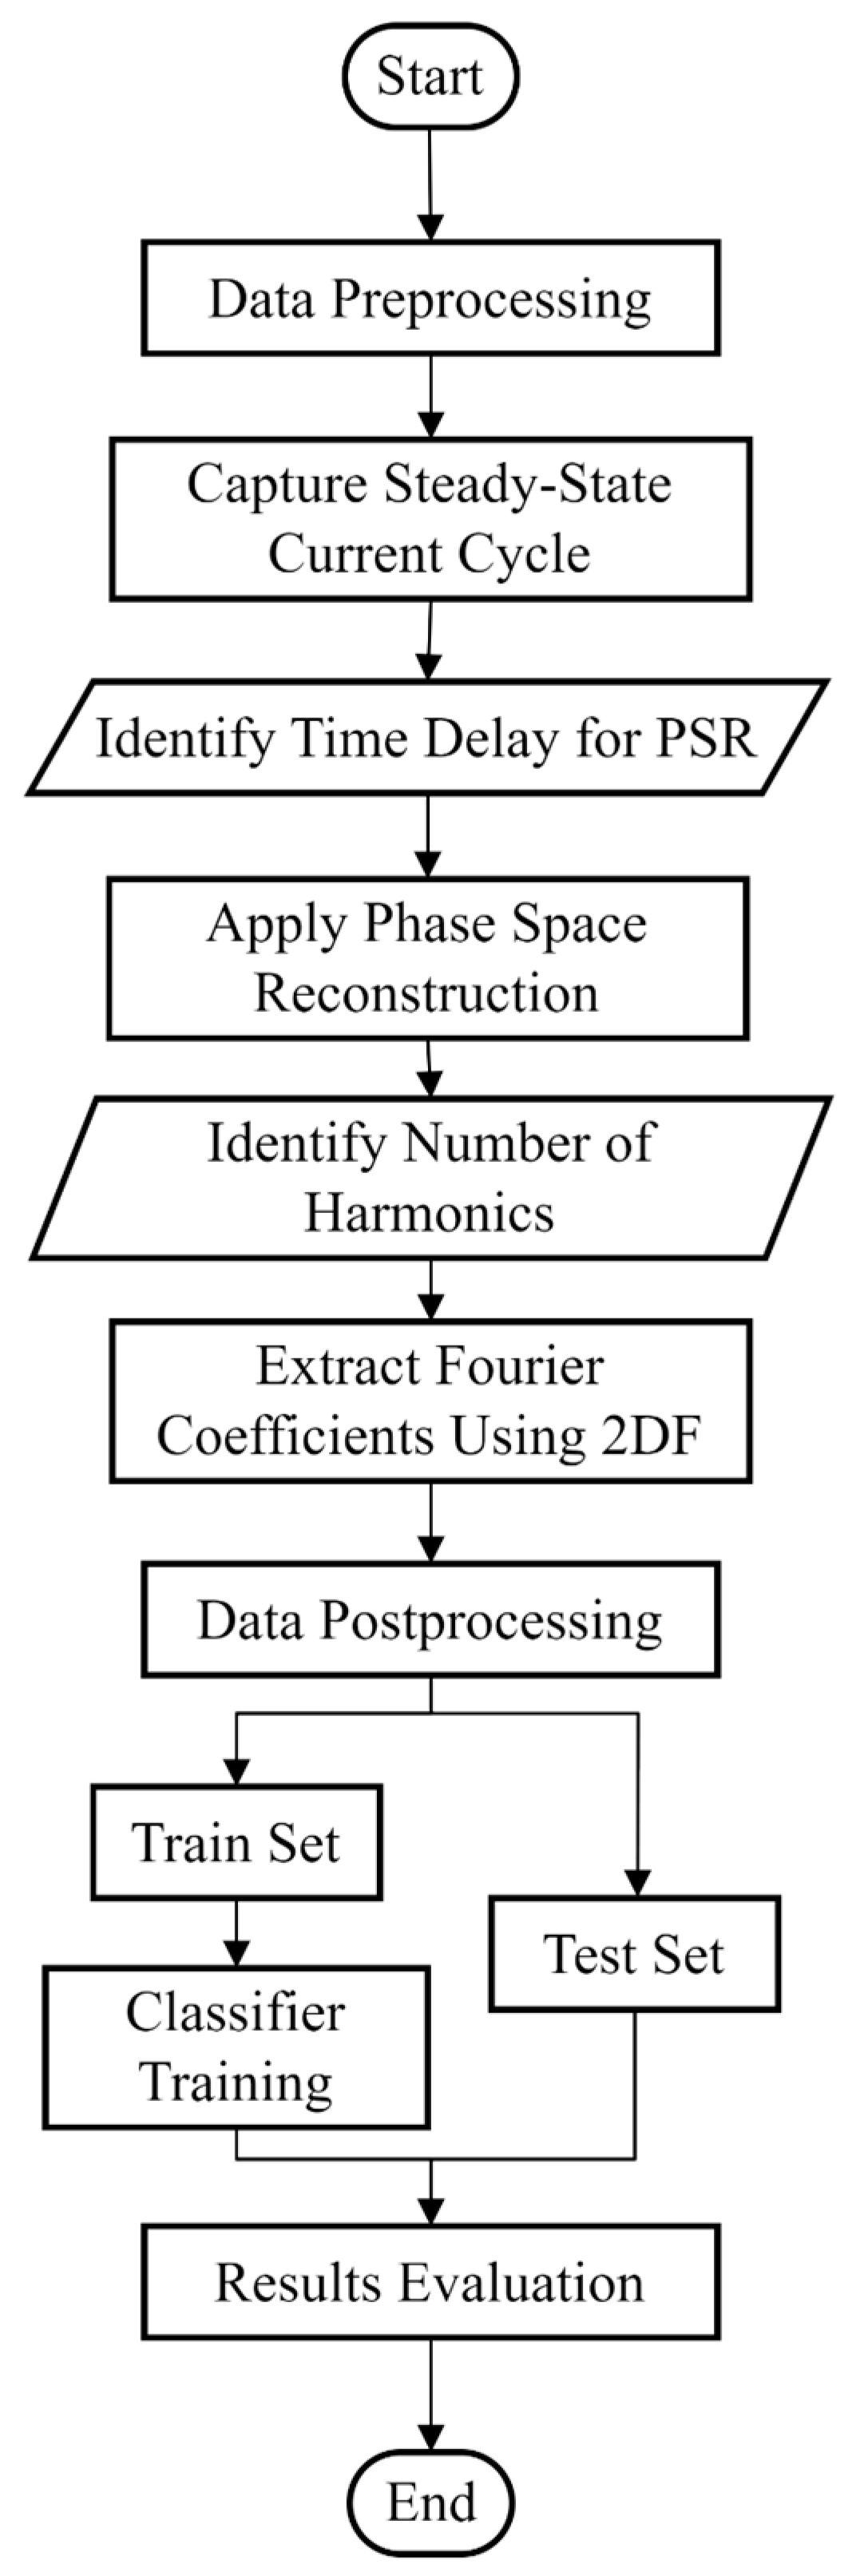
The flowchart of the entire procedure of the proposed PSR–Fourier-based technique for NILM is shown in Figure 7.
Figure 7.
Flowchart of the proposed PSR–Fourier-based technique for appliance classification.
3. Results and Discussion
This section presents the evaluation of the proposed PSR–Fourier-based feature extraction framework for appliance classification. A sensitivity analysis is first conducted to assess how the main model parameters such as the time delay, number of Fourier harmonics, and KNN settings independently affect classification performance. Following this analysis, the proposed method is compared with prior NILM approaches that have used the COOLL dataset, demonstrating the effectiveness of the proposed feature extraction strategy.
3.1. Sensitivity Analysis of Proposed NILM Model Parameters
3.1.1. Effect of Time Delay
As mentioned in Section 2.2, time delay is a fundamental parameter in phase-space reconstruction, which directly influences the shape of the PSR trajectory. An inappropriate choice of may distort the reconstructed geometry and reduce classification accuracy. To analyze the effect of , the value was varied over a wide range from to 1000 samples. For each candidate delay value, a separate PSR contour is constructed and encoded into a feature vector, as described in Algorithm 1. The descriptors corresponding to different delay values are evaluated independently. After identifying the optimal delay, a single feature vector per sample is constructed using the selected . The other parameters such as the Fourier harmonic order were fixed at = 5 and the KNN classifier was configured with the number of neighbors as = 3 using the Euclidean distance metric.
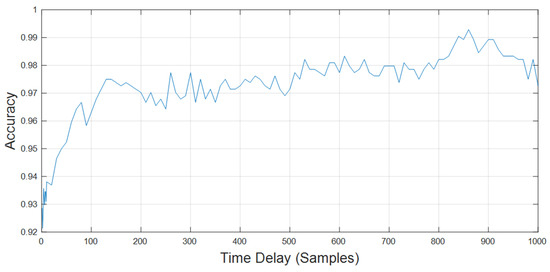
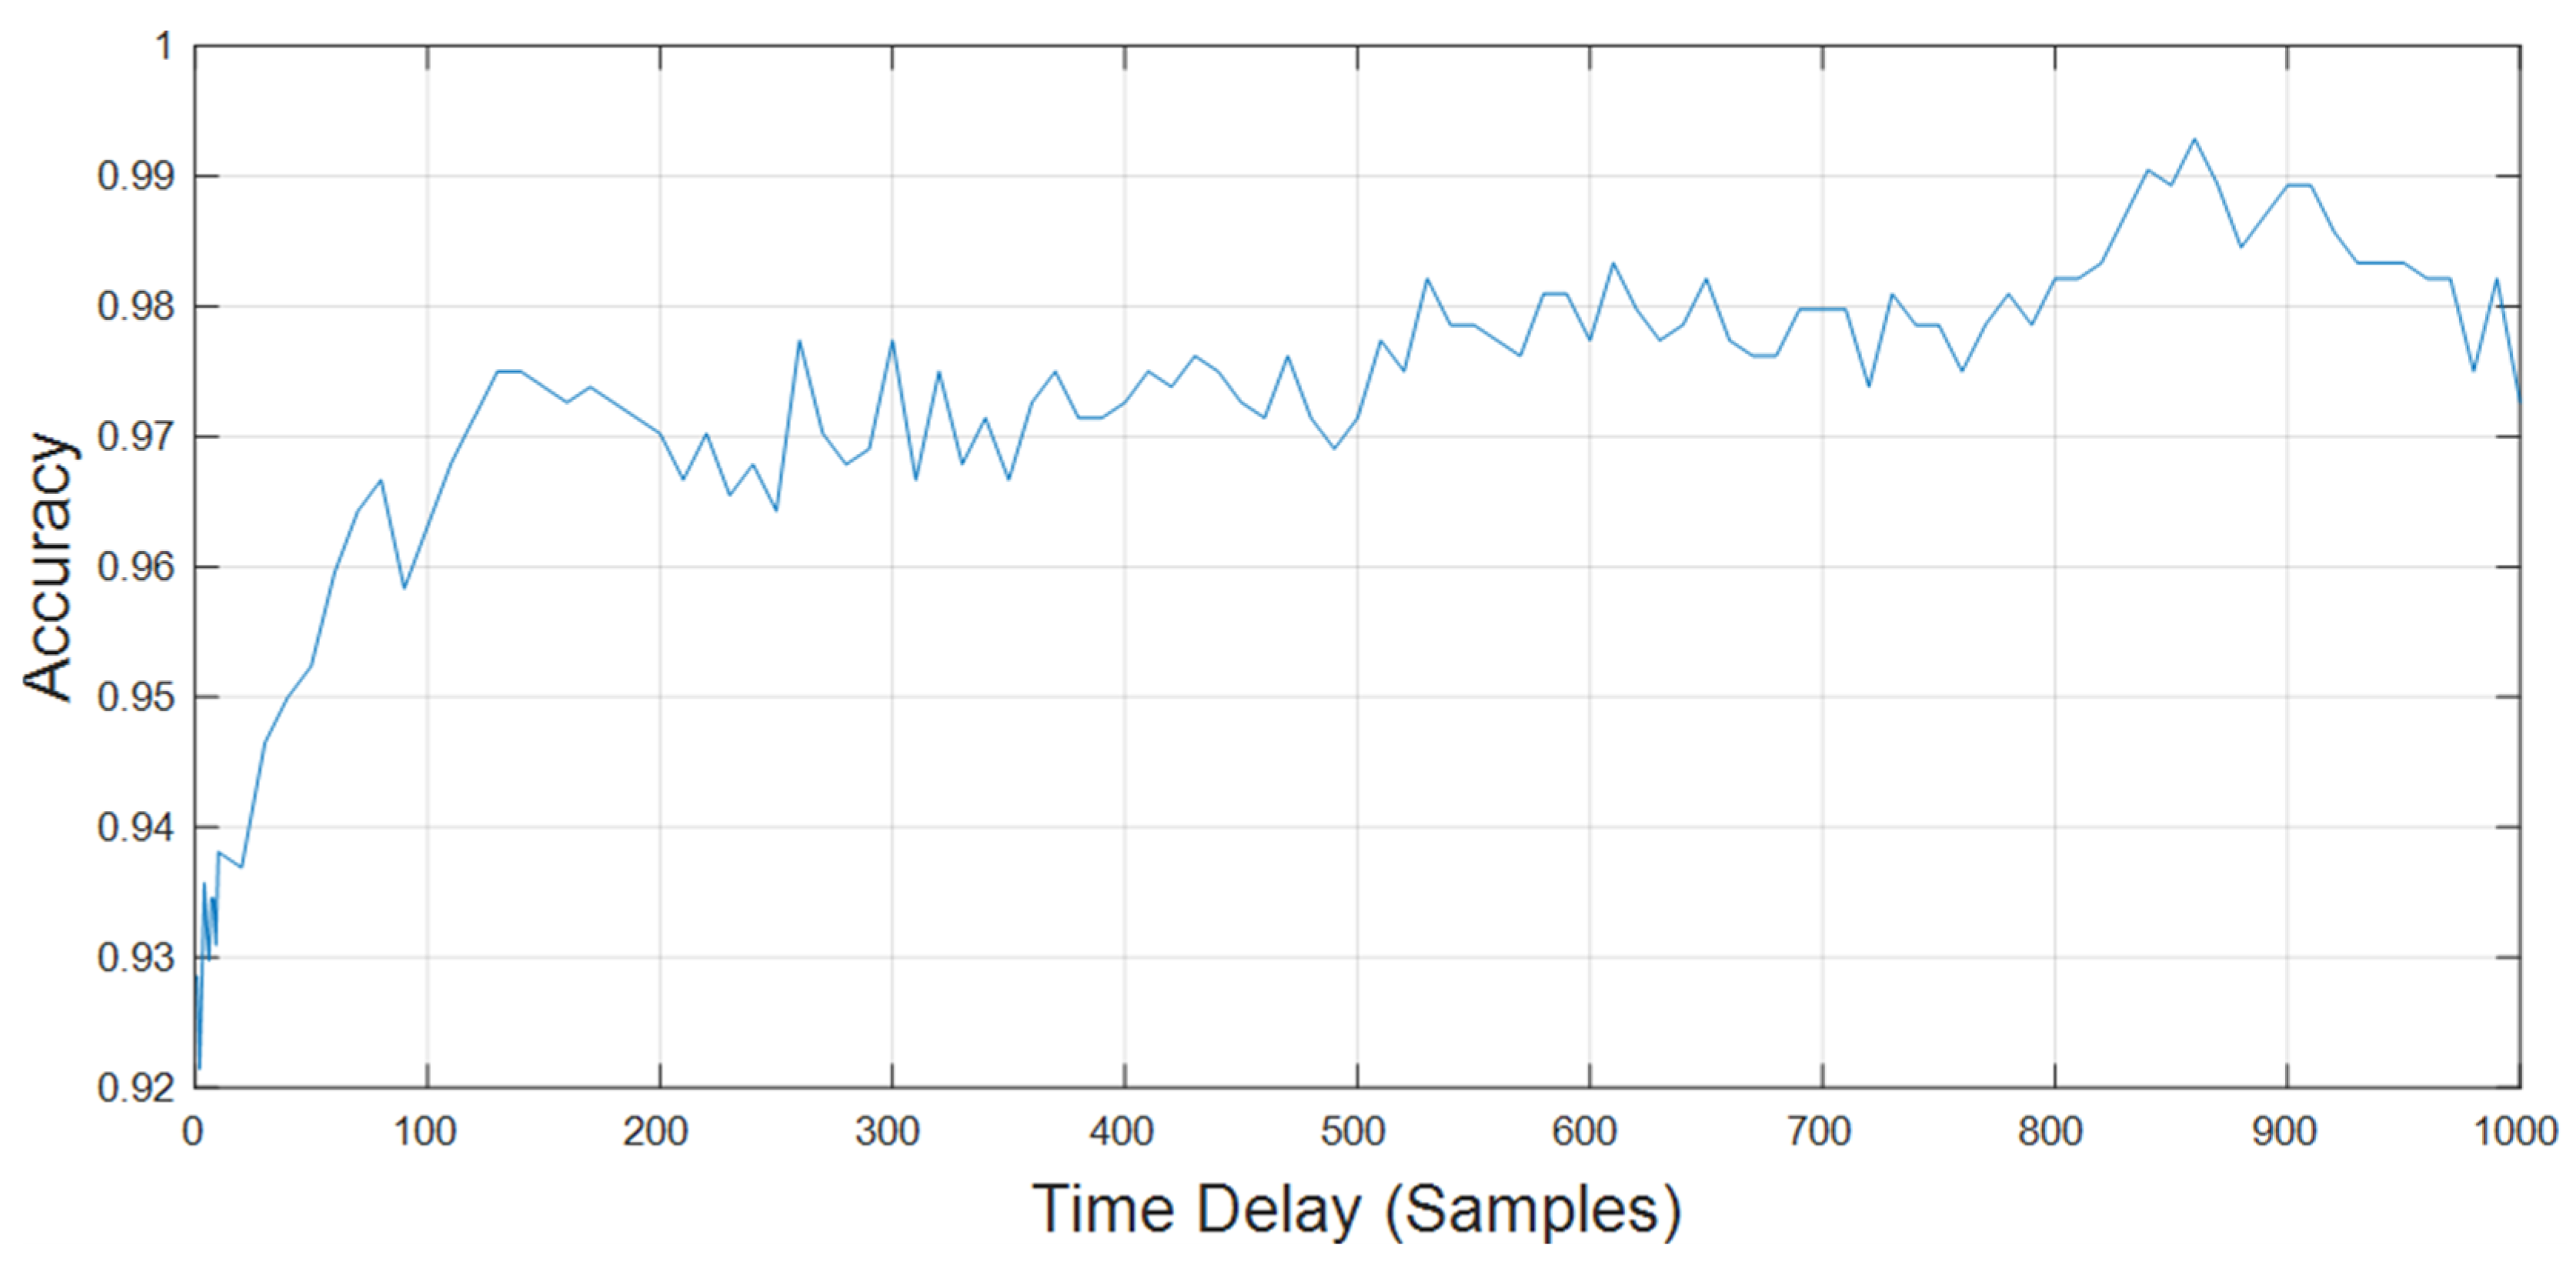
The resulting classification accuracy for various time delays is presented in Figure 8. It can be observed that, for very short time delay ( = 1), the accuracy is approximately 92.8% and exhibits slight fluctuations as increases. Around = 10 and = 20, the accuracy stabilizes above 93%, showing minor fluctuations across this range. Thereafter, the accuracy increases significantly as the exceeds 50 samples, where the accuracy rises to around 95% and continues to improve steadily with minor fluctuations. The highest accuracy of 99.29% is observed at , indicating that larger time delays produce PSR contours with stronger discriminative characteristics. Beyond = 860, the accuracy remained high, fluctuating around 98.3% to 98.9%.
Figure 8.
Time delay () vs. classification accuracy for KNN.
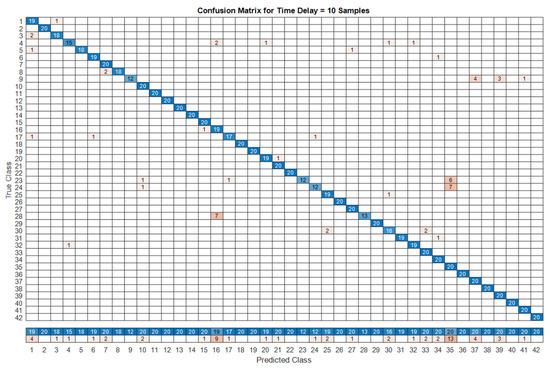
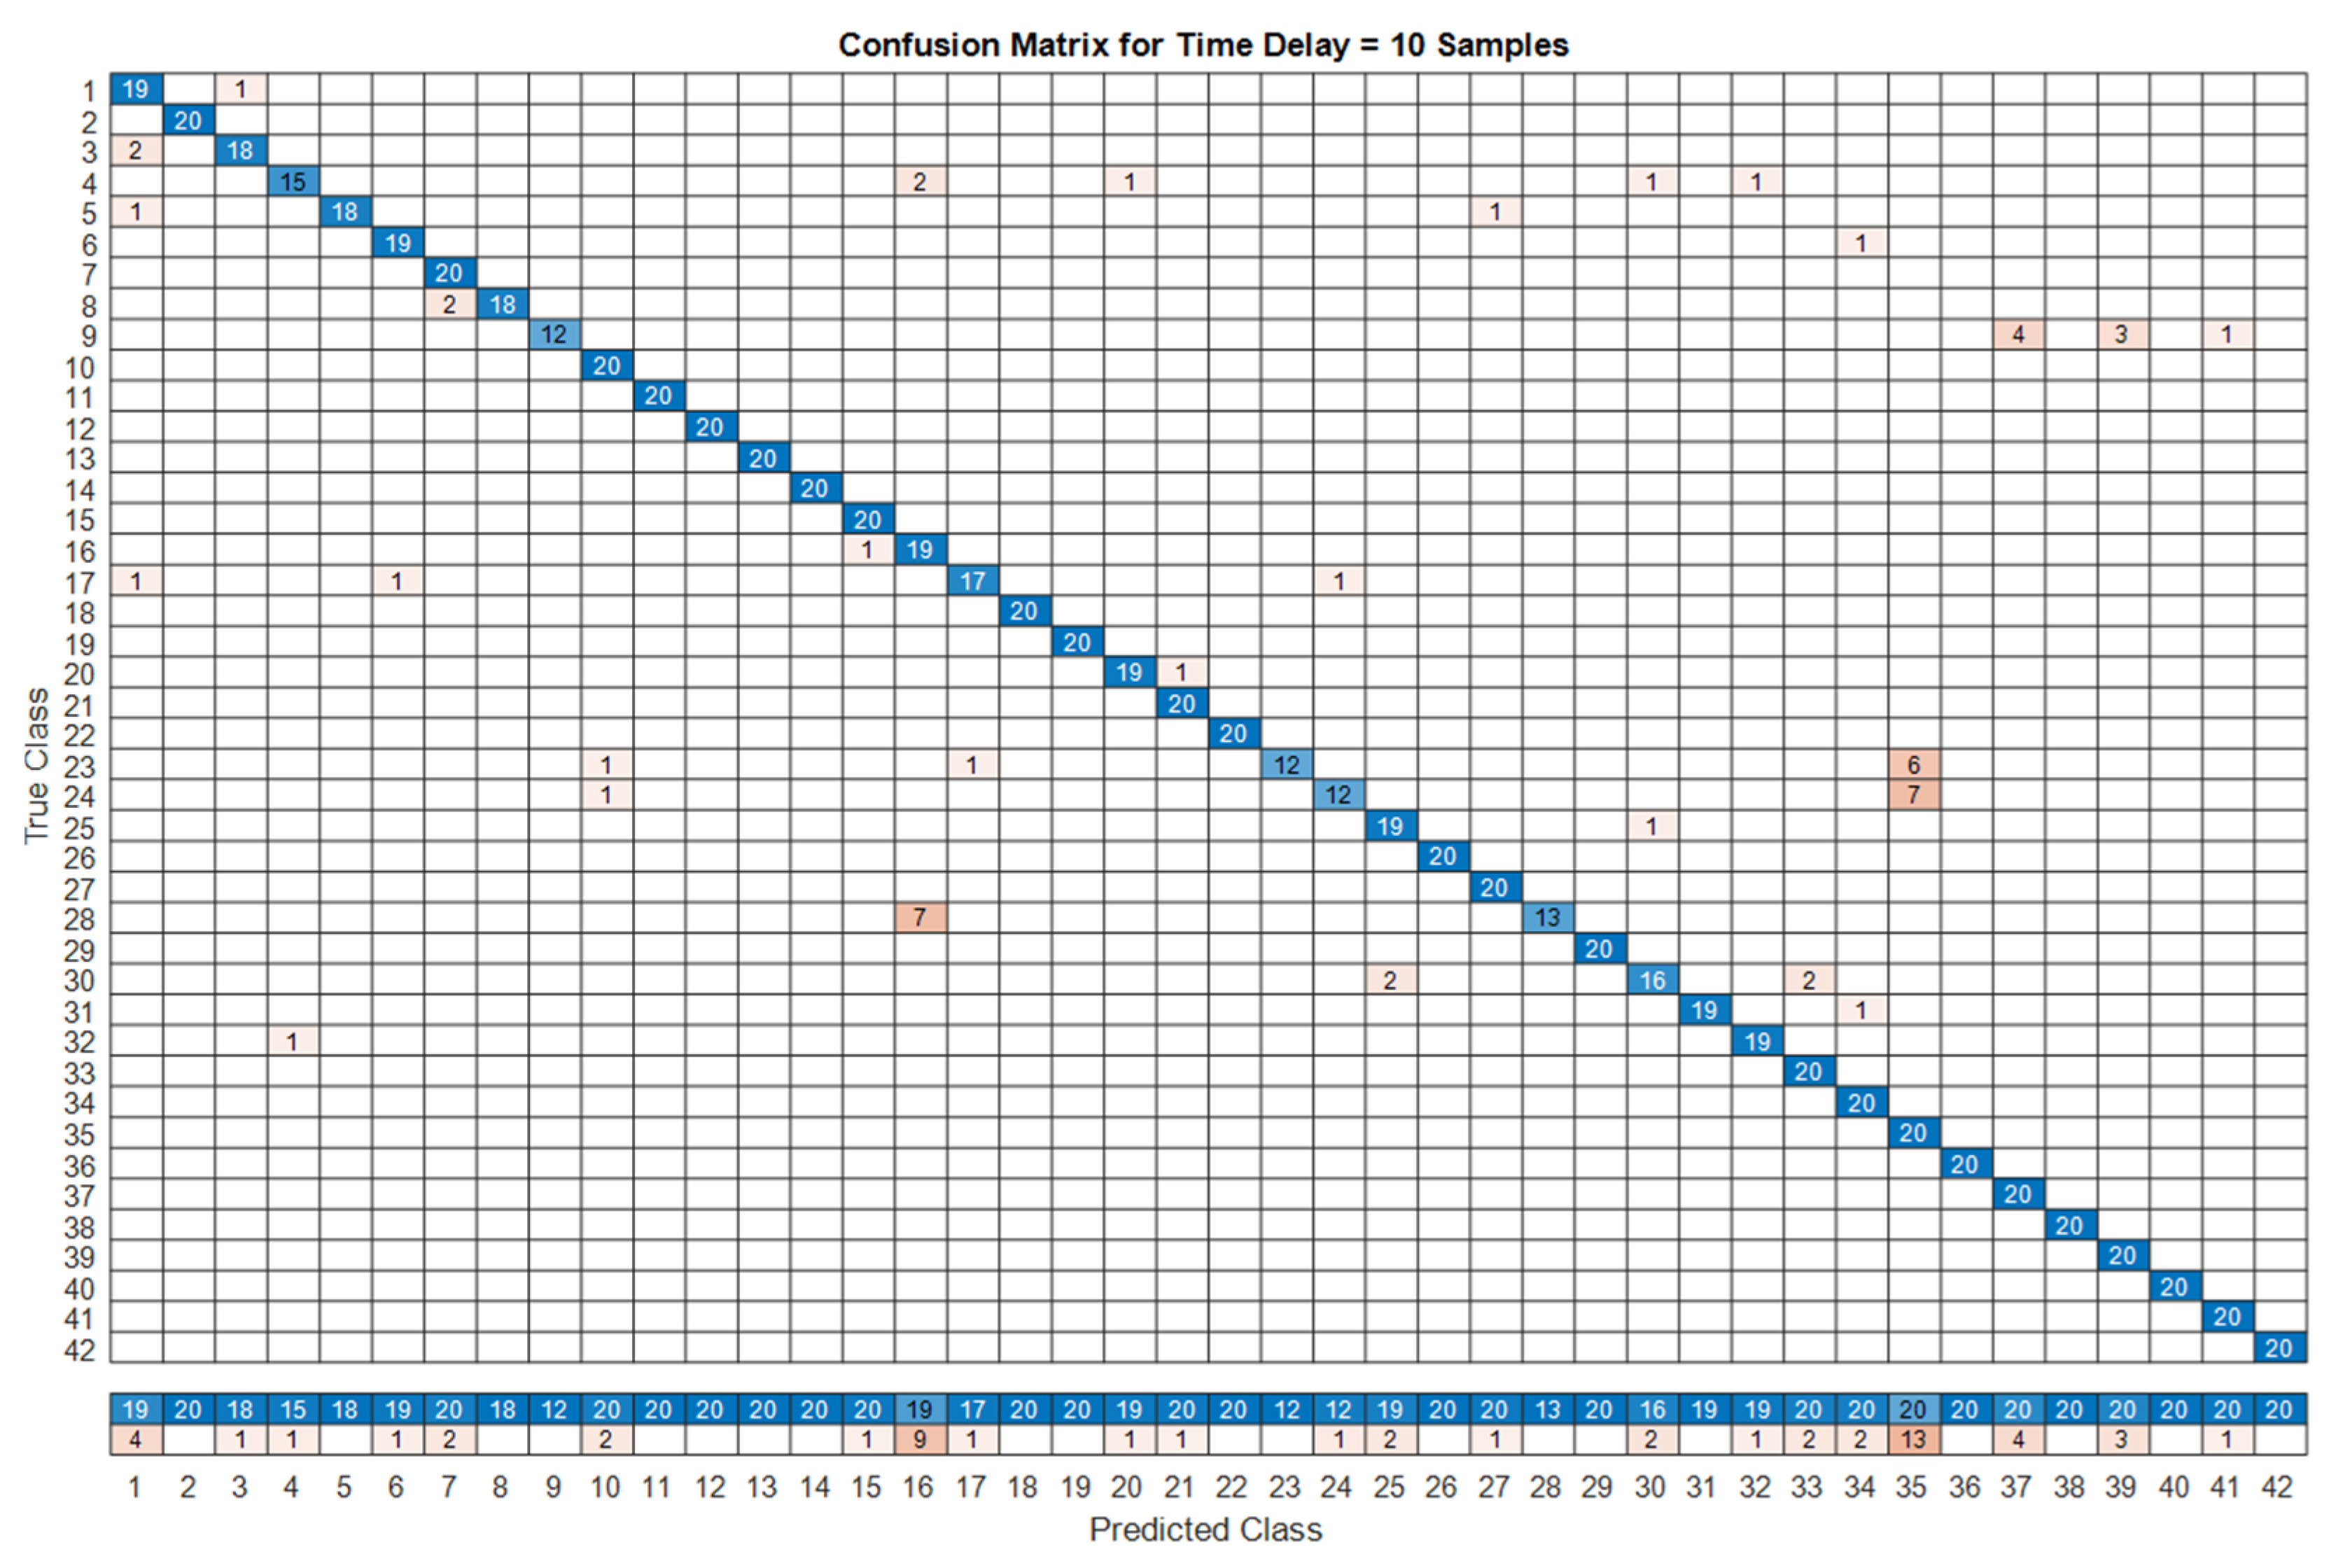
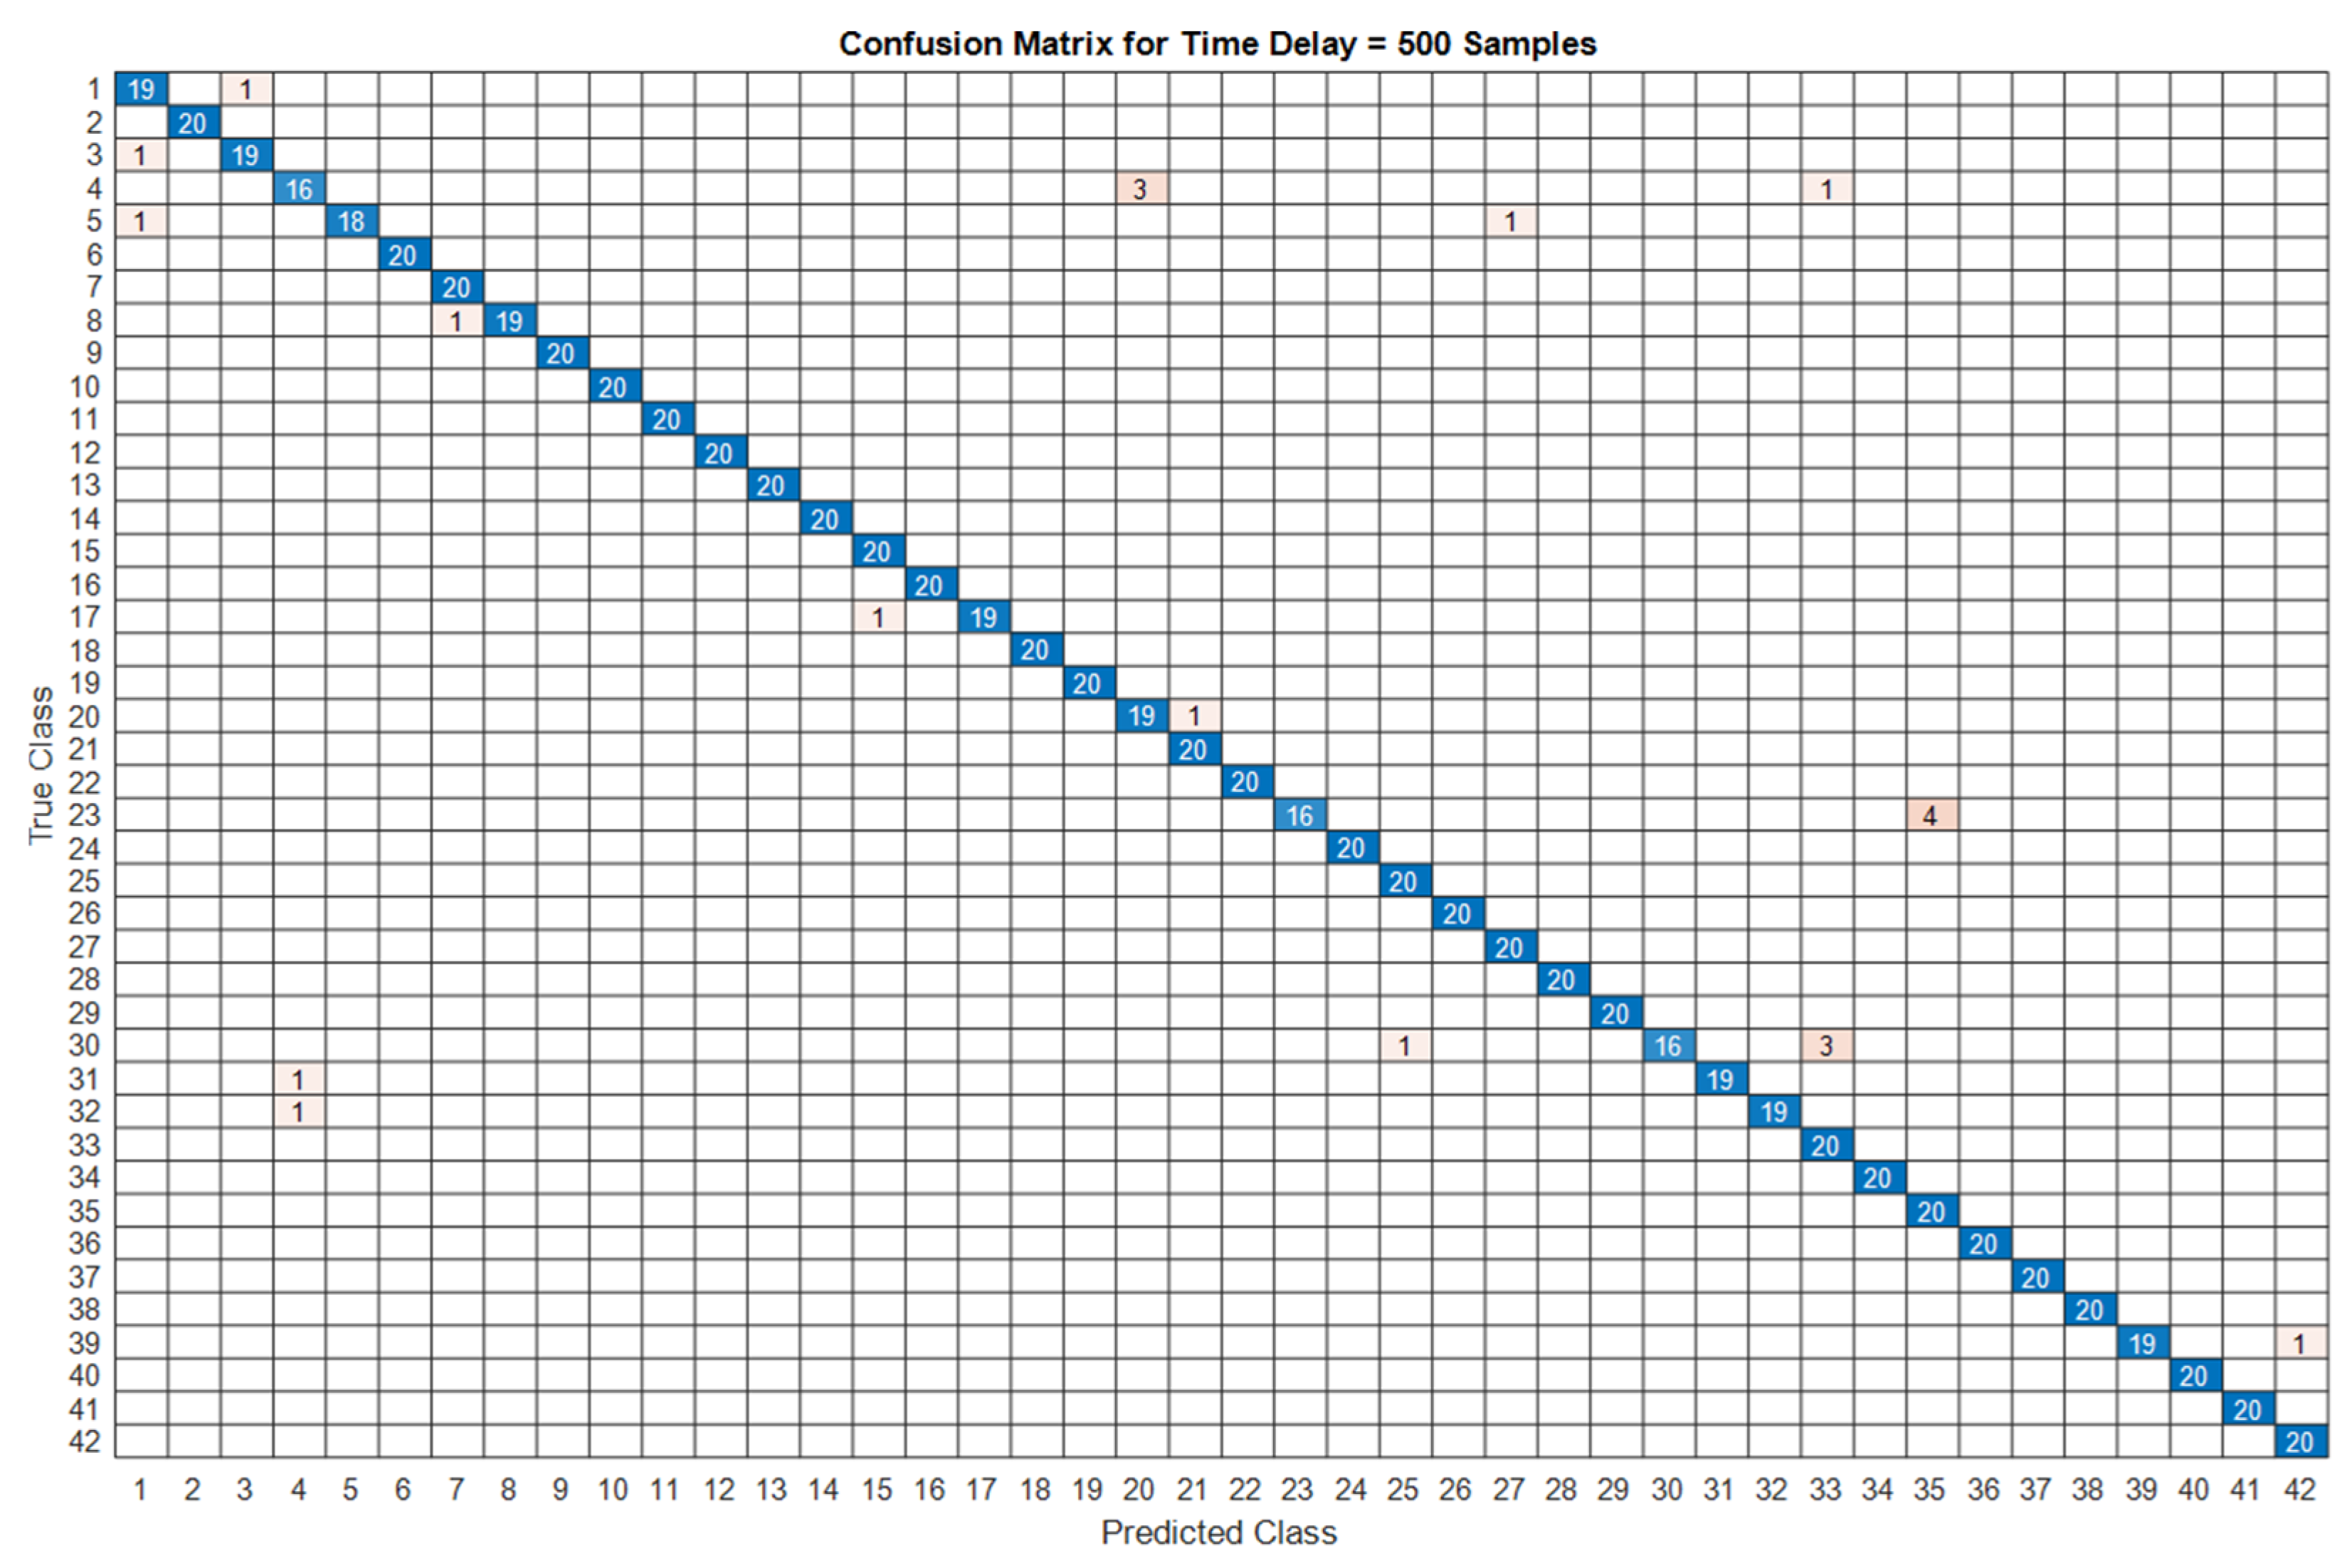
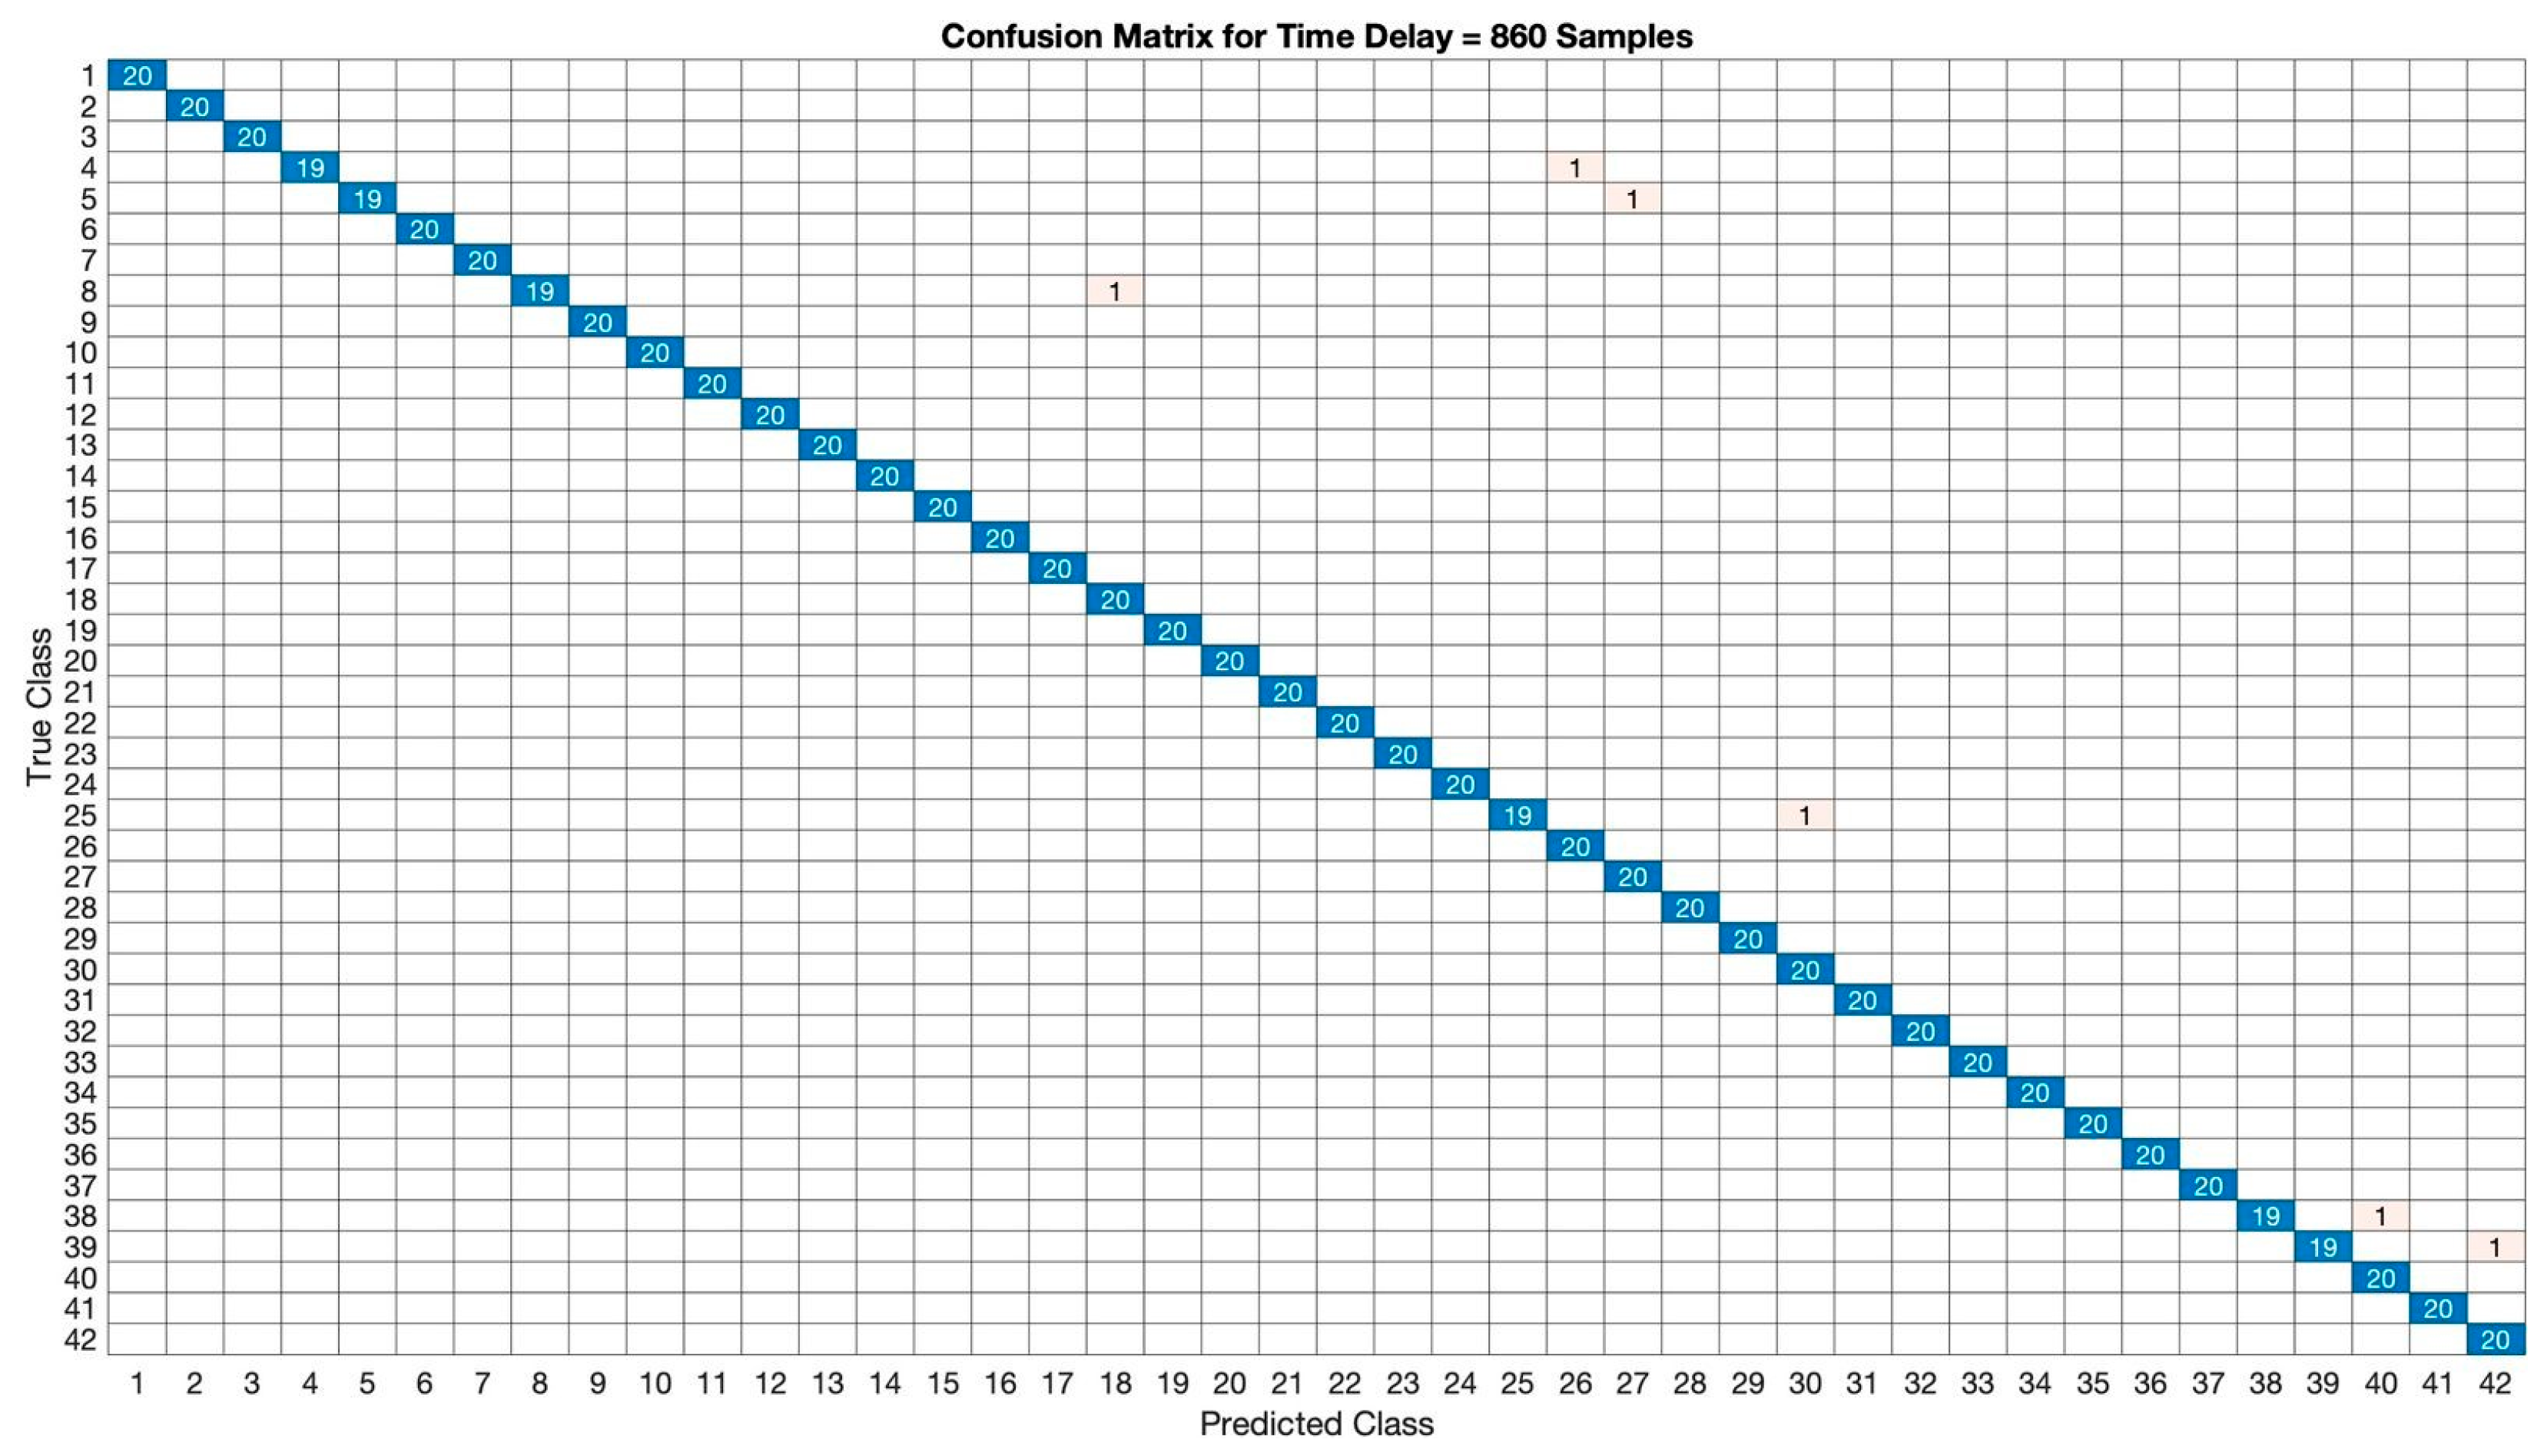
Representative confusion matrices for the three selected delay values are shown in Figure 9, Figure 10 and Figure 11. The matrices clearly demonstrate a reduction in misclassification as the time delay increases, consistent with the accuracy trend in Figure 8. A detailed view of performance metrics is provided in Table 3, which lists the precision, recall, and F1-scores for all 42 appliances at = 10, = 500 and = 860, respectively. The bolded entries in the table indicate the highest metric values for each appliance across the three delays. At = 10, several appliances exhibit relatively low recall or F1-scores, confirming the limitations of using small delays for PSR construction. In contrast, the mid-range delay ( = 500) yields noticeably higher scores across most classes, and the optimal delay ( = 860) produces near-perfect metrics for the majority of appliances. The average performance improves from 93% at = 10 to 99% at = 860, demonstrating that larger delays reveal more distinctive dynamical patterns in the reconstructed phase space. This allows the Fourier descriptors to capture more meaningful information in the waveform, which leads to improved classification performance by the KNN. However, it should be mentioned that although the optimal time delay for the COOLL dataset and the proposed feature extraction method was found to be large when using KNNs, future studies should investigate whether this result generalizes across different NILM datasets and different appliance types.
Figure 9.
Confusion matrix for low time delay (10 samples).
Figure 10.
Confusion matrix for mid time delay (500 samples).
Figure 11.
Confusion matrix for the optimal time delay (860 samples).
Table 3.
Summary of metrics per class (precision, recall, F1-score) for different delays.
3.1.2. Effect of Fourier Harmonics
The number of Fourier harmonics, , determines how much of the PSR contour’s geometric detail is captured during feature extraction. To analyze their effect on classification performance, the number of harmonics, , was varied from 1 to 20. The time delay was fixed at the optimal value obtained in the previous analysis ( = 860) and the KNN classifier was configured with = 3 using the Euclidean distance metric.
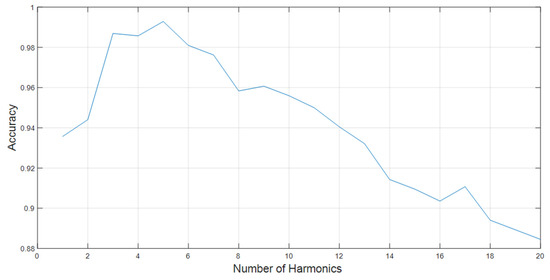
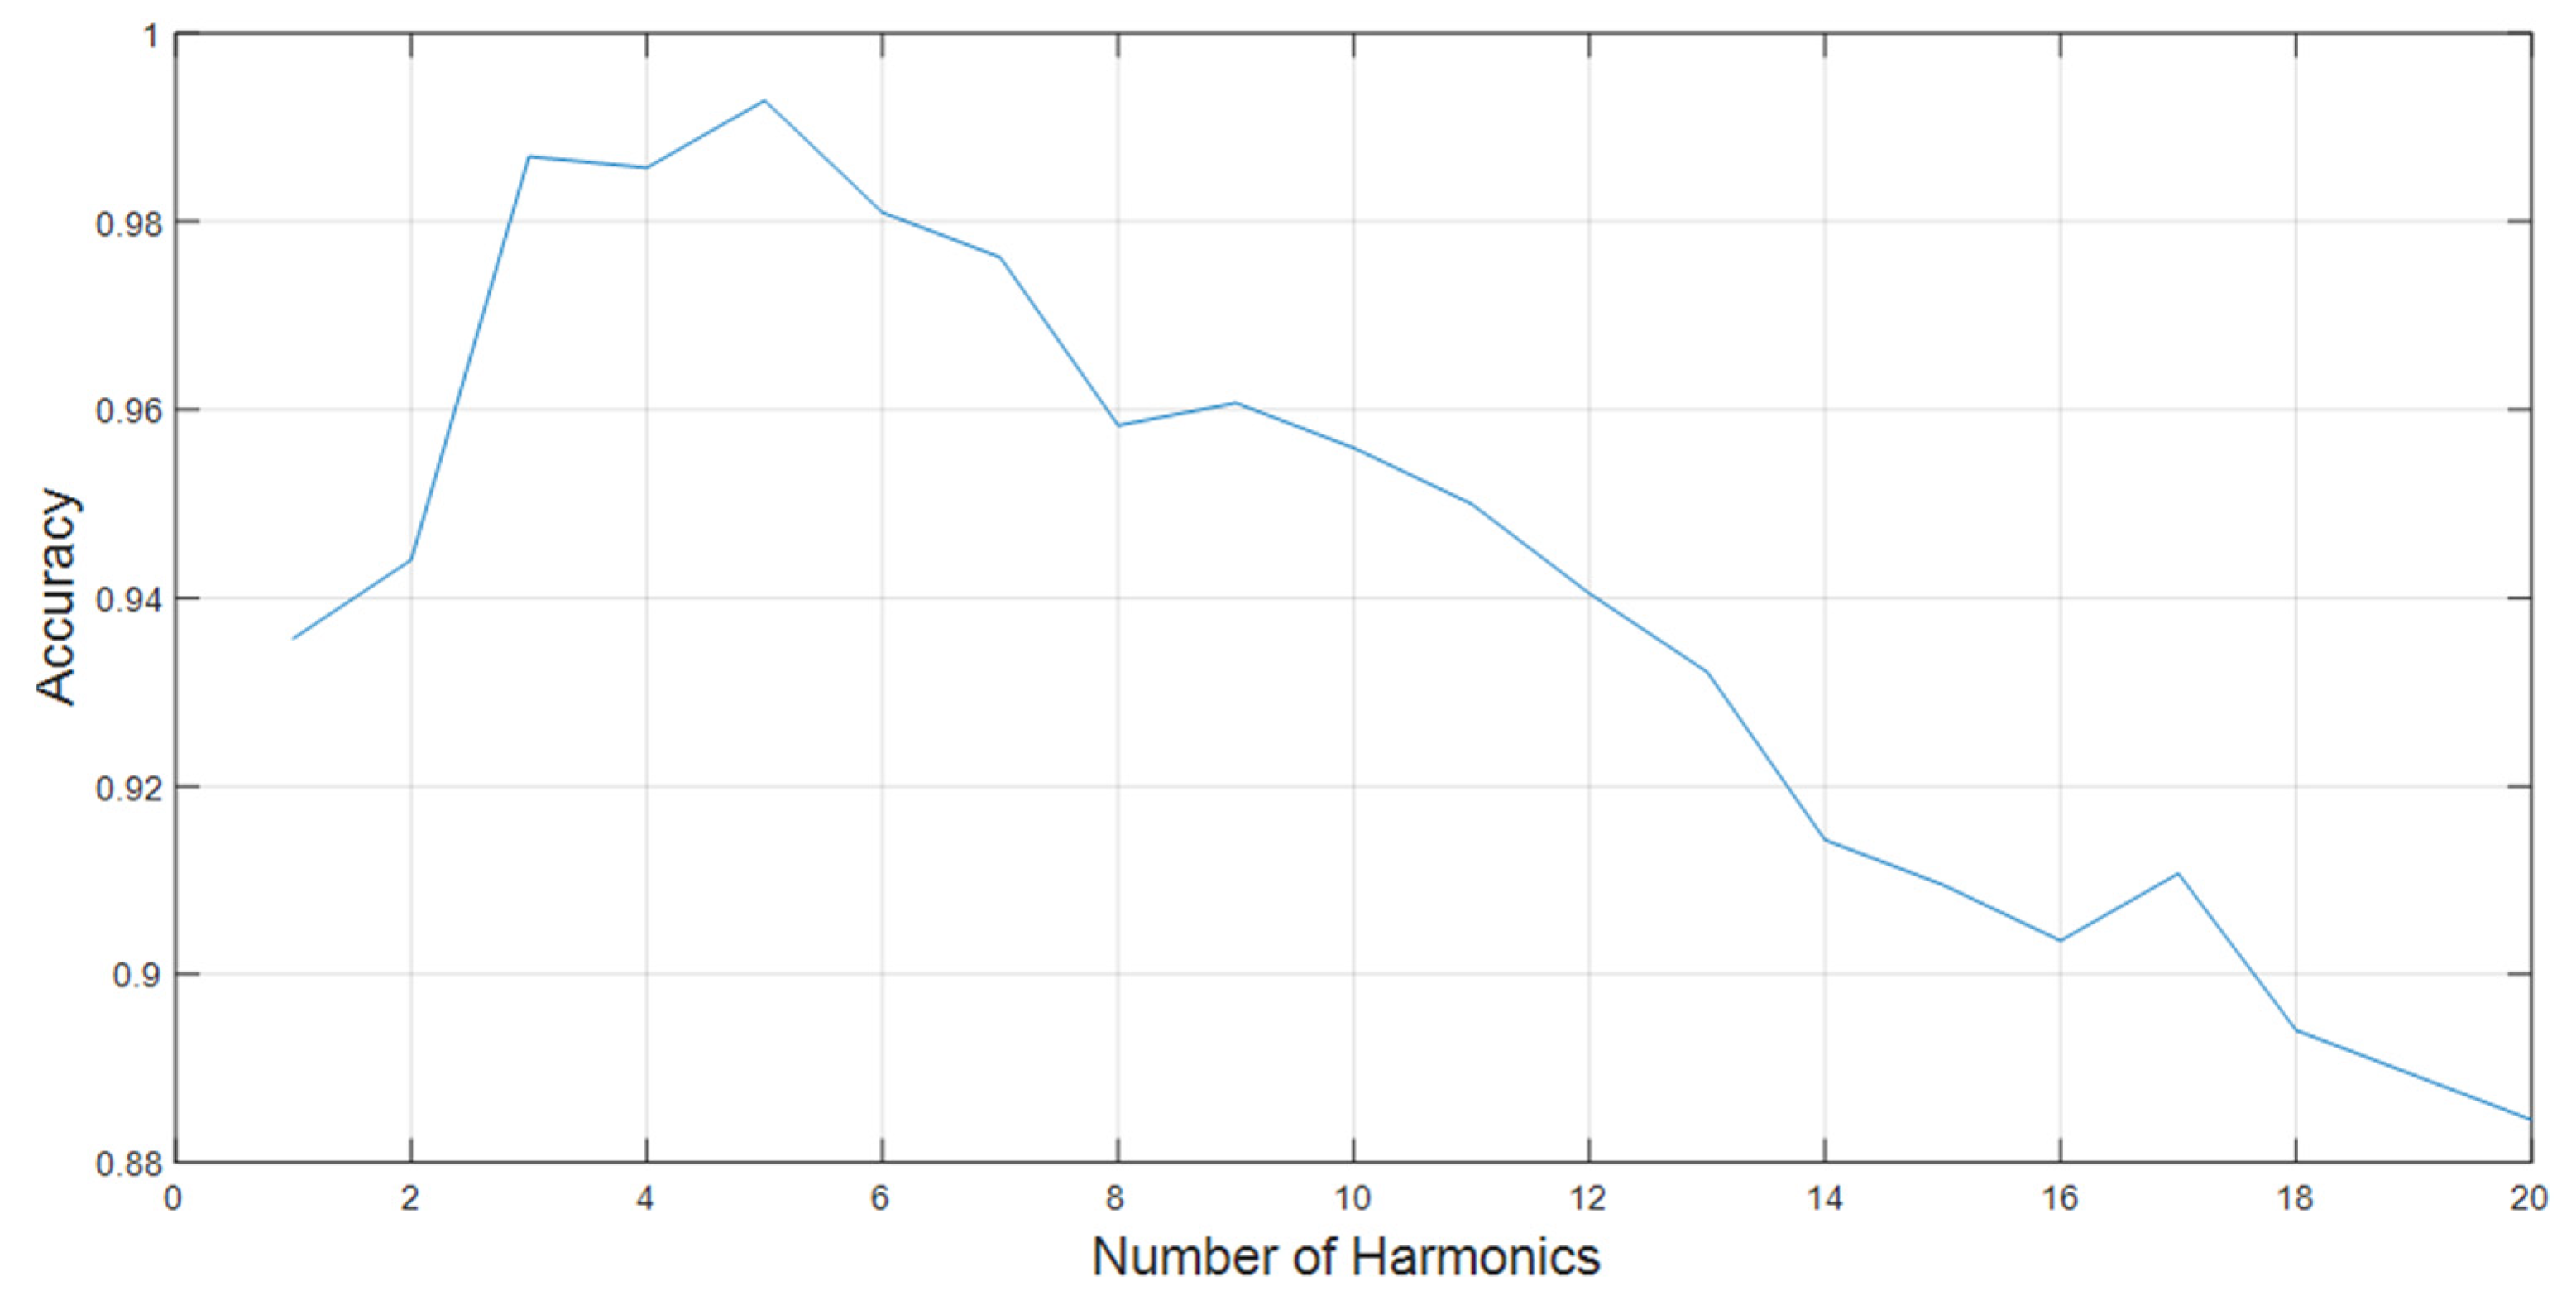
Figure 12 demonstrates how classification accuracy varies as the number of harmonics increases. The accuracy initially increases as the number of harmonics increases, reaching a peak value of 99.29% at = 5. However, beyond this point, the accuracy declines gradually, indicating that adding more harmonics does not improve classification performance and may degrade it. This decline can be attributed to the nature of high-order harmonics, which capture minor fluctuations or noise-like variations rather than the dominant geometric structure of the PSR contour. Including these components may cause the classifier to focus on less relevant details, thereby reducing its ability to distinguish between appliance types.
Figure 12.
Number of harmonics vs. classification accuracy for KNN.
Furthermore, the results can be interpreted in a way that for the COOLL dataset, most of the critical information is concentrated in the first few harmonic components. This reinforces the selection of = 5 as the optimal harmonic count for the proposed method. In future work, it might be useful to explore adaptive techniques to select the most relevant harmonics based on the characteristics of each appliance signal. Additionally, testing this method on other NILM datasets could help verify these findings across different types of appliances.
3.1.3. Tuning of KNN Classifier Parameters
The performance of the KNN classifier is dependent on the choice of two key parameters: the number of neighbors, , and the distance metric used to compute the similarity between feature vectors. To analyze their effect on classification performance, each parameter was varied independently, while the remaining parameters were fixed at the optimal values obtained from the earlier analyses, namely time delay τ = 860 and harmonic count = 5.
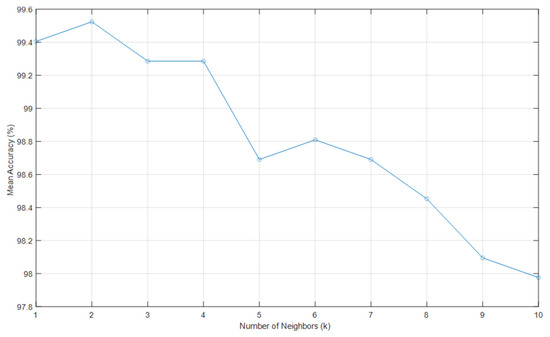
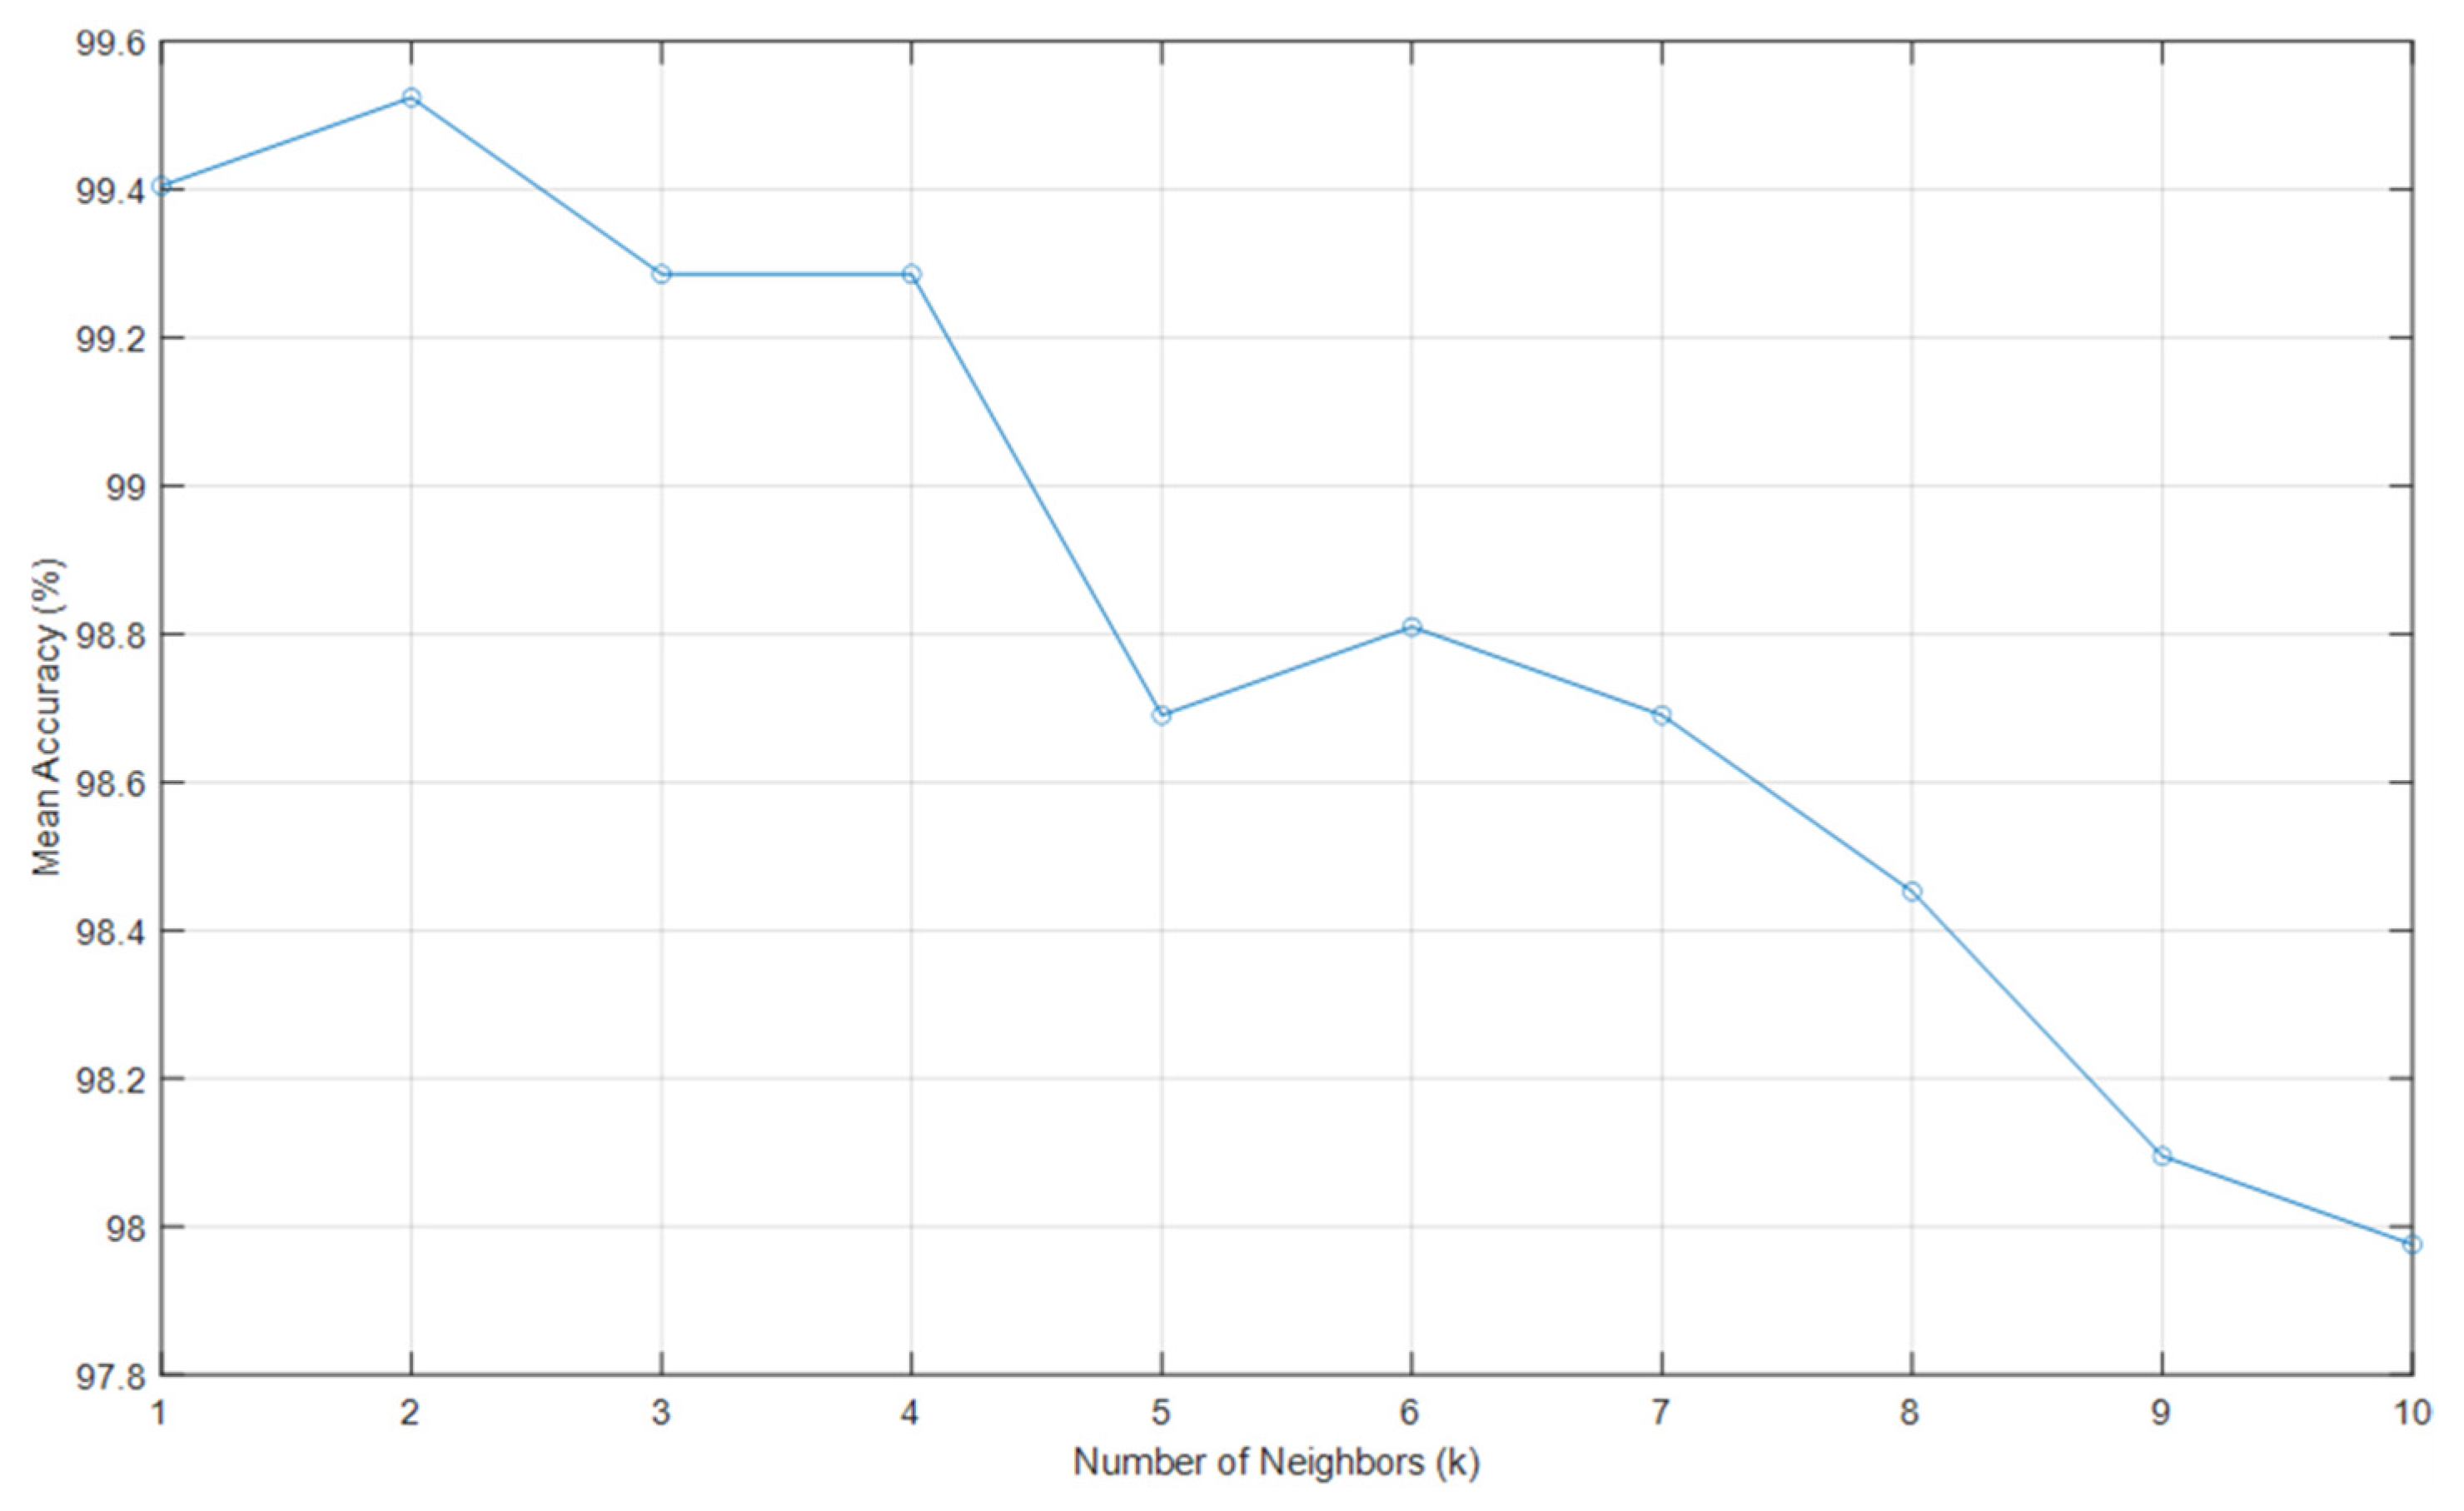
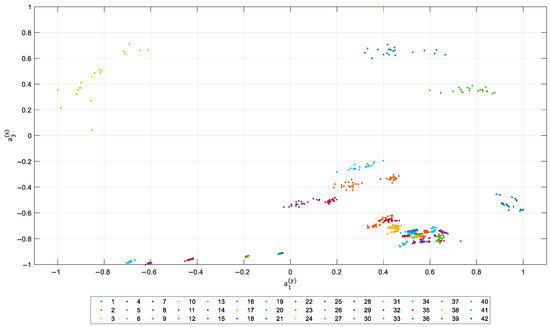
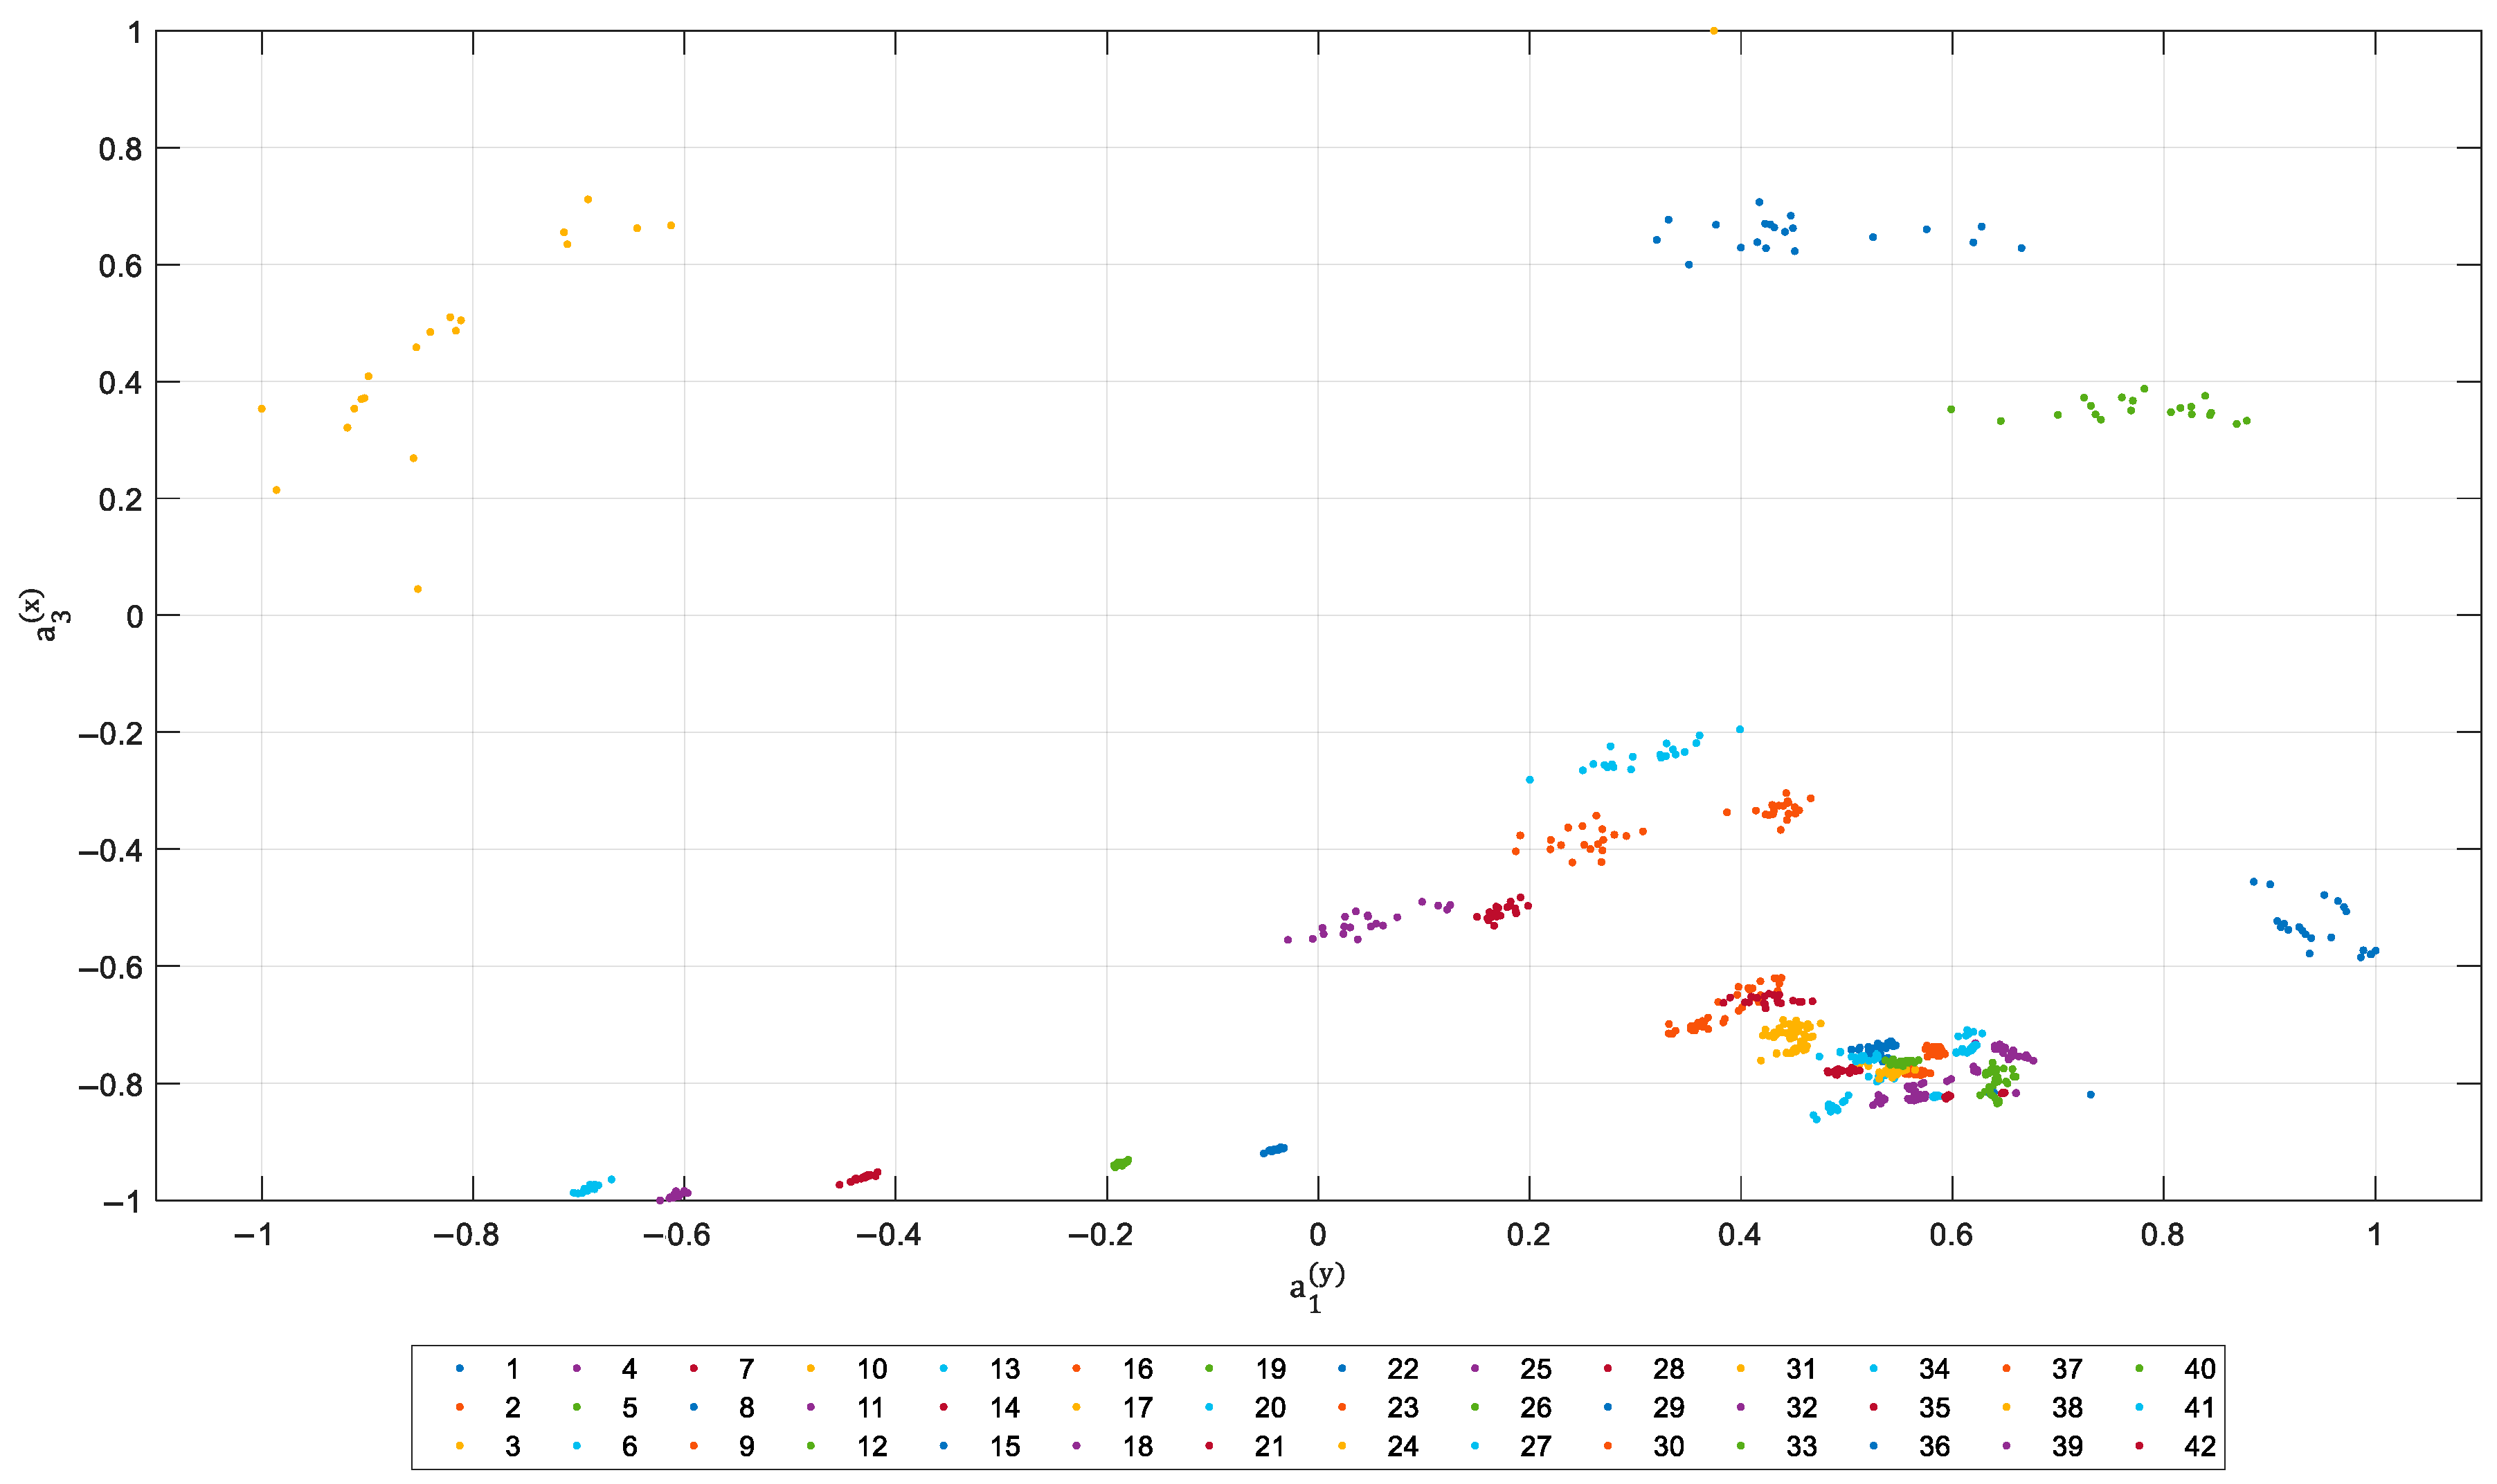
Effect of the Number of Neighbors: The number of neighbors was varied from = 1 to = 10 and the optimal value was determined based on the mean accuracy across 10 folds. As shown in Figure 13, the highest accuracy is achieved at = 2, with a mean accuracy of 99.52%. At = 1, the accuracy is still high but slightly lower due to potential overfitting. As increases beyond two, the accuracy declines gradually, indicating that larger neighborhood size leads to over-smoothing of class boundaries and reduced discriminative capability. These results confirm that the optimal number of neighbors for the KNN classifier is two. Also, the small neighborhood size provides a feature space that is well-separated, allowing the classifier to make accurate predictions. Figure 14 shows the feature space separation using the top two features, and .
Figure 13.
Effect of the number of neighbors , on classification performance.
Figure 14.
Feature space separation of appliance classes using two most discriminative Fourier descriptors.
Effect of Distance Metric: Four distance metrics—Euclidean, Manhattan, Minkowski and Chebyshev—were evaluated to determine their influence on classification accuracy. The results are summarized in Table 4.
Table 4.
Classification accuracy for different distance metrics.
The results show that the Manhattan distance metric achieves the highest classification accuracy of 99.52%. The Euclidean metric also delivers competitive performance, reaching a maximum accuracy of 99.40%, while the Minkowski metric achieves slightly lower performance, with a maximum of 99.17%. In contrast, the Chebyshev metric consistently produces lower accuracy, with a maximum value of 98.33%, indicating that it is less suited to the feature space generated by the proposed method. Based on its superior performance across neighborhood sizes, the Manhattan distance metric is selected for the final configuration of the classifier.
In summary, the optimal values obtained from the sensitivity analysis are presented in Table 5. These parameters are used for all subsequent evaluations of the proposed PSR–Fourier-based appliance classification method.
Table 5.
The optimal parameters for the proposed method using KNN classifier.
3.1.4. Nested Cross-Validation Analysis
The 5 × 5 nested cross-validation experiment yielded a mean outer-fold accuracy of 99.40%, with a standard deviation of 0.84% across the outer folds. This result is only 0.12% lower than the previously reported non-nested 10-fold accuracy of 99.52%. This minimal difference between the two estimates indicates that the originally reported performance was not significantly overestimated and confirms that the proposed PSR–Fourier framework maintains strong generalization performance under strict nested validation.
3.2. Comparison with Existing Methods
To assess the effectiveness of the proposed PSR–Fourier feature extraction technique, its performance is compared with several state-of-the-art approaches that have previously employed the COOLL dataset for NILM applications. It is important to note that prior studies have used two different evaluation settings: (1) 42-class classification, where each appliance is treated as a separate class, and (2) 12-class classification, where appliances are grouped according to their category. This work focuses on the 42-class scenario; nevertheless, the proposed method was also evaluated under the 12-class scenario to enable a direct comparison with studies following that setup.
3.2.1. Comparison Under the 42-Class Scenario
Several existing studies have used the COOLL dataset with different feature extraction techniques and classification algorithms. To ensure a fair comparison, the proposed method was also evaluated using DT, SVM, and Ensemble (ENS) classifiers to enable direct comparison with prior studies employing different algorithms. Table 6 summarizes key studies that have reported results for all 42 appliances. The proposed PSR–Fourier approach achieves a classification accuracy of 99.52% using KNN, while higher accuracies of 99.88% are obtained with DT and ENS classifiers. These results demonstrate that the proposed feature extraction framework produces highly separable feature spaces and performs competitively across different classification models.
Table 6.
Comparison of the proposed method with state-of-the-art methods for 42-appliance classification.
3.2.2. Comparison Under the 12-Class Scenario
Some prior studies categorize the 42 appliances into 12 broader types, simplifying the classification problem. Table 7 presents a comparison of methods evaluated under this configuration. When applying the proposed method to the 12-class problem, an accuracy of 99.64% is achieved, outperforming other approaches based on spectrograms and wavelet transforms. In summary, the results of the comparison under the 42-class and 12-class scenarios indicate that the proposed PSR–Fourier approach outperforms existing methods.
Table 7.
Comparison of the proposed method with state-of-the-art methods for 12-class appliance grouping.
Overall, the findings demonstrate that the proposed PSR–Fourier feature extraction method, combined with KNN classification, provides highly accurate and robust appliance classification for the COOLL dataset. The sensitivity analysis confirms that carefully chosen parameters, particularly the time delay and number of harmonics, enhance the discriminative power of the extracted features, enabling classification accuracies of up to 99.52% using KNNs.
4. Conclusions
This study proposed a feature extraction and classification framework based on geometric features extracted from phase-space reconstructed current waveforms and their 2-D Fourier descriptors. By transforming the 1-D steady-state current into a 2-D phase-space trajectory and encoding its contour through a limited number of Fourier harmonics, the method captures distinctive nonlinear characteristics of appliance signatures without relying on complex signal preprocessing other than standard feature scaling. The extracted features were classified using the KNN algorithm.
A systematic sensitivity analysis demonstrated that the performance of the proposed approach depends primarily on two key parameters: the time delay used in the PSR, and the number of Fourier harmonics included. The results from the COOLL dataset show that larger time delays yield more discriminative PSR contours, and that the first few harmonics (up to five) are sufficient to capture essential appliance characteristics. Under optimal parameter settings, the proposed PSR–Fourier method achieved a classification accuracy of 99.52% using the KNN classifier. When evaluated with DT and ENS classifiers, the same feature representation achieved up to 99.88% accuracy in the 42-class scenario.
These findings confirm that PSR combined with Fourier descriptors provides an effective feature extraction strategy for appliance classification within the NILM context. While the proposed framework demonstrates strong classification performance under the controlled COOLL dataset, application in aggregated multi-appliance environments would require additional processing steps, including event detection and separation of overlapping loads. Future research may therefore explore adaptive feature selection techniques, evaluate the method across additional NILM datasets with varying noise characteristics, and extend the proposed PSR–Fourier framework toward aggregated multi-appliance scenarios, including real-time appliance monitoring applications.
Author Contributions
Conceptualization, M.A.S. and H.S.; Methodology, M.A.S. and H.S.; Validation, M.A.S. and H.S.; Formal analysis, M.A.S., H.S. and M.A.; Investigation, M.A.S. and H.S.; Data curation, M.A.S.; Writing—original draft, M.A.S. and M.A.; Writing—review & editing, M.A.S., H.S., M.A., R.E., M.Z.D., R.G. and B.B.D.; Supervision, H.S.; Funding acquisition, H.S. All authors have read and agreed to the published version of the manuscript.
Funding
This research was supported by the Emirates Centre for Mobility Research (ECMR) at the United Arab Emirates University under Grant No. 12R202. Additional financial support was provided by the Ministry of Higher Education Malaysia (MOHE) through the Fundamental Research Grant Scheme (FRGS/1/2024/TK07/UMT/02/1).
Data Availability Statement
The COOLL (Controlled On/Off Loads Library) dataset used in this study is publicly available at https://coolldataset.github.io/ (accessed on 10 December 2024) and described in Picon et al., COOLL: Controlled On/Off Loads Library, a Public Dataset of High-Sampled Electrical Signals for Appliance Classification (arXiv:1611.05803).
Acknowledgments
During the preparation of this manuscript, the authors used ChatGPT 5.3 and Grammarly 1.2.235 to enhance language clarity, grammar, and readability. After using these tools, the authors carefully reviewed and revised the content as needed and take full responsibility for the content of the published article. No generative AI tools were employed to generate original content, data, or analysis.
Conflicts of Interest
The authors declare no conflicts of interest.
References
- Athanasiadis, C.; Doukas, D.; Papadopoulos, T.; Chrysopoulos, A. A Scalable Real-Time Non-Intrusive Load Monitoring System for the Estimation of Household Appliance Power Consumption. Energies 2021, 14, 767. [Google Scholar] [CrossRef] [Scilit]
- Hart, G.W. Nonintrusive Appliance Load Monitoring. Proc. IEEE 1992, 80, 1870–1891. [Google Scholar] [CrossRef] [Scilit]
- Angelis, G.F.; Timplalexis, C.; Krinidis, S.; Ioannidis, D.; Tzovaras, D. NILM Applications: Literature Review of Learning Approaches, Recent Developments and Challenges. Energy Build. 2022, 261, 111951. [Google Scholar] [CrossRef] [Scilit]
- Sadeghianpourhamami, N.; Ruyssinck, J.; Deschrijver, D.; Dhaene, T.; Develder, C. Comprehensive Feature Selection for Appliance Classification in NILM. Energy Build. 2017, 151, 98–106. [Google Scholar] [CrossRef] [Scilit]
- Schirmer, P.A.; Mporas, I. Non-Intrusive Load Monitoring: A Review. IEEE Trans. Smart Grid. 2022, 14, 769–784. [Google Scholar] [CrossRef] [Scilit]
- He, K.; Stankovic, L.; Liao, J.; Stankovic, V. Non-Intrusive Load Disaggregation Using Graph Signal Processing. IEEE Trans. Smart Grid 2016, 9, 1739–1747. [Google Scholar] [CrossRef] [Scilit]
- Chowdhury, D.; Hasan, M.; Rahman Khan, M.Z. Statistical Features Extraction from Current Envelopes for Non-Intrusive Appliance Load Monitoring. In Proceedings of the 2020 SoutheastCon, Raleigh, NC, USA, 28–29 March 2020; pp. 1–5. [Google Scholar]
- Shareef, H.; Asna, M.; Errouissi, R.; Prasanthi, A. Rule-Based Non-Intrusive Load Monitoring Using Steady-State Current Waveform Features. Sensors 2023, 23, 6926. [Google Scholar] [CrossRef] [Scilit] [PubMed]
- Jiang, L.; Luo, S.; Li, J. Automatic Power Load Event Detection and Appliance Classification Based on Power Harmonic Features in Non-Intrusive Appliance Load Monitoring. In Proceedings of the IEEE 8th Conference on Industrial Electronics and Applications (ICIEA), Melbourne, VIC, Australia, 19–21 June 2013; pp. 1083–1088. [Google Scholar]
- Gray, M.; Morsi, W.G. Application of Wavelet-Based Classification in Non-Intrusive Load Monitoring. In Proceedings of the 2015 IEEE 28th Canadian Conference on Electrical and Computer Engineering (CCECE), Halifax, NS, Canada, 3–6 May 2015; pp. 41–45. [Google Scholar]
- Himeur, Y.; Alsalemi, A.; Bensaali, F.; Amira, A. Robust Event-Based Non-Intrusive Appliance Recognition Using Multi-Scale Wavelet Packet Tree and Ensemble Bagging Tree. Appl. Energy 2020, 267, 114877. [Google Scholar] [CrossRef] [Scilit]
- Ancelmo, H.C.; de Lima, M.; Lazzaretti, A.E.; Linhares, R.R.; Renaux, D.P.B. A Transient and Steady-State Power Signature Feature Extraction Using Different Prony’s Methods. In Proceedings of the 20th International Conference on Intelligent System Application to Power Systems (ISAP), New Delhi, India, 10–14 December 2019; pp. 1–6. [Google Scholar]
- Reddy, R.; Garg, V.; Pudi, V. A Feature Fusion Technique for Improved Non-Intrusive Load Monitoring. Energy Inform. 2020, 3, 9. [Google Scholar] [CrossRef] [Scilit]
- Drouaz, M.; Colicchio, B.; Moukadem, A.; Dieterlen, A.; Ould-Abdeslam, D. New Time-Frequency Transient Features for Non-Intrusive Load Monitoring. Energies 2021, 14, 1437. [Google Scholar] [CrossRef] [Scilit]
- Lu, J.; Zhao, R.; Liu, B.; Yu, Z.; Zhang, J.; Xu, Z. An Overview of Non-Intrusive Load Monitoring Based on VI Trajectory Signature. Energies 2023, 16, 939. [Google Scholar] [CrossRef] [Scilit]
- Wang, A.L.; Chen, B.X.; Wang, C.G.; Hua, D. Non-Intrusive Load Monitoring Algorithm Based on Features of V–I Trajectory. Electr. Power Syst. Res. 2018, 157, 134–144. [Google Scholar] [CrossRef] [Scilit]
- Du, L.; He, D.; Harley, R.G.; Habetler, T.G. Electric Load Classification by Binary Voltage–Current Trajectory Mapping. IEEE Trans. Smart Grid 2015, 7, 358–365. [Google Scholar] [CrossRef] [Scilit]
- Liu, Y.; Wang, X.; You, W. Non-Intrusive Load Monitoring by Voltage–Current Trajectory Enabled Transfer Learning. IEEE Trans. Smart Grid 2018, 10, 5609–5619. [Google Scholar] [CrossRef] [Scilit]
- Mulinari, B.M.; de Campos, D.P.; da Costa, C.H.; Ancelmo, H.C.; Lazzaretti, A.E.; Oroski, E.; Lima, C.R.E.; Renaux, D.P.B.; Pottker, F.; Linhares, R.R. A New Set of Steady-State and Transient Features for Power Signature Analysis Based on V–I Trajectory. In Proceedings of the 2019 IEEE PES Innovative Smart Grid Technologies Conference—Latin America (ISGT LA), Gramado, Brazil, 15–18 September 2019; pp. 1–6. [Google Scholar]
- Mulinari, B.M.; da Silva Nolasco, L.; Oroski, E.; Lazzaretti, A.E.; Linhares, R.R.; Renaux, D.P.B. Feature Extraction of V–I Trajectory Using 2-D Fourier Series for Electrical Load Classification. IEEE Sens. J. 2022, 22, 17988–17996. [Google Scholar] [CrossRef] [Scilit]
- Himeur, Y.; Alsalemi, A.; Bensaali, F.; Amira, A. An Intelligent Nonintrusive Load Monitoring Scheme Based on 2D Phase Encoding of Power Signals. Int. J. Intell. Syst. 2021, 36, 72–93. [Google Scholar] [CrossRef] [Scilit]
- Stanescu, D.; Enache, F.; Popescu, F. Smart Non-Intrusive Appliance Load-Monitoring System Based on Phase Diagram Analysis. Smart Cities 2024, 7, 1936–1949. [Google Scholar] [CrossRef] [Scilit]
- Cavalca, D.L.; Fernandes, R.A. Deep Transfer Learning-Based Feature Extraction: An Approach to Improve Nonintrusive Load Monitoring. IEEE Access 2021, 9, 139328–139335. [Google Scholar] [CrossRef] [Scilit]
- Papageorgiou, P.; Mylona, D.; Stergiou, K.; Bouhouras, A.S. A Time-Driven Deep Learning NILM Framework Based on Novel Current Harmonic Distortion Images. Sustainability 2023, 15, 12957. [Google Scholar] [CrossRef] [Scilit]
- Ciancetta, F.; Bucci, G.; Fiorucci, E.; Mari, S.; Fioravanti, A. A New Convolutional Neural Network-Based System for NILM Applications. IEEE Trans. Instrum. Meas. 2020, 70, 1501112. [Google Scholar] [CrossRef] [Scilit]
- Pau, D.P.; Naramo, T.A.; Dimbiniaina, M. Coding Mel Spectrogram Using Keras and Tensorflow for Home Appliances Tiny Classification. In Proceedings of the 2023 IEEE International Conference on Consumer Electronics (ICCE), Las Vegas, NV, USA, 6–8 January 2023; pp. 1–5. [Google Scholar]
- Yu, H.; Xu, C.; Geng, G.; Jiang, Q. Multi-Time-Scale Shapelet-Based Feature Extraction for Non-Intrusive Load Monitoring. IEEE Trans. Smart Grid 2023, 15, 1116–1128. [Google Scholar] [CrossRef] [Scilit]
- Ghosh, S.; Mitra, A.; Chakrabarti, S.; Sharma, A. Data-Driven Strategy for Appliance Classification Using Phase-Space Reconstruction. IEEE Trans. Smart Grid 2023, 14, 4964–4967. [Google Scholar] [CrossRef] [Scilit]
- Chen, Y.L.; Chiang, Y.; Chiu, P.H.; Huang, I.C.; Xiao, Y.B.; Chang, S.W.; Huang, C.W. High-Dimensional Phase Space Reconstruction with a Convolutional Neural Network for Structural Health Monitoring. Sensors 2021, 21, 3514. [Google Scholar] [CrossRef] [Scilit]
- Acharya, R.; Faust, O.; Kannathal, N.; Chua, T.; Laxminarayan, S. Nonlinear Analysis of EEG Signals at Various Sleep Stages. Comput. Methods Programs Biomed. 2005, 80, 37–45. [Google Scholar] [CrossRef] [Scilit]
- COOLL Dataset. Controlled On/Off Loads Library (COOLL): A Public Dataset of High-Sampled Electrical Signals for Appliance Classification. Available online: https://coolldataset.github.io/ (accessed on 10 January 2026).
- Picon, T.; Meziane, M.N.; Ravier, P.; Lamarque, G.; Novello, C.; Bunetel, J.C.L.; Raingeaud, Y. COOLL: Controlled on/off loads library, a public dataset of high-sampled electrical signals for appliance classification. arXiv 2016, arXiv:1611.05803. [Google Scholar]
- Fan, G.F.; Peng, L.L.; Hong, W.C. Short term load forecasting based on phase space reconstruction algorithm and bi-square kernel regression model. Appl. Energy 2018, 224, 13–33. [Google Scholar] [CrossRef] [Scilit]
- Eftekhari, A.; Yap, H.L.; Wakin, M.B.; Rozell, C.J. Stabilizing embedology: Geometry-preserving delay-coordinate maps. Phys. Rev. E 2018, 97, 022222. [Google Scholar] [CrossRef] [Scilit] [PubMed]
- Dalitz, C.; Brandt, C.; Goebbels, S.; Kolanus, D. Fourier Descriptors for Broken Shapes. EURASIP J. Adv. Signal Process. 2013, 2013, 161. [Google Scholar] [CrossRef] [Scilit]



Disclaimer/Publisher’s Note: The statements, opinions and data contained in all publications are solely those of the individual author(s) and contributor(s) and not of MDPI and/or the editor(s). MDPI and/or the editor(s) disclaim responsibility for any injury to people or property resulting from any ideas, methods, instructions or products referred to in the content. |
© 2026 by the authors. Licensee MDPI, Basel, Switzerland. This article is an open access article distributed under the terms and conditions of the Creative Commons Attribution (CC BY) license.