


Abstract
This study examines the effects of Gross Domestic Product (GDP) per capita, its squared and cubic terms (GDP2 and GDP3), renewable energy, fossil fuels, nuclear energy, and research and development (R&D) on environmental sustainability in G20 countries from 1994 to 2023, with a specific focus on testing the N-shaped Environmental Kuznets Curve (EKC) hypothesis. CS-ARDL serves as the baseline estimator, and robustness is checked using FMOLS and DOLS estimators and an alternative dependent variable, greenhouse gas (GHG) emissions. The coefficients of GDP, GDP2, and GDP3 follow the expected +, −, + pattern of a cubic specification, indicating nonlinear income–environment dynamics. However, the implied turning points are not observed within the sample range, suggesting that a full N-shaped EKC trajectory is not empirically supported for G20 countries. Renewable energy consumption and R&D investment have negative coefficients, suggesting they help reduce environmental degradation. Fossil fuel consumption significantly increases ecological pressure, whereas nuclear energy shows a positive but insignificant effect. The findings remain robust across alternative estimators and when GHG emissions are used. Overall, the findings indicate that economic growth alone cannot ensure environmental sustainability, underscoring the need for renewable energy expansion, technological innovation, and reduced reliance on fossil fuels.
1. Introduction
Global warming and climate change have emerged as some of the most serious global challenges, posing significant risks to environmental sustainability, economic stability, and human well-being. These challenges are particularly evident and widely discussed among the Group of Twenty (G20) countries, which play a dominant role in the global economy and are major contributors to environmental degradation. Collectively, the G20 economies account for nearly 75% of global greenhouse gas (GHG) and carbon dioxide (CO2) emissions, making their environmental performance crucial for achieving international climate targets [1]. Despite growing global awareness and international agreements aimed at limiting global temperature increases to 1.5 °C above pre-industrial levels, environmental pressure continues to intensify [2]. Rapid industrialisation, urban expansion, rising consumption, and increasing energy demand have placed unprecedented stress on natural ecosystems [3]. Moreover, economic growth in many G20 countries remains closely linked to energy-intensive production structures [4]. Therefore, understanding the environmental consequences of economic activity in the G20 region is essential for designing effective and globally relevant sustainability policies.
Recently, G20 countries have faced complex economic, environmental, and geopolitical challenges that have intensified environmental degradation. While economic growth remains a key policy objective, its environmental implications have become increasingly evident. According to the Organisation for Economic Cooperation and Development [5], economic growth across G20 countries slowed significantly in 2022, reflecting challenges in the post-pandemic recovery, inflationary pressures, and global uncertainty. Although some countries experienced short-term growth and development, overall economic performance remained uneven across the group. In response to environmental threats, G20 governments have emphasised collective action through cleaner, more transparent, and flexible energy systems. Following the COVID-19 pandemic, G20 countries committed at least 1.10 trillion USD during 2020–2021 to support alternative and cleaner energy sources [6]. Nevertheless, emission reductions have remained limited, highlighting the difficulty of balancing economic recovery with long-term environmental sustainability.
Energy consumption patterns are a central driver of environmental outcomes in the G20 region. Fossil fuels continue to dominate the energy mix in many G20 countries, particularly during periods of energy insecurity. Recent geopolitical developments, including Russia’s war with Ukraine, have disrupted global energy markets and intensified reliance on coal, oil, and natural gas [7]. At the same time, renewable energy adoption has expanded, but unevenly across countries. Studies indicate that countries such as Brazil and Canada have made significant progress in renewable electricity generation, while several oil-dependent economies remain heavily reliant on nonrenewable energy sources [8]. Nuclear energy also plays an important role in the energy mix of some G20 countries, raising ongoing debates regarding its environmental benefits and risks. These contrasting energy structures suggest that the environmental impacts of energy use vary substantially across G20 economies, underscoring the need for comprehensive and long-run analysis.
Research and development (R&D) investment has become an increasingly important factor in addressing environmental challenges, technological improvement, and promoting sustainable growth. The G20 countries account for approximately 70% of global research and development (R&D) expenditure and employ nearly 87% of the world’s researchers, underscoring their central role in global innovation [9]. Technological progress can contribute to environmental improvement by enhancing energy efficiency, facilitating the diffusion of renewable energy technologies, and reducing emissions associated with production and consumption. Empirical evidence suggests that innovation-driven growth can decouple economic expansion from environmental degradation when R&D is directed toward clean and efficient technologies [10]. However, technological progress may also increase energy consumption if innovation is primarily growth-oriented rather than environmentally focused. Therefore, assessing the environmental impact of R&D investment within the G20 context is critical for understanding whether innovation supports or undermines sustainability objectives.
A growing body of empirical literature has examined the relationship between economic growth, energy use, and environmental degradation using the Environmental Kuznets Curve (EKC) framework. Several studies have confirmed the presence of an inverted U-shaped EKC, suggesting that environmental pressure initially increases with income but declines after a threshold of development [11,12]. More recent research has incorporated innovation and R&D variables, showing that technological progress can play a key role in reducing emissions in the long run [13,14]. However, much of the existing evidence relies on linear or quadratic income specifications and therefore focuses mainly on monotonic or inverted U-shaped relationships. This conventional approach may not fully capture the evolving nature of the growth–environment nexus, particularly for large and diverse economies where environmental gains can be followed by renewed pressure at higher income levels. In this regard, the N-shaped EKC framework provides an important extension because it allows environmental degradation to rise again after an initial improvement phase, reflecting mechanisms such as rebound effects from efficiency gains, expansion of consumption and mobility, increased material throughput, and shifts in production and trade patterns. Despite its conceptual relevance, empirical research on N-shaped dynamics remains limited and fragmented, and the evidence is especially scarce for the G20 context, where heterogeneous development stages and strong global linkages may produce more complex non-linear environmental trajectories.
This study addresses these gaps and offers several novel contributions to the EKC and energy–environment literature. First, it applies a cubic EKC specification by incorporating GDP per capita, GDP2, and GDP3, enabling the joint testing of both inverted U-shaped and N-shaped EKC hypotheses within a unified empirical framework. This is conceptually important because it recognises that environmental improvements associated with structural transformation and technological progress may not be permanent, and that long-run sustainability may depend on whether countries avoid crossing an upper-income threshold after which ecological pressure can increase again. In contrast to studies that test only the quadratic EKC and implicitly assume a single turning point, the cubic specification allows for multiple turning points and thus provides richer information about the stages of the development process at which environmental conditions improve or deteriorate. Empirically, this contribution is highly relevant for the G20 because the group includes both advanced economies that may have already reached high-income stages and emerging economies that are still approaching such thresholds. Therefore, the cubic EKC framework generates new insights for G20 policy debates by helping distinguish whether observed environmental improvements are likely to persist or whether additional environmental pressure may re-emerge as incomes continue to rise.
Second, the study extends the EKC framework by jointly examining economic growth, energy structure, and innovation within the same model for G20 countries. Specifically, it evaluates the environmental effects of renewable energy, fossil fuels, and nuclear energy alongside R&D investment, which is a key driver of technological change and energy transition. This integrated approach is both conceptually and empirically important because growth effects cannot be properly interpreted without considering the underlying energy mix and the innovation capacity that shapes production technology, energy efficiency, and the pace of decarbonisation. Moreover, G20 policy discussions increasingly focus on how to balance economic expansion with rapid energy transition, including scaling renewables, reducing fossil dependence, and promoting innovation-led mitigation strategies. By combining the cubic EKC model with explicit energy-source channels and R&D, this study provides more policy-relevant evidence on which levers are most effective for sustaining environmental improvements across different development stages. In addition, the study strengthens empirical credibility by using the ecological footprint as the primary environmental indicator—capturing broader ecological pressures beyond CO2 emissions—and by employing GHG emissions as an alternative measure for robustness. Overall, the contributions of this paper lie not only in methodological rigour but also in generating deeper conceptual understanding and more actionable empirical evidence for G20 countries seeking long-term environmental sustainability.
2. Review of Empirical Literature
2.1. Existing Research Insights
The EKC theory posits a link between environmental degradation and economic growth, and it has been supported by research across various fields [15,16]. In reviewing the existing literature, the EKC is increasingly used to assess the effects of economic processes on environmental sustainability. Sinha et al. [17] examined the EKC model for N-11 countries from 1990 to 2014, and found an N-shaped relationship, with refillable energy and GDP minimizing GHG emissions. Another research group, Chen et al. [18], analyzed how GHG emissions in China are affected by GDP, foreign trade, and the use of refillable and non-refillable resources from 1980 to 2014. They employed the ARDL and VECM methods. The concluding outcomes indicated that the EKC model was irrefutable there and that economic growth and nonrenewable resource use positively affected ecological degradation. Refillable power and trade negatively impacted environmental degradation. Degirmencioglu Aydin and Aydin [19] examined the environmental sensitivity of Turkey’s leading economic sectors using the EKC hypothesis. Their empirical results showed that the EKC hypothesis holds only for construction firms. They also emphasized the negative impact of construction companies on environmental quality. Aydin et al. [14] tested the validity of the EKC hypothesis in 20 European Union countries. The results revealed that the EKC hypothesis was valid only for Austria, the Netherlands, Poland, and Slovenia. Gormus and Aydin [20] examined the relationships among renewable energy consumption, innovation, and the ecological footprint in the top 10 innovative economies within the framework of the EKC hypothesis. Their long-term estimation results indicated that the EKC hypothesis holds only for Israel. Wang et al. [21] examined the relationship between renewable energy and CO2 emissions across 208 countries within the EKC framework. They discovered that an inverted U-shaped relationship exists and that renewable energy consumption reduces CO2 emissions.
Cherni & Essaber [22] investigated how refillable energy and GDP determine CO2 emissions in Tunisia. The ARDL result concluded that GDP, carbon emissions, and renewable energy were stable for longer. Hashmi et al. [23] contemplated that trade openness positively influences the environment in the short and long run using the ARDL model for Pakistan from 1971 to 2014. Atsu and Adams [24] examined whether policy uncertainty drives emissions and showed how energy resources and finances affect climate change in BRICS countries from 1984 to 2017. They reported that conventional energy sources and policy uncertainty contributed to increased carbon emissions, whereas renewable energy financing helped reduce CO2 emissions. Shao et al. [25] examined how ecologically sound technologies and refillable energy sources affected spinouts in N-11 countries from 1980 to 2018. They stated that environmentally sound technologies and refillable energy significantly and negatively impact carbon emissions. From 1990 to 2018, Ibrahim & Ajide [10] analyzed the influence of trade liberalization and dependence on non-refillable power on environmental standards in the G20 countries. Carbon emissions increased when using nonrenewable energy sources, decreased when exporting, and decreased further when technological advancements were used. Ozcan and Ulucak [26] performed tests in India to confirm the EKC hypothesis. The dynamic ARDL estimation technique demonstrated the importance of nuclear power and population expansion in developing the EKC hypothesis. Rahman et al. [27] used the EKC model to examine the environmental implications of tourism across the top 10 global tourist destinations from 1972 to 2021.
Yan et al. [28] used the EKC hypothesis to examine how renewable energy, technical innovation, GDP, and population of the G20 countries affected their CO2 output. During 1990–2017, Chien et al. [29] examined the effects of green technology and environmental taxation on air quality in leading Asian nations. According to their findings, CS-ARDL stated that eco-innovation, environmental fees, and technology had a detrimental effect on CO2 and PM2.5 levels. Alternatively, the elevated levels of CO2 can be solely attributed to the widespread adoption of fossil fuels. From 1990 to 2018, Ding et al. [30] identified correlations among energy productivity, eco-innovation, and CO2 emissions across the G7 nations. They concluded that consumption-based carbon emissions are mainly driven by reusable energy, exports, GDP, and energy production, whereas refillable energy and innovations have a negative effect on emissions. Dong et al. [31] examined the relationship between renewable energy consumption and CO2 emissions in 120 countries. Their empirical results showed that renewable energy consumption reduces CO2 emissions. They also emphasized that renewable energy is crucial in formulating global, sustainable, and coordinated energy.
Several studies have examined the relationship between globalization, financial development, and environmental quality in major economies. For example, Shahbaz et al. [32] reported that globalization and financial development significantly influence carbon emissions across large panel economies. Yao & Tang [33] examined how CO2 emissions were affected by the financial structures of G20 nations. The results demonstrated that productivity and the monetary framework positively contributed to environmental degradation. Yao et al. [34] analyzed the predominant factors driving CO2 emissions in G20 countries. They reported that the economic upswing was the dominant factor contributing to GHG emissions and that population density positively impacted carbon emissions. Chen et al. [35] investigated how CO2 emissions were affected by income inequalities among the G20 nations from 1988 to 2015. They revealed that economic disparity helped mitigate carbon emissions, but income inequality did not significantly affect CO2 levels in some developing countries. Alotaibi & Alajlan [36] analyzed how socioeconomic factors, including economic expansion, the use of sustainable energy sources, fossil fuels, and CO2 emissions, were correlated across G20 countries from 2000 to 2019. They tested the EKC hypothesis, which was accurate at the time, and examined how fossil fuels positively affected carbon emissions. Xu et al. [37] analyzed the conditions of G20 nations to determine how biofuel consumption and urbanization impacted CO2 emissions from 2001 to 2017 and applied a fully modified OLS method. The results illustrated that the EKC hypothesis supports the relationship between GDP and CO2. It also concluded that biofuels reduced CO2 emissions, thereby mitigating them, whereas urbanization increased them.
Another researcher, Tzeremes [38], examined how CO2 emissions were impacted by factor productivity and energy consumption for G20 countries from 1971 to 2017. They found nonlinear causality between the variables. Nguyen et al. [11] conducted a study for the G20 to observe how information and communication technology and innovation systems contributed to mitigating CO2 emissions from 2000 to 2014. Their research suggested that FDI, technology, and innovation helped reduce environmental degradation; in contrast, information and communication technology also positively affected CO2 emissions. Voumik et al. [39] analyzed how the environment is affected by urbanization, industrialization, electrification, and alternative energy sources in the BRICS countries spanning 1972 to 2021, using the advanced CS-ARDL procedure. The results showed that urbanization, industrialization, and electrification positively affected environmental degradation, but renewable energy can improve ecological conditions by reducing carbon emissions. Razzaq et al. [40] examined how CO2 emissions are affected by growth in environmentally friendly technologies across the BRICS nations from 1990 to 2017. The results showed that green technology helped mitigate consumption-based carbon emissions in higher-emission quantiles.
The findings demonstrated that, in the long run, carbon outputs are immune to population fluctuations and that fossil fuels harm environmental quality. In addition, various development methods help boost the economy and alleviate carbon emissions. Awan and Azam [41] examined the link between average GDP growth and pollution levels in the G20. They verified the existence of an EKC in the shape of an N. Variables, including energy consumption, social globalization, and technological advancement, are also considered. They used the Driscoll–Kraay and LM bootstrapping methods. Ansari et al. [42] investigated the development of the EKC in G20 countries between 1991 and 2016. An inverted N-shaped association exists between environmental degradation and economic development in nations. Furthermore, globalization, renewable energy consumption, and urbanization enhance ecological quality in G20 nations, whereas nonrenewable energy (NRE) worsens environmental quality. Hence, greenfield energy investment is pivotal for sustained growth. Usman et al. [43] investigated the impact of renewable energy consumption and R&D investments on the ecological footprint of European Union countries within the EKC framework. The results revealed that the EKC hypothesis is valid only for Finland. They emphasized that European Union countries should support the green innovation process to build a sustainable environment.
2.2. Development of Research Hypotheses
This study develops its hypotheses based on the EKC framework and the role of energy structure and technological innovation in shaping environmental outcomes. The EKC theory suggests that environmental degradation initially increases with economic growth, driven by higher production and energy demand. Still, it may decline at later stages as cleaner technologies and environmental regulations are adopted. However, in highly industrialized economies, rising consumption and energy intensity may again exert upward environmental pressure, leading to more complex nonlinear patterns. In addition, renewable energy, fossil fuels, nuclear energy, and R&D are expected to influence environmental quality through different channels. Based on these theoretical arguments, the following hypotheses are formulated.
- (a)
- N-Shaped EKC Hypothesis:
H1:
An N-shaped relationship exists between GDP per capita and EFP such that GDP increases environmental pressure, GDP2 reduces it, and GDP3 increases it again, reflecting the complex and nonlinear nature of the growth–environment relationship.
- (b)
- Impact of Renewable Energy:
H2:
Renewable energy is negatively related to the EFP, suggesting that higher utilization of renewable energy contributes to a lower ecological footprint.
- (c)
- Impact of Fossil Fuel Consumption:
H3:
Fossil fuel is positively correlated with the EFP, indicating that reliance on fossil fuels contributes to environmental degradation.
- (d)
- Impact of Nuclear Energy:
H4:
Nuclear energy has a negative relationship with the EFP, suggesting that greater reliance on nuclear energy reduces the EFP relative to fossil fuel consumption.
- (e)
- Impact of Research and Development:
H5:
R&D is negatively associated with the EFP, suggesting that increased investment in research and innovation leads to more sustainable practices and technologies that mitigate environmental impacts.
2.3. Identified Research Gaps
Although the EKC has been widely examined, empirical evidence for G20 countries remains fragmented, particularly when broader environmental indicators such as the ecological footprint are considered. Existing studies on G20 economies often focus on a limited set of explanatory variables or rely mainly on carbon emissions, thereby overlooking the joint role of renewable energy, fossil fuels, nuclear energy, and R&D in shaping environmental outcomes [4,5,8,11]. Moreover, most prior research primarily tests linear or quadratic EKC specifications that assume either a monotonic or inverted U-shaped relationship between growth and environmental degradation [12,13,20,26,27]. Such approaches may oversimplify the growth–environment nexus and fail to consider more complex nonlinear dynamics. N-shaped EKC testing is important because the possibility of renewed environmental pressure at higher income levels is complex and diverse [41]. Consequently, the empirical relevance of the cubic or N-shaped EKC remains underexplored in the G20 context.
In addition, much of the literature employs first-generation panel estimators that assume CSD and SH, which may be unrealistic for economically integrated countries such as the G20 [4,27]. Ignoring CSD and SH can lead to biased and inconsistent long-run estimates [11,17]. To address these conceptual and methodological limitations, this study applies a second-generation CS-ARDL framework. It adopts a cubic EKC specification that enables more comprehensive testing of nonlinear and rebound effects. Robustness is further ensured by using greenhouse gas emissions as an alternative dependent variable and by employing FMOLS and DOLS estimators, which are well-suited for addressing endogeneity and serial correlation in cointegrated panels [4]. Consequently, this study provides more reliable, comprehensive, and policy-relevant evidence on the growth–environment nexus in G20 economies.
3. Data and Methodology
3.1. Data and Variables
The research applied data from various sources. Data for ecological footprints were obtained from the Global Footprint Network [44]. Information on GHG, GDP per capita, fossil fuel energy consumption, and nuclear energy use was collected from the World Bank’s World Development Indicators database [45]. Data on renewable energy consumption and R&D expenditure were sourced from the OECD statistics database [46]. All variables were transformed into logarithmic forms to reduce scale differences and improve estimation accuracy. Detailed descriptions of the variables and their meanings, along with basic statistics, are provided below. In this study, economic growth is proxied by GDP per capita (constant 2015 US$), following the EKC literature. Data was collected from 1994 through 2023. The list of the G20 countries included in this study is provided in Appendix A. The variables discussed in this research are presented in Table 1. To address missing observations, linear interpolation was used for internal data gaps, while extrapolation was applied for missing values at the beginning or end of the sample period. This procedure ensured a balanced panel and preserved the time-series structure of the variables.
Table 1.
Description of Study Variables and Their Sources.
3.2. Theoretical Framework and Extended EKC Proposition
This study is grounded in the EKC hypothesis, which explains the dynamic relationship between economic growth and environmental degradation. The EKC framework addresses a fundamental policy question: what happens to environmental sustainability as income levels continue to rise, particularly in major economies such as the G20? As incomes and living standards increase across G20 countries, it becomes essential to examine whether economic growth eventually leads to environmental improvement or persistent ecological damage. The traditional EKC hypothesis proposes an inverted U-shaped relationship between income and environmental degradation. In the early stages of economic development, industrial expansion, urbanization, and increased energy demand lead to higher pollution levels. At this stage, environmental protection is often a lower priority compared to economic growth. However, as income rises beyond a certain threshold, societies demand cleaner environments, governments introduce stricter environmental regulations, and firms adopt cleaner technologies. As a result, environmental degradation begins to decline, leading to an inverted U-shaped EKC [47,48,49,50].
While the inverted U-shaped EKC has been widely accepted, recent studies argue that this relationship may not remain stable over time, particularly in highly developed and rapidly growing economies. This has led to the concept of the N-shaped EKC, which extends the traditional framework. The N-shaped EKC suggests that after an initial decline in environmental degradation at higher income levels, pollution may increase again when income continues to rise. This renewed increase may result from higher consumption, more energy-intensive lifestyles, and larger production-scale effects that outweigh technological and regulatory improvements [41,51]. The extended EKC framework is particularly relevant for G20 countries. These economies are characterized by rapid industrialization, high levels of energy consumption, technological advancement, and strong global economic integration. While many G20 countries have made progress in environmental regulation and clean energy adoption, rising consumption and production pressures may still pose long-term environmental risks. Therefore, relying solely on the traditional inverted U-shaped EKC may provide an incomplete understanding of the growth–environment nexus in these economies.
From a theoretical perspective, the N-shaped EKC is particularly plausible for G20 economies given their advanced levels of industrialization, high income levels, and intensive consumption patterns. In the initial stage of development, economic expansion increases environmental pressure through higher production, urbanization, and fossil-fuel-based energy use (scale effect). As income rises further, technological innovation, environmental regulations, and the adoption of cleaner energy improve environmental efficiency, leading to a temporary decline in ecological degradation (technological effect). However, at very high income levels, additional income often stimulates greater consumption, transportation demand, energy-intensive lifestyles, and globalized production networks, which may offset earlier environmental gains. These rebound and consumption effects can re-increase environmental pressure despite technological progress, generating a second upward turn in pollution. Given that G20 countries account for the majority of global GDP, energy demand, and material consumption, such nonlinear transitions are more likely to emerge in these economies. Therefore, a cubic or N-shaped EKC provides a more realistic framework than the traditional inverted-U model for capturing long-run growth–environment dynamics in the G20 context.
To capture this complexity, the present study adopts an extended EKC model that incorporates GDP per capita, GDP per capita squared (GDP2), and GDP per capita cubed (GDP3). This specification allows the analysis to test N-shaped EKC patterns simultaneously. In addition, the framework integrates key energy and innovation-related variables, including renewable energy, fossil fuel consumption, nuclear energy, and R&D, which are closely linked to environmental outcomes in G20 countries [52]. These variables help explain how structural changes in energy use and technological progress influence ecological sustainability alongside economic growth. In this context, the theoretical framework of this study proposes that economic growth initially increases environmental pressure, followed by potential improvement due to technological progress and policy intervention, and possibly renewed degradation at higher income levels. Accordingly, the primary objective of this paper is to empirically test the validity of N-shaped EKC hypotheses for G20 countries using an extended EKC framework. The formal representation of the N-shaped EKC relationship is presented in Equation (1).
To learn more about how environmental factors affect development, economists employ the concept of EKC. Equation (1) presents the EKC, where ED stands for environmental devastation; the research used ecological footprint and greenhouse gas emissions as proxies for environmental degradation. GDP2 denotes the square of GDP, and GDP3 denotes the cube of GDP. A positive , negative , and positive indicate an N-shaped relationship, implying that environmental pressure may rise again at higher income levels. The vector includes additional control variables, such as renewable energy, fossil fuels, nuclear energy, and R&D, that influence environmental outcomes. is the intercept term, and denotes the error term. Equation (2) is the elaboration form of Equation (1).
Equation (2) presents the functional form of the extended EKC model, where the EFP is expressed as a function of economic growth, energy structure, and innovation variables. This specification follows Mekhzoumi et al. [52] and allows examination of both nonlinear income effects and additional environmental determinants.
The statistical measures to explain the proposed model are shown in Equation (3) below.
where EFP is the ecological footprint, REN indicates renewable energy, FOS specifies fossil fuel consumption, and R&D indicates research and development. All data were converted into natural logarithms before econometric analysis. and capture the nonlinear impact of GDP per capita and enable testing of N-shaped EKC patterns. Log transformation reduces scale differences and heteroscedasticity concerns [53,54,55]. To examine the robustness of the findings, GHG emissions are used as an alternative dependent variable in Equations (4) and (5).
Here, β0 is the intercept term, and the slope coefficients range from β1 to β7; positive values indicate increased environmental pressure, and negative values imply environmental improvement. Here, i and t denote the cross-sectional indicators and time. The coefficient of R&D is presumed to be negative. In addition, renewable energy can alleviate GHG emissions; thus, nuclear energy is also expected to be negative. The economies of the G20 nations are also expanding sufficiently. Energy demand rises with economic expansion, and energy use directly impacts natural resources. Hence, GDP and fossil fuel coefficients are supposed to be positive.
3.3. Econometric Methodology
Figure 1 shows how the methodology section of this paper will be implemented, along with the steps and tests in place to determine the pre- and post-estimations. The following are reasons this research used second-generation panel methods. Trade, tourism, education, and many bilateral treaties tie the G20 countries together in many ways. Accordingly, ignoring CSD may lead to biased estimates. After confirming the CSD problem, the paper cannot use traditional unit root and cointegration tests. A second-generation unit root test and cointegration test were employed in this study. “Panel cointegration” experiments, such as those by Westerlund [56], examined long-term connections. To test the short- and long-run assessments, this paper applied CS-ARDL estimation. It is necessary to assess robustness to confirm the validity of our model and findings. This study used two dynamic estimators, DOLS and FMOLS, to check for robustness.
Figure 1.
Analysis flow of methodology [57,58].
3.3.1. Cross-Sectional Dependence (CSD) Test
The prevalence of the CSD problem in panel data econometrics is expected to increase as economic integration grows and other barriers are removed [59]. Forgetting about the CSD issue and assuming that cross-sections are unrelated leads to a different conclusion, and findings can be biased, misleading, and inconsistent [58]. Medium-scale panel data econometrics with minimally exogenous CSD were used in this investigation [60]. Considering the CSD when performing unit root tests using panel data econometrics is recommended. Equation (6) presents the formal test statistic, where denotes the number of cross-sectional units (countries), represents the time dimension, and is the pairwise correlation of the residuals between countries i and j. The test measures the average correlation across all cross-sections to detect the presence of common shocks. A significant CSD statistic indicates cross-sectional dependence, justifying the use of second-generation panel techniques such as CS-ARDL.
In practical terms, cross-sectional dependence means that economic or environmental shocks affecting one country may simultaneously influence other countries in the panel. This is particularly relevant for G20 economies, which are highly interconnected through trade, financial markets, energy systems, and global policy coordination. For example, global oil price fluctuations, financial crises, or climate policies can affect multiple countries at the same time. The CSD test therefore checks whether countries behave independently or are influenced by shared global factors. If dependence is present, conventional panel methods that assume independence become unreliable, making second-generation approaches more appropriate.
3.3.2. Unit Root Test
Because of slope inconsistency and “cross-sectional dependence,” the findings of conventional stationarity tests, such as those of Pedroni [61] and Kao and Chiang [62], may be misguided [63]. Therefore, this study applies to the cross-sectionally augmented IPS (CIPS) unit root test proposed by Pesaran [64], which is suitable for panels of interconnected economies such as the G20. Equation (7) presents the CIPS statistic, where denotes the number of countries, represents the time dimension, and is the cross-sectionally augmented ADF t-statistic for each country. The CIPS value is calculated as the average of these individual statistics across all cross-sections. A significant CIPS result indicates stationarity while properly accounting for cross-sectional dependence and slope heterogeneity.
3.3.3. Panel Cointegration Test
First-generation cointegration tests [65,66,67] fail to address the CSD problem, making it difficult to determine the nature of panel data using these techniques. Kao et al. [68] and Pedroni [69] ignored CSD in their analyses of cross-sectional data. Given the data’s CSD, heterogeneity, and mixed-order stationarity, Westerlund’s [56] technique is used to test for cointegration. This study uses Westerlund’s [56] second-generation panel cointegration method to examine the cointegration relationships between the relevant variables. We generated statistics for a four-panel cointegration test based on error-correction models using data from multiple panels.
Equations (8)–(11) present the Westerlund error-correction–based statistics, including two group statistics (, ) and two panel statistics (, ). The group statistics test cointegration for each cross-sectional unit, whereas the panel statistics test cointegration for the entire panel. Significant test statistics lead to rejection of the null hypothesis of no cointegration, indicating a stable long-run relationship among the variables.
3.3.4. Cross-Sectionally Augmented ARDL (CS-ARDL) Estimation
To account for cross-sectional dependence (CSD), slope heterogeneity, and mixed orders of integration across variables, this study employs the Cross-Sectionally Augmented Autoregressive Distributed Lag (CS-ARDL) model developed by Chudik et al. [70]. G20 economies are highly interconnected through trade, financial markets, and global energy systems, making cross-country spillovers and common shocks likely. Conventional panel estimators that assume cross-sectional independence may therefore produce biased and inconsistent results [71]. The CS-ARDL approach overcomes these limitations by incorporating cross-sectional averages of the variables, which capture unobserved common factors such as global economic cycles, energy price fluctuations, and technological diffusion. In addition, the model accommodates heterogeneous dynamics across countries and allows estimation of both short-run adjustments and long-run equilibrium relationships.
The choice of CS-ARDL is motivated by the need to obtain reliable estimates in the presence of endogeneity, feedback effects, and dynamic interactions among economic growth, energy consumption, and environmental outcomes. By including lagged terms and cross-sectional averages, the estimator controls for simultaneity bias and omitted global influences while remaining valid for variables integrated at different orders. As a robustness check, FMOLS and DOLS estimators are also employed, and the consistency of results across methods supports the stability of the findings. It should be noted that the contribution of this study lies not merely in the application of an advanced econometric technique, but in the policy-relevant insights derived from reliable estimation of the growth–energy–environment nexus in G20 countries.
Equation (12) presents the CS-ARDL specification, where is the dependent variable, represents the vector of explanatory variables (GDP, GDP2, GDP3, REN, FOS, NUC, and R&D), and lagged terms capture both short-run adjustments and long-run equilibrium relationships. The coefficients , , and measure the dynamic effects of past environmental and economic factors, while denotes the error term. In intuitive terms, the CS-ARDL model examines how current environmental pressure in each country depends not only on its own past values and domestic economic conditions but also on global influences shared across countries. By incorporating cross-sectional averages, the model captures common external factors—such as worldwide energy price shocks, technological diffusion, or international climate policies—that simultaneously affect all G20 economies. The lagged structure allows the model to distinguish short-run responses from long-run equilibrium effects, showing how quickly environmental indicators adjust after economic or policy changes. This feature makes CS-ARDL particularly suitable for analyzing interconnected economies where national outcomes are shaped by both domestic dynamics and global forces.
Equation (12) is the famous CS-ARDL Equation:
where and .
3.3.5. Robustness Analysis Using FMOLS and DOLS
In panel estimation, the ordinary least squares method yields inefficient estimators, and endogeneity and serial correlation among the explanatory variables are often present. Consequently, this study considers the use of DOLS and FMOLS. Because the variables are cointegrated, dynamic OLS is used to estimate their behavior. This DOLS model was first developed by Stock and Watson [72]; however, Kao et al. [73] later formulated the idea. The OLS technique produces biased results due to endogeneity [74]. Along with DOLS, this study used FMOLS to assess robustness. Moreover, FMOLS is appropriate because the data is first-order cointegrated [69]. Because of endogeneity, the results are biased. This model addresses the bias problem by incorporating a semi-parametric correction in OLS [75]. In addition, the FMOLS method is used to identify parameters that matter in the long run.
4. Results and Discussion
4.1. Empirical Results
Table 2 summarizes the statistics for all variables. Regarding mean values, nuclear power is at its lowest, while GDP squared is at its highest. GHG displays a mean of 13.56, reflecting substantial emissions, with a relatively low standard deviation of 1.073. GDP has a mean of 27.84, indicating substantial economic output, while GDP3 has a mean of 778.8, illustrating the dispersion in economic magnitudes across the G20 nations. These descriptive statistics offer a comprehensive snapshot of the dataset’s central tendencies and variability, providing crucial insights for subsequent econometric analysis.
Table 2.
Summary of descriptive statistics for study variables.
Table 3 shows the Correlation Matrix between the variables in the study. GDP and ecological footprint exhibit a positive correlation (0.4317), indicating that higher economic activity is associated with increased environmental pressure. Renewable energy has a negative correlation with fossil fuels (−0.519), suggesting that increased use of renewable energy reduces dependence on fossil fuels. Additionally, nuclear energy shows a positive correlation with renewable energy (0.6754), highlighting complementary roles in energy transitions.
Table 3.
Pairwise correlation coefficients among the variables.
Table 4 displays the Variance Inflation Factor (VIF) and 1/VIF values for the model variables, indicating the level of multicollinearity. All variables have VIF values below 10, indicating acceptable multicollinearity. The large VIF for the constant term is a common outcome in models including polynomial terms and does not indicate problematic multicollinearity among the regressors. The VIF values for all regressors remain within acceptable limits, suggesting that multicollinearity is not a serious concern. Therefore, the estimated coefficients are reliable and statistically stable.
Table 4.
Multicollinearity Diagnostics Based on VIF and 1/VIF.
Following the procedure described in Section 3.3.1, the Pesaran CSD [60] test is applied to examine cross-sectional dependence among the variables, and the results are reported in Table 5. The test statistics are significant for all variables at the 1% level, indicating strong cross-sectional dependence across G20 countries. This confirms the presence of common shocks and interconnections, justifying the use of second-generation panel techniques such as CS-ARDL.
Table 5.
Evidence of Cross-Sectional Dependence among Variables.
Given the presence of CSD, the second-generation CIPS unit root test outlined in Section 3.3.2 is applied to assess the stationarity properties of the variables. The results reported in Table 6 indicate that most variables are stationary at level, i.e., integrated at order I(0), while renewable energy (REN) becomes stationary after first differencing, i.e., I(1). Importantly, no variable is integrated at order I(2), confirming the suitability of the dataset for subsequent CS-ARDL estimation.
Table 6.
Second-generation CIPS unit root test.
Following the methodology described in Section 3.3.3, the Westerlund cointegration test [56] is applied to examine the existence of long-run relationships among the variables, and the results are reported in Table 7. The significant test statistics (particularly under the no-break and regime-shift specifications) lead to rejection of the null hypothesis of no cointegration. These findings confirm the presence of a stable long-run equilibrium relationship among the variables in the G20 panel.
Table 7.
Westerlund and Edgerton’s [58] results for the panel cointegration test.
Following Section 3.3.4, the CS-ARDL model is applied to estimate both the short-run and long-run effects on the ecological footprint in G20 countries. The results are reported in Table 8. The long-run estimates indicate that economic growth significantly increases environmental pressure. Specifically, a 1% increase in GDP increases the ecological footprint by 2.361%, suggesting that economic expansion intensifies environmental degradation in the G20 economies. This finding is consistent with An et al. [76], Khan et al. [77], Atasoy [78], Bhatti et al. [79], and Anees et al. [80], who also report that economic growth is associated with higher environmental pressure. However, this result differs from Zhang et al. [81], Usman et al. [82], Erdogan et al. [83], and Dogan et al. [84], who document cases where economic growth contributed to environmental improvements. The coefficient of GDP2 is negative and statistically significant, indicating that environmental pressure may slow as income increases. Specifically, a 1% increase in GDP2 reduces the ecological footprint by 0.439%. This finding suggests that structural changes, technological progress, and stronger environmental regulations may partially offset the environmental impacts of economic growth at higher income levels. Similar findings are reported by An et al. [76], Atasoy [78], and Erdogan et al. [83]. The coefficient of GDP3 is positive and statistically significant, indicating the presence of nonlinear income–environment dynamics under a cubic specification.
Table 8.
Determinants of Ecological Footprint Based on CS-ARDL Estimation.
In a cubic EKC model, turning points are identified by differentiating the function with respect to income and solving the resulting equation. However, the estimated coefficients in this study do not generate real turning points within the sample range, meaning that the marginal effect of economic growth on the ecological footprint remains positive. Therefore, although the coefficients follow the expected +, −, + pattern of a cubic specification, the results do not support a complete N-shaped EKC for the G20 countries during the study period. This suggests that economic growth alone is not sufficient to reduce environmental pressure and that stronger environmental policies are required.
Regarding energy variables, renewable energy consumption has a negative and significant effect on the ecological footprint. A 1% increase in renewable energy use reduces the ecological footprint by 0.103%, confirming that clean energy adoption contributes to environmental sustainability. This finding is consistent with Ahmad et al. [85], Zhang et al. [81], Paramati [86], Chien et al. [87], and Nica et al. [88]. In contrast, fossil fuel consumption significantly worsens environmental quality: a 1% increase in fossil fuel use raises the ecological footprint by 2.058%, underscoring the dominant role of nonrenewable energy in environmental degradation. This result supports the findings of Erdogan et al. [83] and Akter et al. [89]. The coefficient of nuclear energy is positive but insignificant, suggesting that nuclear energy does not play a decisive role in reducing ecological footprint in G20 countries. This insignificance may be due to the relatively small share of nuclear power in the overall energy mix and the large differences in nuclear adoption and regulation across G20 countries, which limit its measurable environmental impact. This result contradicts Usman et al. [82], who reported that nuclear energy has an emission-reducing effect. Meanwhile, R&D investment has a negative and significant effect, indicating that a 1% increase in R&D reduces the ecological footprint by 0.154%. This supports the view that innovation, energy efficiency, and technological advancement contribute to environmental improvement, consistent with the findings of Khan et al. [77] and Paramati [86].
In the short run, GDP and FOS remain positive and significant, while the coefficients for REN, GDP2, GDP3, and NUC are generally weaker and not consistently significant. At the same time, R&D can partially offset short-term environmental damage. The error-correction term is negative and highly significant, confirming a stable long-run equilibrium and indicating that deviations from long-run environmental balance are corrected rapidly.
Table 9 presents the robustness check results from the CS-ARDL model using GHG emissions as the alternative dependent variable, rather than the ecological footprint. The findings are broadly consistent with the main results reported in Table 8, confirming the robustness of the analysis. Economic growth and fossil fuel consumption continue to increase environmental pressure, while renewable energy and research and development contribute to emission reduction. Nuclear energy remains statistically insignificant. Overall, using GHG emissions as an alternative environmental indicator supports the reliability and stability of the baseline findings.
Table 9.
Determinants of Greenhouse Gas Emissions Based on CS-ARDL Estimation.
Consistent with the robustness approach outlined in Section 3.3.5, FMOLS and DOLS estimators are applied, and the results are presented in Table 10. The results are consistent with the baseline CS-ARDL findings, confirming the robustness of the long-run relationships. Both FMOLS and DOLS estimates support an N-shaped EKC relationship (GDP has a positive effect, GDP2 has a negative effect, and GDP3 has a positive effect), with all coefficients being statistically significant. Renewable energy and R&D investment continue to reduce environmental pressure, while fossil fuel consumption significantly increases ecological footprint across both estimators. Nuclear energy shows a positive but statistically insignificant effect. Overall, these findings confirm that the main results are not sensitive to the choice of econometric technique.
Table 10.
Robustness Check for the Long-Run Relationships: FMOLS and DOLS Results.
Table 11 summarizes the hypothesis-testing results based on the long-run CS-ARDL estimates.
Table 11.
Summary of hypothesis testing results based on long-run CS-ARDL estimates.
4.2. Discussion of Findings
The findings indicate a nonlinear relationship between economic growth and environmental pressure in G20 countries under a cubic specification. Economic expansion initially increases ecological pressure through higher energy use, industrial activity, and resource extraction. As income rises, improvements in technology, environmental awareness, and regulatory frameworks may slow the growth of environmental degradation. However, the estimated coefficients do not generate real turning points within the observed income range, indicating that a complete N-shaped EKC trajectory is not empirically confirmed. This suggests that environmental pressure may moderate at higher income levels but does not reverse direction during the study period. Similar patterns have been noted in previous studies highlighting complex growth–environment dynamics in advanced economies [90,91]. Therefore, relying solely on economic growth is unlikely to ensure long-term environmental sustainability without stronger environmental policies and structural changes.
Renewable energy emerges as a key mitigating factor in the empirical models. The negative, statistically significant coefficients indicate that increasing the share of renewable sources reduces both the ecological footprint and greenhouse gas emissions. This finding is consistent with [92,93], who report that solar, wind, and hydro power significantly improve environmental quality in G20 and other advanced economies by lowering carbon intensity and reducing dependence on fossil fuels. Likewise, Apergis and Payne [73] highlight that renewable energy adoption promotes cleaner growth trajectories through technological substitution. The present results reinforce the argument that energy transition policies are central to achieving sustainable development, particularly for countries seeking to decouple economic growth from environmental degradation.
Conversely, fossil fuels continue to pose significant environmental challenges. The positive, significant coefficients for fossil fuel use demonstrate a clear link between fossil fuel consumption and rising CO2 emissions and ecological degradation. Fossil fuels, including particularly coal, oil, and natural gas, release substantial greenhouse gases throughout their lifecycle, from extraction to combustion. This not only accelerates climate change but also contributes to air pollution, water contamination, and ecosystem disruption. In line with previous studies, the current findings reaffirm that dependence on fossil fuels undermines environmental sustainability in G20 nations [94,95,96]. Therefore, G20 countries must prioritize the gradual phase-out of fossil fuel dependence and redirect energy policies to expand renewable energy capacity and improve energy efficiency.
Although nuclear energy displays a positive effect in the models, its coefficients are statistically insignificant, suggesting that its impact on environmental sustainability is limited or varies widely across G20 nations. While nuclear power is carbon-neutral at the point of generation, it brings other environmental and safety concerns, including radioactive waste disposal, nuclear accidents, and high operational costs [97,98]. Radioactive waste can remain hazardous for thousands of years and requires specialized long-term storage, posing intergenerational environmental risks [97]. Moreover, public concerns regarding plant safety and accident risks continue to influence perceptions of nuclear energy as a sustainable solution [98]. These limitations may explain the modest role of nuclear energy in reducing emissions, despite its potential as a low-emission source. Nonetheless, in some countries with stable nuclear infrastructure, it may still serve as a transitional option in decarbonizing the energy mix. Empirical evidence suggests that nuclear energy can reduce carbon emissions and ecological footprint in certain contexts, but its overall environmental impact depends heavily on governance quality, waste management, and lifecycle externalities [99,100]. However, its broader application will require stringent safety protocols, effective waste management systems, and greater public trust in nuclear governance.
Finally, the study highlights the important contribution of R&D in advancing environmental sustainability. The negative and significant coefficients for R&D imply that investment in technological innovation plays a vital role in reducing the ecological footprint and greenhouse gas emissions. Through R&D, countries can discover new clean energy technologies, improve existing renewable energy systems, and enhance energy efficiency across industries. Innovations in recycling, circular economy models, and sustainable industrial processes further amplify the environmental benefits [101,102]. This evidence is consistent with findings by Jiang et al. [103] and Abbas [104], who find that technological innovation and green R&D reduce emissions by enhancing productivity and facilitating energy transition. Recent cross-country studies also confirm that environmental and energy-related R&D expenditures contribute significantly to lowering carbon emissions and ecological footprint by accelerating low-carbon technological change and improving resource efficiency [43]. Moreover, innovation-driven development supports the decoupling of economic growth from environmental degradation by promoting cleaner production processes and digital efficiency gains [105]. As a result, economies that prioritize R&D are better positioned to decouple economic growth from environmental harm and progress toward long-term sustainable development. Overall, the results underscore the importance of continued investment in R&D to drive the next generation of climate-friendly technologies and practices.
5. Policy Implications and Practical Insights
The results show that economic growth continues to increase environmental pressure in G20 countries, even though the cubic specification indicates nonlinear income–environment dynamics. Because the estimated coefficients do not produce turning points within the observed income range, higher income alone does not automatically lead to environmental improvement. Therefore, economic development strategies should integrate environmental considerations at every stage of growth. Governments should promote sustainable production, resource-efficient industries, and environmentally responsible consumption patterns as economies expand. In addition, economic planning should prioritize structural transformation toward less resource-intensive sectors and support cleaner industrial practices. These measures can help ensure that future economic growth does not translate into higher ecological pressure. For G20 countries, aligning economic development with environmental sustainability is essential to achieve long-term balanced growth.
To ensure sustainable development and reduce greenhouse gas emissions, G20 countries must take strong action to replace fossil fuels with renewable energy. Fossil fuels such as coal, oil, and gas are the major contributors to global warming and environmental damage. Shifting toward renewable sources such as solar, wind, hydro, and biomass can significantly reduce the ecological footprint. Governments should support this transition by offering financial incentives, such as subsidies for renewable energy projects and tax breaks for companies and households that adopt clean energy. Public awareness campaigns and education about the environmental and health risks of fossil fuels should also be promoted. Furthermore, strict environmental standards and regulations must be enforced to discourage continued reliance on polluting fuels.
At the same time, fossil fuel consumption should be gradually phased out through higher carbon taxes or increased prices on coal, gas, and oil. This approach would make nonrenewable energy less attractive and push consumers and industries to adopt cleaner alternatives. In addition, G20 nations should invest in upgrading their energy infrastructure to support the integration of renewables into the grid. As for nuclear energy, although it emits far fewer greenhouse gases than fossil fuels, it requires careful handling due to safety concerns and the long-term storage of radioactive waste. Governments must ensure that nuclear power plants follow the highest safety standards and conduct regular checks. If appropriately managed, nuclear energy can serve as a transitional or supplementary source alongside renewables in the journey toward carbon neutrality.
Nuclear energy, though showing an insignificant statistical impact in this study, holds potential as a transitional low-carbon option within the broader clean energy mix. Policymakers should consider cautiously expanding nuclear power by implementing stringent safety protocols, transparent regulatory frameworks, and fostering public trust through inclusive stakeholder engagement. Investment in next-generation nuclear technologies, such as small modular reactors (SMRs), can enhance safety, reduce waste, and make nuclear energy more adaptable to modern energy grids. Importantly, nuclear energy should be integrated into national energy strategies in a way that complements renewable energy development rather than competing with it, ensuring a balanced, resilient path toward long-term environmental sustainability.
In the context of accelerating climate change, R&D has become a cornerstone for achieving meaningful reductions in GHG emissions and footprints. R&D plays a critical role in discovering and advancing renewable energy alternatives while reducing dependence on nonrenewable sources. Increasing investment in R&D can drive the development of innovative, eco-friendly technologies and upgrade existing energy infrastructure, both of which are essential for mitigating environmental degradation. Moreover, targeted R&D funding enables the identification of high-emission sectors and the design of cleaner, sector-specific solutions. By fostering innovation, cleaner energy practices, and sustainable technologies, the R&D sector contributes not only to emission reductions but also to shaping environmentally responsible regulations and raising public awareness. By strategically investing in R&D, G20 countries can lead the way in implementing environmentally sound practices and accelerating the global transition to a low-carbon economy.
6. Limitations and Future Research
While this research provides valuable insights into the relationships among economic indicators, energy sources, and environmental outcomes across the G20 countries, it is essential to acknowledge certain limitations. First, this study relies primarily on aggregated national-level data, potentially overlooking regional or sector-specific variations. Moreover, the analysis assumes a static relationship, which may not fully capture the dynamic changes in energy policies and technological advancements. This research is based on limited observations for only 30 years due to data availability. Future research will overcome this issue. Renewable energy is a broader concept. Future researchers will consider wind, solar, heat, and other renewable energy sources. Similarly, researchers will consider emissions from coal, natural gas, oil, and other nonrenewable sources. In the future, researchers will consider various influential variables, such as democracy, corruption, and globalization. Due to space limitations, the research did not present each country’s performance. Future research will show the impact on each country. Future research will consider important variables such as uncertainties, innovation, green technologies, green finance, and green energy. Finally, this study primarily focuses on G20 countries, potentially excluding valuable insights from smaller or less economically developed nations. Extending the analysis to a broader sample of countries could provide a more comprehensive understanding of the global dynamics of economic development, population, energy demand, and environmental sustainability.
7. Conclusions
This study examined the relationships among economic growth, energy structure, R&D, and environmental sustainability in G20 countries over the period 1994–2023, using the ecological footprint as the primary environmental indicator and GHG emissions as an alternative measure. The analysis first accounted for cross-sectional dependence and slope heterogeneity and then applied second-generation unit root and cointegration tests. Based on these data characteristics, the CS-ARDL model was employed as the baseline estimator, while FMOLS and DOLS estimators, along with an alternative dependent variable, were used to verify the robustness of the results.
The empirical findings indicate a nonlinear relationship between economic growth and environmental degradation under a cubic specification. The coefficients of GDP, GDP2, and GDP3 follow the expected +, −, + pattern, suggesting nonlinear income–environment dynamics. However, the estimated coefficients do not generate real turning points within the observed income range, indicating that a complete N-shaped EKC trajectory is not empirically supported for the G20 countries during the study period. This implies that environmental pressure may slow at higher income levels but does not reverse direction in the long run. In addition, renewable energy consumption and R&D investment significantly reduce environmental degradation, while fossil fuel consumption increases the ecological footprint and GHG emissions. Nuclear energy shows a positive but statistically insignificant effect. The short-run results further confirm that economic growth and fossil fuel use increase environmental pressure, whereas innovation-related activities help mitigate environmental damage.
These findings have important implications for G20 countries, which play a central role in global economic activity and emissions. The results suggest that economic growth alone cannot ensure long-term environmental sustainability. Instead, sustained investment in renewable energy, technological innovation, and reduced dependence on fossil fuels is essential for improving environmental outcomes. As leading global economies, G20 countries have a critical responsibility to promote clean energy transitions and strengthen environmental policies to support sustainable development.
Author Contributions
Conceptualization, E.N.; Methodology, E.N.; Software, D.S.; Validation, J.S.; Formal analysis, D.S. and J.S.; Investigation, E.N.; Resources, E.N., T.K., D.S. and S.M.; Data curation, E.N., T.K., J.S. and S.M.; Writing—original draft, T.K., D.S., J.S. and S.M.; Writing—review & editing, J.S. and S.M.; Visualization, T.K., D.S., J.S. and S.M.; Project administration, D.S. and J.S.; Funding acquisition, T.K. and D.S. All authors have read and agreed to the published version of the manuscript.
Funding
This research received no external funding.
Data Availability Statement
The raw data supporting the conclusions of this article will be made available by the authors on request.
Conflicts of Interest
The authors declare no conflict of interest.
Abbreviations
| ARDL | Autoregressive Distributed Lag |
| CO2 | Carbon dioxide emission |
| CSD | Cross-sectional dependence |
| CSARDL | Cross-Sectionally Augmented Autoregressive Distributed Lag |
| CIPS | Cross-section Im–Pesaran–Shin |
| DOLS | Dynamic Ordinary Least Square |
| EFP | Ecological Footprint |
| EKC | Environmental Kuznets Curve |
| FOS | Fossil fuel |
| FMOLS | Fully Modified Ordinary Least Squares |
| GDP | Gross Domestic Product |
| G20 | Group of Twenty |
| GMM | Generalized Method of Moments |
| IMF | International Monetary Fund |
| ICT | Information, Communication, & Technology |
| OECD | Organization for Economic Cooperation and Development |
| PMG-ARDL | Panel Mean Group Autoregressive Distributed Lag |
| REC | Renewable Energy Consumption |
| R&D | Research & Development |
| TO | Trade openness |
| WB | World Bank |
| WDIs | World Development Indicators |
Appendix A. List of the G20 Countries
Argentina, Australia, China, France, Italy, Japan, the United Kingdom, Germany, India, Indonesia, Saudi Arabia, South Africa, Mexico, Russia, Brazil, Canada, South Korea, Turkey, the United States, and the European Union.
References
- Codal, K.S.; Ari, I.; Codal, A. Multidimensional perspective for performance assessment on climate change actions of G20 countries. Environ. Dev. 2021, 39, 100639. [Google Scholar] [CrossRef] [Scilit]
- Warren, R.; Andrews, O.; Brown, S.; Colón-González, F.J.; Forstenhäusler, N.; Gernaat, D.E.H.J.; Goodwin, P.; Harris, I.; He, Y.; Hope, C.; et al. Quantifying risks avoided by limiting global warming to 1.5 or 2 °C above pre-industrial levels. Clim. Change 2022, 172, 39. [Google Scholar] [CrossRef] [Scilit]
- Saxena, V. Water quality, air pollution, and climate change: Investigating the environmental impacts of industrialization and urbanization. Water Air Soil Pollut. 2025, 236, 73. [Google Scholar] [CrossRef] [Scilit]
- Liu, Y.; Sander, M. What Drives Energy Efficiency in the G20? Evidence From Finance, Education, and Sustainable Development. Sustain. Dev 2025, early view. [Google Scholar] [CrossRef] [Scilit]
- OECD. Real Gross Domestic Product (GDP). 2022. Available online: https://www.oecd.org/en/data/indicators/real-gross-domestic-product-gdp.html (accessed on 10 November 2022).
- Shen, J.; Ibrahim, R.L.; Ajide, K.B.; Al-Faryan, M.A.S. Tracking environmental sustainability pathways in Africa: Do natural resource dependence, renewable energy, and technological innovations amplify or reduce the pollution noise? Energy Environ. 2024, 35, 88–112. [Google Scholar] [CrossRef] [Scilit]
- Simon, T.L.; McCullough, J.; Snyder, E.L.; Solheim, B.G.; Strauss, R.G. (Eds.) Rossi’s Principles of Transfusion Medicine; John Wiley & Sons, Incorporated: Hoboken, NJ, USA, 2022. [Google Scholar]
- Sokulski, C.C.; Barros, M.V.; Salvador, R.; Broday, E.E.; de Francisco, A.C. Trends in Renewable Electricity Generation in the G20 Countries: An Analysis of the 1990–2020 Period. Sustainability 2022, 14, 2084. [Google Scholar] [CrossRef] [Scilit]
- Crew, B. 10 Key Insights from the First Research Scorecards for G20 Countries. Nature Index. 19 July 2019. Available online: https://www.nature.com/nature-index/news-blog/ten-insights-first-research-scorecards-countries-clarivate-twenty-nineteen (accessed on 11 November 2022).
- Ibrahim, R.L.; Ajide, K.B. Disaggregated environmental impacts of nonrenewable energy and trade openness in selected G-20 countries: The conditioning role of technological innovation. Environ. Sci. Pollut. Res. 2021, 28, 67496–67510. [Google Scholar] [CrossRef] [Scilit]
- Nguyen, T.T.; Anh, T.; Pham, T.; Thi, H.; Tram, X. Role of information and communication technologies and innovation in driving carbon emissions and economic growth in selected G-20 countries. J. Environ. Manag. 2020, 261, 110162. [Google Scholar] [CrossRef] [Scilit]
- Pata, U.K. Renewable and nonrenewable energy consumption, economic complexity, CO2 emissions, and ecological footprint in the USA: Testing the EKC hypothesis with a structural break. Environ. Sci. Pollut. Res. 2021, 28, 846–861. [Google Scholar] [CrossRef] [Scilit] [PubMed]
- Pata, U.K.; Kartal, M.T.; Erdogan, S.; Sarkodie, S.A. The role of renewable and nuclear energy R&D expenditures and income on environmental quality in Germany: Scrutinizing the EKC and LCC hypotheses with smooth structural changes. Appl. Energy 2023, 342, 121138. [Google Scholar] [CrossRef] [Scilit]
- Aydin, M.; Koc, P.; Sahpaz, K.I. Investigating the EKC hypothesis with nanotechnology, renewable energy consumption, economic growth, and ecological footprint in G7 countries: Panel data analyses with structural breaks. Energy Sources Part B Econ. Plan. Policy 2023, 18, 2163724. [Google Scholar] [CrossRef] [Scilit]
- Riti, J.S.; Song, D.; Shu, Y.; Kamah, M. Decoupling CO2 emission and economic growth in China: Is there consistency in estimation results in analyzing the environmental Kuznets curve? J. Clean. Prod. 2017, 166, 1448–1461. [Google Scholar] [CrossRef] [Scilit]
- Shahbaz, M.; Mahalik, M.K.; Shah, S.H.; Sato, J.R. Time-varying analysis of CO2 emissions, energy consumption, and economic growth nexus: Statistical experience in next 11 countries. Energy Policy 2016, 98, 33–48. [Google Scholar] [CrossRef] [Scilit]
- Sinha, A.; Shahbaz, M.; Balsalobre, D. Exploring the Relationship between Energy Usage Segregation and Environmental Degradation in N-11 Countries. J. Clean. Prod. 2017, 168, 1217–1229. [Google Scholar] [CrossRef] [Scilit]
- Chen, Y.; Wang, Z.; Zhong, Z. CO2 emissions, economic growth, renewable and nonrenewable energy production, and foreign trade in China. Renew. Energy 2019, 131, 208–216. [Google Scholar] [CrossRef] [Scilit]
- Degirmencioglu Aydin, N.; Aydin, M. An environmental impact assessment of major economic sectors in Turkey: Economics and law perspective. J. Knowl. Econ. 2024, 15, 5893–5913. [Google Scholar] [CrossRef] [Scilit]
- Gormus, S.; Aydin, M. Revisiting the environmental Kuznets curve hypothesis using innovation: New evidence from the top 10 innovative economies. Environ. Sci. Pollut. Res. 2020, 27, 27904–27913. [Google Scholar] [CrossRef] [Scilit]
- Wang, K.; Umar, M.; Akram, R.; Caglar, E. Is technological innovation making the world “Greener”? Evidence from the changing growth story of China. Technol. Forecast. Soc. Change 2021, 165, 120516. [Google Scholar] [CrossRef] [Scilit]
- Cherni, A.; Essaber, S. An ARDL approach to the CO2 emissions, renewable energy, and economic growth nexus: Tunisian evidence. Int. J. Hydrogen Energy 2017, 42, 29056–29066. [Google Scholar] [CrossRef] [Scilit]
- Hashmi, S.H.; Hongzhong, F.; Fareed, Z.; Bannya, R. Testing Nonlinear Nexus between Service Sector and CO2 Emissions in Pakistan. Energies 2020, 13, 526. [Google Scholar] [CrossRef] [Scilit]
- Atsu, F.; Adams, S. Energy consumption, finance, and climate change: Does policy uncertainty matter? Econ. Anal. Policy 2021, 70, 490–501. [Google Scholar] [CrossRef] [Scilit]
- Shao, X.; Zhong, Y.; Liu, W.; Yi, R.; Li, M. Modeling the effect of green technology innovation and renewable energy on carbon neutrality in N-11 countries? Evidence from advanced panel estimations. J. Environ. Manag. 2021, 296, 113189. [Google Scholar] [CrossRef] [Scilit]
- Ozcan, B.; Ulucak, R. An empirical investigation of nuclear energy consumption and carbon dioxide (CO2) emission in India: Bridging IPAT and EKC hypotheses. Nucl. Eng. Technol. 2021, 53, 2056–2065. [Google Scholar] [CrossRef] [Scilit]
- Rahman, M.H.; Voumik, L.C.; Islam, M.J.; Halim, M.A.; Esquivias, M.A. Economic Growth, Energy Mix, and Tourism-Induced EKC Hypothesis: Evidence from Top Ten Tourist Destinations. Sustainability 2022, 14, 16328. [Google Scholar] [CrossRef] [Scilit]
- Yan, K.; Gupta, R.; Wong, V. CO2 Emissions in G20 Nations through the Three-Sector Model. J. Risk Financ. Manag. 2022, 15, 394. [Google Scholar] [CrossRef] [Scilit]
- Chien, F.; Sadiq, M.; Atif, M.; Sajjad, M.; Duc, T.; Le, T. A step toward reducing air pollution in top Asian economies: The role of green energy, eco-innovation, and environmental taxes. J. Environ. Manag. 2021, 297, 113420. [Google Scholar] [CrossRef] [Scilit]
- Ding, Q.; Khattak, S.I.; Ahmad, M. Towards sustainable production and consumption: Assessing the impact of energy productivity and eco-innovation on consumption-based carbon dioxide emissions (CO2) in G-7 nations. Sustain. Prod. Consum. 2021, 27, 254–268. [Google Scholar] [CrossRef] [Scilit]
- Dong, K.; Dong, X.; Jiang, Q. How renewable energy consumption lower global CO2 emissions? Evidence from countries with different income levels. World Econ. 2020, 43, 1665–1698. [Google Scholar] [CrossRef] [Scilit]
- Shahbaz, M.; Nasreen, S.; Ahmed, K.; Hammoudeh, S. Trade openness–carbon emissions nexus: The importance of turning points of trade openness for country panels. Energy Econ. 2017, 61, 221–232. [Google Scholar] [CrossRef] [Scilit]
- Yao, X.; Tang, X. Does financial structure affect CO2 emissions? Evidence from G20 countries. Financ. Res. Lett. 2021, 41, 101791. [Google Scholar] [CrossRef] [Scilit]
- Yao, C.; Feng, K.; Hubacek, K. Driving forces of CO2 emissions in the G20 countries: An index decomposition analysis from 1971 to 2010. Ecol. Inform. 2015, 26, 93–100. [Google Scholar] [CrossRef] [Scilit]
- Chen, J.; Xian, Q.; Zhou, J.; Li, D. Impact of income inequality on CO2 emissions in G20 countries. J. Environ. Manag. 2020, 271, 110987. [Google Scholar] [CrossRef] [Scilit]
- Alotaibi, A.A.; Alajlan, N. Using Quantile Regression to Analyze the Relationship between Socioeconomic Indicators and Carbon Dioxide Emissions in G20 Countries. Sustainability 2021, 13, 7011. [Google Scholar] [CrossRef] [Scilit]
- Xu, B.; Zhong, R.; Qiao, H. The impact of biofuel consumption on CO2 emissions: A panel data analysis for seven selected G20 countries. Energy Environ 2020, 31, 1498–1514. [Google Scholar] [CrossRef] [Scilit]
- Tzeremes, P. The impact of total factor productivity on energy consumption and CO2 emissions in G20 countries. Econ. Bull 2020, 40, 2179–2192. [Google Scholar]
- Voumik, L.C.; Sultana, R.; Dey, R. Going away or getting green in BRICS: Investigating the EKC hypothesis with Human capital index, nuclear energy, urbanization, and service sectors on the environment. World Dev. Sustain. 2023, 2, 100060. [Google Scholar] [CrossRef] [Scilit]
- Razzaq, A.; Wang, Y.; Chupradit, S.; Suksatan, W.; Shahzad, F. Technology in Society Asymmetric interlinkages between green technology innovation and consumption-based carbon emissions in BRICS countries using a quantile-on-quantile framework. Technol. Soc. 2021, 66, 101656. [Google Scholar] [CrossRef] [Scilit]
- Awan, A.M.; Azam, M. Evaluating the impact of GDP per capita on environmental degradation for G-20 economies: Does the N-shaped environmental Kuznets curve exist? Environ. Dev. Sustain. 2022, 24, 11103–11126. [Google Scholar] [CrossRef] [Scilit]
- Ansari, M.A.; Haider, S.; Kumar, P.; Kumar, S.; Akram, V. Main determinants for ecological footprint: An econometric perspective from G20 countries. Energy Ecol. Environ. 2022, 7, 250–267. [Google Scholar] [CrossRef] [Scilit]
- Usman, M.; Radulescu, M.; Balsalobre-Lorente, D.; Rehman, A. Investigation on the causality relationship between environmental innovation and energy consumption: Empirical evidence from EU countries. Energy Environ. 2023, 34, 3130–3159. [Google Scholar] [CrossRef] [Scilit]
- Global Footprint Network. National Footprint and Biocapacity Accounts. 2024. Available online: https://www.footprintnetwork.org (accessed on 14 July 2024).
- World Bank. World Development Indicators. 2024. Available online: https://databank.worldbank.org/source/world-development-indicators (accessed on 14 July 2024).
- Organisation for Economic Cooperation and Development (OECD). OECD Statistics. 2024. Available online: https://stats.oecd.org (accessed on 16 July 2024).
- Azam, M.; Khan, A. Testing the environmental Kuznets curve hypothesis: A comparative empirical study for low, lower middle, upper middle- and high-income countries. Renew. Sustain. Energy Rev. 2016, 63, 556–567. [Google Scholar] [CrossRef] [Scilit]
- Baek, J. Does nuclear and renewable energy improve the environment? Empirical evidence from the United States. Ecol. Indic. 2016, 66, 352–356. [Google Scholar] [CrossRef] [Scilit]
- Dong, K.; Sun, R.; Jiang, H.; Zeng, X. CO2 emissions, economic growth, and the environmental Kuznets curve in China: What roles can nuclear energy and renewable energy play? J. Clean. Prod. 2018, 196, 51–63. [Google Scholar] [CrossRef] [Scilit]
- Koçak, E.; Ulucak, Z.Ş. The effect of energy R&D expenditures on CO2 emission reduction: Estimation of the STIRPAT model for OECD countries. Environ. Sci. Pollut. Res. 2019, 26, 14328–14338. [Google Scholar] [CrossRef] [Scilit] [PubMed]
- Jahanger, A.; Hossain, M.R.; Onwe, J.C.; Ogwu, S.O.; Awan, A.; Balsalobre-Lorente, D. Analyzing the N-shaped EKC among top nuclear energy generating nations: A novel dynamic common correlated effects approach. Gondwana Res. 2023, 116, 73–88. [Google Scholar] [CrossRef] [Scilit]
- Mekhzoumi, L.; Harnane, N.; Ayachi, A.; Abdellaoui, O. The Environmental Kuznets Curve Hypothesis in Industrialized Countries: A Second-Generation Econometric Approach. Int. J. Econ. Financ. Issues 2022, 12, 96–103. [Google Scholar] [CrossRef] [Scilit]
- Mehmood, U. Transport energy consumption and carbon emissions: The role of urbanization towards the environment in SAARC region. Integr. Environ. Assess. Manag. 2021, 17, 1286–1292. [Google Scholar] [CrossRef] [Scilit] [PubMed]
- Novak, A.; Sedlackova, A.N.; Vochozka, M.; Popescu, G.H. Big data-driven governance of smart sustainable intelligent transportation systems: Autonomous driving behaviors, predictive modeling techniques, and sensing and computing technologies. Contemp. Read. Law Soc. Justice 2022, 14, 100–117. [Google Scholar] [CrossRef] [Scilit]
- Balsalobre-Lorente, D.; Sinha, A.; Driha, O.M.; Mubarik, M.S. Assessing the Impacts of Ageing and Natural Resource Extraction on Carbon Emissions: A Proposed Policy Framework for European Economies. J. Clean. Prod. 2021, 296, 126470. [Google Scholar] [CrossRef] [Scilit]
- Westerlund, J. Panel cointegration tests of the Fisher effect. J. Appl. Econom. 2008, 23, 193–233. [Google Scholar] [CrossRef] [Scilit]
- Pesaran, M.H. General Diagnostic Tests for Cross-Sectional Dependence in Panels; Cambridge Working Papers in Economics No. 0435; Faculty of Economics, University of Cambridge: Cambridge, UK, 2004. [Google Scholar]
- Westerlund, J.; Edgerton, D.L. A simple test for cointegration in dependent panels with structural breaks. Oxf. Bull. Econ. Stat. 2008, 70, 665–704. [Google Scholar] [CrossRef] [Scilit]
- Tufail, M.; Song, L.; Adebayo, T.S.; Kirikkaleli, D.; Khan, S. Do fiscal decentralization and natural resources rent curb carbon emissions? Evidence from developed countries. Environ. Sci. Pollut. Res. 2021, 28, 49179–49190. [Google Scholar] [CrossRef] [Scilit]
- Pesaran, M.H. Testing Weak Cross-Sectional Dependence in Large Panels. Econom. Rev. 2015, 34, 1089–1117. [Google Scholar] [CrossRef] [Scilit]
- Pedroni, P. Purchasing power parity tests in cointegrated panels. Rev. Econ. Stat. 2001, 83, 727–731. [Google Scholar] [CrossRef] [Scilit]
- Kao, C.; Chiang, M.H. On the estimation and inference of a cointegrated regression in panel data. In Nonstationary Panels, Panel Cointegration, and Dynamic Panels; Emerald Group Publishing Limited: Leeds, UK, 2001; Volume 15, pp. 179–222. [Google Scholar] [CrossRef] [Scilit]
- Dogan, E.; Seker, F. The influence of real output, renewable and nonrenewable energy, trade, and financial development on carbon emissions in the top renewable energy countries. Renew. Sustain. Energy Rev. 2016, 60, 1074–1085. [Google Scholar] [CrossRef] [Scilit]
- Pesaran, M.H. A simple panel unit root test in the presence of cross-section dependence. J. Appl. Econom. 2007, 22, 265–312. [Google Scholar] [CrossRef] [Scilit]
- Larsson, R.; Lyhagen, J.; Löthgren, M. Likelihood-based cointegration tests in heterogeneous panels. Econom. J. 2001, 4, 9–142. [Google Scholar] [CrossRef] [Scilit]
- Pedroni, P. Panel cointegration: Asymptotic and finite sample properties of pooled time series tests with an application to the PPP hypothesis. Econom. Theory 2004, 20, 597–625. [Google Scholar] [CrossRef] [Scilit]
- Westerlund, J. A panel CUSUM test of the null of cointegration. Oxf. Bull. Econ. Stat. 2005, 67, 231–262. [Google Scholar] [CrossRef] [Scilit]
- Kao, H.; Jian, P.R.; Ma, K.F.; Huang, B.S.; Liu, C.C. Moment-tensor inversion for offshore earthquakes east of Taiwan and their implications to regional collision. Geophys. Res. Lett. 1998, 25, 3619–3622. [Google Scholar] [CrossRef] [Scilit]
- Pedroni, P. Fully Modified Ols for Heterogeneous Cointegrated Panels. In Nonstationary Panels, Panels Cointegration, and Dynamic Panels; Emerald Group Publishing Limited: Leeds, UK, 2001; Volume 15, pp. 93–130. Available online: https://pdfs.semanticscholar.org/b6b4/fe66e3344b173e4cd91c9ec768296c2e4fbf.pdf (accessed on 20 July 2024).
- Chudik, A.; Mohaddes, K.; Pesaran, M.H.; Raissi, M. Long-Run Effects in Large Heterogeneous Panel Data Models with Cross-Sectionally Correlated Errors. In Essays in Honor of Man Ullah (Advances in Econometrics); Emerald Group Publishing Limited: Bingley, UK, 2016; Volume 36, pp. 85–135. [Google Scholar] [CrossRef] [Scilit]
- Kong, Y.; Nketia, E.B.; Antwi, S.K.; Musah, M. Scrutinizing the complex relationship between financial development gross fixed capital formation and economic growth in Africa by adopting CCEMG and AMG estimation techniques. Int. J. Sci. Bus. 2020, 4, 160–174. [Google Scholar]
- Stock, J.H.; Watson, M.W. A Simple Estimator of Cointegrating Vectors in Higher Order Integrated Systems. Econom. J. Econom. Soc. 1993, 61, 783–820. [Google Scholar] [CrossRef] [Scilit]
- Kao, C.; Li, C.C.; Chen, S.P. Parametric programming to the analysis of fuzzy queues. Fuzzy Sets Syst. 1999, 107, 93–100. [Google Scholar] [CrossRef] [Scilit]
- Apergis, N.; Filippidis, I.; Economidou, C. Financial deepening and economic growth linkages: A panel data analysis. Rev. World Econ. 2007, 143, 179–198. [Google Scholar] [CrossRef] [Scilit]
- Phillips, P.C.B.; Hansen, B.E. Statistical inference in instrumental variables regression with I (1) processes. Rev. Econ. Stud. 1990, 57, 99–125. [Google Scholar] [CrossRef] [Scilit]
- An, H.; Razzaq, A.; Haseeb, M.; Mihardjo, L.W.W. The role of technology innovation and people’s connectivity in testing environmental Kuznets curve and pollution heaven hypotheses across the Belt and Road host countries: New evidence from Method of Moments Quantile Regression. Environ. Sci. Pollut. Res. 2020, 28, 5254–5270. [Google Scholar] [CrossRef] [Scilit] [PubMed]
- Khan, Z.; Ali, S.; Dong, K.; Yi, R.; Li, M. How does fiscal decentralization affect CO2 emissions? The roles of institutions and human capital. Energy Econ. 2020, 94, 105060. [Google Scholar] [CrossRef] [Scilit]
- Atasoy, B.S. Testing the environmental Kuznets curve hypothesis across the U. S.: Evidence from panel mean group estimators. Renew. Sustain. Energy Rev. 2017, 77, 731–747. [Google Scholar] [CrossRef] [Scilit]
- Bhatti, M.A.; Raheem, F.; Zafar, M.A. Environmental Kuznets Curve (EKC): Empirically Examined Long Run Association Between Globalization, Financial Development, and CO2 Emission for ASEAN Countries. IRASD J. Energy Environ. 2020, 1, 1–13. [Google Scholar] [CrossRef] [Scilit]
- Zaidi, S.A.H.; Zafar, M.W.; Shahbaz, M.; Hou, F. Dynamic linkages between globalization, financial development, and carbon emissions: Evidence from Asia-Pacific Economic Cooperation countries. J. Clean. Prod. 2019, 228, 533–543. [Google Scholar] [CrossRef] [Scilit]
- Zhang, L.; Pang, J.; Chen, X.; Lu, Z. Carbon emissions, energy consumption and economic growth: Evidence from the agricultural sector of China’s main grain-producing areas. Sci. Total Environ. 2019, 665, 1017–1025. [Google Scholar] [CrossRef] [Scilit]
- Usman, A.; Ozturk, I.; Muhammad, S.; Abbas, M.; Ullah, S.; Imran, M. Revealing the nexus between nuclear energy and ecological footprint in STIRPAT model of advanced economies: Fresh evidence from novel CS-ARDL model. Prog. Nucl. Energy 2022, 148, 104220. [Google Scholar] [CrossRef] [Scilit]
- Erdogan, S.; Okumus, I.; Guzel, A.E. Revisiting the Environmental Kuznets Curve hypothesis in OECD countries: The role of renewable, nonrenewable energy, and oil prices. Environ. Sci. Pollut. Res. 2020, 27, 23655–23663. [Google Scholar] [CrossRef] [Scilit]
- Dogan, E.; Ulucak, R.; Kocak, E.; Isik, C. The use of ecological footprint in estimating the Environmental Kuznets Curve hypothesis for BRICST by considering cross-section dependence and heterogeneity. Sci. Total Environ. 2020, 723, 138063. [Google Scholar] [CrossRef] [Scilit] [PubMed]
- Ișik, C.; Ahmad, M.; Pata, U.K.; Ongan, S.; Radulescu, M.; Adedoyin, F.F.; Bayraktaroğlu, E.; Aydın, S.; Ongan, A. An Evaluation of the Tourism-Induced Environmental Kuznets Curve (T-EKC) Hypothesis: Evidence from G7 Countries. Sustainability 2020, 12, 9150. [Google Scholar] [CrossRef] [Scilit]
- Paramati, S.R.; Alam, M.S.; Hammoudeh, S.; Hafeez, K. Long-run relationship between R & D investment and environmental sustainability: Evidence from the European Union member countries. Int. J. Financ. Econ. 2020, 26, 5775–5792. [Google Scholar] [CrossRef] [Scilit]
- Chien, F.; Hsu, C.C.; Sibghatullah, A.; Hieu, V.M.; Phan, T.T.H.; Hoang Tien, N. The role of technological innovation and cleaner energy towards the environment in ASEAN countries: Proposing a policy for sustainable development goals. Econ. Res.-Ekon. Istraživanja 2022, 35, 4677–4692. [Google Scholar] [CrossRef] [Scilit]
- Nica, E.; Konecny, V.; Poliak, M.; Kliestik, T. Big data management of smart sustainable cities: Networked digital technologies and automated algorithmic decision-making processes. Manag. Res. Pract. 2020, 12, 48–57. [Google Scholar]
- Akter, S.; Voumik, L.C.; Rahman, M.H.; Raihan, A.; Zimon, G. GDP, health expenditure, industrialization, education and environmental sustainability impact on child mortality: Evidence from G-7 countries. Sustain. Environ. 2023, 9, 2269746. [Google Scholar] [CrossRef] [Scilit]
- Popescu, G.H.; Andrei, J.V.; Nica, E.; Mieilă, M.; Panait, M. Analysis on the impact of investments, energy use and domestic material consumption in changing the Romanian economic paradigm. Technol. Econ. Dev. Econ. 2019, 25, 59–81. [Google Scholar] [CrossRef] [Scilit]
- Deb, S.K.; Das, M.K.; Voumik, L.C.; Nafi, S.M.; Rashid, M.; Esquivias, M.A. The environmental effects of tourism: Analyzing the impact of tourism, global trade, consumption expenditure, electricity, and population on environment in leading global tourist destinations. GeoJ. Tour. Geosites 2023, 51, 1703–1716. [Google Scholar] [CrossRef] [Scilit]
- Nica, E.; Poliak, M.; Alpopi, C.; Kliestik, T.; Manole, C.; Burlacu, S. Impact of Trade, FDI, and Urbanization on Female Employment System in SAARC: GMM and Quantile Regression Approach. Systems 2023, 11, 137. [Google Scholar] [CrossRef] [Scilit]
- Gierałtowska, U.; Asyngier, R.; Nakonieczny, J.; Salahodjaev, R. Renewable Energy, Urbanization, and CO2 Emissions: A Global Test. Energies 2022, 15, 3390. [Google Scholar] [CrossRef] [Scilit]
- Popescu, G.H.; Mieila, M.; Nica, E.; Andrei, J.V. The emergence of the effects and determinants of the energy paradigm changes on European Union economy. Renew. Sustain. Energy Rev. 2018, 81, 768–774. [Google Scholar] [CrossRef] [Scilit]
- Güney, T. Renewable energy, nonrenewable energy and sustainable development. Int. J. Sustain. Dev. World Ecol. 2019, 26, 389–397. [Google Scholar] [CrossRef] [Scilit]
- Luo, H.; Sun, Y. The impact of energy efficiency on ecological footprint in the presence of EKC: Evidence from G20 countries. Energy 2024, 304, 132081. [Google Scholar] [CrossRef] [Scilit]
- US Energy Information Administration. Nuclear Power and the Environment. 2023. Available online: https://www.eia.gov/energyexplained/nuclear/nuclear-power-and-the-environment.php? (accessed on 14 July 2024).
- Dehner, G.; McBeth, M.K.; Moss, R.; van Woerden, I. A zero-carbon nuclear energy future? Lessons learned from perceptions of climate change and nuclear waste. Energies 2023, 16, 2025. [Google Scholar] [CrossRef] [Scilit]
- Sadiq, M.; Wen, F. Environmental footprint impacts of nuclear energy consumption: The role of environmental technology and globalization in ten largest ecological footprint countries. Nucl. Eng. Technol. 2022, 54, 3672–3681. [Google Scholar] [CrossRef] [Scilit]
- Soto, G.H.; Martinez-Cobas, X. Nuclear energy generation’s impact on the CO2 emissions and ecological footprint among European Union countries. Sci. Total Environ. 2024, 945, 173844. [Google Scholar] [CrossRef] [Scilit]
- Popp, D. Environmental Policy and Innovation: A Decade of Research. 2019. Available online: https://www.nber.org/papers/w25631 (accessed on 21 July 2024).
- Aydin, M.; Degirmenci, T.; Yavuz, H. The influence of multifactor productivity, research and development expenditure, renewable energy consumption on ecological footprint in G7 countries: Testing the environmental Kuznets curve hypothesis. Environ. Model. Assess. 2023, 28, 693–708. [Google Scholar] [CrossRef] [Scilit]
- Jiang, Y.; Guo, Y.; Bashir, M.F.; Shahbaz, M. Do renewable energy, environmental regulations and green innovation matter for China’s zero carbon transition: Evidence from green total factor productivity. J. Environ. Manag. 2024, 352, 120030. [Google Scholar] [CrossRef] [Scilit] [PubMed]
- Abbas, S. Toward a sustainable green energy transition: The role of low-carbon technology trade and investment in industrial production technologies. Environ. Model. Assess. 2025, 30, 1217–1233. [Google Scholar] [CrossRef] [Scilit]
- Özcan, M. Do technology usage and innovation promote an environmental friendly economy? Evidence from selected 30 Asian economies. Energy Environ. 2025, 36, 3184–3211. [Google Scholar] [CrossRef] [Scilit]
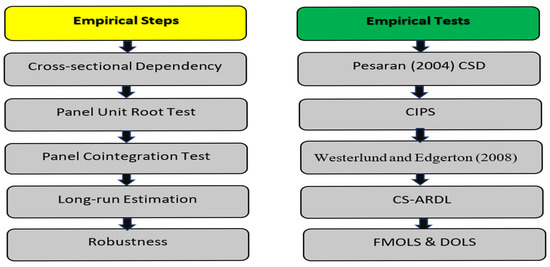
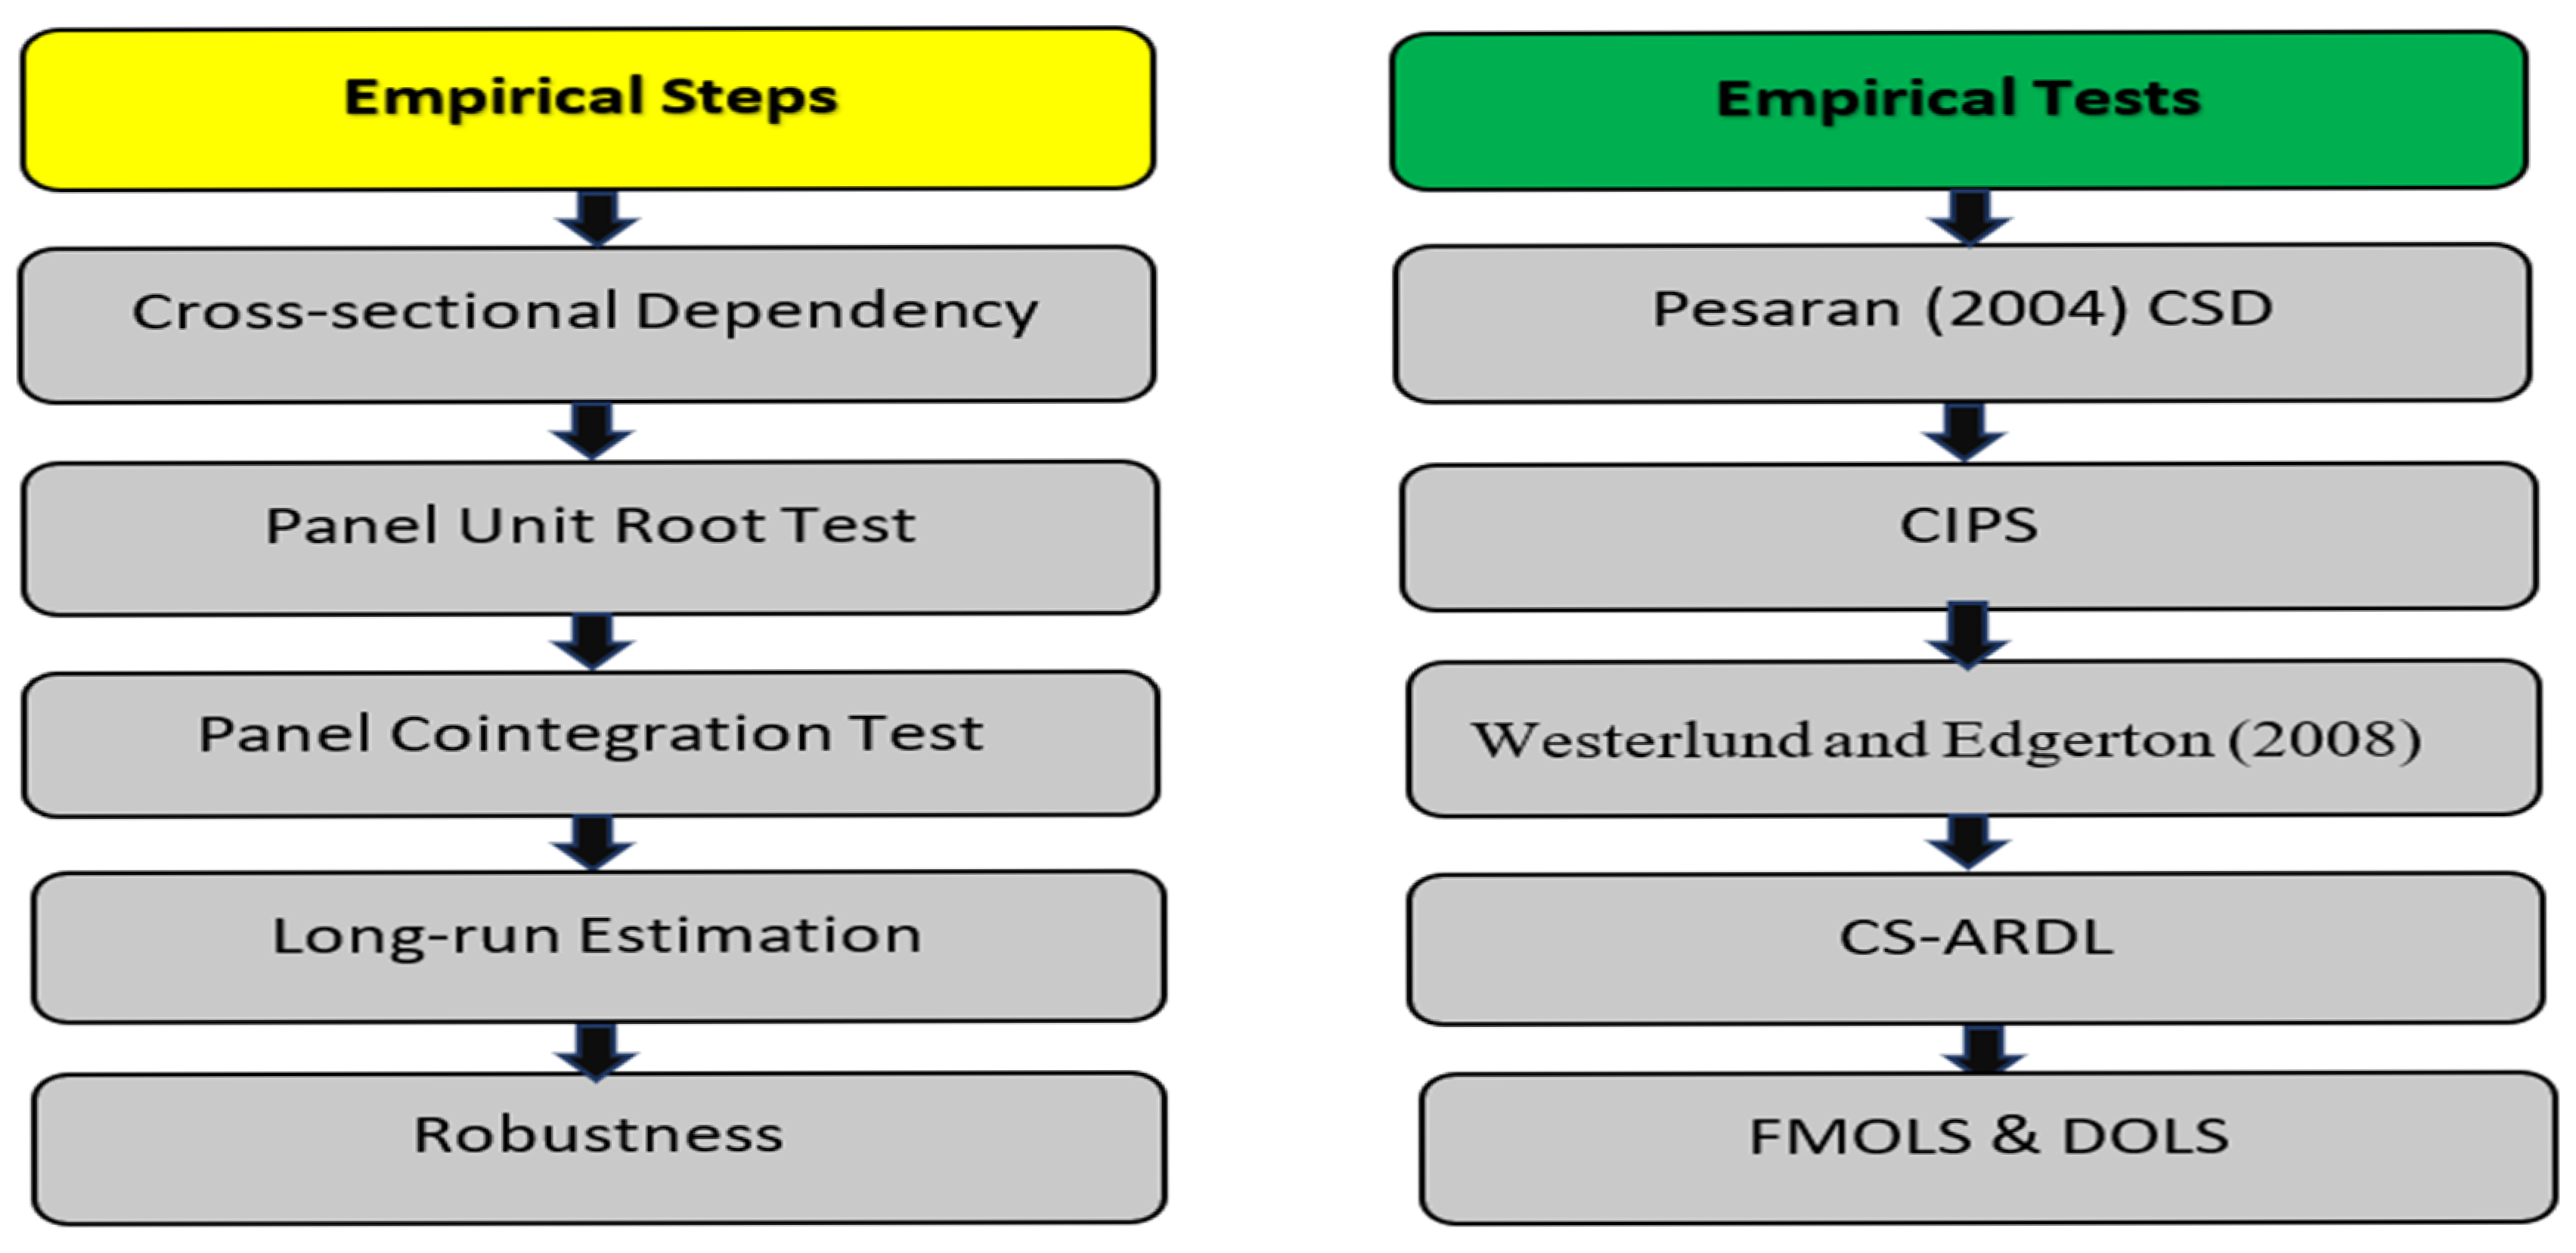

Disclaimer/Publisher’s Note: The statements, opinions and data contained in all publications are solely those of the individual author(s) and contributor(s) and not of MDPI and/or the editor(s). MDPI and/or the editor(s) disclaim responsibility for any injury to people or property resulting from any ideas, methods, instructions or products referred to in the content. |
© 2026 by the authors. Licensee MDPI, Basel, Switzerland. This article is an open access article distributed under the terms and conditions of the Creative Commons Attribution (CC BY) license.