


Abstract
The Mabi Block is located in the southern Qinshui Basin, representing an underexplored region with high-rank coal seams that host significant Coalbed Methane (CBM) potential. Despite extensive CBM development in the nearby Anze and Zheng Zhuang blocks, the geological and geophysical controls on Coalbed Methane enrichment in Mabi remain insufficiently constrained. This study integrates the core data (63 samples) of isothermal adsorption tests, well-logging data from (13 wells), and 3D seismic attributes to systematically evaluate the key controlling factors, such as burial depth, roof and floor lithology, and sealing capacity, in the horizons of the No.3# and No.15# coal seams. Lithology is characterized using natural gamma ray (GR), acoustic (AC), deep resistivity (RD), compensated neutron log (CNL), and seismic wave impedance inversion. Coal quality parameters, ash content, and the Langmuir volume (VL) are correlated with gas content, and structural controls are mapped using curvature, fault interpretation, and burial depth analysis. The results show that thick mudstone and limestone roofs, moderate burial depth (1100–1350 m), synclinal structural lows, and thicker coal seams (6–9 m) collectively enhance methane preservation. The ash content (%) exhibits a moderate negative correlation with the Langmuir volume (R2 = 0.4) and gas content. Structural curvature (syncline) and fault intensity strongly govern lateral sealing integrity, where anticline zones and faulted regions display notable degassing. This integrated assessment contributes to a refined CBM optimization model for the Mabi Block and guides targeted future drilling, reservoir evaluation, and production optimization.
1. Introduction
Coalbed Methane (CBM) is an unconventional natural gas resource stored in coal seams, either adsorbed on the surface of coal micropores or as free gas in fractures and cleats [1]. CBM originates directly from the coal itself, making coal seams both the source and the reservoir [2]. With increasing global demand for clean energy and growing concerns regarding greenhouse gas emissions, CBM has emerged as a strategic energy resource [3]. National interest in the exploration and development of CBM has grown [4]. The Qinshui Basin is one of the largest basins of high-rank coals in China. The Qinshui Basin is a significant CBM region with reserves of up to 3.28 × 10¹² m3, and is considered the most valuable region for CBM exploration and development [5]. The Mabi Block represents a structurally stable yet geologically underexplored region with a significant potential for new CBM discoveries [6].
The coal reservoirs of different coal ranks have been studied by different researchers to gain insight into the classification of coal reservoirs [7], adsorption [8,9], ash [7,8], tectonic development [10], coalbed structure features [11], roof stratum properties [12,13], and burial depth [12,14]. The model of sealing capacities in the coal reservoir has been evaluated [15,16]. These studies indicate that, in coal seams, the main factors influencing the surrounding rock capacity to seal are variations in the microstructure and pores of the various rocks found in the roof and floor [15,17]. Rocks with finer grains, such as limestone and mudstone, have higher densities, but sandstone, which serves as the primary fluid transport channel, has comparatively weak reservoir sealing capabilities [18]. Furthermore, the degree of fracture development in the coal seam floor and roof is also a significant factor that influences their sealing capacity, and a higher ash mineral concentration always has an indirect negative impact on the coal reservoir gas content by limiting the coal seam’s ability to adsorb gas [19]. While these studies have significantly advanced the understanding of CBM reservoir behavior in blocks such as Anze, Zheng Zhuang, and Fan Zhuang, comparatively few investigations have focused on the Mabi Block [6,10]. The existing literature lacks integrated geological–geophysical interpretations that combine core data, advanced well-log analysis, and 3D seismic attributes to evaluate the multi-factor controls on CBM [20]. Furthermore, little is known about how variations in the roof lithology, coal quality and structure, and burial patterns influence gas content in the Mabi area.
In this study, by integrating 3D seismic and well-log data, we evaluate the controlling factors affecting Coalbed Methane (CBM) and influencing Coalbed Methane (CBM) accumulation in coal reservoirs by using geological and geophysical logging methods in the No.3# and No.15# coal seams of the Mabi Block. The research is carried out in the underexplored Mabi area of the Qinshui Basin, China. Core, petrophysical analysis, and 3D seismic data provide new insights into the structural and reservoir characteristics governing CBM distribution in a part of the Qinshui Basin. The findings contribute to improving exploration strategies, enhancing resource assessment and control, and guiding the future development of CBM reservoirs in similar geological settings.
2. Geological Background
2.1. Regional Structure Characteristics
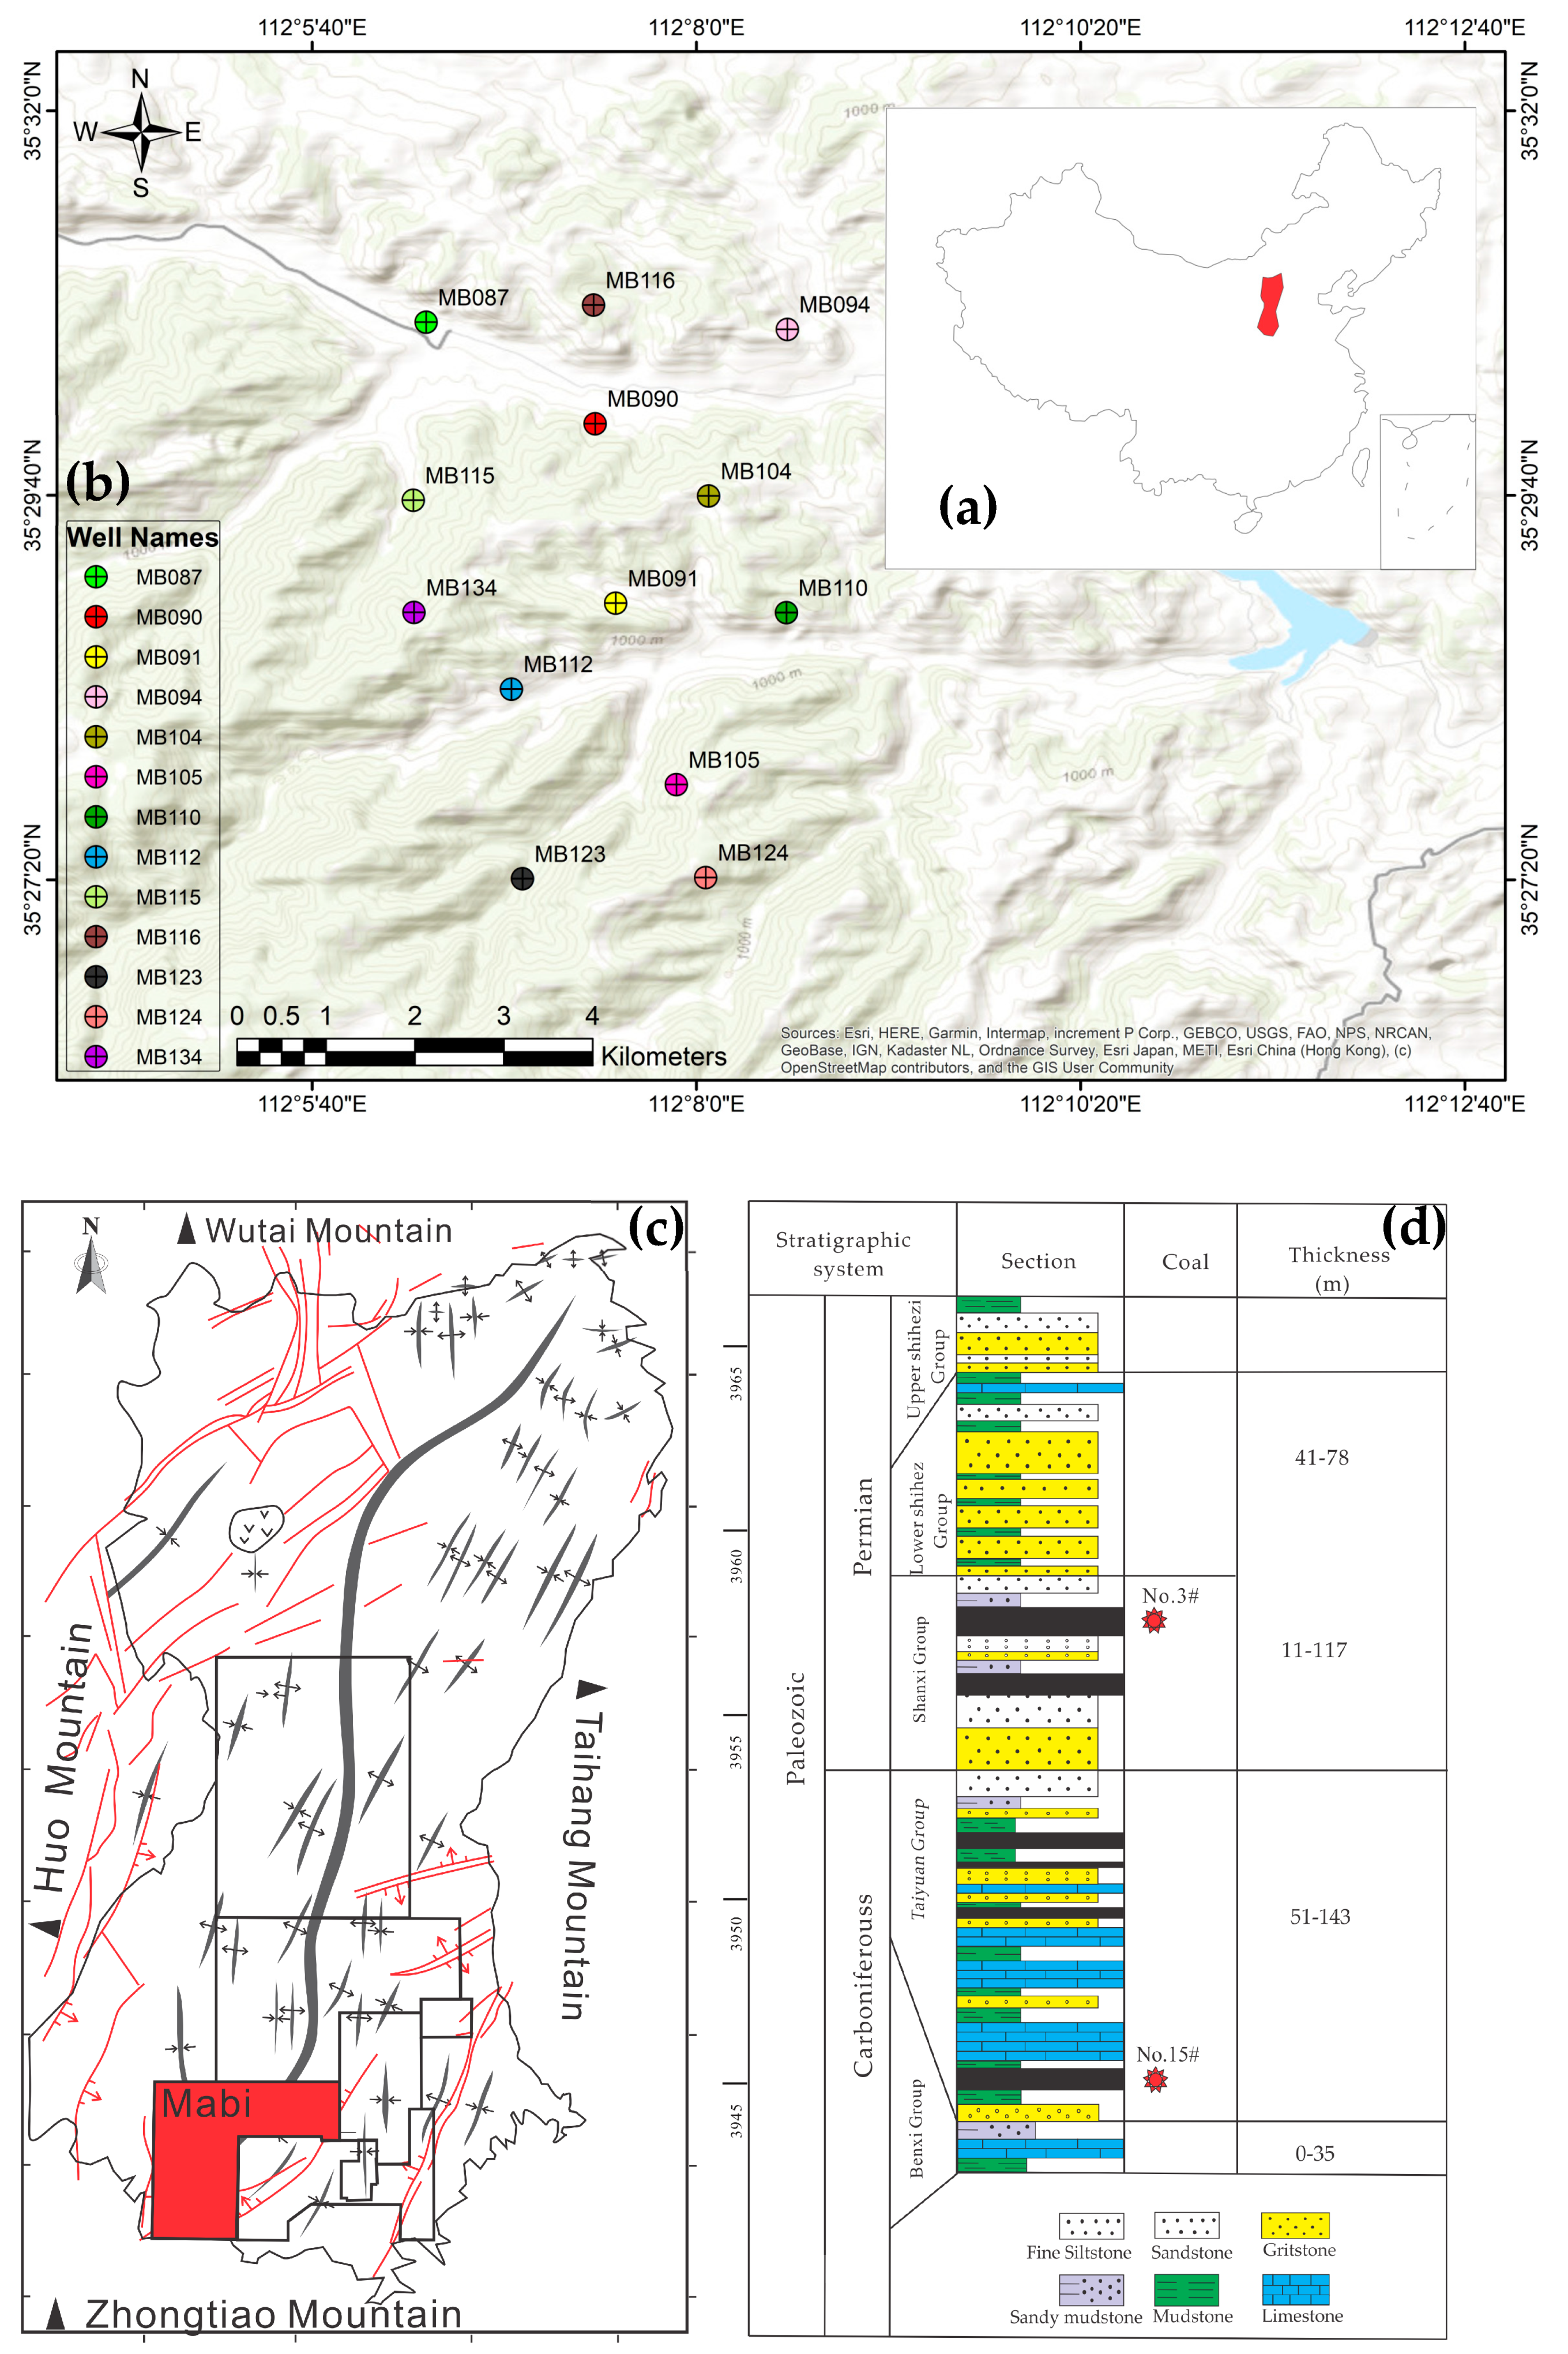
The study area, Mabi, is located in the southwestern part of Shanxi province in the Qinshui Basin, administratively belonging to the Qinyuan Block and Yangcheng Block in Jincheng City, as well as the Anze Block, Fushan Block, and Yicheng Block in Linfen City. The geological coordinates are 112°00′00″ E to 112°15′00″ E and 35°35′00″ N to 35°58′00″ N, shown in Figure 1. The Qinshui Basin is one of the most important coal-bearing basins in China, situated between the Taihang Mountain to the east and the Luiang Mountains to the west, which stretch 300 km north to south and 150 km east to west.
During the period of the Late Paleozoic, the North China Craton Basin developed the Qinshui Basin. The Basin is bordered by major uplifts, including the Wutai Mountains to Huo from the north to the west and the Zhongtiao Mountains to Taihang Mountains from the south to the east [21]. These four tectonic events, the Indosinian, Yanshanian, early Himalayan, and late Himalayan orogenies caused the formation of Pennsylvanian–Permian coal-bearing strata in this region [22]. The Indosinian orogeny induced the first compressional deformation in the Late Permian and Triassic periods, where the dominant stress orientation was north–south, leading to the development of early east–west thrust faults and uplifts in the central Qinshui Basin. The Yanshanian orogeny resulted in a second, more intense compressional deformation during the Jurassic and Early Cretaceous. During this period, the principal stress direction shifted from southeast (SE) to northwest (NW), contributing to the formation of the Qinshui Basin’s structural prototype [23]. With the onset of the Himalayan orogeny in the Paleogene, the regional stress field transitioned to extensional in a west–northwest to east–southeast direction, which facilitated the development of numerous significant normal faults [24]. Finally, the late Himalayan orogeny in the Quaternary altered the stress field once more, rendering it compressional along a northeast (NE) to southwest (SW) axis. The compressive nature of this current tectonic stress has led to the transformation of major faults in the region, which now likely function as local normal faults [10]. The research area is located on the southern edge of the basin, where the development of normal faults occurs in a northeast direction. However, it includes some broad faults and fold structures that can include gas content trapping and leakage; see Figure 1.
2.2. Stratigraphy and the Importance of Coal-Bearing Strata
The Mabi Block consists of a rich array of coal-bearing rocks and stable geological formations conducive to Coalbed Methane (CBM) occurrence. Originating from the North China Craton Basin during the Late Paleozoic era, the basin developed as sediment from the Pennsylvanian and Triassic periods [5,6].
The primary stratigraphic units in the basin include the formation, Carboniferous Benxi (C2b), Taiyuan (C3t), Permian Shanxi (P1s), Xiashilezi (P1x), Shangshihezi (P2s), Shiqianfeng (P2sh), Triassic Liujiagou (Til), and the Quaternary deposit [25,26]. The main coal-bearing formations, the Taiyuan (C3t) and Shanxi (P1s), consist of siltstone, mudstone, coal, medium- and fine-grained sandstones, and limestone, as shown in Figure 1c. These formations represent a delta and tidal flat depositional setting [27]. The coal-bearing zones in the study area are the Permian Shanxi and the Carboniferous Taiyuan Formation, in which Shanxi contains the No.3# coal seam, while the Carboniferous zone corresponds to the No.15# coal seams [28]. The No.3# coal seam has a thickness ranging from approximately 4.1 to 9.3 m and burial depth between 700 and 1240 m within the sub-surface. The No.15 # coal seam is located near the bottom of the Taiyuan Formation, with a thickness ranging from 2.1 to 8.5 m, and is situated at burial depths between 750 and 1420 m. The distance between the No.3# coal seam and No.15# coal seam is approximately 50 m [6,29].
Figure 1.
(a) Location in China. (b) Study area of the Mabi Block and distribution of wells, (c) Geological map of Qinshui Basin, modified after [10]. (d) Stratigraphic section of the southeastern Qinshui Basin and CBM targets within Shanxi and Taiyuan Group strata, modified after [30].
3. Methodology
Geological and geophysical methodology is used for research on the controlling factors of (CBM) in the Mabi area, Qinshui Basin [15,20,26]. This method is categorized into three main datasets: data preparation, data analysis, and data interpretation.
3.1. Dataset
The dataset comprises three principal categories: core data, well-logging data, and seismic data. Core data provide the most direct information about the coal reservoir and are collected from 13 CBM wells of 63 coal samples for lab analyses to perform the isothermal adsorption test according to the GB/T 19560-2008 standard, the Coalbed Methane Content determination from GB/T 19559-2008, and the coal quality analysis test [10]. Well-logging data, including gamma ray (GR), density (DEN), neutron (CNL), sonic (AC), and resistivity logs (LLS/LLD), are integrated with core information to identify coal seam, roof, and floor lithology [20]. In addition, 3D seismic data collected from the survey area of well block MB105 are interpreted and analyzed. The mentioned block covers an area of 75 km2. Seismic data consist of a 3D seismic volume acquired over the study area. Check-shot data are also input to convert time to a depth attribute. Preconditioning is performed to enhance the quality of seismic volumes for structural and fractural reservoir analysis [31].
3.2. Data Analysis
The analysis phase involved detailed workflows for each dataset. Core data are analyzed to determine coal quality, adsorption capacity, and gas content. The gas desorption experiments and Langmuir isotherm fitting were used to quantify gas storage potential because the Langmuir (VL) volume is intricately associated with the microscopic pore and fracture configurations in coal; see Table 1 [7]. Well-logging data are analyzed through petrophysical interpretation to identify the roof and floor lithology, in addition to contouring different petrophysical characteristics and using cross-plots to understand lithology. Coal intervals are identified using gamma ray and density log signatures, and the net coal thickness is calculated.
Table 1.
Isothermal adsorption test results of collected samples and gas content data.
3.3. Data Interpretation
The interpretation phase integrated findings from core, log, and seismic analyses to identify the controlling factors for CBM occurrence and distribution in the Mabi Block. Coal seam thickness and continuity, coal quality parameters such as gas content and ash content, adsorption capacity indicated by the Langmuir volume, and reservoir properties are evaluated as key geological controls [6]. Conventional seismic interpretation and wave impedance inversion are the geophysical techniques employed for more information about the roof and floor lithology [20]. Seismic data analysis is carried out to delineate structural and stratigraphic controls on CBM distribution. Well–seismic is established to link log-defined horizons to the seismic domain. Key horizons, including the No.3# and No.15# coal seam horizons, are marked with the help of Petrel software to identify coal seam lithology and are also interpreted along with the structure architecture, e.g., faults and folds. Curvature attributes are used to identify potential fracture-prone zones; coherence and trace attributes describe faults, discontinuities, and acoustic impedance from seismic inversion to map lateral variations in coal properties [6]. Structural and tectonic features, including faults, folds, and fracture networks, are assessed using seismic and logging information to determine their role in gas migration pathways [15]. The coal seams’ average structural curvature, along with their roofs and floors, is then calculated based on the higher structural curvature, which indicates the potential for more pronounced fracturing. In contrast, relatively gentle segments of the coal seams exhibit lower structural curvature values. A combination of geophysical logging, seismic attribute extraction, and structural curvature analysis offers a comprehensive approach to understanding the complex geological structures that influence CBM reservoirs and is finally integrated into a coherent interpretation that explains the geological and reservoir factors controlling CBM distribution and identifies the sweet spots for CBM in the Mabi area of the Qinshui Basin [7].
4. Results
4.1. Lithology Coal-Bearing Strata Identification
In the Mabi Block, coal-bearing identification and the evaluation of lithology are performed using a suite of well-logging parameters that provide critical insights into the composition and structure of the coal-bearing strata. Key parameters utilized in this study include (GR), (DEN), and (RD). These well-logging curves allow for detailed lithological characterization. A clear differentiation for different lithologies is obtained by calculating the logging parameters for the coal and mudstone sample sections (including sandy mudstone), sandstone (including argillaceous sandstone), and limestone in the core samples of 13 parameter wells; see Figure 2. This is because various rocks have different mineral compositions, physical attributes, and crystal structures, which typically demonstrate precise responses to different logging architectures and higher structural curvature, which indicates the potential for more pronounced fracturing. In contrast, relatively gentle segments of the coal seams exhibit lower structural curvature values, which explicitly display the logging characteristics and wave impedance of various lithologies, as shown in Table 2.
Figure 2.
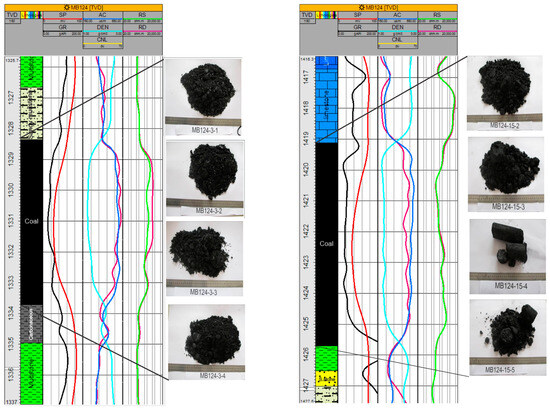
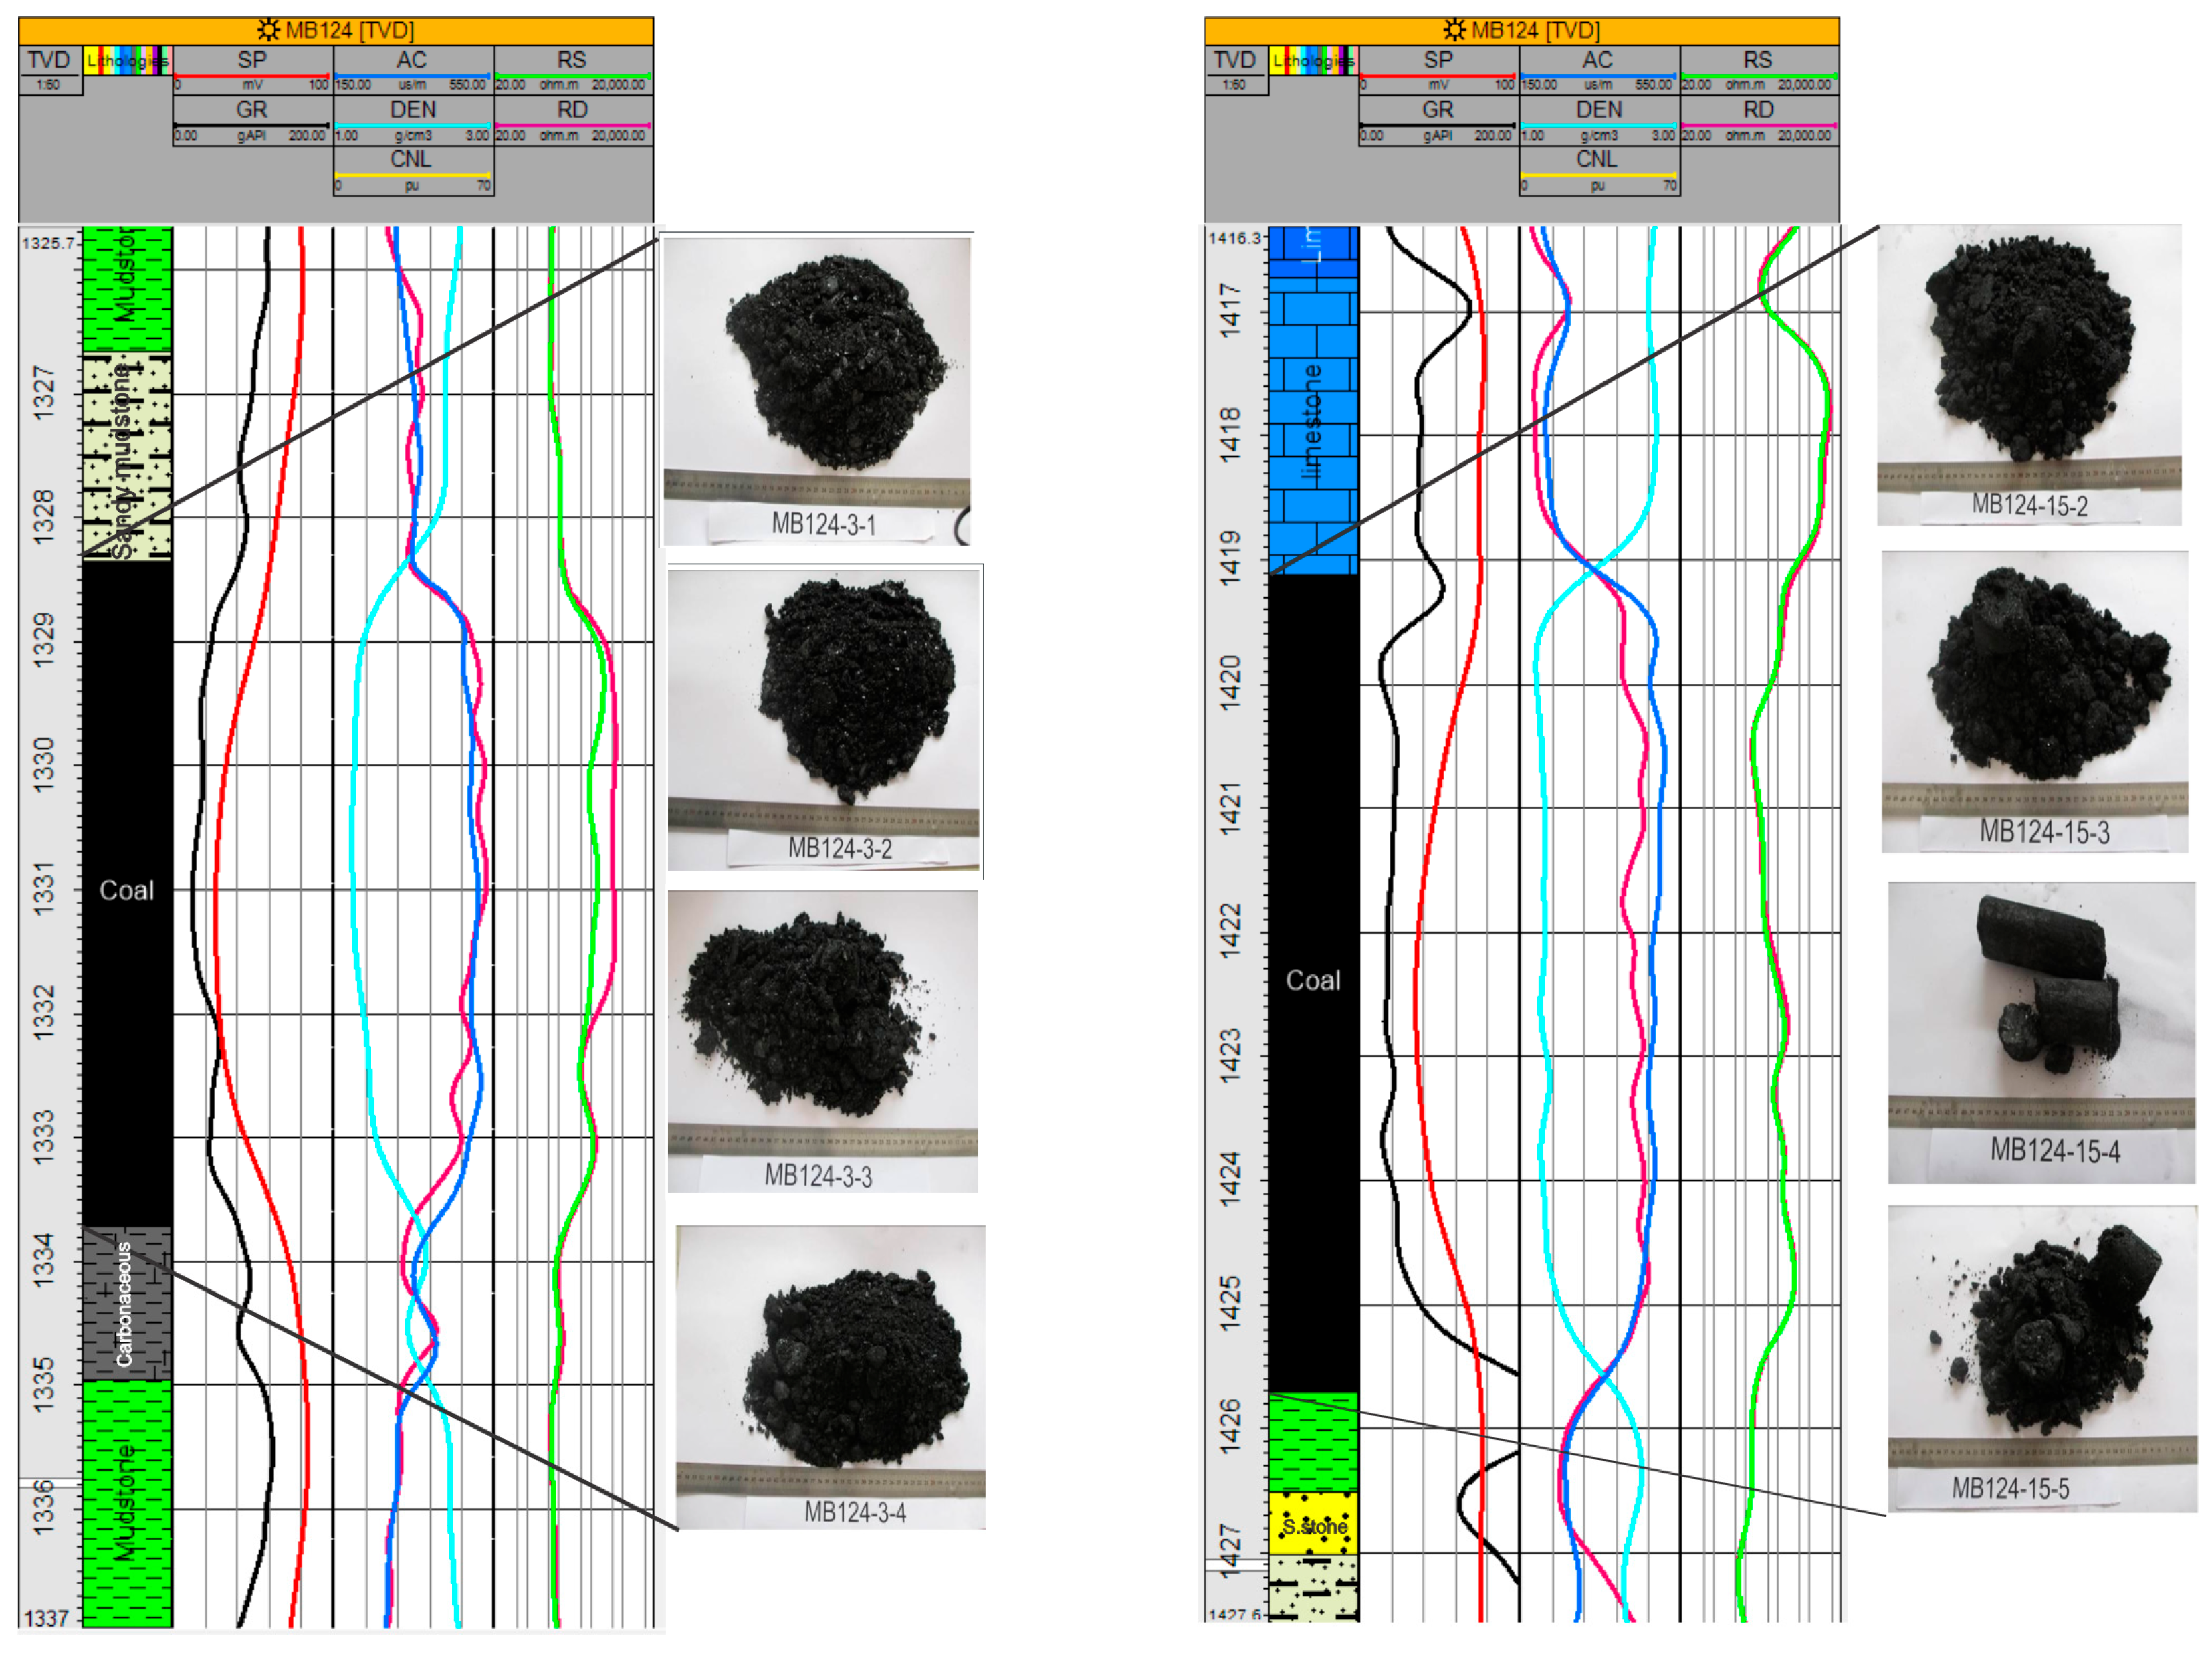
Integrated lithology and petrophysical logs of well MB124 with associated photographs of core coal samples from the No.3# and No.15# seams. Variations in log responses correlate with coal thickness, density contrasts, and adjacent limestone–mudstone units. Coal textures shown correlate with intervals of interest for CBM assessment.
Table 2.
Logging parameter and wave impedance of different lithologies.
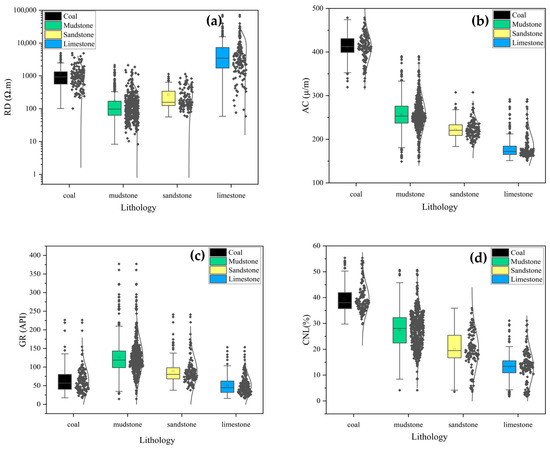
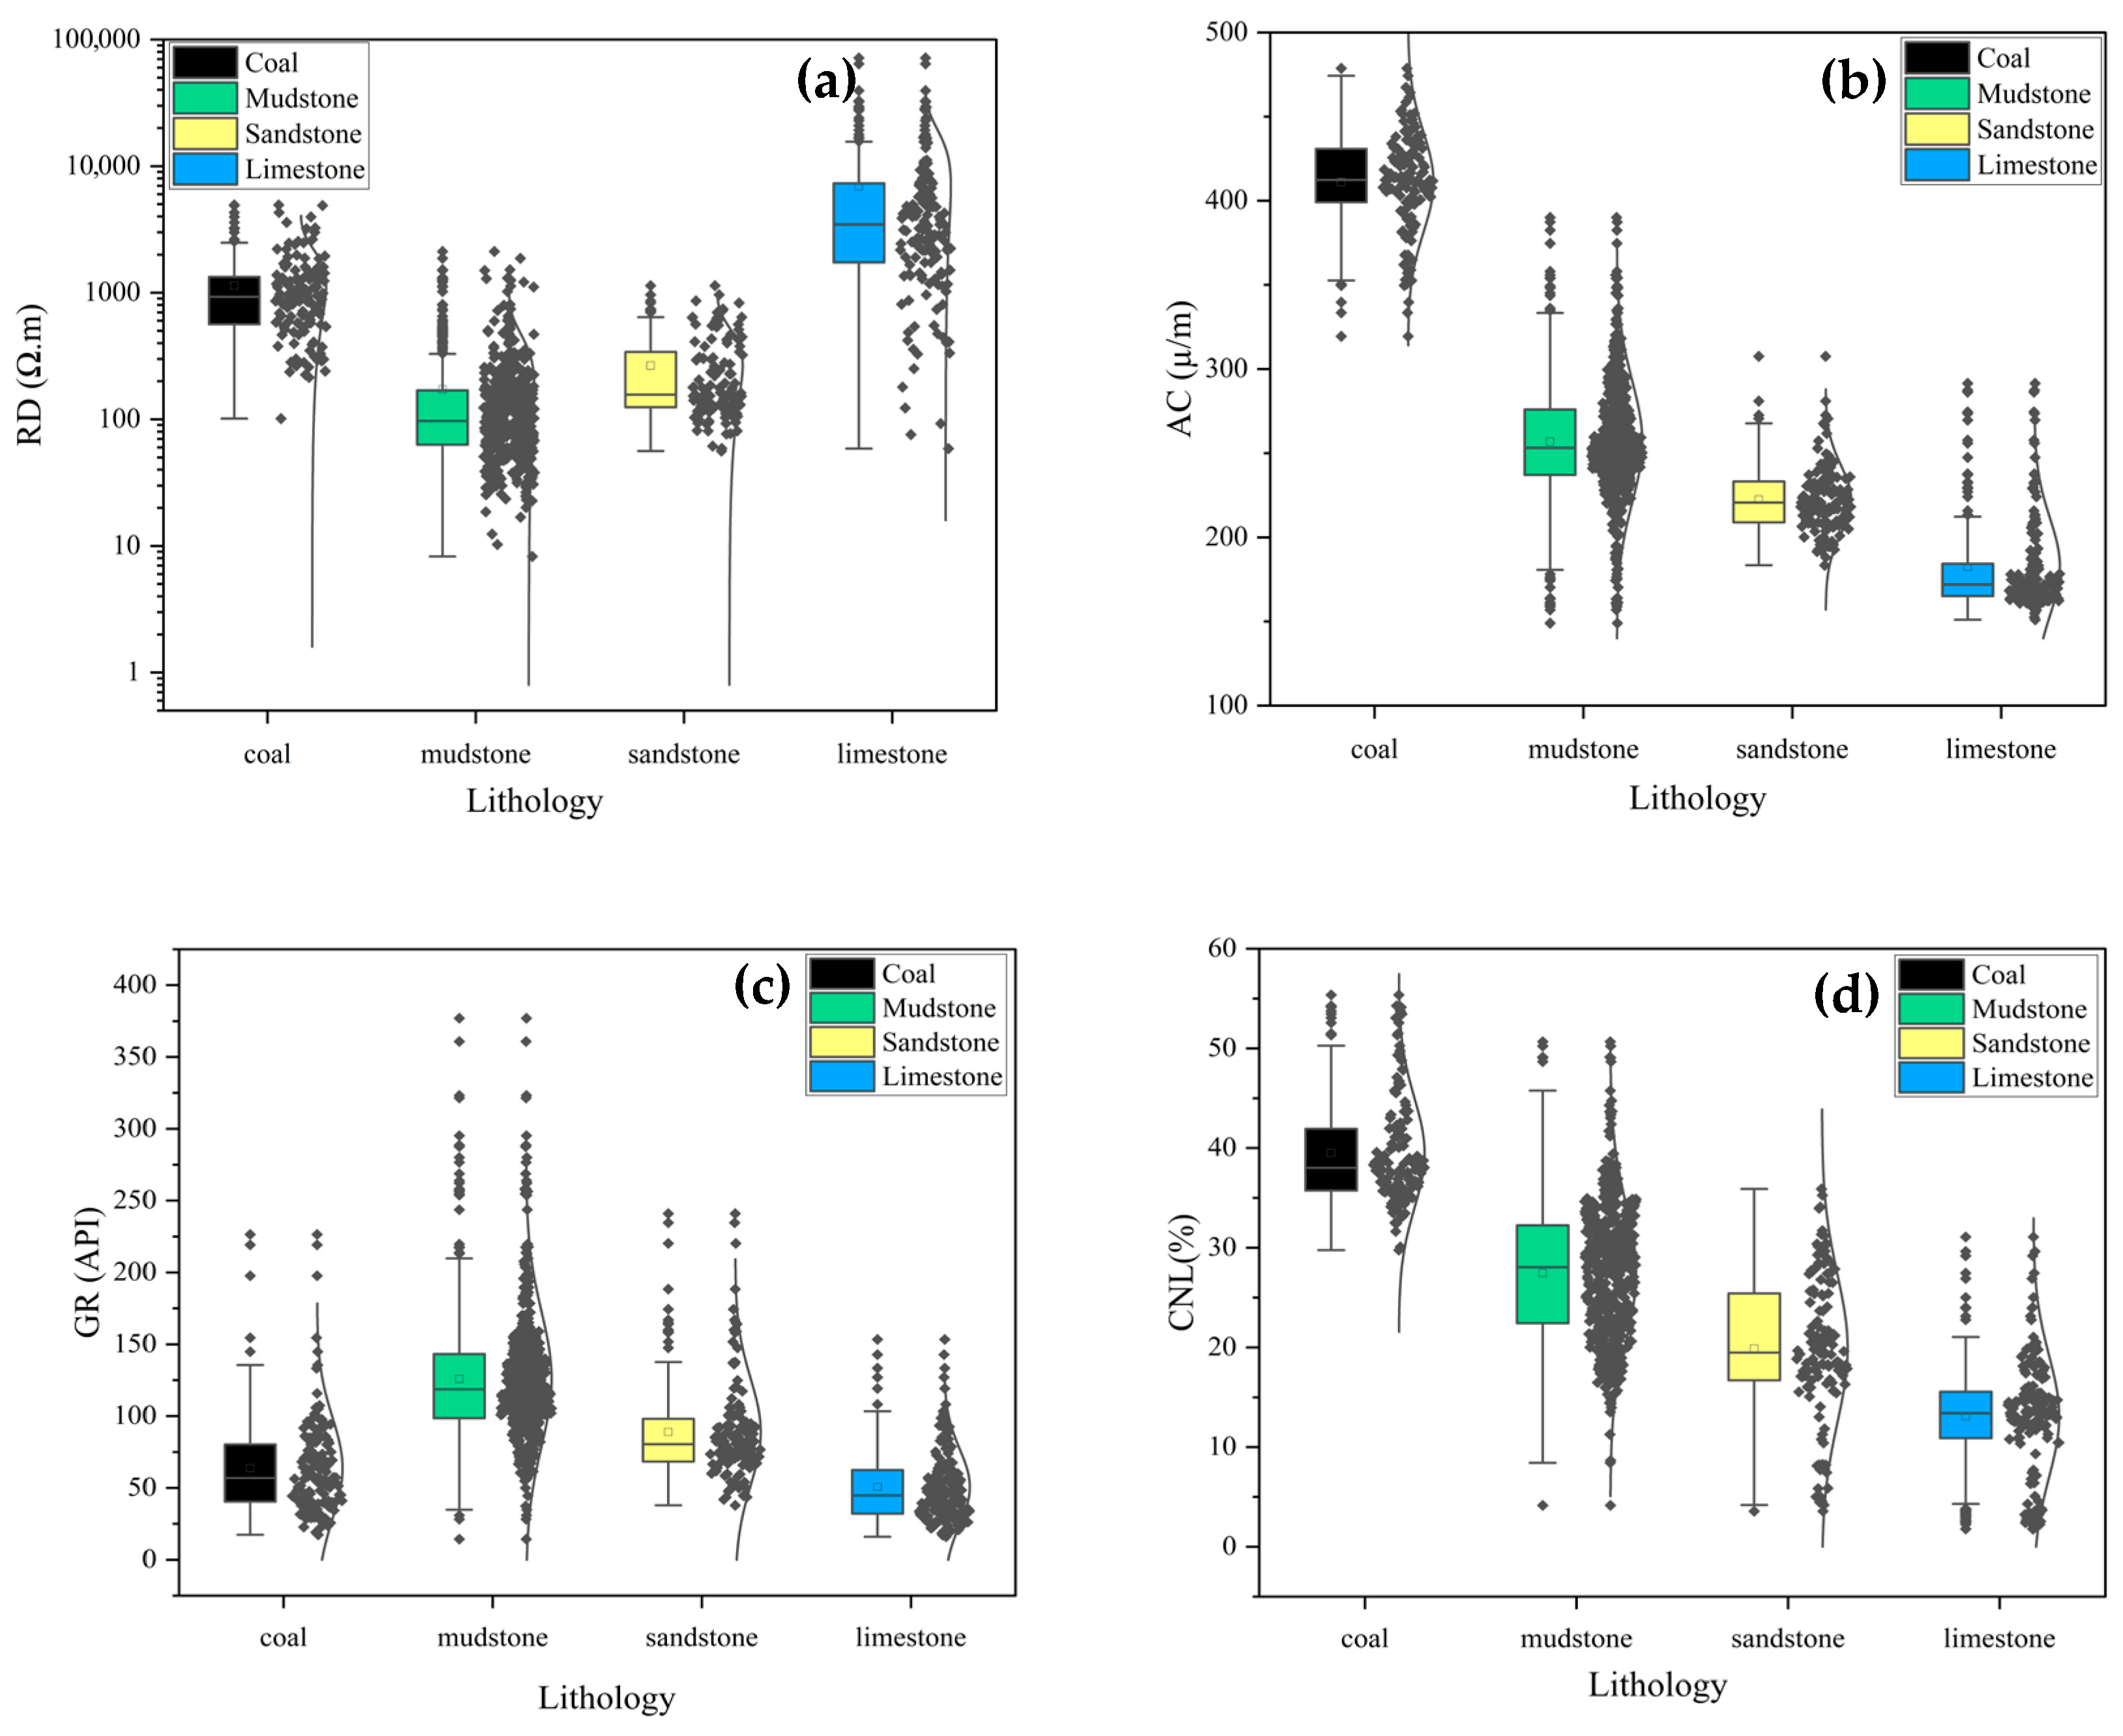
The response of each logging parameter varies depending on the lithologies. The boxplots in the RD responses are much greater in limestone (median value of 4177.32 (Ω·m)) than in coal (median value of 895.07 (Ω·m)), and they have a median value that is lower than in mudstone and lowest in sandstone (median value of 235.69(Ω·m)), as shown in Figure 3a. The AC responses for coal, mudstone, sandstone, and limestone have decreased in order; the median value for coal was 411.07 (µ/m), but the median value for limestone is only 171.82 (µ/m) in Figure 3b. In mudstone, the GR response is quite strong at 138 (API), whereas in sandstone it is lower at 95.53 (API), coal is at 58 (API), and the lowest is in limestone at 45 (API), as shown in Figure 3c. CNL is becoming less prevalent and lucrative in limestone, mudstone, sandstone, and coal. It is 37.1% in coal, 31.06% in mudstone, and 16.88% in sandstone, but only 13.2% in limestone; see Figure 3d.
Figure 3.
Lithological comparison based on various well-log data (a) RD (resistivity) vs. lithology: The plot illustrates the variation in resistivity (in ohm-m) across different lithologies (i-e, coal, mudstone, sandstone, and limestone). (b) AC (acoustic log) vs. lithology: The boxplot here displays the distribution of acoustic values (in µ/m) for each lithology. (c) GR (gamma ray) in API units vs. lithology: This plot shows gamma ray values in API units for different lithologies. (d) CNL (neutron porosity) percentage vs. lithology: The boxplot illustrates the variation in neutron porosity (CNL%) across lithologies. The figure effectively compares the distribution of well-log data for coal, mudstone, sandstone, and limestone, providing insights into the distinct physical properties of each lithology type.
4.2. Seismic Inversions
Seismic wave impedance is the product of density (DEN) and acoustic velocity (AC), based on this formula.
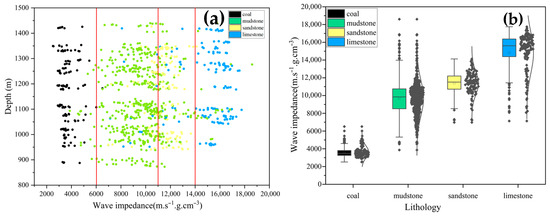
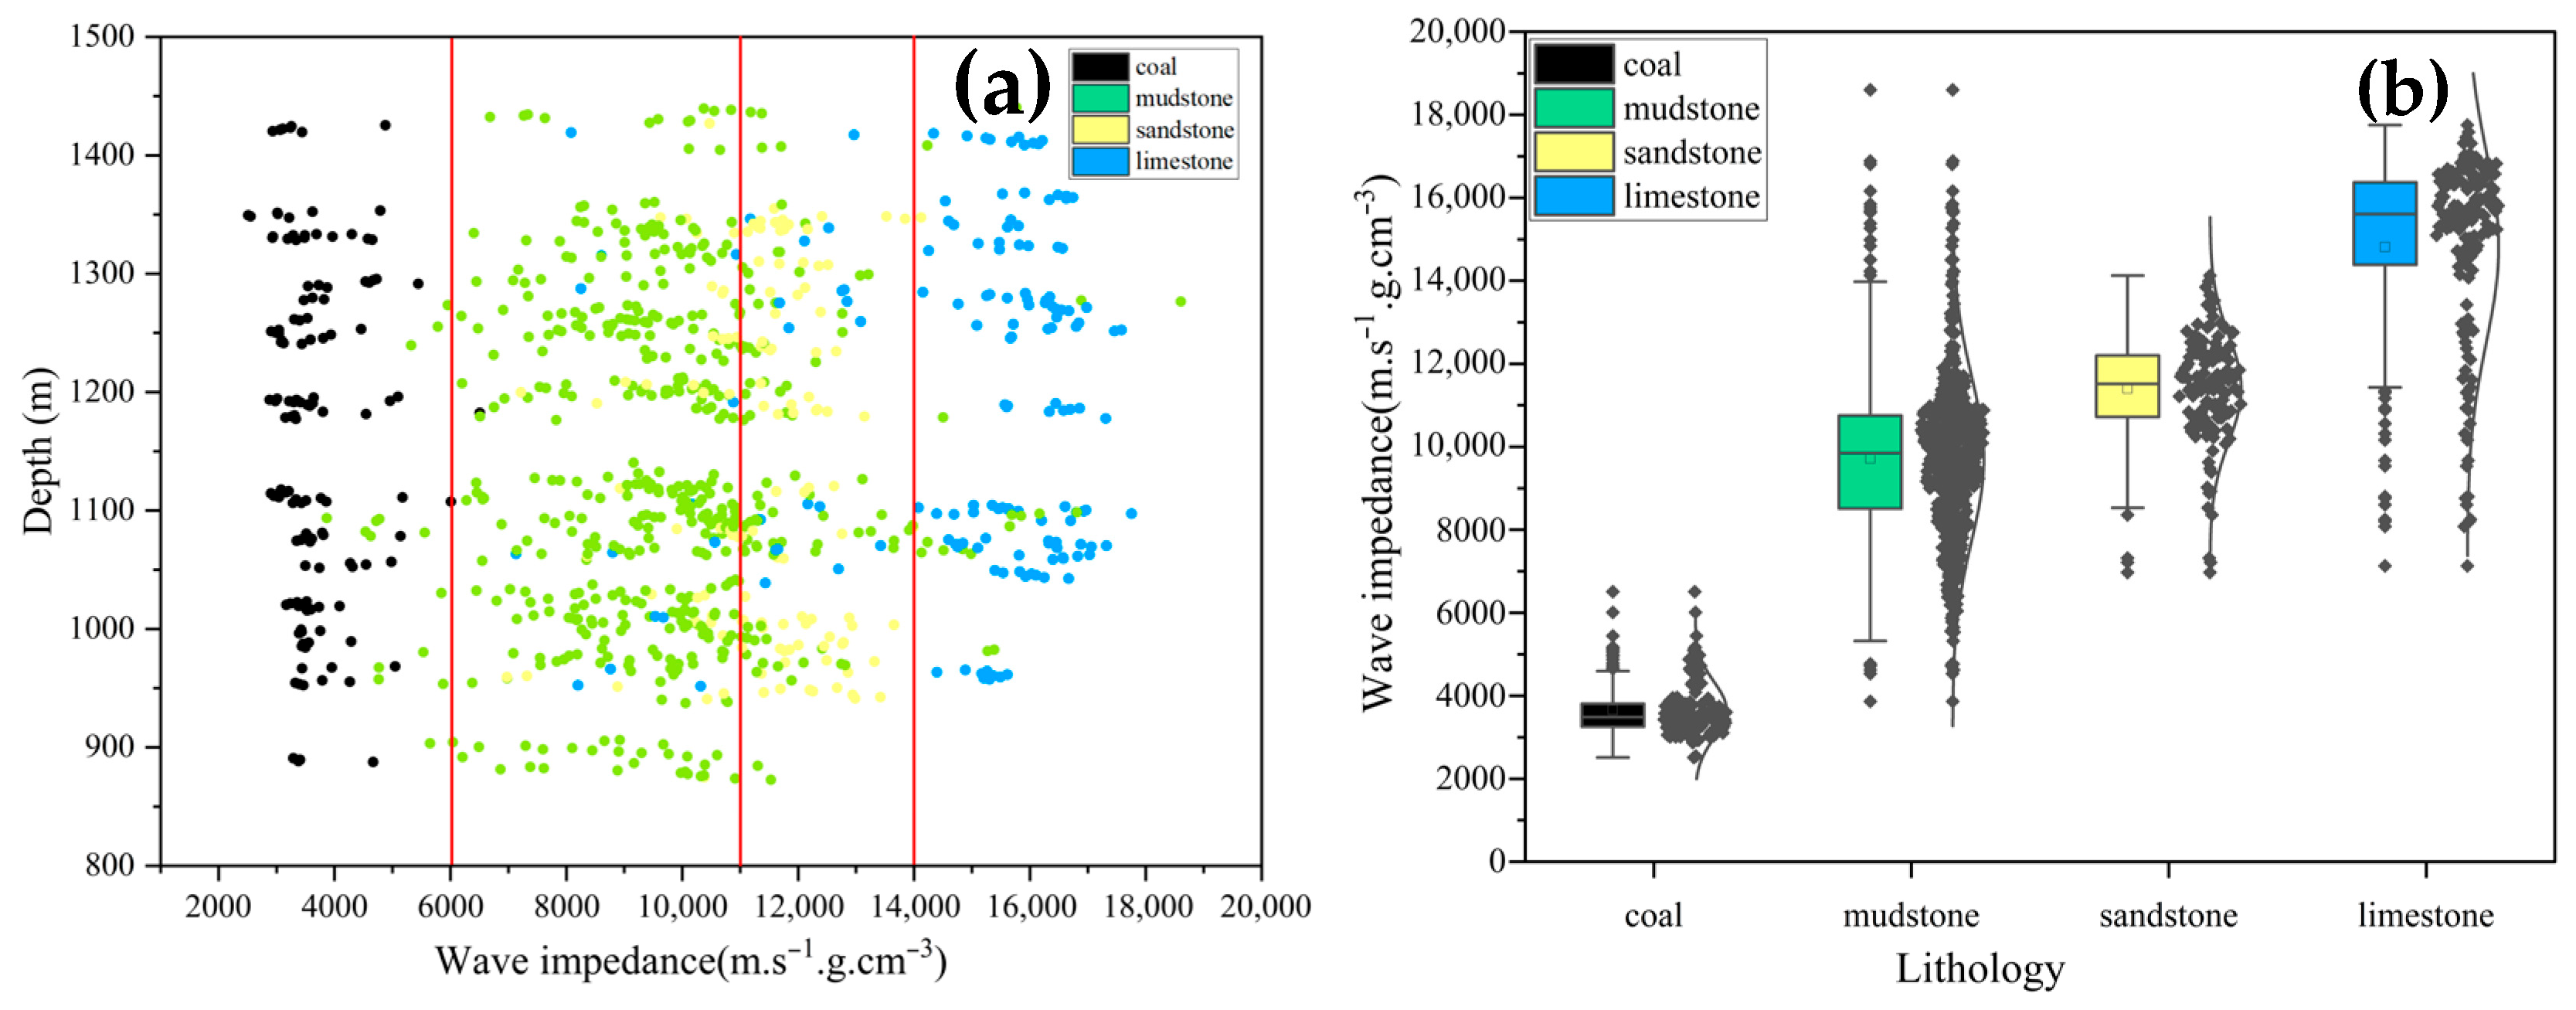
where , p and are the wave impedance (m·s−1·g·cm−3), density (g·cm−3) and acoustic wave velocity (m·s−1) of the rock, respectively. The wave impedance at various CBM well depths may be computed using the DEN and AC values. The wave impedance versus lithology intersection plot is shown below. A wave impedance-based lithology identification criterion is then established. The findings indicate an overall upward trend in the wave impedance values for limestone, mudstone, coal, and sandstone, as shown in Figure 4b.
Figure 4.
(a) Cross-plot of depth versus wave impedance (m·s−1·g·cm−3) with points colored by lithology (black: coal; green: mudstone; yellow: sandstone; blue: limestone) and vertical red lines marking impedance thresholds used for preliminary lithologic classification. (b) presents boxplots showing lithology distribution as a function of wave impedance. The figure illustrates that coal has the lowest median impedance, while limestone has the highest median.
The impedance value for coal is the lowest, 2000 to 6000 m·s−1·g·cm−3, mudstone is intermediate, from 6000 to 11,000 m·s−1·g·cm−3, sandstone is higher, from 11,000 to 14,000 m·s−1, and limestone is highest, at >14,000, respectively. Seismic profiles can be applied to wave impedance inversion, target layer calibration, and a comparison of the wave impedance curves computed using logging parameters. Based on this, the lithology identification criterion and the wave impedance inversion data are used to provide the seismic interpretation of lithology.
4.3. Lithological Importance of the Surrounding (Roof and Floor) Rocks on CBM
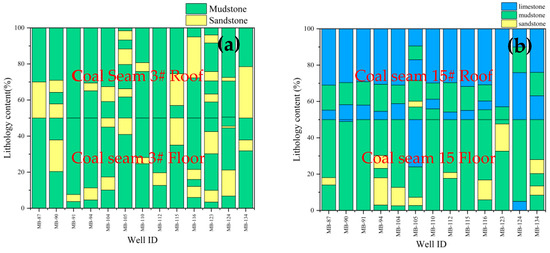
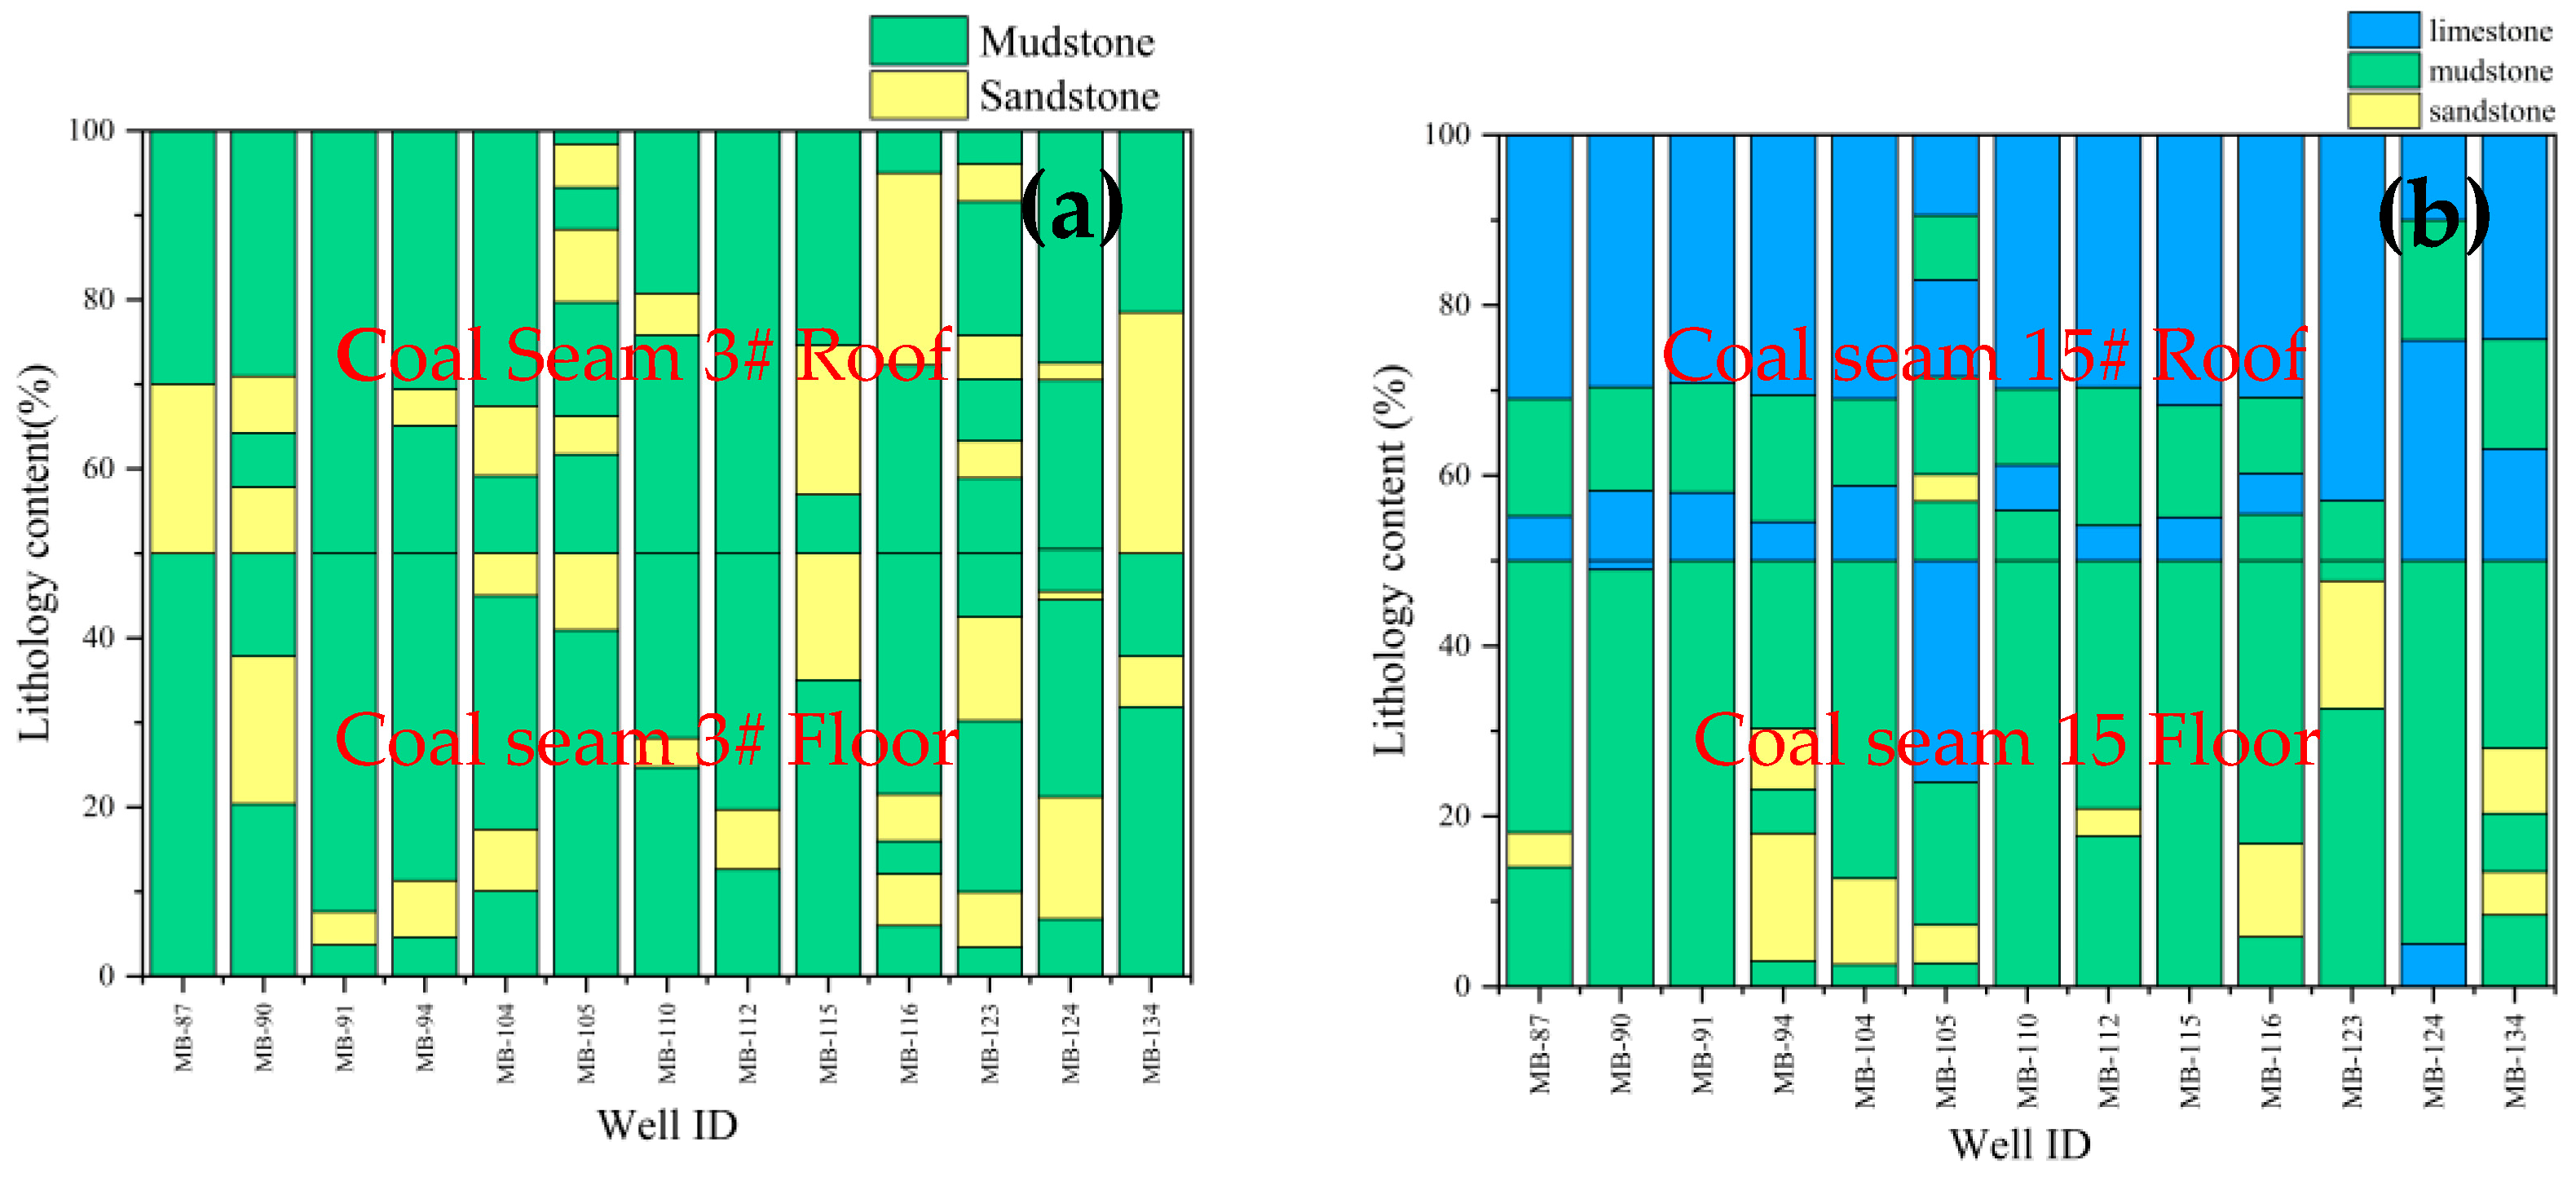
The composition of the floor and roof strata of a coal seam is a critical factor in gas preservation. In the current study, the lithology within 15 m above and below the No.3# and No.15# coal seams is evaluated to quantitatively describe the effect of lithology combination on the gas concentration of coal seams, taking into consideration the thickness of sandstone, mudstone, and limestone. The target strata’s lithology in the research region is measured at each well, as shown in Figure 5. The lithology of the floor and roof is summarized for the intersection of wells MB087 to MB134. The coal seam 3# roof and floor show that mudstone is dominant, while sandstone is interlayered with a minor showing in Figure 5a. The mudstone thickness is 7 to 15 m, with an average of ~12 m, whereas the sandstone is thinner, interbedded in the No.3# coal seam, which shows that the roof rock suggests a strong sealing capacity above the No.3# coal seam.
Figure 5.
Lithological composition of roof and floor strata around the No.3# and No.15# coal seams across wells MB087 to MB134. (a) shows the relation proportions of sandstone and mudstone in the roof and floor of the No.3# coal seam, where mudstone dominates most wells, indicating better sealing capacity. (b) illustrates the lithologic distribution in the roof and floor of the No.15# coal seam, revealing higher limestone and mudstone content in the roof, while sandstone is more abundant in the floor. Mudstone is the predominant proportion in the No.15# coal seam roof, enhancing reservoir preservation.
In the case of the No.15# coal seam, the roof lithology is different, in which the limestone is primarily composed of many wells, and sometimes mudstone is intercalated with limestone in the roof. The thickness of limestone in the roof range is between 5 and 13 m (average ~10 m), shown in Figure 5b, while the mudstone is underlined by a few meters in the No.15# coal seam. Limestone serves as an excellent cap rock, being low-permeability if laterally continuous. Overall, these observations indicate that both target coal seams are overlain by lithologies that are conducive to gas retention (mudstone for No.3# coal seam; limestone and mudstone for No.15# coal seam). The laterally persistent limestone in the roof of the No.15# coal seam and mudstone in the roof of the No.3# coal seam are a regional aquitard and a gas seal as the cap rock. Moreover, wave impedance has been implied to further evaluate the roof lithology of both the studied coal seams.
4.4. Ash Content Evaluation
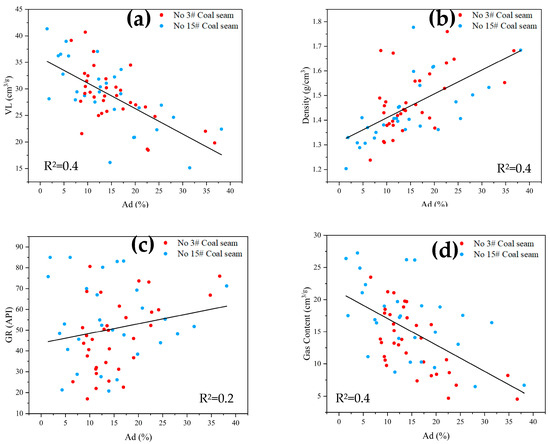
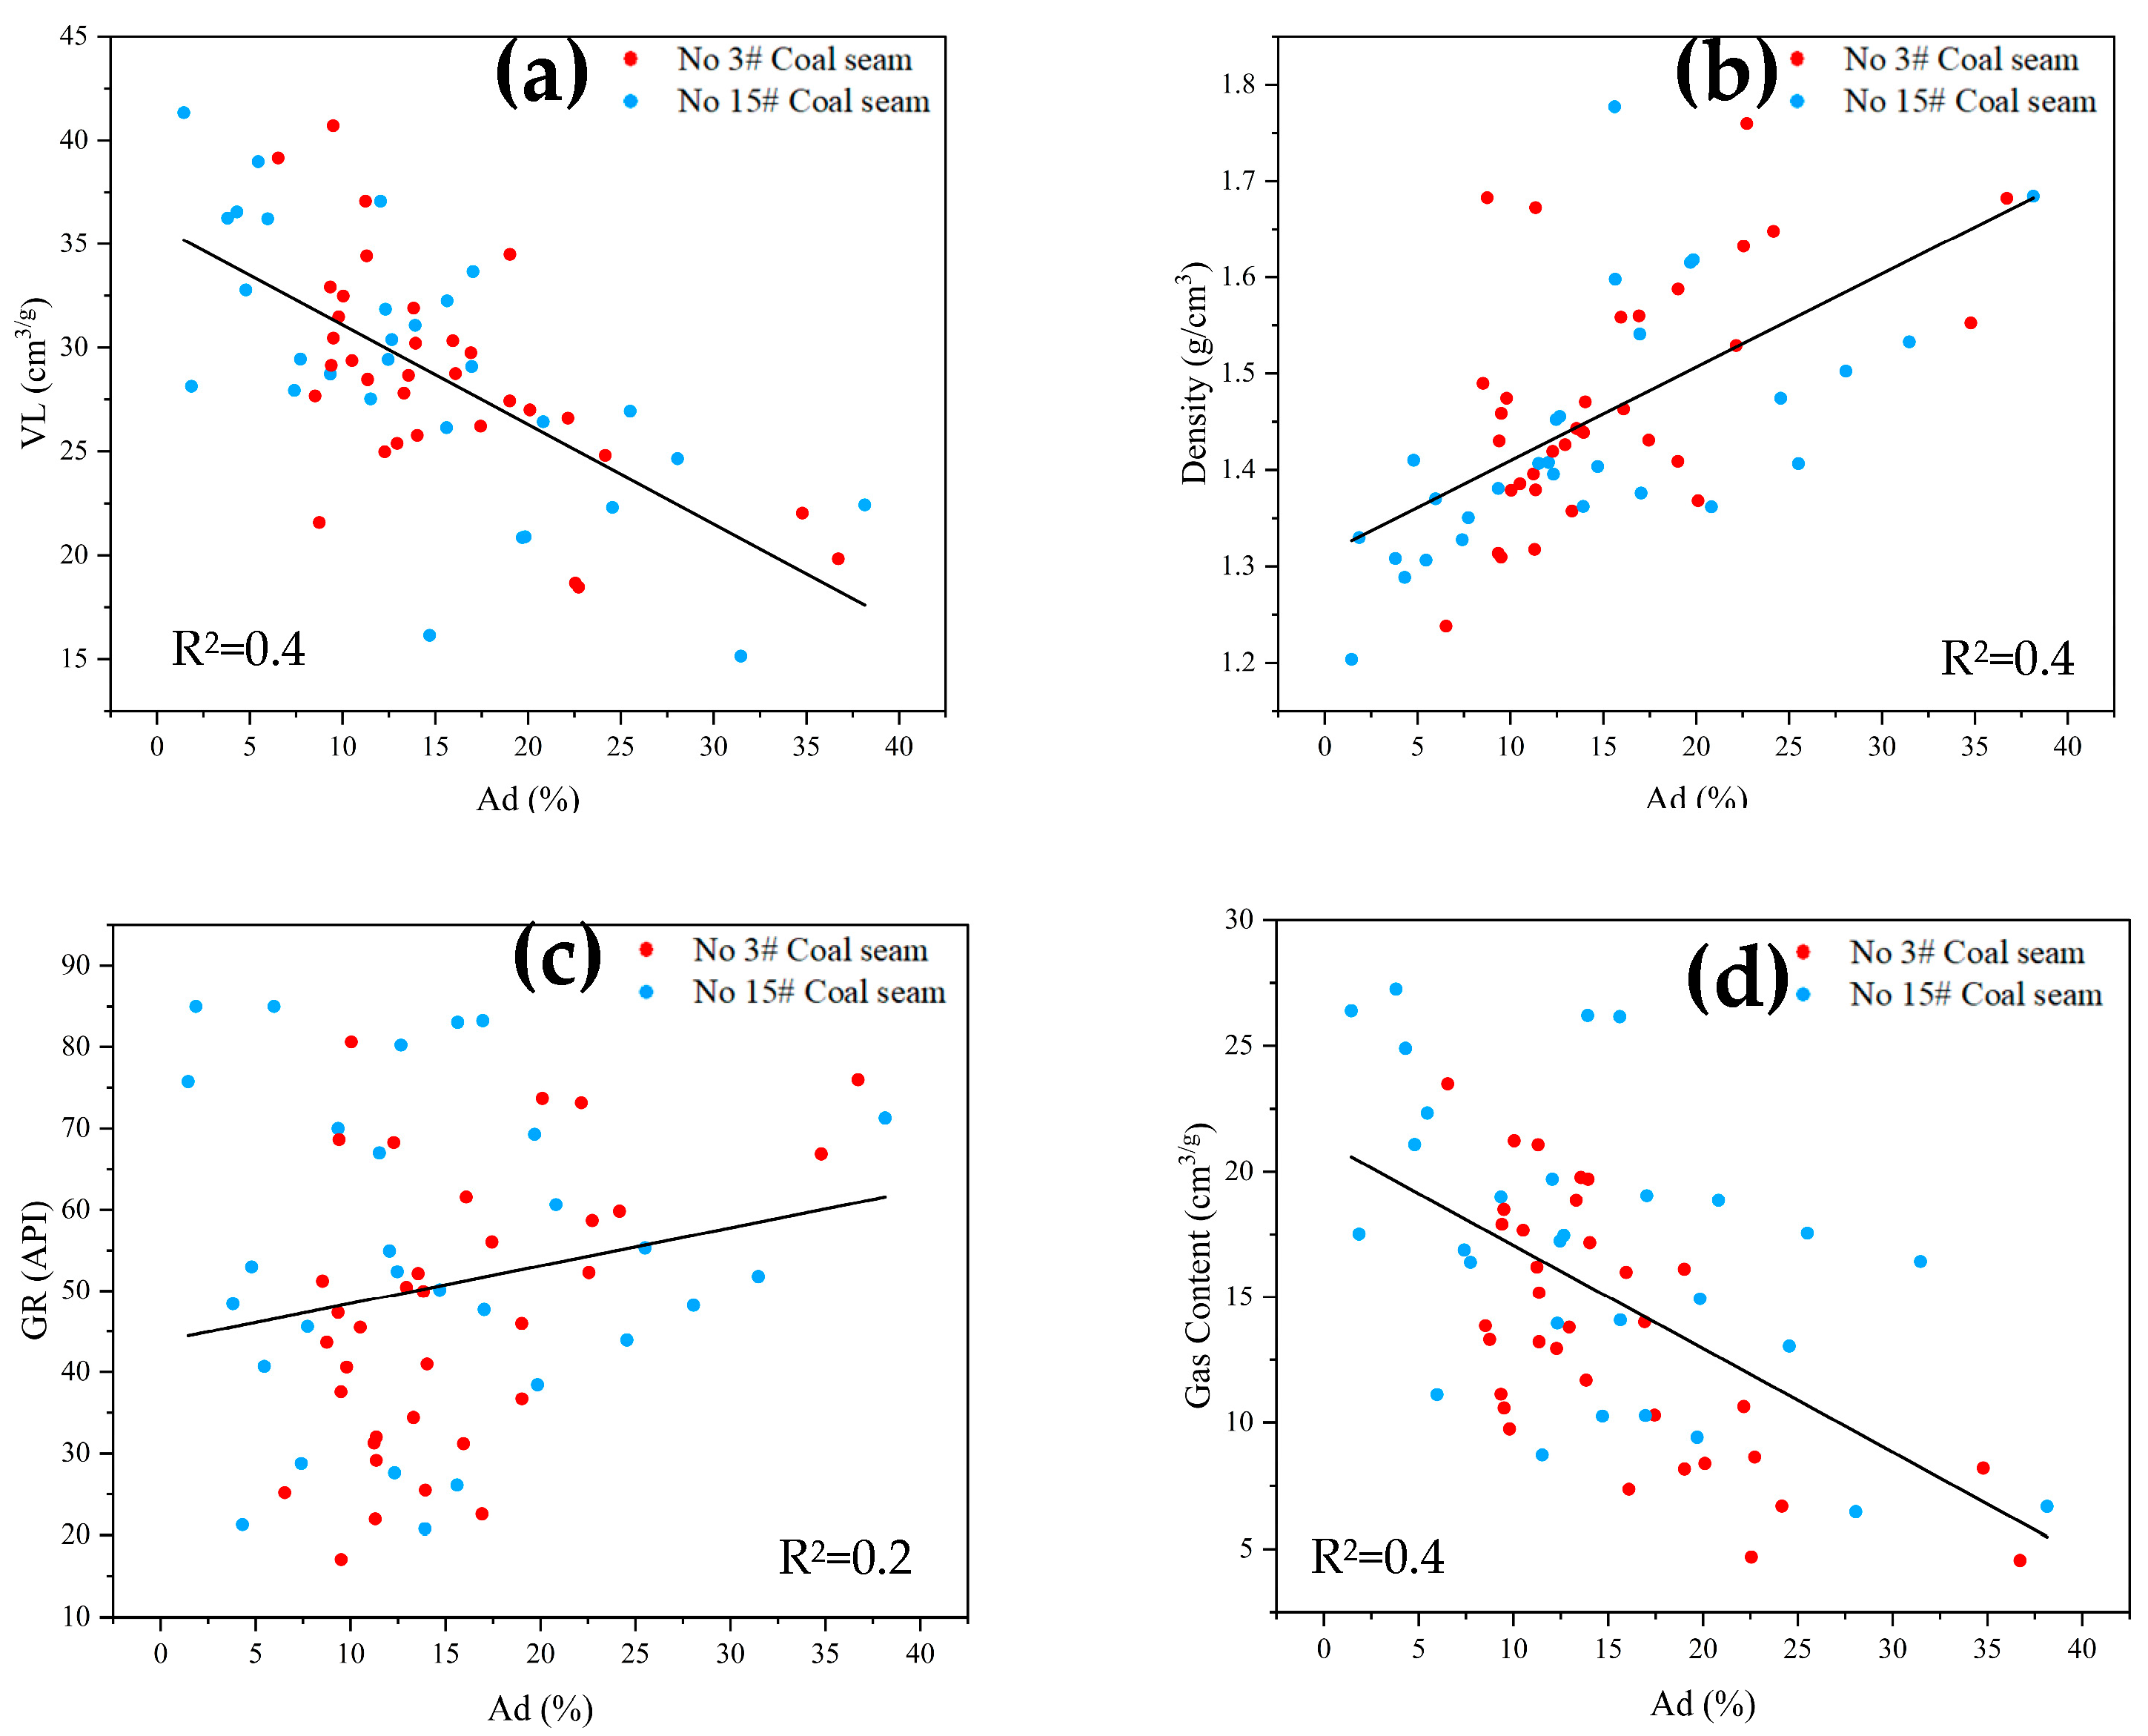
The ash content determines the methane storage capacity in the coal seam. The higher the ash content, the lower the gas content and the lower the micropore volume because the ash content inorganic mineral occupies space within the coal. For this reason, we correlate the ash content with the Langmuir volume (VL), which establishes that the tiny pore and fracture patterns in coal are closely linked to the gas storage capacity of coal reservoirs. So, the relationship between the ash and the Langmuir volume (VL) is negative (R2 = 0.4), as shown in Figure 6a. This indicates that, as the ash content increases, the Langmuir volume tends to decrease within the coals with more mineral matter, which have fewer micropores available for gas adsorption. Similarly, the gas content is correlated with the ash (R2 = 0.4) in Figure 6d, which shows that low ash can hold more gas. Additionally, the ash content is positively correlated with the density (DEN) (R2 = 0.4), shown in Figure 6b, and the gamma ray (GR) (R2 = 0.2), shown in Figure 6c. As ash content increases, the density and GR values also increase due to the presence of ash in coal.
Figure 6.
Cross-plots between ash content (Ad%) and petrophysical properties for No.3# and No.15# coal seams: (a) cross-plots between ash (Ad%) and Langmuir volume, which show negative correlation with ash content; (b) cross-plots between ash (Ad%) and density (DEN), which show positive correlation; (c) cross-plots between ash (Ad%) and gamma ray (GR), which also show positive correlation; (d) cross-plots between ash (Ad%) and gas content, which show a negative correlation with ash content.
4.5. Coal Thickness and Burial Depth
The coal bed thickness is the foundation of methane enrichment because a thicker coalbed should theoretically create more total methane and a larger reservoir space during its evolution. Coal seams can be used as a source rock and as CBM reservoirs. Because a coal seam can provide space for the storage of CBM, it can contain abundant CBM.
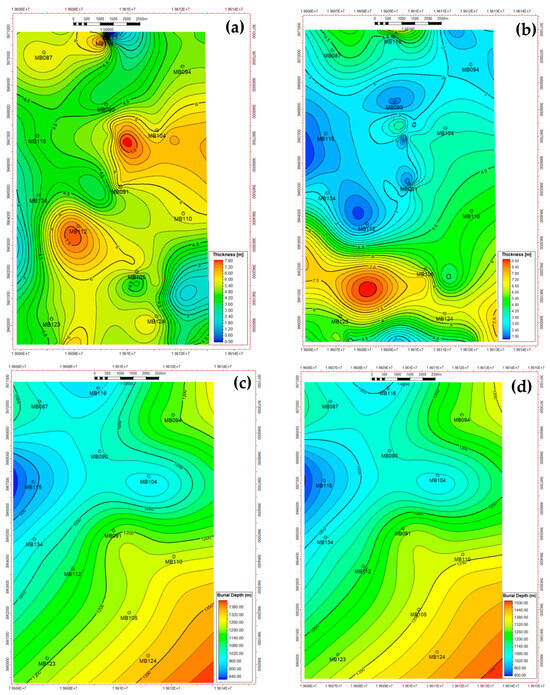
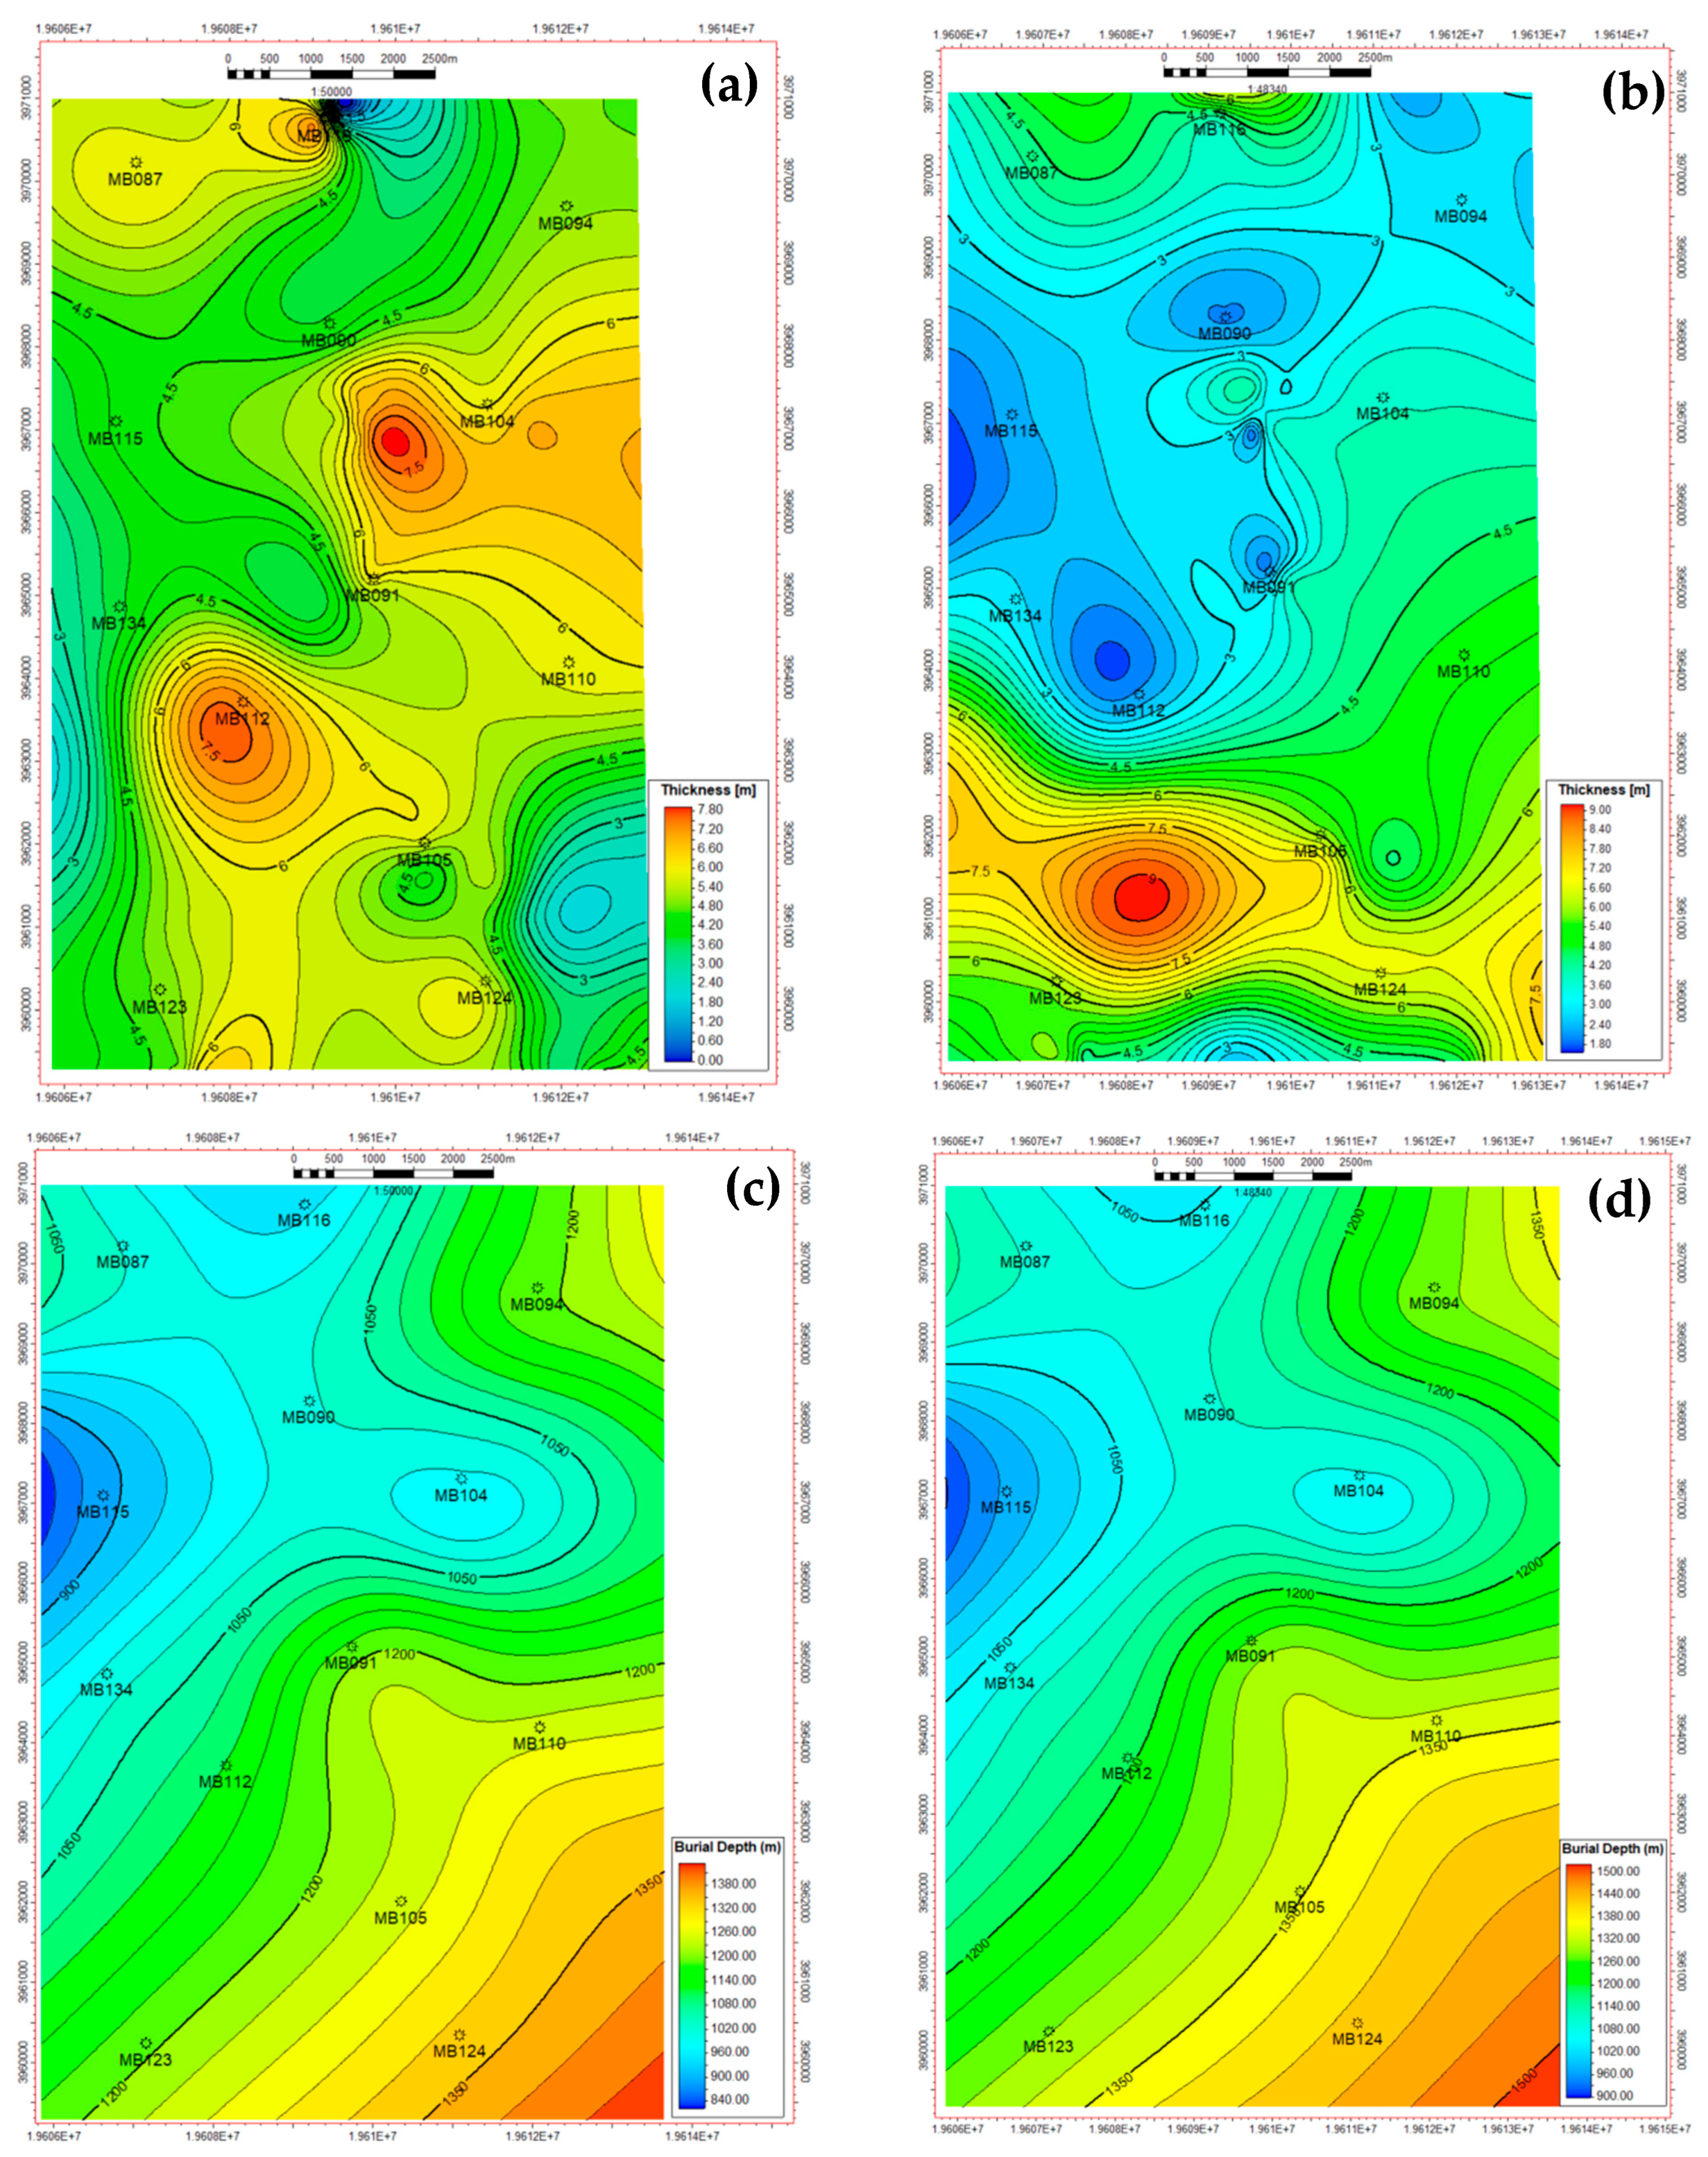
The thickness of the coalbed sediment is comparatively stable here. It averages (~6) meters and varies from (~3 to 10 m); see Figure 7a,b. The narrowest coalbed has a rather narrow range and is located close to well block MB124 and MB134 in the anticline’s center in the No.3# coal seam. The thickest sedimentary coalbeds, greater than 7 m, formed close to well block MB112 and MB104, whereas the thicker coalbeds generally formed near synclines in coal seam No.3#. Meanwhile, in coal seam No.15#, the thicker coal bed seam area is MB105 and MB123, formed near synclines in coal seam 15#. But the small and narrow coal seam is present in the anticline of the MB090, MB091, and MB115 area in coal seam No.15#. Statistically, the variation in coal seam thickness in the study area is comparatively uniform (~5–8 m thickness), which is favorable to CBM enrichment and preservation.
Figure 7.
Contour map of coal seam thickness and burial depth. The red color shows us the highest, and the blue color is the lowest. (a) The thickness map of No.3# coal seam; (b) the thickness map of No.15# coal seam; (c) burial depth of No.3# coal seam; (d) burial depth of No.15# coal seam.
Burial depth is one of the most important factors of coal maturity, coal rank, and reservoir pressure. The methods we used for contouring the burial depth are isopach contouring mapping for coal seam No.3# and coal seam No.15#, as a result of the calculated moderate burial variation of around 900–1400 m, with a distinct low-burial zone to the northwest and a deeper burial to the southeast. The local minimum around well MB104 represents a depression. In the direction of wells MB105–MB124, the gradient rises, indicating structurally deeper regions. A closed low in the NW that progressively widens towards the SE boundary in the contour curvature is shown in Figure 7c.
Although the total deeper burial of coal seam No.15# is between 950 and 1500 m, coal seam No.15# has a similar structural layout. While the deep zone in the SE is stronger and the isolines are closer together, suggesting that it is steeper, the NW portion (around MB115) still exhibits a shallow depth comparable to the No.3# coal seam. The structural tightness of the No.15# coal seam is higher, which is shown in Figure 7d.
4.6. Nature of Coal Seams’ Roof
The roofs of the coal seams in coalbeds No.3# and No.15# are diverse lithologies. Additionally, for further investigation, we made an isopach map with the help of a contour map, in which we determine the roof lithology of coal seams No.3# and No.15#.
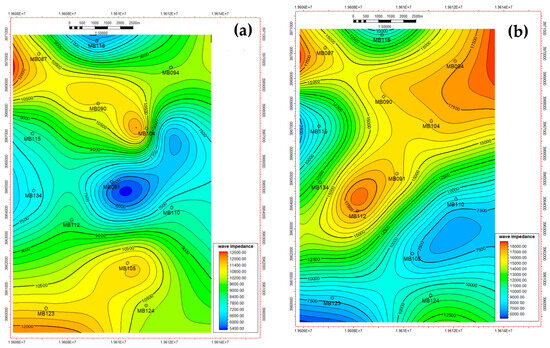
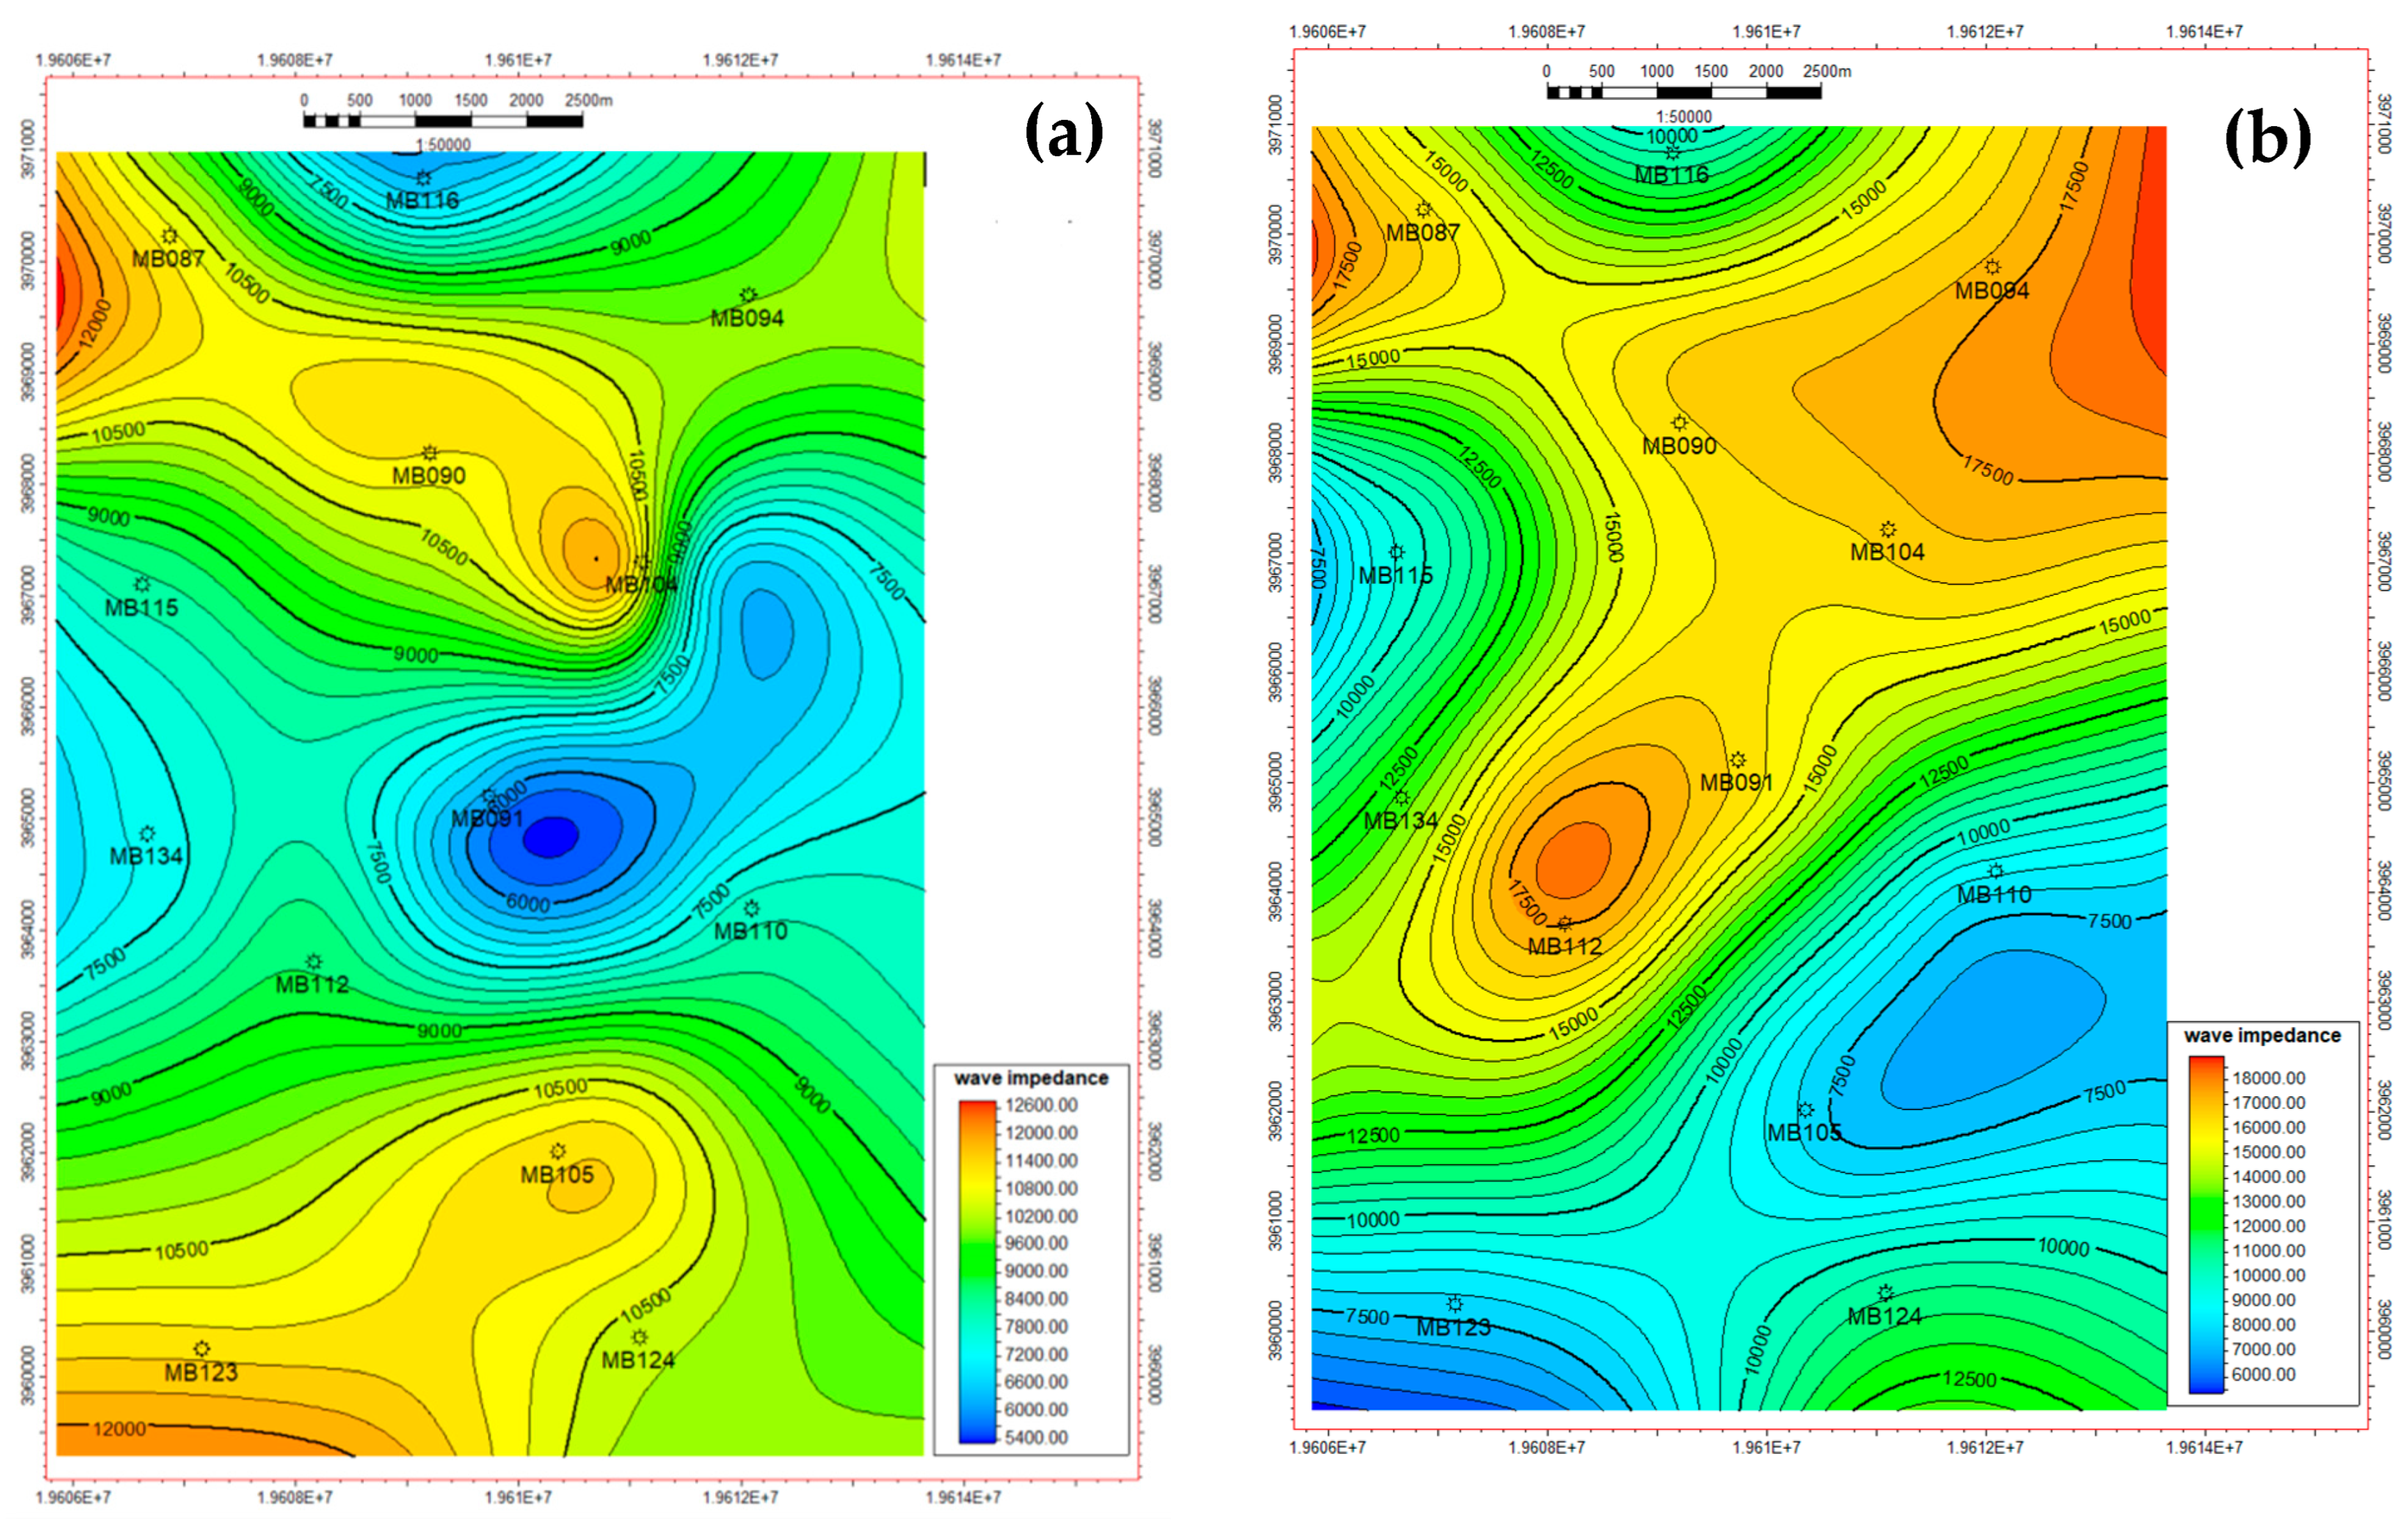
The mudstone and limestone in the top rock layers are advantageous for gas content, and generally the circumstances for CBM accumulation and storage are favorable because there are minor faults in the entire area. However, fracture channels, such as fault-cutting and folding, may form in these mudstone strata due to structural factors. In light of this issue, the coalbed top density is analyzed using the wave impedance inversion data, as shown in Figure 8. The blue color represents the lowest wave impedance, which indicates mudstone, and the reddish color value is greater than that, which indicates sandstone in Figure 8a in coal seam No.3#. However, the blue color value represents mudstone, green represents sandstone, and the yellow-to-reddish color is the highest, which represents the coal seams’ limestone roof for No.15#, shown in Figure 8b. The value of mudstone is 6000 to 11,000 m·s−1·g·cm−3, sandstone is 11,000 to 14,000 m·s−1·g·cm−3, and limestone is greater than 14,000 m·s−1·g·cm−3. The wave impedance values tell us the roof is covered by mudstone and limestone. Overall, the top cover exhibits a strong sealing performance as the CBM reservoir’s capping layer.
Figure 8.
Wave impedance contour maps for two different coal seams: (a) coal seam No.3#, (b) coal seam No.15#. These maps illustrate the spatial distribution of wave impedance values across the coal seams. The contour lines indicate variations in the impedance, which can provide insights into the physical properties of the coal formations, such as density and velocity, and can identify the roof stratum of coal seams.
4.7. Regularity of Methane Enrichment
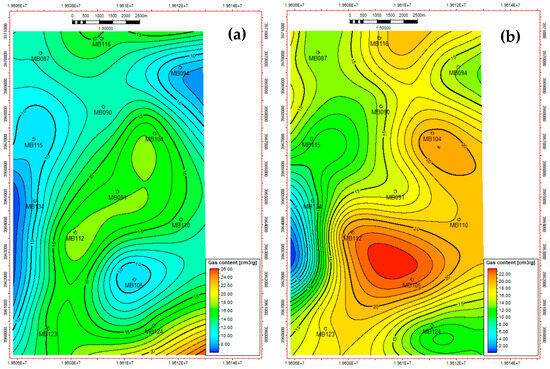
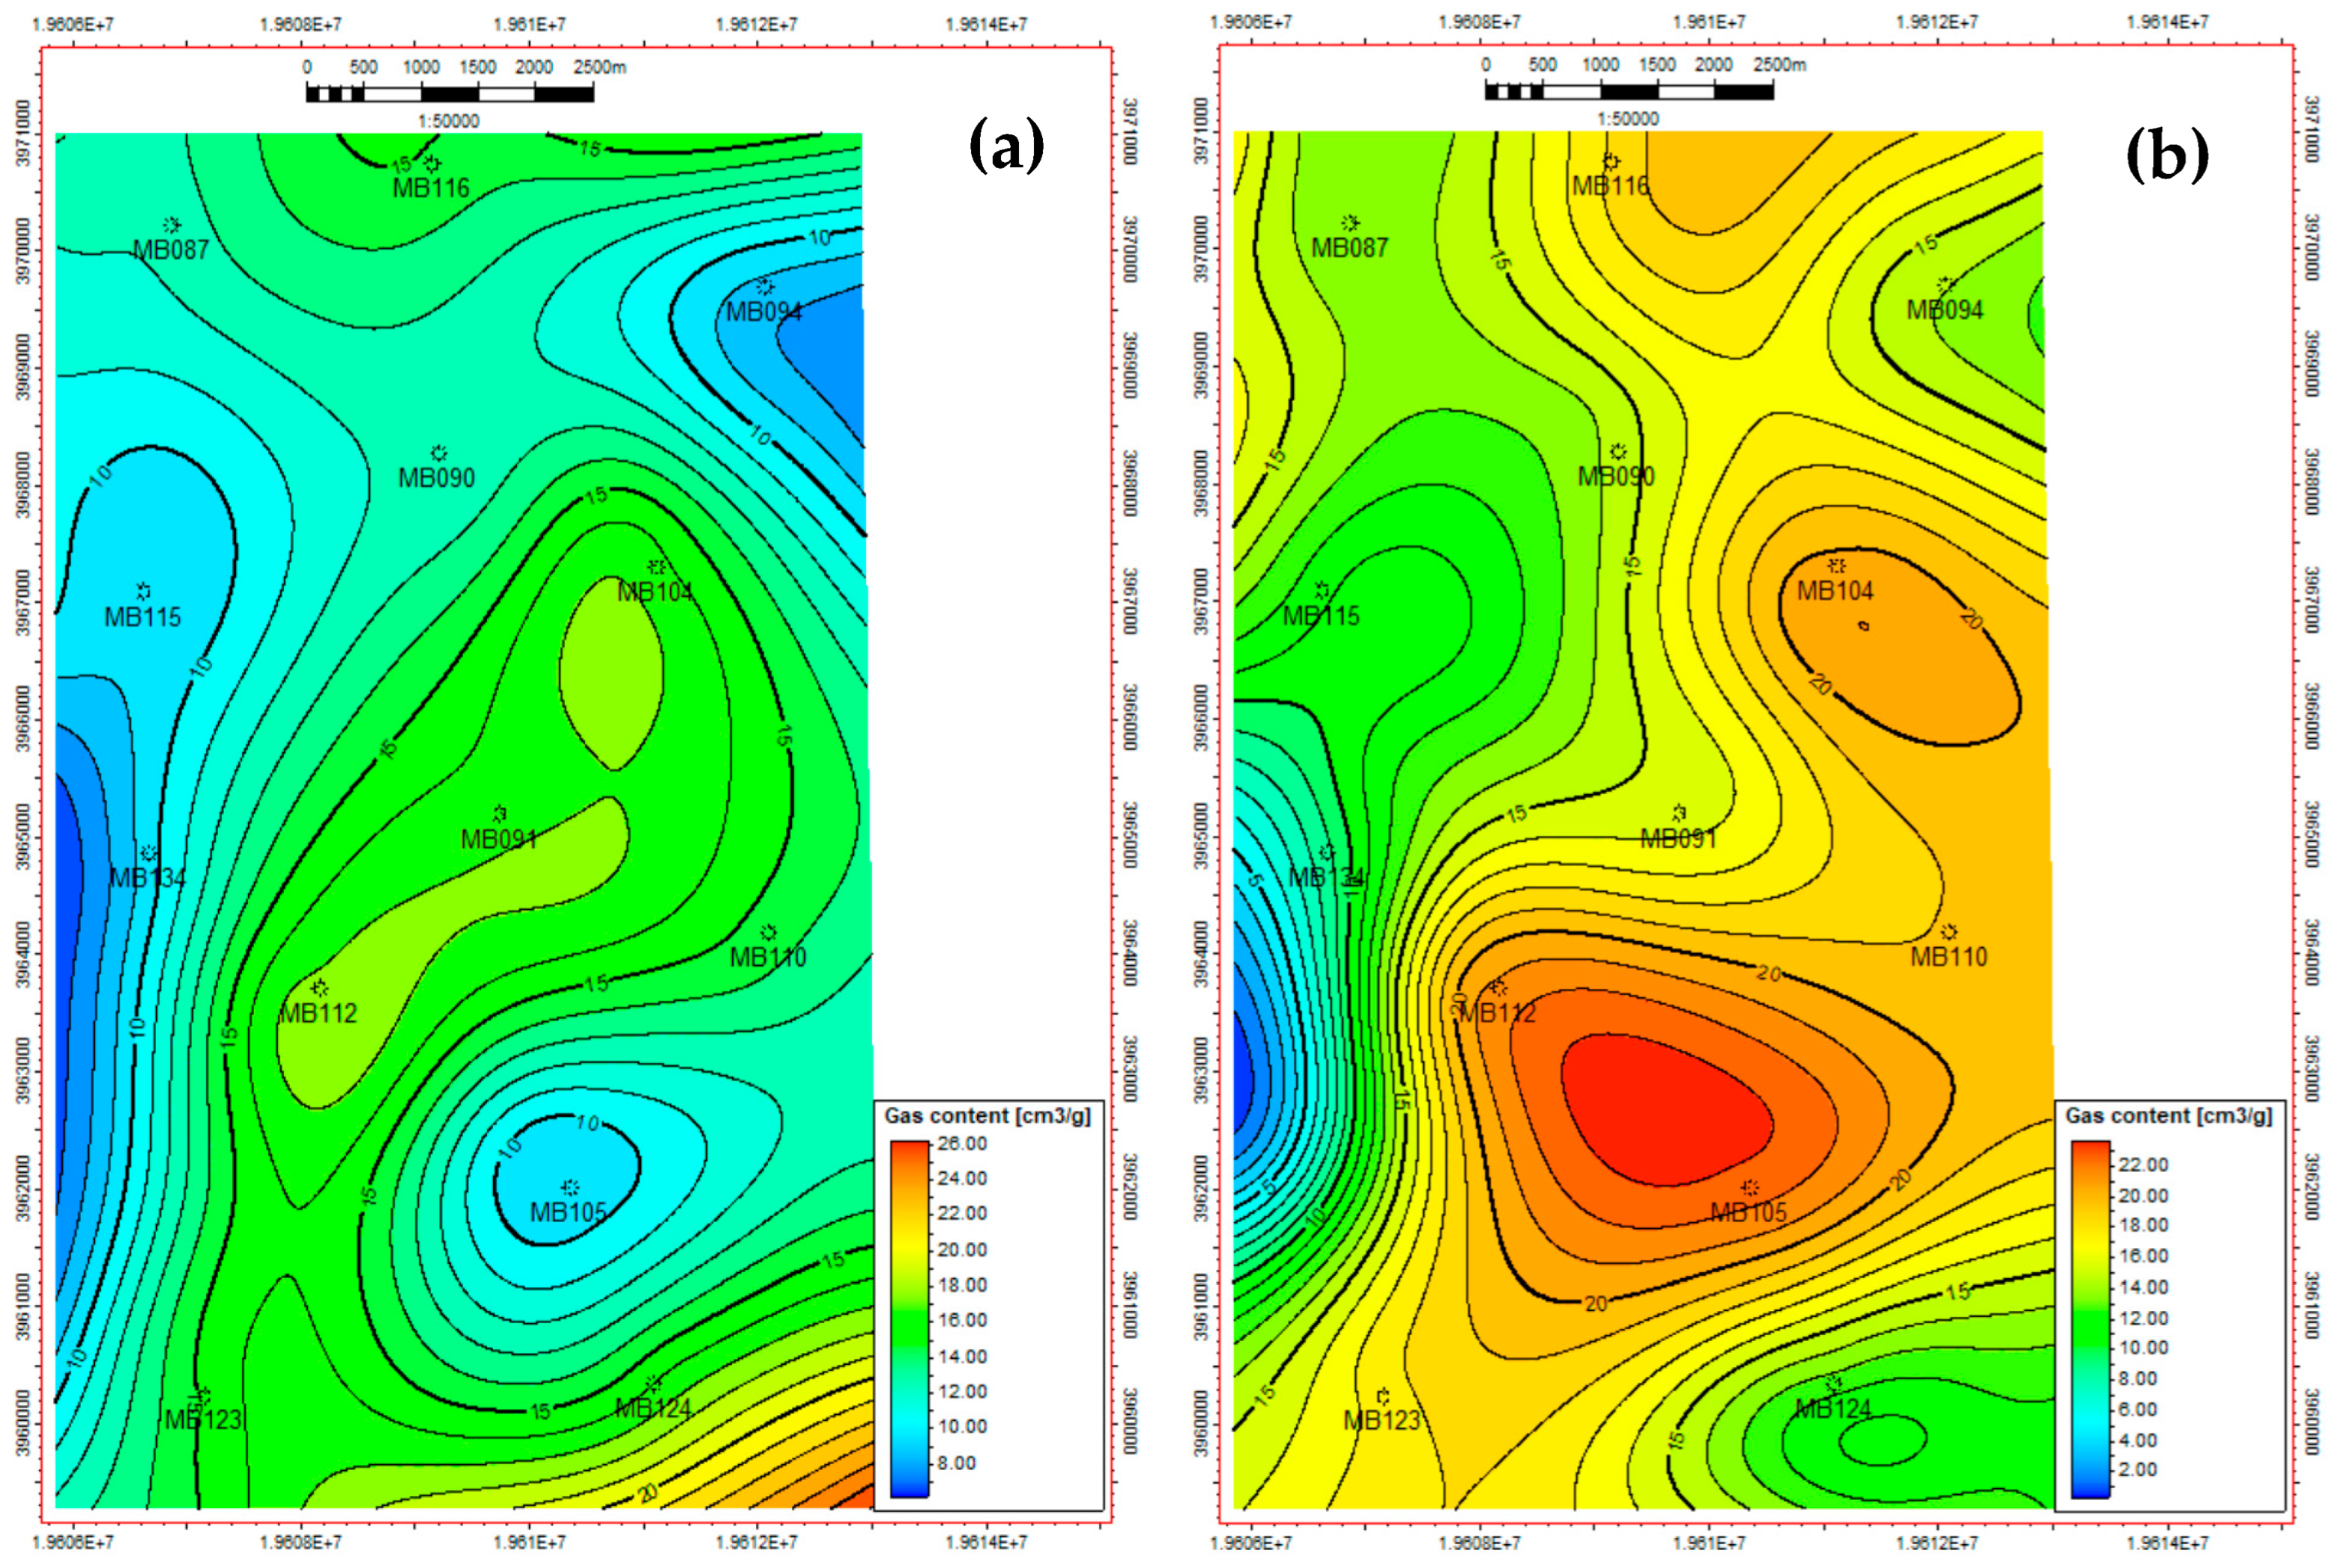
Using the data gathered for air-dry total gas content, the distribution of gas in the coal seams is mapped, and the regularity of methane enrichment in the study region is examined. The contour maps of the methane content in m3/t for coal seam No.3# and coal seam No.15# are shown in Figure 9 across the study area. Coal seam No.3# exhibits a significant rate of total methane enrichment. During the later stages of development, additional drilling revealed that the methane content ranged from around 8 m3/t at the minimum to about 26 m3/t at the maximum. Meanwhile, in coal seam No.15#, it exhibits a significant rate of total methane enrichment, and the methane content ranged from around 5 m3/t at the minimum to about 24 m3/t. The highest three zones of gas content in the coal seam are MB112, MB104, and MB91 in coal seam No.3#, in which all record values are in the mid-20 m3/t, and the location has thicker coal and favorable sealing. In contrast, the lower gas content is mainly on the NNE and WNW sides, with the blue contours indicating the lowest gas content, shown in Figure 9a. However, in coal seam No.15#, the highest coal zone consists of three places, MB105 to MB112, MB104, and near MB116, because of the moderate depth, and the roof is thick, with a competent limestone and mudstone as cap rocks. The lowest gas content is located on the west side of coal seam No.15#, shown in Figure 9b.
Figure 9.
Gas contour maps for two different coal seams: (a) coal seam No.3#, (b) coal seam No.15#. These maps show the distribution of gas content in coal seams by using contour lines.
4.8. Structural Analysis
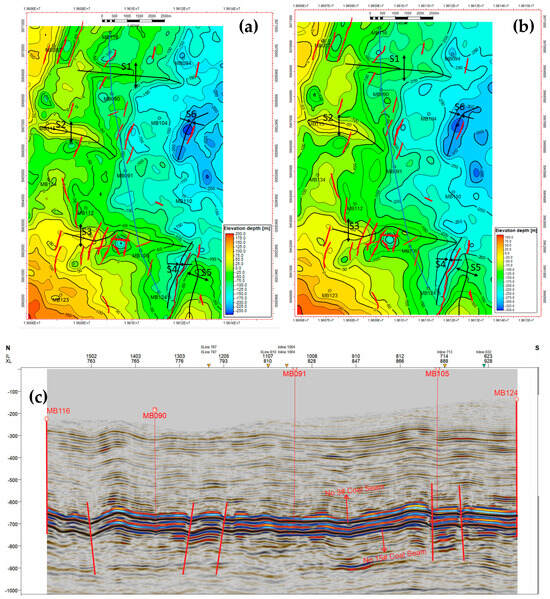
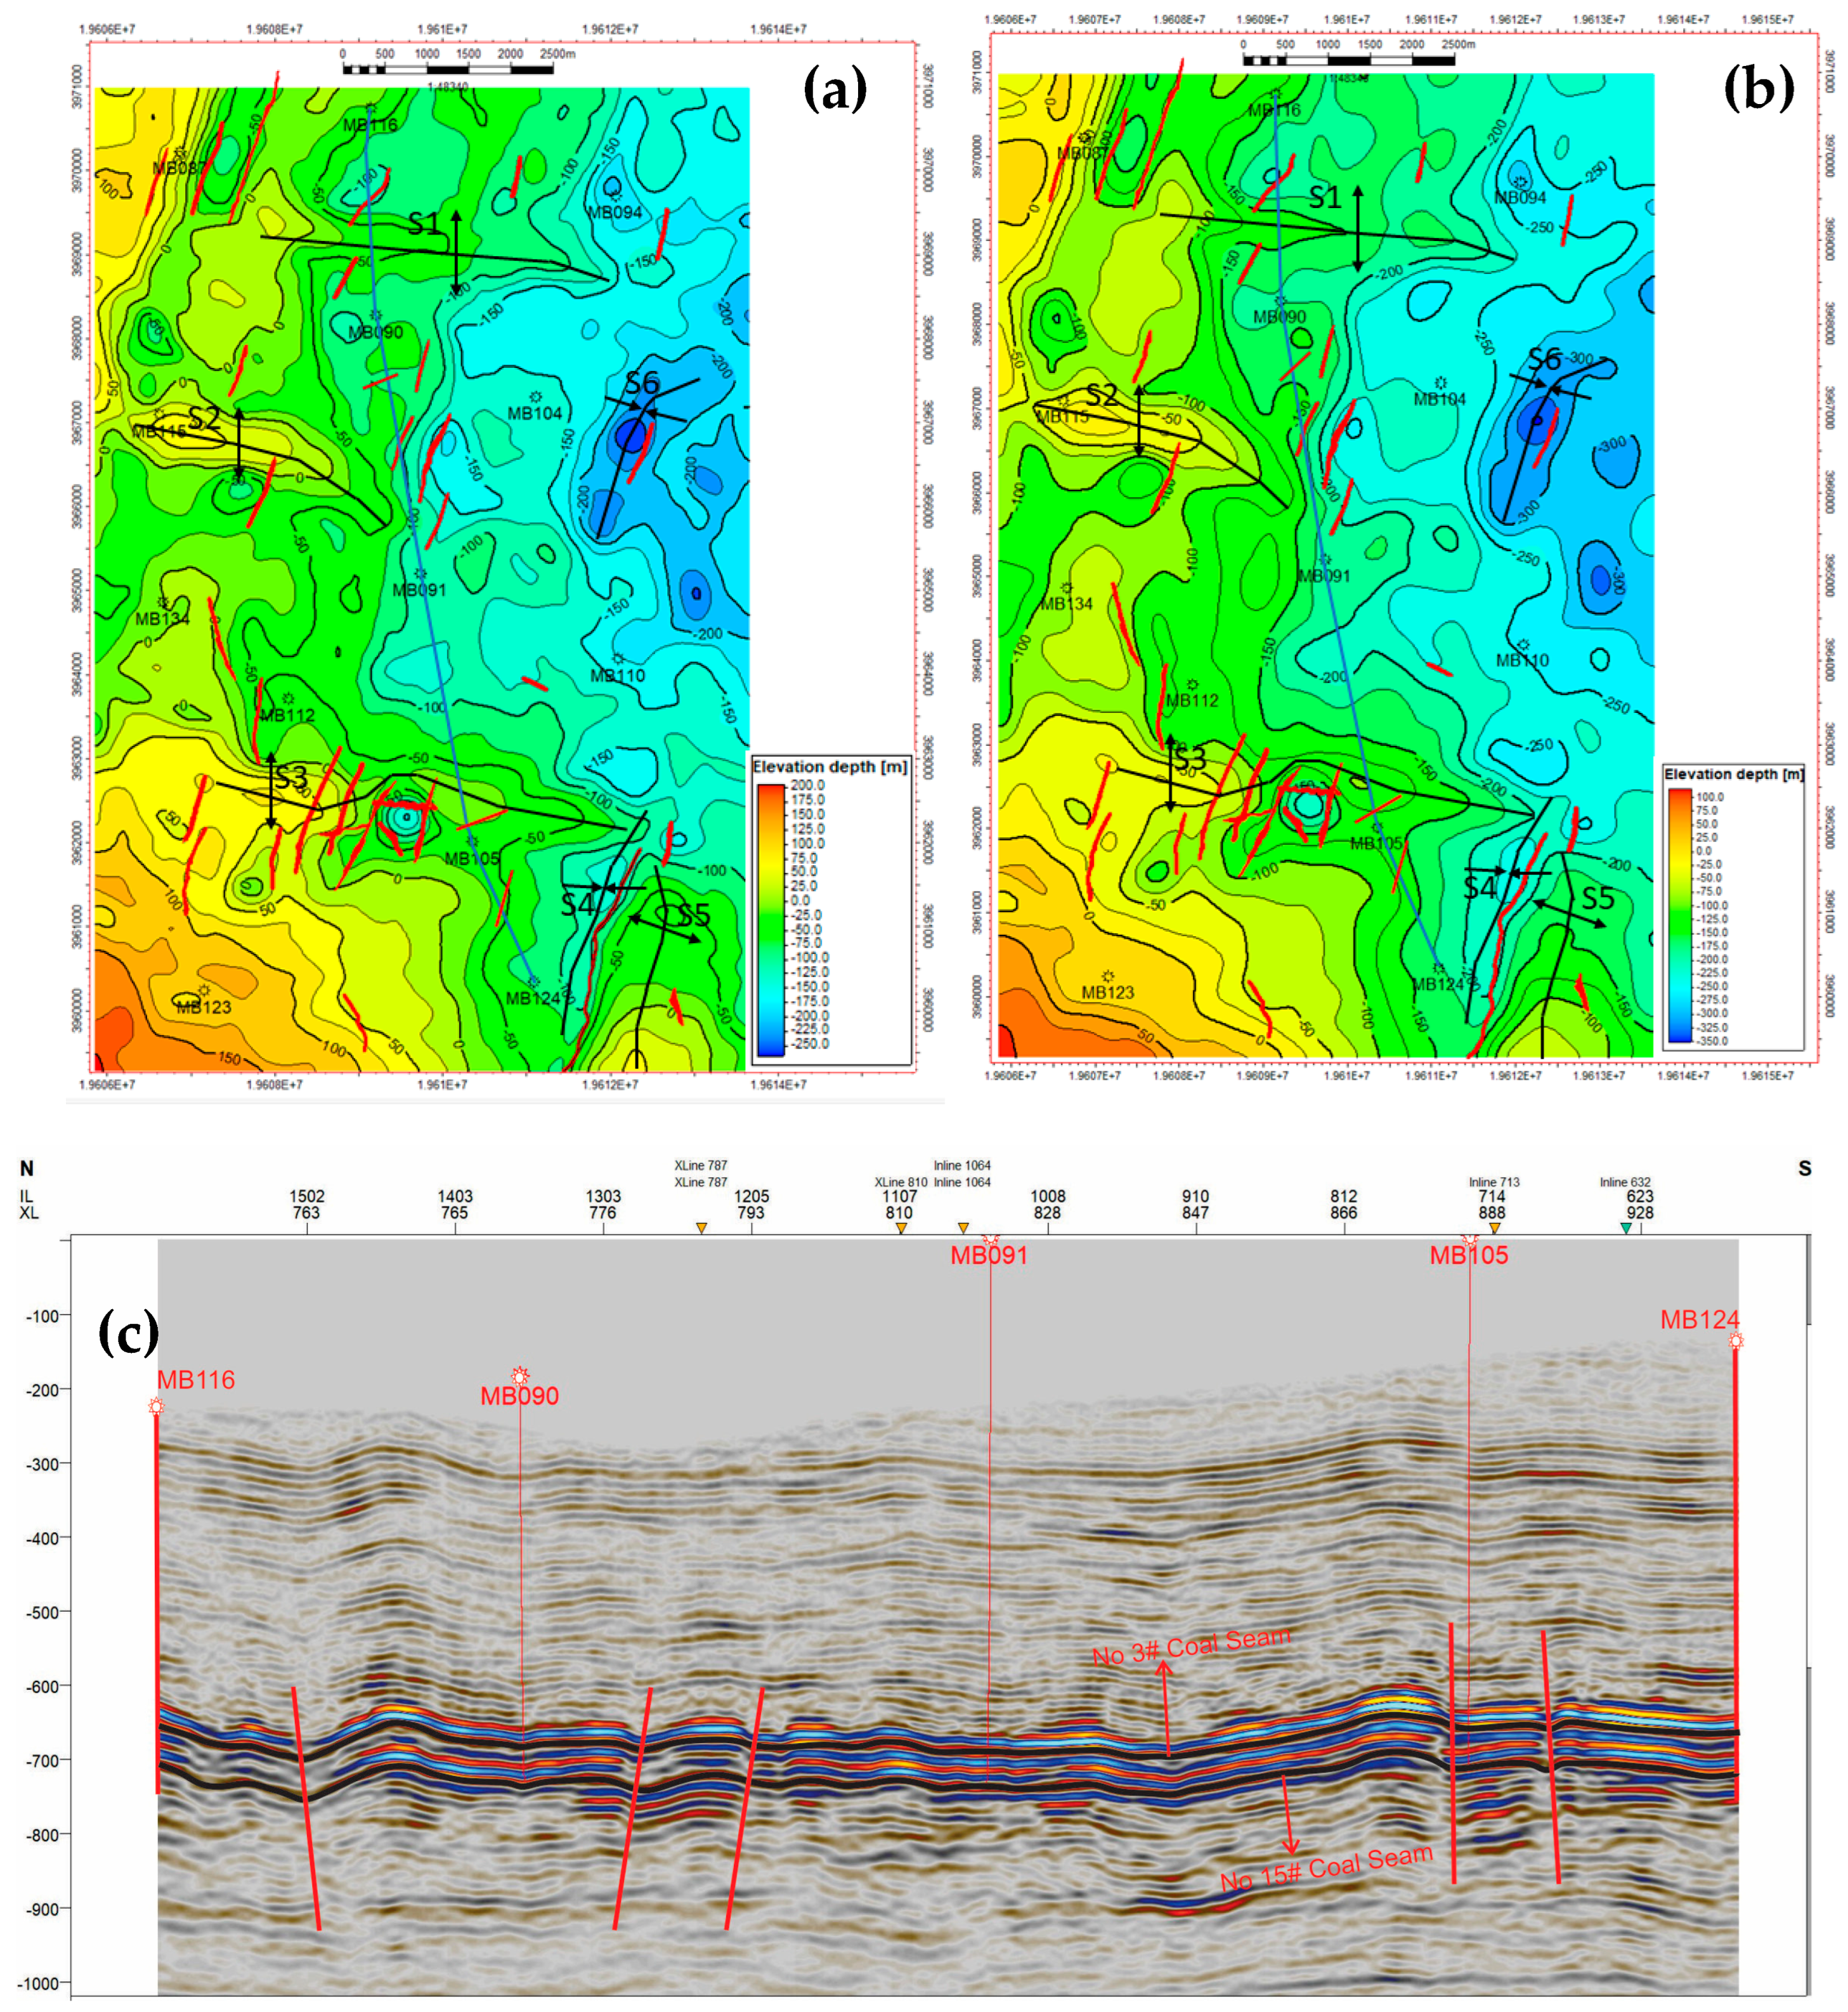
The 3D seismic data provided detailed information about the geometry of the coal seams. The structure of the Mabi Block has many superimposed folds and faults. The roof surface of the No.3# coal seam shows a regional NNE-trending, ESE-dipping monocline modified by six secondary folds: S1-, S2-, and S3-parallel ESE-trending anticlines in the north-central area. S4 (syncline) and S5 (anticline) have parallel NNE-trending folds in the southeast, and S6 has a NNE-trending syncline on the eastern margin. Faults are dominated by NNE-trending strike-slip faults with a minor NNW set. The depth trends shallow in the west and deep in the east. The shallowest is the southwest corner, with a ~1120 m burial and floor elevation of +160 m. The deepest is the S6 syncline axis, with a ~1020 m burial and floor elevation of −265 m, as shown in Figure 10a.
Figure 10.
(a) Coal seam No.3#; (b) coal seam No.15#. These maps show the contour map of the roof, with faults in red and folds in black. (c) Seismic line of No.3# coal seam and 15# coal seam from well north to south (MB116–MB124).
Coal seam No.15#’s spacing to the No.3# seam is fairly constant; the roof structure mirrors that of the No. 3# seam. The strata form a regional NNE-trending, ESE-dipping monocline modified by six second-order folds. Depth trend: The shallowest is the southwest corner, with a ~1230 m burial and elevation of +50 m. The deepest is the S6 syncline axis, with a ~1140 m burial and elevation of −485 m, as shown in Figure 10b.
5. Discussion
While controlling the factors for gas content in the coal reservoir of the Mabi Block, we identify the primary results from geological and geophysical methods. These integrated results for controlling factors include such factors as the roof and floor lithology, burial depth and structure properties, thickness of the coal seam, ash content, adsorption capacity for coal quality, and structure deformation such as faults and folds. These are the contributors to the CBM in an interrelated manner.
5.1. Lithology Control
The gas preservation depends on the lithology. In the Mabi Block, the mudstone and limestone thickness in the layers of the roof of the coal seam is higher, which acts as an effective seal as a cap rock. Since mudstone and limestone have a low permeability, porosity, and high capillary entry pressure, this can cause the inhibition of gas escaping upward easily [18,32]. A lithological intersection analysis model is developed based on the variations in how different lithologies respond to the four common logging configurations. While RD and GR have lower reaction values in coal, as shown in Figure 11a. AC and CNL have bigger ones. In limestone, the RD response values are considerable, but there are fewer CNL, AC, and GR responses. Medium AC and CNL values, lesser RD values, and noticeably high GR values are characteristics of mudstones. Medium AC, GR, and CNL values and lower RD levels are seen. The RD response values are considerable, but there are fewer CNL, AC, and GR responses. Medium AC and CNL values, lesser RD values, and noticeably high GR values are characteristics of mudstones. Medium AC, GR, and CNL values and lower RD levels are seen in sandstones [7]. Significantly, the logging parameters’ response values are readily skewed by the impact of nearby layers. For instance, the influence of bordering limestone clearly causes the RD value in the upper portion of the No.15# coal seam to be larger, and the influence of coal clearly causes the CNL and AC values in the lower portion of the carbonate to be higher, as shown in Figure 3. As a result, when using geophysical logging to identify lithologies, a threshold for the logging characteristics of various lithologies should be established between the lower and upper medians, with a higher structure curvature, which indicates the potential for a more pronounced fracture. In contrast, a relatively gentle segment of the coal seams exhibits a lower structural curvature value, which explicitly displays the findings of geophysical logging used to identify the lithology of typical wells, shown in Figure 2 [33].
Figure 11.
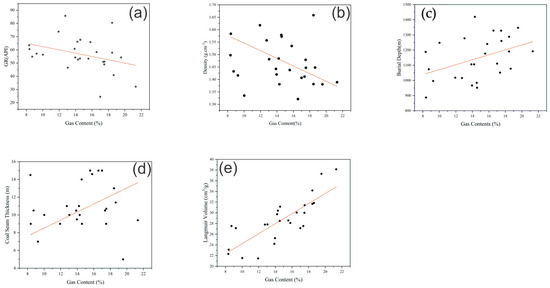
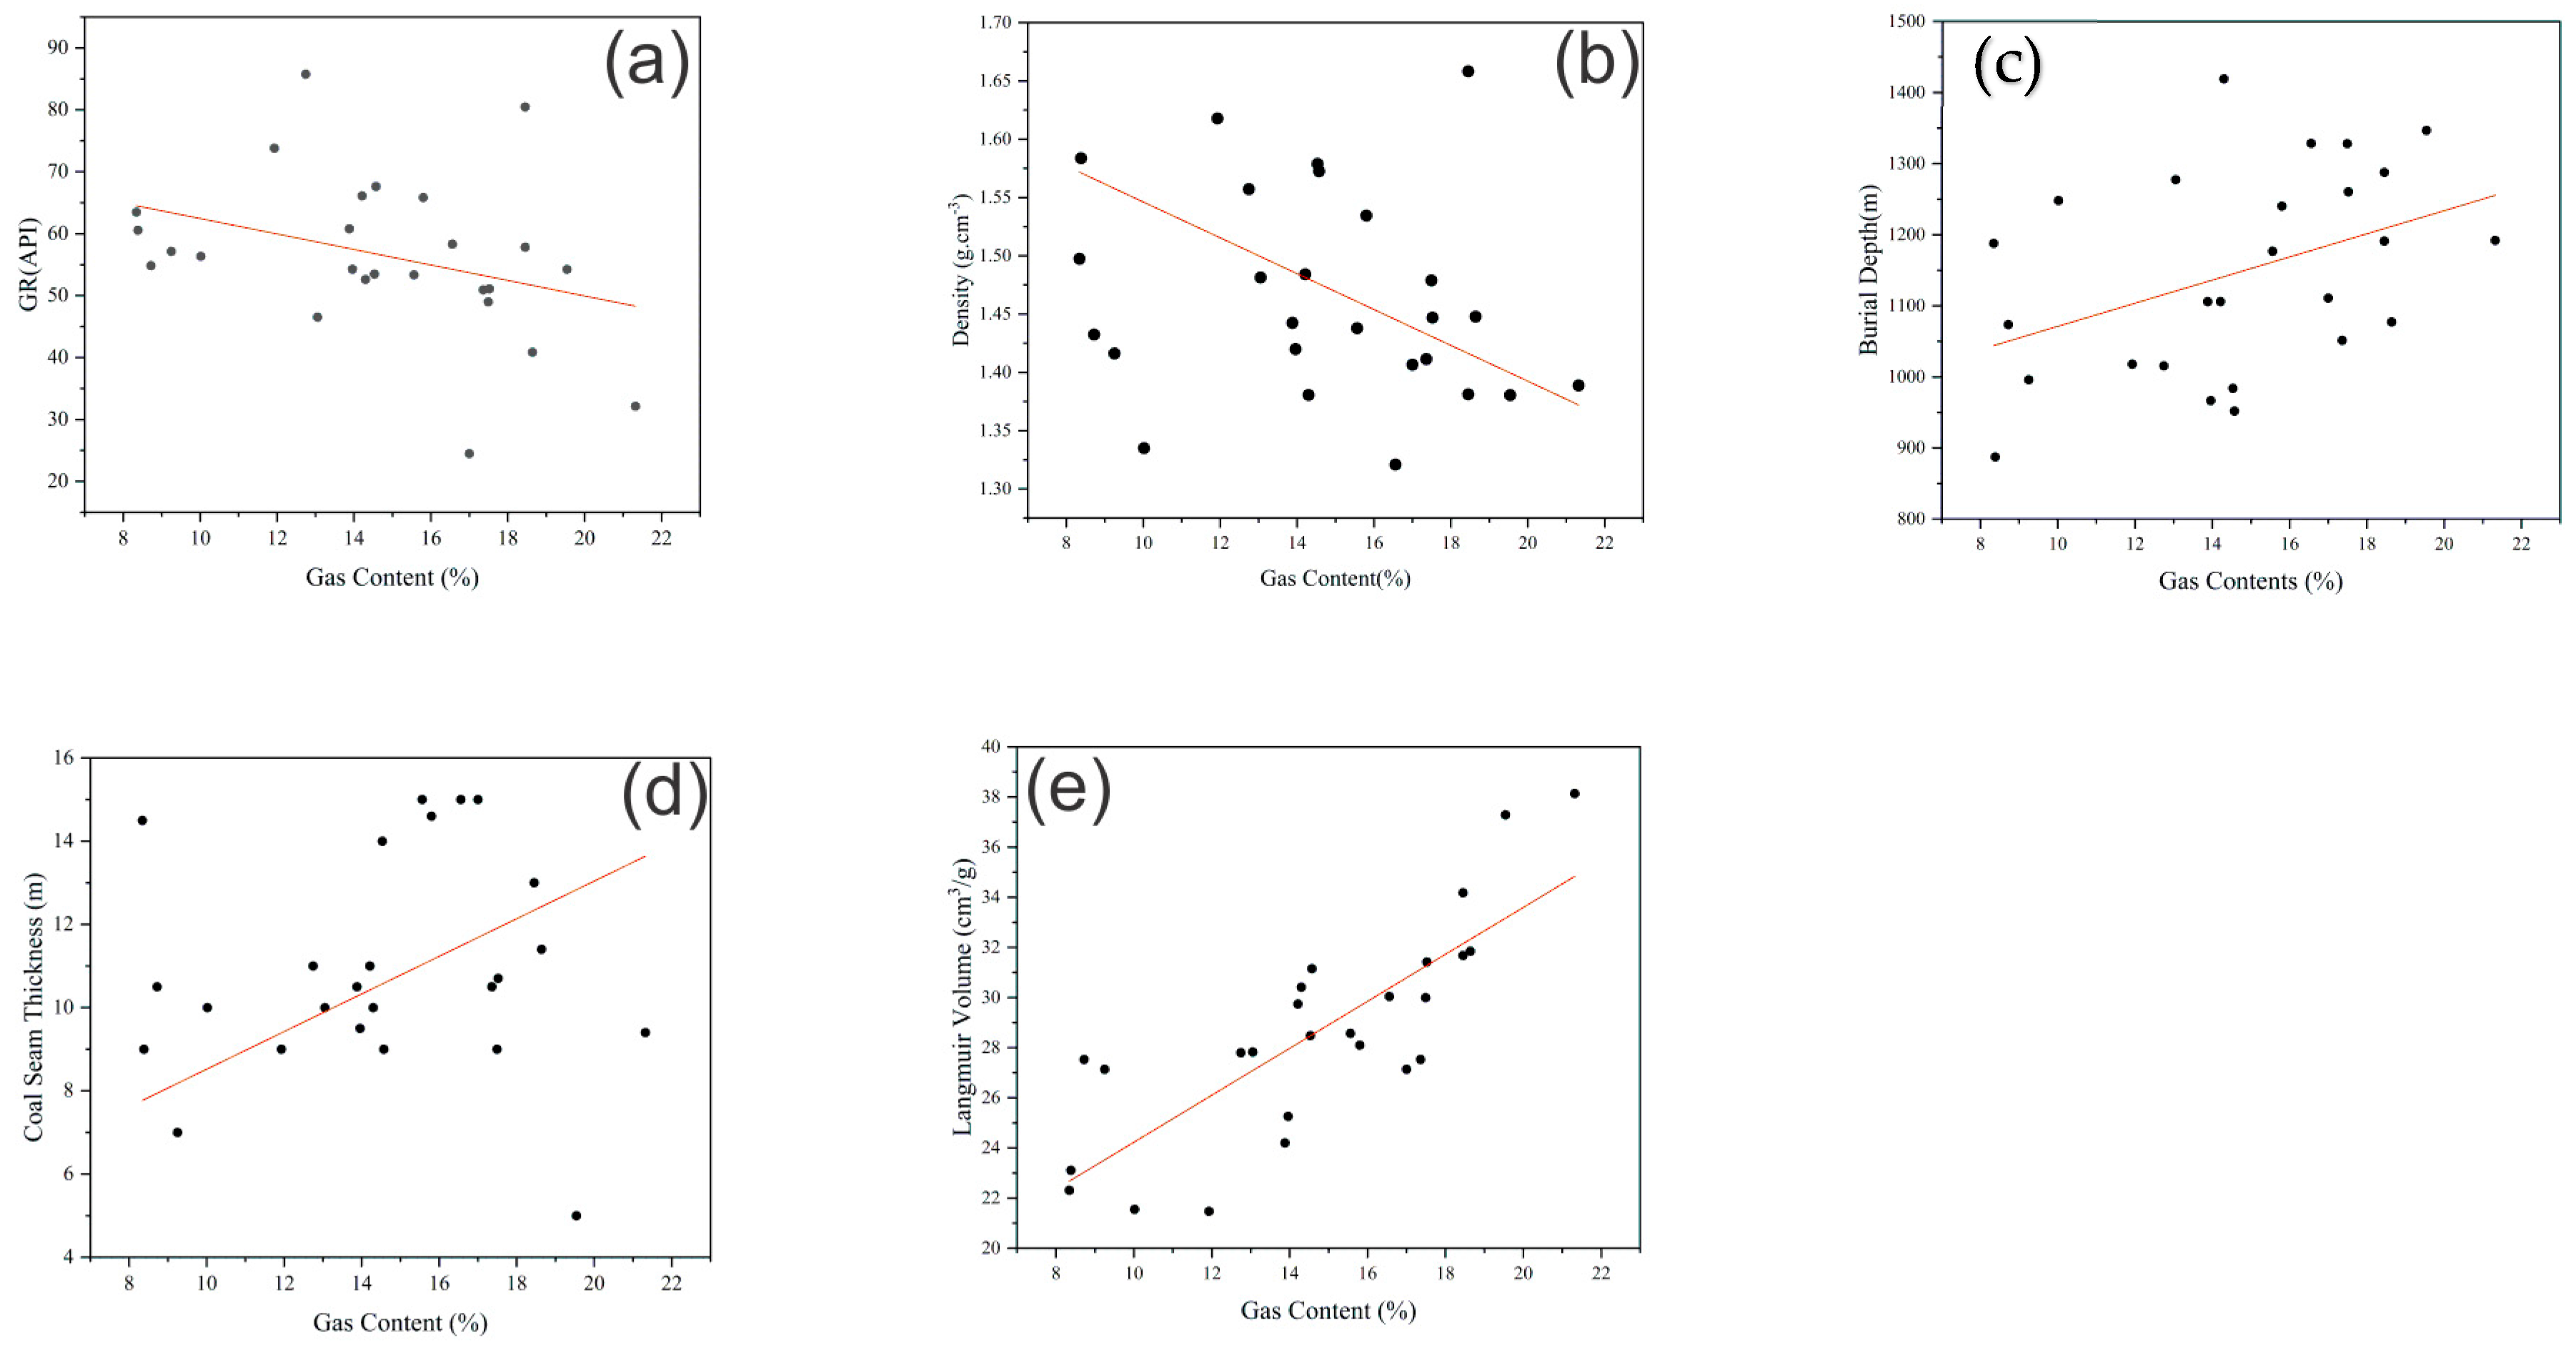
The scatter diagrams between gas content vs. effect factors, (a) burial depth, (b) coal seam thickness, (c) langmuir volume, (d) gamma ray and (e) density.
The roof of the No. 3# coal seam, with the presence of excessive mudstone and limestone in the roof of coal seam No.15#, is shown in Figure 5 and Figure 8, which provides laterally continuous, ductile layers that can accommodate strain without fracturing easily and maintain seal integrity. Our thinking about the sealing and trap mechanisms is reported in other basins, finding that a higher density in the rock overlying coal creates a stratigraphic trap for CBM as shown in Figure 11b [18,34]. In comparison, if the roof and floor contain extensive significant sandstone, they are more favorable for gas migration through the fracture network or more conductive layers, for the reason that sandstone is more brittle and permeable and not a good sealing cap rock for gas [15,35]. However, in the Mabi area, some of the wells showing sandstone in the roof of the coal seam are very low. The exploration for mapping the roof lithology, well logs, and seismic wave impedance for predicting gas content distribution found that continuous mudstone or limestone as a cap or sealing is more likely to retain a higher gas saturation than areas lacking this feature, as shown in Figure 5 and Figure 8. This finding is consistent with the findings by [15], who emphasized that the roof and floor lithology is a key factor for Coalbed Methane enrichment patterns.
5.2. Burial Depth and Pressure Regime
ThedDepth range of the Mabi Block is between (~700 and 1500 m). The depth influences the CBM content in multiple ways within coal ranks, from a higher volatile bituminous to a low anthracite range, which is enough to generate mature and thermogenic methane [33]. However, if the depth of the coal reservoir is shallow, the gas can escape due to reservoir pressure or temperature in the atmosphere, or can diffuse out over time, while, if the depth is too deep and the reservoir pressure is too high, it might keep gas adsorbed, but the low permeability can reduce production [36]. In our study, intermediate depth is good for gas preservation in this area. The highest gas content is between (1000 and 1350 m) in depth in coal seam No.3# and slightly deeper for coal seam No.15#; see Figure 7c,d. Meanwhile, toward the western side direction, the gas content is lower because of the shallower depth (~900 m); see Figure 7c,d. This is probable, as those coals were not under sufficient pressure to keep all the generated gas and may have some early degassing experienced through the connect cleat network [36,37]. On the other hand, the deepest depth in the southeast direction, approximately (~1400–1500 m), does not show a proportionally higher gas; it shows a moderate gas content. This can be due to the fact that deeper coals generate more gas; they also compact and lose porosity, and some gas may be displaced by water at higher pressure. Gas is lost if the microfracture, pores, faults, and folds exist, which can allow gas migration in the upward direction [15,33,38]. In the study area, the depth factors play a nuanced balance. The CBM needs to be tarped and generated in a deeper coal seam, but not deep enough to have compromised reservoir conditions [39]. In the above analysis, we correlate the gas content with the burial depth, which shows a positive correlation, showing that the burial depth increases the gas content, as shown in Figure 11c. Thus, most of the wells that are identified are in a favorable depth range in the Mabi Block for CBM enrichment.
5.3. Coal Seam Thickness
Coal seam thickness is one of the important factors for gas preservation. Our analysis confirms that the coal seam thickness correlates with the gas content, which is positive, as shown in Figure 11d, although it occurs together with other factors. The thicker the coal seams, the greater the gas storage capacity, the more the organic material absorption, and the greater the pore volume [40]. In the Mabi, the thickness of the No.3# coal seam is greater than 7 m near well MB104-112, and the No.15# coal seam thickness is greater than 6 m near well MB104–MB105, which indicates that the gas contents are higher; see Figure 9. The thicker the coal seam is, the higher its gas content. However, the coalbed thickness is not a precondition for a higher or lower gas content, as a coalbed thickness of one meter can result in higher CBM in the reservoir [31,41]. Furthermore, it must be noted that the thicker the coalbed is, the higher the gas content is, also paired with depth and sealing [38]. In Mabi, most of the coalbed has a thickness of (~4–8 m), which means that the thickness was not a limiting factor in most places, while some places (~2–3 m) are thin and give higher gas contents; see Figure 9. In those thin coalbed spots (an anticline crest), other issues like leakage were likely more dominant [41]. Nonetheless, the thickness of coal seam No.3# is increased (~9 m); the gas content will be high if the gas is saturated in the coal seam. A thicker coal seam might respond to higher desorption dynamics and tends to have a more massive cleat system [38]. In terms of the overall investigation and findings for CBM exploration principles, prioritize thicker coal seams, while ensuring that other factors such as structure, depth, and sealing conditions are comparable, as these variables are crucial for maximizing gas yield.
5.4. Ash and Adsorption Capacity
Coal quality, particularly ash content, plays a key role in the adsorption capacity. A strong negative relationship between the ash content, gas content, and Langmuir volume indicates that free space is available for CBM storage [33,42]. In Mabi, we calculate that the ash content is negatively correlated with gas, and the Langmuir volume is evidence for more gas-developed micropores in coal seams. Moreover, coal enriched in inertinite, which typically contains more ash, generally exhibits more sorption potential than vitrinite-rich coal. As a result, a lower ash content, higher vitrinite, and better cleat development can retain substantially more methane under the same pressure conditions [43].
In our study, the two wells near ~1000 m depth show contrasting gas contents due to the differences in coal purity, which display markedly different gas yields due to cleaner coal consistently containing more CBM. Although most of the coal in the Mabi Block has moderate ash values (~10 to 20%), a few samples indicate more than 25% ash and show a poorer gas performance; see Table 1. For better performance and development, prospectively, a higher-ash zone will be less productive and may need treatment with different methods and strategies. A weak negative correlation is observed between Coalbed Methane and the ash content, with a value of R2 = 0.4, as shown in Figure 6d, which describes a low proportion of variation in the gas content. However, the raising of the ash content corresponds to a greater proportion of inorganic minerals with a low methane adsorption capacity in comparison to organic matter. Moreover, the ash content separately does not completely control the occurrence of Coalbed Methane as suggested by the low R2 value, as shown in Figure 11e. Other geological characteristics, including reservoir factors, for example, reservoir pressure, moisture content, coal rank, burial depth and structural preservation, strongly influenced methane retention and enrichment [33]. As a result, the ash content only plays a secondary role to the controlled Coalbed Methane Content, and this cannot be used as a primary indicator of gas potentials.
5.5. Structural Control and Analysis of Differences
The structural setting of the Mabi Block exerts a strong influence on the gas content, which impacts control, sealing, and burial depth integrity. The syncline structure and structurally low or depressed areas emerge as sweet spots for CBM development in our analysis [44]. Some deeper areas are a local high-coal seam, which can confine the gas rise until it is trapped by a structure [45]. Moreover, for a thicker coal seam and syncline structure, calculated to compound their favorability in Mabi, our results show that higher gas content is near or in synclinal cores (e.g., MB104 and MB112 in coal seam No.3# and MB104, MB105, MB112), as shown in Figure 9. The identification of the syncline gas enrichment mechanism has been described for other parts of the Qinshui Basin [6,41,44]. Observe that a syncline is a trapping and preservation structure for CBM, while an anticline structure often suffers from gas leakage, which is not good for preservation over geological time without any sealing faults. The faults intersect the coal and, through volatile or gas escape, can occur in microfractures, resulting in bending stress at the anticline crest [46,47]. As a result, four anticlines, S1, S2, and S3, are parallel to ESE-trending anticlines in the north-central area. For S5 (anticline), parallel NNE-trending folds in the southeast lower the gas content, suggesting leakage from the fold crests. The higher curvature attributes reflect a tighter fold, which tends to promote feature generation and can facilitate escape unless an effective secondary seal is present [48,49]. In Mabi, block faults are generally moderate in scale and influence gas distribution. The area near the well MB087 NNE-trending fault commonly exhibits a reduced gas content; this indication implies that these faults have served as a partial leakage pathway or an enhanced permeability zone (possibly connected with hydrodynamic drainage). Some faults have closed to apertures, meaning not all faults are actively venting gas at present [50,51]. The overall perspective for the CBM wells is that those with higher gas will be a safe distance from major faults or anticlines. This structure is the main theme for CBM control globally, and this is clearly evident in the Mabi Block dataset.
6. Conclusions
Through the integrated analysis of core data, well logs, and 3D seismic attributes, this study concludes that:
Methane enrichment is maximized in areas combining optimal depth, strong sealing lithology, favorable structure, and high coal quality. Specifically, coal seams buried at moderate depths (~1.1–1.3 km) retain more gas than those that are significantly shallower or deeper, provided the overlying strata offer a competent seal (thick mudstone or limestone cap rocks). Structural synclines and gentle dips act as traps that preserve methane, whereas anticlines and faulted zones correspond to gas-depleted areas due to past leakage. Thicker coal seams (on the order of 6–9 m in this area) contribute to a greater gas storage capacity, and their occurrence in conjunction with synclinal lows is a fortunate interaction observed in the Mabi Block. Coal quality emerges as an important internal factor: low-ash, high-pore-volume coals have a higher gas content and adsorption potential, whereas higher ash levels diminish the gas storage capability.
The relationships quantified in this work—such as the negative correlation between ash content and gas content/adsorption capacity, and the positive correlation between strong seals (mudstone/limestone roofs) and gas preservation—underscore the interplay between lithological and structural controls on CBM.
To optimize future CBM exploration in the Mabi Block, priority should be given to structurally low, well-sealed, thick, high-quality coal zones—particularly along the SSW–ENE trend—where favorable burial, impermeable roof lithologies, minimal tectonic disturbance, limited hydrological drainage, and strong adsorption capacity combine to create the most reliable CBM sweet spots.
Author Contributions
This article is part of the Master’s thesis of the first author, A.J., who contributed to the original draft preparation, formal analysis, investigation, resources, and data curation. Project administration, conceptualization, and overall supervision were provided by D.L., with co-supervision(supervised the drawing of the figures in this work, including Figure 8, Figure 9 and Figure 10, as well as the internal review work before the work submitted to your journal) by Y.C. Methodology development and data validation were conducted by X.S., while software support was provided by F.S. Review, editing, and visualization were carried out by R.A., and final paper compilation and technical writing were completed by J.J.A. All authors have read and agreed to the published version of the manuscript.
Funding
This research was supported by the National Key R&D Program of China (2024YFC2909400), National Natural Science Foundation of China (42130806).
Data Availability Statement
The data will be available on special request from the corresponding author.
Acknowledgments
The authors sincerely thank their lab mate, Tang Liguang, for his valuable assistance with laboratory work. Special appreciation is extended to Yang Chao for his support in Chinese-language data translation and assistance with software installation. The authors also acknowledge Ma Tao for his guidance on various research guidelines and standard operating procedures (SOPs). Their support and cooperation greatly contributed to the successful completion of this study.
Conflicts of Interest
The authors declare no conflicts of interest.
Abbreviations
| CBM | Coalbed Methane |
| Ad | Ash content (%) |
| Mad | Moisture content (%) |
| Vdaf | Volatile content (%) |
| Fcd | Fixed carbon content (%) |
| VL | Langmuir volume (cm3/g) |
| PL | Langmuir pressure (MPa). |
| GR | Gamma ray log (API) |
| DEN | Density (g/cm3) |
| SP | Spontaneous potential log (mV) |
| RD | Resistivity log deep (Ω·m) |
| CNL | Compensated neutron log (%) |
| AC | Acoustic log (or sonic log) (µ/m) |
| Seismic wave impedance | |
| p | Density |
| Km | Kilometer |
| M | Meters |
References
- Goraya, N.S.; Rajpoot, N.; Marriyappan Sivagnanam, B. Coal Bed Methane Enhancement Techniques: A Review. ChemistrySelect 2019, 4, 3585–3601. [Google Scholar] [CrossRef] [Scilit]
- Altowilib, A.; AlSaihati, A.; Alhamood, H.; Alafnan, S.; Alarifi, S. Reserves Estimation for Coalbed Methane Reservoirs: A Review. Sustainability 2020, 12, 10621. [Google Scholar] [CrossRef] [Scilit]
- Mallick, N.; Prabu, V. Energy Analysis on Coalbed Methane (CBM) Coupled Power Systems. J. CO2 Util. 2017, 19, 16–27. [Google Scholar] [CrossRef] [Scilit]
- Tao, S.; Chen, S.; Pan, Z. Current Status, Challenges, and Policy Suggestions for Coalbed Methane Industry Development in China: A Review. Energy Sci. Eng. 2019, 7, 1059–1074. [Google Scholar] [CrossRef] [Scilit]
- Cai, Y.; Liu, D.; Yao, Y.; Li, J.; Qiu, Y. Geological Controls on Prediction of Coalbed Methane of No. 3 Coal Seam in Southern Qinshui Basin, North China. Int. J. Coal Geol. 2011, 88, 101–112. [Google Scholar] [CrossRef] [Scilit]
- Sun, X.; Wang, H.; Du, F.; Yao, Y.; Liu, D.; Liu, Z. CBM Enrichment Mechanisms in the Southern Qinshui Basin: A Synergistic Role of Tectonic-Lithological-Hydrodynamic Coupling. Int. J. Coal Geol. 2025, 309, 104861. [Google Scholar] [CrossRef] [Scilit]
- Liu, D.; Zhao, Z.; Cai, Y.; Sun, F. Characterizing Coal Gas Reservoirs: A Multiparametric Evaluation Based on Geological and Geophysical Methods. Gondwana Res. 2024, 133, 91–107. [Google Scholar] [CrossRef] [Scilit]
- Hao, J.; Zou, C.; Huang, Z.; Xiao, L.; Yang, Y.; Zhang, G.; Wang, W. Log Evaluation of a Coalbed Methane (CBM) Reservoir: A Case Study in the Southern Qinshui Basin, China. J. Geophys. Eng. 2014, 11, 015009. [Google Scholar] [CrossRef] [Scilit]
- Huang, H.; Li, R.; Jiang, Z.; Li, J.; Chen, L. Investigation of Variation in Shale Gas Adsorption Capacity with Burial Depth: Insights from the Adsorption Potential Theory. J. Nat. Gas Sci. Eng. 2020, 73, 103043. [Google Scholar] [CrossRef] [Scilit]
- Liu, D.; Jia, Q.; Cai, Y.; Gao, C.; Qiu, F.; Zhao, Z.; Chen, S. A New Insight into Coalbed Methane Occurrence and Accumulation in the Qinshui Basin, China. Gondwana Res. 2022, 111, 280–297. [Google Scholar] [CrossRef] [Scilit]
- Wang, Y.; Liu, D.; Cai, Y.; Yao, Y.; Pan, Z. Constraining Coalbed Methane Reservoir Petrophysical and Mechanical Properties through a New Coal Structure Index in the Southern Qinshui Basin, Northern China: Implications for Hydraulic Fracturing. Am. Assoc. Pet. Geol. Bull. 2020, 104, 1817–1842. [Google Scholar] [CrossRef] [Scilit]
- He, Y.; Huang, Q. Research on Roof Structure and Determination of Working Resistance of Shallow Buried Single Key Stratum Based on Grid Drillhole Field Method. Lithosphere 2022, 2021, 4328618. [Google Scholar] [CrossRef] [Scilit]
- Xu, L.; Ma, Y.; Elmo, D.; Ding, S.; Zhu, H.; Liu, H.; Li, W.; Chen, W. Parameters and Surrounding Rock Control of Gob-Side Driving under Double Key Stratum after Roof Cutting. Sci. Rep. 2024, 14, 5567. [Google Scholar] [CrossRef] [Scilit]
- Xie, H.; Li, C.; He, Z.; Li, C.; Lu, Y.; Zhang, R.; Gao, M.; Gao, F. Experimental Study on Rock Mechanical Behavior Retaining the in Situ Geological Conditions at Different Depths. Int. J. Rock Mech. Min. Sci. 2021, 138, 104548. [Google Scholar] [CrossRef] [Scilit]
- Zhang, Q.; Li, P.; Liu, D.; Yao, Y.; Cai, Y.; Guo, Y.; Wang, Z. Sealing Mechanisms and Enrichment Patterns of Deep Coalbed Methane: Insights from the Jiaxian Block, Ordos Basin. Sci. Rep. 2025, 15, 01345. [Google Scholar] [CrossRef] [Scilit] [PubMed]
- Jiang, L.; Song, Y.; Zhao, W.; Bo, D.; Liu, S.; Hao, J. Main Controlling Factor of Coalbed Methane Enrichment Area in Southern Qinshui Basin, China. J. Pet. Explor. Prod. Technol. 2024, 14, 165–173. [Google Scholar] [CrossRef] [Scilit]
- Zhang, X. Analysis of Carboniferous-Permian Coal-accumulating Environment and Coalbed Methane Enrichment in the Southern Qinshui Basin. Geol. J. 2024, 59, 3080–3091. [Google Scholar] [CrossRef] [Scilit]
- Zhao, Z.; Liu, D.; Wang, B.; Chen, M.; Sun, J.; Yu, L.; Cai, Y.; Zhang, X.; Wu, X.; Sun, F. Comprehensive Evaluation of In Situ Stress in the Daning–Jixian Area and Its Control on the Distribution of Coal-Measure Gas. Nat. Resour. Res. 2024, 33, 347–364. [Google Scholar] [CrossRef] [Scilit]
- Lin, Y.; Qin, Y.; Ma, D.; Duan, Z. Pore Structure, Adsorptivity and Influencing Factors of High-Volatile Bituminous Coal Rich in Inertinite. Fuel 2021, 293, 120418. [Google Scholar] [CrossRef] [Scilit]
- Sobih, N.S.; El Nagar, A.A.; Abbas, A.E.; Shehab, S. Integrating Petrophysical Characterization and Reservoir Evaluation of the Kafr ELSheikh Formation in Sapphire Field, Nile Delta, Egypt. Sci. Rep. 2025, 15, 88056. [Google Scholar] [CrossRef] [Scilit]
- Fang, H.; Sang, S.; Wang, J.; Liu, S.; Ju, W. Simulation of Paleotectonic Stress Fields and Distribution Prediction of Tectonic Fractures at the Hudi Coal Mine, Qinshui Basin. Acta Geol. Sin. Engl. Ed. 2017, 91, 2007–2023. [Google Scholar] [CrossRef] [Scilit]
- Wang, B.; Zhang, Q.; Qu, Z.; Zhang, Y. South Anze Structure and Its Control on Coalbed Methane Aggregation in the Qinshui Basin and the Mechanism of Syncline Gas Enrichment in the Qinshui Basin. Energies 2023, 16, 4521. [Google Scholar] [CrossRef] [Scilit]
- Liu, H.; Sang, S.; Wang, G.G.X.; Li, M.; Xu, H.; Liu, S.; Li, J.; Ren, B.; Zhao, Z.; Xie, Y. Block Scale Investigation on Gas Content of Coalbed Methane Reservoirs in Southern Qinshui Basin with Statistical Model and Visual Map. J. Pet. Sci. Eng. 2014, 114, 1–14. [Google Scholar] [CrossRef] [Scilit]
- Su, X.; Lin, X.; Zhao, M.; Song, Y.; Liu, S. The Upper Paleozoic Coalbed Methane System in the Qinshui Basin, China. Am. Assoc. Pet. Geol. Bull. 2005, 89, 81–100. [Google Scholar] [CrossRef] [Scilit]
- Zeng, L.; Zhang, Y.; Li, Y.; Wang, X.; Shi, J.; Dong, S. Coexistence of Coalbed Methane, Shale Gas, and Tight Sandstone Gas in Coal Measure Strata: A Case Study from the Southern Qinshui Basin, China. Am. Assoc. Pet. Geol. Bull. 2025, 109, 637–657. [Google Scholar] [CrossRef] [Scilit]
- Peng, C.; Zou, C.; Zhou, T.; Li, K.; Yang, Y.; Zhang, G.; Wang, W. Factors Affecting Coalbed Methane (CBM) Well Productivity in the Shizhuangnan Block of Southern Qinshui Basin, North China: Investigation by Geophysical Log, Experiment and Production Data. Fuel 2017, 191, 427–441. [Google Scholar] [CrossRef] [Scilit]
- Shao, L.Y.; Yang, Z.Y.; Shang, X.X.; Xiao, Z.H.; Wang, S.; Zhang, W.L.; Zheng, M.Q.; Lu, J. Lithofacies Palaeogeography of the Carboniferous and Permian in the Qinshui Basin, Shanxi Province, China. J. Palaeogeogr. 2015, 4, 384–412. [Google Scholar] [CrossRef] [Scilit]
- Su, X.; Lin, X.; Liu, S.; Zhao, M.; Song, Y. Geology of Coalbed Methane Reservoirs in the Southeast Qinshui Basin of China. Int. J. Coal Geol. 2005, 62, 197–210. [Google Scholar] [CrossRef] [Scilit]
- Hou, H.; Shao, L.; Wang, S.; Xiao, Z.; Wang, X.; Li, Z.; Mu, G. Influence of Depositional Environment on Coalbed Methane Accumulation in the Carboniferous-Permian Coal of the Qinshui Basin, Northern China. Front. Earth Sci. 2019, 13, 535–550. [Google Scholar] [CrossRef] [Scilit]
- Hou, Y.; Liu, D.; Zhao, F.; Zhong, L.; Emmanuel, N.N.; Zhang, Q. Geological Characteristics Affecting Coalbed Methane: A Case Study in the Anze Area, Southern Qinshui Basin. Nat. Resour. Res. 2022, 31, 1425–1442. [Google Scholar] [CrossRef] [Scilit]
- He, Y.L. Differences in the methane contents in the coalbed methane enrichment region of the southern Qinshui Basin, China. Appl. Ecol. Environ. Res. 2017, 15, 273–291. [Google Scholar] [CrossRef] [Scilit]
- AlNajdi, N.; Worden, R.H. Porosity in Mudstones and Its Effectiveness for Sealing Carbon Capture and Storage Sites. Geol. Soc. Lond. Spec. Publ. 2023, 528, 339–357. [Google Scholar] [CrossRef] [Scilit]
- Wei, Q.; Chen, S.; Yi, W.; Gui, H.; Jiang, W.; Li, F.; Li, S. Gas Content, Geochemical Characteristics and Implications of Coalbed Methane from the Deep Area of Qi’Nan Coalmine in Huaibei Coalfield. Sci. Rep. 2024, 14, 28334. [Google Scholar] [CrossRef] [Scilit] [PubMed]
- Chen, B.; Li, S.; Tang, D.; Pu, Y.; Zhong, G. Evaluation of Recoverable Potential of Deep Coalbed Methane in the Linxing Block, Eastern Margin of the Ordos Basin. Sci. Rep. 2024, 14, 9192. [Google Scholar] [CrossRef] [Scilit] [PubMed]
- Xie, W.; Gan, H.; Chen, C.; Vandeginste, V.; Chen, S.; Wang, M.; Wang, J.; Yu, Z. A Model for Superimposed Coalbed Methane, Shale Gas and Tight Sandstone Reservoirs, Taiyuan Formation, Yushe-Wuxiang Block, Eastern Qinshui Basin. Sci. Rep. 2022, 12, 11455. [Google Scholar] [CrossRef] [Scilit] [PubMed]
- Fan, Z.; Fan, G.; Zhang, D.; Luo, T.; Han, X.; Xu, G.; Tong, H. Mechanism of Burial Depth Effect on Recovery Under Different Coupling Models: Response and Simplification. Appl. Sci. 2025, 15, 11657. [Google Scholar] [CrossRef] [Scilit]
- Ma, L.; Yang, F.; Yang, J.; Cui, Y.; Wang, W.; Liu, C.; Zhang, B.; Yang, J.; Tao, S. Gas Content and Gas Occurrence Mechanism of Deep Coal Seams in the Shenfu-Linxing Block. Energies 2025, 18, 699. [Google Scholar] [CrossRef] [Scilit]
- Feng, C.; Li, X.; Yang, R.; Cai, J.; Sui, H.; Xie, H.; Wang, Z. The Geological Factors Affecting Gas Content and Permeability of Coal Seam and Reservoir Characteristics in Wenjiaba Block, Guizhou Province. Sci. Rep. 2023, 13, 18992. [Google Scholar] [CrossRef] [Scilit]
- Wei, Q.; Chen, S.; Gui, H.; Zhao, M.; Zhao, K.; Xia, H.; Wu, C. Geochemical Characteristics and Geological Significance of Coalbed Methane in Suzhou Mining Area of the Huaibei Coalfield. ACS Omega 2024, 9, 20086–20100. [Google Scholar] [CrossRef] [Scilit]
- Yuan, A.; Wang, R.; Yang, X.; Wang, P. Integrated Pore Structure Analysis and Methane Adsorption and Desorption Investigation in Deep Multi Seam Coal Systems. Sci. Rep. 2025, 15, 34102. [Google Scholar] [CrossRef] [Scilit]
- Guo, Z.; Cao, Y.; Zhang, Z.; Dong, S. Geological Controls on the Gas Content and Permeability of Coal Reservoirs in the Daning Block, Southern Qinshui Basin. ACS Omega 2022, 7, 17063–17074. [Google Scholar] [CrossRef] [Scilit]
- Luo, B.; Wang, H.; Sun, B.; Ouyang, Z.; Yang, M.; Wang, Y.; Zhou, X. Gas Content and Geological Control of Deep Jurassic Coalbed Methane in Baijiahai Uplift, Junggar Basin. Processes 2024, 12, 2671. [Google Scholar] [CrossRef] [Scilit]
- Crosdale, P.J.; Beamish, B.B.; Valix, M. Coalbed Methane Sorption Related to Coal Composition. Int. J. Coal Geol. 1998, 35, 147–158. [Google Scholar] [CrossRef] [Scilit]
- Xia, P. Geologic structural controls on coalbed methane content of the No. 8 coal seam, Gujiao area, Shanxi, China. Appl. Ecol. Environ. Res. 2017, 15, 51–68. [Google Scholar] [CrossRef] [Scilit]
- Chen, Y.; Tang, D.; Xu, H.; Li, Y.; Meng, Y. Structural Controls on Coalbed Methane Accumulation and High Production Models in the Eastern Margin of Ordos Basin, China. J. Nat. Gas Sci. Eng. 2015, 23, 524–537. [Google Scholar] [CrossRef] [Scilit]
- Cawood, A.J.; Watkins, H.; Bond, C.E.; Warren, M.J.; Cooper, M.A. Natural Fracture Patterns at Swift Reservoir Anticline, NW Montana: The Influence of Structural Position and Lithology from Multiple Observation Scales. Solid Earth 2023, 14, 1005–1030. [Google Scholar] [CrossRef] [Scilit]
- Carminati, E.; Scrocca, D.; Doglioni, C. Compaction-induced Stress Variations with Depth in an Active Anticline: Northern Apennines, Italy. J. Geophys. Res. Solid Earth 2010, 115, B02401. [Google Scholar] [CrossRef] [Scilit]
- Xie, Q.; Chen, J.; Zhao, C.; Li, Q.; Guan, S.; Wang, J. Application of Seismic Attribute Analysis Techniques to Multi-Scale Natural Fractures Description: A Case Study of the Longmaxi-Wufeng Formation in H Shale Gas Block, Yangtze Plate, China. Front. Earth Sci. 2024, 12, 1361706. [Google Scholar] [CrossRef] [Scilit]
- Li, L.; Huang, Y.; Qi, X. Recognition of Small Faults in Coal Fields Based on Multi-Scale Seismic Curvature Attributes Fusion. Heliyon 2023, 9, e22630. [Google Scholar] [CrossRef] [Scilit]
- Liu, D.; Yao, Y.; Wang, H. Structural Compartmentalization and Its Relationships with Gas Accumulation and Gas Production in the Zhengzhuang Field, Southern Qinshui Basin. Int. J. Coal Geol. 2022, 259, 104055. [Google Scholar] [CrossRef] [Scilit]
- Wang, H.; Yao, Y.; Liu, D.; Pan, Z.; Yang, Y.; Cai, Y. Fault-Sealing Capability and Its Impact on Coalbed Methane Distribution in the Zhengzhuang Field, Southern Qinshui Basin, North China. J. Nat. Gas Sci. Eng. 2016, 28, 613–625. [Google Scholar] [CrossRef] [Scilit]

Disclaimer/Publisher’s Note: The statements, opinions and data contained in all publications are solely those of the individual author(s) and contributor(s) and not of MDPI and/or the editor(s). MDPI and/or the editor(s) disclaim responsibility for any injury to people or property resulting from any ideas, methods, instructions or products referred to in the content. |
© 2026 by the authors. Licensee MDPI, Basel, Switzerland. This article is an open access article distributed under the terms and conditions of the Creative Commons Attribution (CC BY) license.