Article

Small-Scale Parabolic Trough–Concrete Thermal Energy Storage for Dispatchable Heat for Pharmaceutical Processes: A Makkah Case Study


by
Abdulmajeed S. Al-Ghamdi
1,* and
Ali Alaidaros
2,*
1
Department of Mechanical Engineering, College of Engineering and Architecture, Umm Al-Qura University, Mecca City 24381, Saudi Arabia
2
Mechanical Engineering Department, King Fahd University of Petroleum & Minerals (KFUPM), Dhahran 31261, Saudi Arabia
*
Authors to whom correspondence should be addressed.
Energies 2026, 19(5), 1211; https://doi.org/10.3390/en19051211
Submission received: 20 December 2025 / Revised: 20 February 2026 / Accepted: 25 February 2026 / Published: 27 February 2026

Abstract

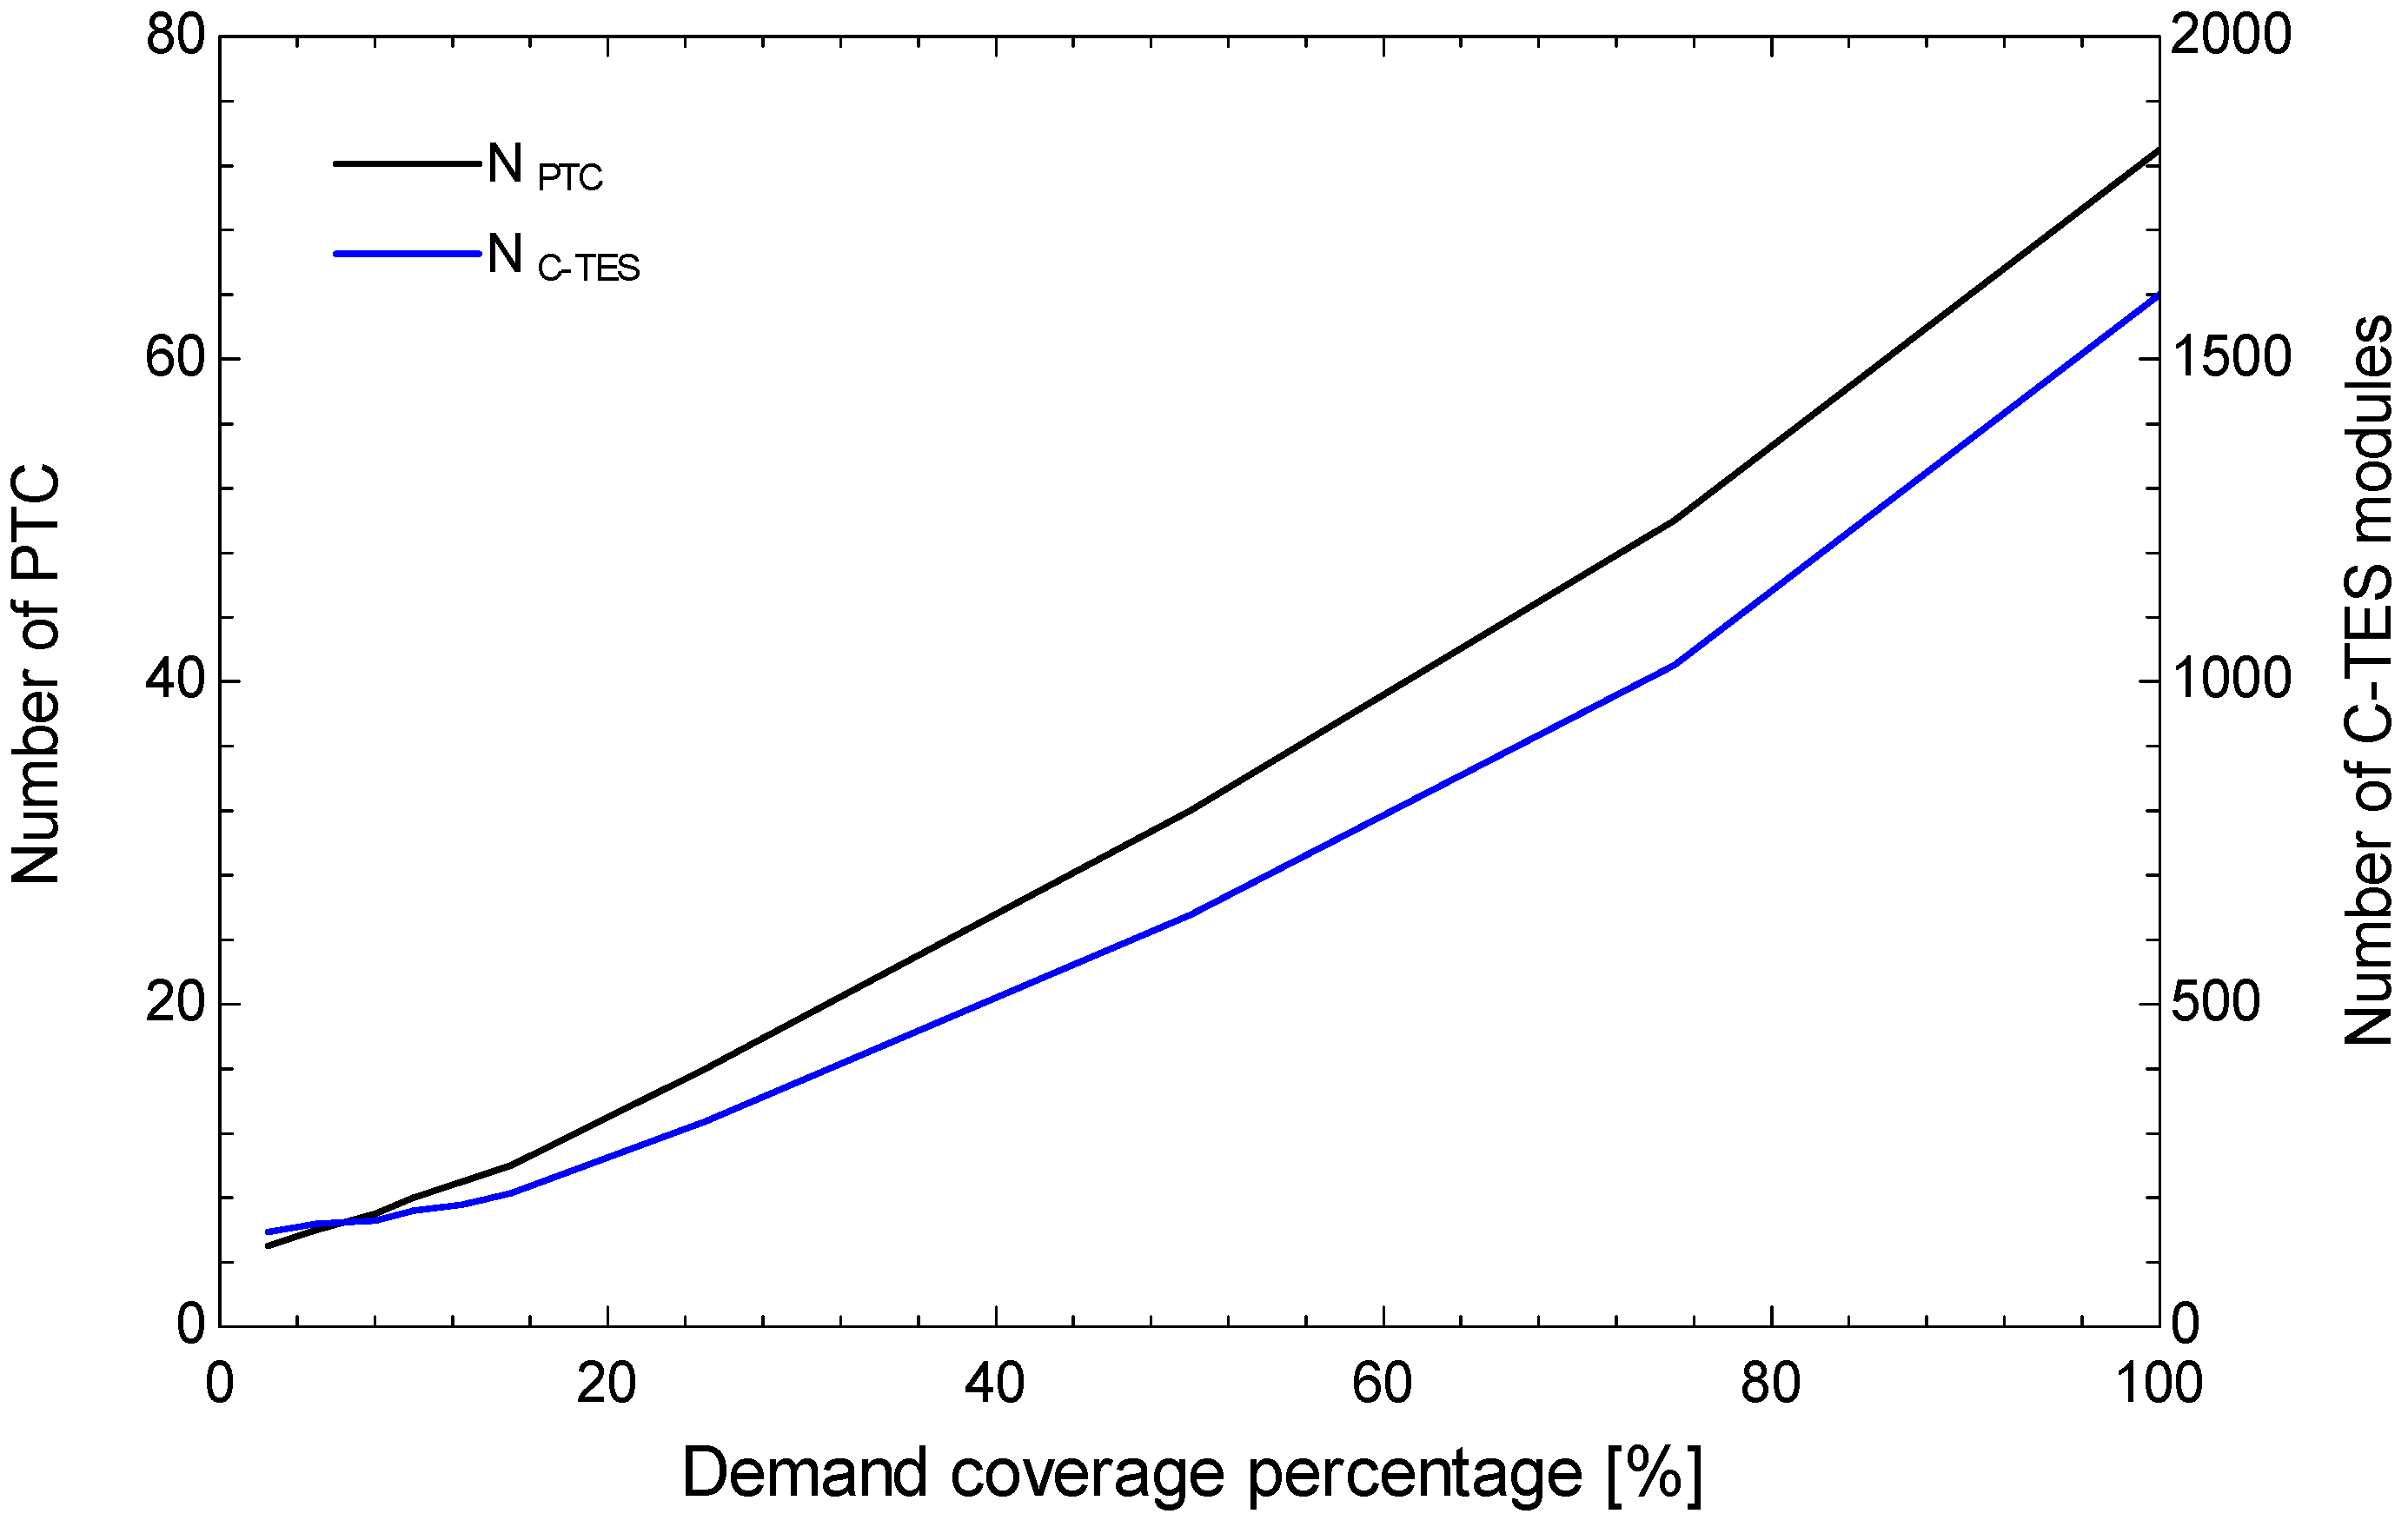
Pharmaceutical industries require a continuous heat supply to sustain around-the-clock operations such as sterilization. While fossil-fuel systems ensure reliability, they increase emissions and fuel dependence. Integrating a small-scale parabolic trough collector (PTC) with concrete thermal energy storage (C-TES) enables continuous and stable solar heat delivery, offering a flexible solution for pharmaceutical manufacturing. This study investigates the integration of PTC and C-TES to provide continuous heat supply using 12 representative days of the year based on weather data for Makkah City obtained from the Renewable Resource Atlas (RRA) developed by the King Abdullah City for Atomic and Renewable Energy (K.A.CARE). Model validation was performed using experimental PTC–C-TES charging data and a simplified C-TES module model. The results show that the C-TES system successfully maintained operating temperatures between 120 °C and 310 °C. Demand coverage was identified as a key design parameter. Full demand coverage requires approximately 73 PTC units and 1600 C-TES modules, representing increases of about 4.5 and 5 times compared with the 25% coverage case. Techno-economic analysis indicates that the levelized cost of heat (LCOH) reaches an optimum of approximately 89.7 USD/MWh at 25% coverage, while overall efficiency peaks at about 41%. The results indicate that a moderate solar contribution of around 25% provides the optimal balance between cost and operational flexibility.

1. Introduction

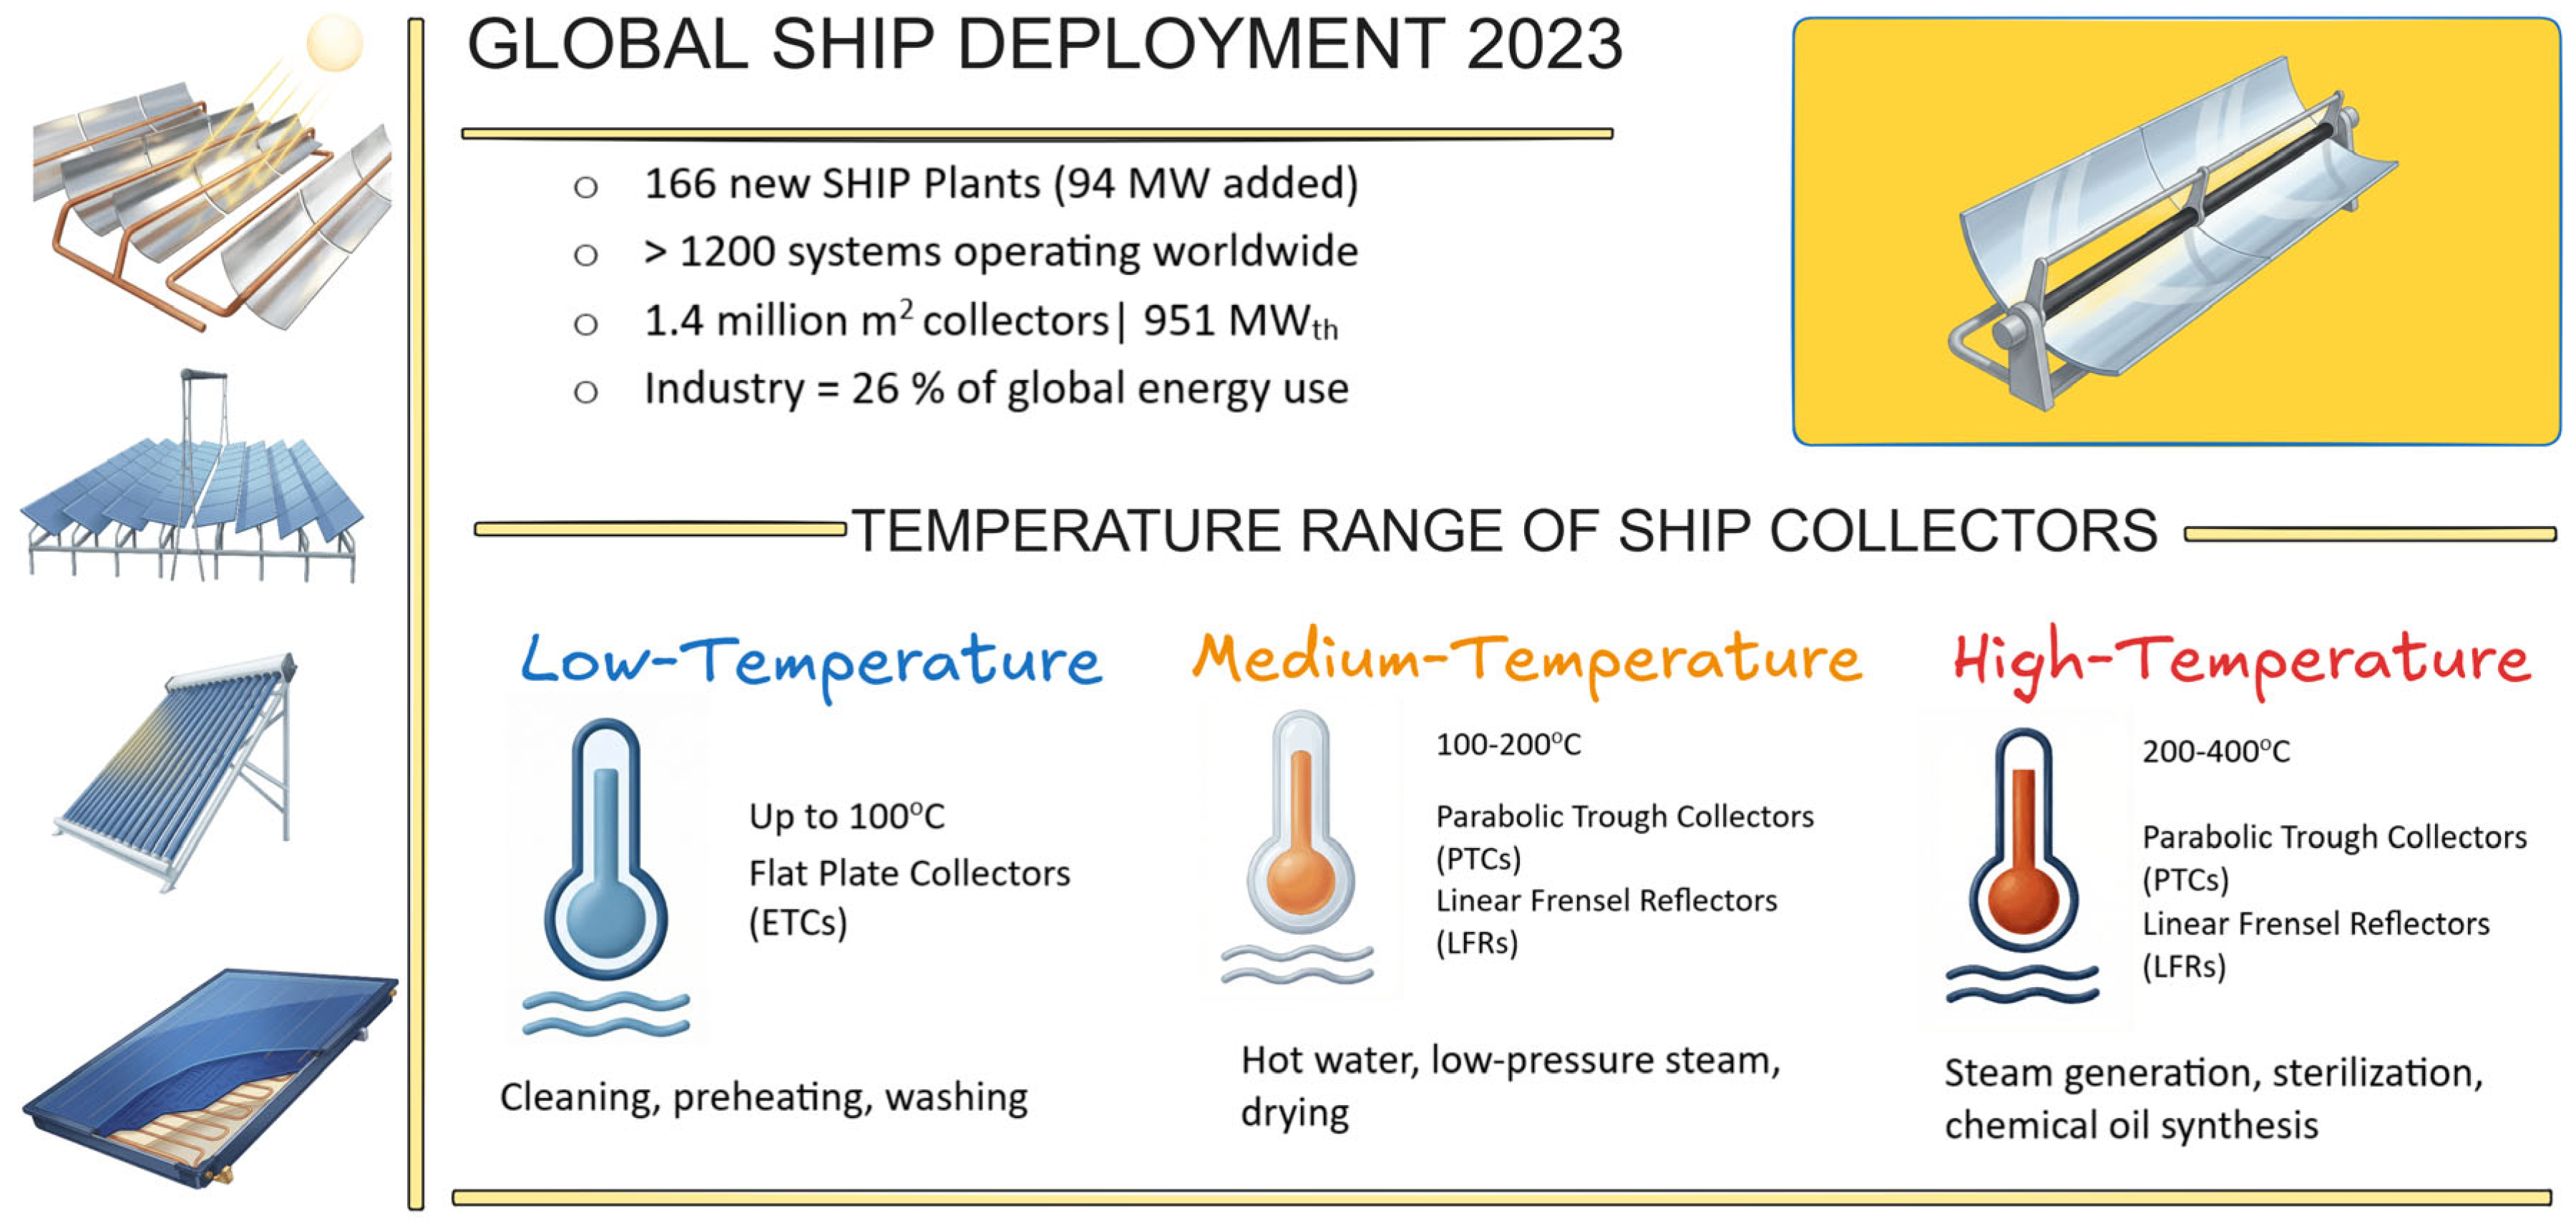
1.1. Solar Heat for Industrial Processes (SHIP) Outlook

According to Solar Heat Worldwide 2024 [1], Solar Heat for Industrial Processes (SHIP) is emerging as a promising decarbonization solution for the industrial energy demand (Figure 1). The industrial sector consumes approximately 26 % of global final energy, yet in 2022, only 13 % of that demand was met by renewable sources [1]. In 2023, 116 new SHIP plants totaling 94   M W t h were constructed, three times the capacity added in 2022, bringing the global stock to over 1200 systems with 1.4   million   m 2 of collectors and a 951   M W t h thermal capacity [1]. A key trend is the shift toward concentrating collectors, especially parabolic trough collectors (PTCs), which now dominate large SHIP systems because they can reliably deliver 200–400 °C heat for steam generation, thermal-oil loops, sterilization, and high-temperature process operations [1]. The main share of energy consumption in this sector is used for heating and cooling production at temperatures up to 400 °C, and fossil fuels supply almost all its requirements. SHIP is a simple, easy-to-integrate system that requires a diversification of the supply chain to ensure energy security and reliability for companies and communities over the next decades [2]. Industrial process heat is typically classified as low (<100 °C), medium (100–400 °C), or high (>400 °C) [3].

1.2. Parabolic Trough Collectors (PTCs) for Industrial Heat

1.2.1. Technological Maturity, Deployment, and Performance

PTCs are consistently identified as the most mature and commercially established Concentrated Solar Power (CSP) technology, accounting for the majority of global CSP deployment due to their high reliability and advanced technological readiness level [4]. They are already deployed across multiple industrial sectors, including the food and beverage, dairy, textiles, chemicals, and mining sectors, where medium- to high-temperature steam and thermal energy are required [4]. According to Ferruzzi et al. [5], the SolarPACES database documents 129 CSP projects worldwide, with parabolic troughs dominating 73.9%, followed by power towers (22.5%), linear Fresnel (3.6%), and parabolic dish systems (0.04%), confirming that PTCs benefit from extensive global operating experience, robust supply chains, and a comparatively lower technological risk. This dominant market share reinforces their position as the leading SHIP technology in high-DNI regions.
PTCs deliver high thermal efficiency across a broad operating range of 50–400 °C, with particularly strong performance in the 150–400 °C range, making them highly suitable for industrial applications such as steam generation, thermal oil heating, and high-grade SHIP [6,7,8]. A significant advantage of PTCs is their superior land-use performance, requiring only 8000–9000 m2 per MW, which is substantially lower than the ~11,000 m2 per MW typically required for linear Fresnel systems and comparable to optimized power tower layouts [4]. The techno-economic assessment by Saini et al. [9] further demonstrated that hybrid systems integrating PTC + TES-water outperform PV + TES-sand + boiler configurations in terms of land use and levelized cost of heat (LCOH), reflecting the inherently higher solar-to-thermal conversion efficiency of PTCs. Consequently, PTC-based SHIP systems are particularly advantageous for industrial facilities with limited land availability.

1.2.2. PTC Designs and Types for Industrial Applications

In early attempts to design PTCs for industrial heat processing, Kalogirou [10,11,12] suggested that PTCs designed for industrial process heat applications typically operate in the 50–250 °C range and require efficient single-axis tracking, high-reflectivity mirrors, and a selectively coated absorber tube enclosed within an evacuated glass envelope to minimize thermal losses. Their design incorporates key parameters, including the rim angle, aperture width, tracking orientation, receiver geometry, and optimal flow rate, all of which influence thermal efficiency and storage behavior for hot-water and steam-based industrial processes [10,11]. The receiver model developed by Kalogirou [12], consisting of a selectively coated absorber housed within an evacuated glass envelope, showed excellent agreement with Sandia experimental data, achieving thermal efficiencies of approximately 58% at 200 °C and accurately predicting heat losses under both vacuum and air-filled annulus conditions. Case studies further indicate that properly sized PTC systems can supply up to 50% of the annual industrial heat demand, with optimal configurations employing E–W tracking, a collector field of roughly 300 m2, and a storage volume of approximately 25 m3 for representative industrial heat process (IHP) loads [11].
Indeed, according to the review by Fernández-García et al. [13], PTC technology has progressed from early commercial models, such as the Acurex, Solar Kinetics, and M.A.N. collectors, to the widely deployed Luz LS series capable of operating up to 390 °C. Their review highlights that IHP is a major application area for PTCs, particularly in food, textile, chemical, and pharmaceutical industries operating within the 100–250 °C temperature range. They also note that the Middle East possesses excellent CSP potential, with DNI values often exceeding 2400 kWh/m2·year, making PTC deployment especially suitable for this region [13].

1.2.3. Large-Scale PTC Installations

Large-scale parabolic trough collector (PTC) systems have been widely deployed for industrial steam generation. A 22,583 m2 PTC field integrated with pressurized water, a PV boiler, and sand storage demonstrated cost competitiveness for the food and beverage sector [9]. In Salt Lake City, a 15,744 m2 solar field supplied 5 MWth of steam at 120–250 °C, reducing CO2 emissions by 3.5 tons of CO2 annually [14]. Similarly, a EuroTrough (ET-150) system with a 10,800 m2 field was modeled for Kenya’s tea industry, achieving significant biomass substitution and 9817 tons of CO2 annual reduction [15].
Industrial applications also include a 696 m2 LAT-73 PTC system in a Chile juice production manufacturer for feedwater preheating (20–90 °C), generating 241 MWhth annually, although seasonal demand limitations reduced the solar fraction [16]. In Egypt, the El-Nasr pharmaceutical plant operates a 1958 m2 PTC field delivering steam at 175 °C and covering ~10% of demand, demonstrating scalable integration despite using older non-evacuated receiver technology [17].
Utility-scale applications further illustrate the capability of large-aperture troughs, such as the 26,930 m2 Aalborg CSP AAL-Trough™ 4.0 system delivering 16.6 MWth at 312–340 °C for district heating and ORC power generation [18]. Overall, large-aperture systems enable high-capacity output, while modular industrial PTCs provide flexibility for SHIP applications in space-constrained facilities.

1.2.4. Small-Scale and Modular PTC Systems

A variety of small- and medium-sized PTCs have been developed for industrial process heat, ranging from commercial units such as Absolicon’s T10/MT10, SolarXEnergy’s SolarX-164, and Soltigua’s PTM series to prototype designs like the PTC-1000 and AEE-INTEC concepts [19]. Several of these collectors incorporate flat glass aperture covers to improve durability, ease of cleaning, and optical stability in industrial environments, while compact apertures less than 3 m allow for installation in space-constrained settings such as factory roofs. Together, these emerging and commercialized PTC technologies demonstrate growing readiness for supplying medium-temperature industrial heat (120–250 °C) using modular and cost-effective systems [19]. Unlike flat-plate collectors, which become inefficient at temperatures above 100 °C, or utility-scale CSP plants that demand vast tracts of land and extensive infrastructure, small-scale PTCs can efficiently achieve the target temperatures required for industrial processes while maintaining a compact footprint [19].
Growing commercial interest in small PTCs highlights the need for standardized testing and certification, as these compact units are increasingly deployed to meet industrial heat demands in space-constrained environments [20]. Demonstrating this potential, the CAPSOL prototypes [20] tested at the Plataforma Solar de Almería (PSA), with aperture areas of ~2 m2 and measured thermal efficiencies between 0.45 and 0.65, confirmed the suitability of small PTCs for delivering medium-temperature heat (100–250 °C) under real outdoor operating conditions.
In Cyprus, a pilot beverage facility installed an industrial CF100 parabolic trough collector (PTC) system that was designed and manufactured by Protarget AG (Cologne, Germany); it consists of eight collectors (aperture of 3 m, total field length of 96 m, total aperture of 288 m2) coupled with two modular concrete thermal storage units (600 kWh) to supply saturated steam for cleaning, pasteurization, and sterilization processes [21,22,23,24]. Each collector is equipped with a CF115 evacuated receiver featuring a selectively coated steel absorber tube enclosed within a glass envelope and a vacuum annulus to minimize thermal losses, while HELISOL® XA (from Wacker Chemie AG, Munich, Germany)silicone-based thermal oil is used as the heat transfer fluid, allowing operation at temperatures of up to 350–425 °C [21,22]. The system can operate at a nominal HTF outlet temperature of 350 °C and, depending on the production schedule, delivers between 5% and 25% of the factory’s total steam demand [21]. Experimental measurements showed that the system can produce up to 940 L of steam per day with an average collector efficiency of 39–44%, while the concrete thermal energy storage (C-TES) enables early-morning steam production before sunrise and compensates for cloud transients [22]. The dynamic simulation, validated against field data, confirmed excellent agreement with measured temperatures and energy flows, with a Percentage Relative Error (PRE) below 6.5%, demonstrating reliable dispatchability and strong potential for scaling to larger industrial loads [21,23].
In the Mexican food industry, chicken and shrimp food solar systems were proposed to fulfill the factories’ demand using a PTC with 1.1 m aperture and efficiency of 60% to prevent the emissions of 1084 tons of CO2 per year [25].

1.2.5. Promising Commercial Small-Scale PTCs

One of the most promising commercial small-aperture PTCs is the Absolicon T160, which operates in the 40–160 °C range and provides a bankable, standardized, and high-performance solution for SHIP. The Absolicon T160 is a certified glass-covered small PTC with an optical efficiency exceeding 76% that is capable of supplying steam at pressures up to 8 bar, and is widely deployed across the pharmaceutical, food, and beverage industries for processes such as CIP, washing, drying, sterilization, cooking, and hot water preheating [26,27]. A notable implementation is the pharmaceutical case in Gujarat, India, where a 4114 m2 T160 solar field combined with 200 m3 of thermal storage generated 4.8 GWhth year−1, meeting a substantial share of the facility’s thermal demand [28]. Importantly, Saini et al. [9] demonstrated that PTC + TES(water) systems outperform PV + TES(sand) + boiler configurations in both land-use efficiency and LCOH, delivering significantly more useful thermal energy per unit area. These findings confirm that modern PTC technologies such as the T160 offer compelling techno-economic advantages over PV-based or fully electric alternatives, particularly for industries requiring continuous medium-temperature process heat.

1.2.6. Integration and Operation Strategies in SHIP

The integration and flow of system operation strategies strongly influence SHIP performance. A review by Tasmin et al. [29] provides a detailed assessment of integration strategies for Solar SHIP, including integration points, collector types, thermal capacity, and storage configurations across multiple case studies. Sectoral analysis shows that in the food, beverage, and agriculture industries, SHIP is predominantly integrated at the supply level (51%), with 27.3% implemented at the process level, reflecting how system layout, temperature needs, and operational constraints shape integration choices. In addition to the integration point, the operation and control strategy plays a critical role in SHIP performance, as the coordination of solar field operation, TES charging/discharging, and steam generation modes determines the stability, continuity, and dispatchability of thermal output. The Cyprus case studies [23] demonstrate that well-designed control sequences, such as early morning preheating, DNI-triggered tracking, and dynamic switching between C-TES and the solar field, enable reliable and dispatchable steam delivery under real industrial operating conditions.
SHIP technologies—ranging from large-scale CSP-type troughs to compact, modular small PTCs—now offer feasible, cost-competitive solutions across diverse industrial sectors. Their performance depends not only on the collector type but also on the integration configuration and dynamic operation strategies. These insights provide a technical foundation for the next Section 1.3, which examines thermal energy storage (TES) and PTC–TES modeling approaches that are essential for delivering fully dispatchable industrial heat.

1.3. Thermal Energy Storage (TES)

TES plays a crucial role in enabling the flexible and continuous operation of solar thermal systems by decoupling the temporal mismatch between solar energy availability and industrial heat demand. This function is particularly critical for SHIP, where uninterrupted and reliable thermal energy supply is required. Based on the storage mechanism, TES technologies are commonly classified into three main categories: sensible heat storage (SHS), latent heat storage (LHS), and thermochemical storage (TCS). Sensible heat storage relies on the temperature variation in solid or liquid media; latent heat storage exploits phase change materials (PCMs); and thermochemical storage is based on reversible chemical reactions with a high theoretical energy density but comparatively low technological maturity. Among these options, sensible thermal energy storage is the most mature, reliable, and economically viable solution for industrial applications and is therefore widely adopted in SHIP systems integrated with concentrating solar collectors [30,31].
C-TES is classified under sensible heat storage and has garnered increasing attention due to its low cost, global availability, mechanical robustness, and long service life. Concrete-based TES systems offer a practical solution for modular and small-to-medium scale solar industrial heat applications, where simplicity, durability, and scalability are essential design requirements [30,31,32,33].
Extensive studies show that C-TES exhibits several advantages under various operating conditions. Concrete is inexpensive and widely available, with abundant raw materials, making its large-scale implementation economically attractive and resulting in significantly lower material costs per unit of stored energy than conventional storage media such as molten salts [34,35]. In addition, concrete possesses good mechanical strength and structural stability, allowing it to maintain integrity during operation and often eliminating the need for an additional containment structure. This durability enables long operational lifetimes and provides design flexibility in the form of modular blocks, cylinders, or packed-bed configurations [33]. Using the PRISMA 2020 framework [36], a review synthesized the recent progress in thermal energy storage for renewable energy, covering advances in PCMs, sensible thermal storage, and hybrid TES concepts. It emphasizes that hybrid sensible–latent storage—often enabled by improved PCM encapsulation—can boost overall efficiency and enhance system stability.
Regarding thermal durability, specially designed concrete formulations, including calcium–aluminate and geopolymer-based concretes, have demonstrated stable performance under repeated heating and cooling cycles, with a reported operational capability approaching 500 °C for high-temperature sensible TES applications [34,37].

1.3.1. High-Temperature Concrete Thermal Energy Storage (>400 °C)

High-temperature concrete thermal energy storage (C-TES) has been mainly investigated for CSP and advanced solar–industrial applications operating above 400 °C. Studies show that specially formulated concretes, such as calcium–aluminate and geopolymer types, can reliably operate within 400–600 °C, offering a lower-cost alternative to molten salt systems [32,34,37]. Recent reviews indicate that mid-temperature solid media systems are approaching commercial readiness, while higher-temperature concepts (>750 °C) still face challenges related to material durability, thermal cracking, and long-term reliability [38,39,40].
Operation at elevated temperatures introduces thermo-mechanical degradation and reduced heat transfer performance due to thermal cycling [34,39]. Modular block configurations have been proposed to improve structural flexibility and scalability [39]. However, despite technical feasibility above 400 °C, high-temperature C-TES remains less mature than low- and mid-temperature systems, which are currently more suitable for SHIP applications [40].
Sensible TES is often preferred for high-temperature applications due to material availability, safety, and lower capital cost, with applicability up to ~1000 °C [41]. In contrast, PCM-based latent systems offer higher energy density but are limited by low thermal conductivity, leakage, flammability, and corrosion concerns [41].

1.3.2. Low- and Medium-Temperature SHIP Projects

Experimental demonstrations and validated simulations confirm the technical and economic feasibility of integrating PTCs with C-TES for low- and medium-temperature SHIP [21,22,23,24]. A representative benchmark is the KEAN food and beverage industry pilot in Cyprus, where a PTC field coupled with modular concrete sensible storage enabled a dispatchable heat supply and effective decoupling of solar availability from industrial demand. Dynamic simulation studies [24], which were validated using operational data from the installed system, demonstrated that C-TES significantly enhances solar utilization and system reliability, with reported payback periods of approximately 2–6 years, depending on the system scale, storage capacity, and load characteristics.
Complementary evidence is provided by pharmaceutical SHIP applications discussed in the literature [42], which predominantly target low- and medium-temperature heat demands (≈60–120 °C) for processes such as drying, sterilization, distillation, granulation, and hot water generation. These studies show that non-concentrating collectors (flat-plate and evacuated tube collectors) combined with sensible hot water storage are effective for hot water production and boiler feedwater preheating, whereas concentrating systems (PTCs or linear Fresnel collectors) are required when direct steam generation or higher operating temperatures are needed [42]. Notably, the RAM Pharma (Jordan) linear Fresnel–DSG system demonstrates 100% instantaneous solar coverage during sunny daytime operation, achieving complete boiler displacement.
A synthesis of these findings is presented in Table 1, which summarizes selected SHIP installations and simulation studies, highlighting the storage configuration, solar technology, solar coverage, and operational strategy. Together, the KEAN C-TES benchmark and pharmaceutical SHIP cases illustrate the scalability and cross-sector applicability of storage-assisted SHIP concepts, supporting the extension of PTC–concrete TES configurations for low- and medium-temperature industrial heat supply.

1.3.3. Modeling and Simulation of Concrete Thermal Energy Storage (C-TES)

Modeling and simulation are essential tools for the design, optimization, and predictions of the performance of C-TES, enabling the efficient exploration of system operation performance (transient charging/discharging), which will significantly reduce experimental effort [53,54,55,56]. Early modeling work largely relied on high-precision finite-element modeling, which can resolve complex geometries and transient conduction/convection within concrete modules and embedded heat exchanger tubes [53,54]. For example, Panneer Selvam and Castro [53] developed a 3-D FEM model for concrete storage heated by an embedded pipe network (up to ~390 °C) and used it for parametric studies, including features of increased heat transfer such as different configurations of fins. Ferone et al. [54] further described detailed FEM-based transient models of sensible heat TES with innovative concretes, explicitly accounting for the real element geometry and storage cycling, and showing the strong dependence of performance on the thermophysical properties.
Concrete TES modeling has also been supported by experimental validation and coupled thermo-mechanical considerations. Giannuzzi et al. [55] combined an experimental campaign with numerical analyses (FEM code via CAST3M) for instrumented concrete storage modules (SolTeCa1), which is located at an experimental plant at ENEA Casaccia, highlighting the role of validated numerical tools for interpreting the measured temperature evolution and identifying possible pipe–concrete interface effects during cycling. At higher temperatures, Vigneshwaran et al. [56] developed and experimentally validated a concrete-based TES module operating up to ~500 °C using air as the HTF; they confirmed that a 3-D numerical model captures the spatial temperature evolution and that simplified 1-D dynamic approaches can provide fast predictions with quantified deviation (±4.9 °C) from the experimental results. Insights from the 3- and 1-D models are captured by performing a parametric study. Since the C-TES is modular in nature, the 1-D dynamic model is useful for estimating and monitoring real-time system performance [56]. Likewise, Singh and Sørensen [57] presented a 3-D Multiphysics numerical model (finite element method (FEM) software COMSOLv.5.2a, Multiphysics, 2017) for concrete TES in the 350–390 °C range for steam-generating applications, including energy/exergy performance and the influence of finned tubes on charging/discharging behaviors. An analysis of the C-TES model [57] suggested that the optimization of design parameters can reduce the investment cost for a real-time large operation system.
While FEM/CFD-type models are highly accurate, they are often computationally intensive and configuration-specific, limiting rapid design-space exploration and whole-plant SHIP simulations [58]. Suárez et al. [58] reviewed the development of C-TES from laboratory-scale experiments to the first commercial application at the 15 MW TeraSolar CSP plant in Zhangbei, China. Their review highlights extensive use of 1-D, 2-D, and 3-D modeling approaches employing modeling languages and FEM/CFD tools to analyze C-TES thermal behavior and operating conditions; however, only limited studies address the system-level integration of C-TES within CSP plants. To address this, Doretti et al. [59] developed a simplified lumped-capacitance-based analytical code validated against ENEA experiments for two different concrete mixtures during both heating and cooling, enabling fast transient simulation and easy integration into models of the CSP/SHIP system. Suárez et al. [58] similarly proposed a simplified model for concrete passive sensible TES, achieving mean temperature errors less than ~2% relative to experimental benchmarks while retaining a compact formulation suitable for pre-design and modular simulation environments. Importantly, for modular system design, Doretti et al. [60] extended their validated approach to study the effect of the module arrangement by analyzing series, parallel, and mixed (series × parallel) configurations under adiabatic and diabatic boundary conditions; they showed that the optimal arrangements depend on the operating constraints, such as the mass flow rate and pressure drop, and they identified configurations that reach asymptotic performance with fewer elements. The model showed good agreement with experimental tests whether during charging or discharging. Then, the investigation was expanded to find the most performance configuration where each of the 44 elements was linked in series with two parallel arrays [60].
Finally, broader solid-media TES studies provide transferable modeling insights for sensible storage systems. For example, Soprani et al. [61] experimentally tested a horizontal high-temperature rock-bed storage system and highlighted the importance of the flow distribution, buoyancy effects, and thermal stratification—issues that are also relevant to the practical design and validation of solid sensible TES concepts, including concrete systems. At the low-temperature end, Ndiaye et al. [62] demonstrated experimentally supported modeling and prototype optimization of cementitious storage concepts for building-scale applications, reinforcing the value of validation-driven reduced-order approaches in storage design and performance assessment.
Overall, the evidence in [53,54,55,56,57] supports using high-precision FEM models for detailed design validation and a spatial temperature analysis, while Doretti-type lumped and hybrid reduced-order models provide a practical and reliable framework for system-level modeling, optimization, and integration of C-TES into SHIP simulations, especially when multiple module arrangements must be evaluated efficiently [58,59,60].

1.3.4. Economic Performance of SHIP Systems: Impact of TES on LCOH

From an economic perspective, the LCOH is a key metric for evaluating the performance of Solar Heat for Industrial Processes (SHIP). Systems without thermal energy storage (TES) generally exhibit a lower initial investment and can achieve competitive LCOH when solar heat is directly utilized; however, their limited dispatchability restricts the achievable solar fraction and necessitates a reliance on backup fuels during non-solar periods, thereby limiting renewable energy penetration [9]. For example, stand-alone PTC systems implemented for direct-use applications in Seville, Spain, report LCOH values ranging from approximately 50 to 130 EUR/MWh, with the lowest values achieved for smaller collector fields (below ~15,000 m2) where all generated heat is directly consumed and no significant storage is required [9].
Similarly, hybrid solar–biomass configurations without TES applied to industrial process heat demonstrate LCOH values on the order of ~20 USD/MWhth, confirming the cost advantage of direct-use solar heat in suitable operating regimes [15]. In contrast, SHIP systems integrated with TES typically involve higher upfront capital costs but deliver improved long-term economic performance by enabling greater dispatchability and higher solar utilization. A techno-economic analysis of a 5 MWth PTC system with 6 h of TES in Salt Lake City reported an LCOH of approximately 26.3 USD/MWhth, which could be reduced to ~18.5 USD/MWhth with favorable reductions in the total installed cost [14].
Concrete-based TES concepts further increase economic viability due to their low material cost, durability, and scalability. In particular, dual-media thermocline (DMT) systems employing concrete as a solid filler have demonstrated storage-specific costs as low as ~9–15 USD/kWhth, representing cost reductions of up to ~60% compared with conventional two-tank molten salt systems, while also offering lower environmental impacts [63].

2. SIHP—Potential in Saudi Arabia and Pharmaceutical Case Study

In Saudi Arabia, renewable energy efforts have primarily focused on electricity generation (PV and wind), while industrial heat has received comparatively less attention. However, decarbonizing industrial thermal demand is essential to achieving Vision 2030 goals related to sustainability and energy security [64]. According to King Abdullah City for Atomic and Renewable Energy (K.A.CARE), the Saudi SHIP market has strong growth potential if integration barriers and limited industrial awareness are addressed [65]. As reported in [66], Saudi Arabia had 7007 industrial facilities in 2025, distributed across major MODON-managed industrial cities. Major manufacturing sectors—including chemicals, building materials, food, and machinery—have substantial low- and medium-temperature process heat demands, making them strong candidates for Solar Heat for Industrial Processes (SHIP) integration. Recent developments indicate growing momentum in solar industrial heat.
The Ma’aden Solar I project integrates 1500 MWth of parabolic trough collectors (PTCs) with thermal energy storage to provide dispatchable steam and reduce approximately 600,000 tons per year annually [67]. In parallel, domestic PTC manufacturing is being established to support future SHIP deployment [68].
The pharmaceutical sector represents a particularly relevant SIHP case due to its high utility demand and heat-intensive processes. According to the Energy Star Guide for Energy Management [69], HVAC systems, ventilation, and thermal utilities (chilled water, hot water, and steam) account for approximately 65% of total facility energy consumption. Energy Star data also indicate that HVAC/ventilation and clean-room systems dominate pharmaceutical energy use, especially in fill/finish plants [70]. Heat-intensive processes such as sterilization, drying, and fermentation require temperatures up to ~180 °C, making them suitable targets for dispatchable solar thermal integration [71].
Saudi Arabia’s pharmaceutical includes more than 40 licensed manufacturers but still meets only 22–25% of national demand, indicating continued growth and energy transition opportunities [72,73]. The sector currently relies primarily on fossil-fuel-based utilities, creating strong opportunities for decarbonization aligned with Vision 2030 [64]. Consistent with scalable industrial decarbonization pathways [74], this study evaluates the process-level performance of a PTC–C-TES system under representative operating conditions, with future work extending to full 8760-h simulations for a Riyadh-based facility.

3. Objectives and Case Study Definition

Based on the reviewed literature, there remains a need for practical, dispatchable, and industry-ready solar thermal solutions capable of supplying continuous process heat to the pharmaceutical sector under real operating conditions. To address this gap, the present study proposes a small-scale PTC system coupled with C-TES to meet the process heat requirements of pharmaceutical production in Makkah City. The key contributions of this study are as follows:
  • An integrated small-scale PTC–C-TES system is proposed and assessed using twelve monthly representative (characteristic) days to represent seasonal variability, an accepted method for estimating typical/average performance, rather than certifying extreme or rare-year operation or worst-case sizing.
  • A simplified C-TES model based on Doretti et al. [59,60] is combined with a PTC system, enabling reduced computational effort and flexibility to be integrated with other renewable technologies and industrial demands.
  • Demand sustainability is introduced as a system design criterion through fixed demand coverage during both daytime and nighttime operation.
  • Techno-economic analysis is conducted to evaluate the levelized cost of heat (LCOH) and to identify the optimal combination of PTC field size and C-TES capacity across demand coverage levels up to 100%.
The site was selected in the western province of Saudi Arabia, where several photovoltaic (PV) pilot and commercial projects have been previously installed, indicating favorable solar conditions and existing renewable energy infrastructure. In addition, the region benefits from the availability of a solar resource monitoring station operated by K.A.CARE, which provides high-quality, long-term solar irradiance measurements.
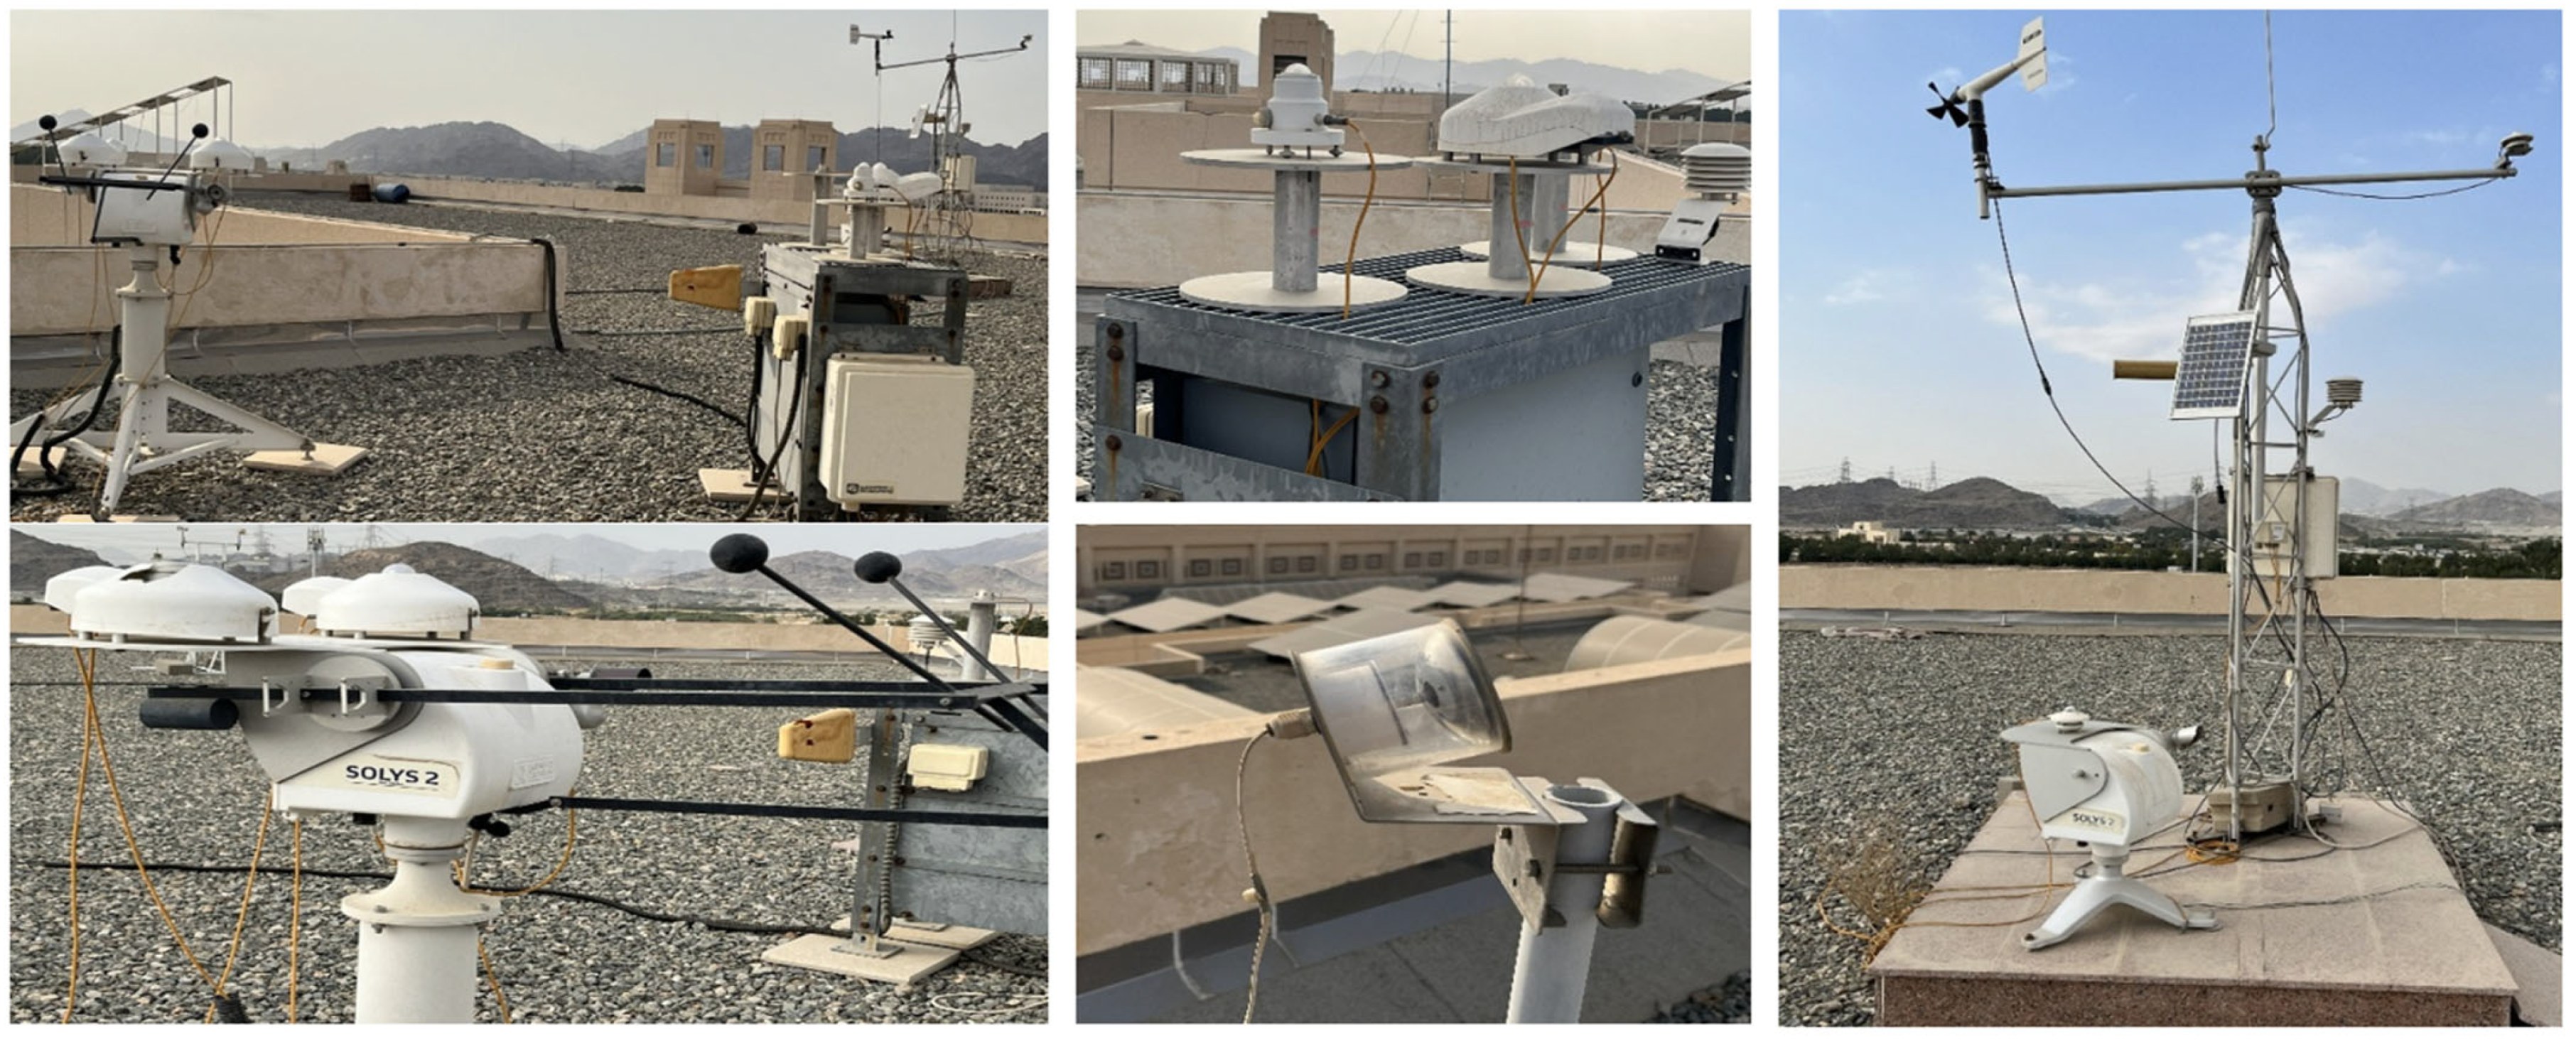
For the present study, solar and meteorological data were obtained from measured records of the solar monitoring station at Umm Al-Qura University (UQU), Makkah (latitude 21.331° N, longitude 39.949° E), as shown in Figure 2. The measured datasets were validated against the authors’ solar radiation model to ensure input consistency for the simulations. To reduce the computational weight while preserving seasonal variability, the simulations were carried out using 12 representative (characteristic) days (one per month). The measured DNI and ambient temperature were processed on a daily basis: for each month, (i) days with complete records were screened, (ii) the daily DNI total and daily mean ambient temperature was calculated, and (iii) the representative day was selected as the day that best matches the monthly mean conditions (i.e., closest daily DNI total and comparable daily mean ambient temperature). The selected dates were then used consistently in all simulations and figures. This work represents an initial step toward a decision-support framework that offers high-quality, high-resolution solar–meteorological inputs while balancing the added measurement effort and simulation weight associated with detailed performance assessment [75].
To preserve seasonal variability in a manageable manner, the annual meteorological behavior is represented using twelve monthly representative (characteristic) days (one day per month). This approach is commonly used for annual/seasonal-average performance estimation and for comparing design trends across scenarios. In this work, the characteristic-day methodology was intentionally adopted to evaluate process-level dispatchable heat performance under representative operating conditions, capturing short-term thermodynamic behavior, charging–discharging dynamics, and dispatch feasibility rather than annual energy yield, lifetime degradation, long-term storage endurance, or worst-case oversizing optimization. Therefore, it is not intended to guarantee full-year continuous heat supply under rare/extreme events or to determine final oversizing margins for multi-day low-DNI periods; these require an 8760-h (hourly), and ideally multi-year, simulation and/or explicit inclusion of extreme periods.
As a next step, an 8760-h (hourly) simulation will be conducted for a Saudi pharmaceutical new-build scenario in the Riyadh region (e.g., Sudair Industrial and Business City) considering a hybrid configuration in which a natural-gas boiler ensures operational continuity while a solar PTC/LFR field and C-TES provide a dispatchable share of medium-temperature process heat. The full-year model will quantify seasonal carryover in storage, reliability metrics (e.g., hours of unmet thermal demand), and worst-case oversizing requirements under low-DNI multi-day sequences using representative operating schedules and extreme-period selection.

4. System Description

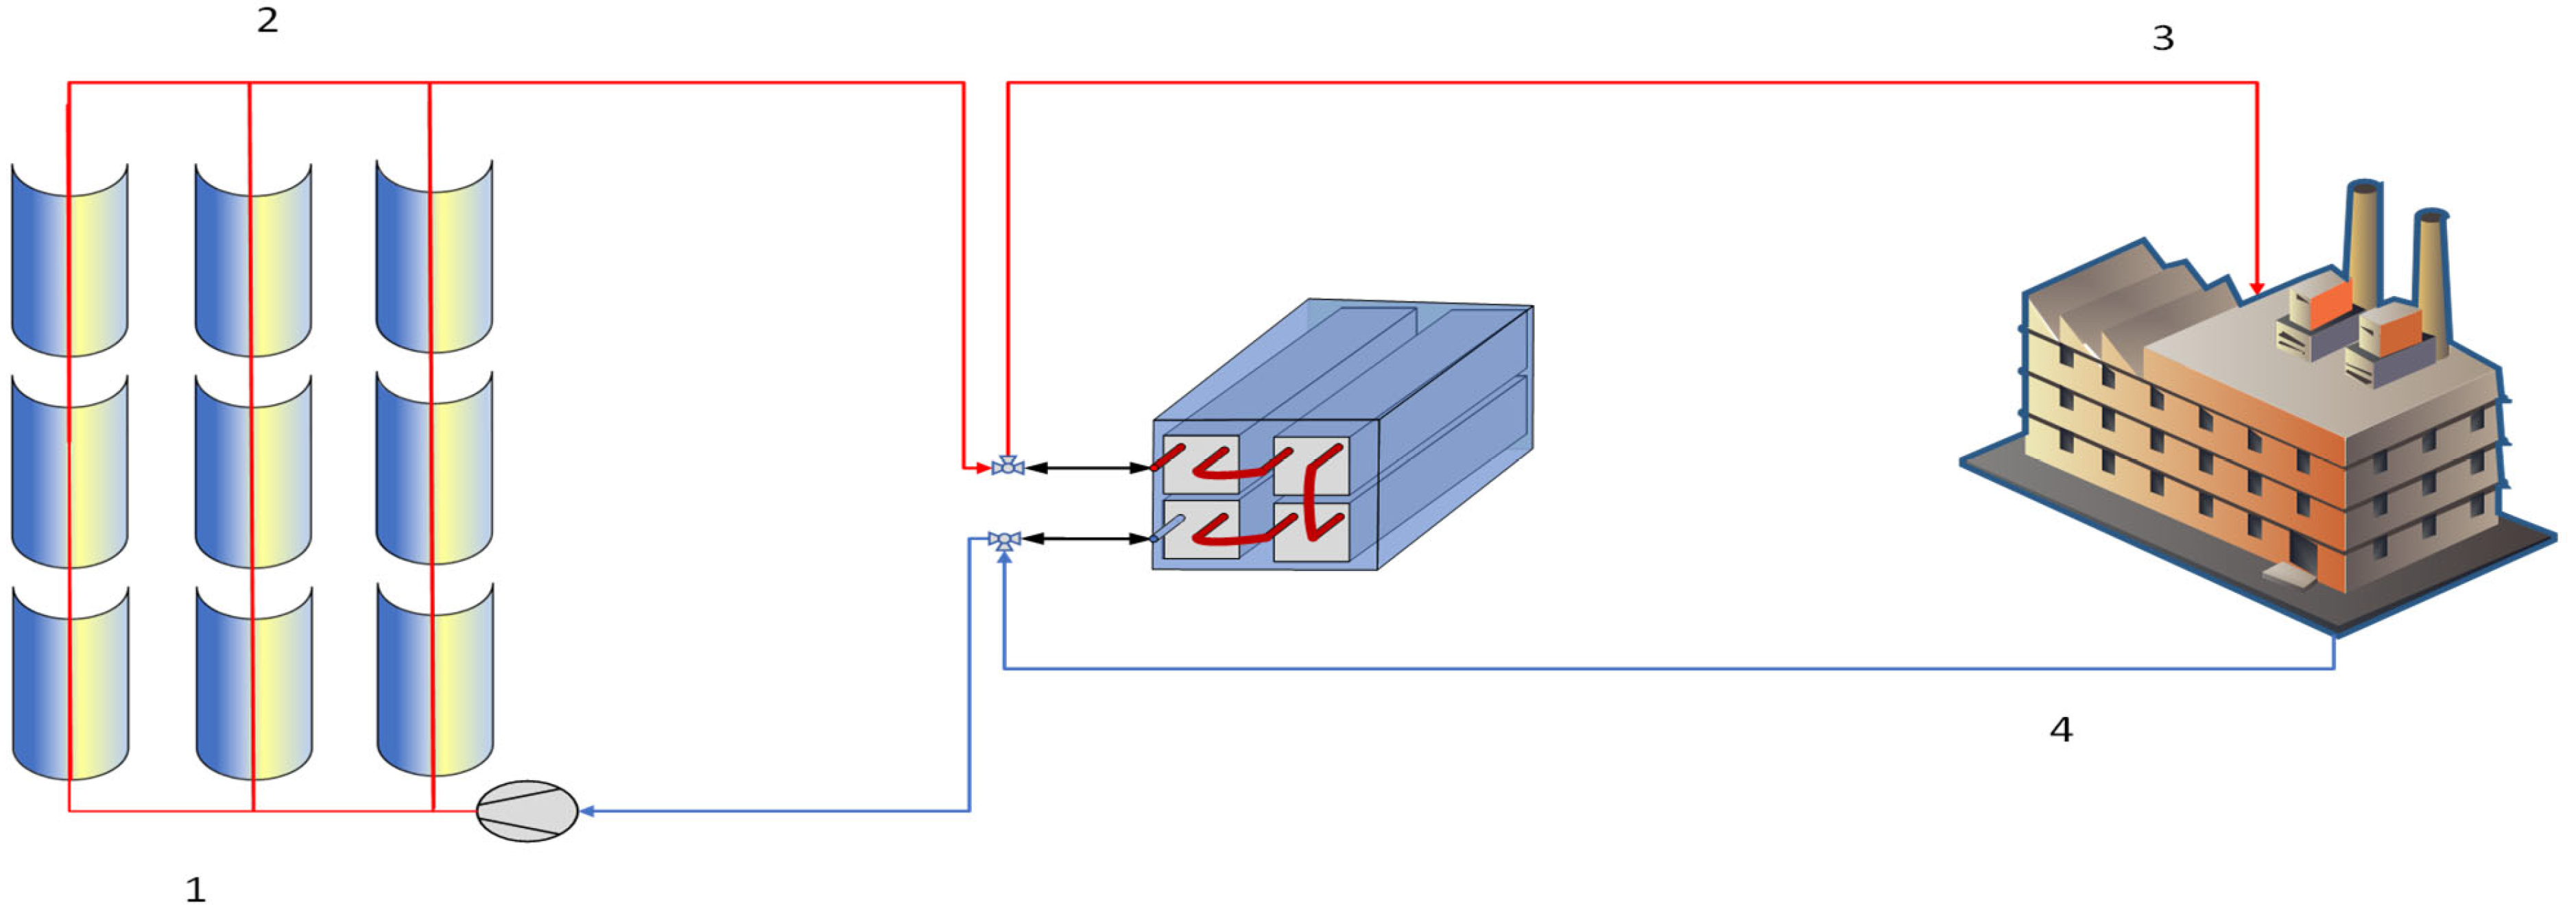
The proposed system is designed to supply continuous high-temperature heat for industrial applications by integrating a PTC field with C-TES module. The schematic configuration of the integrated system is shown in Figure 3. The system operates in a closed-loop arrangement, where the heat transfer fluid (HTF), Therminol VP-1, entering at point 1 and is then circulated through the PTC field to absorb solar energy and exits at point 2. It is subsequently transferred to the C-TES unit. In order to maintain the PTC outlet temperature at fixed design point, the mass flow rate of the HTF is controlled based on solar radiation. Depending on the operational requirement, the thermal energy stored in the C-TES can be dispatched directly to the industrial process load or recirculated to maintain system temperature stability, which is represented by points 3 and 4.
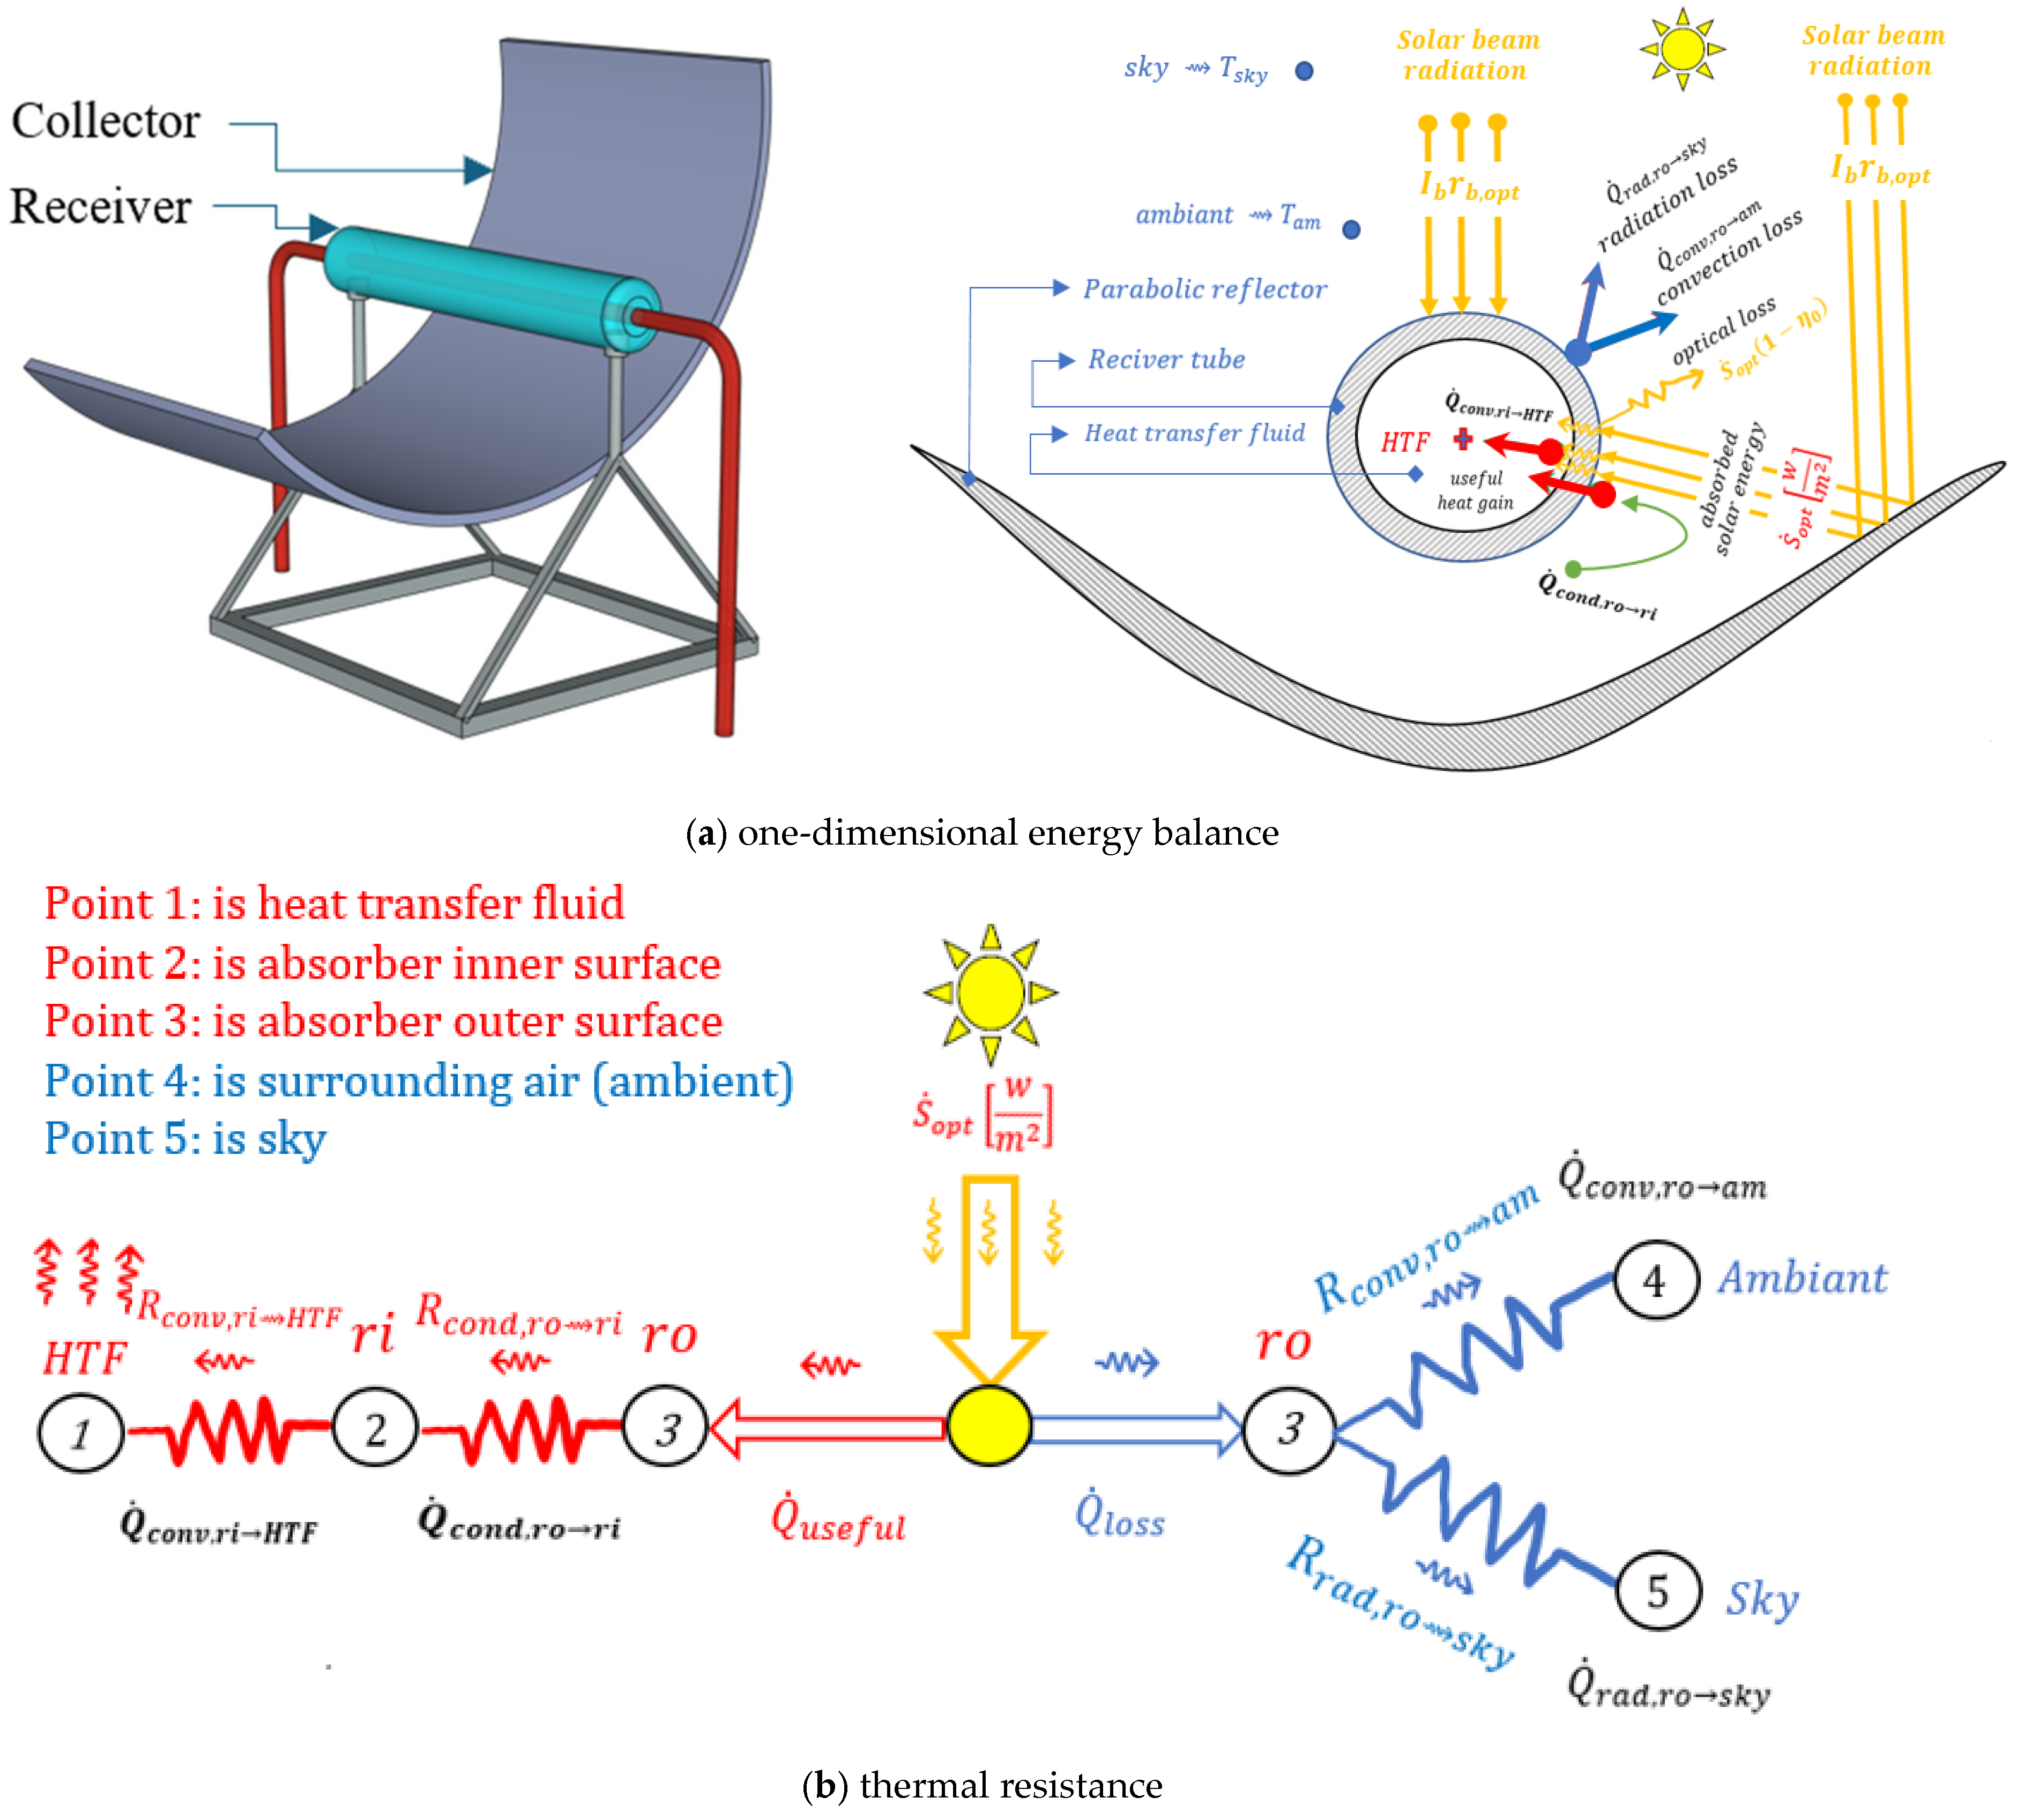
The physical and dimensional properties of the main system components are summarized in Table 2. The PTC field employs the CF100 collector model (Figure 4), which features an aperture width of 3.0 m and a length of 12.0 m per unit, with a total field aperture area of 288 m2 [21,22,23,24]. Each collector uses a CF115 receiver tube with a vacuum annulus between the steel absorber and the glass envelope to minimize convective and conductive losses. The optical and thermal properties of both the collector and receiver are optimized for medium-to-high-temperature operation, with a reflectivity of 0.94 and an absorber absorptance of 0.95.
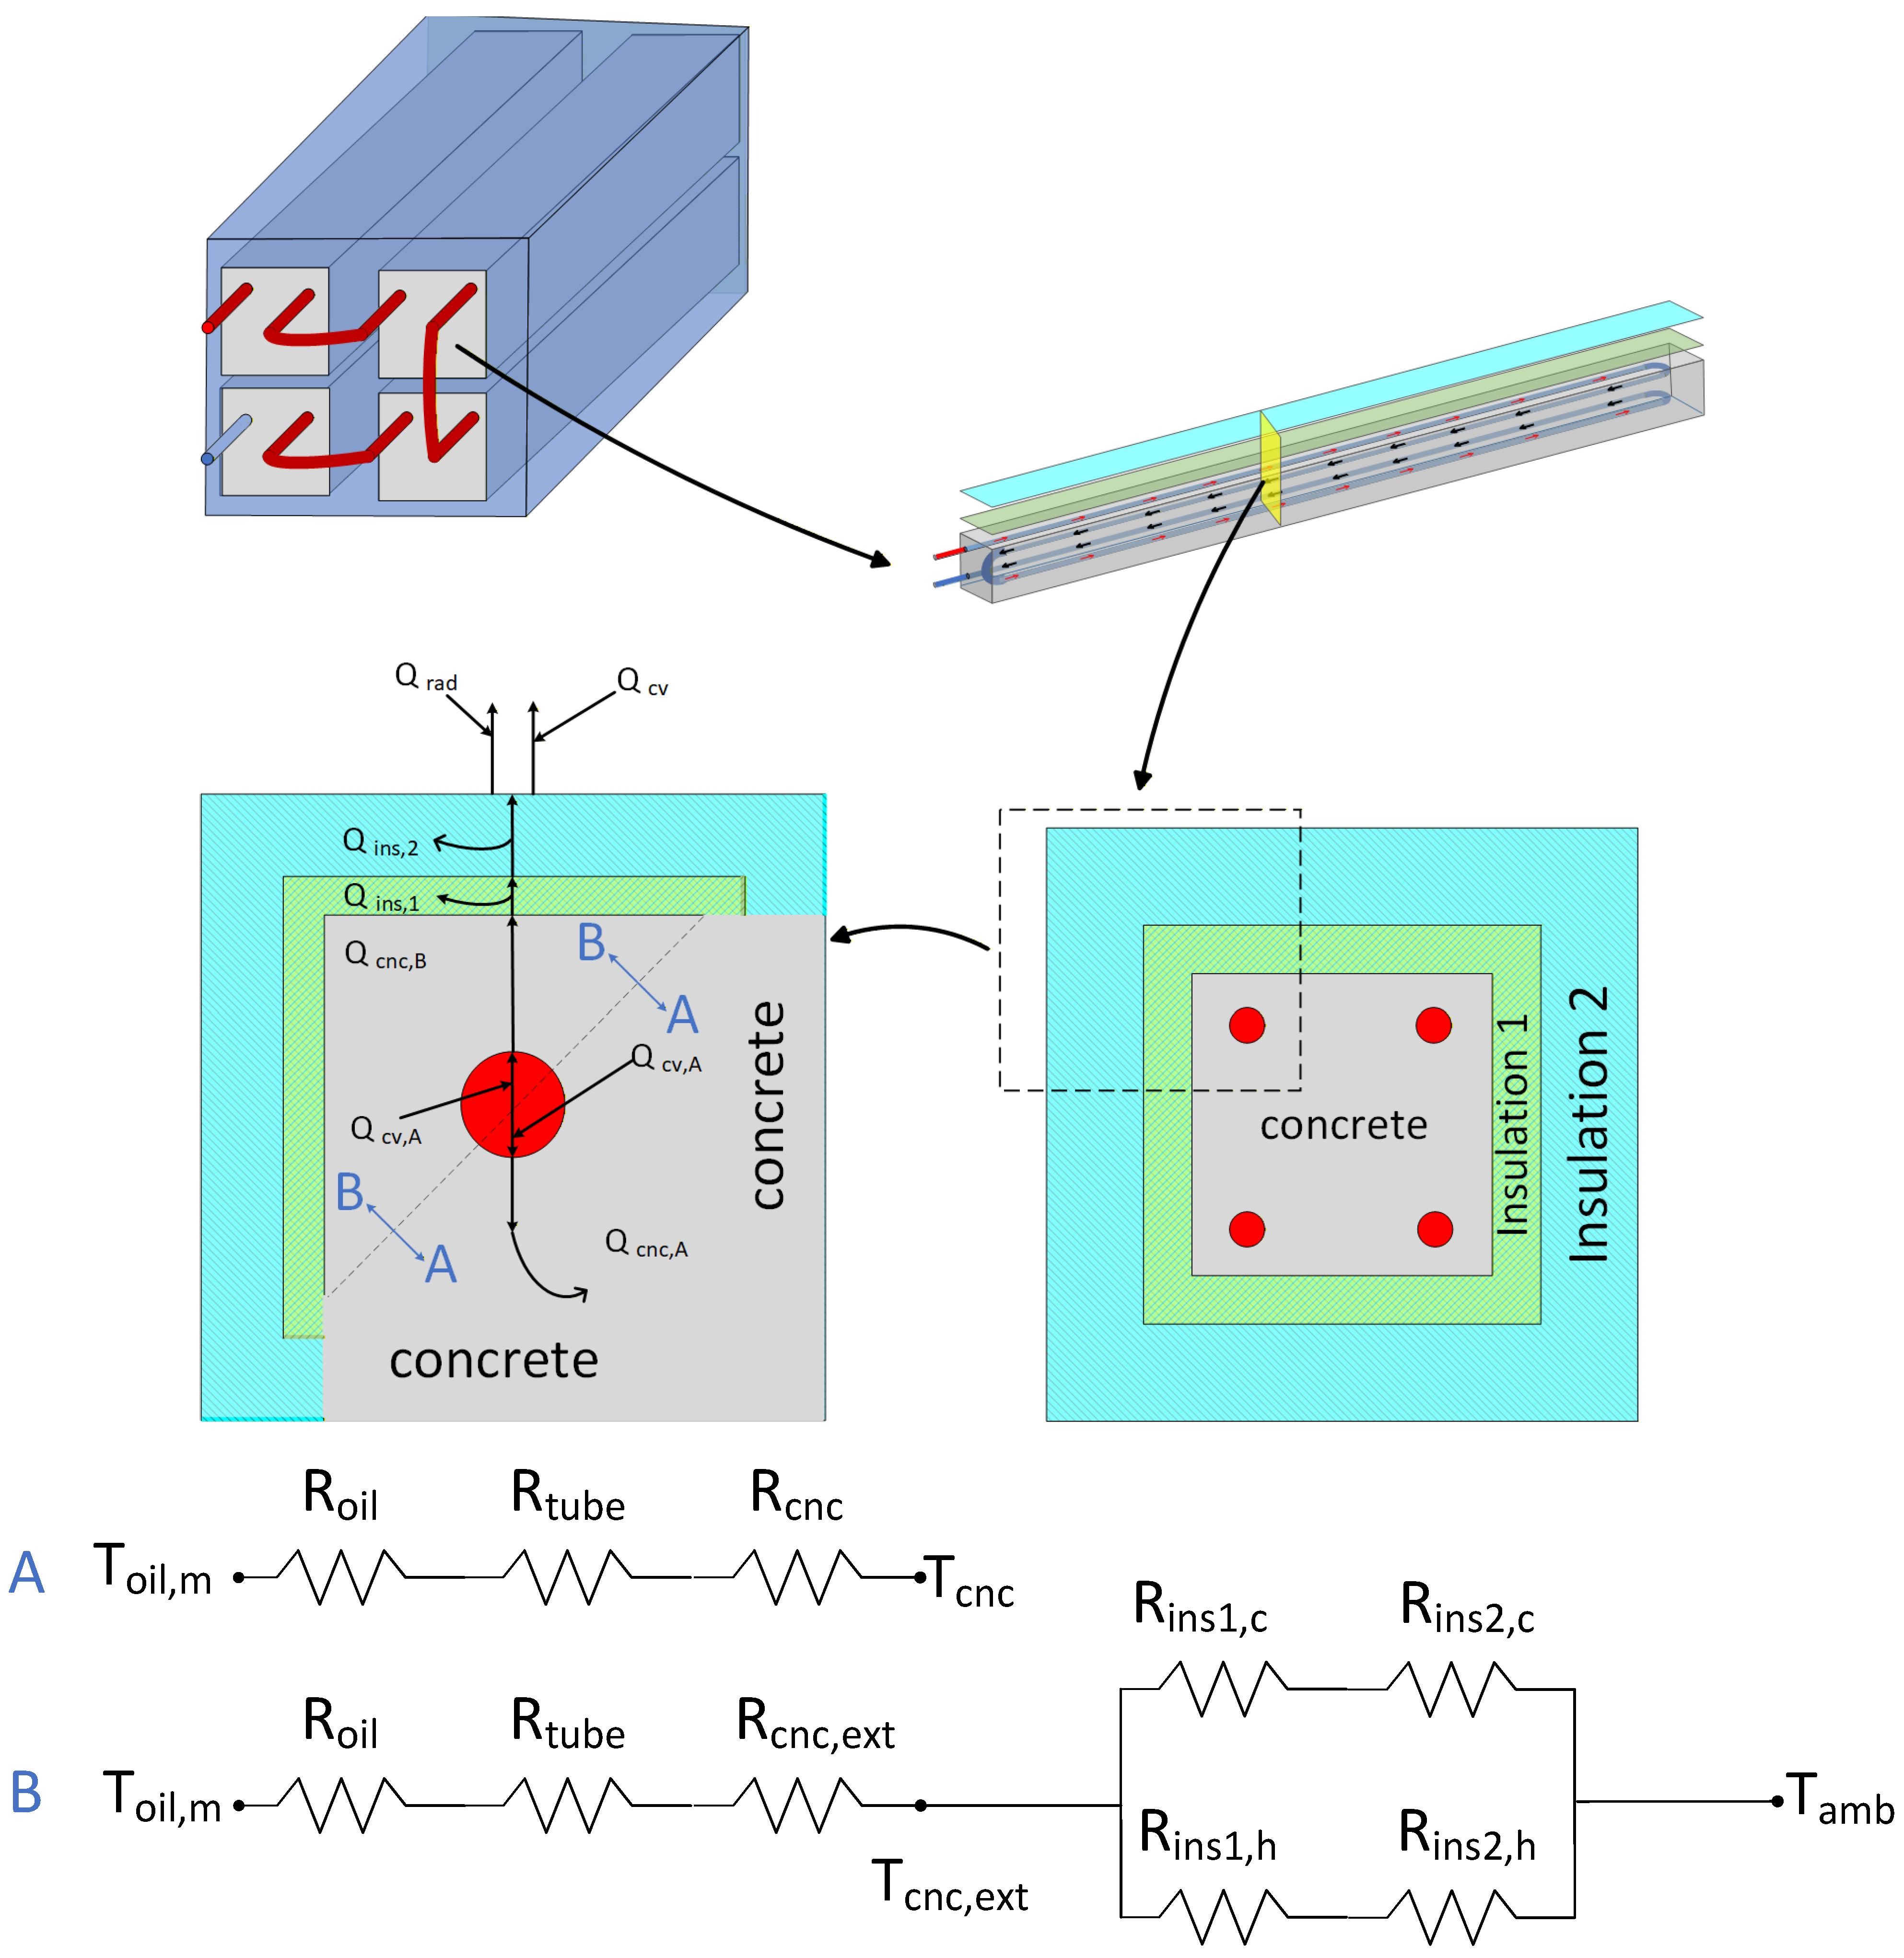
The C-TES unit, shown in Figure 5, consists of high-density concrete blocks embedded with steel heat exchanger tubes. The HTF enters the module at high temperature, releasing heat to the concrete through convective heat transfer inside the tubes and conductive transfer through the surrounding material. To reduce thermal losses, the storage unit is encased in a dual-layer insulation system comprising a high-temperature ceramic blanket (inner layer) and mineral wool (outer layer).
A detailed thermal resistance network is used to model heat transfer from HTF to the surrounding environment. Two representative conduction paths, labeled Path A and Path B, are employed to characterize heat dissipation as depicted in Figure 5. In Path A, heat transfer begins from the mean oil temperature ( T o i l , m ) and passes sequentially through the oil-side convective resistance R o i l , the tube wall conduction resistance R t u b e , and finally the internal concrete conduction resistance R c n c , resulting in a concrete core temperature T c n c . Path B extends this model outward, incorporating an additional resistance R c n c , e x t that represents the concrete layer outside the embedded tubes before the heat encounters the two-layer insulation system characterized by resistances R i n s , 1 and R i n s , 2 . Additionally, radiative and convective losses on the module’s surface are included in the energy balance and are represented by Q ˙ r a d and Q ˙ c v , respectively, in the heat flow schematic.
The integration of the PTC and C-TES enables the decoupling of solar energy collection from process heat demand, allowing for a dispatchable heat supply during periods of low or no solar irradiation. This configuration is particularly suited for industrial sectors that require a stable and continuous high-temperature thermal source.

4.1. Analysis and Modeling

This section details the governing equations for both PTC and C-TES. Energy balances are derived for the PTC and account for the solar radiation thermal losses. Simultaneously, transient heat transfer is applied within the C-TES, assuming a lumped system through the concrete layer.

4.1.1. Parabolic Trough Collector

Based on the first law of thermodynamics, the energy balance equation is derived for the current system as follows:
Q ˙ s = Q ˙ u s e f u l + Q ˙ l o s s + Q ˙ l o s s , o p t
where Q ˙ s is the total solar power incident, Q ˙ u s e f u l is the useful power from the PTC, Q ˙ l o s s is the thermal loss to the environment, and Q ˙ l o s s , o p t is the optical losses due to the optical parameters. The solar power is calculated by knowing the amount of beam radiation that falls onto PTC area as follows:
Q ˙ s = I b A p
where ( A p ) is the collector aperture area in m 2 and ( I b e a m ) is the direct beam radiation W / m 2 . Mainly, two losses have occurred in the PTC thermal losses affected by the environment and PTC temperature difference and the optical losses caused by several optical factors:
Q ˙ o p t , l o s s = Q ˙ s 1 η o p t
where the optical efficiency ( η o p t ) is identified in Table 2.
Q ˙ t h , l o s s = A r U O T f T a
where A r is the area of the PTC receiver, U O is the overall heat transfer coefficient, T f is the temperature of the HTF, and T a is the ambient temperature. The details of the model were previously developed and validated [4], and the useful energy is determined as follows:
Q ˙ u s e f u a l = m ˙ H T F h 2 h 1
where m ˙ H T F is the mass flow rate of the HTF inside the PTC in k g / s , and h 1 and h 2 are the inlet and outlet enthalpies of the PTC. Therefore, the PTC energy efficiency is calculated using the following equation:
η e n , P T C = Q ˙ u s e f u l I b A p

4.1.2. Concrete Thermal Energy Storage

This section details the analytical framework and governing equations for the simulation of the C-TES system based on the lumped capacitance approach validated by Doretti et al. [60]. The model is designed to provide a computationally efficient yet robust representation of the thermal dynamics of concrete-based sensible heat storage modules during both the charging and discharging phases. The thermal behavior of the C-TES module is governed by the first law of thermodynamics, which equates the net heat transfer to the change in internal energy of the storage medium. The general energy balance for the concrete module is expressed as follows:
Q c h = Q d i s ± Q s t o + Q i n s + Q l o s s
where the ( Q c h ) is the charged energy to the concrete storage, ( Q d i s ) is the dispatched energy from the C-TES, ( Q s t o ) is the stored energy within the C-TES, and ( Q l o s s ) is the thermal loss of C-TES to the environment. In the case of charging/discharging mode for concrete, the sign control of energy transfer ± Q s t o + Q i n s should be controlled. Each term of the energy balance can be estimated as follows:
Q c h = Q u s e f u l
where ( Q c h ) is the total energy charged to the concrete storage and ( Q u s e f u l ) is the total useful energy from the PTC. The useful energy is obtained by integrating the instantaneous useful power over the charging period as follows:
Q u s e f u l = t i t f Q ˙ u s e f u l   d t
where ( Q ˙ u s e f u l ) is the instantaneous useful heat rate from the PTC and ( t i ) and ( t f ) are the initial and final times of the charging period. The total energy stored in the C-TES is given by
Q s t o = Q c n c , A + Q c n c , B
where ( Q c n c , A ) is the energy stored in the inner concrete (Path A) and ( Q c n c , B ) is the energy stored in the outer concrete layer (Path B).
Q c n c , A = t i t f Q ˙ c n c , A   d t
The instantaneous heat transfer rate is expressed as follows:
Q ˙ c n c , A = T o i l , m T c n c 2 R i n t
Here, ( T o i l , m ) is the mean temperature of the HTF oil, ( T c n c ) is the concrete core temperature, and ( R i n t ) is the internal resistance between the oil and the concrete. The factor 1 2 represents the division of the heat transfer path between the two symmetrical sides. Similarly, for Path B, the stored energy is
Q c n c , B = t i t f Q ˙ c n c , B   d t
with the instantaneous rate given by
Q ˙ c n c , B = T o i l , m T c n c , e x t 2 R i n t
where ( T c n c , e x t ) is the external concrete surface temperature before the insulation layer. The total heat loss from the C-TES is obtained as follows:
Q l o s s = t i t f Q ˙ l o s s   d t
where the instantaneous heat loss rate is
Q ˙ l o s s = Q ˙ c v + Q ˙ r a d
Q ˙ c v , and ( Q ˙ r a d ) are the convection and radiation losses from the outer surface:
Q ˙ c v = A c _ t e s h a ( T i n s , 2 , e x t T a )
where ( h a ) is the external convective heat transfer coefficient calculated using the Churchill and Bernstein correlation, ( A c _ t e s ) is the outer surface area, ( T i n s , 2 , e x t ) is the surface temperature, and ( T a ) is the ambient temperature. The external convection coefficient is obtained from the following equations:
h a = k a   N u D i n s , 2
N u = 0.3 + 0.62   R e 0.5   p r 1 3 1 + 0.4 p r 2 3 0.25 1 + R e 2.82 × 10 5 0.625 0.8
where ( R e ) is the Reynolds number, ( p r ) is the Prandtl number, ( k a ) is the thermal conductivity of air, and ( D i n s , 2 ) is the outer diameter of the insulation. For 10 2 < R e < 10 7   and   R e   p r > 0.2 by Churchill and Bernstein [76], the radiative heat loss rate is expressed as follows:
Q ˙ r a d = A c _ t e s σ ε v ( T i n s , 2 , e x t 4 T a 4 )
where ( ε v ) is the surface emissivity of insolation material, ( σ ) is the Stefan–Boltzmann constant, and ( T i n s , 2 , e x t 4 ) is the temperature of outer insulation layer 2. The total energy stored within the insulation layers of the C-TES is calculated as the sum of the contributions from the first and second insulation layers:
Q i n s = Q i n s , 1 + Q i n s , 2
where ( Q i n s , 1 ) and ( Q i n s , 2 ) are the sensible heat energies stored in insulation layer 1 and insulation layer 2, respectively. These values are determined using the following equations:
Q i n s , 1 = m i n s , 1 C i n s , 1   T i n s , 1
Q i n s , 2 = m i n s , 2 C i n s , 2 (   T i n s , 2 )
where ( m i n s , 1 ) and ( m i n s , 2 ) are the masses of insulation layer 1 and layer 2, ( C i n s , 1 ) and ( C i n s , 2 ) are their specific heat capacities, and   T i n s , 1 and (   T i n s , 2 ) are their respective temperature changes over the considered time interval. For the first insulation layer, the internal surface temperature equals the external concrete temperature:
T i n s , 1 , i n t = T c n c , e x t
while the external surface temperature is
T i n s , 1 , e x t = T i n s , 1 , i n t Q ˙ l o s s   R i n s , 1
For the second insulation layer, the external surface temperature is
T i n s , 2 , e x t = T i n s , 1 , i n t Q ˙ l o s s   R i n s
The mean temperature of an insulation layer is evaluated using the following equation:
T i n s , m = T i n s , i n t T i n s , e x t T i n s , i n t ln r e x t r i n t ln r i n t + T i n s , e x t T i n s , i n t ln r e x t r i n t r e x t 2 ln r e x t 1 2 r i n t 2 ln r i n t 1 2 r e x t 2 r i n t 2
where ( r i n t ) and ( r e x t ) are the inner and outer radii of the insulation layer. The temperature change in each insulation layer is then calculated as follows:
  T i n s , 1 = T i n s , 1 , m , f T i n s , 1 , m ,   i
  T i n s , 2 = T i n s , 2 , m , f T i n s , 2 , m ,   i
where ( T i n s , 1 , m , f ) and ( T i n s , 2 , m , f ) are the final mean temperatures of insulation layers 1 and 2, and ( T i n s , 1 , m ,   i ) and ( T i n s , 2 , m ,   i ) are their initial mean temperatures. Table 3 summarizes the dimension and resistance equations used in the C-TES model.
The total internal thermal resistance between the HTF and the concrete core is obtained using the following equation:
R i n t = R o i l + R t + R c n c
where ( R o i l ) is the internal convection resistance, ( R t ) is the tube wall conduction resistance, and ( R c n c ) is the conduction resistance through the internal concrete layer. The total insulation resistance is given by
R i n s = R i n s , 1 + R i n s , 2
where ( R i n s , 1 ) and ( R i n s , 2 ) are the total thermal resistances of insulation layers 1 and 2, respectively. The ambient convection resistance is calculated as follows:
R a m b = 1 h a m b A i n s 2 , e x t
where ( h a m b ) is the ambient convection coefficient and ( A i n s 2 , e x t ) is the external surface area of insulation layer 2. The overall efficiency of the system is determined as follows:
η t o t a l = t i t f Q d i s + t i t f Q s t o t i t f Q s
The deliverable energy potential (DEP) is introduced as a complementary metric to the solar fraction, providing an insight into the oversupply requirement necessary to maintain dispatchability under intermittent conditions. The DEP is defined as the ratio of total available energy in the C-TES (newly charged plus previously stored) relative to the corresponding process demand:
D E P = t i t f Q c h + t i t f Q s t o t i t f Q d i s
where ( Q s t o ) is the stored energy within the C-TES and ( Q d i s ) is the discharged energy to meet the demand.

4.2. Economic Analysis

Following the performance indicators defined in the previous Section 4.1, the economic implications of the proposed PTC–C-TES system are evaluated. The economic performance is evaluated using the LCOH, which represents the cost per unit of useful energy delivered to the industrial load over the system’s lifetime. The LCOH incorporates both the upfront capital investment and the recurring operation and maintenance (O&M) expenses. It is expressed as follows:
L C O H = C A P E X   · C R F + C o m Q a n n
where C A P E X is the total capital cost, ( C o m ) is the annual operation and maintenance cost, ( Q a n n ) is the annual useful heat that operates under 300 days, and C R F is the capital recovery factor, which is defined as
C R F = r 1 + r n 1 + r n 1
with (r) the discount rate and (n) lifetime in years. The cost terms are defined as follows:
C P T C = A p   c P T C
C T E S = Q T E S     c T E S
C A P E X = C P T C + C T E S
C o m = C o m , P T C + C o m , T E S
where ( c P T C ) is the specific cost of PTC, ( c T E S ) is the specific cost of C-TES, ( Q T E S ) is the capacity of storage, and C o m , P T C and C o m , T E S are the maintenance costs of both the PTC and C-TES. The parameters are listed in Table 4.

5. Results and Discussion

The numerical simulations were implemented using Engineering Equation Solver (EES version 10) and MATLAB (version 2025A). EES was used to solve the governing thermodynamic and energy balance equations of the PTC–C-TES system, as well as for parametric analysis and figure generation, while MATLAB was employed for processing and handling solar radiation and meteorological data.

5.1. Validation

The simulation results are presented in two parts. First, the model is validated against reference data to ensure the reliability of the adopted analytical framework. Second, the validated model is applied to evaluate system performance under representative operating conditions for industrial heat supply.

5.1.1. Validation of the C-TES System Model

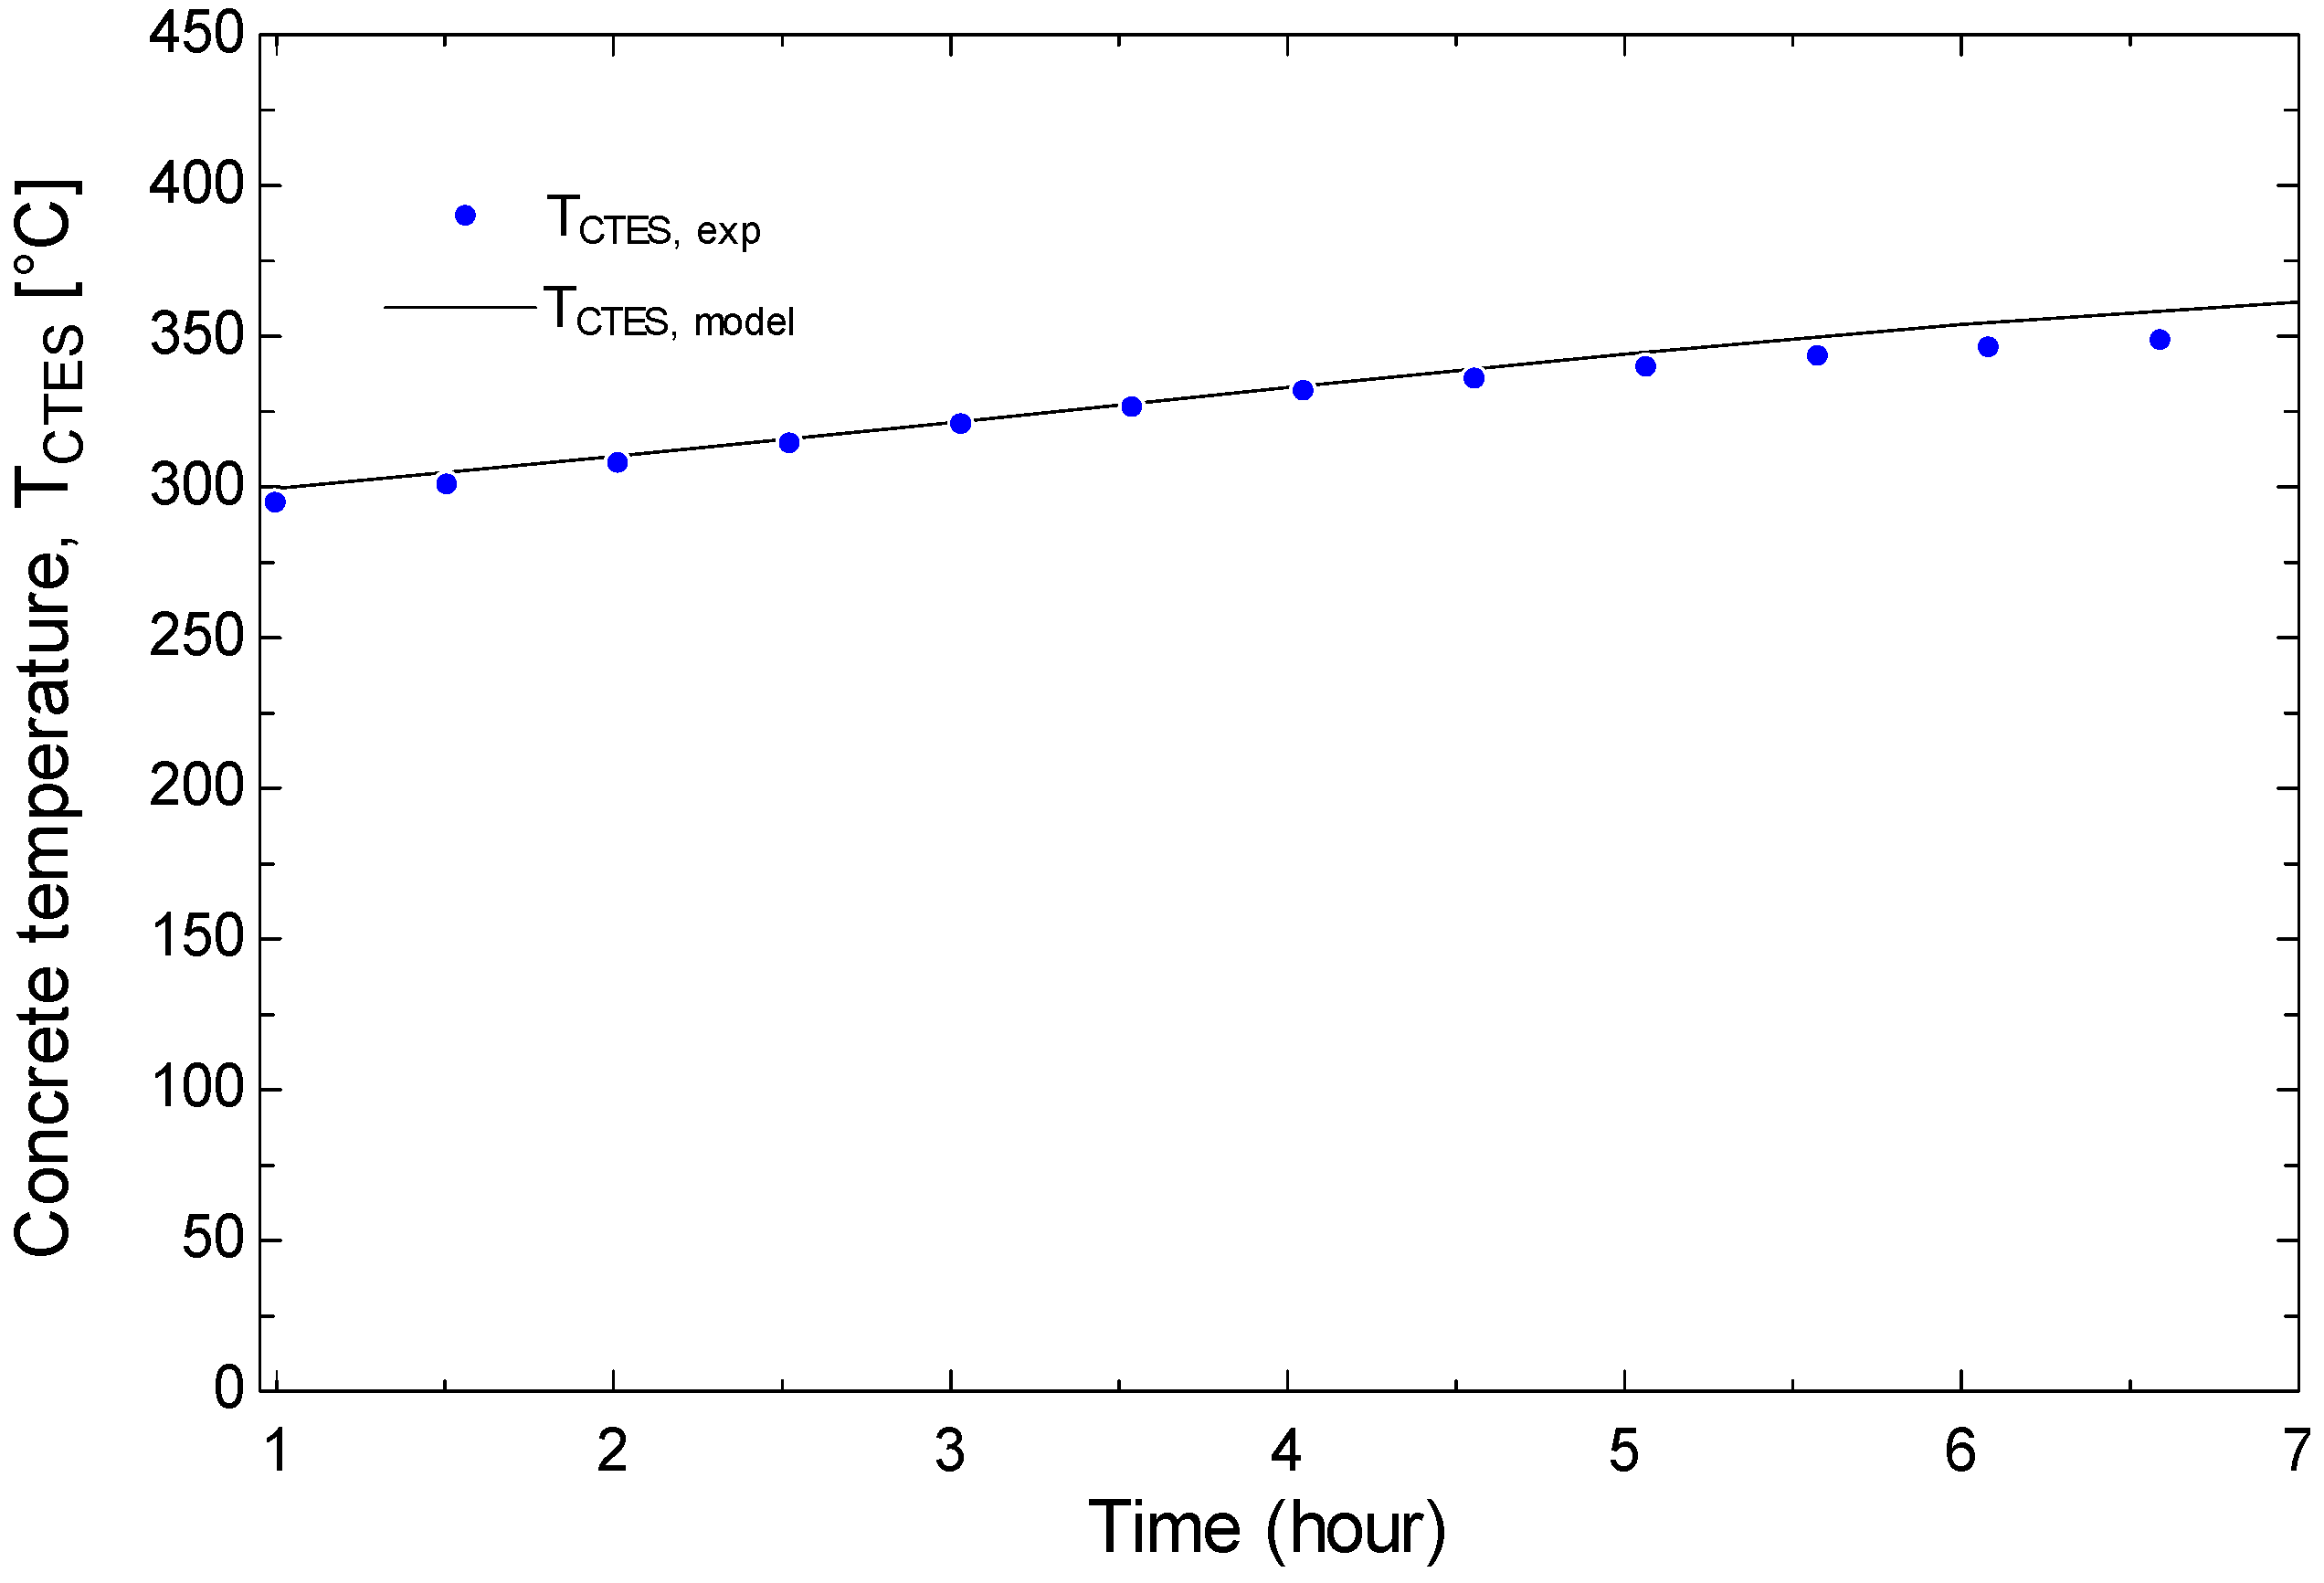
The accuracy of the developed C-TES model was assessed by comparing its predictions with experimental measurements and benchmark results from the literature. Figure 6 presents the variation in the C-TES outer surface temperature during the charging period, where the model results temperatures are plotted alongside experimental data. The model accuracy was quantified using the mean absolute error (MAE) between simulated and measured temperatures, which remained below 2% for all validated cases. These results confirm the model’s ability to capture the transient heat storage behavior. Results correspond to the validated operating conditions of the Cyprus beverage case study and are used to assess model accuracy. The input and operational parameters are listed in Table 5.

5.1.2. Benchmarking of Concrete Core Temperature Profile

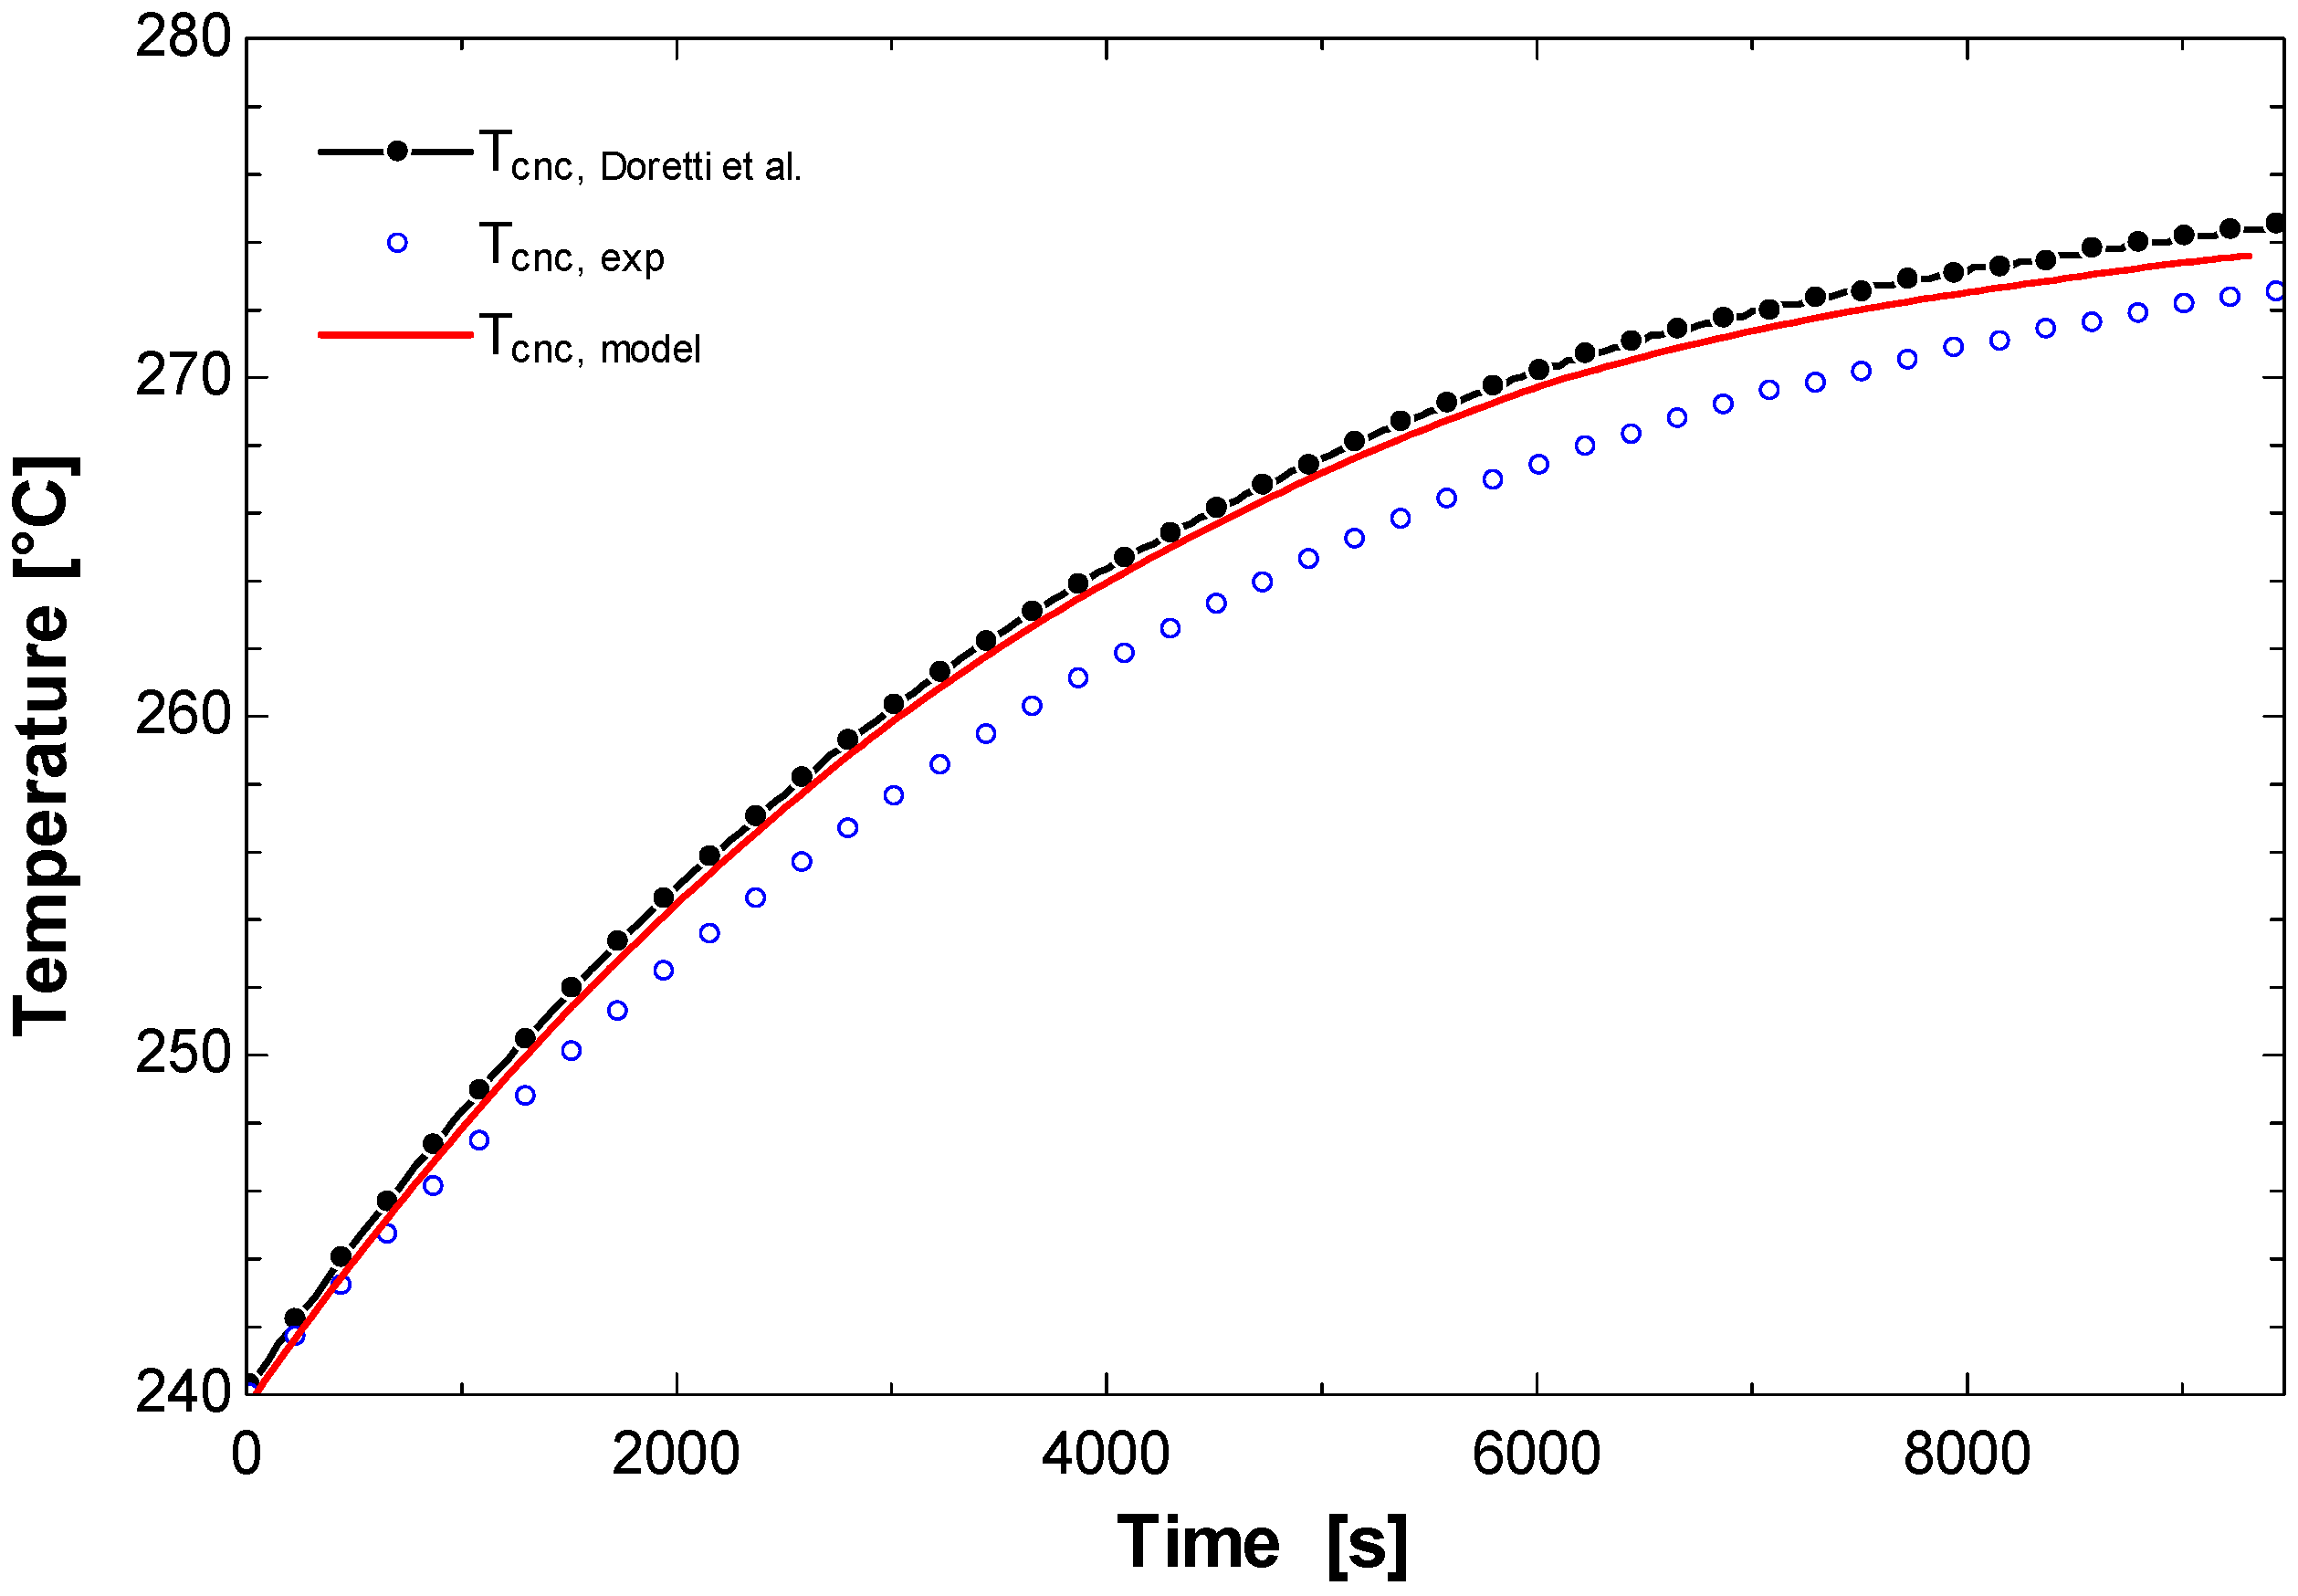
Further validation was conducted for the concrete core temperature profile, as illustrated in Figure 7. In this case, the present model temperatures were compared with experimental data and the validated model by Doretti et al. [60] using the single-module input parameters listed in Table 6. The present model closely follows the reference and experimental trends throughout the charging period, with small deviations observed mainly at later stages. Quantitative comparison indicates that the mean absolute error (MAE) between the simulated and experimental core temperatures remains below 3%. This level of agreement confirms that the proposed model reliably captures the transient thermal behavior of the C-TES core, supporting its application in subsequent performance and sensitivity analyses.
To comprehensively evaluate the model’s accuracy, a quantified estimation was performed against three datasets: two experimental cases and one numerical from literature. The statistical error metrics including root mean square error (RMSE) and mean absolute percentage error are summarized in Table 7. As shown the RMSE for Cyprus validation case is higher due to spatial resolution mismatch between experimental and numerical; however, the low MAPE confirms that these deviations are negligible and the model successfully illustrate acceptable agreement.
In the simulation Section 5.2, all reported performance indicators are based on the twelve representative monthly days and therefore reflect typical seasonal behavior rather than guaranteed annual extreme conditions.

5.2. Simulations Results

This section presents the simulation results for the PTC–C-TES system under the selected representative operating days and for different demand-coverage targets. The results are organized to first describe the C-TES thermal response and overall sizing trends, then quantify the effect of demand coverage on efficiency and cost LCOH. The DEP-based dispatchability requirement is then discussed, followed by a parametric analysis of key design and operating parameters, including HTF type, insulation thickness, mirror reflectivity, thermal losses, and mass-flow control under variable DNI.

5.2.1. C-TES Thermal Behavior over the 12 Representative Days

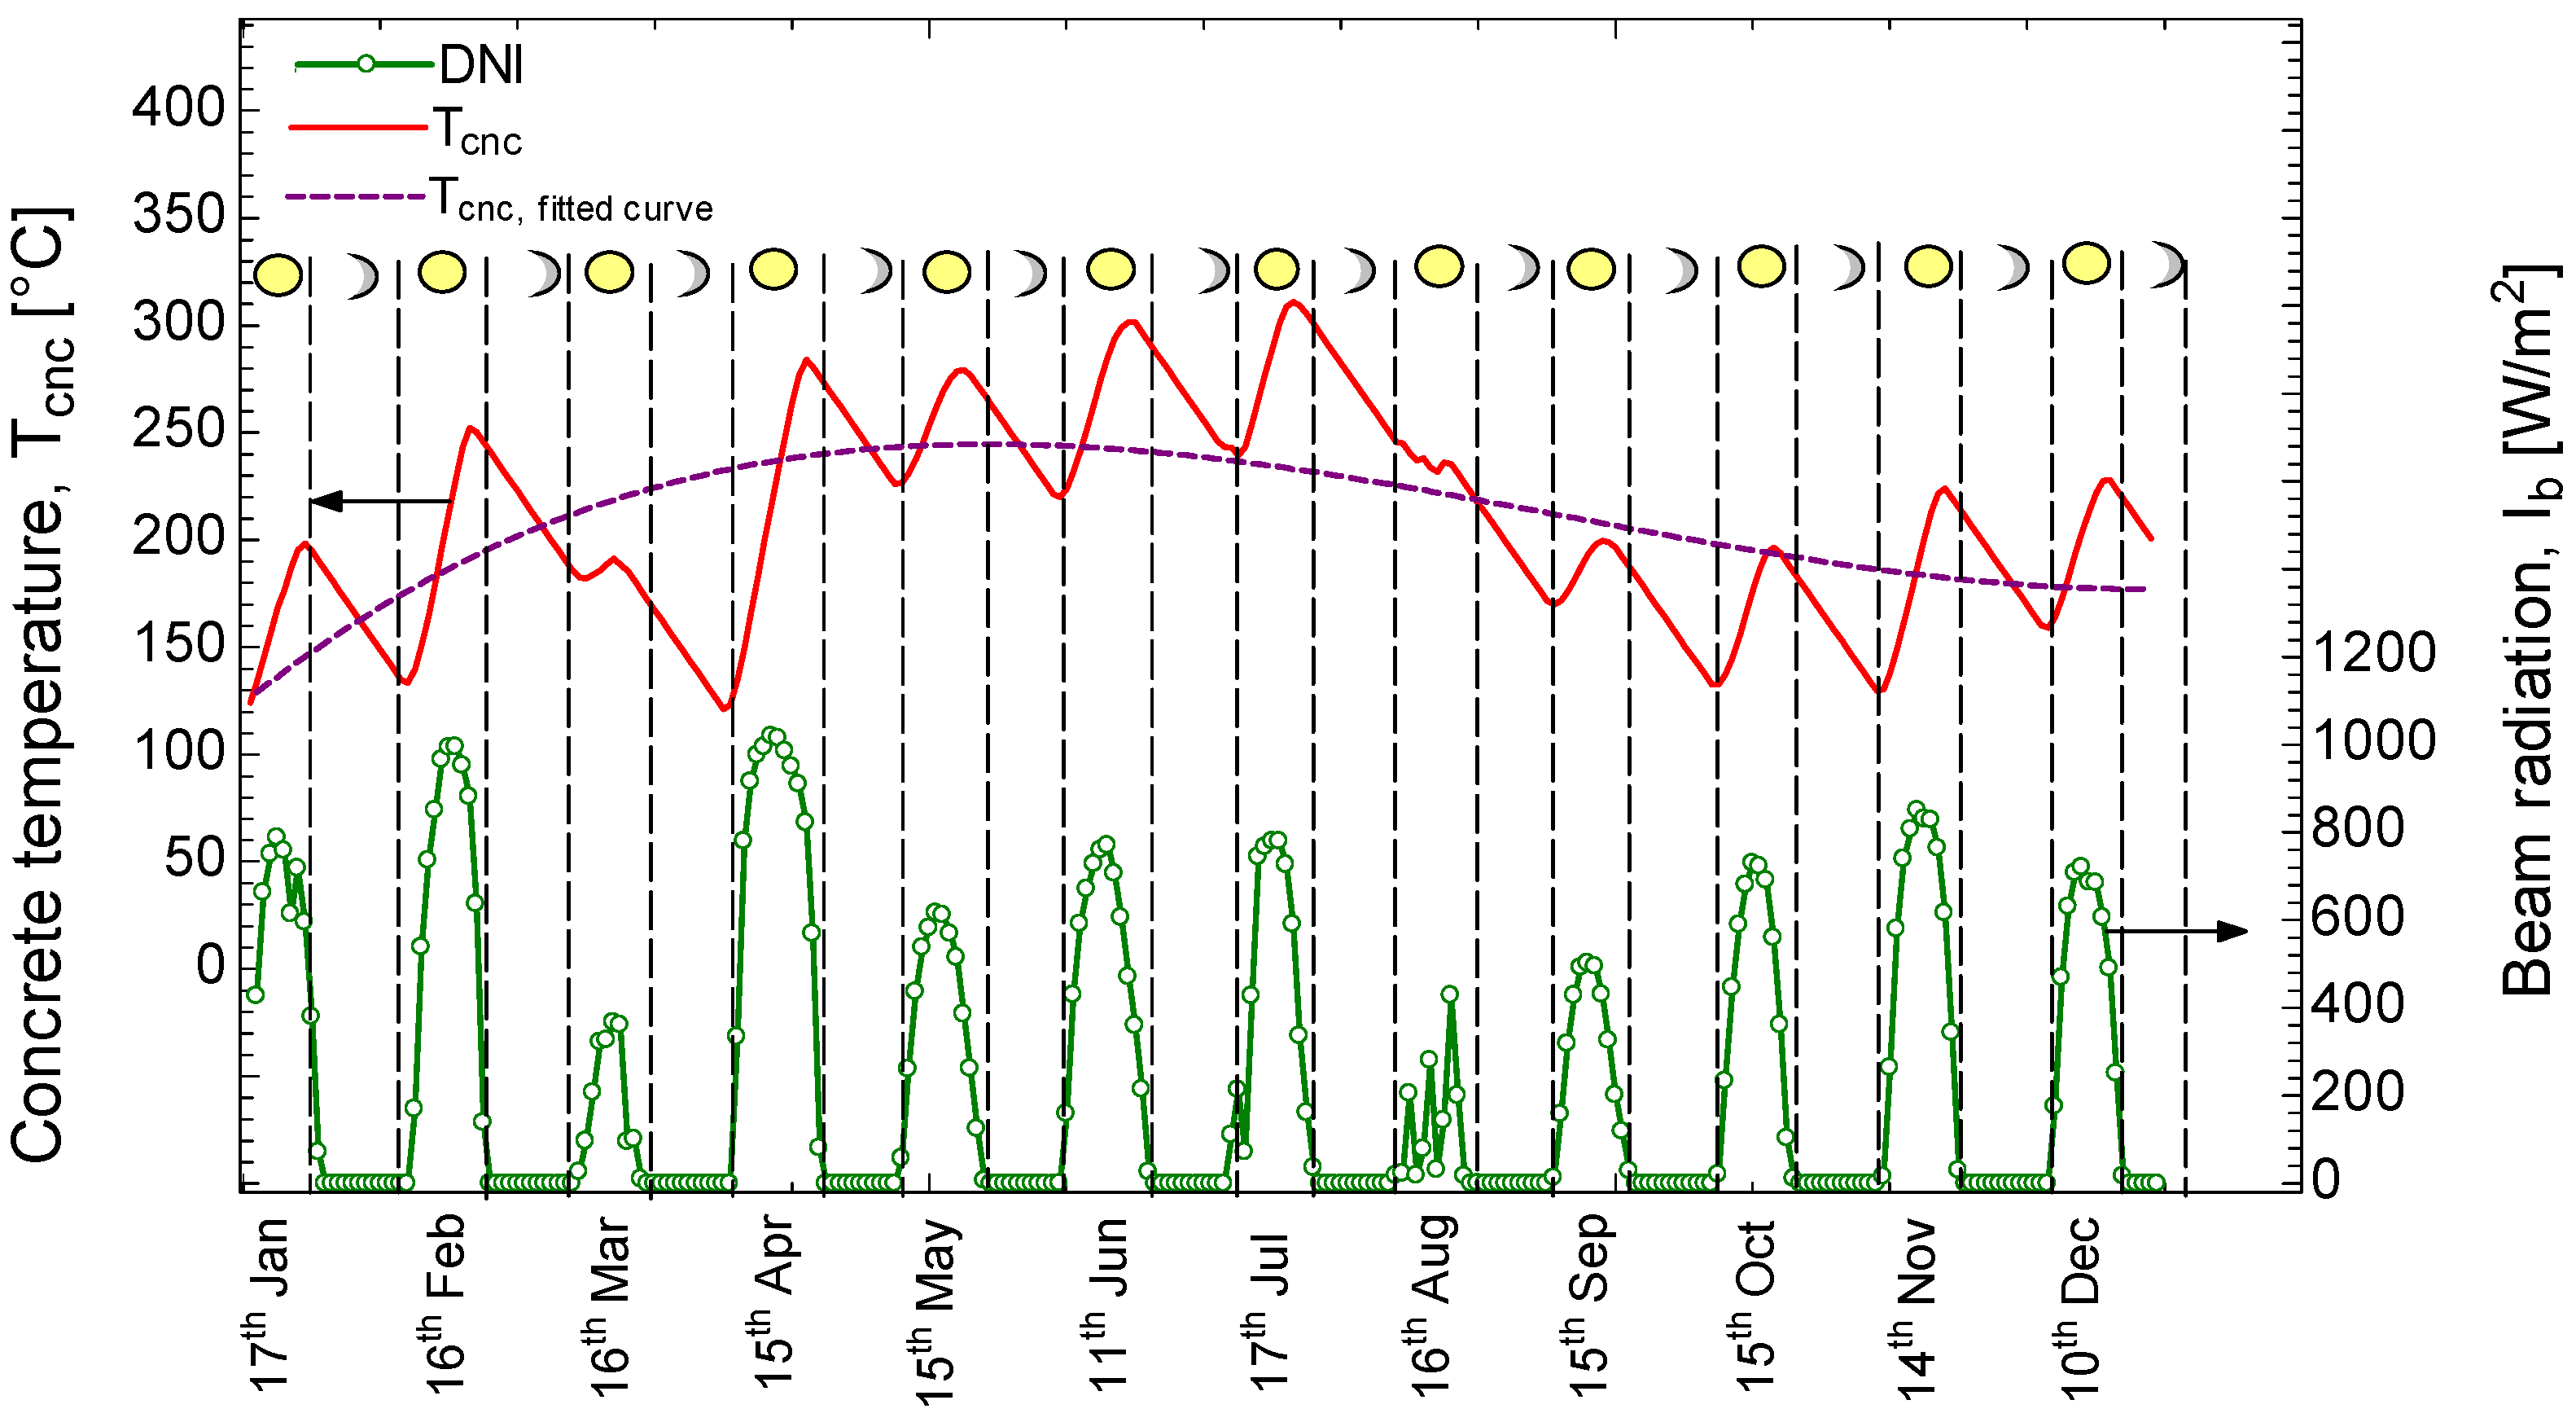
Figure 8 illustrates the hourly variation in the C-TES temperature over a representative 12-day simulation period, which replaces the yearly cycle for simplification. The initial storage temperature was set to 100 °C at the beginning of the operating year (17 January, 9:00 AM). The rise in temperature corresponds to the charging phase, whereas the decline reflects discharging to the industrial load. It is evident that the storage unit successfully maintains a continuous supply throughout the simulation period. Even during the lowest operating point, recorded on 15 April at 6:00 AM, the concrete temperature remained above 120 °C, ensuring uninterrupted process heat availability. At the same time, the C-TES exhibited steady accumulation during high-irradiance days, achieving a maximum temperature of approximately 310 °C under peak solar radiation. To highlight this long-term behavior, a fitted curve was added to the temperature profile. The fit shows the system’s tendency to approach a stable equilibrium line, where daily charging and discharging cycles are balanced, confirming the capacity of the C-TES to operate within a steady temperature range and thus ensure reliable and dispatchable heat delivery.
The solar resource is applied here as a supplementary heat source. However, solar technologies face inherent challenges in providing a fully constant supply, which necessitates the inclusion of auxiliary systems in typical industrial plants. In the present case, the simulation was designed to cover 25% of the factory demand, although this fraction can be adjusted upward or downward depending on the required demand profile and the associated heat cost.

5.2.2. System Sizing Versus Demand Coverage

Figure 9 illustrates the required number of PTCs and C-TES modules to achieve different demand coverage percentages based on the Makkah dataset. For a 25% coverage level, approximately 16 PTCs and 316 C-TES modules are sufficient to ensure a stable supply, whereas achieving full coverage (100%) would require approximately 73 PTCs and 1600 C-TES modules, highlighting the significant scaling of the system size necessary to eliminate the auxiliary input entirely.

5.2.3. Coverage Impact on Overall Efficiency and LCOH

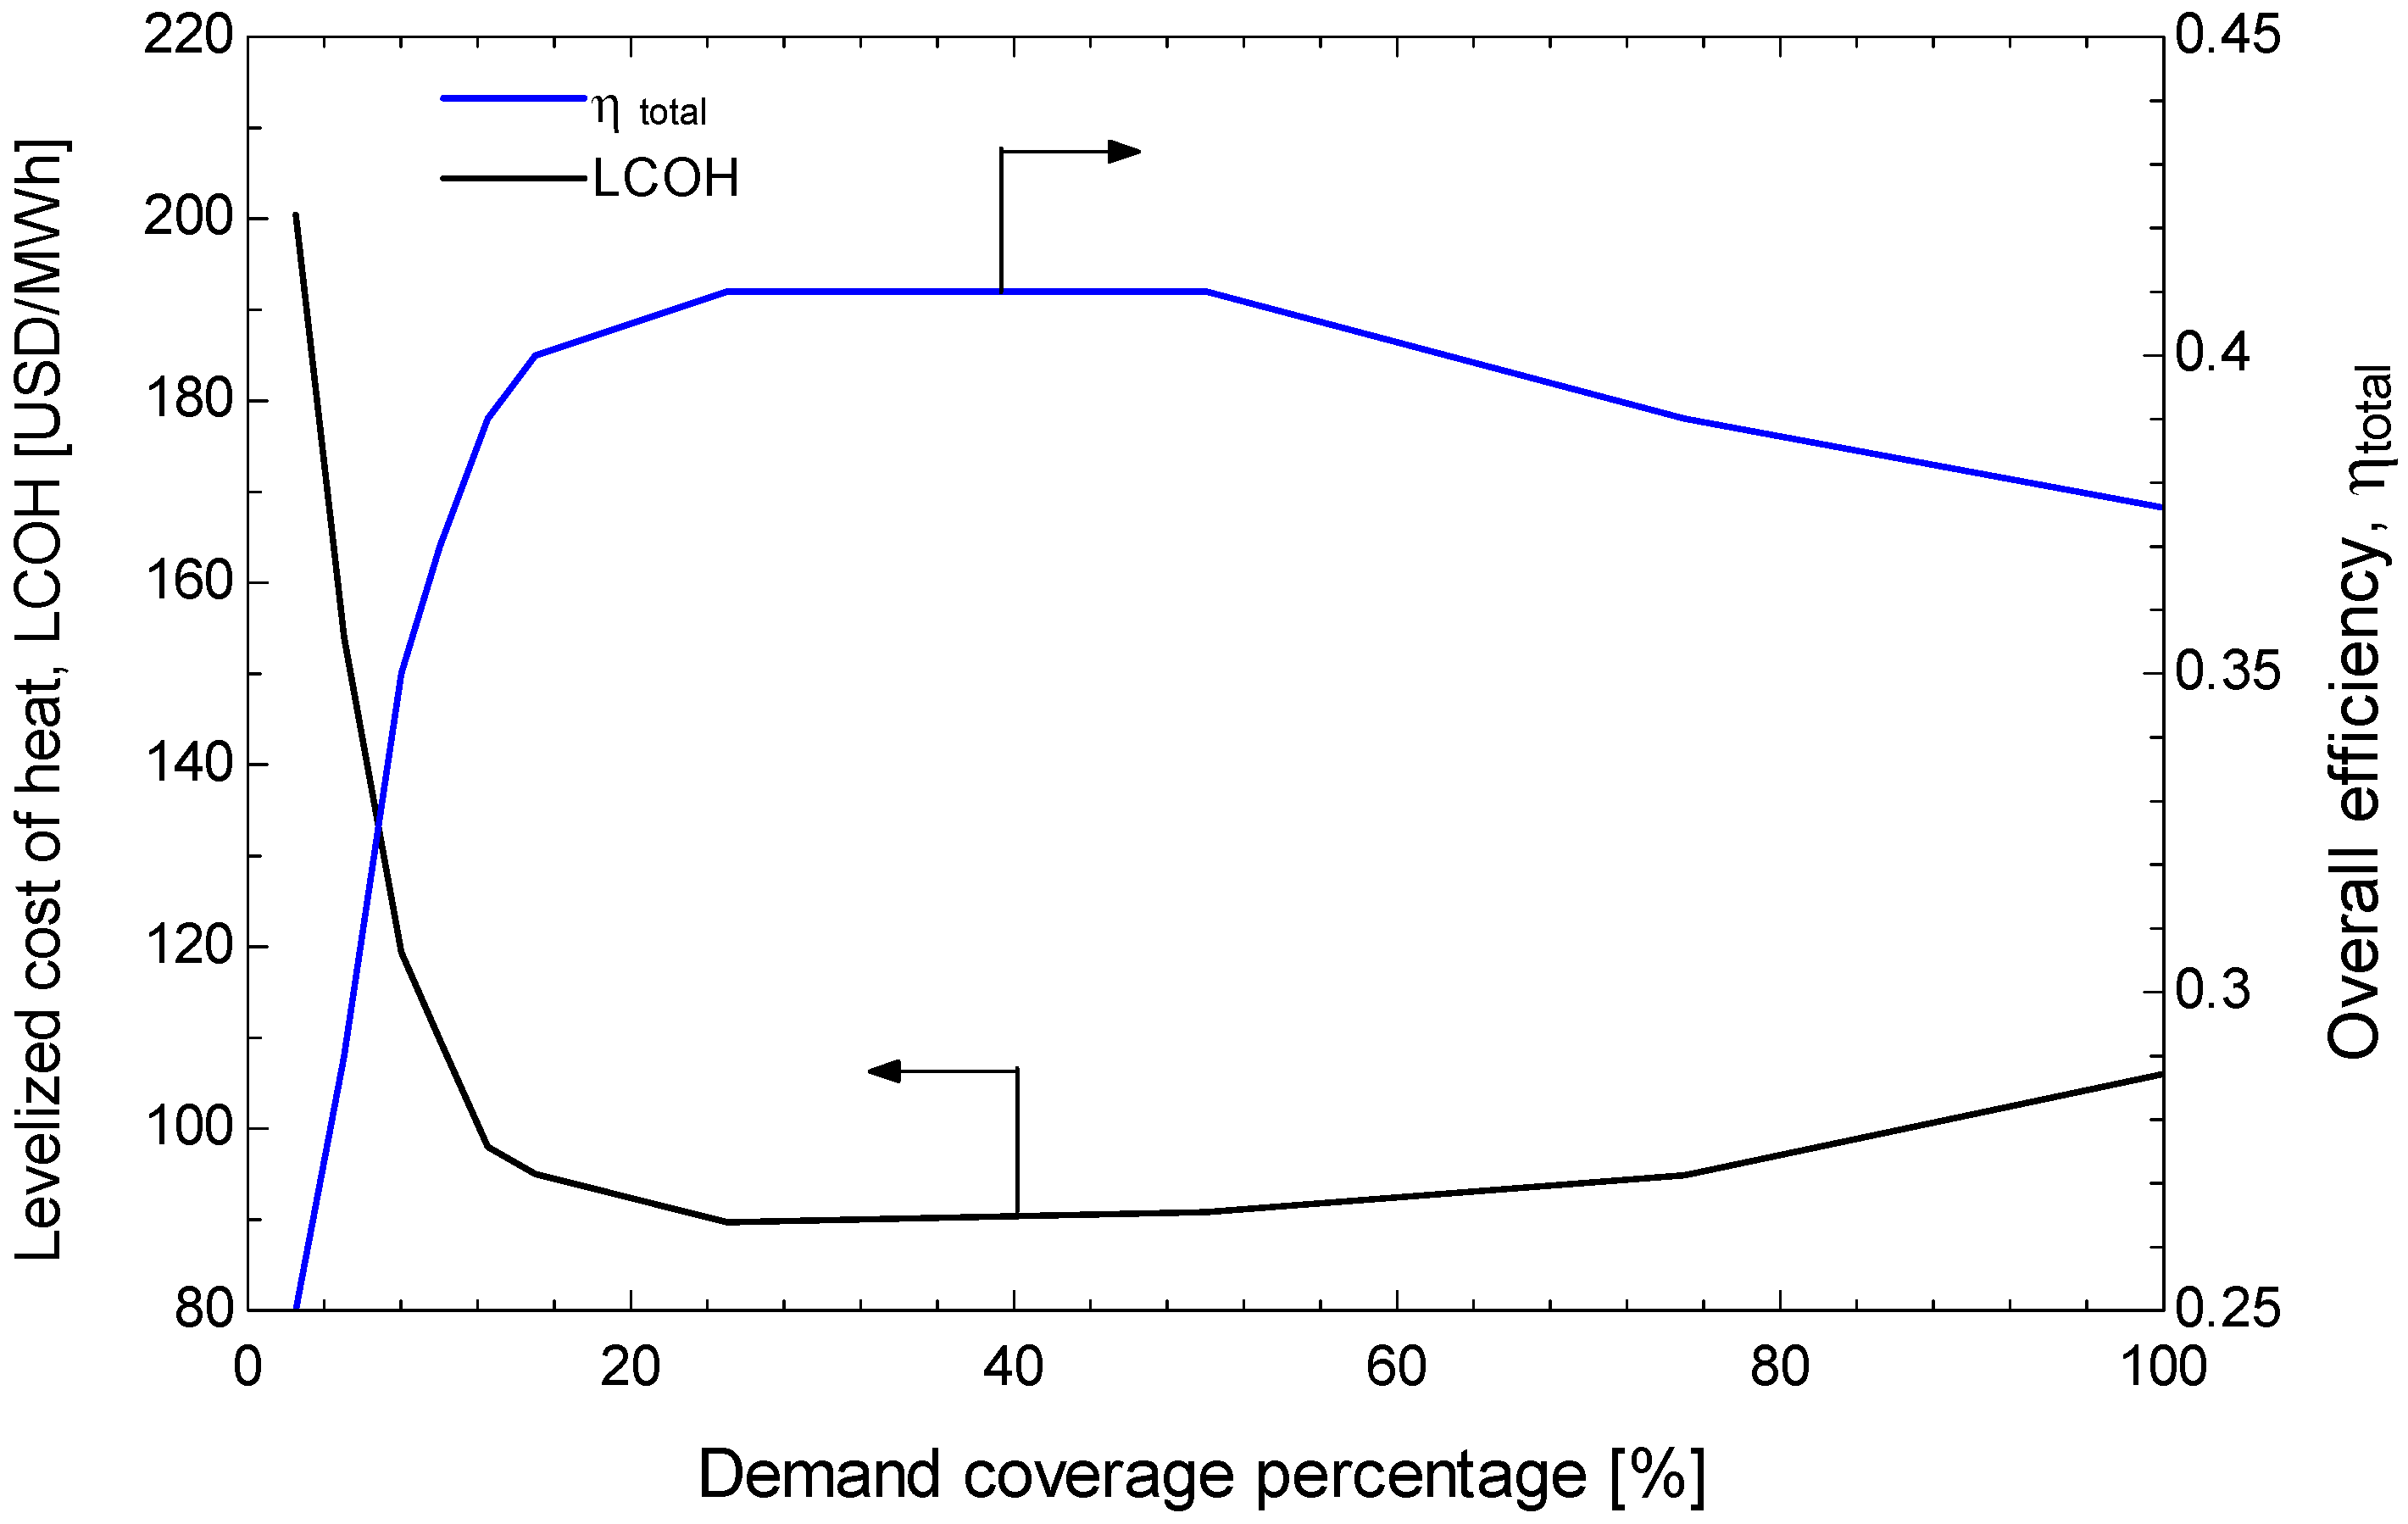
Figure 10 illustrates the effects of the demand coverage percentage on the LCOH and the overall system efficiency. At very low coverage levels (<5%), the LCOH exceeds 150 USD/MWh because of underutilization of the solar field and storage, while efficiency remains below 30%. As the coverage fraction increases, the LCOH decreases sharply and reaches a minimum of approximately 89.7 USD/MWh for 25% coverage, where the system achieves its most favorable balance between cost and performance. In this region, the overall efficiency also reaches its peak at approximately 0.41, indicating the effective utilization of both the collectors and the storage modules.
Beyond 50% coverage, the curves reveal diminishing returns. The LCOH gradually increases again, reaching 123 USD/MWh at full coverage, while efficiency decreases slightly to due to the larger collector field and extended storage operation, which introduce higher thermal losses. Although 100% coverage guarantees complete substitution of the auxiliary input, the economic penalty highlights that the optimum configuration is found at partial coverage (25–50%), where both cost and efficiency are simultaneously optimized.

5.2.4. Deliverable Energy Potential and Dispatchability Requirement

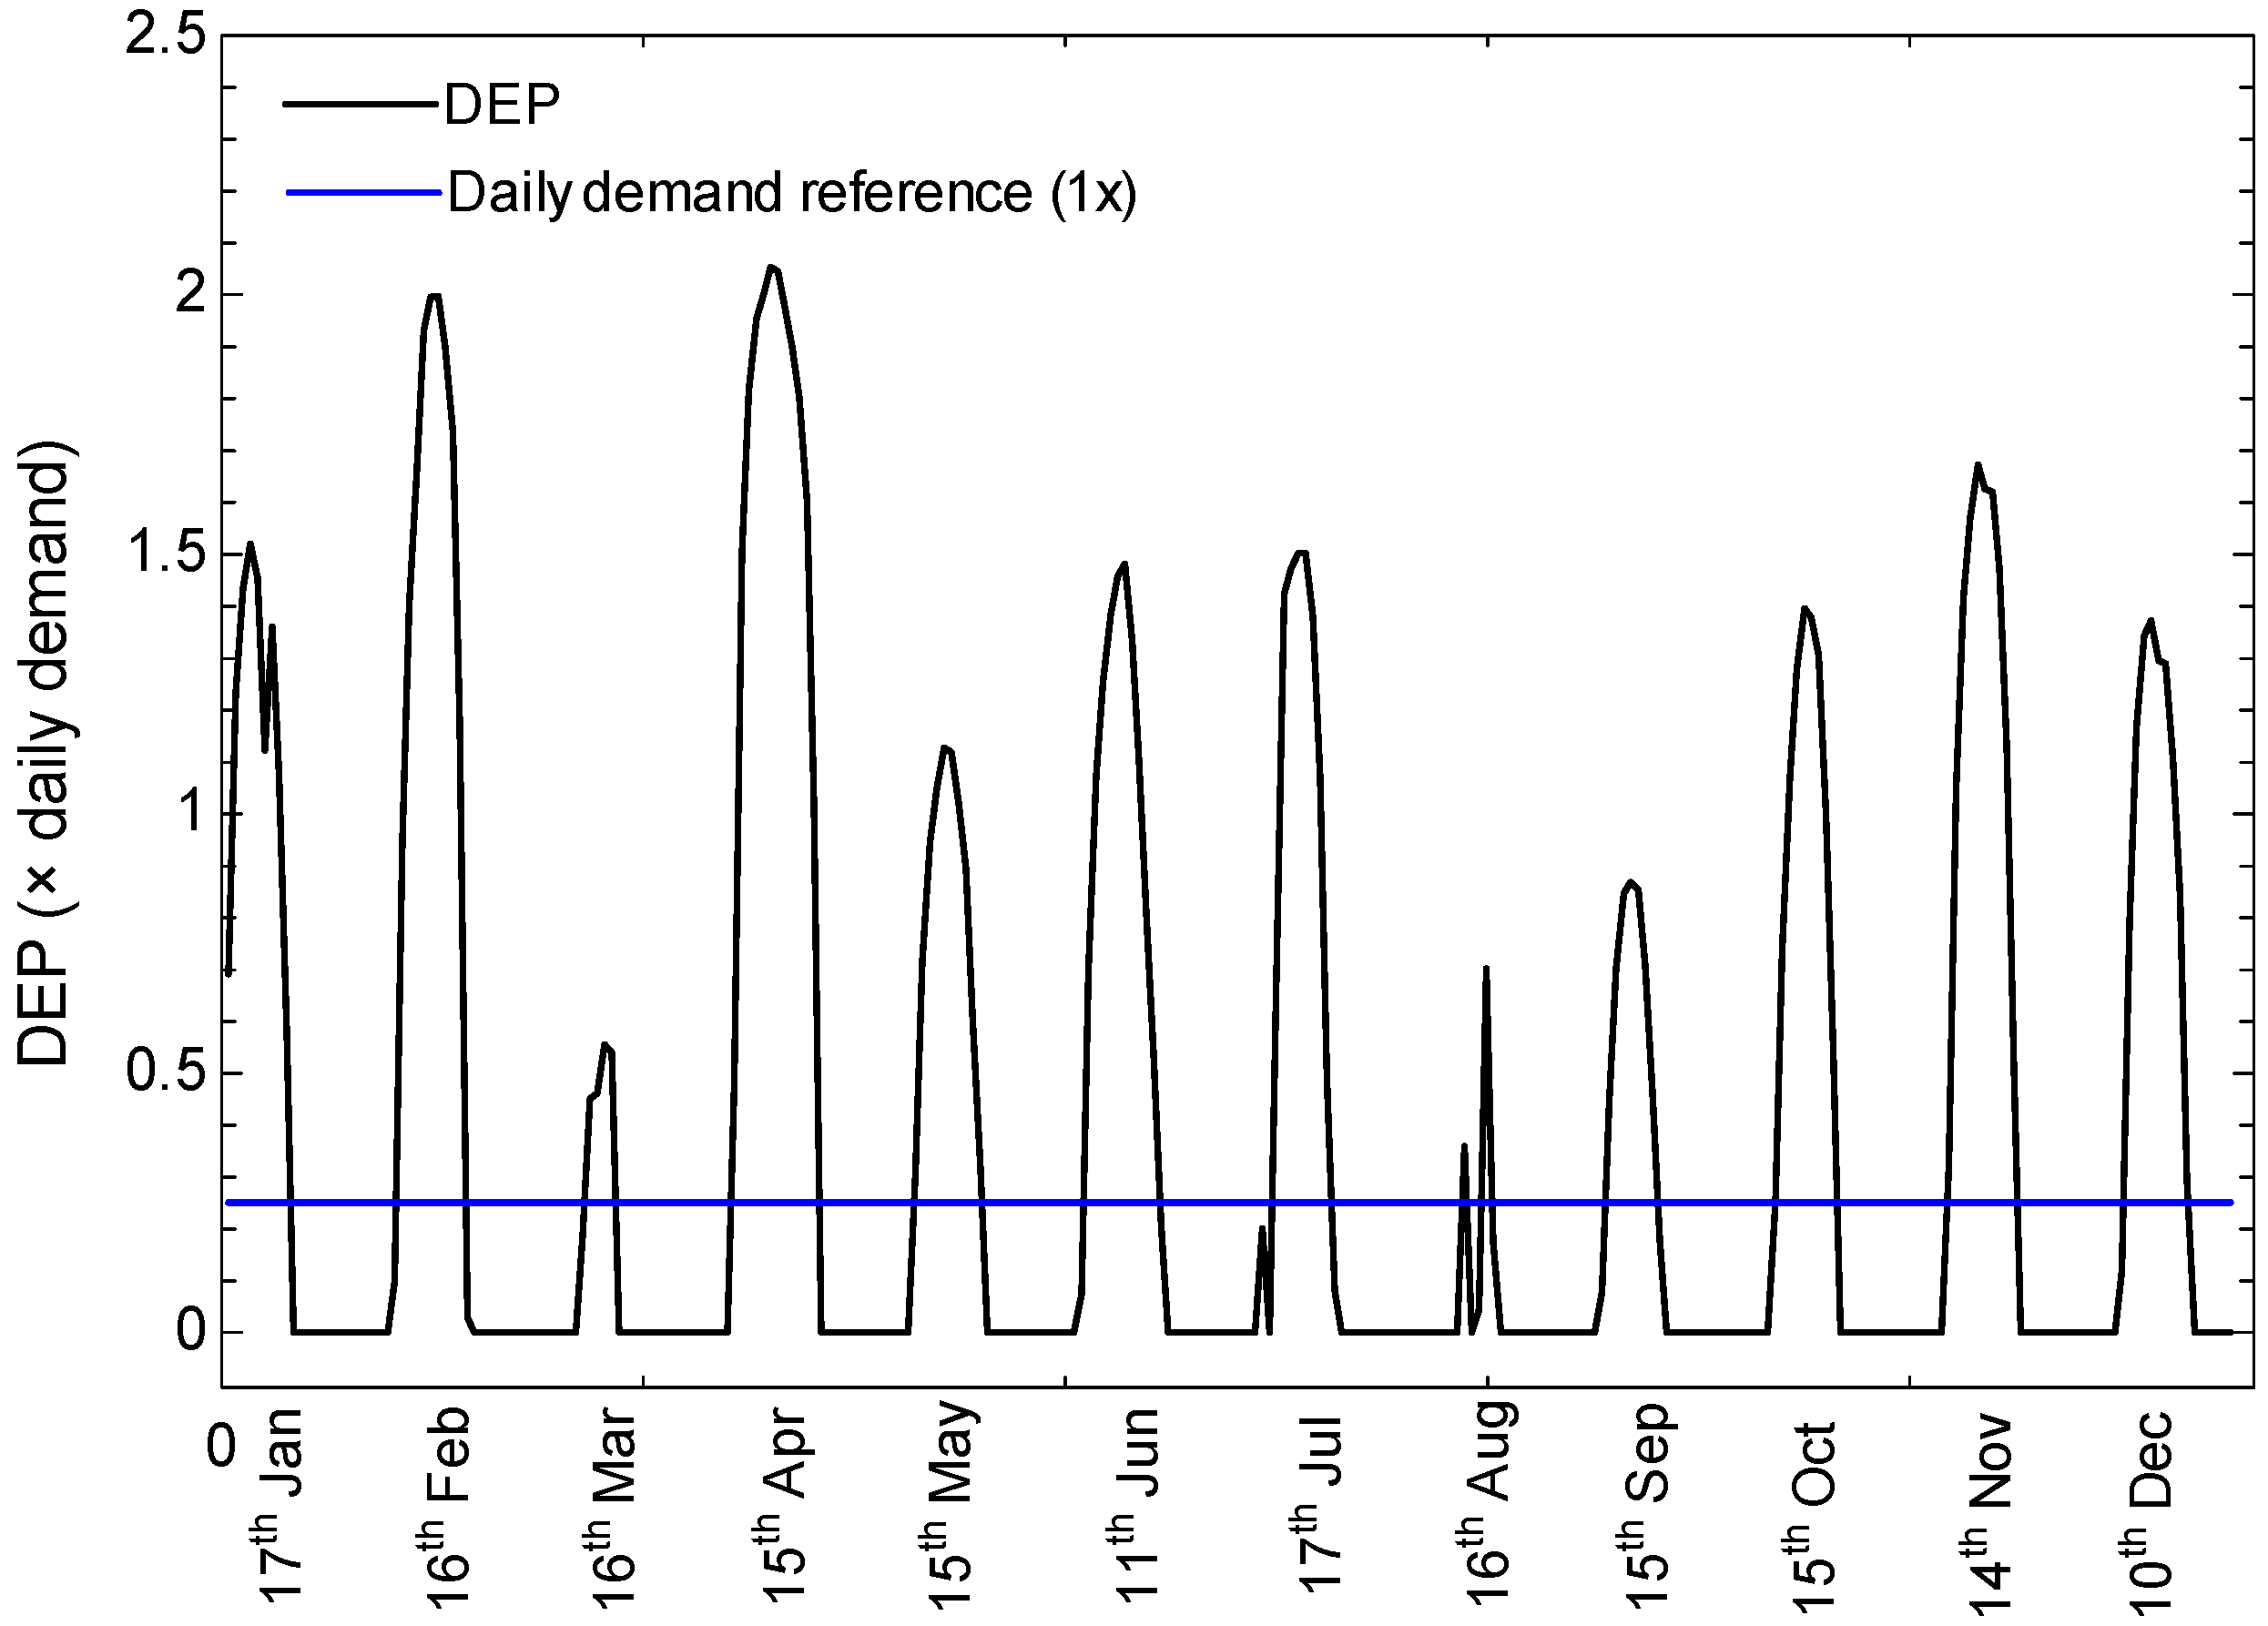
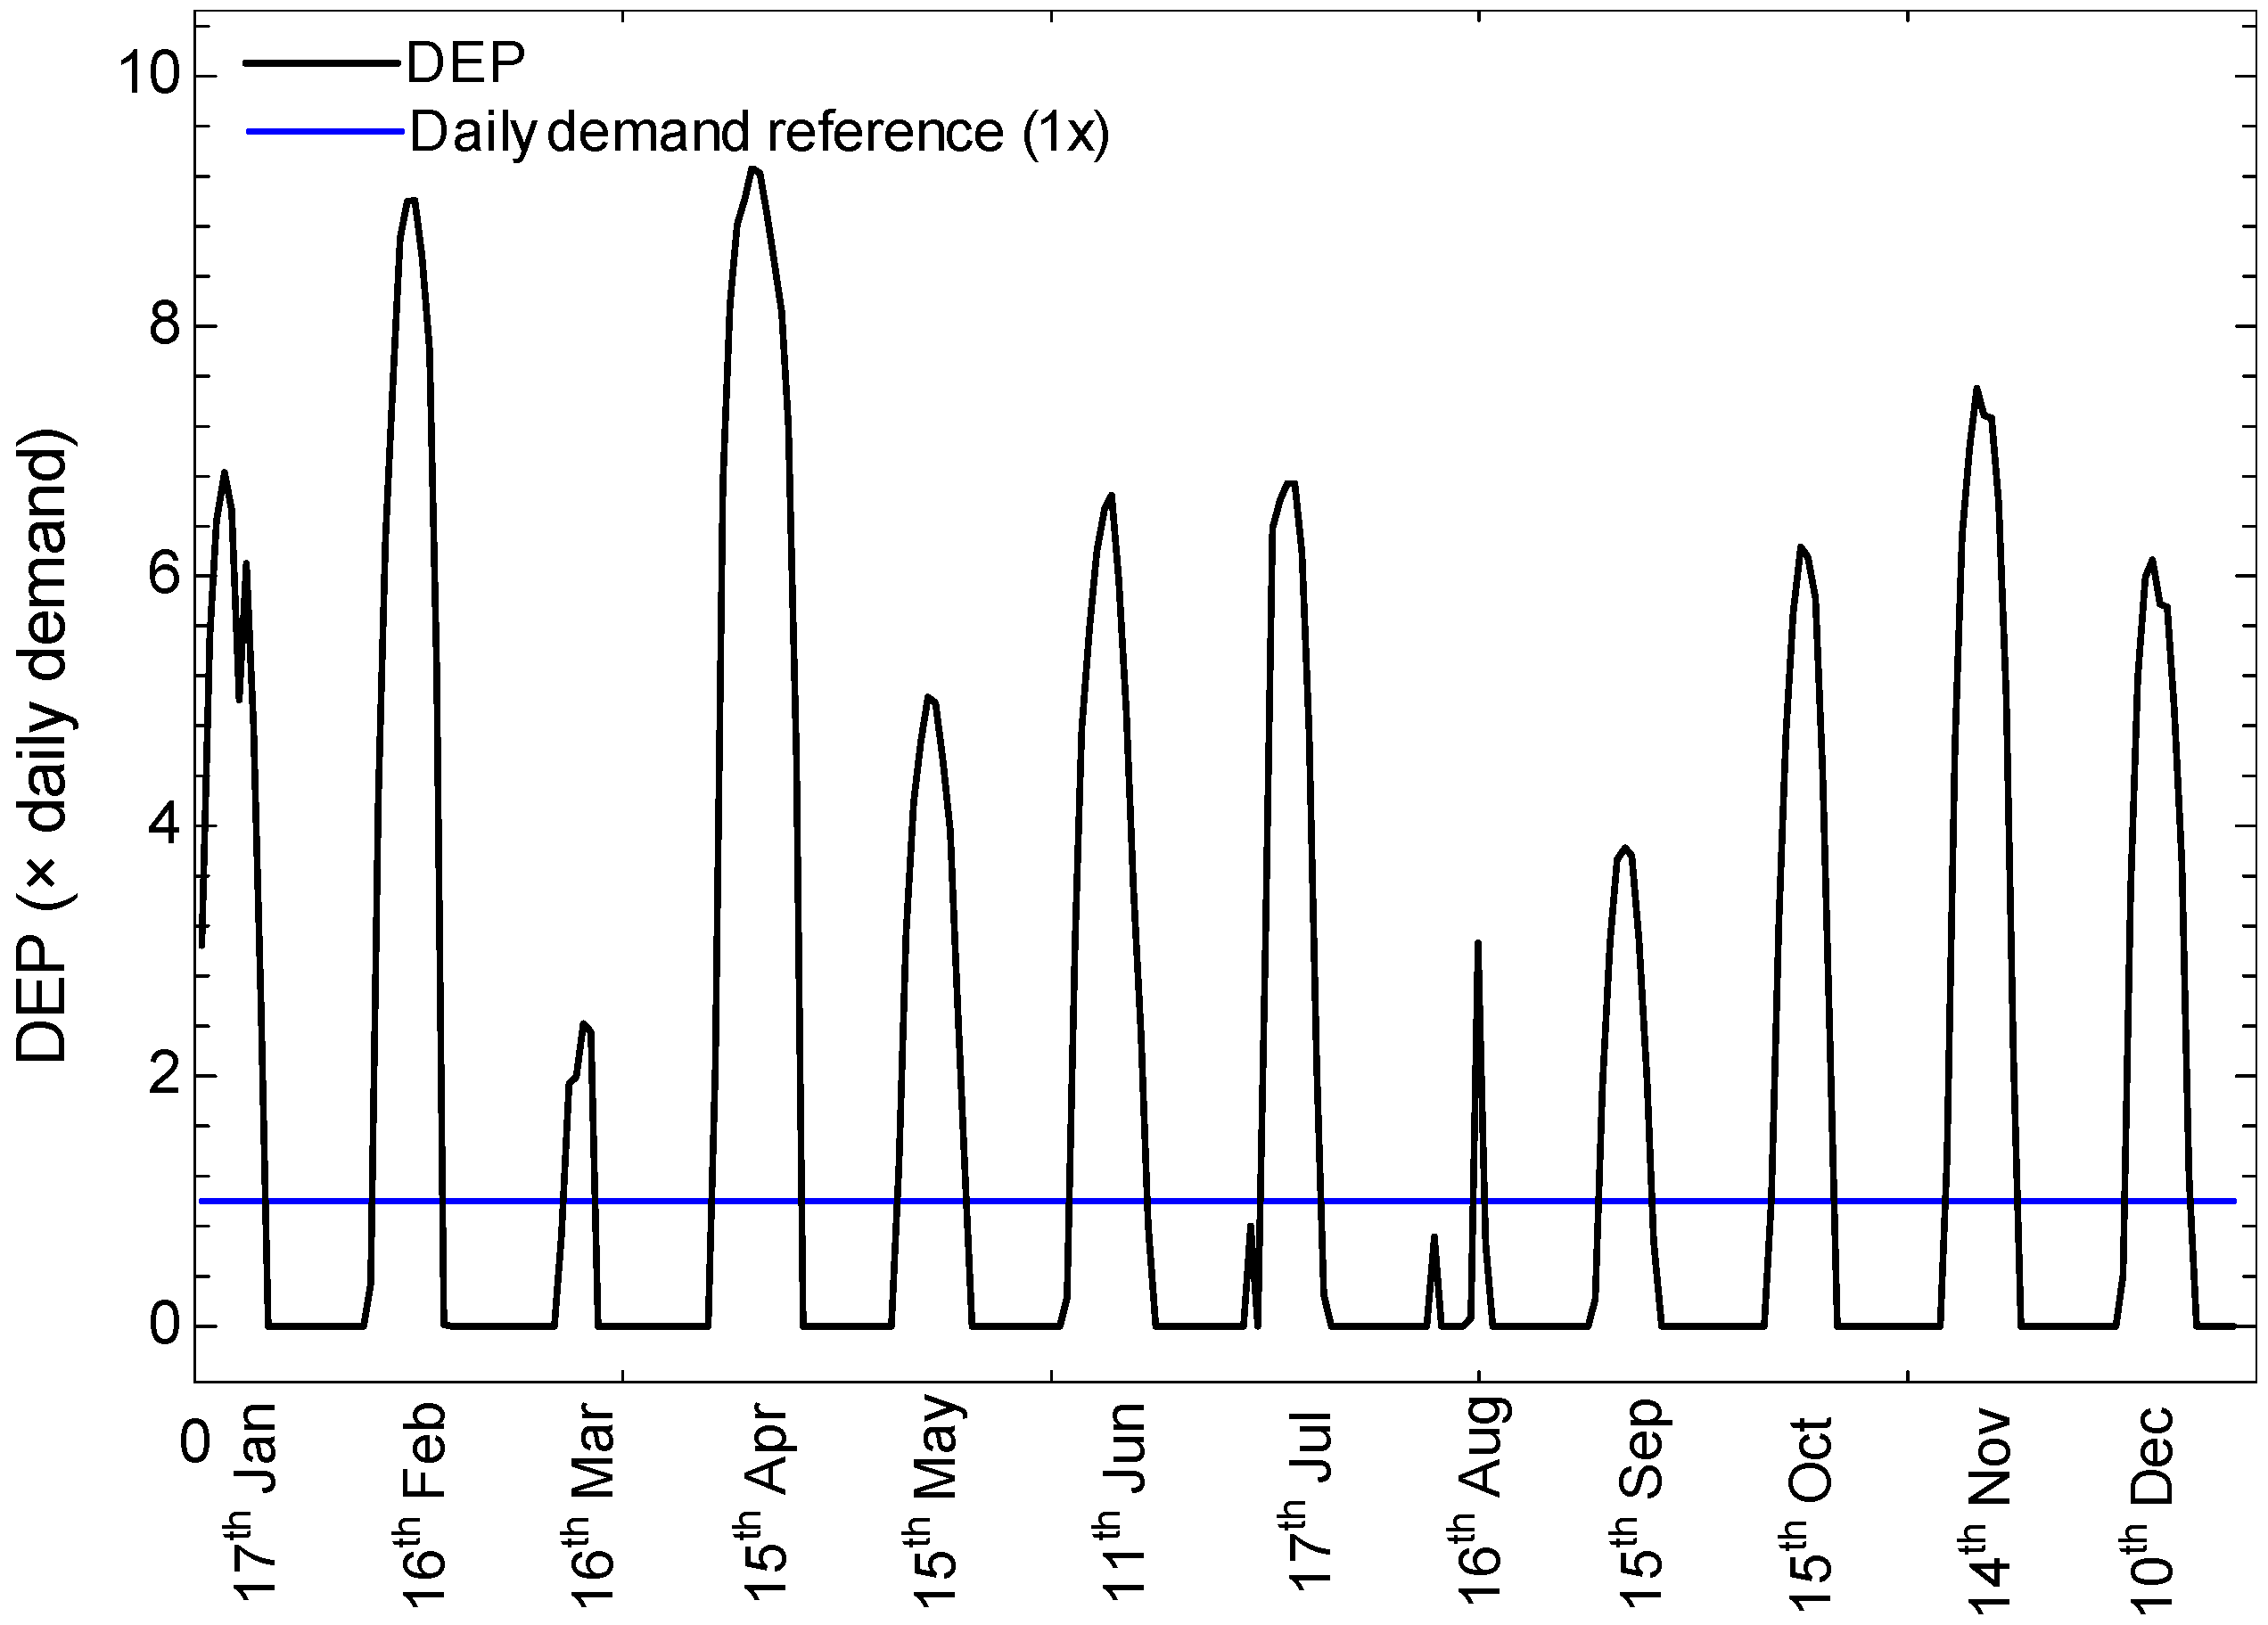
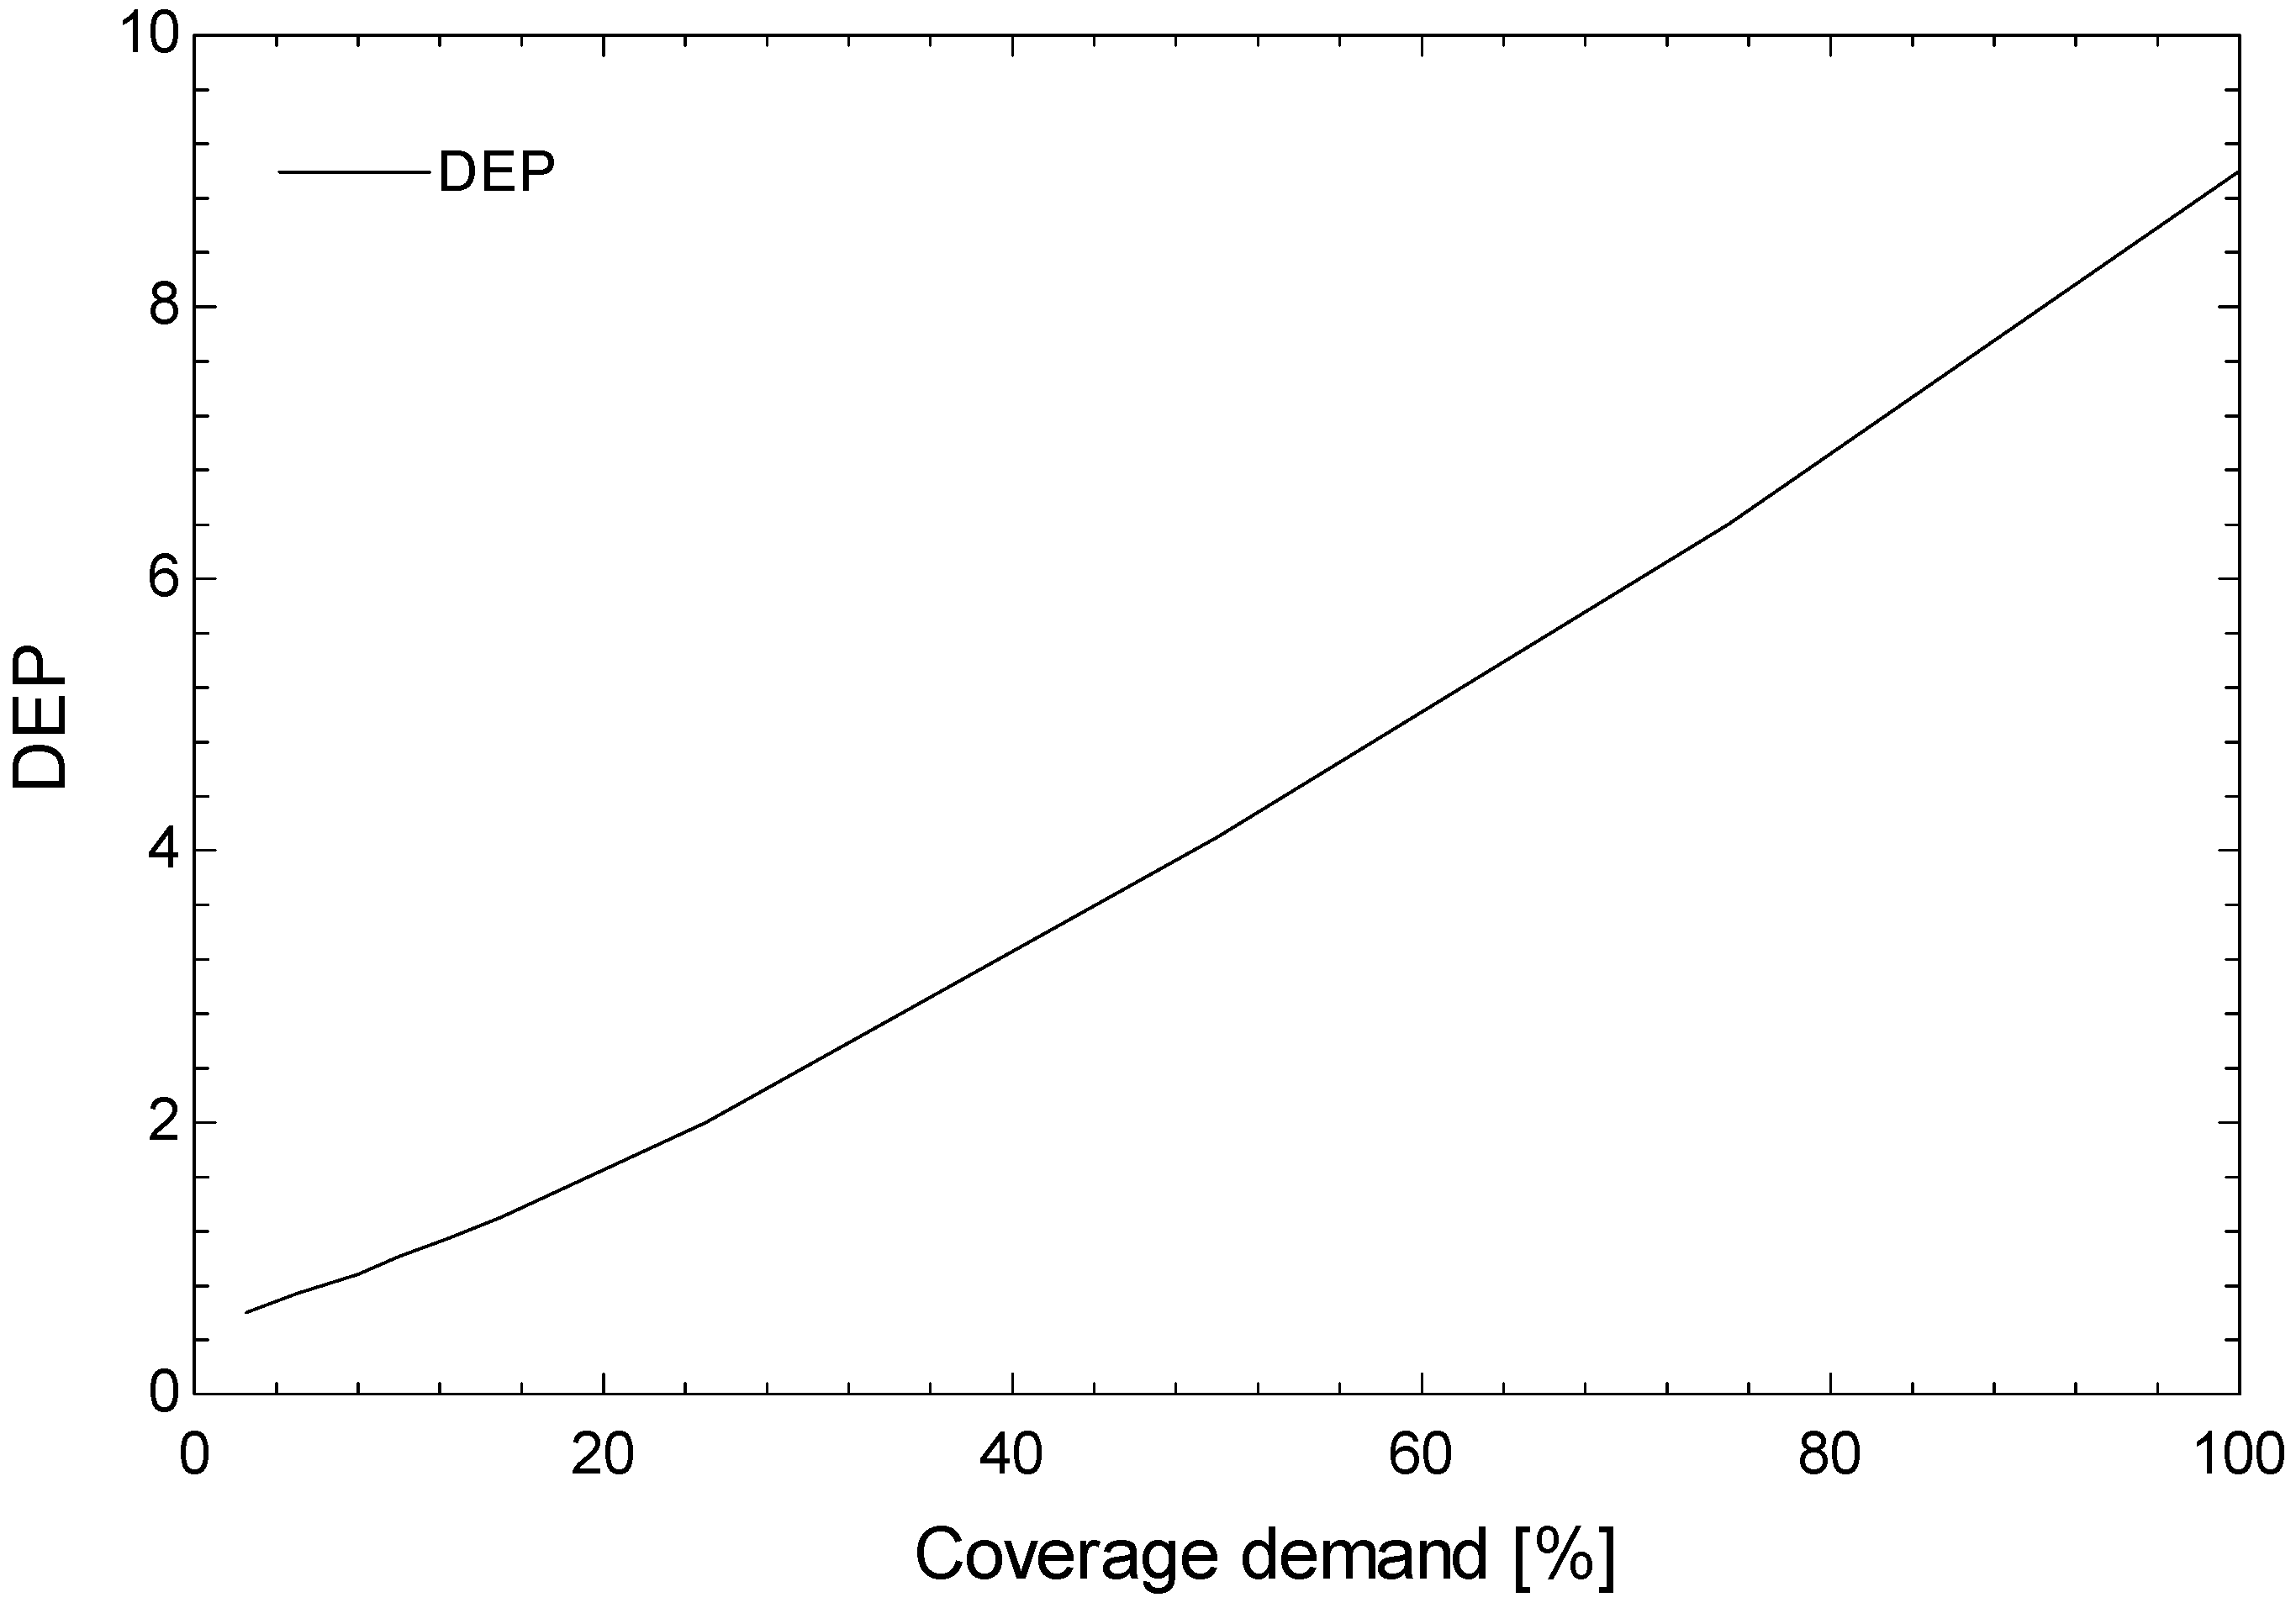
Figure 11 and Figure 12 compare the deliverable energy potential (DEP) with the delivered process demand for the 12 representative days. DEP is plotted as a multiple of the daily demand (1× reference) and represents the surplus energy that must be available/accumulated in storage to maintain dispatchable heat during non-solar hours and short low-DNI intervals. Accordingly, DEP varies across the representative days and seasons, as shown in Figure 11 and Figure 12. For a 25% coverage case, the stored energy can reach nearly 2 times of the total demand on high-radiation days. This oversizing requirement contributes directly to the higher cost of solar heat, since additional collectors and storage modules are needed to harvest and store this excess energy. As the solar fraction increases, this effect becomes even more pronounced. For instance, at 100% demand coverage, the system must accumulate nearly 9 times of the demand to compensate for cloudy and night periods, as further illustrated in Figure 12.
The system’s ability to maintain dispatchability depends on the selected demand coverage. For 25% coverage, the storage requirement can reach nearly ~2× of the daily demand on high-irradiance representative days (Figure 11), whereas full coverage (100%) can require up to ~9× on specific representative days to ensure continuous supply (Figure 12). This relationship is generalized in Figure 13, which presents the maximum DEP across all coverage percentages based on simulations for the Makkah weather conditions. Importantly, these high DEP values are only required on specific representative days of certain months, such as 16 February and 15 April (Figure 11 and Figure 12). Consequently, some storage modules allocated for these extreme cases could be reutilized or repurposed during other periods, reducing effective system oversizing and associated cost. From an economic perspective, such strategies can mitigate the increase in LCOH at higher coverage fractions while maintaining dispatchability.

5.2.5. Effect of Heat Transfer Fluid Type

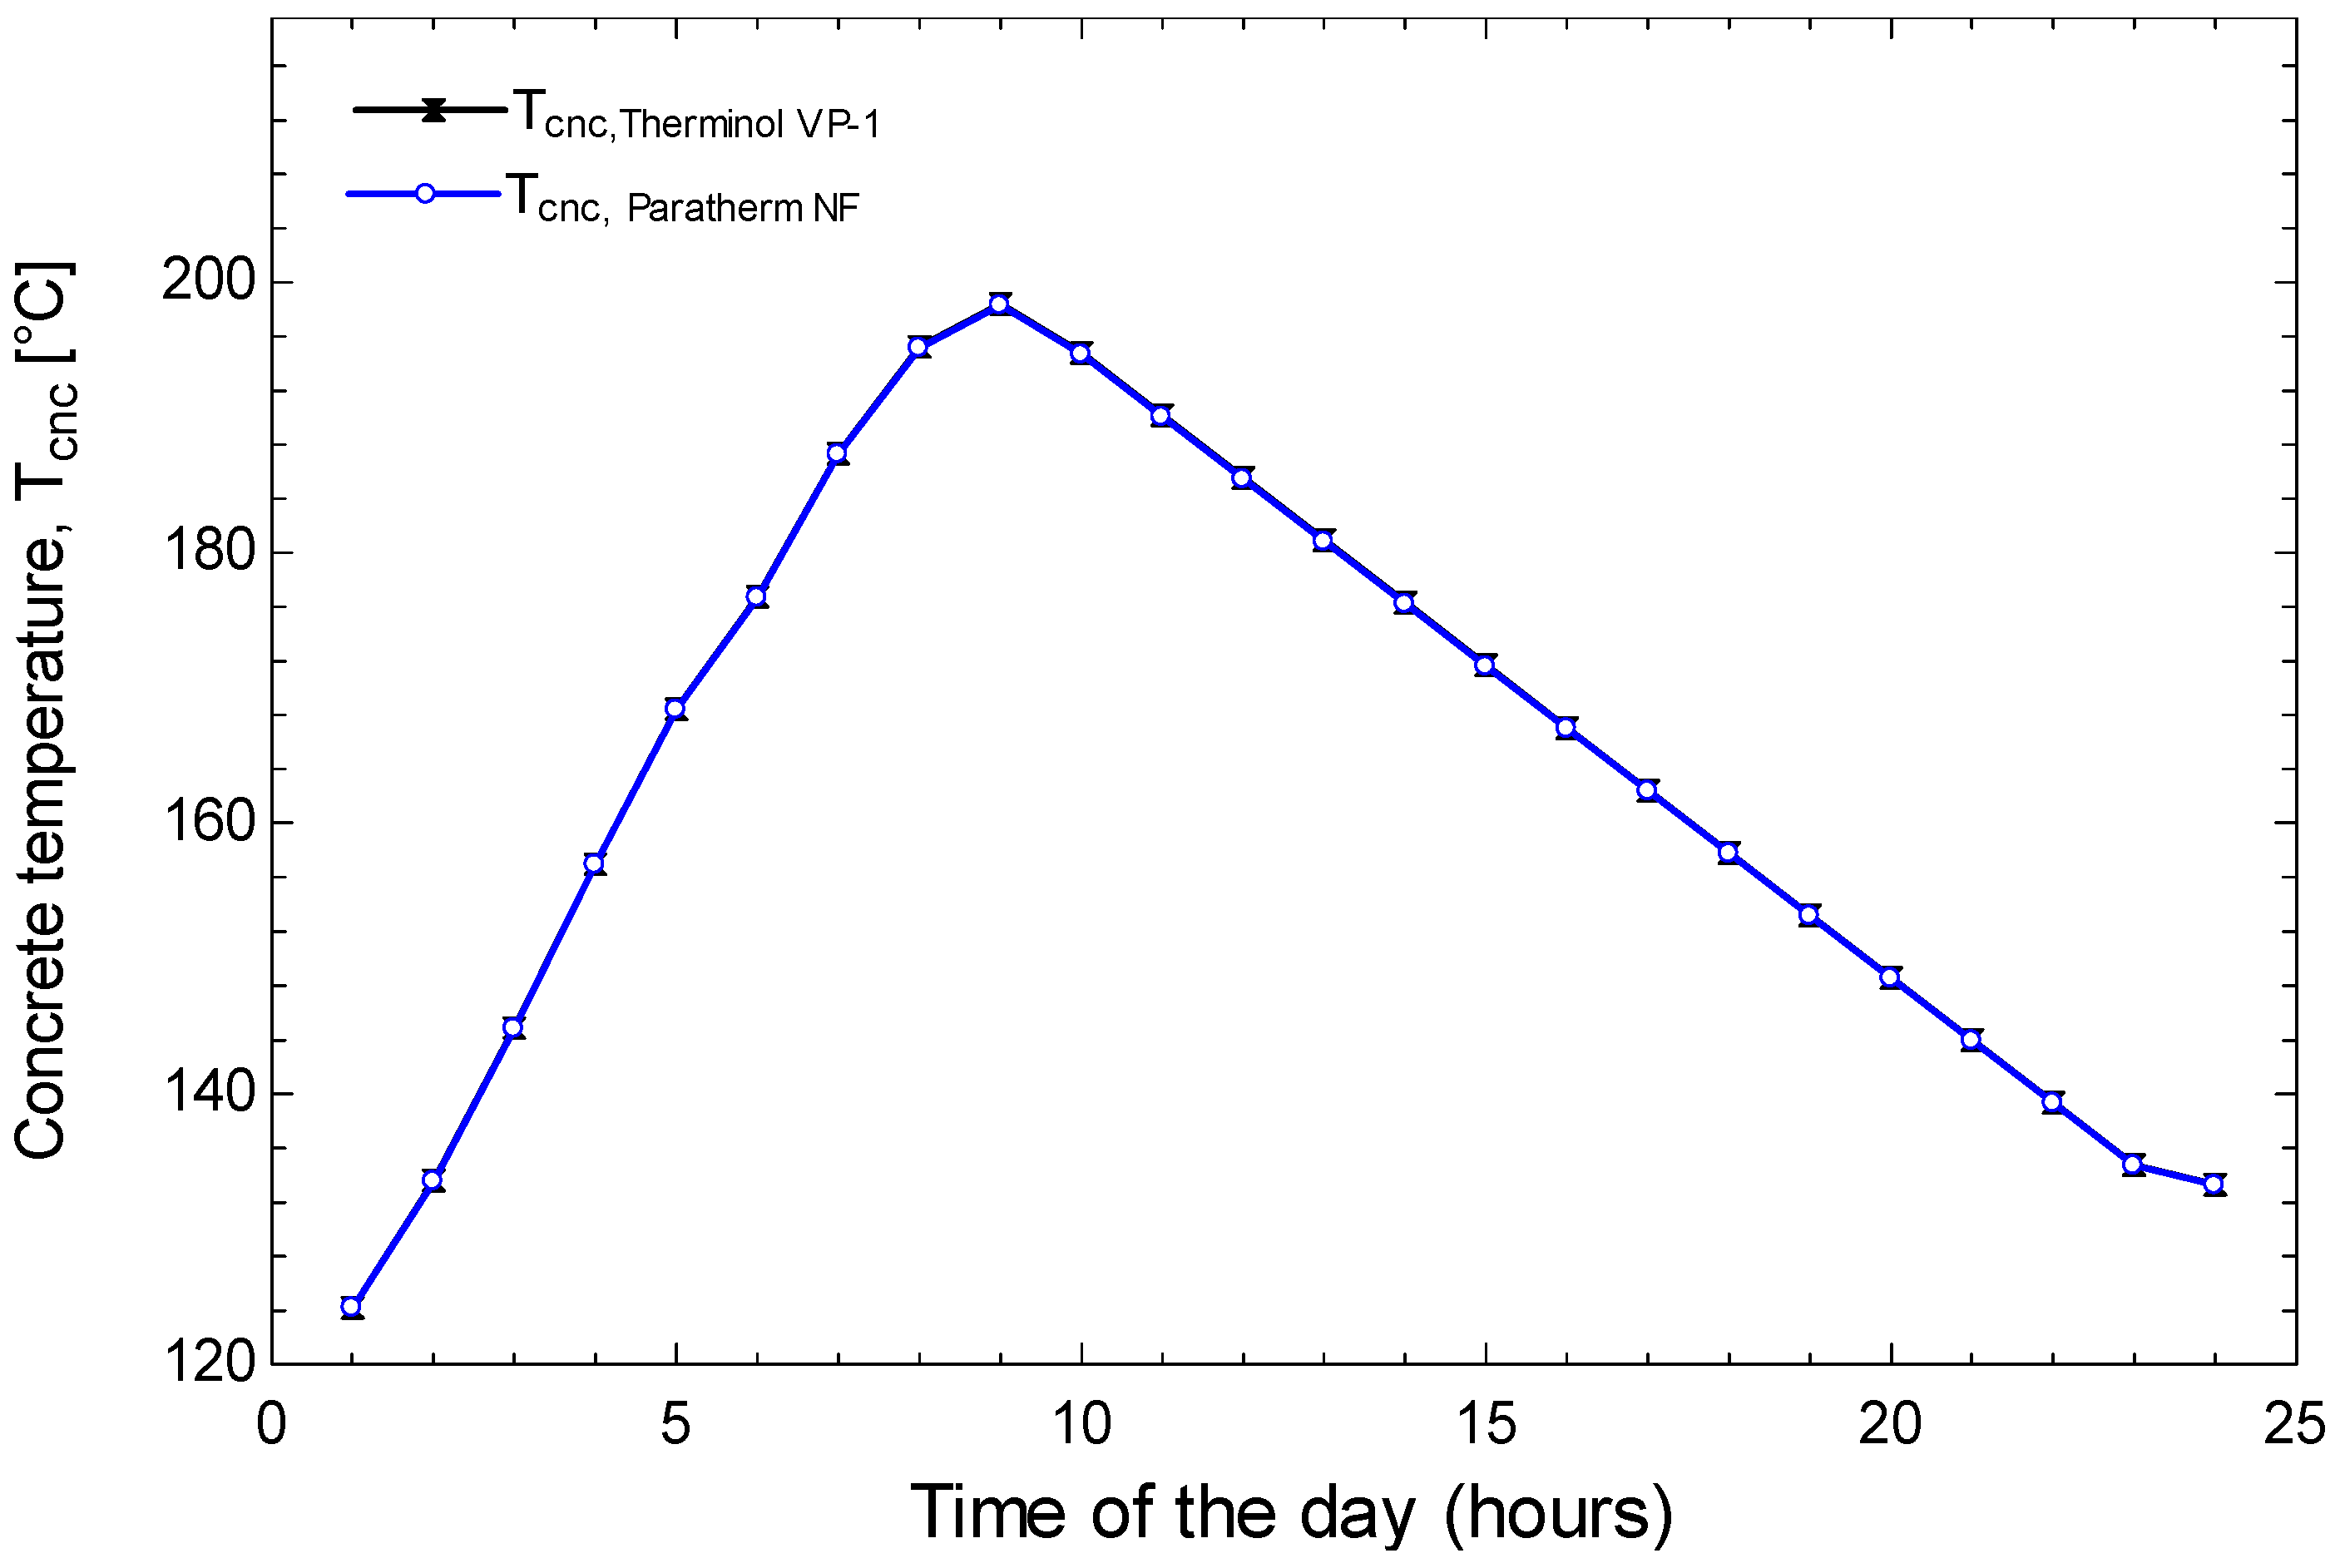
Figure 14 shows the daily variation in the C-TES concrete temperature when charged and discharged using Therminol VP-1 and Paratherm NF. The two fluids exhibit nearly identical temperature profiles, with both increasing from approximately 125 °C in the morning to peaks close to 195–198 °C around midday, followed by a gradual decrease during the discharge phase. This close agreement indicates that, under the simulated conditions, the thermo-physical properties of the two fluids result in very similar heat transfer behavior.

5.2.6. Effect of Insulation Thickness on Temperature and Performance

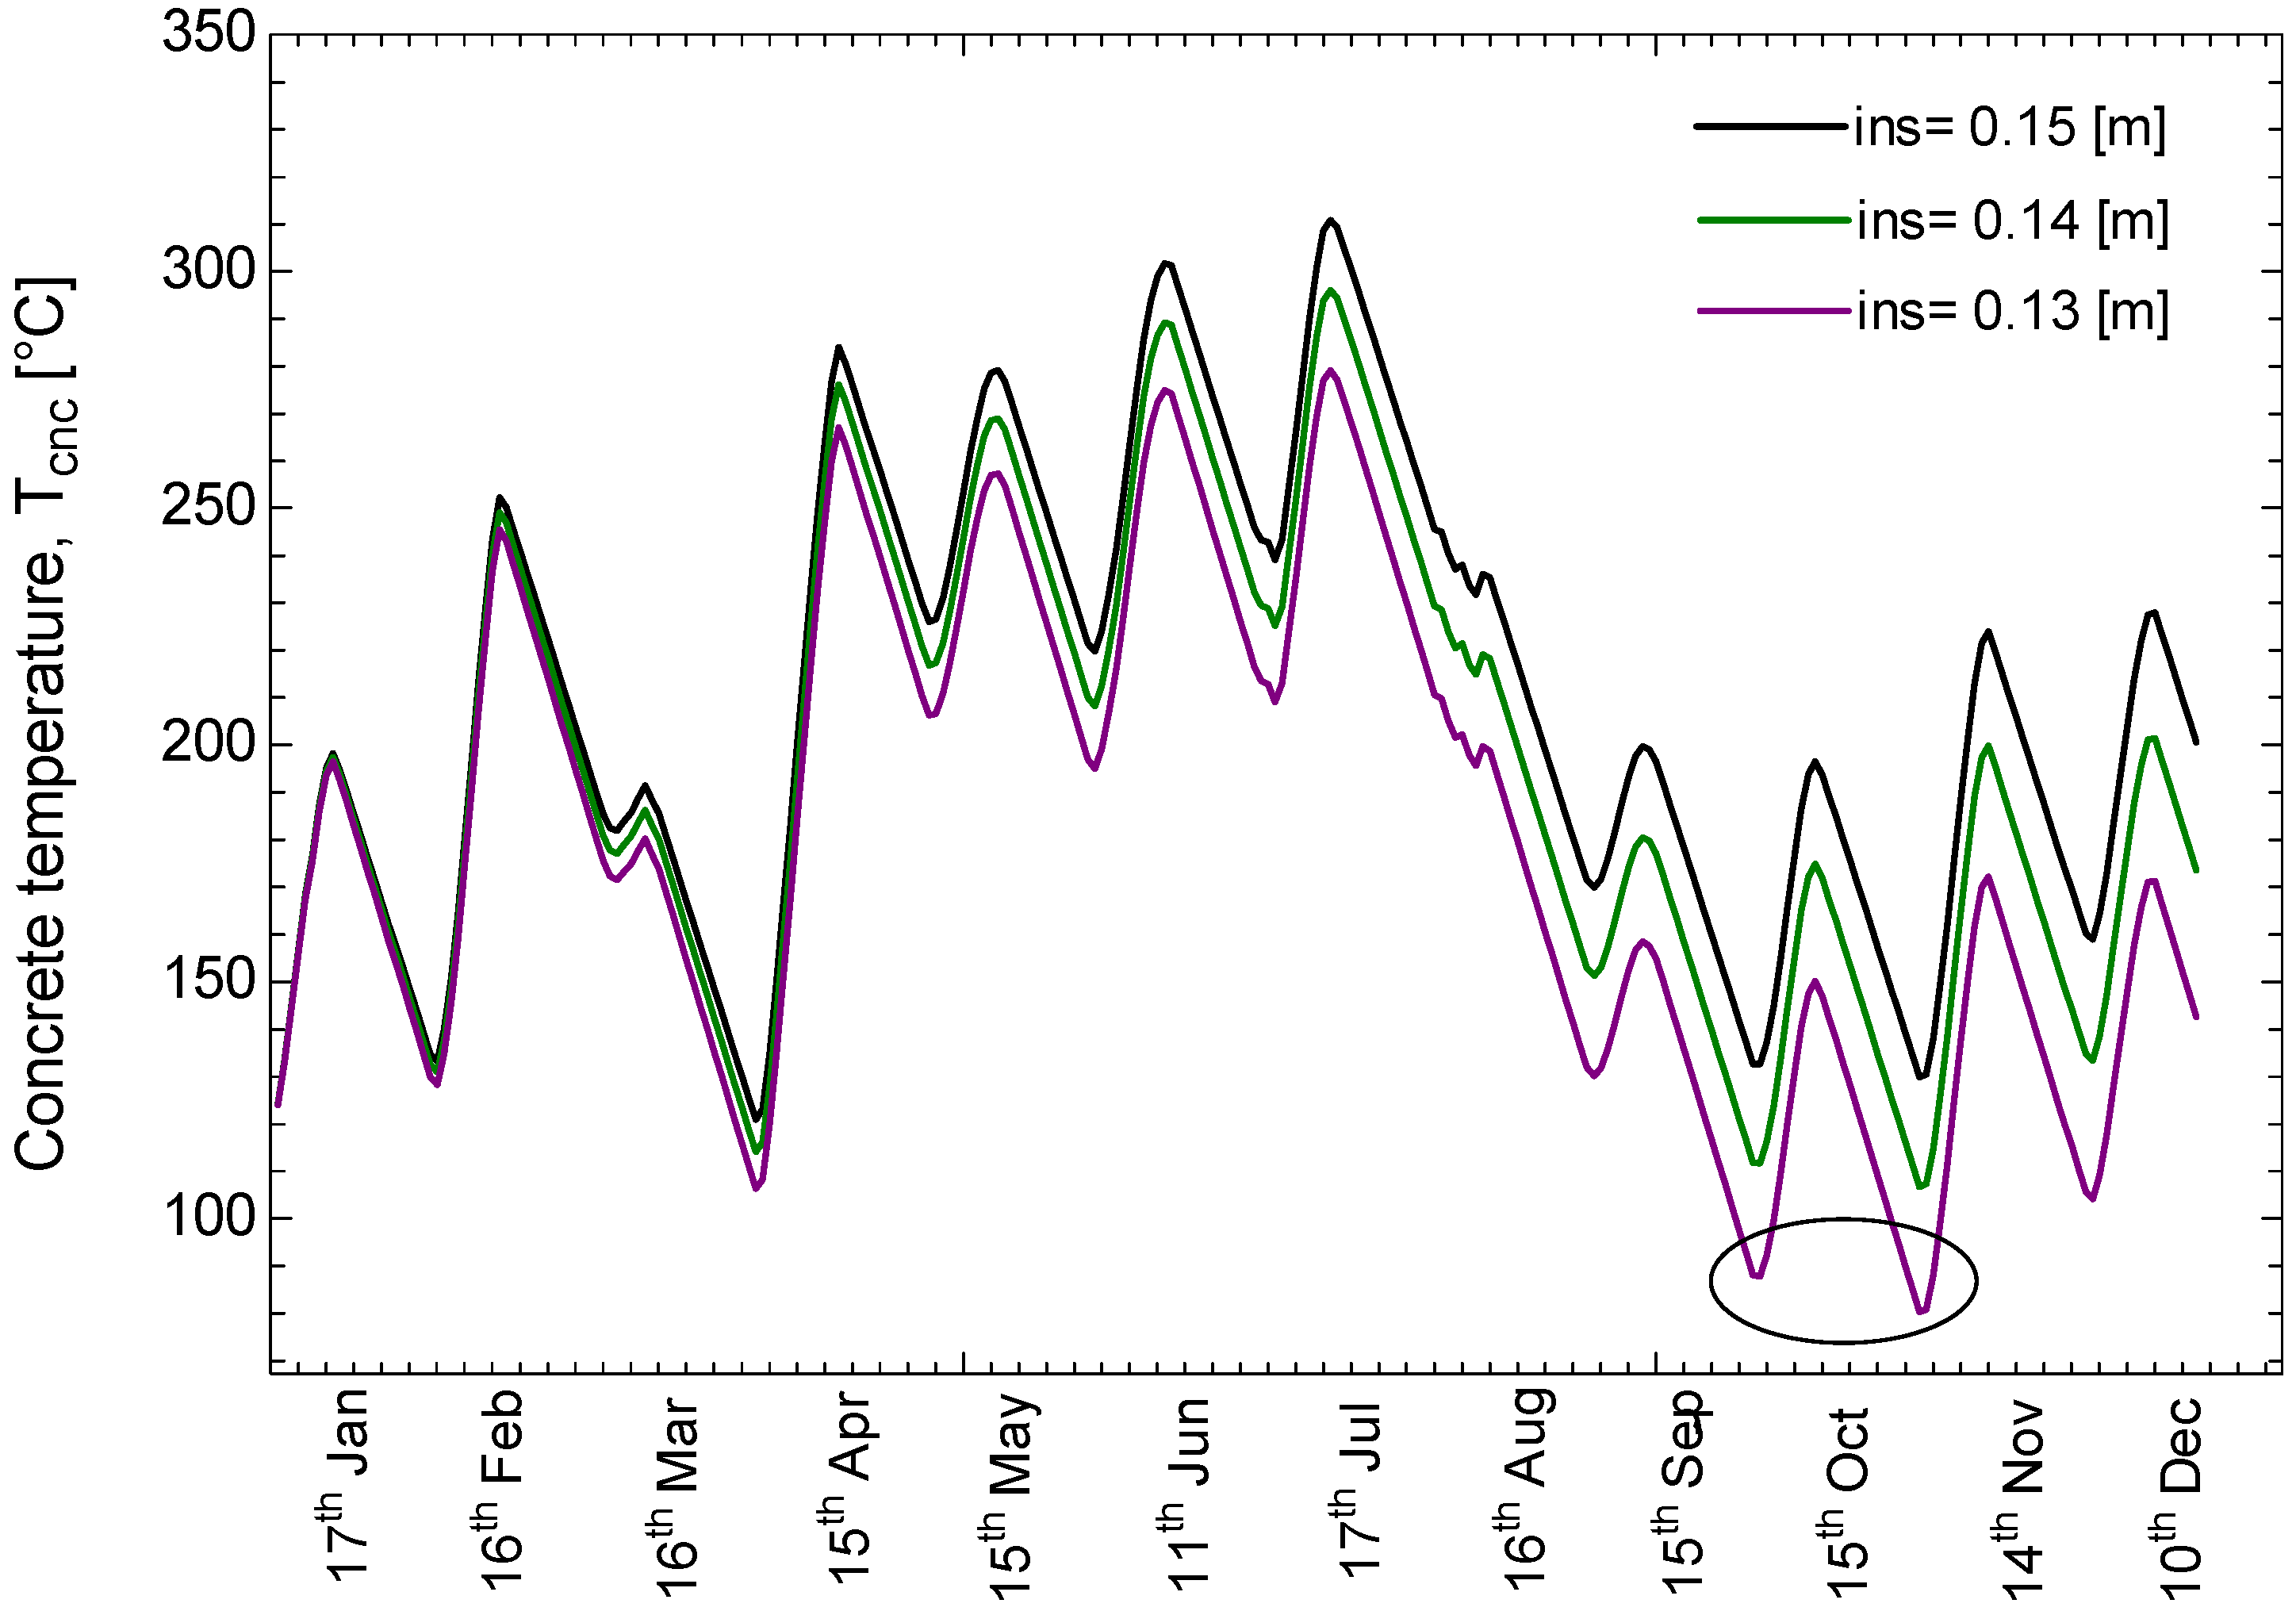
Insulation materials play an important role in thermal storage by reducing heat losses. Generally, increasing the insulation thickness reduces heat losses. The effect of the insulation thickness during the 12-day operation is shown in Figure 15. This influence is not clearly visible in the first few days, but becomes more apparent toward the end of the period, where variations in the concrete temperature occur. In particular, the case with a 0.13 m insulation thickness led to a decrease below the lower design temperature (100 °C) during the days in September and October. In other words, this effect would not appear if the simulation were conducted for only a single day, but becomes evident under extended operation. Thicknesses of 0.14 m and 0.15 m are sufficient to maintain the concrete temperature above the design threshold throughout the cycle.
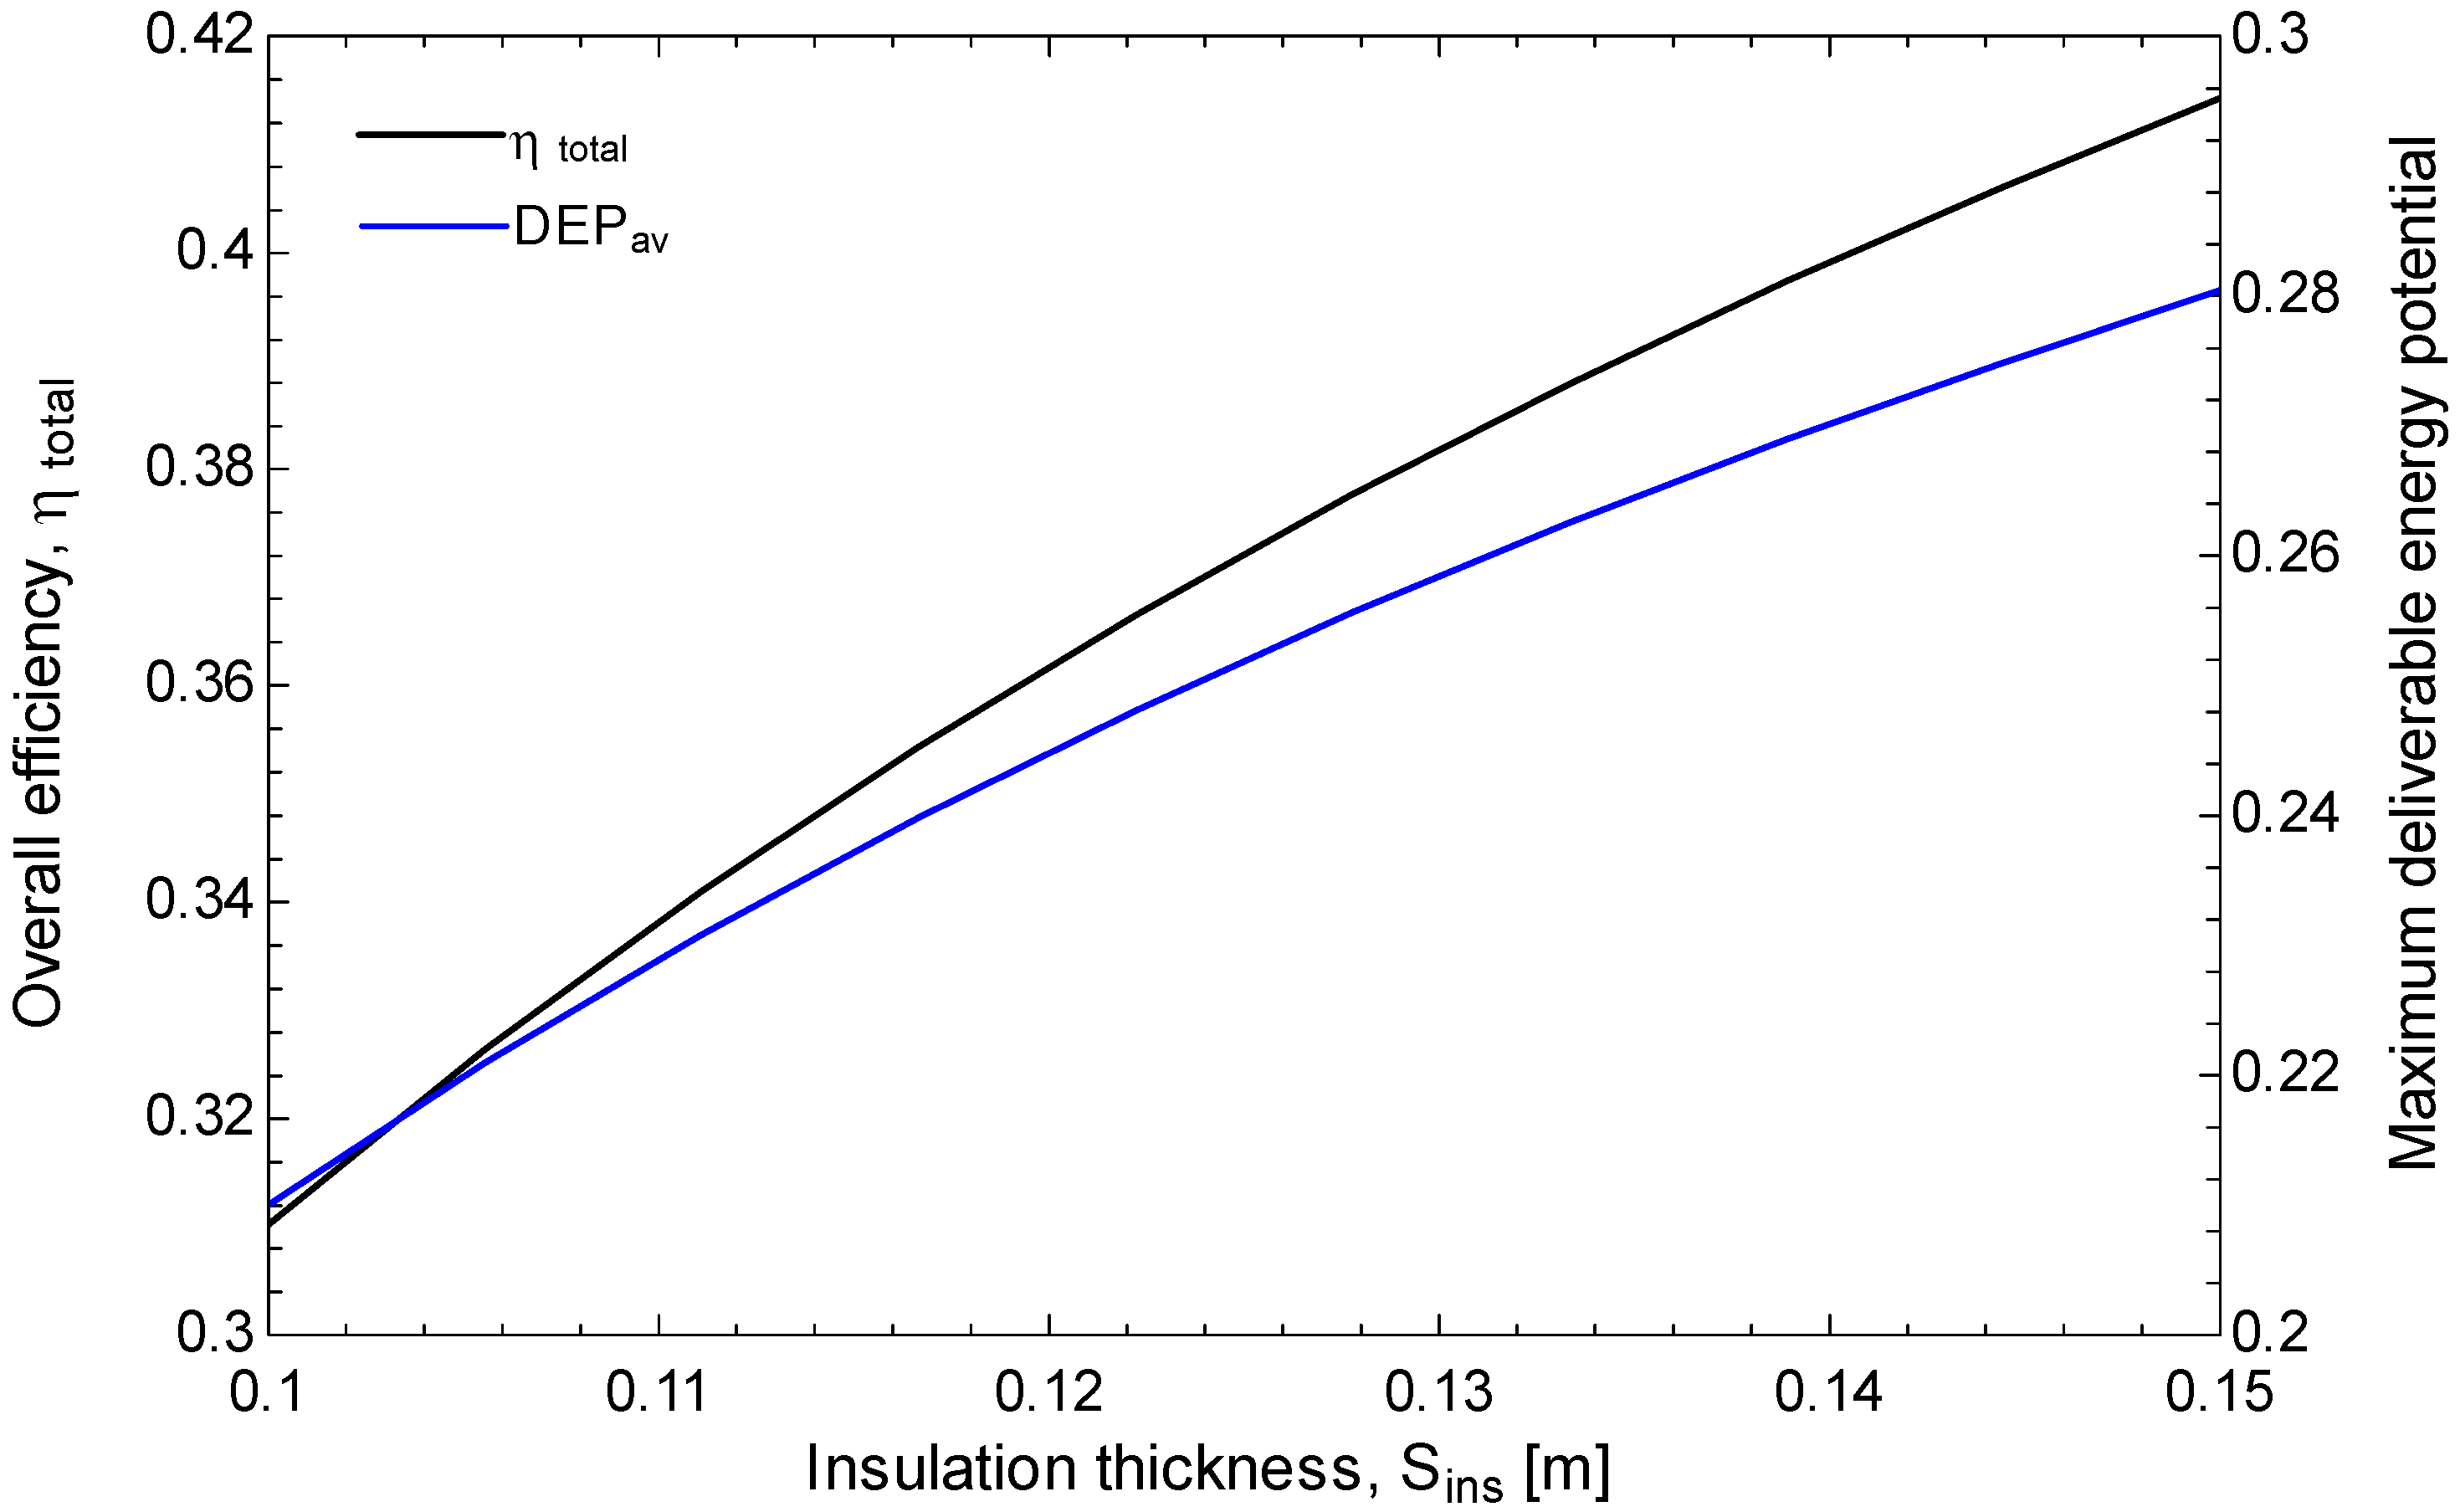
The influences of insulation thickness on both overall efficiency and the maximum deliverable energy potential (DEP) are shown in Figure 16. As the thickness increases from 0.10 m to 0.15 m, thermal losses are reduced, leading to higher system performance. Overall efficiency improves from approximately 31% to 41%, while the DEP increases from about 21% to 28% in normalized units.

5.2.7. Effect of Mirror Reflectivity on Performance and LCOH

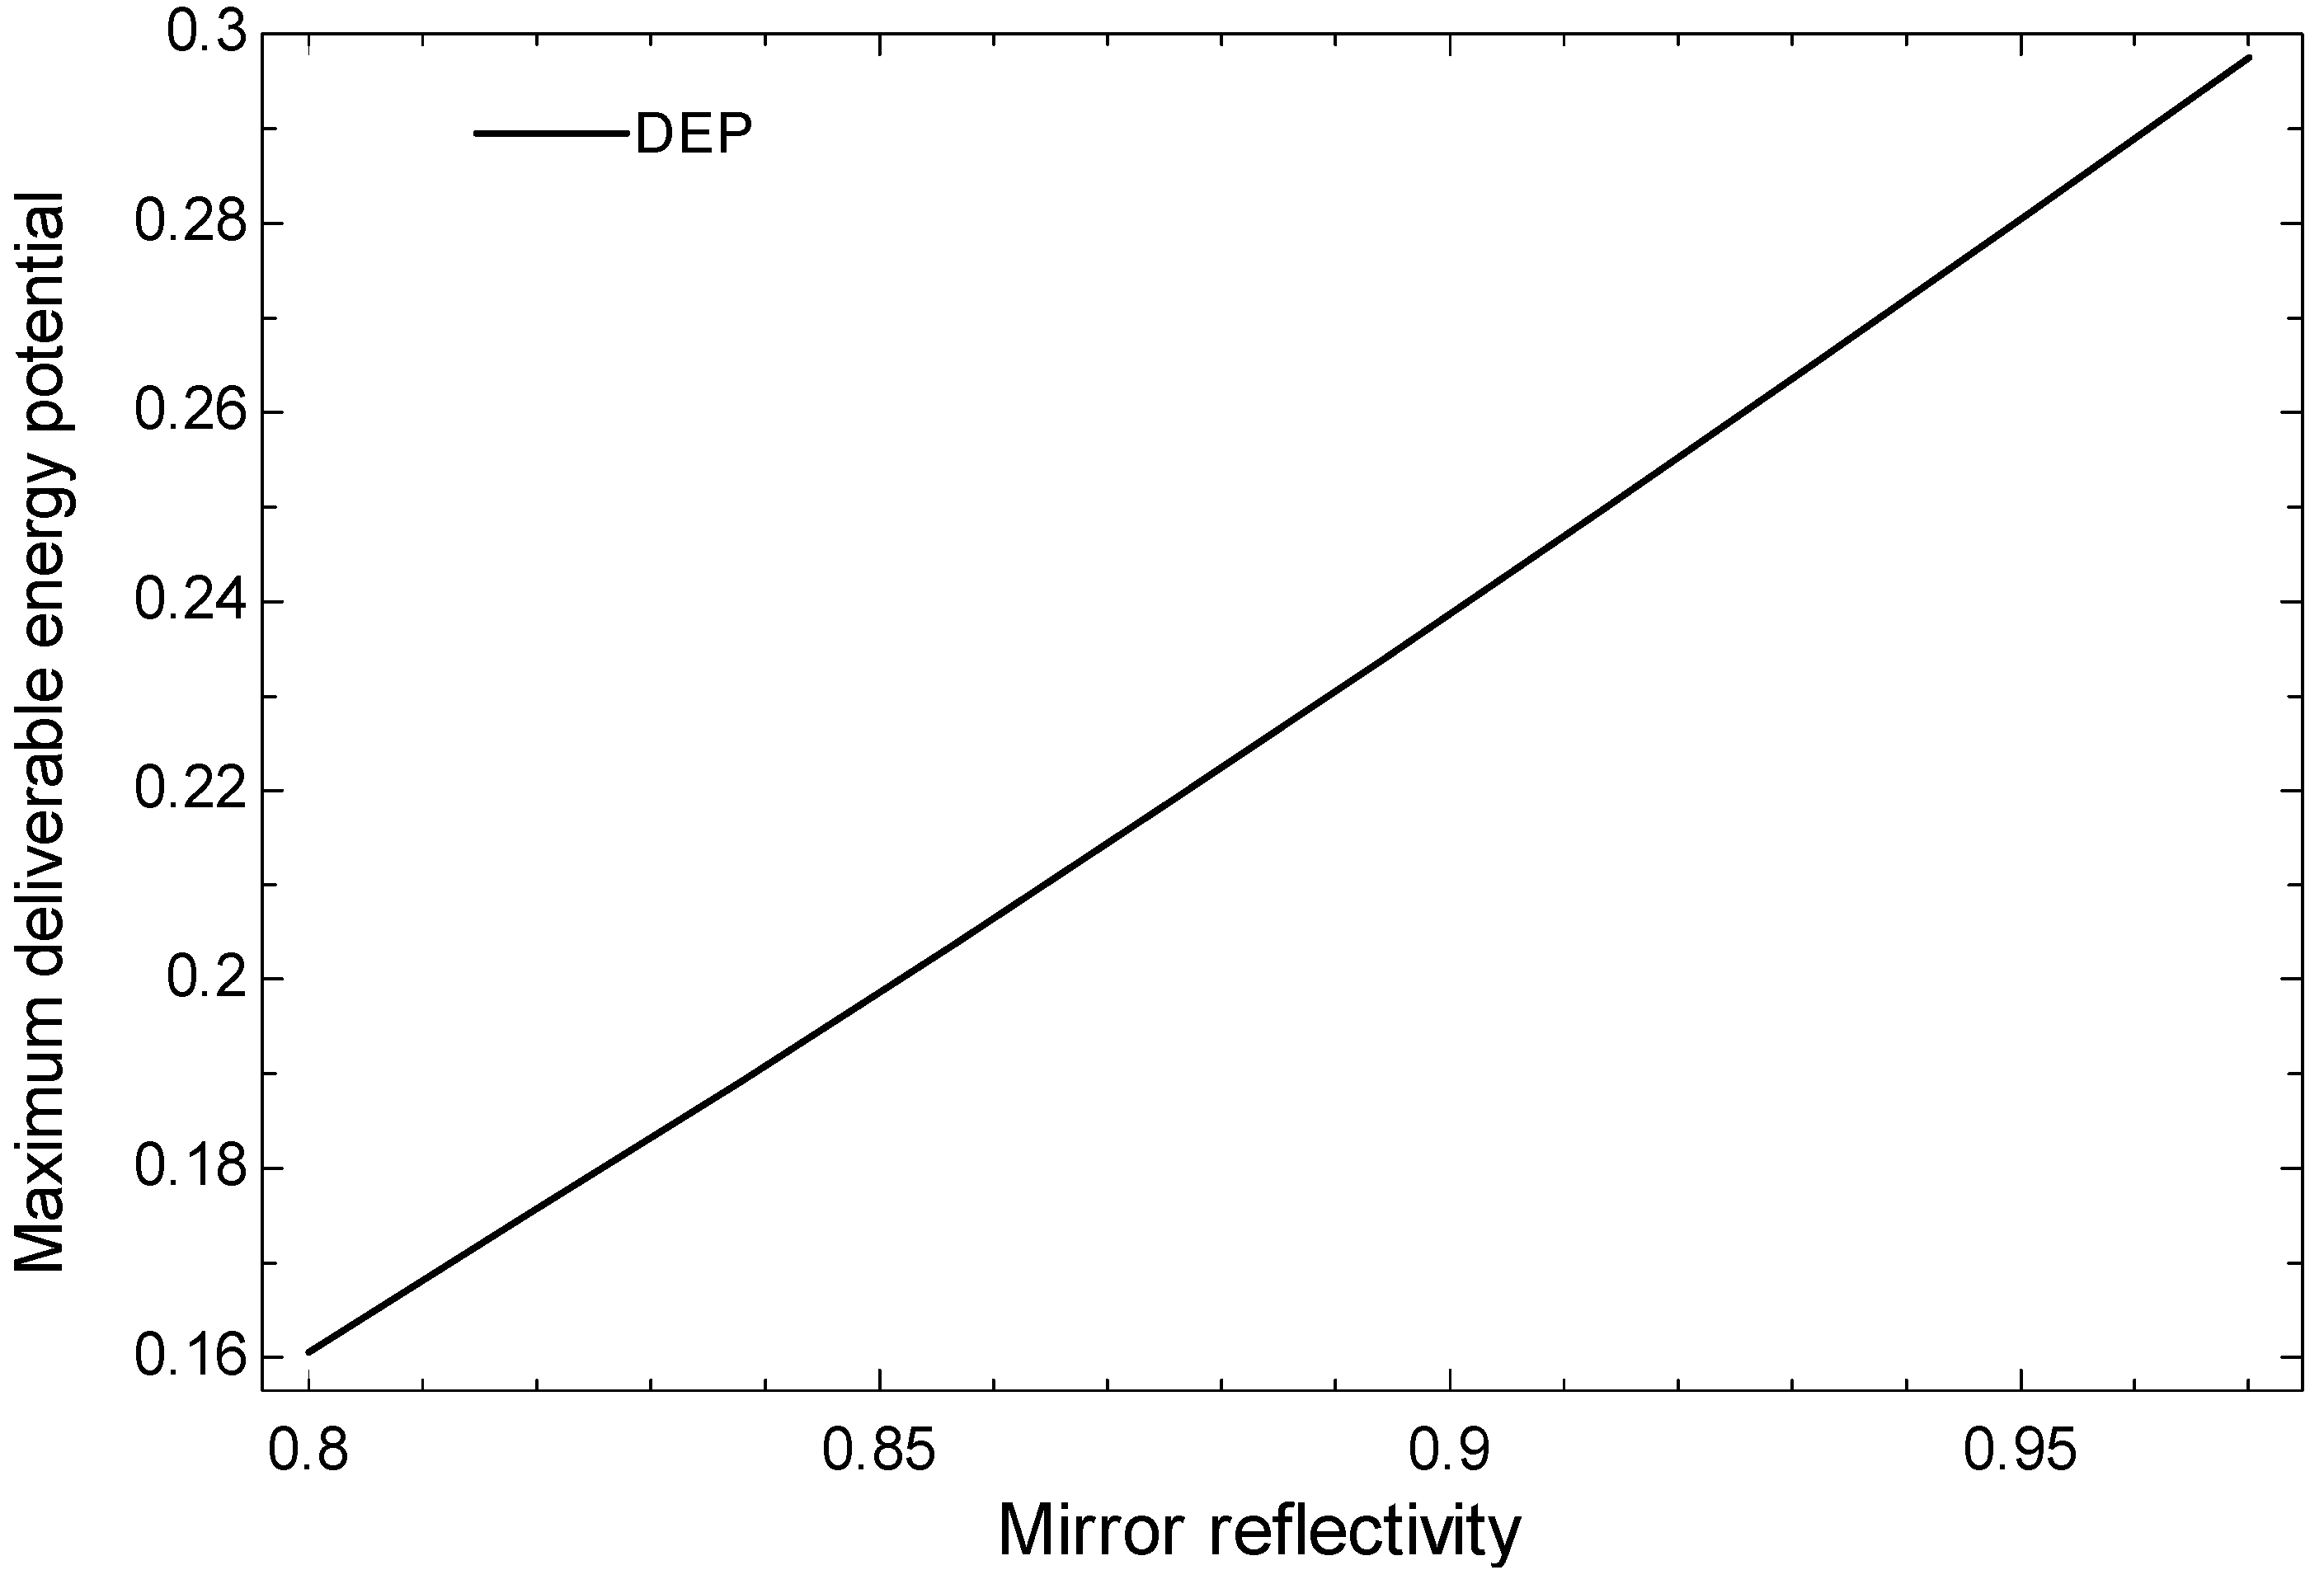
Figure 17 illustrates the influence of PTC mirror reflectivity on the maximum DEP. As expected, the DEP increases almost linearly with reflectivity since higher reflectance directly increases the fraction of incident solar radiation concentrated onto the receiver. When reflectivity is reduced from 0.95 to 0.80, the DEP decreases by nearly 43%, indicating a strong sensitivity of system performance to optical parameters.
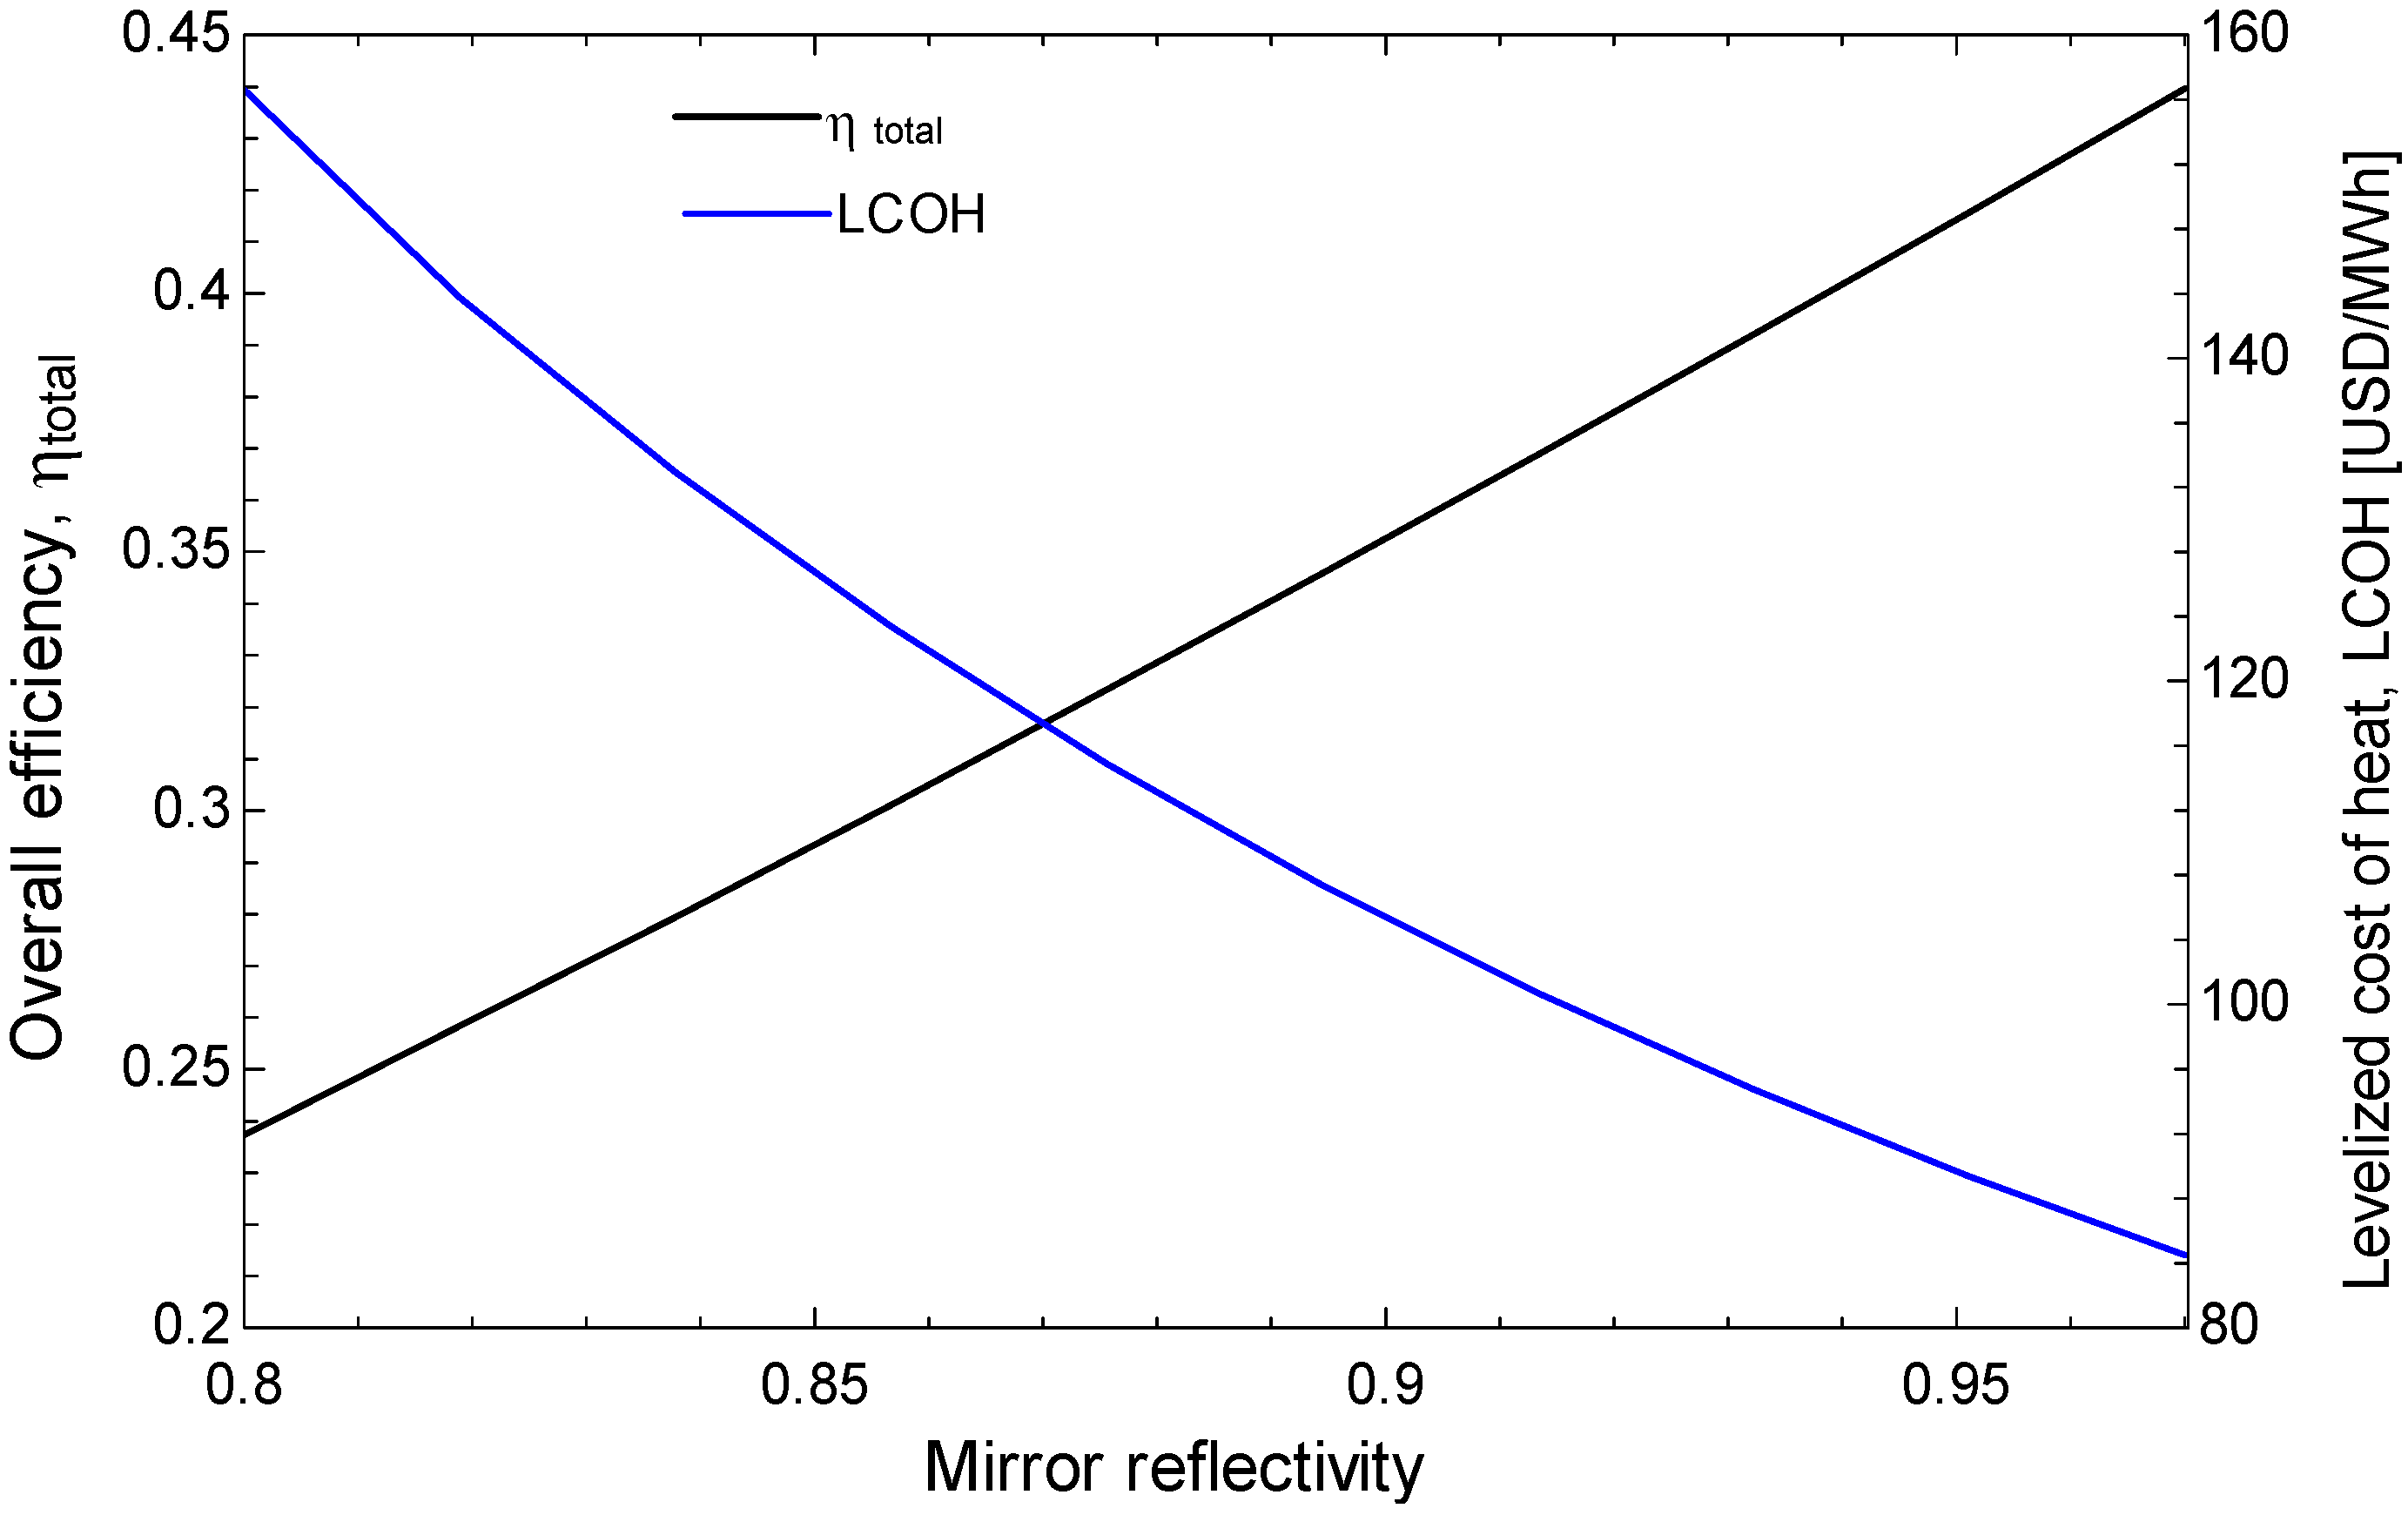
The effects of PTC mirror reflectivity on overall efficiency and the LCOH are presented in Figure 18. The results reveal opposite trends: as reflectivity improves, overall efficiency increases steadily while the LCOH decreases. When reflectivity is reduced from 0.95 to 0.80, the overall efficiency drops from approximately 0.42 to 0.23, while the LCOH increases sharply from approximately 85 USD/MWh to nearly 155 USD/MWh. This analysis highlights the critical role of optical performance in determining both the technical and economic outcomes of the PTC-C-TES system. Small reductions in mirror reflectivity, caused by dust accumulation, aging, or insufficient cleaning, can significantly reduce useful energy delivery while increasing the cost. Conversely, maintaining reflectivity above 0.9 ensures high system efficiency and keeps the LCOH within competitive ranges. Comparable results are also reported in the literature, where the LCOH of PTC systems has been found to vary between 55 and 142 USD/MWh depending on the solar field aperture area and storage volume [9].

5.2.8. Thermal Losses and Operating Control Under Variable DNI

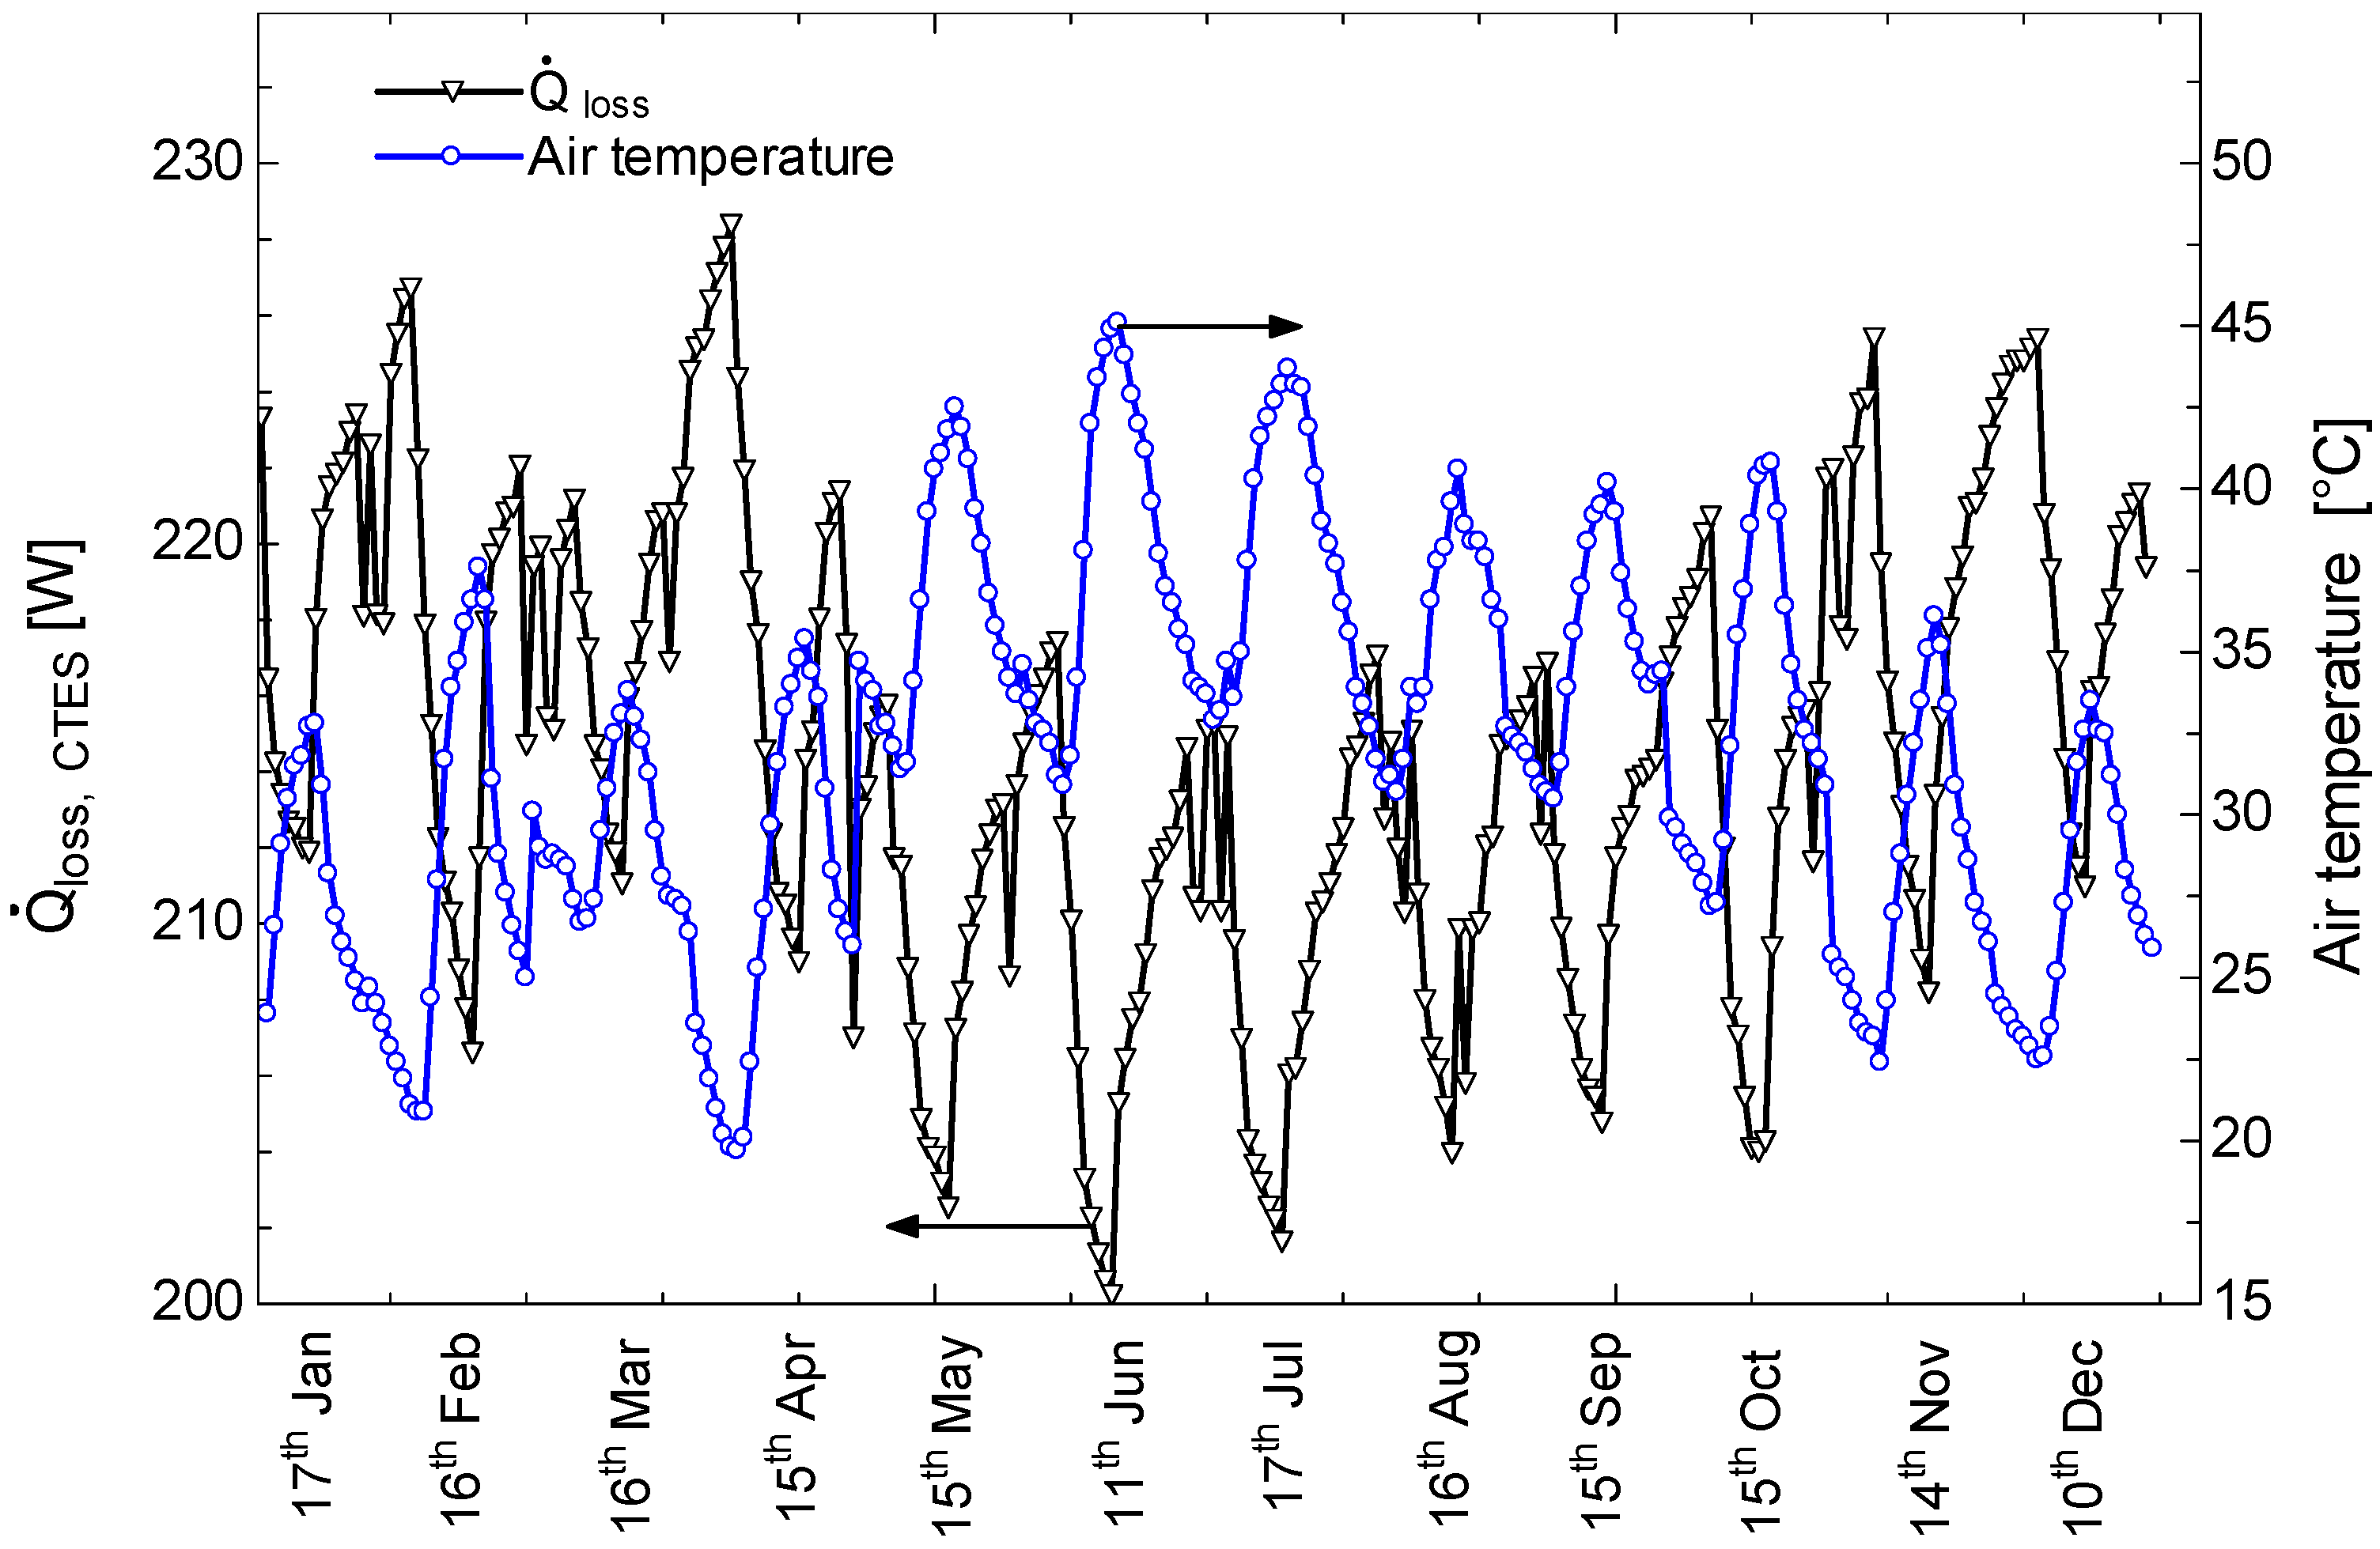
Figure 19 presents the thermal losses of the C-TES module over the representative 12-day simulation period along with the ambient air temperature curve. The results show that heat losses fluctuate within a range of 200–230 W, primarily following variations in ambient temperature. Higher air temperatures during hotter months reduce the temperature gradient between the storage surface and the environment, leading to slightly lower losses. Conversely, during cooler periods, the larger temperature difference results in higher loss values, with peaks above 225 W.
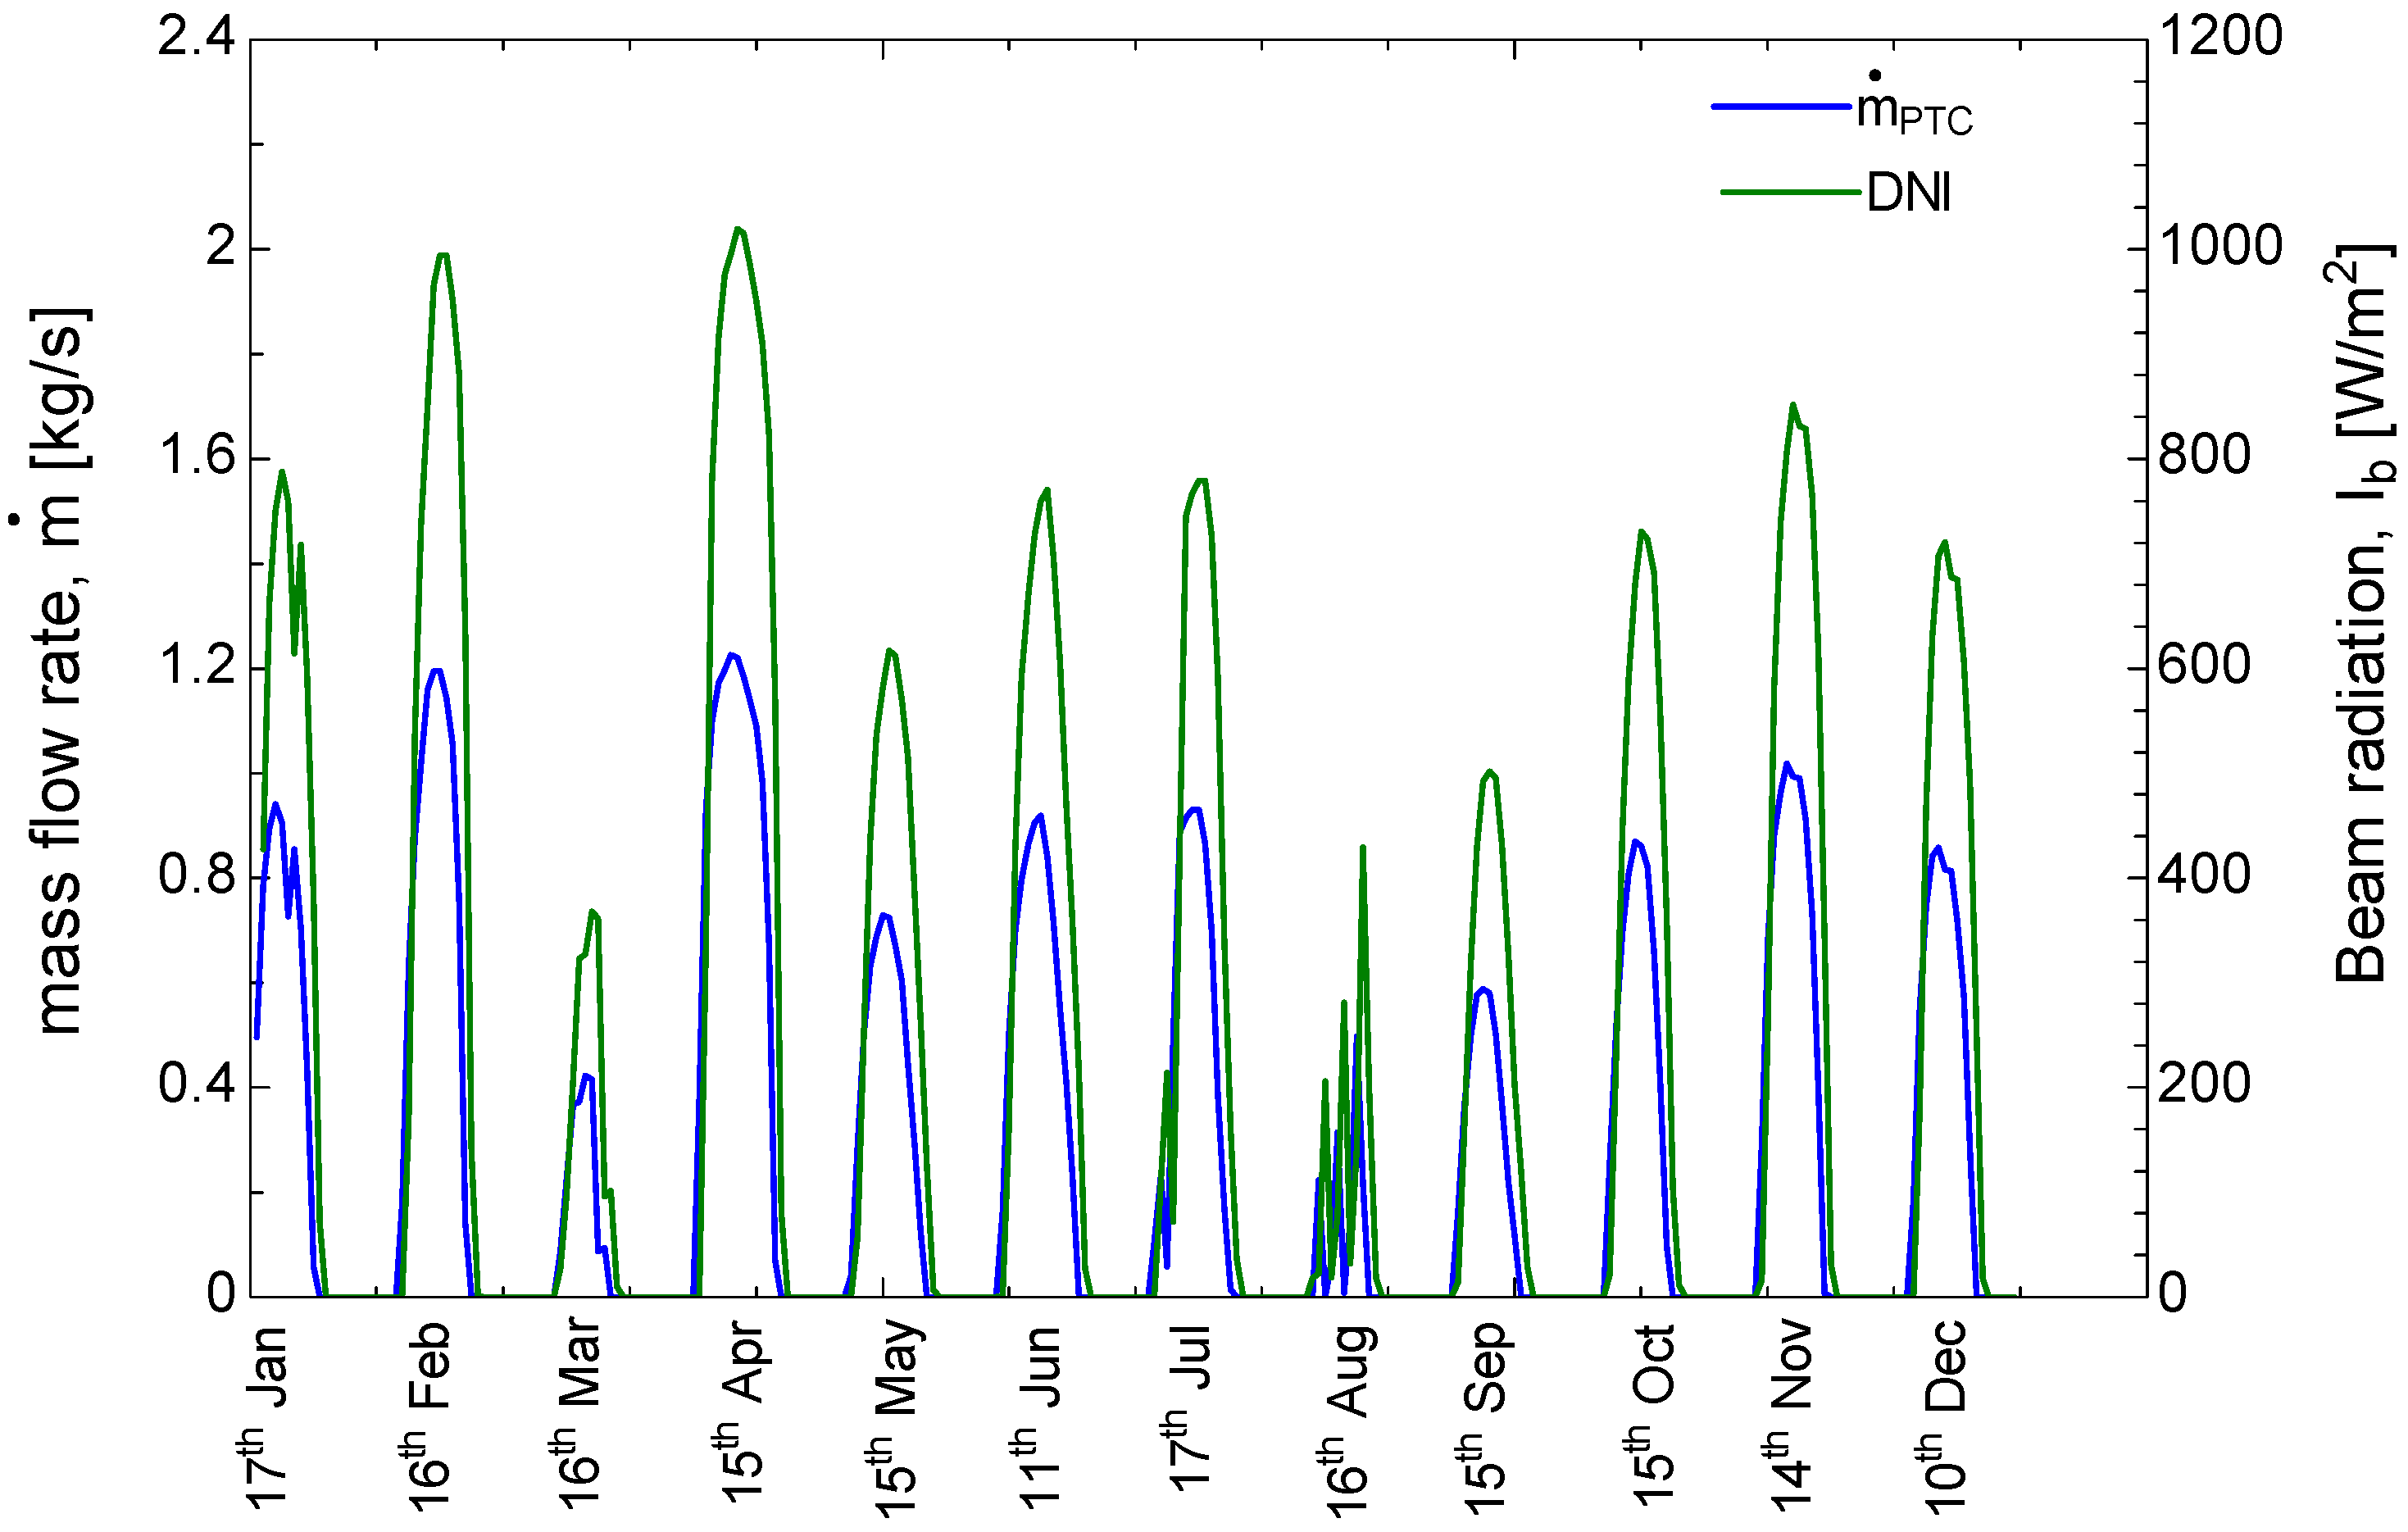
To ensure the delivery of high-grade thermal energy, the PTC field is operated using a variable mass flow rate control strategy. In this configuration, the HTF mass flow rate is continuously modulated in response to fluctuations in direct normal irradiance to maintain a constant design outlet temperature of 400 °C. This operational control, as shown in Figure 20, aimed to prevent HTF over-temperature during peak irradiance, such as 16th Feb, while maximizing thermal capture during periods of lower solar irradiance, such as 16th of Aug, by reducing the flow rate.

6. Conclusions

This work demonstrates the potential of PTC-C-TES integration for SHIP, specifically in the pharmaceutical sector in Saudi Arabia. The system was designed to fulfill 25% of the demand, in other words, to provide continuous heat of 50 kW from 200 kW. The system consists of two main components: the PTC, which includes 16 CF100 units, and the C-TES, which contains 316 modules manufactured by the Italian company Cestaro Srl (Preganziol (Treviso), Italy).
The PTC model was adopted from validated literature, while the C-TES model was validated against both Doretti et al.’s [59] simplified model and experimental data from the Cyprus beverage case study, showing deviations below 2%. Simulations were conducted using Makkah weather data, where 12 representative monthly days were selected. This representative-day framework is used to characterize typical seasonal performance, short-term charging/discharging behavior, and dispatch feasibility under representative conditions. It is not intended to certify worst-case year-round continuity or final oversizing margins under rare/extreme multi-day low-DNI measures, which require an 8760-h (hourly) and ideally multi-year assessment and/or explicit extreme period assessment. The C-TES successfully maintained operating temperatures between 120 °C and 310 °C, while collector outlet temperatures reached up to 400 °C.
The key design parameters were the number of collectors and C-TES modules. Therefore, setting the coverage percentage plays a central role in design. For instance, 100% coverage required 73 collectors and 1600 concrete modules, which are 4.5 and 5 times the values of the 25% coverage case, highlighting the growing requirements toward high coverage percentages. Consequently, the LCOH decreased with increasing coverage until it reached the optimum point of approximately 89.7 USD/MWh at 25% coverage, and then started to increase gradually, reaching 106 USD/MWh. Conversely, the overall efficiency increased to 41% within the 25–50% coverage range and then decreased to 39%. The system’s ability to store surplus energy during peak hours was evaluated using the maximum delivered energy percentage (MDEP). At 25% demand coverage, the required storage capacity reached approximately 2 times the dispatchable energy on 15 April, while full coverage scenarios required storage capacities of nearly 9 times the solar-designed demand.
Moreover, insulation thickness had a noticeable effect on the C-TES temperature and heat losses. While short-term effects were limited, a thickness of 0.13 m led to concrete temperatures falling below 100 °C during October and November, and a 0.05 m reduction in insulation thickness resulted in an efficiency decrease of approximately 10%. The effects of PTC reflectivity were also evaluated: increasing reflectivity from 0.8 to 0.95 raised overall efficiency from 24% to 42% and reduced the LCOH from 156 to 89 USD/MWh.

7. Future Work

Future work will extend the present study through a comprehensive techno-economic analysis based on actual annual heat demand profiles of pharmaceutical manufacturing facilities across the Kingdom of Saudi Arabia (KSA). The proposed model will be applied to a real pharmaceutical manufacturing facility in Riyadh City, where detailed plant operation, circulation logic, and integration with end-use systems will be investigated. The performance and cost-effectiveness of the proposed system will be benchmarked against existing and proven solar-based pharmaceutical plants, enabling a robust comparison under realistic operating conditions. Further research will focus on improving the performance of C-TES by investigating hybrid storage concepts, including the integration of phase change materials (PCMs) and alternative low-cost media such as sand-based thermal storage.
In parallel, a comparative assessment of different solar technologies, including parabolic trough collectors, linear Fresnel systems, photovoltaic (PV)-based solutions, and hybrid configurations, will be conducted to identify optimal system architectures. Advanced optimization algorithms will be employed to improve the overall system performance and minimize cost by optimally sizing and dispatching generation and storage components. Ultimately, this research aims to develop a holistic, integrated energy solution that addresses the full energy profile of pharmaceutical manufacturing, encompassing process heating, cooling, and electricity demand, and represents a long-term pathway toward fully sustainable and low-carbon pharmaceutical production in KSA.
From a practical deployment perspective, the most robust pathway for pharmaceutical utilities is a hybrid configuration: solar thermal (PTC or linear Fresnel) for medium-temperature process heat/steam and hot-water loops, coupled with C-TES for dispatchability, while high-efficiency natural-gas boilers provide backup during low-DNI multi-day periods. In parallel, rooftop or parking-lot PV can offset electrical loads (HVAC, compressed air, and pumps) without compromising the reliability and compliance requirements of pharmaceutical manufacturing utilities. This sequence enables stepwise solar penetration with minimal operational risk, which can be followed by full-year (8760-h) and extreme-period simulations to finalize oversizing and reliability margins.

Author Contributions

Conceptualization, methodology, validation, data curation, writing—original draft preparation, A.S.A.-G. and A.A.; Formal Analysis, investigation, writing—original draft preparation, writing—review and editing, A.S.A.-G. and A.A. All authors have read and agreed to the published version of the manuscript.

Funding

This research received no external funding.

Data Availability Statement

Data are available on request from the corresponding author.

Acknowledgments

A.S.A.-G. gratefully acknowledges Umm Al-Qura University for granting sabbatical leave (No. 4501021717). The authors also thank King Abdullah City for Atomic and Renewable Energy (K.A.CARE) for providing the data on renewable energy sources used in this study.

Conflicts of Interest

The authors declare no conflicts of interest.

Nomenclature

Abbreviations
CSPConcentrated solar power
C-TESConcrete thermal energy storage
DNIDirect normal irradiance
HTFHeat transfer fluid
LCOHLevelized cost of heat
MAPEMean absolute percentage error
O&MOperational and maintenance
PTCParabolic trough collector
RMSERoot means square error
SHIPSolar heat for industrial processes
PVPhotovoltaic
IHPIndustrial heat process
SAMSystem advisor model
PSAPlataforma Solar de Almería
TCSThermochemical storage
PCMsPhase change materials
FEMFinite element method
SFDASaudi Food and Drug Authority
PSIPharmaceutical Solution Industries
UQUUmm Al-Qura University
symbols
AArea (m2)
CSpecific heat capacity (J/kg·K), cost (USD)
DDiameter (m)
TTemperature (°C, K)
RResistance (K·W−1)
Q ˙ Heat rate (W)
Q Heat energy (J)
hHeat transfer coefficient (W·m−2·K−1)
NuNusselt number [-]
KThermal conductivity (W·m−1·K−1)
prPrandtl number [-]
mMass (kg)
rRadius (m)
SThickness (m)
DEPdeliverable energy potential [-]
Subscripts and subscripts
mMean
cncConcrete
extExternal
InsInsulation
radRadiation
cvConvection
sSolar
bBeam
pAperture
optOptical
thThermal
rReceiver
fFluid, final
oOverall
HTFHeat transfer fluid
enEnergy
PTCParabolic trough collector
disDischarge
stoStored
ChCharge
iInitial
APath A
BPath B
IntInternal
aAmbient
ttube
OmOperating and maintenance
Greek Symbols
η Efficiency
σ Stefan–Boltzmann constant
ε Emissivity
α Absorptivity
μ Dynamic viscosity
τ Transmissivity

References

  1. Weiss, W.; Spörk-Dür, M. Solar Heat Worldwide 2024; IEA SHC: Cedar, MI, USA, 2024. [Google Scholar] [CrossRef]
  2. IEA. Solar Heat for Industrial Processes (SHIP); IEA: Paris, France, 2024; p. 9. [Google Scholar]
  3. Schoeneberger, C.A.; McMillan, C.A.; Kurup, P.; Akar, S.; Margolis, R.; Masanet, E. Solar for industrial process heat: A review of technologies, analysis approaches, and potential applications in the United States. Energy 2020, 206, 118083. [Google Scholar] [CrossRef]
  4. Alami, A.H.; Olabi, A.G.; Mdallal, A.; Rezk, A.; Radwan, A.; Rahman, S.M.A.; Shah, S.K.; Abdelkareem, M.A. Concentrating Solar Power (CSP) Technologies: Status and Analysis. Int. J. Thermofluids 2023, 18, 100340. [Google Scholar] [CrossRef]
  5. Ferruzzi, G.; Delcea, C.; Barberi, A.; Di Dio, V.; Di Somma, M.; Catrini, P.; Guarino, S.; Rossi, F.; Parisi, M.L.; Sinicropi, A.; et al. Concentrating Solar Power: The State of the Art, Research Gaps and Future Perspectives. Energies 2023, 16, 8082. [Google Scholar] [CrossRef]
  6. Giovannetti, F.; ISFH Pedro Horta; FhG ISE. IEA SHC Task 49. In Solar Process Heat for Production and Advanced Applications—Technical Report A2.1; IEA SHC, IEA SHC Task 49, SolarPACES Annex IV; SHC: Mobile, AL, USA, 2016. [Google Scholar]
  7. Carrión-Chamba, W.; Murillo-Torres, W.; Montero-Izquierdo, A. A review of the state-of-the-art of solar thermal collectors applied in the industry. Ingenius 2022, 27, 9–22. [Google Scholar] [CrossRef]
  8. Rosales-Pérez, J.F.; Villarruel-Jaramillo, A.; Romero-Ramos, J.A.; Pérez-García, M.; Cardemil, J.M.; Escobar, R. Hybrid System of Photovoltaic and Solar Thermal Technologies for Industrial Process Heat. Energies 2023, 16, 2220. [Google Scholar] [CrossRef]
  9. Saini, P.; Kivioja, V.; Naskali, L.; Byström, J.; Semeraro, C.; Gambardella, A.; Zhang, X. Techno-Economic Assessment of a Novel Hybrid System of Solar Thermal and Photovoltaic Driven Sand Storage for Sustainable Industrial Steam Production. Energy Convers. Manag. 2023, 292, 117414. [Google Scholar] [CrossRef]
  10. Kalogirou, S.A. Parabolic trough collectors for industrial process heat in Cyprus. Energy 2002, 27, 813–830. [Google Scholar] [CrossRef]
  11. Kalogirou, S. The potential of solar industrial process heat applications. Appl. Energy 2003, 76, 337–361. [Google Scholar] [CrossRef]
  12. Kalogirou, S.A. A Detailed Thermal Model of a Parabolic Trough Collector Receiver. Energy 2012, 48, 298–306. [Google Scholar] [CrossRef]
  13. Fernández-García, A.; Zarza, E.; Valenzuela, L.; Pérez, M. Parabolic-Trough Solar Collectors and Their Applications. Renew. Sustain. Energy Rev. 2010, 14, 1695–1721. [Google Scholar] [CrossRef]
  14. Mohammadi, K.; Khanmohammadi, S.; Immonen, J.; Powell, K. Techno-economic analysis and environmental benefits of solar industrial process heating based on parabolic trough collectors. Sustain. Energy Technol. Assess. 2021, 47, 101412. [Google Scholar] [CrossRef]
  15. Akello, P.O.O.; Saoke, C.O.; Kamau, J.N.; Ndeda, J.O.H. Modeling and performance analysis of solar parabolic trough collectors for hybrid process heat applications in Kenya’s tea industry using the System Advisor Model. Sustain. Energy Res. 2023, 10, 77. [Google Scholar] [CrossRef]
  16. Crespo, A.; Muñoz, I.; Platzer, W.; Ibarra, M. Integration enhancements of a solar parabolic trough system in a Chilean juice industry: Methodology and case study. Sol. Energy 2021, 224, 593–606. [Google Scholar] [CrossRef]
  17. Abdel-Dayem, A.M. Numerical-simulation and experimental-validation of the largest Egyptian solar process-heat system. J. Renew. Sustain. Energy 2011, 3, 043102. [Google Scholar] [CrossRef]
  18. Jensen, A.R.; Sifnaios, I.; Perers, B.; Rothmann, J.H.; Mørch, S.D.; Jensen, P.V.; Dragsted, J.; Furbo, S. Demonstration of a Concentrated Solar Power and Biomass Plant for Combined Heat and Power. Energy Convers. Manag. 2022, 271, 116207. [Google Scholar] [CrossRef]
  19. Fernández-García, A.; Rojas, E.; Pérez, M.; Silva, R.; Hernández-Escobedo, Q.; Manzano-Agugliaro, F. A parabolic-trough collector for cleaner industrial process heat. J. Clean. Prod. 2015, 89, 272–285. [Google Scholar] [CrossRef]
  20. Hennecke, K.; Eck, M.; Zarza, E. Testing of Small-Size PTC Prototypes for the CAPSOL Project at PSA. Sol. Energy 2017, 157, 114–128. [Google Scholar]
  21. Sattler, J.C.; Alexopoulos, S.; Caminos, R.A.; Mitchell, J.; Ruiz, V.; Kalogirou, S.; Ktistis, P.; Boura, C.T.; Herrmann, U. Dynamic Simulation Model of a Parabolic Trough Collector System with Concrete Thermal Energy Storage for Process Steam Generation. AIP Conf. Proc. 2019, 2126, 150007. [Google Scholar]
  22. Sattler, J.C.; Caminos, R.A.; Ürlings, N.; Dutta, S.; Ruiz, V.; Kalogirou, S.; Ktistis, P.; Agathokleous, R.; Jung, C.; Alexopoulos, S.; et al. Operational Experience and Behaviour of a Parabolic Trough Collector System with Concrete Thermal Energy Storage for Process Steam Generation in Cyprus. AIP Conf. Proc. 2020, 2303, 140004. [Google Scholar] [CrossRef]
  23. Ktistis, P.; Agathokleous, R.A.; Kalogirou, S.A. Experimental Performance of a Parabolic Trough Collector System for an Industrial Process Heat Application. Energy 2021, 215, 119288. [Google Scholar] [CrossRef]
  24. Ktistis, P.; Agathokleous, R.A.; Kalogirou, S.A. A Design Tool for a Parabolic Trough Collector System for Industrial Process Heat Based on Dynamic Simulation. Renew. Energy 2022, 183, 502–514. [Google Scholar] [CrossRef]
  25. Tagle, P.D.; Agraz, A.; Rivera, C.I. Study of Applications of Parabolic Trough Solar Collector Technology in Mexican Industry. Energy Procedia 2016, 91, 661–667. [Google Scholar] [CrossRef][Green Version]
  26. Absolicon Solar Collector AB. Absolicon T160 Solar Collector—Data Sheet; Absolicon: Härnösand, Sweden, 2022. Available online: https://www.absolicon.com (accessed on 2 October 2025).
  27. Absolicon T160 Solar Collector—World Wide Projects Industrial Solar Thermal; Absolicon: Härnösand, Sweden, 2022. Available online: https://www.absolicon.com (accessed on 2 October 2025).
  28. Absolicon Solar Collector AB. Solar Heat in Pharmaceutical Industry; Absolicon: Härnösand, Sweden. Available online: https://www.absolicon.com (accessed on 2 October 2025).
  29. Tasmin, N.; Farjana, S.H.; Hossain, M.R.; Golder, S.; Mahmud, M.A.P. Integration of Solar Process Heat in Industries: A Review. Clean Technol. 2022, 4, 97–131. [Google Scholar] [CrossRef]
  30. Koçak, B.; Fernández, A.I.; Paksoy, H. Review on Sensible Thermal Energy Storage for Industrial Solar Applications and Sustainability Aspects. Sol. Energy 2020, 209, 135–169. [Google Scholar] [CrossRef]
  31. Khan, M.I.; Asfand, F.; Al-Ghamdi, S.G. Progress in Research and Technological Advancements of Thermal Energy Storage Systems for Concentrated Solar Power. J. Energy Storage 2022, 55, 105860. [Google Scholar] [CrossRef]
  32. Boquera, L.; Castro, J.R.; Pisello, A.L.; Cabeza, L.F. Research Progress and Trends on the Use of Concrete as Thermal Energy Storage Material. J. Energy Storage 2021, 38, 102562. [Google Scholar] [CrossRef]
  33. Barbhuiya, S.; Das, B.B.; Idrees, M. Thermal Energy Storage in Concrete: A comprehensive review on Fundamentals, Technology and Sustainability. J. Build. Eng. 2024, 82, 108302. [Google Scholar] [CrossRef]
  34. Martins, M.; Villalobos, U.; Delclos, T.; Armstrong, P.; Bergan, P.G.; Calvet, N. New concentrating solar power facility for testing high-temperature concrete thermal energy storage. Energy Procedia 2015, 75, 2144–2149. [Google Scholar] [CrossRef]
  35. Alva, G.; Liu, L.; Huang, X.; Fang, G. Thermal energy storage materials and systems for solar energy applications. Renew. Sustain. Energy Rev. 2017, 68, 693–706. [Google Scholar] [CrossRef]
  36. Arévalo, P.; Ochoa-Correa, D.; Villa-Ávila, E. Advances in Thermal Energy Storage Systems for Renewable Energy: A Review of Recent Developments. Processes 2024, 12, 1844. [Google Scholar] [CrossRef]
  37. Rahjoo, M.; Caggiano, A.; Berardi, U.; Prabhu, A.; Dolado, J.S. Geopolymer concrete performance study for high-temperature thermal energy storage applications. Constr. Build. Mater. 2022, 14, 1937. [Google Scholar] [CrossRef]
  38. Pantaleo, A.M.; Trevisan, S.; Matteucci, F.; Cabeza, L.F. Innovation trends on high-temperature thermal energy storage to defossilize energy systems. J. Energy Storage 2024, 103, 114261. [Google Scholar] [CrossRef]
  39. Cabeza, L.F.; Vérez, D.; Zsembinszki, G.; Borri, E.; Prieto, C. Key challenges for high-temperature thermal energy storage in concrete—First steps towards a novel storage design. Energies 2022, 15, 4544. [Google Scholar] [CrossRef]
  40. Rahjoo, M.; Caggiano, A.; Berardi, U.; Prabhu, A.; Dolado, J.S. Reviewing numerical studies on sensible thermal energy storage in cementitious composites: Report of the RILEM TC 299-TES. Mater. Struct. 2025, 58, 40. [Google Scholar] [CrossRef]
  41. Ali, H.M.; Rehman, T.; Arıcı, M.; Said, Z.; Duraković, B.; Mohammed, H.I.; Kumar, R.; Rathod, M.K.; Buyukdagli, O.; Teggarl, M. Advances in thermal energy storage: Fundamentals and applications. Prog. Energy Combust. Sci. 2024, 100, 101109. [Google Scholar] [CrossRef]
  42. Bhaskara Rao, T.S.S.; Murugan, S. Solar Thermal Energy for Industrial Process Heating Applications: Medicinal/Pharmaceutical Industries. In Solar Thermal Conversion Technologies for Industrial Process Heating; Arjunan, T.V., Selvaraj, V., Matheswaran, M.M., Eds.; CRC Press: Boca Raton, FL, USA, 2023; Chapter 4. [Google Scholar] [CrossRef]
  43. Mohamed, A.M.I.; Mohsen, A.; Kaddah, K.S. El-Nasr solar steam generation pilot plant performance simulation. In Proceedings of the Second Ain Shams University International Conference on Environmental Engineering, Cairo, Egypt, 10–12 April 2007; Volume IV, pp. 39–58. [Google Scholar]
  44. Freina, A.; Motta, M.; Berger, M.; Zahler, C. Solar DSG plant for pharmaceutical industry in Jordan: Modelling, monitoring and optimization. Sol. Energy 2018, 173, 362–376. [Google Scholar] [CrossRef]
  45. Haagen, M.; Zahler, C.; Zimmermann, E.; Al-Najami, M.M.R. Solar process steam for pharmaceutical industry in Jordan. Energy Procedia 2015, 70, 621–625. [Google Scholar] [CrossRef]
  46. Guillaume, M.; Wagner, G.; Jobard, X.; Eicher, S.; Citherlet, S. Solar thermal systems for the Swiss pharmaceutical industry sector. In Proceedings of the ISES Solar World Congress & IEA SHC International Conference on Solar Heating and Cooling for Buildings and Industry, Santiago, Chile, 3–7 November 2019. [Google Scholar] [CrossRef]
  47. Tahri, A.; Bouya, M.; Ghazouani, M.; Achak, O.; Chafik, T.; El Azdi, K.; Boughanbour, S. Impact of Solar Energy Integration on the Rheological and Chemical Properties of Bitumen. Energies 2023, 16, 14. [Google Scholar] [CrossRef]
  48. Guillén-Ángel, J.; Julián, I. Evaluation of Technical Feasibility of Solar Heat Integration in Agri-Food Industries. Processes 2023, 11, 696. [Google Scholar] [CrossRef]
  49. Yılmaz, I.H.; Soylemez, M.S.; Yumrutas, R. Experimental analysis and dynamic simulation of a solar-assisted industrial process using parabolic trough collectors. Energy Sustain. Dev. 2023, 72, 212–229. [Google Scholar] [CrossRef]
  50. Buscemi, A.; Panno, D.; Ciulla, G.; Beccali, M.; Lo Brano, V. Concrete thermal energy storage for linear Fresnel collectors: Exploiting the South Mediterranean’s solar potential for agri-food processes. Energy Convers. Manag. 2018, 166, 719–734. [Google Scholar] [CrossRef]
  51. David-Hernández, M.A.; Cazorla-Marín, A.; Gonzalvez-Macía, J.; Paya-Herrero, J.; Frasquet, M. Enhanced monitoring and dynamic analysis of a concentrated solar thermal experimental plant for steam production. Appl. Therm. Eng. 2024, 249, 123418. [Google Scholar] [CrossRef]
  52. Saini, P.; Ghasemi, M.; Arpagaus, C.; Bless, F.; Bertsch, S.; Zhang, X. Techno-economic comparative analysis of solar thermal collectors and high-temperature heat pumps for industrial steam generation. Energy Convers. Manag. 2023, 277, 116623. [Google Scholar] [CrossRef]
  53. Panneer Selvam, R.; Castro, M. 3D FEM Model to Improve the Heat Transfer in Concrete for Thermal Energy Storage in Solar Power Generation. In Proceedings of the ASME 2010 4th International Conference on Energy Sustainability (ES2010), Phoenix, AZ, USA, 17–22 May 2010. Paper No. ES2010-90078. [Google Scholar]
  54. Ferone, C.; Colangelo, F.; Frattini, D.; Roviello, G.; Cioffi, R.; Di Maggio, R. Finite element method modeling of sensible heat thermal energy storage with innovative concretes and comparative analysis with literature benchmarks. Energies 2014, 7, 5291–5316. [Google Scholar] [CrossRef]
  55. Giannuzzi, G.M.; Liberatore, R.; Mele, D.; Mazzucco, G.; Xotta, G.; Salomoni, V.A.; Majorana, C.E.; Di Maggio, R. Experimental campaign and numerical analyses of thermal storage concrete modules. Sol. Energy 2017, 157, 596–602. [Google Scholar] [CrossRef]
  56. Vigneshwaran, K.; Sodhi, G.S.; Muthukumar, P.; Subbiah, S. Concrete based high temperature thermal energy storage system: Experimental and numerical studies. Energy Convers. Manag. 2019, 198, 111905. [Google Scholar] [CrossRef]
  57. Singh, S.; Sørensen, K. Concrete thermal energy storage for steam generation: A numerical investigation. In Proceedings of the 58th Conference on Simulation and Modelling (SIMS 2017), Reykjavik, Iceland, 25–27 September 2017; Jonsson, M.T., Ed.; Linköping University Electronic Press: Linköping, Sweden, 2017; pp. 234–240. [Google Scholar] [CrossRef]
  58. Suárez, C.; Pino, F.J.; Guerra, J. A new simplified model for the unsteady response of concrete passive sensible TES systems. J. Energy Storage 2020, 27, 101042. [Google Scholar] [CrossRef]
  59. Doretti, L.; Martelletto, F.; Mancin, S. A simplified analytical approach for concrete sensible thermal energy storages simulation. J. Energy Storage 2019, 22, 68–79. [Google Scholar] [CrossRef]
  60. Doretti, L.; Martelletto, F.; Mancin, S. Numerical analyses of concrete thermal energy storage systems: Effect of the modules’ arrangement. Energy Rep. 2020, 6, 199–214. [Google Scholar] [CrossRef]
  61. Soprani, S.; Marongiu, F.; Christensen, L.; Alm, O.; Petersen, K.D.; Ulrich, T.; Engelbrecht, K. Design and testing of a horizontal rock bed for high temperature thermal energy storage. Appl. Energy 2019, 251, 113345. [Google Scholar] [CrossRef]
  62. Ndiaye, K.; Ginestet, S.; Cyr, M. Experimental evaluation of two low temperature energy storage prototypes based on innovative cementitious material. Appl. Energy 2018, 217, 47–55. [Google Scholar] [CrossRef]
  63. Pompei, L.; Nardecchia, F.; Miliozzi, A. Current, Projected Performance and Costs of Thermal Energy Storage. Processes 2023, 11, 729. [Google Scholar] [CrossRef]
  64. Kingdom of Saudi Arabia Vision 2030 Office. Vision 2030 Annual Report 2024. Available online: https://www.vision2030.gov.sa/media/r3ij40wu/en-annual-report-vision2030-2024.pdf (accessed on 2 August 2025).
  65. King Abdullah City for Atomic and Renewable Energy (K·A·CARE). Theme 1: Solar Heat for Industrial Processes (SHIP); K·A·CARE: Riyadh, Saudi Arabia, 2017. [Google Scholar]
  66. King Abdullah City for Atomic and Renewable Energy (K·A·CARE). Theme 2: Solar Heat for Industrial Processes (SHIP); K·A·CARE: Riyadh, Saudi Arabia, 2017. [Google Scholar]
  67. GlassPoint. Ma’aden Solar I. Available online: https://www.glasspoint.com/projects/maaden-solar (accessed on 12 August 2025).
  68. Kraemer, S. Saudi Factory to Mass-Produce GlassPoint’s Solar Steam Technology. SolarPACES. Available online: https://www.solarpaces.org/saudi-factory-to-mass-produce-glasspoints-solar-steam-technology/ (accessed on 12 August 2025).
  69. Kumar, L.; Ahmed, J.; El Haj Assad, M.; Hasanuzzaman, M. Prospects and challenges of solar thermal for process heating: A comprehensive review. Energies 2022, 15, 8501. [Google Scholar] [CrossRef]
  70. Galitsky, C.; Chang, S.-C.; Worrell, E.; Masanet, E. Energy Efficiency Improvement and Cost Saving Opportunities for the Pharmaceutical Industry: An ENERGY STAR® Guide for Energy and Plant Managers; Lawrence Berkeley National Laboratory (LBNL): Berkeley, CA, USA, 2008; Report No. LBNL-57260; Available online: https://escholarship.org/uc/item/9zw158vm (accessed on 2 August 2025).
  71. U.S. Environmental Protection Agency (EPA). ENERGY STAR® Industrial Insights: U.S. Pharmaceutical Sector (NAICS 325412); EPA: Washington, DC, USA, 2016. Available online: https://www.energystar.gov/sites/default/files/tools/Industry_Insights_Pharma_2016.pdf (accessed on 2 August 2025).
  72. Alshehri, S.; Alshammari, R.; Alyamani, M.; Dabbagh, R.; Almalki, B.; Aldosari, O.; Alsowayigh, R.; Alkudeer, A.; Aldosari, F.; Sabr, J.; et al. Current and future prospective of pharmaceutical manufacturing in Saudi Arabia. Saudi Pharm. J. 2023, 31, 605–616. [Google Scholar] [CrossRef] [PubMed]
  73. Alzahrani, R.; Harris, E. Biopharmaceutical revolution in Saudi Arabia: Progress and development. J. Pharm. Innov. 2020, 15, 344–356. [Google Scholar] [CrossRef]
  74. Beck, A.; Wiedergut, M.; Neubauer, N. Towards fossil-free energy supply: Cost-effective decarbonization measures in pharmaceutical energy systems. Appl. Therm. Eng. 2025, 280, 128213. [Google Scholar] [CrossRef]
  75. Hassan, M.A.; Khalil, A.; Abubakr, M. Selection methodology of representative meteorological days for assessment of renewable energy systems. Renew. Energy 2021, 177, 34–51. [Google Scholar] [CrossRef]
  76. Nellis, G.F.; Klein, S.A. Introduction to Engineering Heat Transfer; Cambridge University Press: Cambridge, UK, 2020. [Google Scholar] [CrossRef]
Figure 1. Solar Heat for Industrial Processes (SHIP): global deployment and collector temperature ranges.
Energies 19 01211 g001
Figure 2. Umm Al Qura University (Makkah—UQU) solar resource monitoring station (King Abdullah City for Atomic and Renewable Energy; https://rratlas.kacare.gov.sa/, data are available from K.A.CARE upon request).
Energies 19 01211 g002
Figure 3. Schematic layout of the proposed PTC–C-TES system illustrating the main operating modes.
Energies 19 01211 g003
Figure 4. Schematic of the PTC: (a) one-dimensional energy balance and (b) thermal resistance model.
Energies 19 01211 g004
Figure 5. Schematic representation of the C-TES modeling and thermal resistance network, redrawn and adapted based on the modeling approach of Doretti et al. [59,60].
Energies 19 01211 g005
Figure 6. Comparison of the transient temperature response predicted by the proposed C-TES model and experimental measurements obtained during the charging phase of the Cyprus case-study system.
Energies 19 01211 g006
Figure 7. Comparison of simulated concrete core temperature with experimental measurements and the validated model of Doretti et al. [60] during the charging period.
Energies 19 01211 g007
Figure 8. Hourly variation in C-TES temperature over 12 representative days corresponding to monthly average conditions in Makkah City, illustrating charging and discharging behavior under 25% demand coverage.
Energies 19 01211 g008
Figure 9. Required number of PTC units and C-TES modules as a function of demand coverage percentage, based on model simulations using representative Makkah weather data.
Energies 19 01211 g009
Figure 10. Effect of demand coverage percentage on levelized cost of heat (LCOH) and overall system efficiency, evaluated using the validated PTC–C-TES model.
Energies 19 01211 g010
Figure 11. Comparison between available stored energy and delivered process demand over 12 representative days for the 25% coverage case, illustrating surplus energy accumulation during high solar irradiance periods.
Energies 19 01211 g011
Figure 12. Comparison between the maximum available stored energy and the delivered process energy over 12 representative days for the 100% demand coverage case, illustrating the surplus energy required to maintain continuous dispatchability under high solar availability.
Energies 19 01211 g012
Figure 13. Designed maximum deliverable energy potential (DEP) as a function of demand coverage, indicating the surplus energy required to maintain continuous dispatchability at different coverage levels.
Energies 19 01211 g013
Figure 14. Comparison of the C-TES temperature profile over one representative day of operation using Therminol VP-1 and Paratherm NF as heat transfer fluids.
Energies 19 01211 g014
Figure 15. Effect of insulation thickness on the C-TES concrete temperature over 12 representative days, illustrating the influence of thermal losses under different insulation configuration.
Energies 19 01211 g015
Figure 16. Influence of insulation thickness on overall efficiency and deliverable energy potential (DEP) of the PTC–C-TES system.
Energies 19 01211 g016
Figure 17. Effect of PTC mirror reflectivity on the overall system efficiency.
Energies 19 01211 g017
Figure 18. The effects of PTC reflectivity on the overall efficiency and LCOH.
Energies 19 01211 g018
Figure 19. Thermal losses from the C-TES module over 12 representative days under the modeled operating conditions.
Energies 19 01211 g019
Figure 20. HTF mass flow rate and DNI profiles for 12 representative operating days (PTC outlet temperature maintained at 400 °C).
Energies 19 01211 g020
Table 1. SHIP projects and system models.
ProjectLocation/IndustryTechnologyStorageCoverageStrategy
Egypt El-Nasr Solar Steam Generation Plant [17,43]Cairo, Egypt/
Pharmaceutical
Parabolic Trough Collectors (PTCs), Direct Steam Generation (DSG)No dedicated TES (flash drum only)~10% of steam demandSolar DSG with flash tank; solar steam fed directly to process; fossil boiler provides backup
Jordan RAM Pharma Solar Process Steam Plant [44,45]Amman, Jordan/
Pharmaceutica
Linear Fresnel Reflectors (LFRs), Direct Steam Generation (DSG)Steam drum (buffer only, no long-term TES)Up to 100% during sunny daytimeSolar steam fed in parallel; boiler switched off during daylight when solar steam is sufficient
Swiss Pharmaceutical SHIP—Case Study 1 [46]Bulle, SwitzerlandFlat-plate and evacuated tube collectors50 m3 hot water tank38% (617 MWh/y)Upstream of steam heat exchangers for drying
Swiss Pharmaceutical SHIP—Case Study 2 [46]St-Prex, SwitzerlandFlat-plate and evacuated tube collectors30 m3 hot water tank28% (382 MWh/y)Air preheating for drying chambers
Absolicon Solar Heat for the Pharmaceutical Industry [28]Gujarat, India/
Pharmaceutical
PTC-Absolicon T160Pressurized hot water tank (sensible)20–40Solar preheating and direct process supply with boiler backup
Cyprus Beverage [21,22,23,24]Cyprus, BeveragePTCC-TES5–25%4–6 AM: C-TES discharge
6–8 AM: C-TES discharge + solar field preheating and steam generation
8 AM–3 PM: steam generation
3–7 PM: C-TES charge
7 PM–4 AM: plant off
Chile Solar-Assisted
Grape Juice Plant [23]
San Felipe, Chile/Food processingPTCHot-water storage tanks (12.5–50 m3)PartialFeed-water preheating upstream of LPG boiler; process-level optimization
  • The solar field is running whenever sun is available.
  • Pasteurization is prioritized if the storage temperature is >90 °C.
  • Increase the operating temperature (140 °C) to avoid defocusing.
Sunil Health Care—Capsule Manufacturing [43]Alwar, Rajasthan, India/Pharmaceutical industryFlat-plate collectors (FPCs)Dual hot water tanks + buffer tank (sensible)Not explicitly reportedSolar hot water production (≈75 °C) for capsule–shell manufacturing; electric/diesel backup
Indian Pharmaceutical Plants—Boiler Feedwater Preheating [43]India/Pharmaceutical industryFPC and ETCHot water storage tanks (sensible)Not explicitly reportedSolar preheating of boiler make-up water to reduce fossil fuel consumption
Medicinal Products Industry—Sterilization and Cleaning [43]Guangxi, China/Medicinal industrySolar thermal collectors + heat recoveryHot water storage (sensible)Not explicitly reportedSolar-assisted sterilization and cleaning combined with waste heat recovery
Morocco Solar-Assisted Bitumen Processing Plant [47]Morocco/BitumenPTC + XCPC + PV (hybrid)SensibleMedium-temperature process heat
Partial 10–25
PTC supplies medium-T heat; XCPC improves off-peak solar gain; PV powers auxiliaries and controls thermal management:
  • Daytime heating (155–175 °C).
  • Night-time adaptive heating (battery-assisted).
Agri-Food SHIP Feasibility (SMEs) [48]Southern Europe/Spanish winery; Italian spirits distillery; French charcuterieSolar thermal collectors are selected based on the temperature level (FPCs/ETCs/PTCs) (hybrid)Sensible (water) and PCM (hybrid)Sensible thermal storage (hot water tanks/buffer storage)Process-level solar heat integration for washing, fermentation support, distillation, and drying
Solar-Assisted Food Processing Plant [49]Turkey/Food (Bulgur industry)Parabolic trough collector (PTC)Minimal buffer tank20.8%Direct solar use with an auxiliary heater; storage minimized
Solar Process Steam Pilot (LFR + C-TES) [50]South Mediterranean (Italy)/Agri-foodLinear Fresnel collector (LFR)Concrete TES (sensible)≈40% (annual, simulated)Solar field coupled with concrete TES for dispatchable medium-temperature process heat
SOLPINVAP Experimental SHIP Plant [51]Spain/Industrial steamLinear Fresnel collector (LFR, ISG/DSG)Pressurized water/steam separator (buffer)Not explicitly reportedIndirect steam generation with advanced monitoring; experimental plant for steam production with advanced monitoring and dynamic operation
Techno-Economic Comparison: PTC vs. HTHP [52]Europe (multiple locations)/Generic industryParabolic trough collector (PTC) vs. high-temperature heat pumpSensible storage (pressurized water tank)The solar fraction limit was defined (≈5–60%, depending on the location)Comparative assessment of solar thermal and HTHP for industrial steam generation
Table 2. Physical parameters and dimensions of the system components [21,22,23,24].
ComponentParameterValue
PTC (CF100)Aperture width3.0 m
Collector length12.0 m
Total field length96 m
Aperture area288 m2
Reflectivity0.94
Optical efficiency η 0 0.73
Receiver (CF115)Outer radius19 mm
AnnulusVacuum between the absorber tube and glass envelope
Absorption coefficient0.95
HTF (Therminol VP-1)Density @ 300 °C905 kg/m3
Specific heat (cp) @ 300 °C2.31 kJ/kg·K
Thermal conductivity0.105 W/m·K
Dynamic viscosity0.3 mPa·s
Concrete (TES medium)Density2300 kg/m3
Specific heat (cp)0.88 kJ/kg·K
Thermal conductivity1.4 W/m·K
Max operating temperature500 °C
Table 4. Economic analysis parameters.
ParameterValue
Discount rate8%
Plant lifetime25 years
Collector cost200 USD/m
Storage cost75 USD/m
PTC O&M rate2% of capital cost
TES O&M rate1% of capital cost
Table 3. The dimension and resistance equations.
Dimension EquationsResistance Equations
Tube layer R o i l = 1 h o i l π D t , i n t L t
R t = 1 2 π λ t L t ln D t , e x t D t , i n t
Concrete layer D e q , c n c = 4 L s i d e , e l 2 π R c n c = 1 2 π λ c n c 4 L e l ln D e q , c n c D t , e x t
Insulation layer 1 D e q , i n s , 1 = D e q , c n c + 2 S i n s , 1
A i n s , 1 = π L T E S D e q , i n s , 1
R i n s 1 , c = 1 2 π λ i n s 1 L T E S ln D e q , i n s 1 D e q , T E S
R i n s , 1 , h = S i n s , 1 k i n s , 1 A i n s , 1
R i n s , 1 = 1 R i n s 1 , c + 1 R i n s , 1 , h 1
Insulation layer 2 D e q , i n s , 2 = D e q , i n s , 1 + 2 ( S i n s , 2 )
A i n s , 2 = π L T E S D e q , i n s , 2
R i n s , 2 , c = 1 2 π λ i n s 2 L T E S ln D e q , i n s 2 D e q , i n s 1
R i n s , 2 , h = S i n s , 2 k i n s , 2 A i n s , 2
R i n s , 2 = 1 R i n s , 2 , c + 1 R i n s , 2 , h 1
Table 5. Input parameters for Cyprus validation.
CategoryParameterValueUnit
Solar FieldCollector TypePTC (Protarget CF100)
Number of collectors8
Aperture width3.0m
Collector length12.0m
Total Aperture Area288m2
Mirror Reflectivity0.94[-]
Receiver Absorptance0.95[-]
Glass Transmittance0.91[-]
HTFFluid NameHELISOL® XA (WACKER Chemie AG)
Outlet Temp350°C
Storage (C-TES)MaterialConcrete
Number of Modules4
Total Capacity640kW
StrategyStrategy 2 (weekend mode)
WeatherAvg. DNI~783W/m2
Ambient temperature20–25°C
Table 6. Input parameters for single module validation.
ParameterValueUnit
Operational Conditions
Process TypeCharging (Heating)
Heat Transfer FluidParatherm NF
Mass Flow Rate0.145kg/s
Inlet Temperature280.9°C
Initial Concrete Temp239.8°C
Ambient Temperature34.0°C
Geometry & Material
Concrete MixtureType A
Concrete Density2483kg/m3
Concrete Thermal Cond.2.21 W / m · K
Concrete Specific Heat820 J / k g · K
Module Length3.0m
Tube Inner/Outer Diam.14/16mm
Table 7. Mean absolute percentage error (MAPE) and root mean square error (RMSE) between the proposed model and reference data. RMSE is expressed in °C.
Validation ParameterMAPERMSE
T_model vs. T_exp_Cyprus1.456.22
T_model vs. T_exp_Giannuzzi2.10.87
T_model vs. T_Dorretti_sim0.330.33
Disclaimer/Publisher’s Note: The statements, opinions and data contained in all publications are solely those of the individual author(s) and contributor(s) and not of MDPI and/or the editor(s). MDPI and/or the editor(s) disclaim responsibility for any injury to people or property resulting from any ideas, methods, instructions or products referred to in the content.