


Abstract
The transition toward market-oriented renewable energy policies has increased the demand for flexible operation of biogas plants (BGPs), particularly under Japan’s Feed-in Premium (FIP) scheme. This study evaluates the technical performance and revenue potential of integrating hydrogen production into a dairy-manure-based BGP, focusing on steam reforming (SR) and electrolysis (EL) pathways. An energy system optimization model was developed using the Open Energy Modelling Framework (OEMOF) to simulate coordinated operation of biogas combined heat and power (CHP), hydrogen production, heat supply, and storage under electricity spot market conditions in Hokkaido, Japan. Sensitivity and scenario analyses were conducted to examine hydrogen production behavior, system-level resource allocation, and revenue performance under varying hydrogen prices and FIP levels. The results show that EL enables price-responsive switching between electricity supply and hydrogen production, resulting in dynamic hydrogen output and high sensitivity to conditions. In contrast, SR provides stable hydrogen production through continuous biogas utilization, achieving biogas throughput but limited responsiveness to price fluctuations. A System-level trade-off between conversion flexibility and direct fuel utilization efficiency was identified. These findings indicate that hydrogen pathway selection in farm-scale BGPs should be treated as a system design decision shaped by market exposure, operational objectives, and risk tolerance under the FIP framework.
1. Introduction
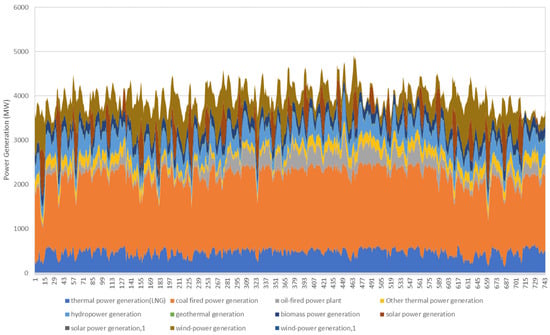
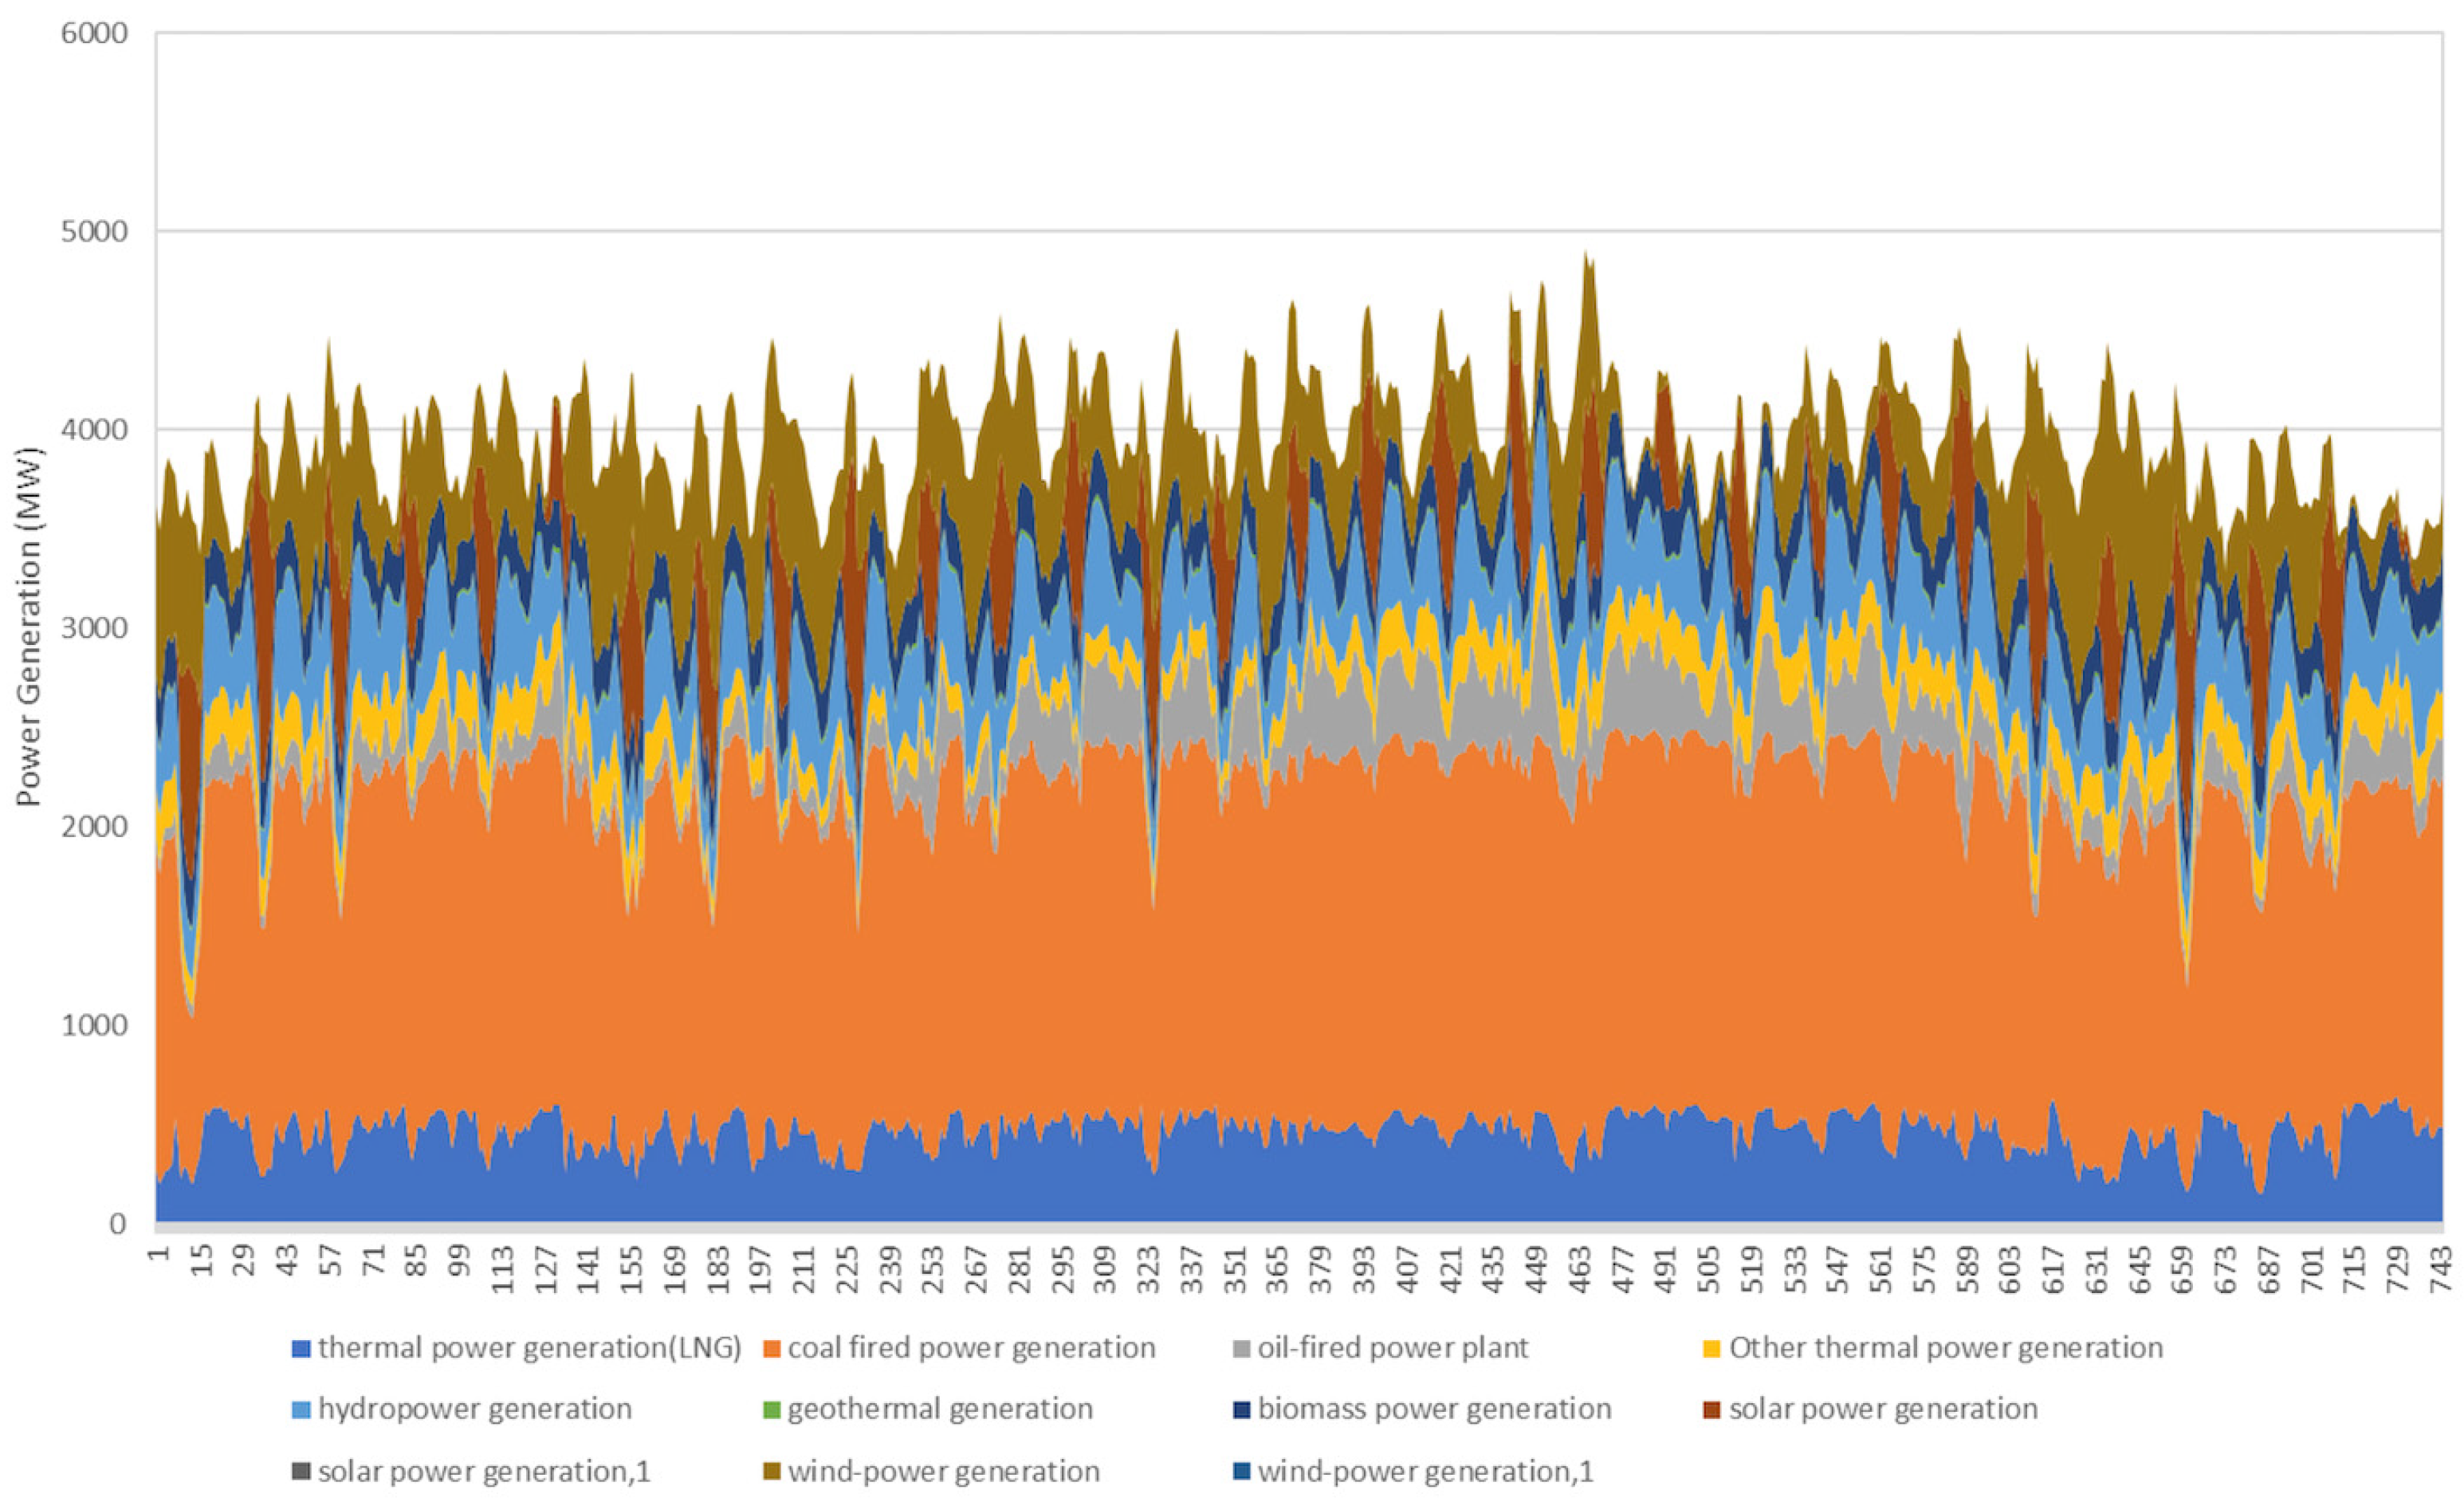
The global shift toward decarbonization has accelerated the deployment of renewable energy, and its role has become increasingly significant in countries such as Japan, where dependence on fossil fuels remains substantial [1,2]. Hokkaido possesses substantial renewable energy resources, including wind, solar, and biomass. However, as shown in Figure 1, the regional power supply remains heavily dependent on thermal power generation from fossil fuels. The current share of renewable energy in the electricity mix is relatively low. This indicates that Hokkaido possesses substantial untapped potential for further renewable energy development.
Figure 1.
Power Generation in Hokkaido—all sources: Fossil fuel-fired generation remains dominant, while solar and wind power exhibit clear diurnal and seasonal variability. Biomass power generation shows relatively stable output, suggesting its suitability as a steady supply component in the regional electricity system.
Among these options, biogas power generation is recognized as a promising technology that leverages agricultural and livestock residues. It also provides stable output independent of weather conditions [3]. In addition to electricity generation, biogas plants (BGPs) have demonstrated—particularly in the EU—a growing capability to provide ancillary services. These include balancing and frequency regulation, which contribute to power system stability [4,5].
Despite these advantages, Japan’s biogas sector has long relied on the Feed-in Tariff (FIT) scheme. Several challenges have recently surfaced. First, reductions in FITs and the expiry of FIT contracts have placed downward pressure on the economic sustainability and revenue stability of BGPs [6]. Second, due to reliance on imported construction materials and equipment, the capital cost of Japanese BGPs remains higher than that in Europe [3]. Third, Japan lacks sufficient mechanisms to integrate biogas operations with wholesale electricity markets and balancing markets, resulting in underutilization of biogas as a flexible power source [7,8].
Similar challenges have been reported in Germany, where maintaining economic sustainability beyond the FIT period and transitioning toward a more flexible energy system have become urgent issues [9]. Although Germany’s Renewable Energy Act (EEG) significantly contributed to the expansion of renewable energy, the FIT-based model has become increasingly unsustainable as energy markets mature [10]. In response, German BGPs have adopted strategies such as combined heat and power (CHP)-based multiuse systems, flexible power plant operation, and market-oriented revenue structures [11,12]. Germany’s feed-in policy for BGPs has shifted in recent years from fixed FITs toward a more market-oriented, auction-based system, accompanied by substantial reforms aimed at increasing system flexibility and supporting existing installations. Recent EEG amendments significantly expanded auction volumes—most notably to 1300 MW in 2025 and 1126 MW in 2026, followed by sharp reductions from 2027 onward [13]. The reforms also prioritize BGPs connected to district or local heating networks, reserving up to 70% of auction volumes for facilities that supplied at least 300 kW of heat to multiple buildings before 2023 and continue to do so today [13]. To promote flexible electricity production, remuneration is now based on so-called “eligible operating quarters of an hour” (förderfähige Betriebsviertelstunden), limited to the 11,680 highest-production quarter-hours per year, replacing earlier full-load-hour models and strengthening incentives for demand-oriented operation [13]. Additionally, the flexibility bonus has been increased to 100 €/kW, and the post-EEG support for existing BGPs have been extended from 10 to 12 years to ensure continued viability as many 20-year EEG terms expire [14]. Collectively, these policy shifts reinforce biogas as a flexible stabilizing resource for Germany’s renewable energy system while tightening eligibility criteria and aligning support more closely with grid needs.
Many countries have shifted away from classic fixed FITs toward more market-oriented, auction or premium-based systems, including Japan, Germany and multiple other EU member states, including France, Italy and Sweden [15]. Reflecting these international developments, Japan introduced the Feed-in Premium (FIP) scheme to encourage market integration and flexible power generation. Under the FIP, electricity is sold at market prices with an added premium, incentivizing operators to respond to price fluctuations [16,17]. This shift is particularly relevant in Hokkaido, where the rapid expansion of renewable energy has increased curtailment risks. The 7th Strategic Energy Plan emphasizes the need for output control [18]. Consequently, Japanese biogas CHP systems are now required to optimize operations under these market-based conditions.
The insights gained from examining Japan’s shift from fixed FITs toward more market-linked schemes—particularly its transition to FIP models and tender-based procurement for larger biomass projects—are highly relevant for other countries pursuing similar reforms. Many EU member states, for example, are also moving away from traditional FIT structures in favor of competitive auctions and flexible support mechanisms aligned with broader renewable energy and biomethane expansion strategies. This parallel evolution underscores that the trends observed in Japan reflect a wider international shift toward cost-efficient, market-integrated, and flexibility-oriented renewable energy policy frameworks, making the findings of this report valuable beyond the Japanese context.
Meanwhile, hydrogen production has gained prominence within Japan’s Green Transformation strategy as a pathway for absorbing surplus renewable electricity [19,20]. The integration of “biogas-to-hydrogen”—specifically through steam reforming (SR) or electrolysis (EL)—is a promising approach to enhance system flexibility, particularly in livestock-dominated regions like Hokkaido [21,22].
Green hydrogen from biomass can be produced via three main families of routes—thermochemical, biochemical, and catalytic aqueous phase processes—with two further, widely deployed comparators often considered alongside these biomass routes: SR of biogenic methane (biogas) and EL powered by renewable electricity. Across the scientific literature, thermochemical options (notably steam/oxy steam gasification and supercritical water gasification) are consistently assessed as the most mature and readily scalable, while biochemical routes (dark and photo fermentation) and aqueous phase reforming (APR) address specific feedstock niches but face scale-up or catalyst constraints [23].
As adjacent comparators to these biomass centric pathways, two routes are frequently evaluated in decision studies. First, the SR of biogas (upgraded to biomethane or reformed as raw biogas) converts biogenic CH4 to H2 with a standard Steam Methane Reforming (SMR) process train; when the feedstock carbon is biogenic and CO2 is captured or appropriately managed, life cycle impacts can be substantially reduced relative to fossil natural gas SMR. A recent comparative Life Cycle Assessment (LCA) reported ~1.30 kg CO2e/kg H2 for agricultural residue gasification versus ~5.05 kg CO2e/kg H2 for biogas reforming under its defined boundaries, highlighting that while biogas SMR is a credible low carbon route, residue gasification generally achieved lower Green House Gas intensity in that study (water consumption was higher for gasification, underscoring site specific trade offs). Second, EL supplied by renewable electricity (Proton Exchange Membrane (PEM), alkaline, or Solid Oxide Electrolysis Cell (SOEC)) produces H2 without direct carbon emissions and is rapidly scaling; multiple reviews of “green hydrogen” position EL as a cornerstone technology where low cost renewable power and grid access are assured, although its cost and emission performance remain sensitive to electricity price and carbon intensity of the marginal kWh [24,25].
While previous studies have evaluated biogas-derived hydrogen regarding reforming efficiency and lifecycle impacts [24,26], comparative assessments of hydrogen production pathways—specifically SR versus EL—under the FIP scheme remain limited [27,28].
This knowledge gap is especially critical for small-scale individual BGPs, which must simultaneously manage electricity, heat, and nutrient recycling [29]. Therefore, this study aims to evaluate how market price fluctuations and alternative hydrogen production pathways influence revenue potential and operational flexibility under the Japanese FIP scheme. Using an existing dairy-manure-based BGP in real operation as a case study, we assess the technical performance and revenue potential of biogas-to-hydrogen conversion via SR and EL.
Recent techno economic literature indicates that biomass based hydrogen pathways can achieve competitive or near competitive levelized costs, particularly for thermochemical routes. Biomass gasification, the most mature option, achieves average Levelized Cost of Hydrogen (LCOH) values around USD 3.15/kg H2, with yields of roughly 0.1 kg H2 per kg biomass, and can even become carbon negative when coupled with CO2 capture, significantly improving its economic outlook. Bio oil reforming also shows strong performance: Techno-Economic Analysis (TEA) comparisons demonstrate higher hydrogen efficiency, lower capital investment, and superior internal rates of return compared to bio oil gasification, indicating that reforming can be a viable large-scale route for low cost hydrogen production. In contrast, biochemical pathways such as dark fermentation, even when enhanced through microbial electrolysis cells, still exhibit relatively high hydrogen production costs—typically USD 17–30/kg H2, reducible to USD 4–7/kg H2 only under intensified operational conditions. These routes are therefore economically attractive mainly in cases where waste treatment credits or negative emission incentives apply, rather than as standalone hydrogen production technologies [30,31,32,33].
When compared to biomass based routes, biogas SR offers a moderate cost, commercially mature alternative, though LCA shows emissions around 5.047 kg CO2e/kg H2, higher than agricultural residue gasification (1.30 kg CO2e/kg H2) yet still substantially lower than fossil SMR without capture. Meanwhile, renewable powered EL remains the key benchmark for green hydrogen, but current costs remain in the range of USD 3.8–11.9/kg H2, largely dominated by electricity price and electrolyzer capital expenditure, which continue to restrict its competitiveness in many regions. Taken together, the TEA evidence suggests that biomass gasification and bio oil reforming are the most economically promising biomass to hydrogen pathways, with biogas reforming and EL offering complementary roles depending on local energy prices, policy frameworks, and feedstock availability [34,35].
We investigate the integration of hydrogen production into a dairy-manure-based BGP by comparing two pathways: SR and EL. EL and SR were selected because they represent the two most technologically mature and widely applied pathways for small-scale hydrogen production that can be integrated into existing BGP infrastructure with minimal additional development. EL is commercially established across a wide range of system sizes, relies only on electricity and water, and can be readily coupled to CHP-based electricity supply. SR, in contrast, is a long-standing industrial technology for converting methane-rich gases into hydrogen, making it directly compatible with biogas substrates. Both technologies therefore offer practical, near-term implementation potential for individual BGPs without requiring experimental components or major technological innovation.
To achieve this, we apply a system-level optimization approach to analyze the coordinated operation of biogas-based electricity generation, hydrogen production, heat utilization, and storage under variable electricity-market conditions. This study uses an energy system optimization model built with the Open Energy Modelling Framework (OEMOF) to simulate the integrated operation of a BGP with hydrogen production technologies. OEMOF enables a detailed representation of energy flows, component interactions, and operational constraints, allowing the study to evaluate how EL and SR influence system performance under market-based electricity pricing. The goal is to assess the technical feasibility and economic implications of adding hydrogen production to a farm-scale BGP.
Research on CHP dispatch modeling emphasizes how OEMOF’s solph library supports realistic representations of CHP units through linear and mixed integer formulations, particularly by using NonConvexFlow to incorporate technical constraints such as minimum load, on/off behavior, and start up characteristics. Broader CHP dispatch literature highlights the complexity of jointly optimizing heat and electricity schedules—an area in which deterministic, stochastic, and metaheuristic approaches have been applied, as reviewed by Kazda and Li, who provide a comprehensive overview of CHP economic and emission dispatch methods and their algorithmic tradeoffs. Additional studies on dispatch under uncertainty, such as Mohamed et al., illustrate how integrating CHP with renewable resources and storage can enhance system sustainability and operational cost efficiency, underscoring the relevance of flexible, multi energy optimization frameworks. These findings collectively show that OEMOF’s optimization structure aligns well with the technical and methodological requirements discussed in the broader CHP dispatch research [36,37,38].
In parallel, the literature on BGPs underscores their growing importance in renewable energy systems, with modeling approaches ranging from detailed anaerobic digestion dynamics to aggregated system level representations. Heiker et al. categorize biogas models into white, grey, and black box approaches and discuss how biogas production can be integrated into energy system models, including CHP supply chains. Studies of practical biogas CHP operation—such as the landfill based efficiency assessment by Ciuła et al.—highlight real world limitations like insufficient biogas flow, unutilized heat, and reduced electrical and thermal efficiencies. Altogether, this literature shows that OEMOF’s modular structure—capable of representing biogas supply constraints, CHP conversion processes, emissions allocation, and multi energy interactions—is well suited for studying integrated biogas CHP systems and supports the development of more realistic and sustainability oriented energy system models [39,40].
In this study sensitivity and scenario analyses are conducted to evaluate hydrogen-production patterns, resource allocation, and revenue performance under different hydrogen-price levels and FIP settings. All analyses are based on market data for Hokkaido from 2024. The full year of 2024 is simulated assuming a daily hydrogen demand equivalent to refueling approximately two hydrogen vehicles per day, resulting in a corresponding annual hydrogen demand. Based on the sensitivity and scenario analyses the following questions are addressed:
- How does the integration of hydrogen production via EL and SR affect the operational behavior, energy flows, and technical performance of a dairy manure based BGP under Japan’s FIP market conditions?
- What are the revenue implications of each hydrogen production pathway when exposed to fluctuating electricity prices and varying FIP levels, and how sensitive are the results to assumed hydrogen prices?
2. Materials and Methods
2.1. OEMOF
This study develops an energy system model using OEMOF, an open-source and modular framework designed to facilitate transparent and reproducible energy system modelling, to evaluate hydrogen production potential from an existing BGP [41]. Two technologies are considered: SR and EL, both powered by electricity from the BGP’s CHP units. The model simulates alternative configurations and operational strategies to assess the technical performance and revenue-based economic implications of integrating hydrogen production into biogas operations.
OEMOF is an open-source, Python-based framework for modeling and optimizing energy systems. It provides a modular, transparent structure that supports multi-sector and multi-scale analysis, making it suitable for renewable integration and sector coupling studies. Energy systems in OEMOF are represented as directed graphs, where nodes denote components (sources, sinks, transformers) and edges represent energy flows. Optimization is implemented through the solph library, which uses linear and mixed-integer programming via Pyomo. Additional libraries, such as oemof.network for system topology and oemof.tabular for data-driven modeling, enhance flexibility and reproducibility. OEMOF’s open development and community support ensure adaptability for diverse research and planning applications [41].
All OEMOF models in this study were solved using the Coin-or Branch and Cut (CBC) [42] solver, an open-source mixed-integer linear programming (MILP) solver developed by the COIN-OR project. CBC is widely used for energy system optimization due to its robustness, transparency, and compatibility with Python 3.12.7-based frameworks such as OEMOF via Pyomo 6.8.2. It supports linear and mixed-integer formulations, making it suitable for modeling operational constraints and discrete decisions in energy systems. Its open-source nature ensures reproducibility and accessibility, aligning with the principles of open science.
2.2. Base Model
The BGP modeled in this study is located in a small town in Hokkaido, and processes approximately 100 t of manure per day in two fermenters. Anaerobic digestion produces biogas with an energy content equivalent to 348 kW. A 400 m3 biogas storage facility provides buffering for continuous operation. Heat demand was estimated using 2024 ambient temperature data from a nearby weather station and the fermenter’s thermal properties, including the requirement to maintain 40 °C for optimal digestion.
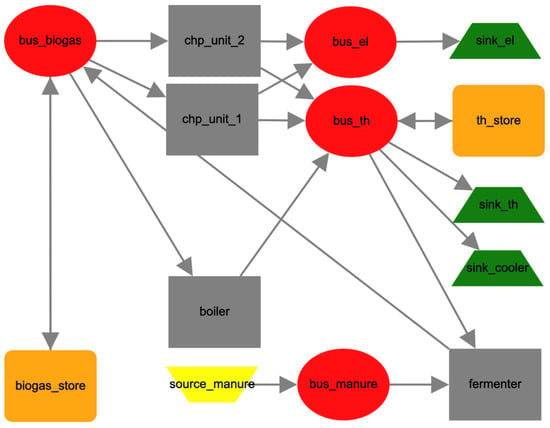
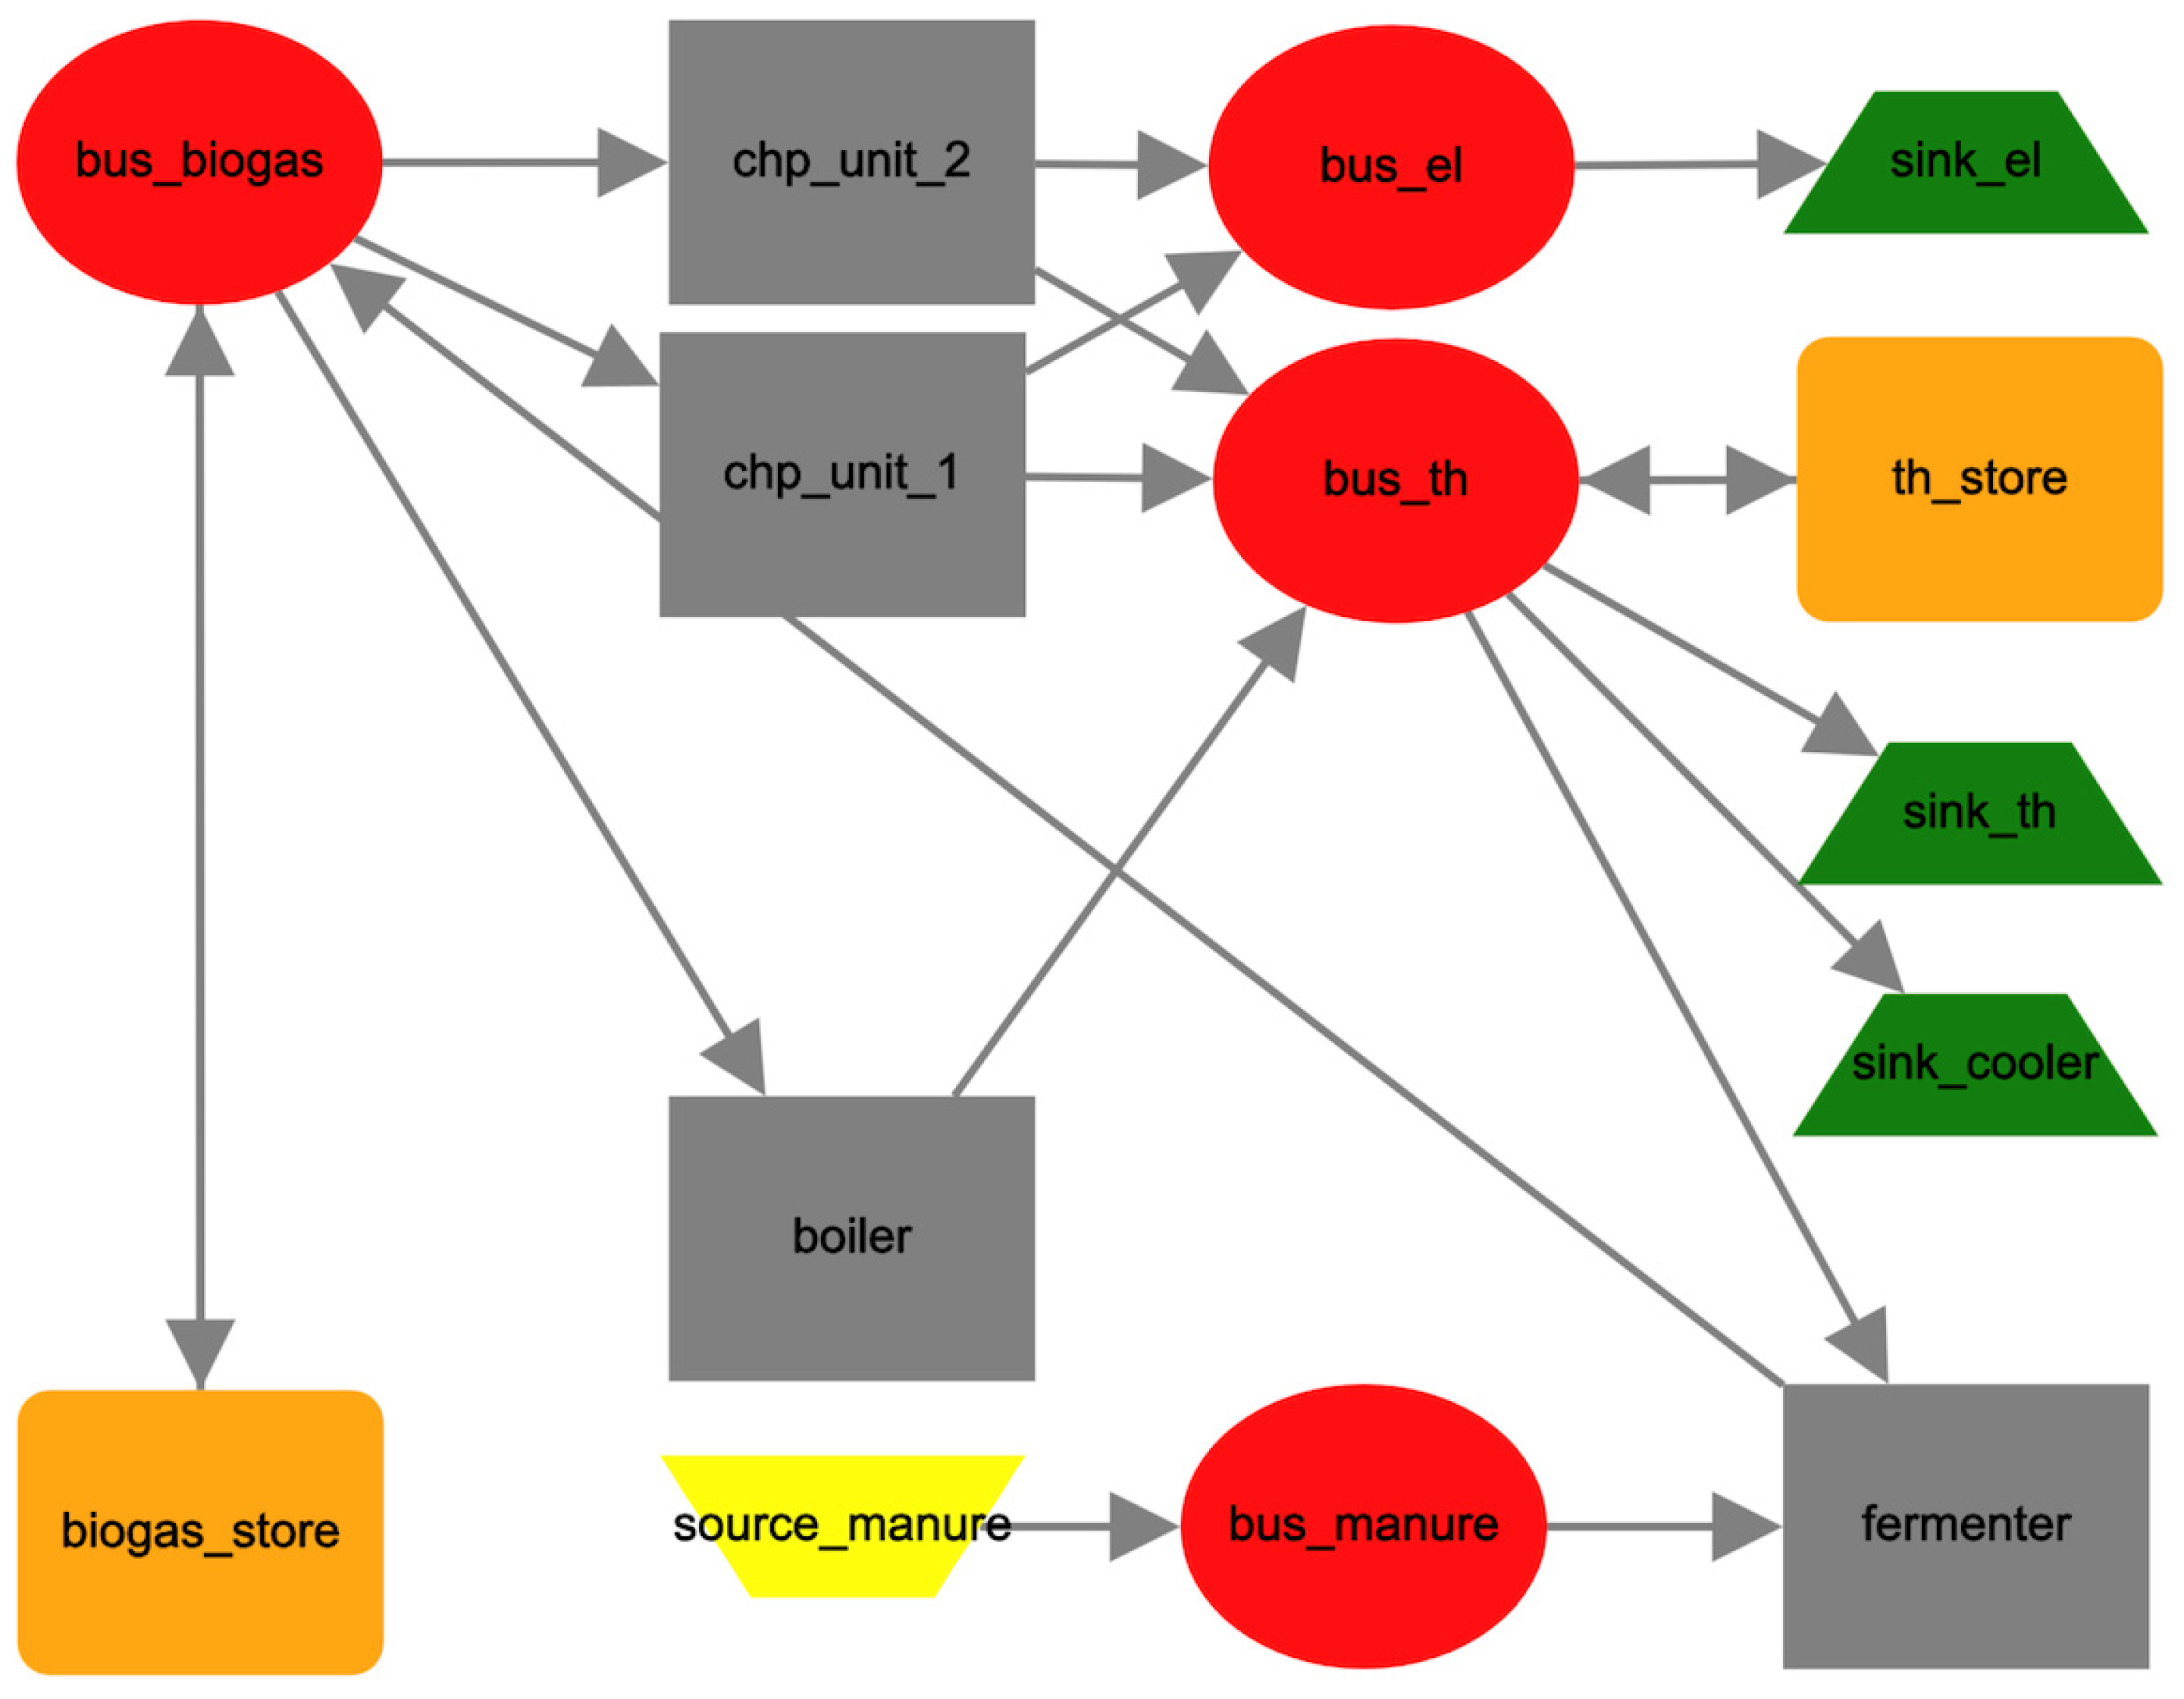
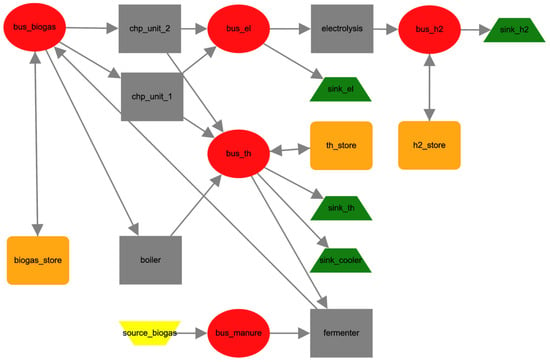
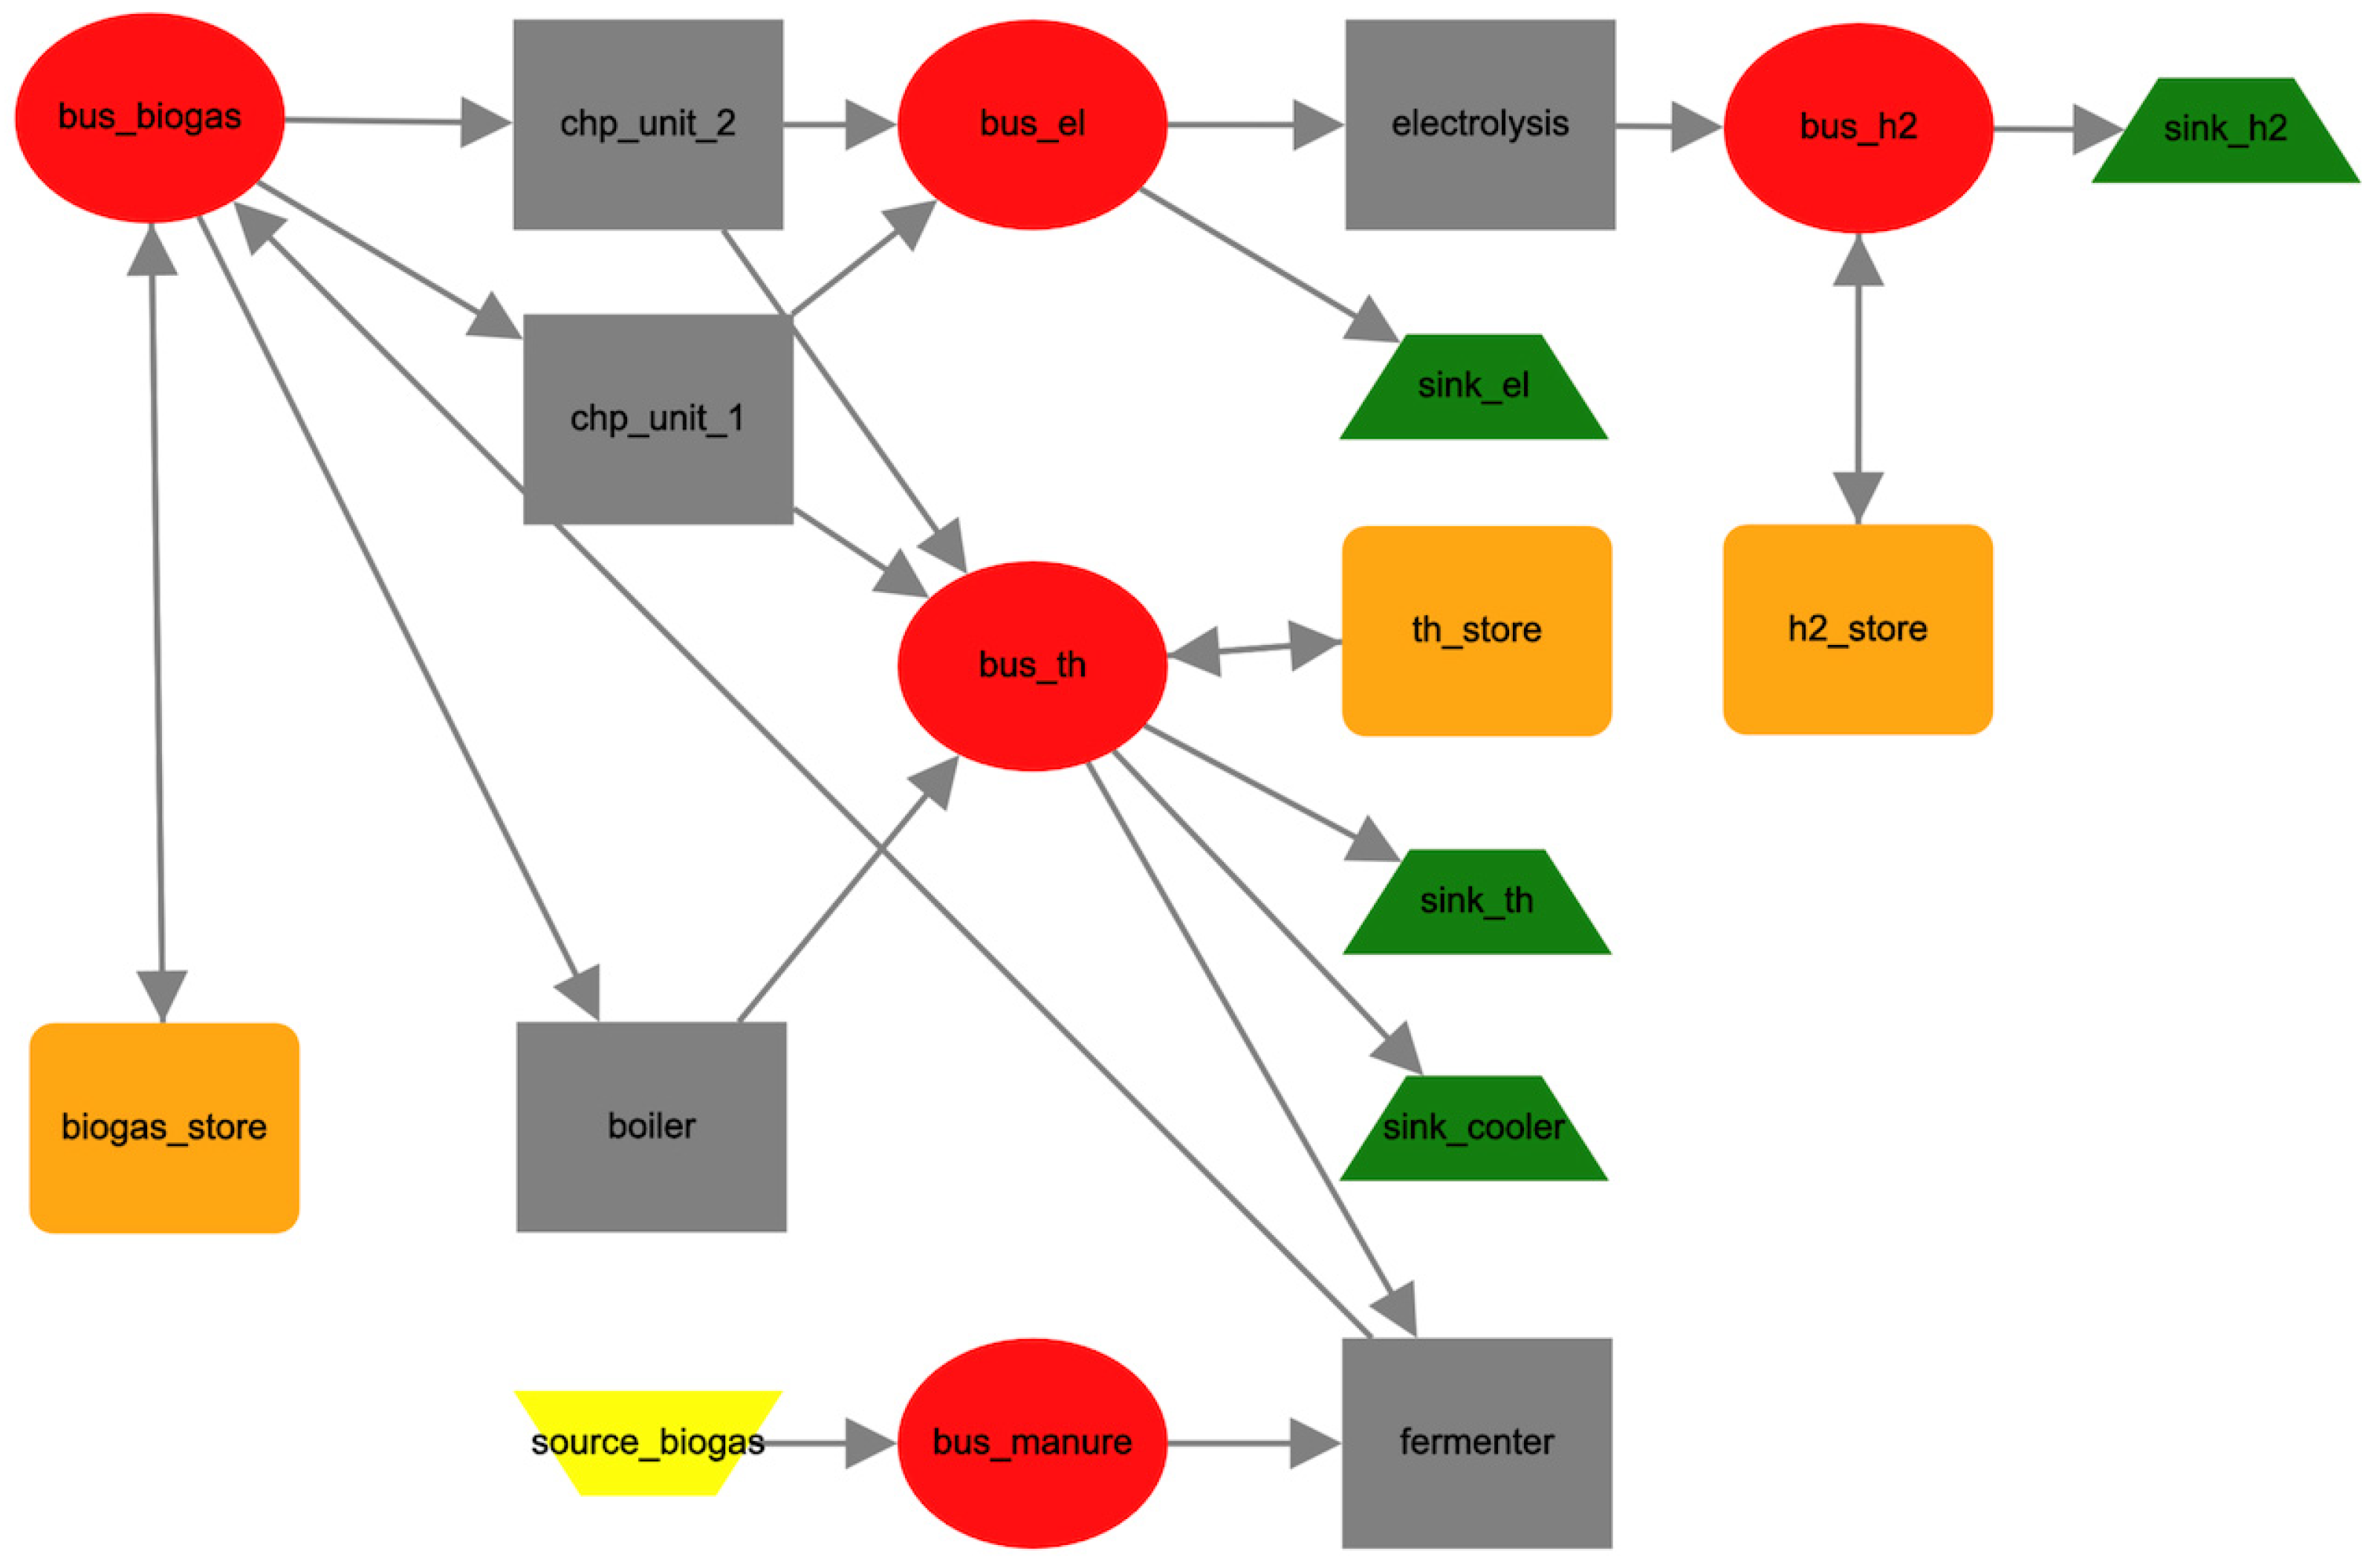
Figure 2 illustrates the overall structure of the energy system model, including the biogas supply, conversion units, storage components, and electricity and heat demand sinks.
Figure 2.
Energy system model of a dairy-manure-based biogas plant (BGP) in Hokkaido: Overall structure.
Electricity and heat are generated by two CHP units. CHP1 delivers 100 kW electrical and 110 kW thermal output (38.43% electric, 42.27% thermal efficiency), while CHP2 provides 100 kW electrical and 121 kW thermal output (38.00% electric, 45.80% thermal efficiency). Both units operate between 50 and 100% load, with efficiencies interpolated linearly; at 50% load, electric efficiency drops to 33%. Minimum uptime is 6 h. A biogas boiler (116 kW thermal, 80% efficiency) supplies additional heat, supported by a thermal storage system (5.7 t water). The corresponding parameters and assumptions are summarized in Table 1.
Table 1.
Summary of the system data.
Electricity is supplied to the local grid under two scenarios:
- FIT—a fixed tariff of 35 JPY (Japanese yen)/kWh, which corresponds to the current FIT purchase price applied to agricultural biogas power generation in Japan [6].
- FIP—variable income based on 2024 spot market prices.
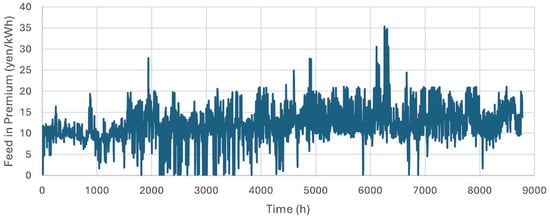
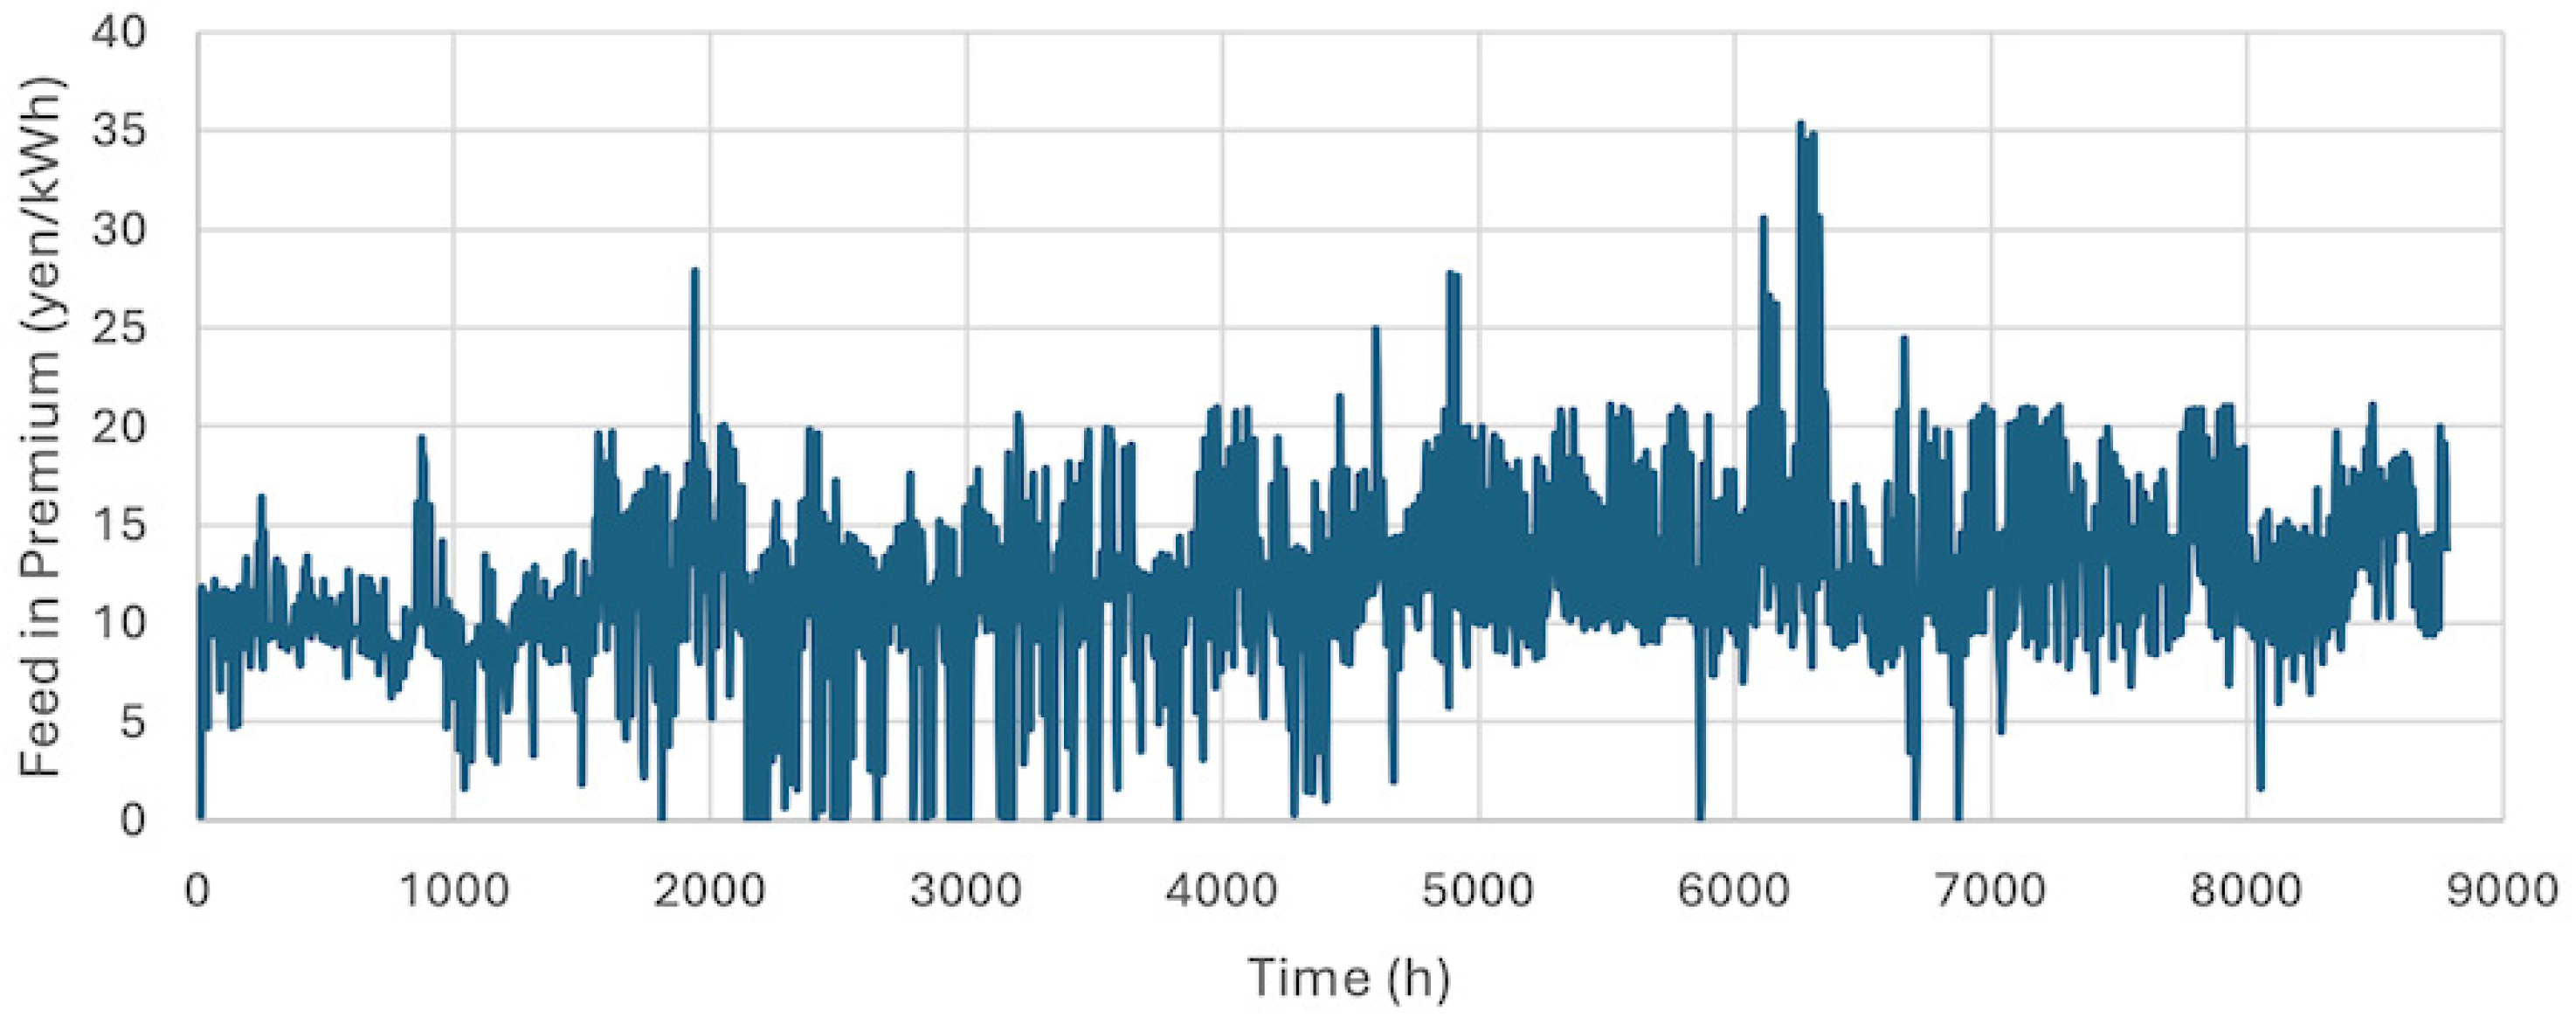
Although the Japanese and European FIP schemes share a similar market-premium structure [17,43], the Japanese system has a distinctive feature: the premium is not predetermined. Instead, only the reference price is published ex ante, and the actual premium is calculated ex post as the difference between the reference price and the reference market price. Consequently, the spot market price functions as the primary economic signal guiding operational decisions and economic assessments for generators (Figure 3). Reflecting this institutional design, the use of Hokkaido spot market price data [44] in our simulations is both appropriate and methodologically consistent with the Japanese FIP scheme.
Figure 3.
Spot market electricity prices in Hokkaido in 2024: Hourly FIP calculated from 2024 spot market electricity prices in Hokkaido under the Japanese FIP scheme. Spot market price data were obtained from the Japan Electric Power Exchange (JEPX).
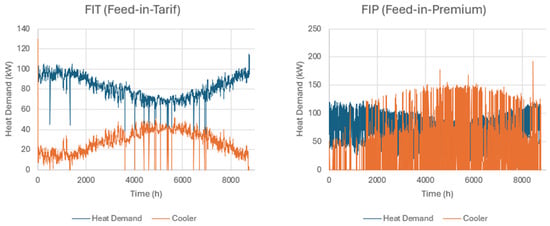
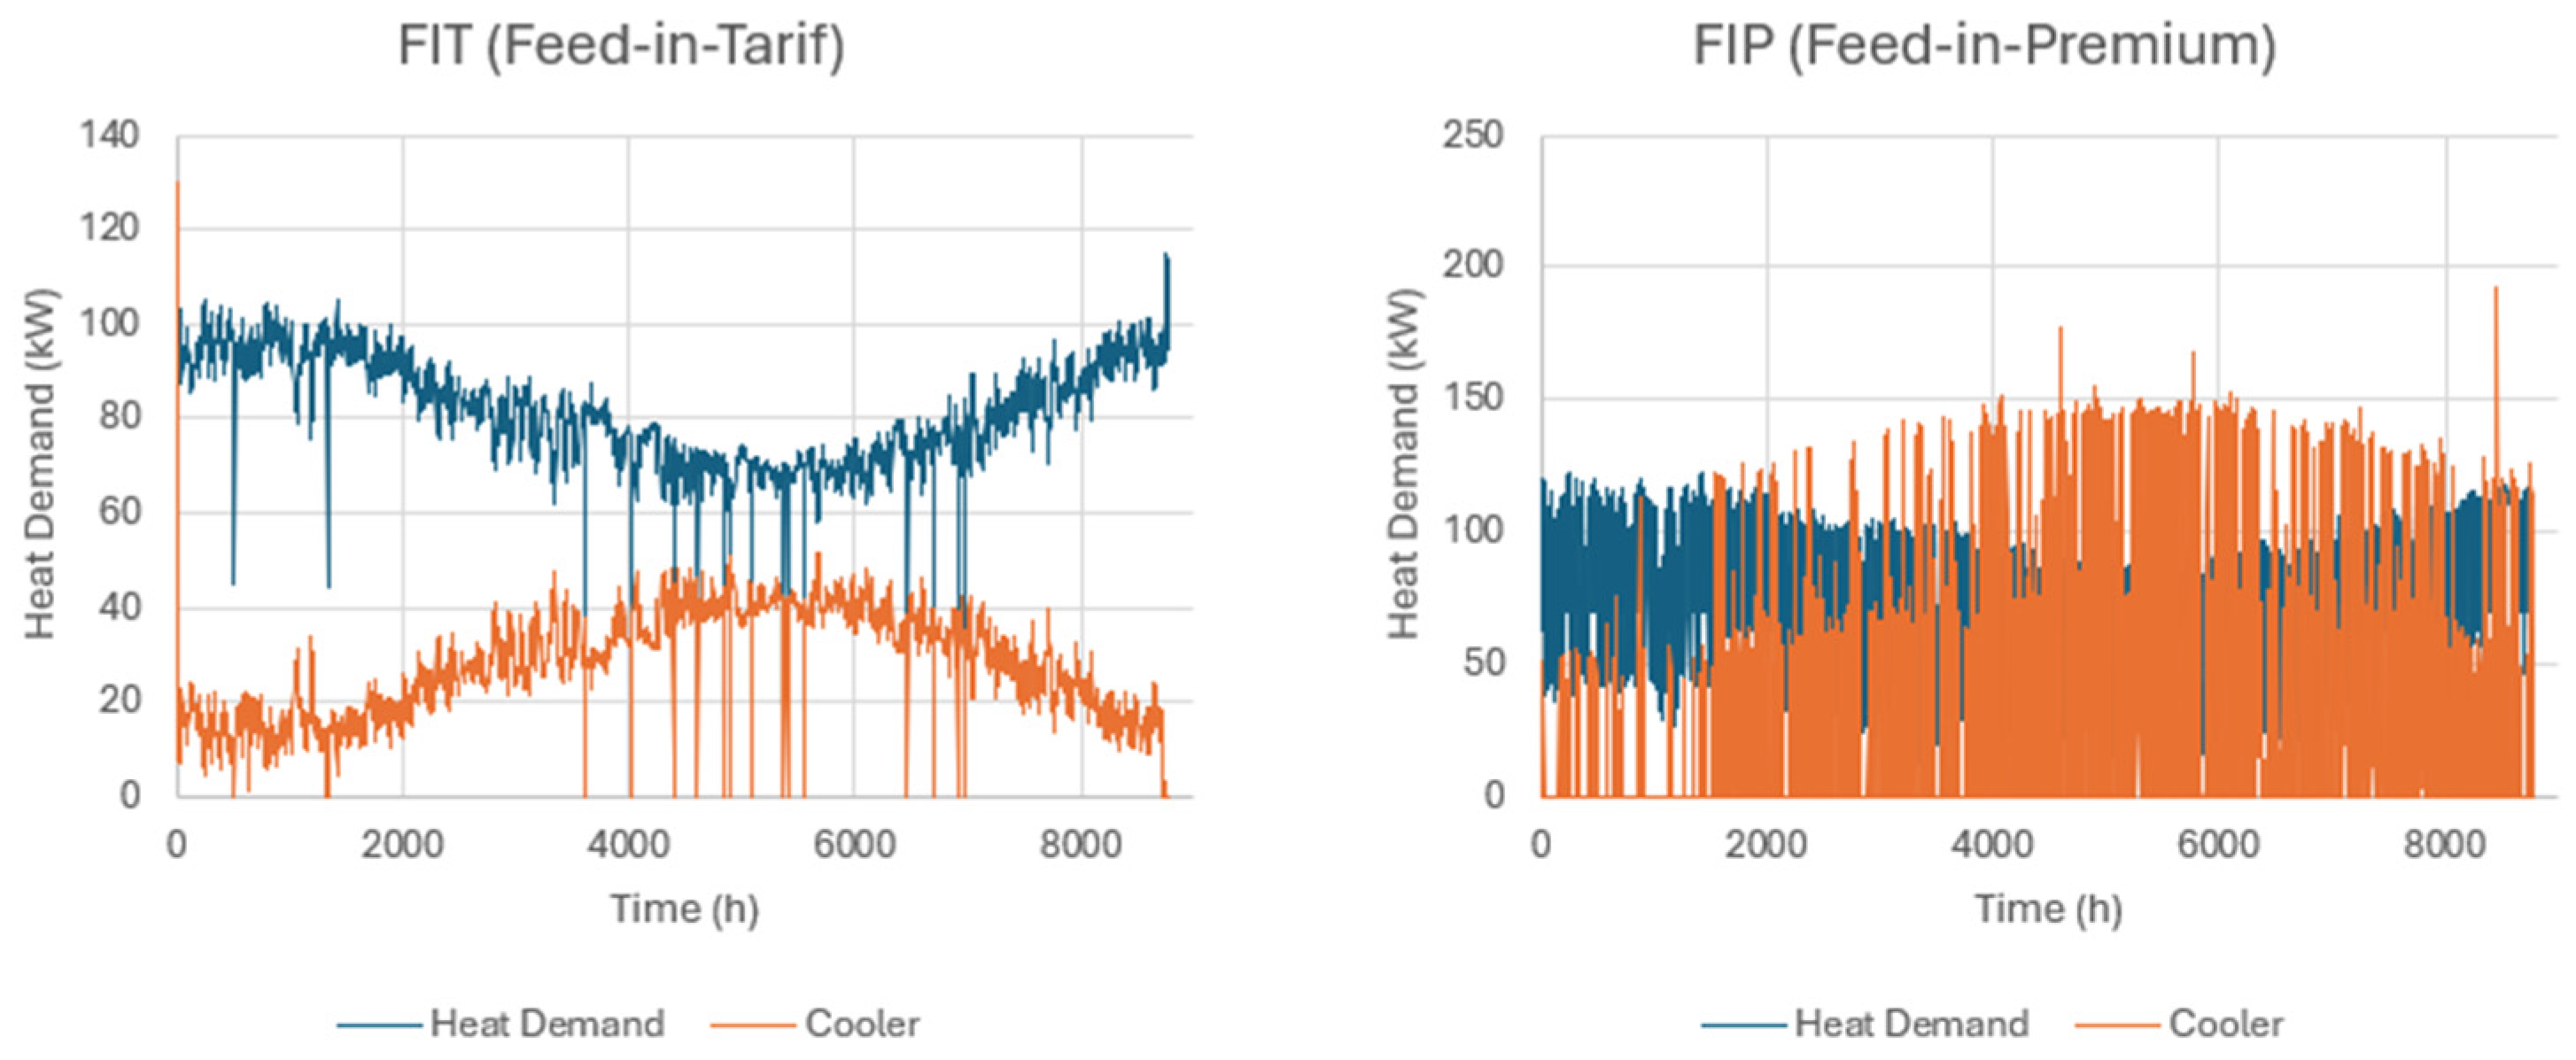
A heat dump was included to manage surplus thermal energy when storage and internal demand are saturated, preventing infeasible model states. To avoid excessive reliance on dumping, a constraint ensures overall plant efficiency remains above 70%. Additional operational profiles of heat demand and heat dumping behavior are provided in Figure 4 to illustrate the thermal balance and model feasibility constraints. This configuration forms the basis for modeling hydrogen production pathways using OEMOF, focusing on SR and EL powered by CHP-generated electricity.
Figure 4.
Annual heat demand and heat dumping behavior under Feed-in Tariff (FIT) and Feed-in Premium (FIP) operation: FIT operation shows stable heat supply with limited excess heat, whereas FIP operation exhibits frequent heat dumping due to price-responsive CHP dispatch, reflecting increased operational flexibility and thermal imbalance.
2.3. EL Model
An alternative configuration of a dairy-manure-based BGP model was developed to assess hydrogen production via EL (Figure 5). Hydrogen-production targets of 5, 10, and 20 kg/day were investigated in three scenarios. Based on market data from C.A.R.M.E.N. e.V. [45], a representative small-scale electrolyzer was selected.
Figure 5.
Schematic of the BGP energy-system model with an electrolysis (EL).
The chosen unit operates at 50 kW nominal electrical input, producing about 0.9 kg H2/h, consistent with the daily target. An efficiency of 60% was assumed, reflecting typical performance PEM electrolyzers in this power range. The minimum uptime is 12 h. In the OEMOF model, the electrolyzer was implemented as a single component with defined electricity input and hydrogen output, supplied by the BGP’s CHP units.
A 200 kWh low-pressure, compression-free hydrogen storage system was added to buffer production–demand fluctuations and help the model converge. A constraint was applied to ensure the cumulative hydrogen output meets the annual target for 2024.
2.4. SR Model
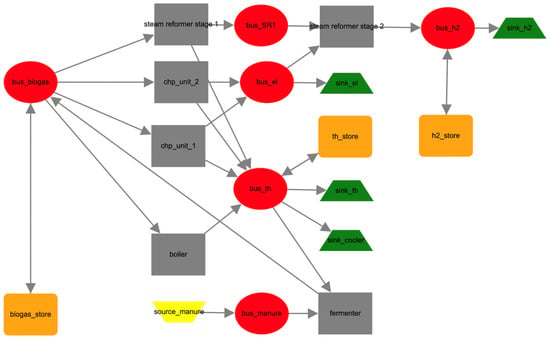
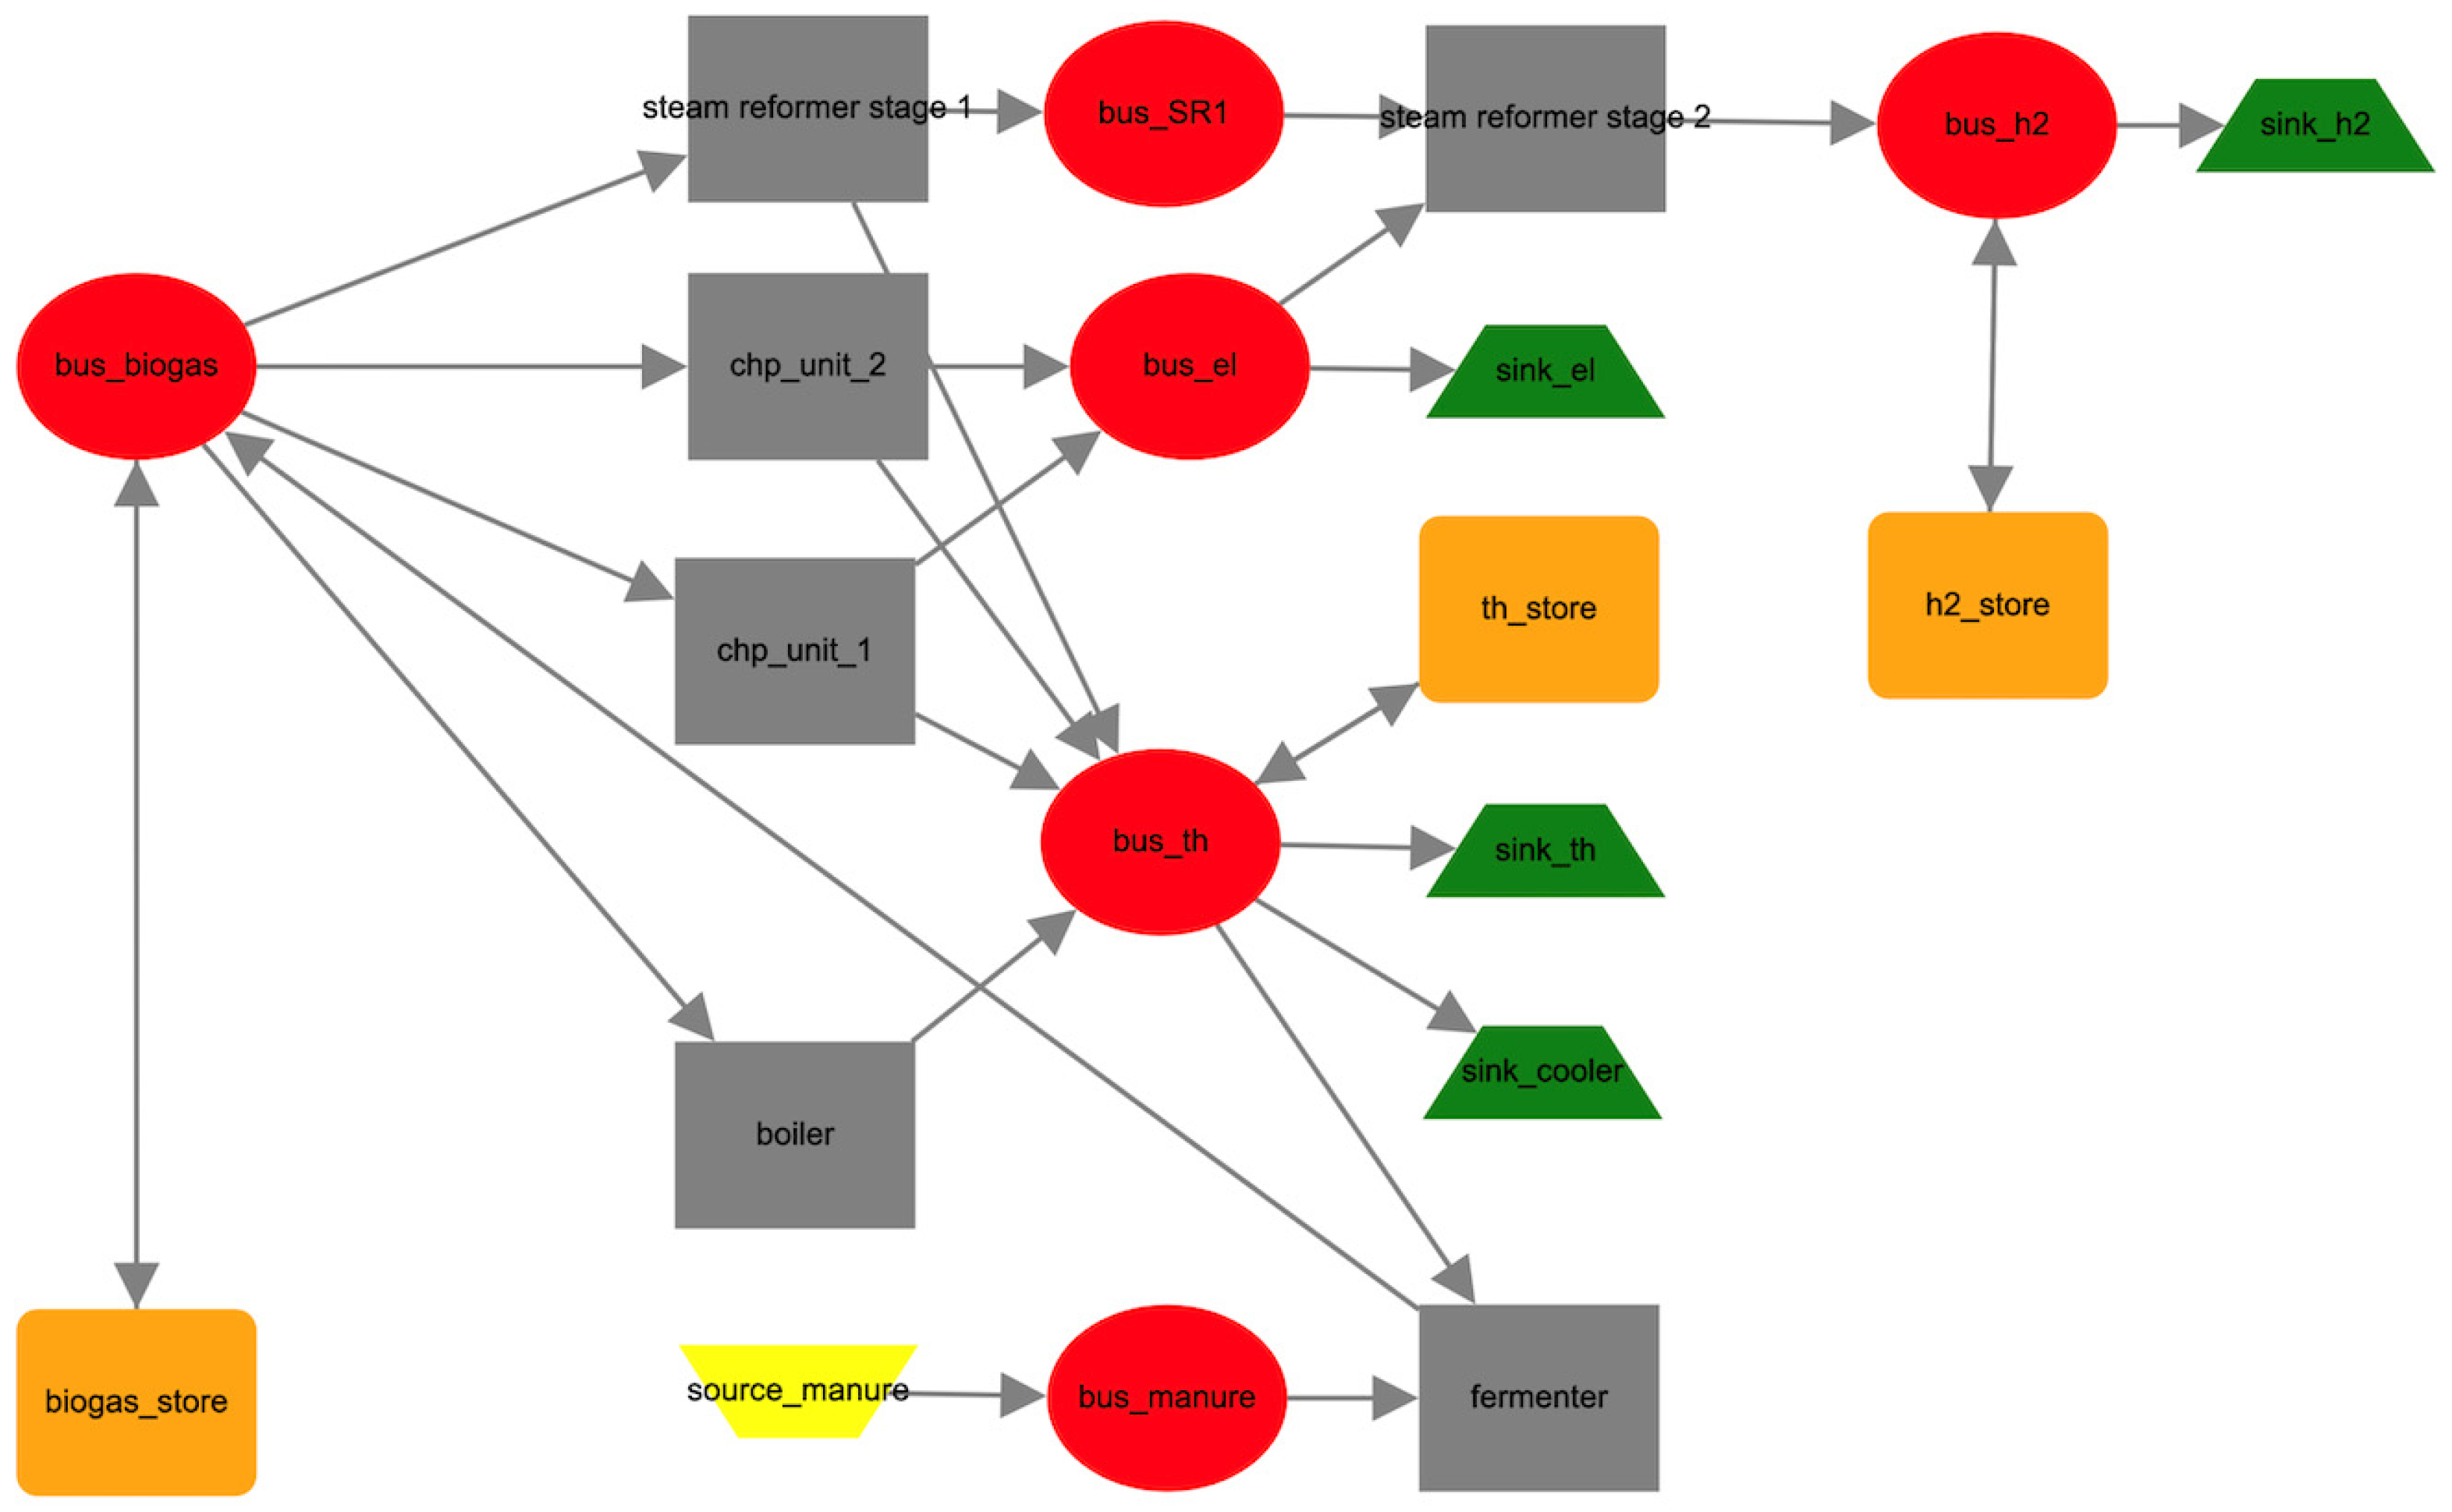
To assess hydrogen production from biogas, the base model was extended with a SR unit (Figure 6). Three hydrogen-production targets were examined: 5, 10, and 20 kg/day. Due to the lack of commercially available small-scale units, the BTH400 by Eflox (Renningen, Germany) was used as a reference and adapted for the model.
Figure 6.
Schematic of the BGP energy-system model with a steam reformer (SR).
The downsized reformer was configured for 20 kg/day hydrogen output, with an overall efficiency of 55.5%, electrical demand of 2.5 kW, thermal output of 12 kW, and biogas input of 50 kW. A minimum uptime of 48 h was set, due to the long start-up process for SRs. These parameters reflect realistic operating conditions while ensuring compatibility with the existing plant infrastructure. Heat recovery from the reformer was considered to improve system efficiency.
In OEMOF, the reformer was modeled as a two-step process:
Biogas-to-Hydrogen Conversion—SR of methane-rich biogas, with thermal energy supplied by CHP units and biogas boilers.
Power Consumption—Electrical demand met primarily by CHP units, supplemented by the grid if necessary.
This modular approach enables detailed analysis of energy flows and integration effects. Hydrogen storage and the annual production constraint from the EL model were retained.
2.5. Model Assumptions and Optimization Framework
The optimization problem is formulated as a linear cost-minimization model with technical constraints. The objective is to maximize the net operational profit of the BGP while satisfying hydrogen production requirements. The objective function is defined as:
Maximize:
where:
Σ_t [P_elec(t) × E_export(t) + P_H2(t) × H_prod(t) − C_fuel(t)]
- -
- P_elec(t) is the FIT/FIP electricity price at time t
- -
- E_export(t) is electricity exported to the grid
- -
- P_H2(t) is the implicit hydrogen value
- -
- H_prod(t) is hydrogen produced at time t
- -
- C_fuel(t) represents biogas consumption costs
All optimization tasks are solved using the CBC solver via Pyomo, applying a maximum MIP gap of 0.05 and allowing up to 10,000 iterations. Presolve is enabled to improve computational efficiency, and the model is evaluated at an hourly temporal resolution. These settings ensure computational feasibility and solution robustness.
Component parameters are calibrated based on manufacturer data (CHP, electrolyzer, SR), BGP operational data (biogas flow rates, temperature requirements), and literature-derived values (efficiency curves, thermal properties). Heat-demand profiles are generated using 2024 weather data from the nearest Hokkaido station. Electricity market parameters follow the Japanese FIP regulatory framework.
The modelling relies on several key assumptions. The CHP units are assumed to exhibit a linearly load-dependent efficiency and must operate for a minimum of six hours once started. The electrolyzer operates at a fixed efficiency of 60%, reflecting typical performance characteristics of PEM systems, while the steam reformer is modelled with a constant efficiency of 55.5% and a minimum uptime requirement of 48 h due to its slow start-up dynamics. Biogas composition, particularly methane content, is treated as constant throughout the simulation, and hydrogen storage is assumed to be loss-free. Finally, electricity price signals are represented using Hokkaido spot market prices, which serve as a proxy for market conditions under the Japanese FIP scheme.
The model is subject to several limitations. First, the downsized steam reformer introduces scaling uncertainties, as its performance characteristics may not fully reflect those of commercially available small-scale units. The efficiency curves used for the CHP units, electrolyzer, and SR are simplified representations of real-world behaviour, which can vary under different operating conditions. Biogas composition is assumed to remain constant, particularly with respect to methane concentration, despite natural variations in feedstock and digestion processes. Hydrogen compression and storage losses are not modelled, resulting in an idealised representation of storage behaviour. Economic parameters are treated as static and do not account for component degradation, maintenance cycles, or cost fluctuations over time. Furthermore, uncertainties in weather conditions and electricity market prices are not captured through probabilistic or stochastic methods. Finally, the analysis does not incorporate potential regulatory changes that could affect future FIP conditions, introducing an additional layer of uncertainty.
Hydrogen production targets (5, 10, and 20 kg/day) are enforced through annual production constraints. The assumed hydrogen demand plays a central role in shaping system behavior, as the model is required to meet a predefined annual production target rather than responding to economic signals. This constraint forces the system to operate the electrolyzer or SR whenever sufficient resources are available, which can alter CHP dispatch patterns, biogas allocation, and storage utilization compared with an unconstrained system. As a result, hydrogen production is treated as a fixed requirement rather than an economically optimized output, meaning the modelling outcomes reflect the feasibility and operational implications of meeting specific hydrogen demand levels rather than predicting market-driven hydrogen production. Consequently, the applicability of the results is strongest for scenarios in which hydrogen demand is policy-driven or contractually fixed, such as supplying a local fueling station or meeting internal consumption goals, rather than for situations where hydrogen would be produced only when economically advantageous.
3. Results
3.1. Baseline Comparison: FIT vs. FIP Operations
3.1.1. Electricity Supply Under FIT and FIP
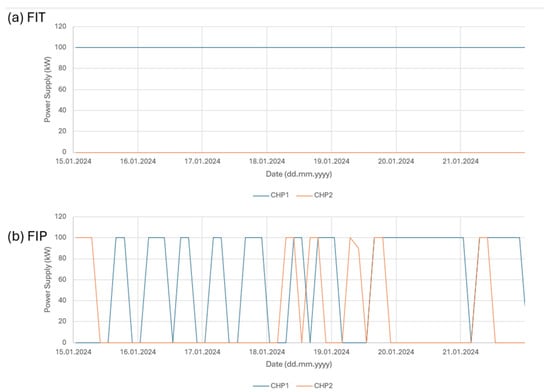
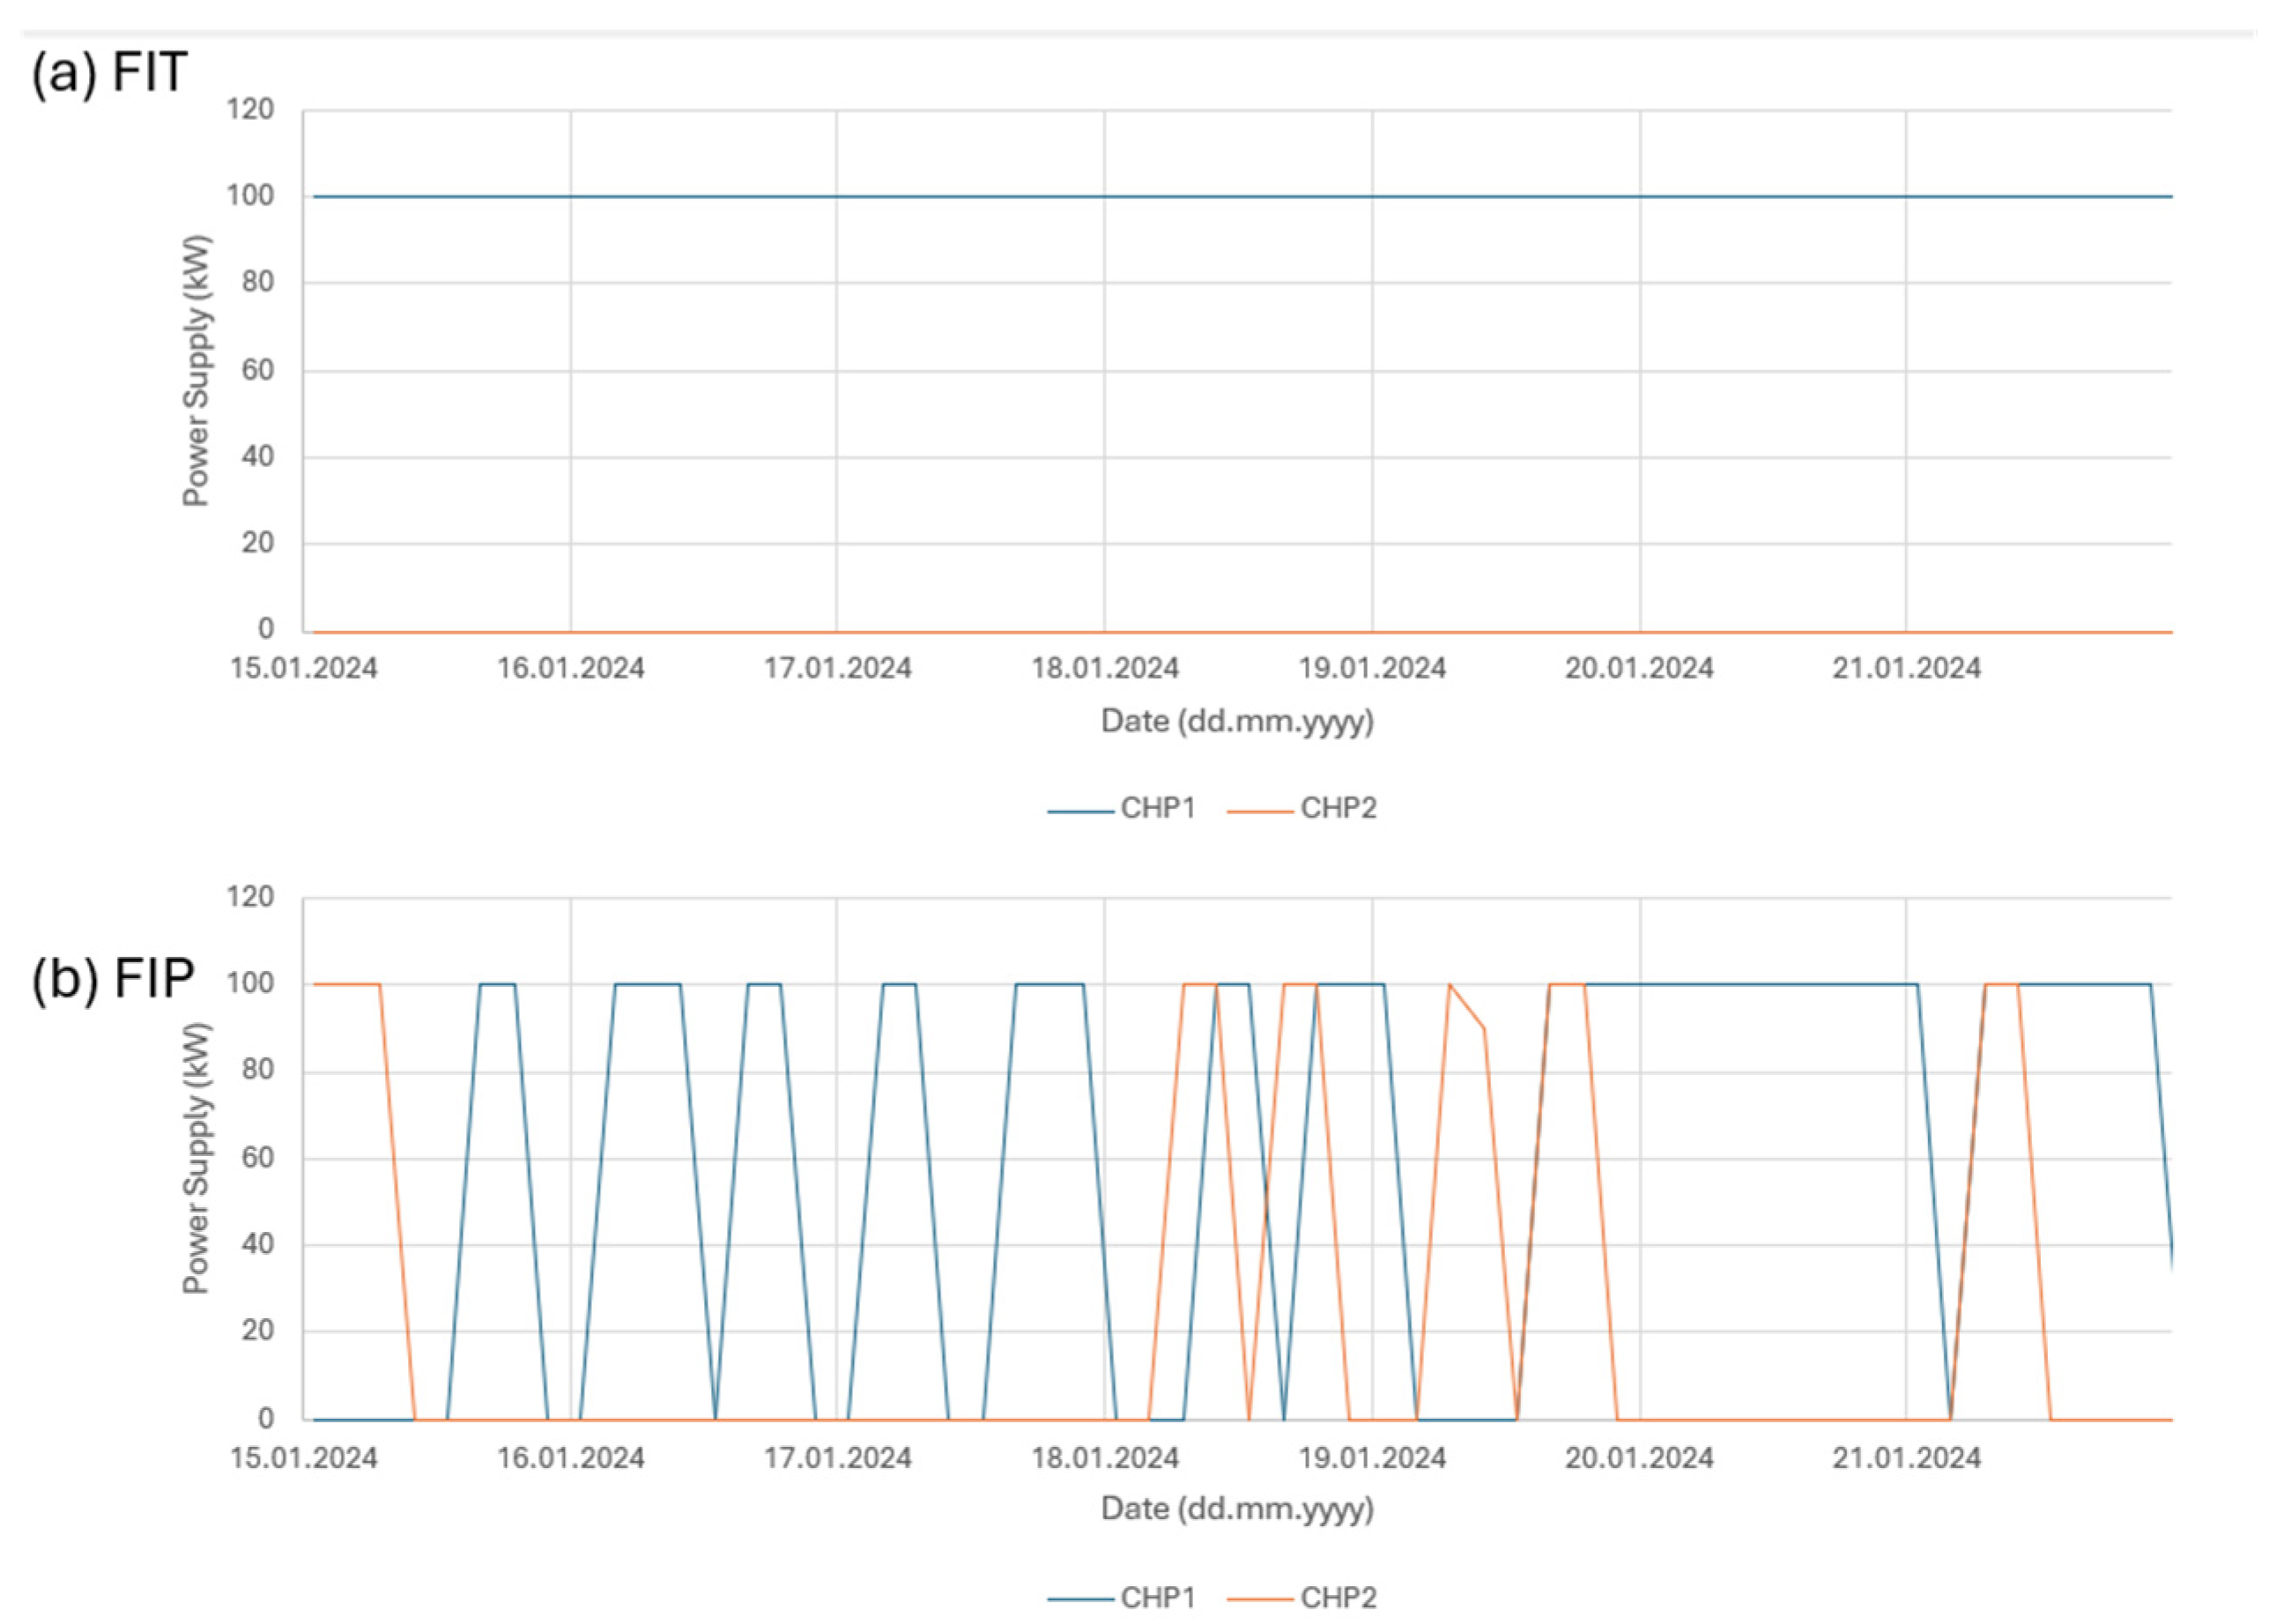
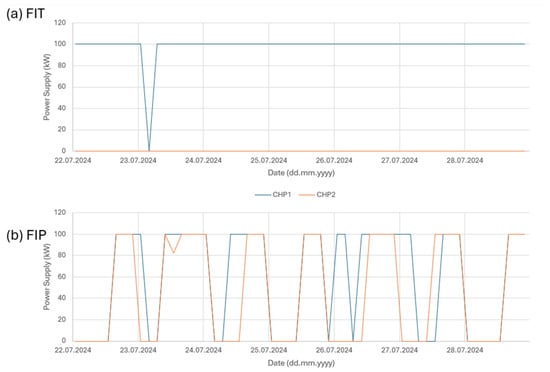
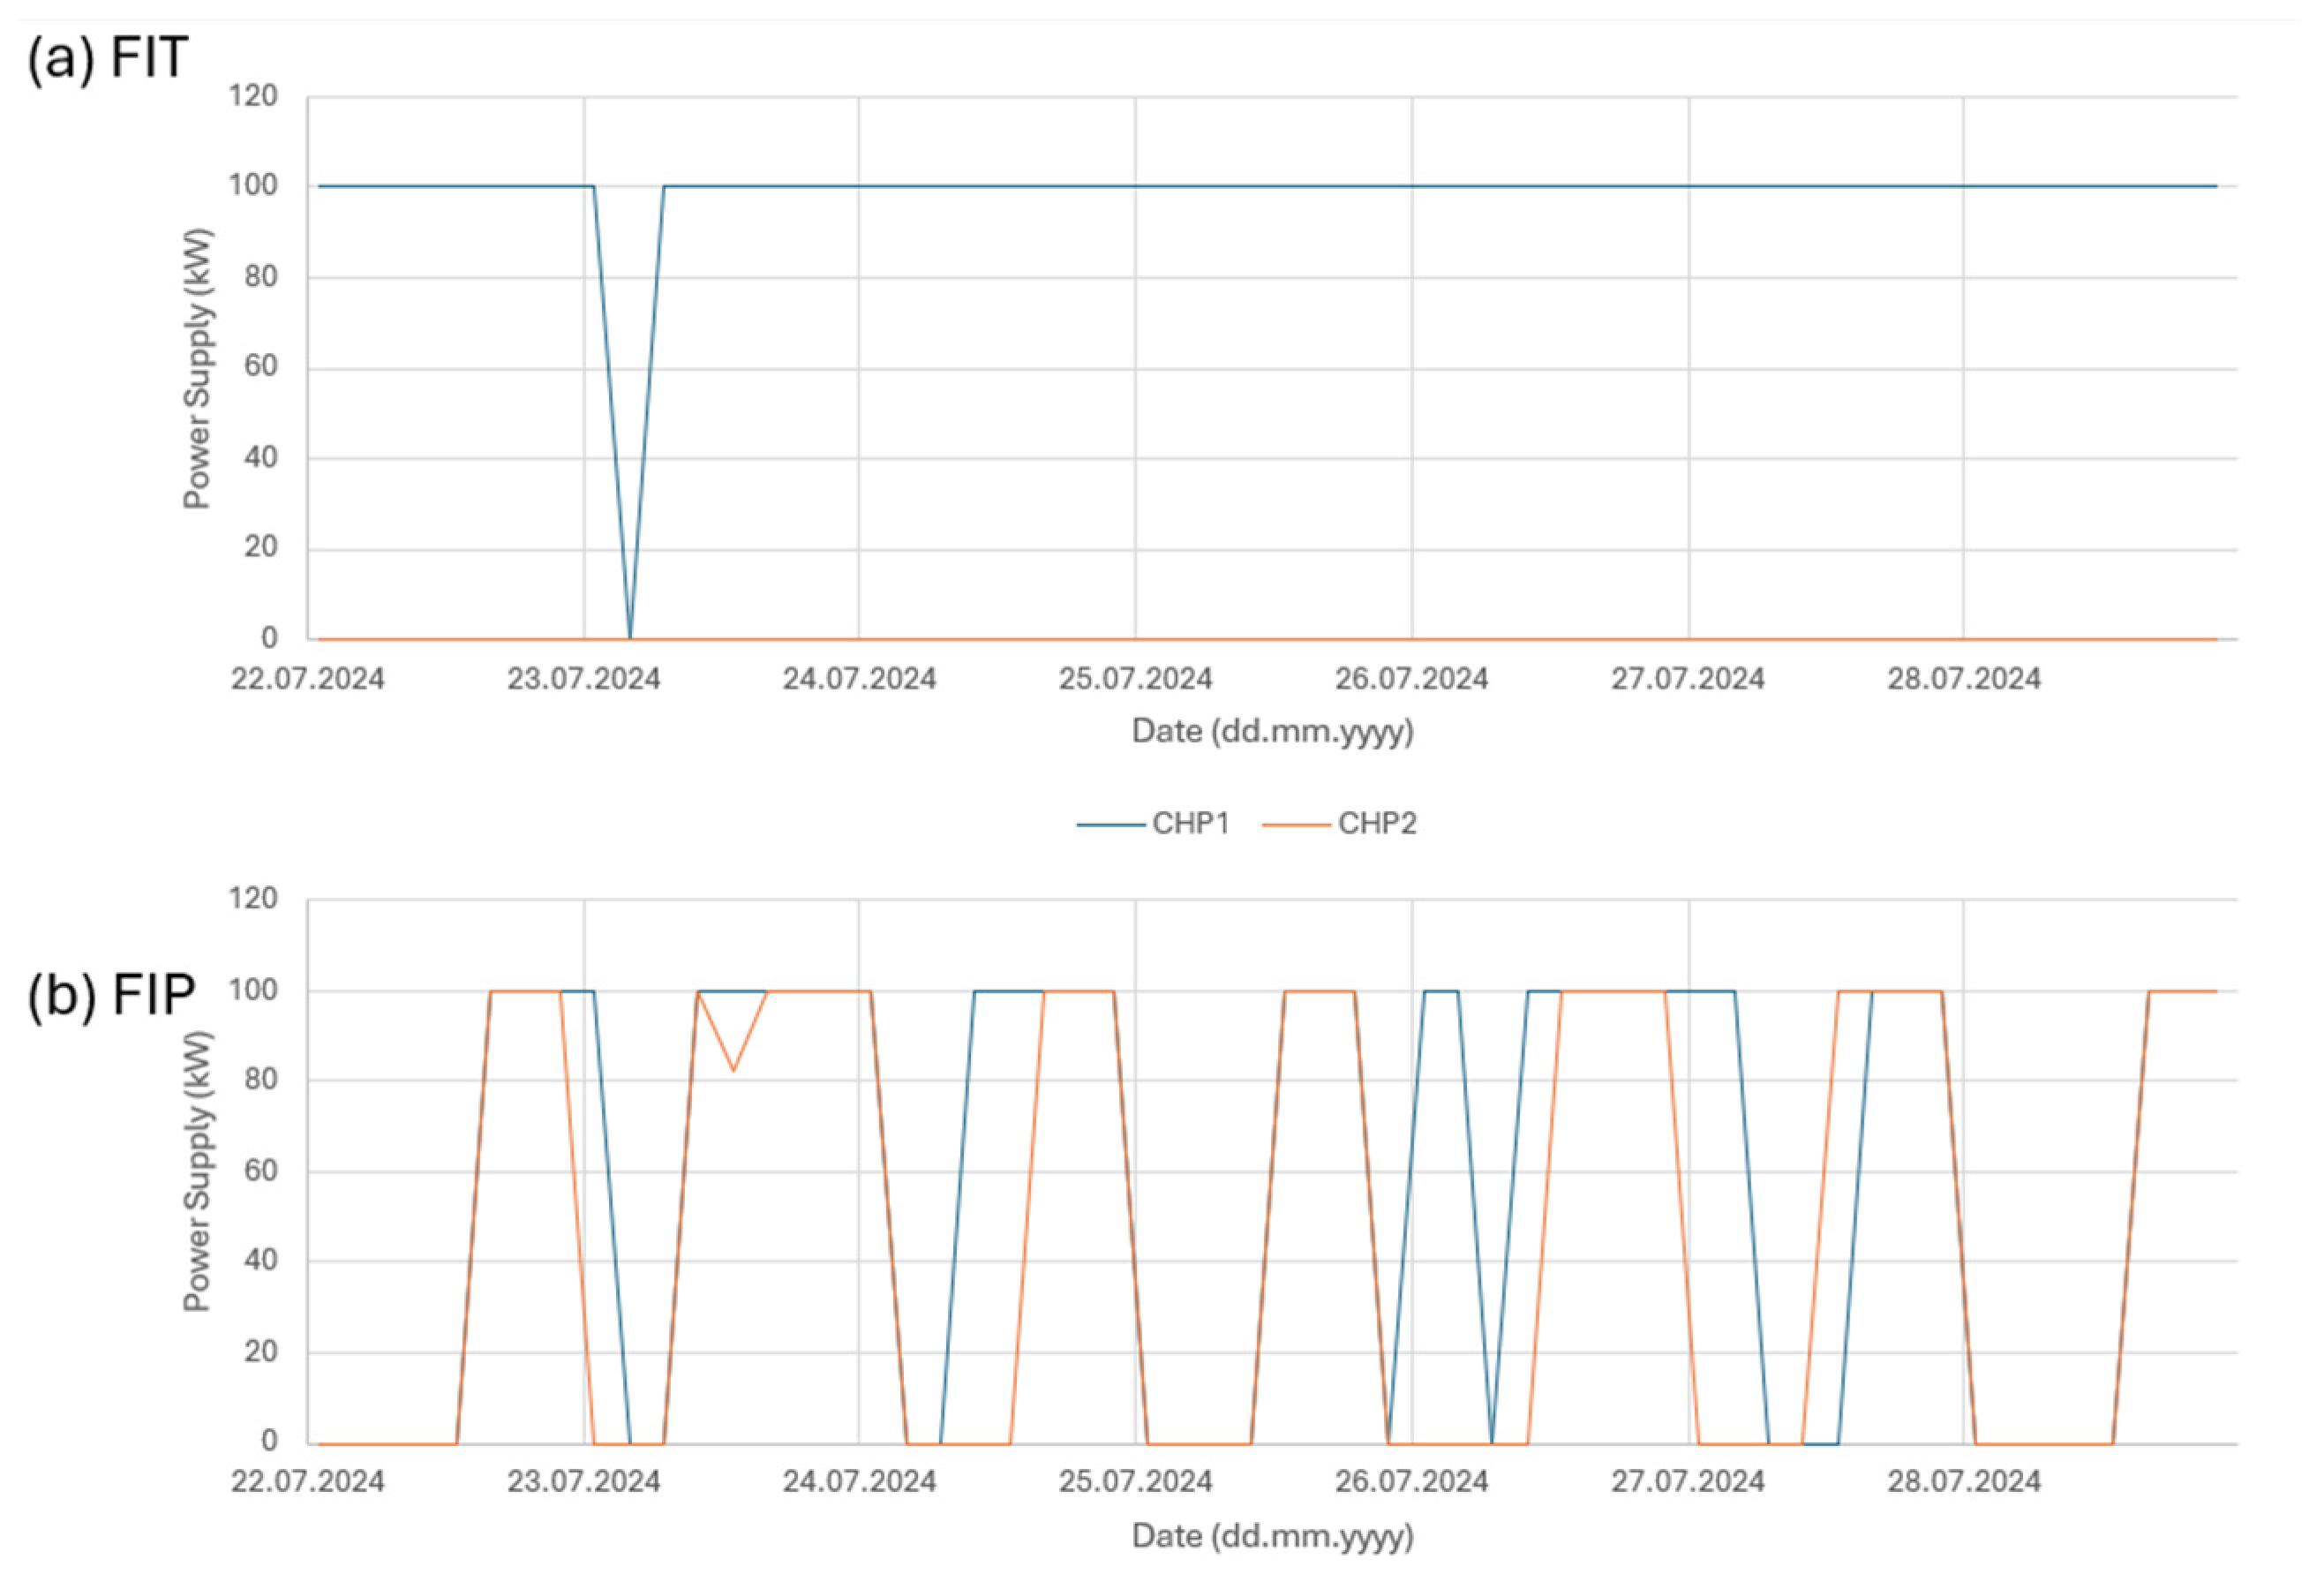
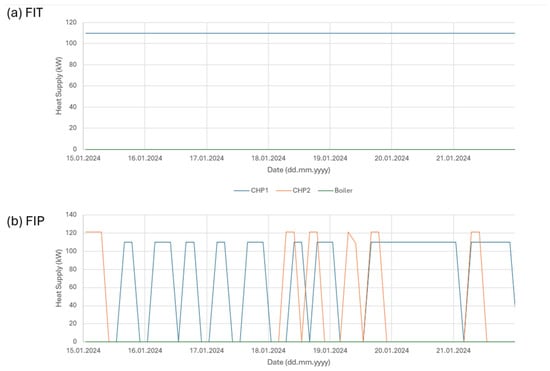
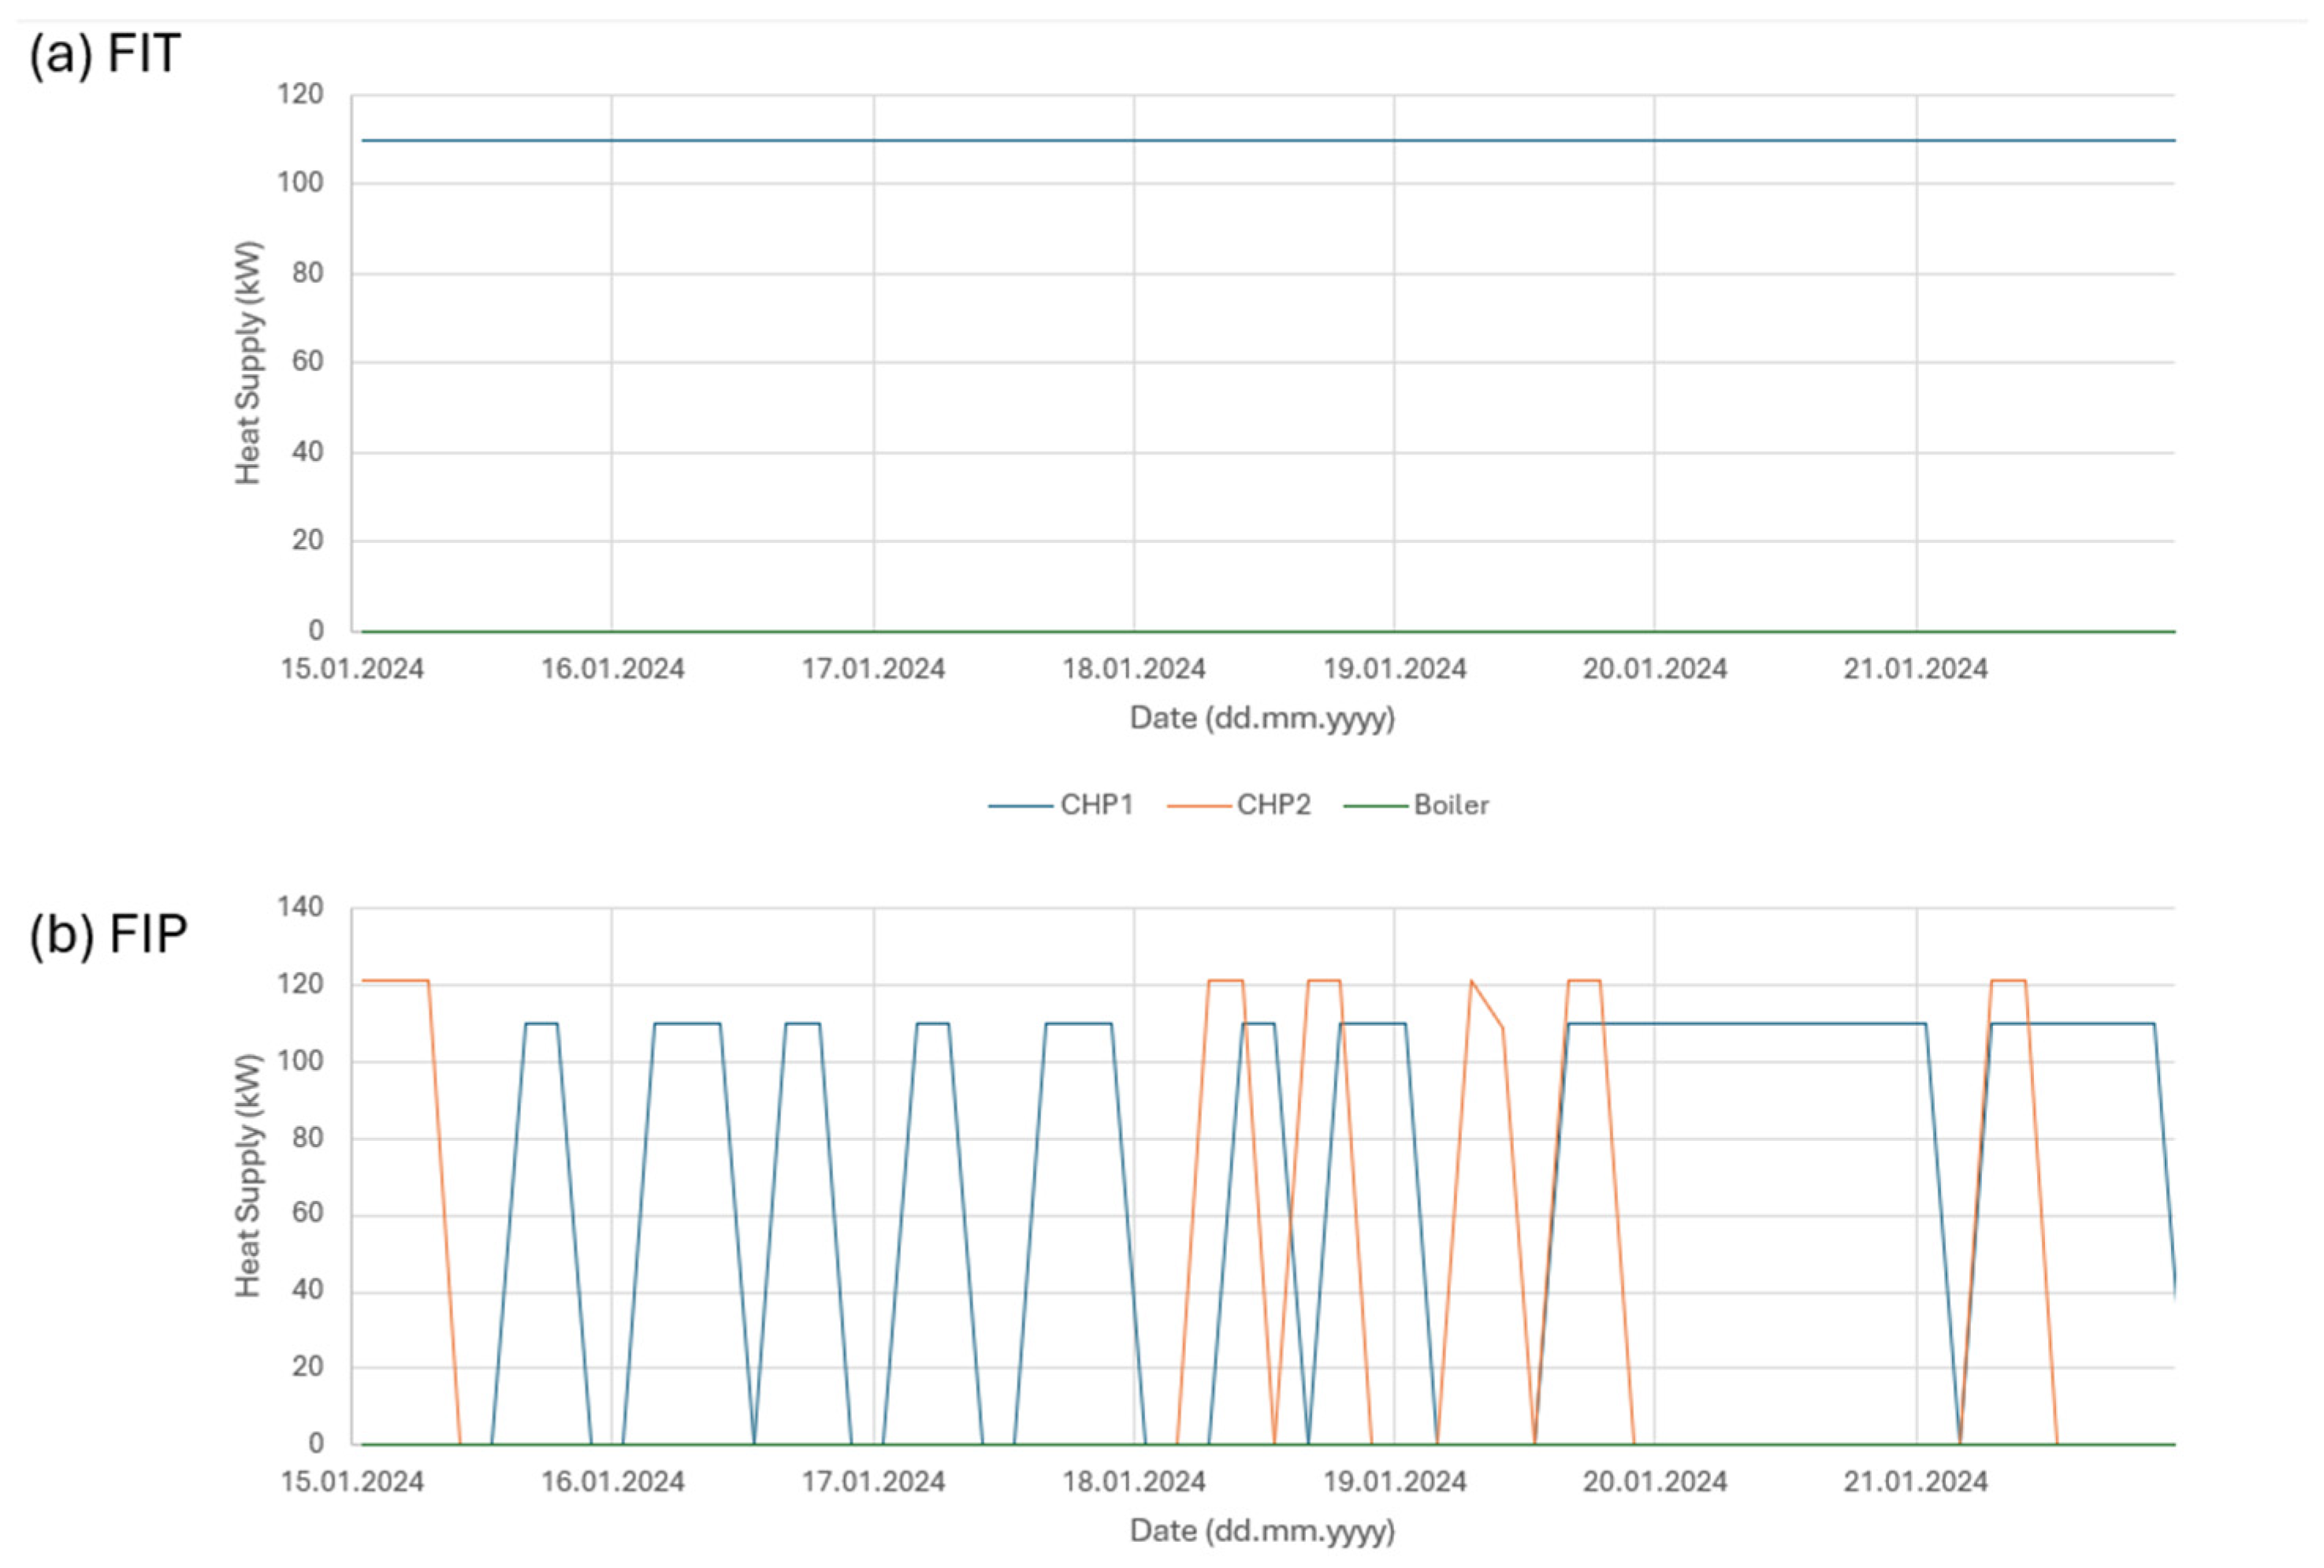
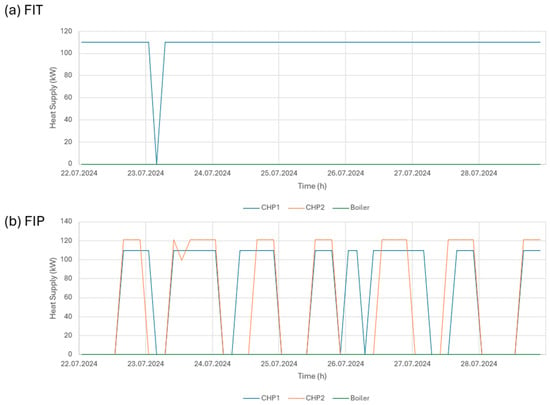
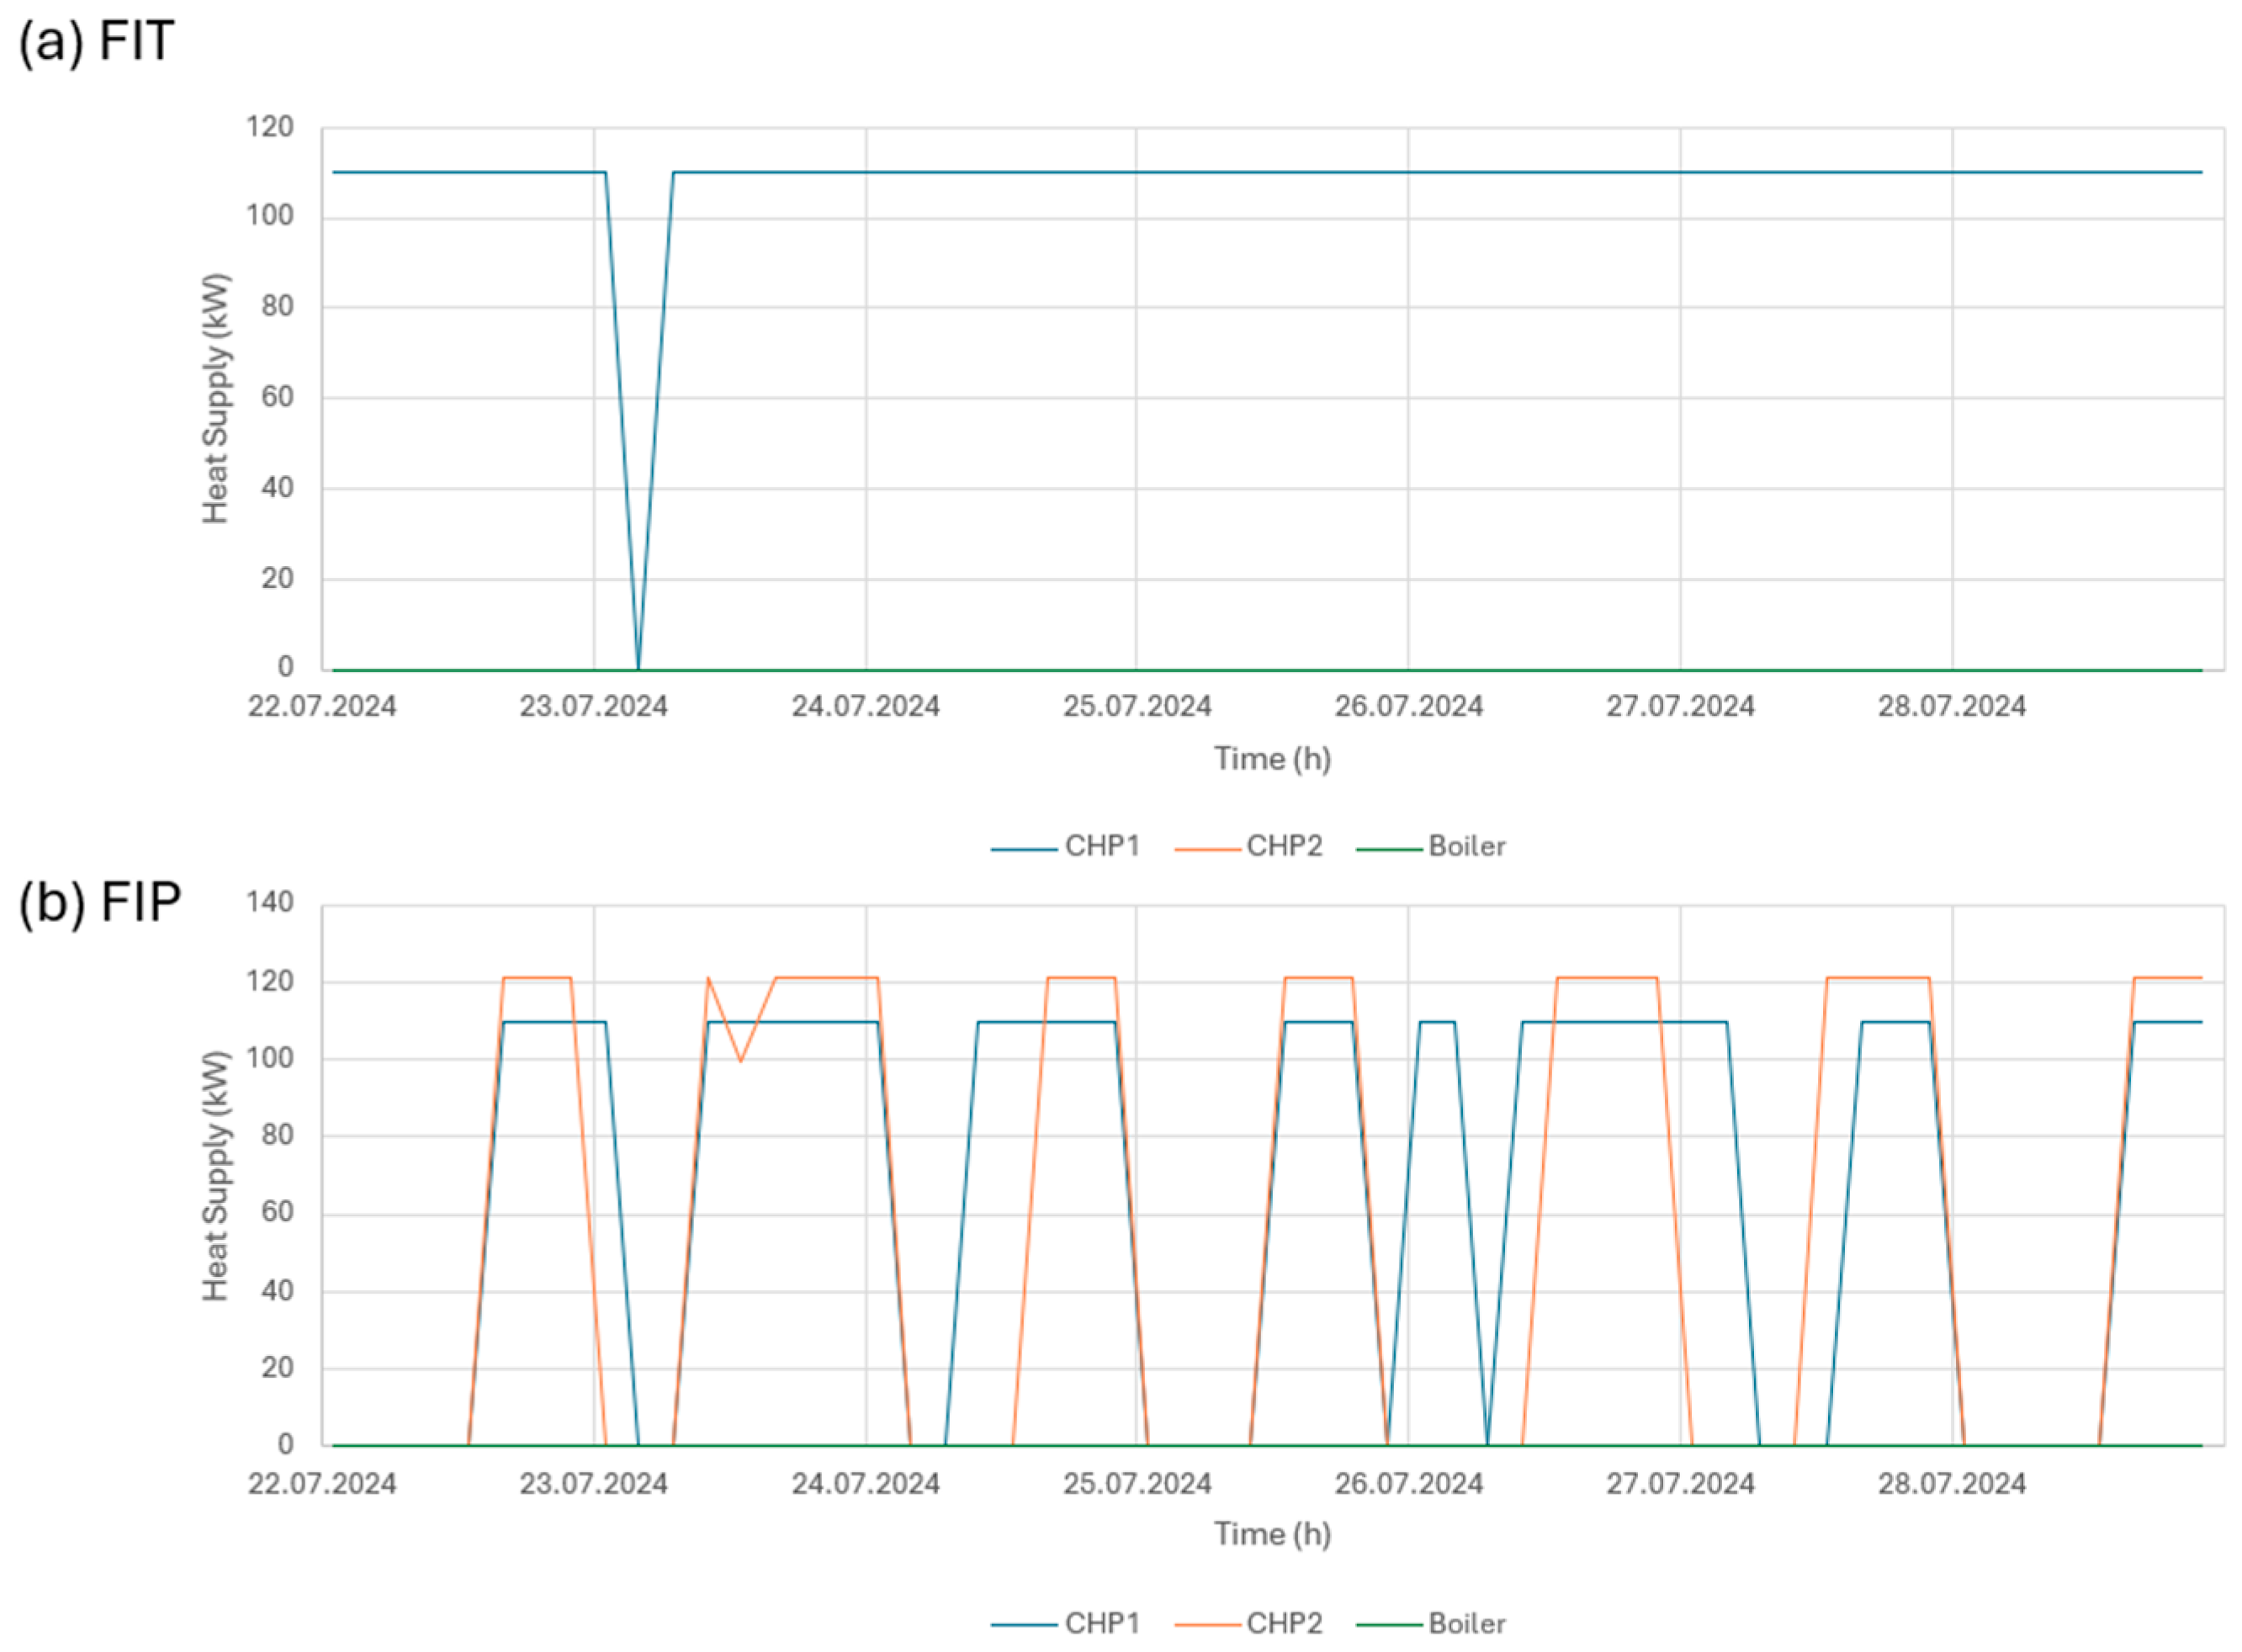
In this section the results of the energy system modeling are presented. Figure 7 and Figure 8 presents the annual operational profiles of the biogas CHP units under the FIT and FIP schemes. Although both frameworks support renewable electricity generation, their differing economic structures lead to distinct operational behaviors.
Figure 7.
Annual Electricity Feed-in Comparison under FIT and FIP Schemes: One week in winter 15–21 January.
Figure 8.
Annual Electricity Feed-in Comparison under FIT and FIP Schemes: One week in summer 22–28 July.
Under the FIT scheme, CHP 1 operates close to its rated electrical output for most of the year, with only limited shutdown periods. CHP 2 remains unused throughout the simulation period because the entire heat demand can be met by CHP 1 alone and CHP 1 exhibits a slightly higher electrical efficiency, making it economically preferable under FIT. This operational pattern reflects the economic incentive to maximize generation when the selling price is constant and independent of market conditions, resulting in a stable but relatively inflexible mode of operation. In contrast, under the FIP scheme, generators are exposed to fluctuations in spot market prices. The simulation results show that both CHP units adjust their output more frequently, curtailing or suspending generation during low-price periods and increasing output when prices are higher. This market-responsive behavior indicates that biogas CHP systems can operate flexibly in ways that support renewable-energy market integration.
As a result of this price-driven operational strategy, the total annual electricity supplied to the grid under FIP is lower than under FIT. However, this reduction reflects an economically rational adjustment to market signals rather than a technical constraint of the CHP units. Overall, the baseline comparison demonstrates that the FIP scheme not only changes the dispatch characteristics of BGPs but also enhances their suitability as flexible, multi-functional assets within regional energy systems.
3.1.2. Thermal Energy Supply
Figure 9 and Figure 10 illustrates the annual thermal energy supply from the CHP units and the auxiliary boiler under the FIT and FIP schemes. The thermal behavior observed in this study is shaped not only by the operational incentives introduced by each policy framework but also by the thermal balance configuration described in Section 2.
Figure 9.
Annual Heat Supply Comparison under FIT and FIP Schemes: One week in winter 15–21 January.
Figure 10.
Annual Heat Supply Comparison under FIT and FIP Schemes: One week in summer 22–28 July.
Under the FIT scheme, only CHP 1 operates throughout the year, providing a stable thermal supply near its rated output. Because the fermenter heat demand remains almost constant across seasons, CHP 1 alone is sufficient to meet the internal heat demand. During short periods of reduced CHP output, the thermal storage compensates for the deficit, and the auxiliary boiler can provide heat to maintain fermenter temperature if necessary. However, in this scenario it is not necessary, resulting in 0 h of boiler operation. When CHP output exceeded internal heat demand, surplus heat was generated and partially discarded, subject to the global efficiency constraint of maintaining at least 70%. In contrast, under the FIP scheme, CHP thermal output fluctuates considerably due to price-responsive dispatch based on spot market conditions. During low-price hours, CHP output is curtailed, resulting in reduced thermal supply; however, similar to the FIT case, the thermal storage remained the primary balancing component, and boiler operation was not required. The FIP baseline scenario produced slightly more annual heat dumping than FIT because CHP 2—which operates during high-price periods—exhibits marginally higher thermal efficiency than CHP 1, thereby generating more heat and increasing the surplus beyond internal demand.
Although internal heat requirements are fully satisfied under both schemes, the composition of heat sources (CHP, thermal storage, and heat dumping) differs substantially. These shifts in thermal supply dynamics indicate that flexible operation under the FIP framework enhances economic performance on the electricity side but also increases surplus heat generation and, importantly, may reorganize the system’s overall dependence on different thermal sources in a manner distinct from FIT operation. However, these results should be interpreted in light of the model’s simplified representation of thermal behavior, including fixed efficiency assumptions and the absence of short-term thermal losses, which may limit the precision of the estimated heat balances.
3.1.3. Economic Performance Under FIT and FIP
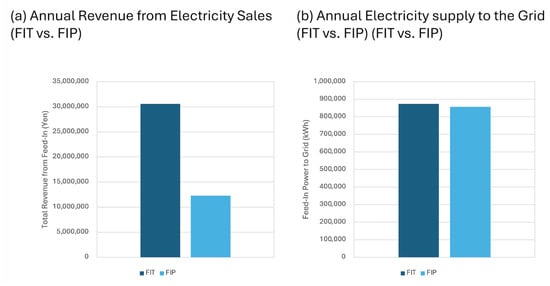
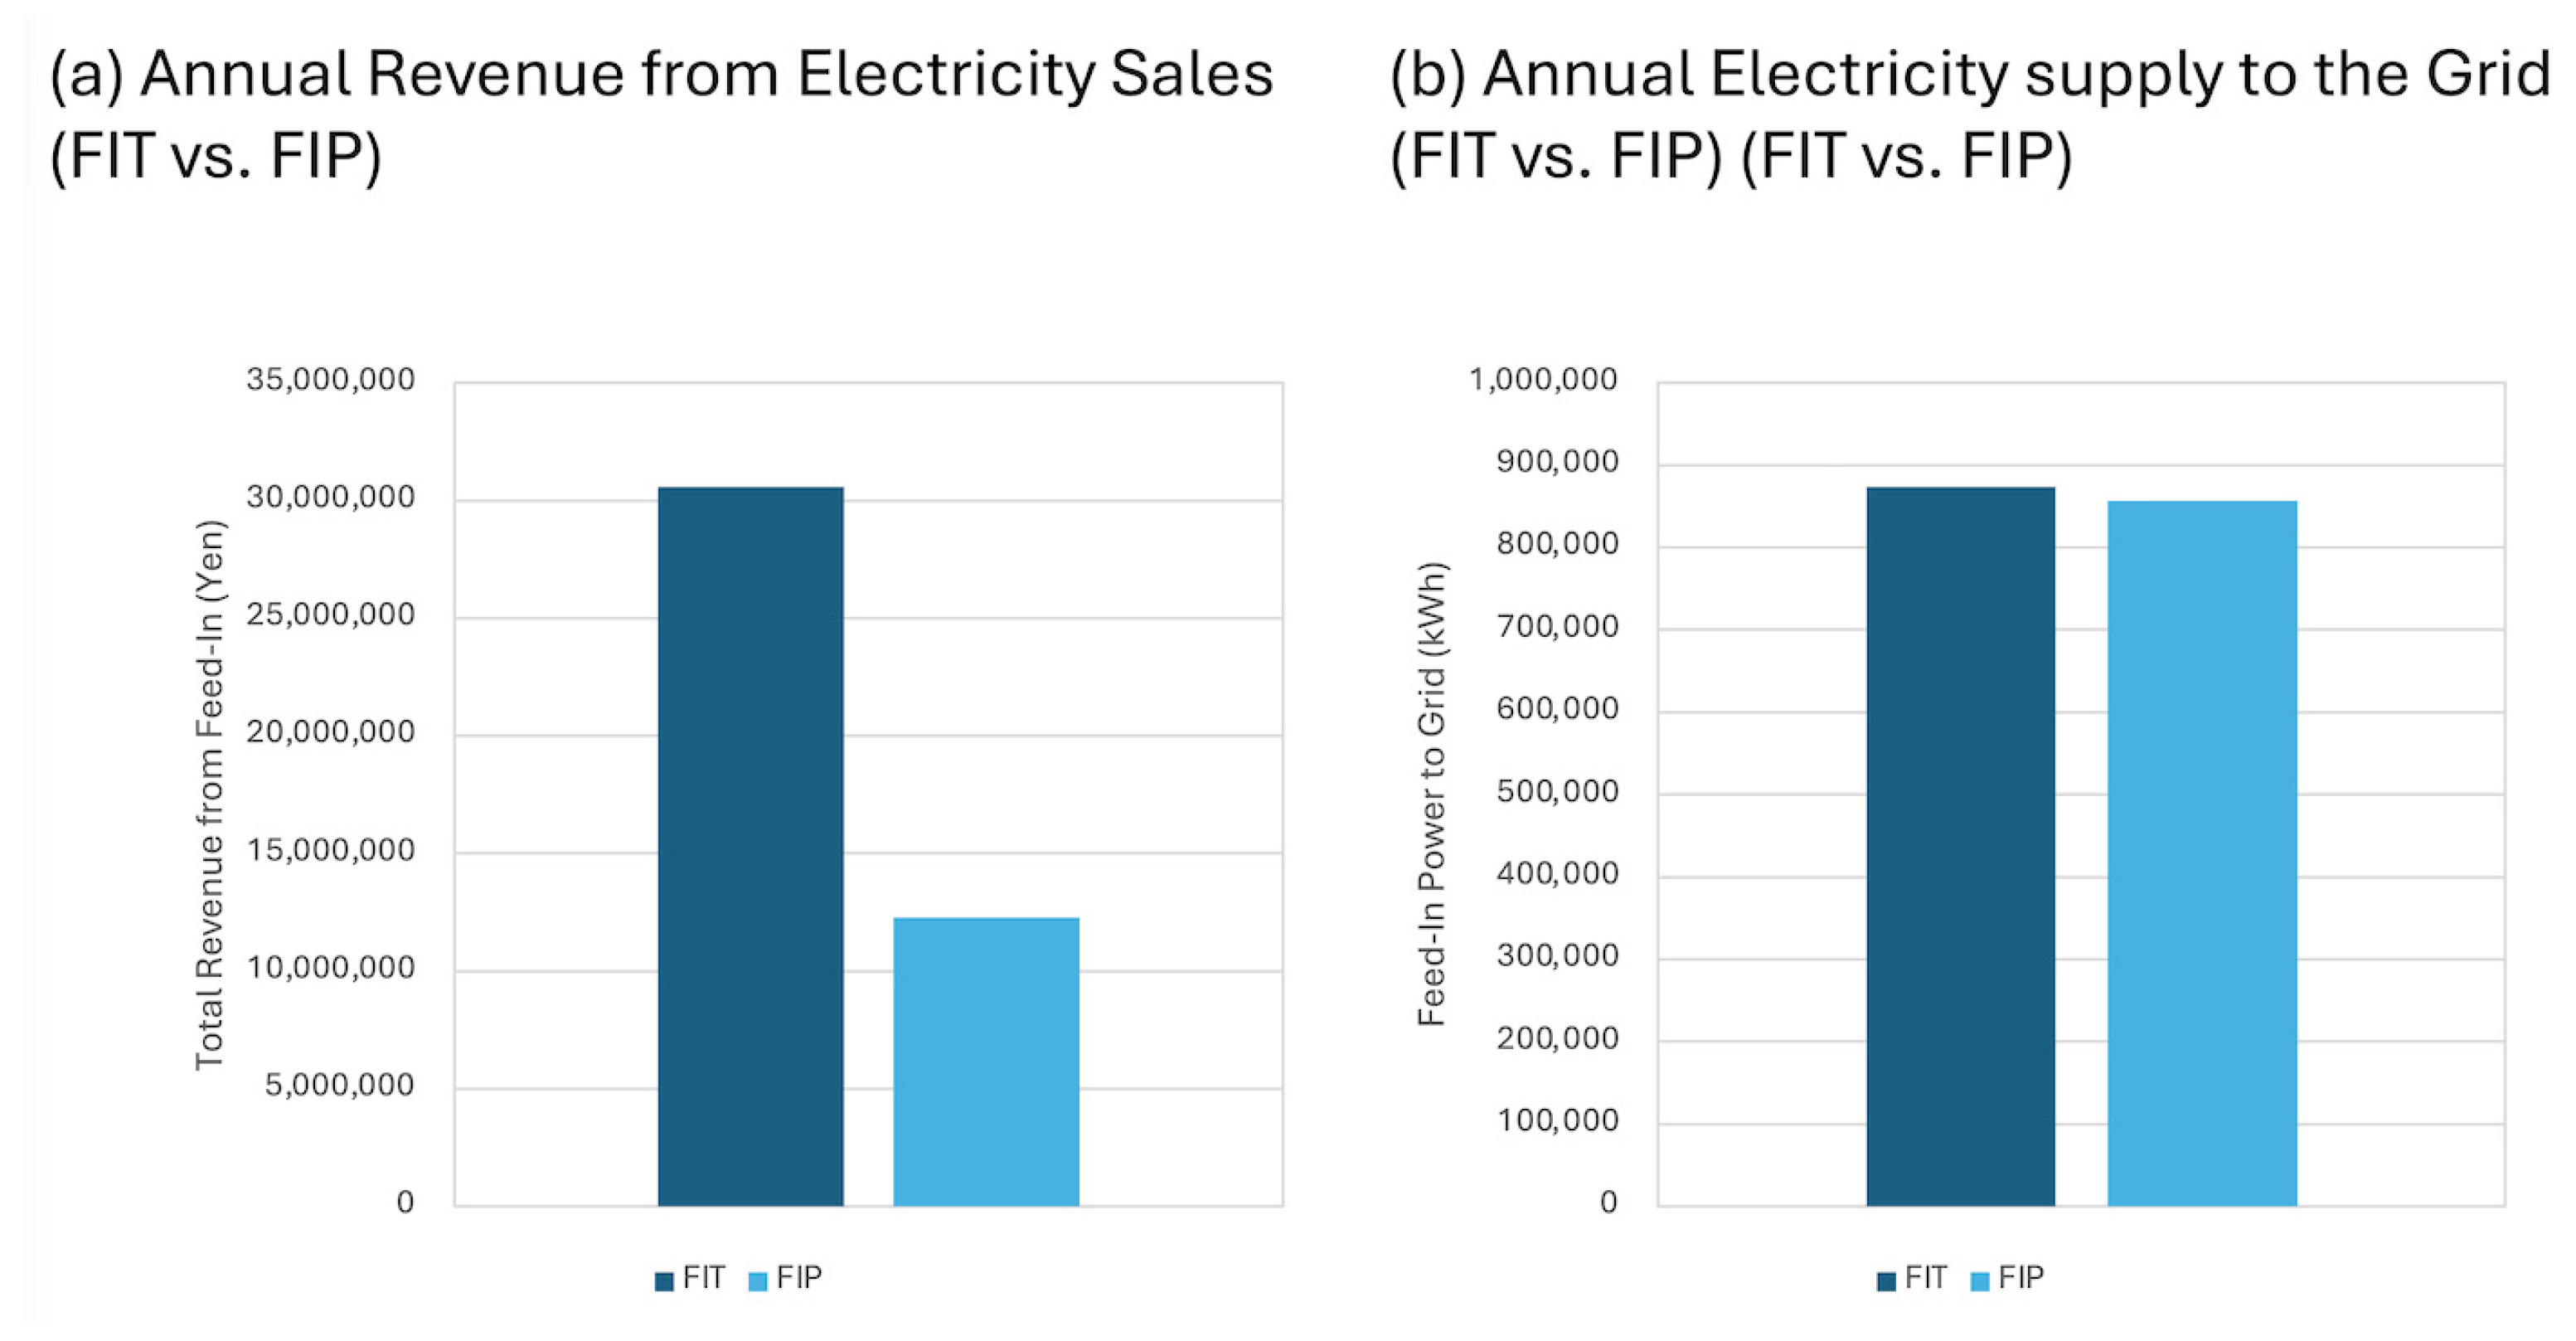
Figure 11 presents a comparison of the annual electricity supply to the grid and the corresponding revenue under both the FIT and FIP schemes. Under FIT, annual electricity revenue reaches approximately 30 million JPY, reflecting both the fixed tariff of 35 JPY/kWh and the stable, near-rated operation of the CHP units. This results in highly predictable income with minimal exposure to market volatility. In contrast, annual revenue under the FIP scheme is substantially lower, despite the nearly identical annual electricity supply to the grid. This outcome arises because FIP income is directly linked to the spot market price, which averaged only 11.9 JPY/kWh during the simulation period—far below the fixed FIT of 35 JPY/kWh. Consequently, even with comparable electricity supply volumes, the markedly lower price environment under the FIP scheme significantly reduces total annual revenue.
Figure 11.
Annual Revenue and Electricity to the grid under FIT and FIP Schemes: While the total electricity supplied to the grid is comparable between the two schemes (b), FIT scheme results in significantly higher annual revenue because of its fixed purchase price (a).
These findings indicate that improving economic performance under the FIP scheme requires an optimized dispatch strategy to maximize revenue. In this study, flexible operation is defined as a set of concrete operational strategies that adjust CHP dispatch in response to market and thermal conditions. Specifically, it includes:
- Curtailing CHP output during low-price hours,
- Increasing operation in high-price periods,
- Shifting generation temporally using short-term biogas storage or substrate feeding adjustments, and
- Coordinating CHP dispatch with thermal demand and the use of thermal storage to ensure fermenter heating is maintained while maximizing electricity income.
By explicitly adopting these operational strategies, BGPs can actively respond to price signals rather than being passively exposed to them, thereby improving profitability under the FIP framework. The results emphasize that flexibility is not merely an operational preference but a critical requirement for optimizing revenue performance in market-based electricity systems. These insights also motivate the assessment of hydrogen production pathways, which can provide an additional revenue stream during low-price periods, as discussed in the following section.
3.2. Hydrogen Production Scenarios Under FIP
3.2.1. Annual Hydrogen Output Under EL and SR
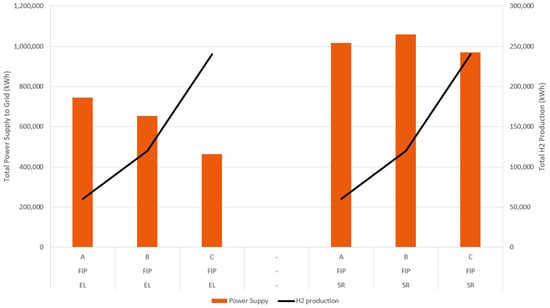
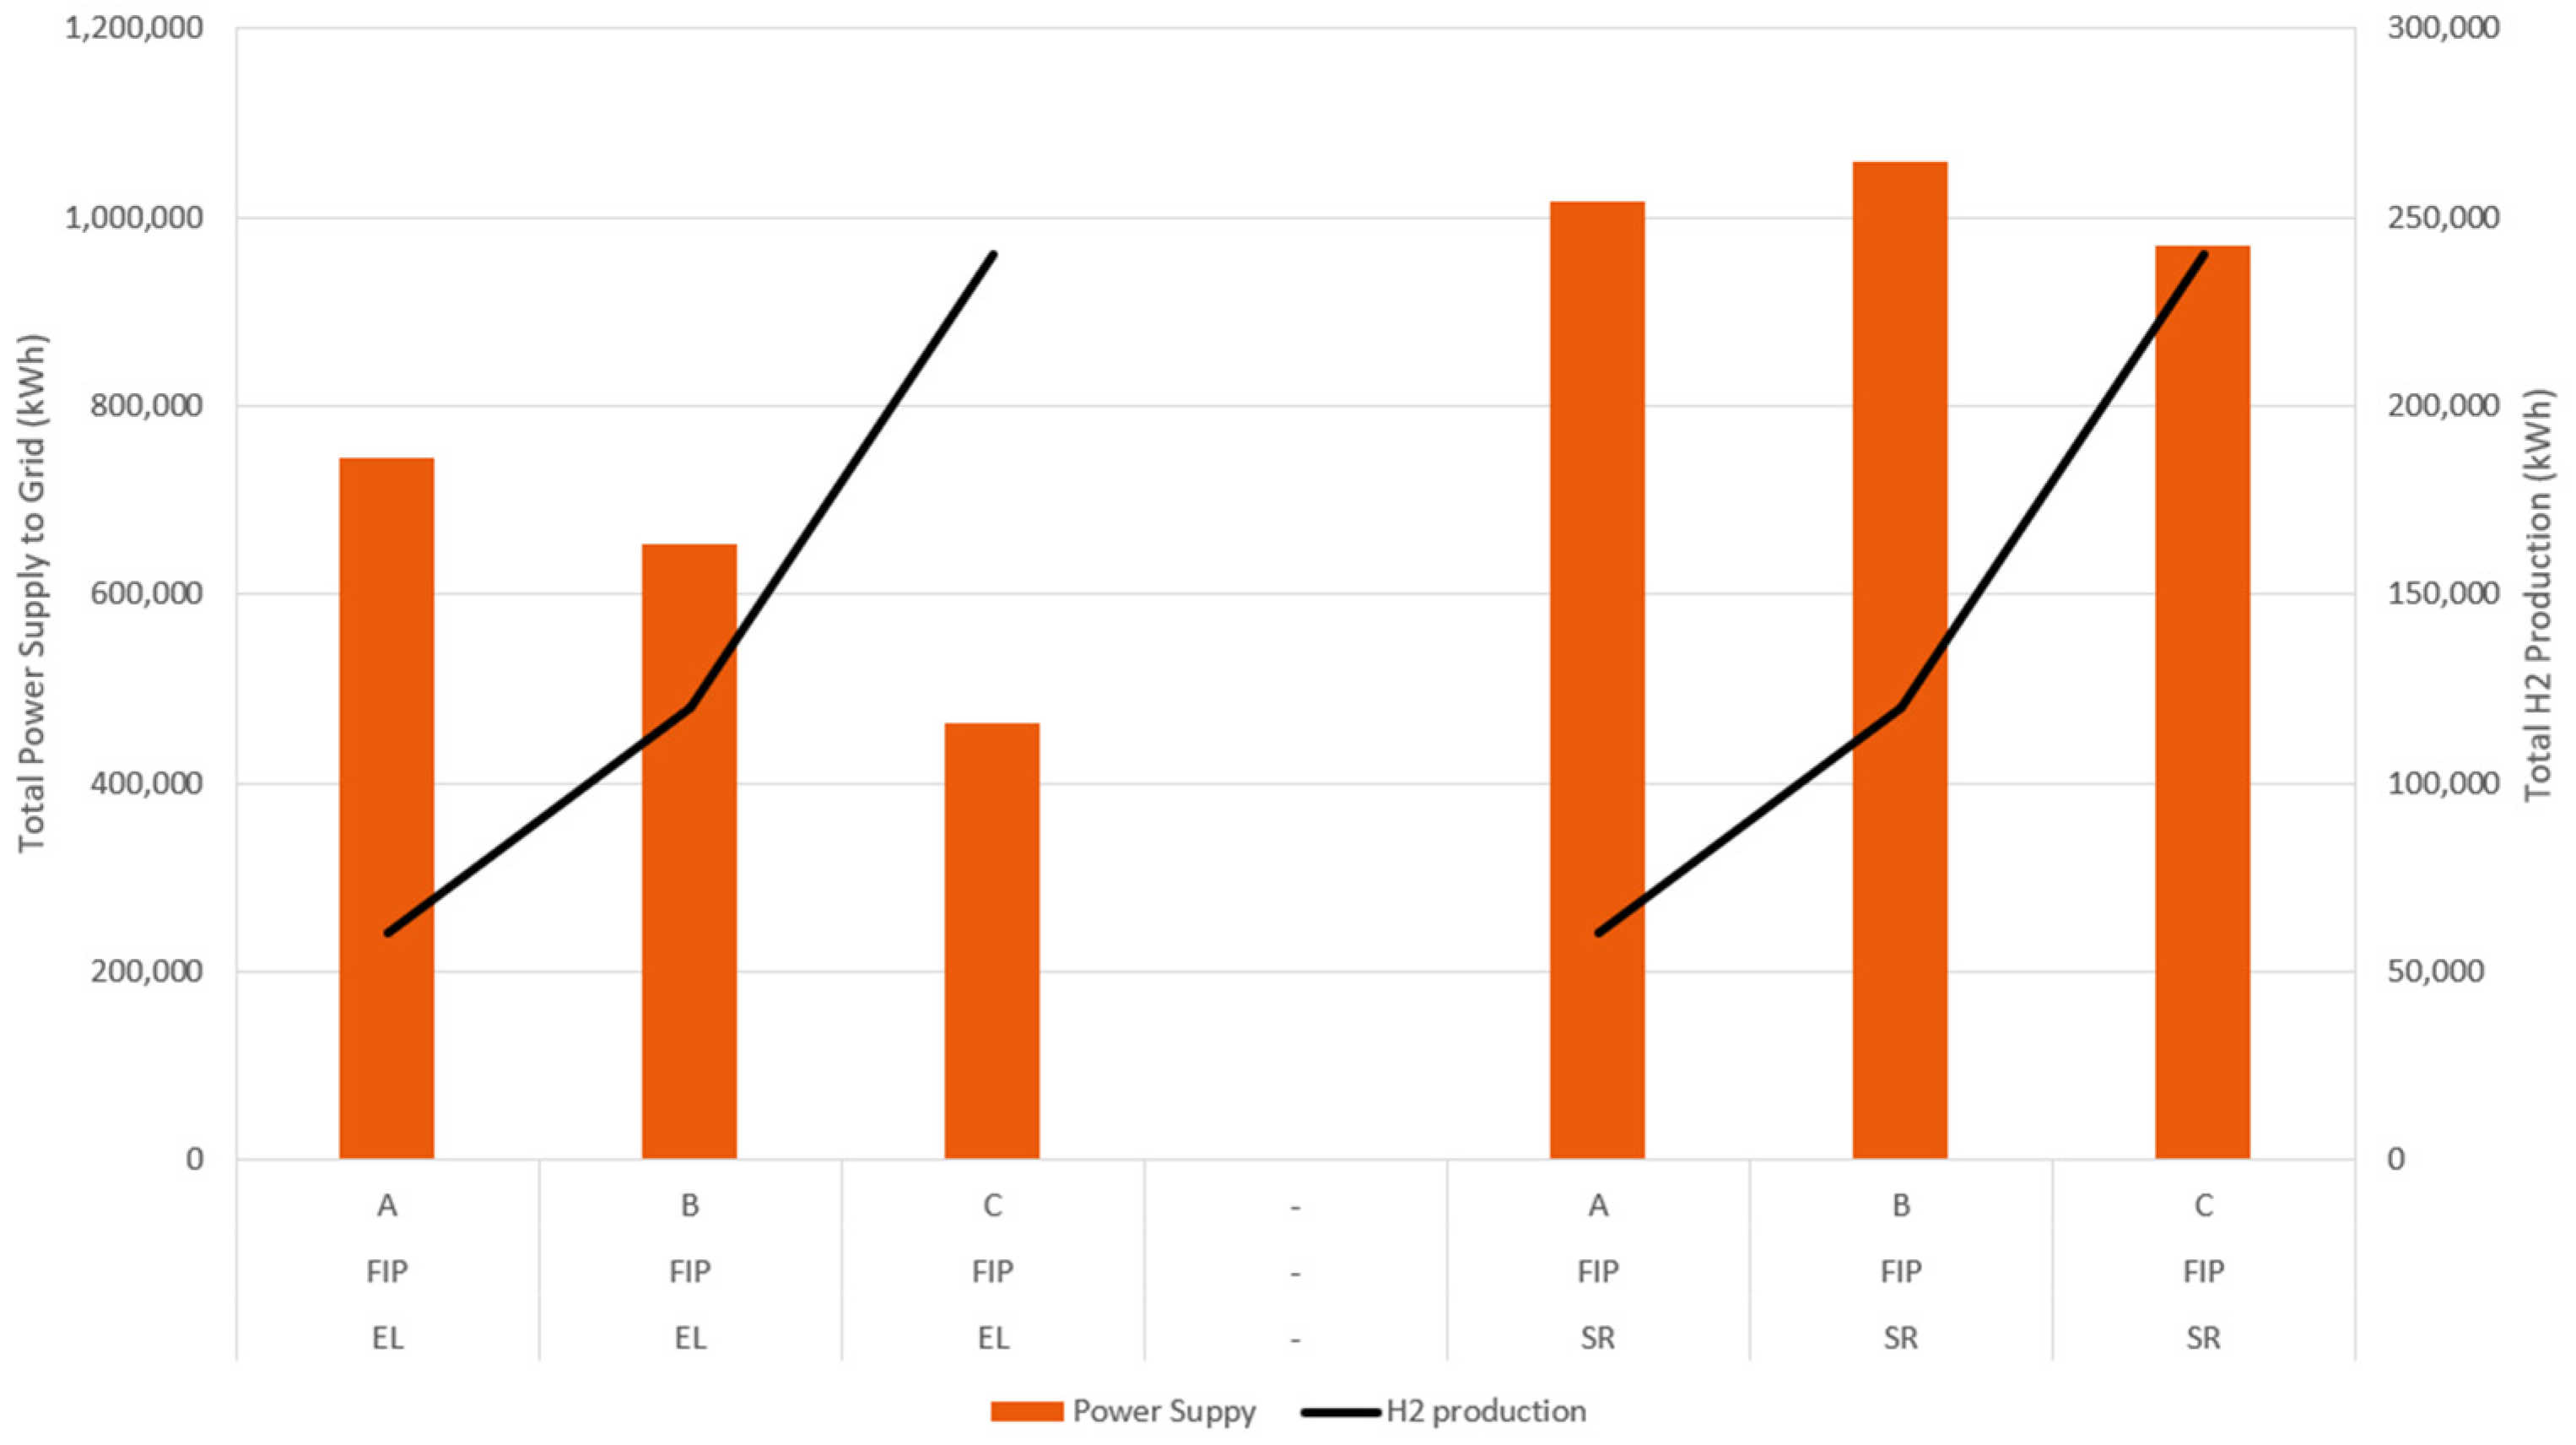
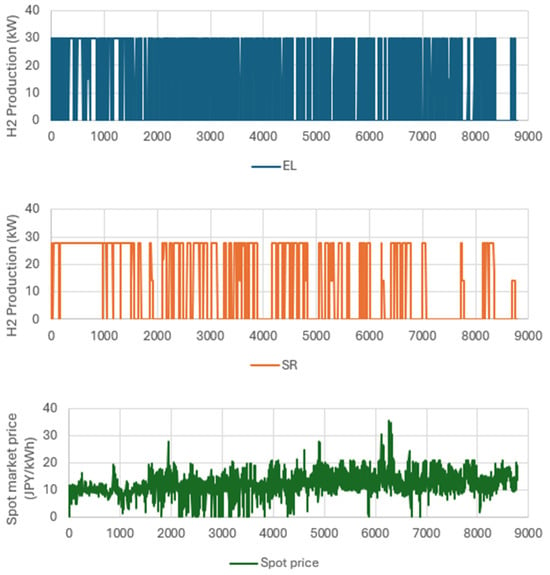
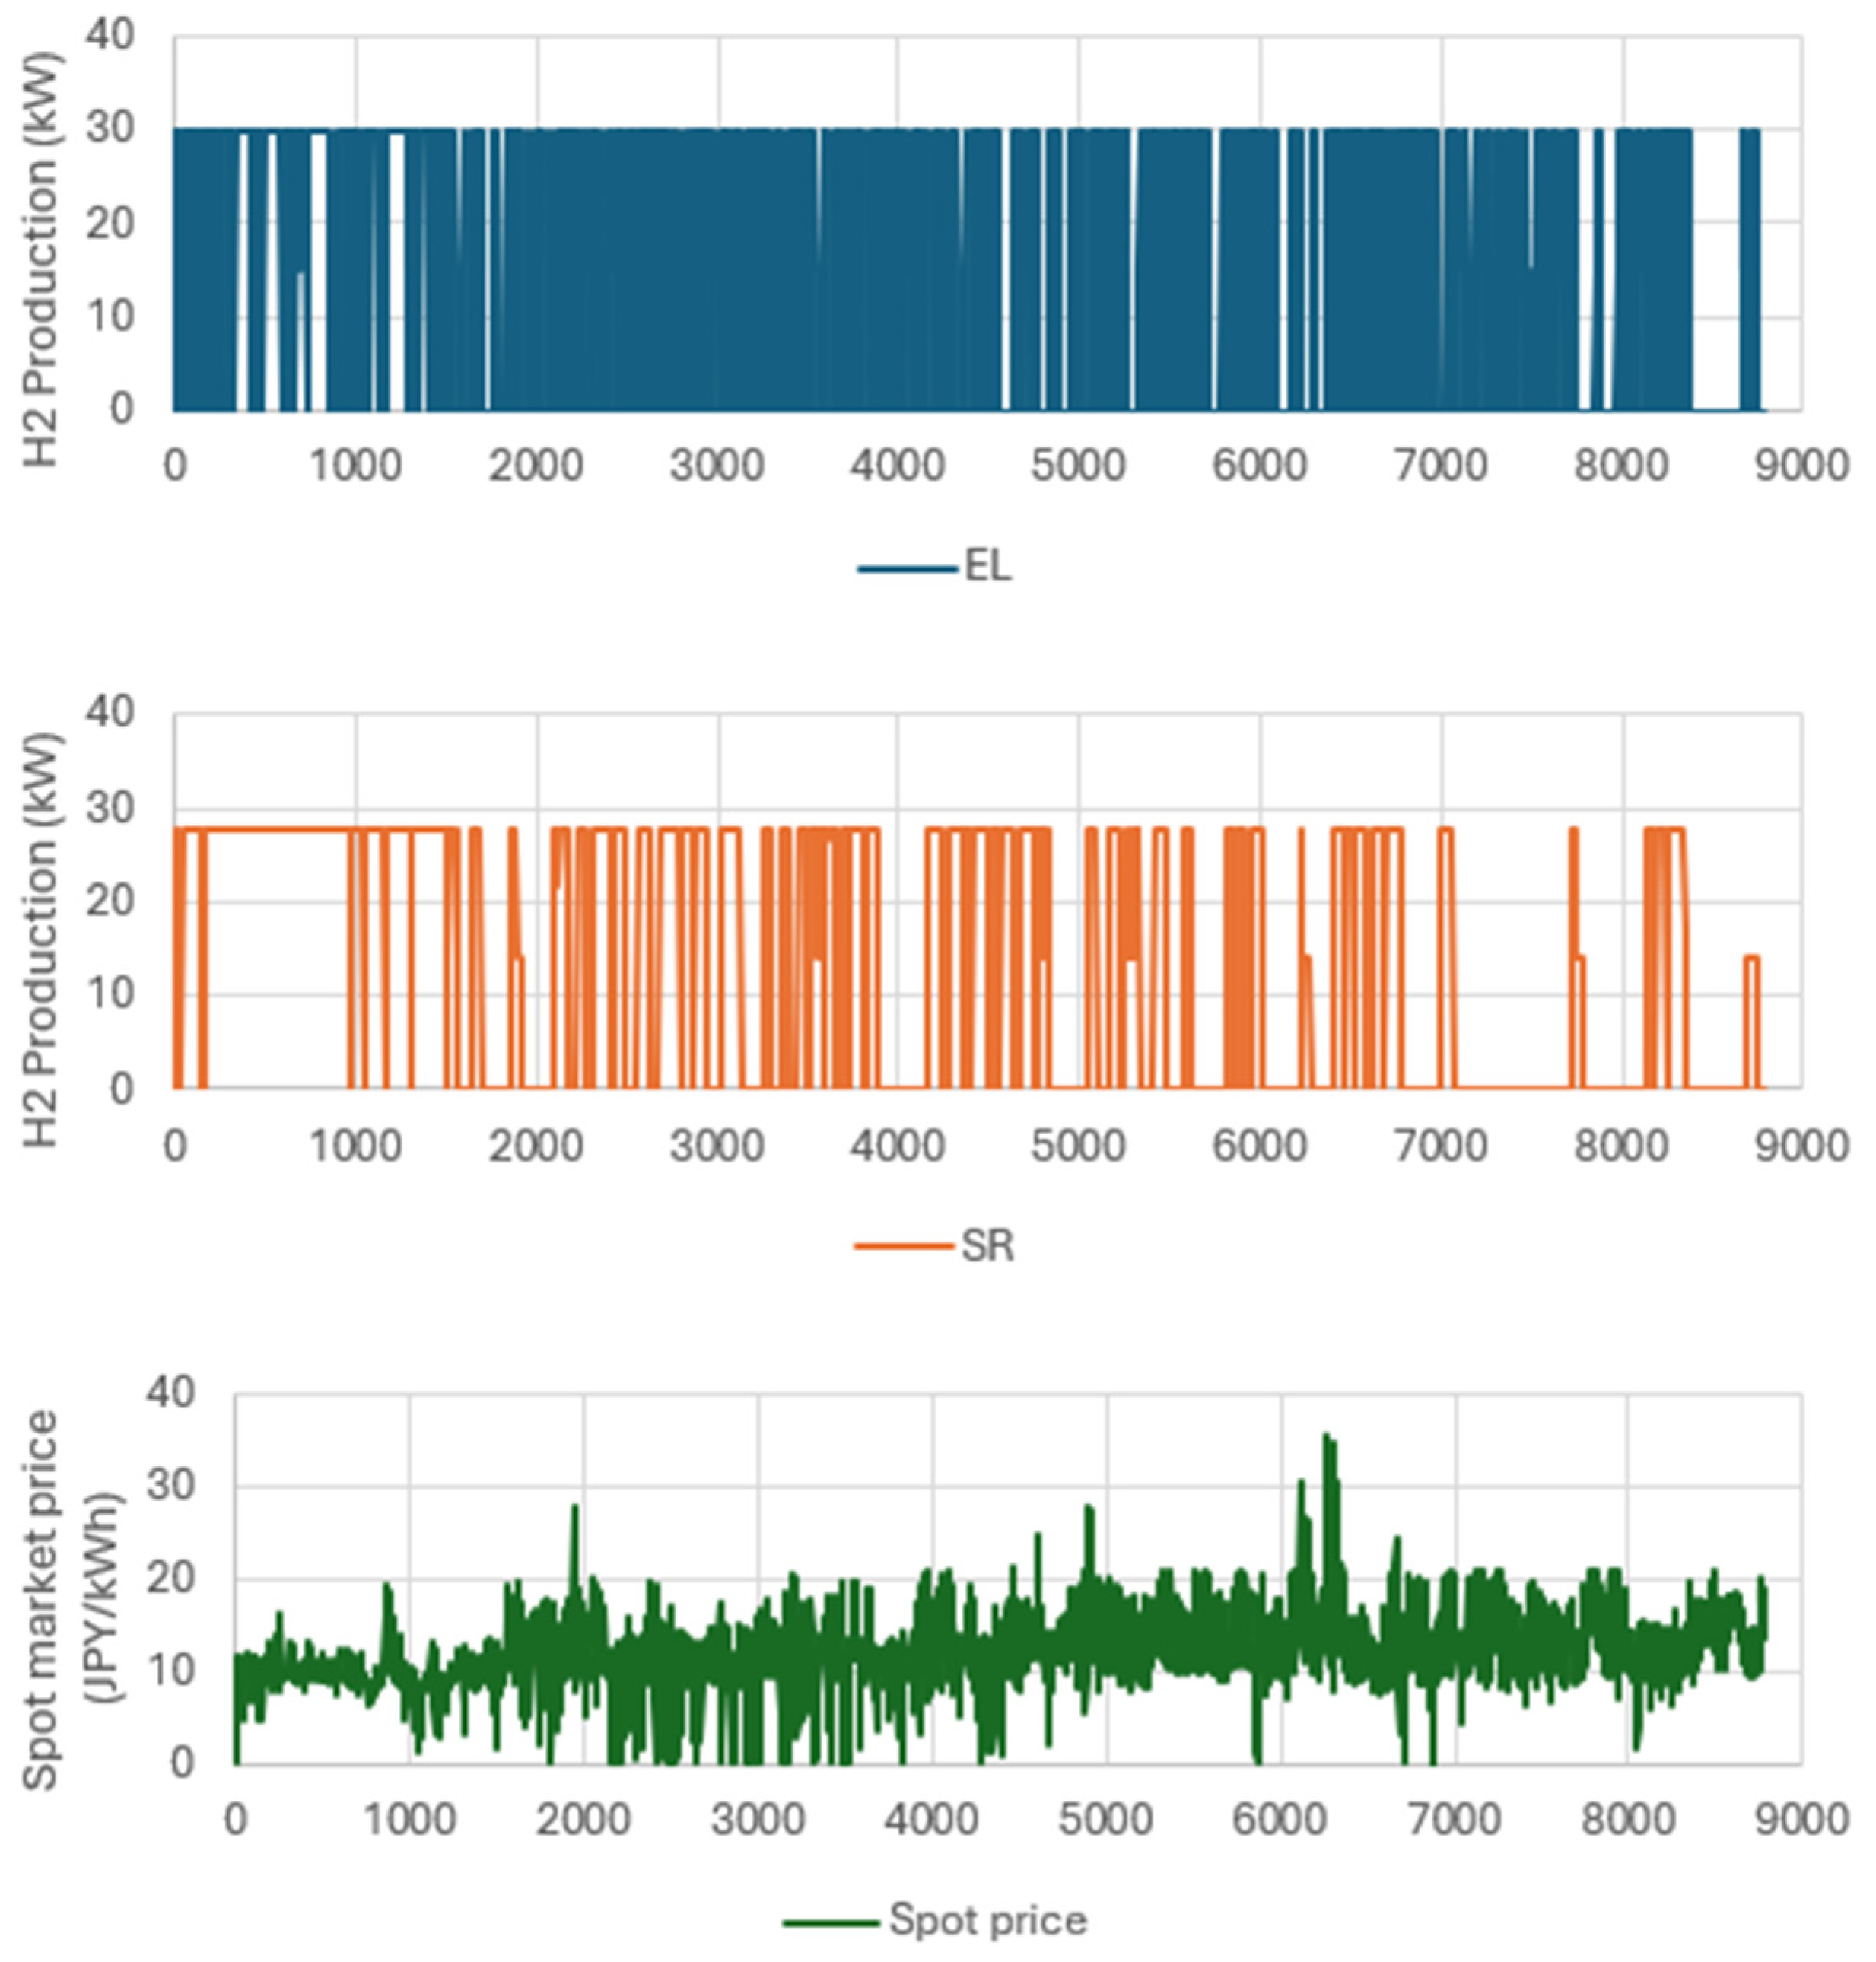
Figure 12 presents the annual electricity production (bars) and the corresponding LHV-based annual hydrogen output (lines) under the FIP scheme. The two hydrogen pathways—EL and SR—respond differently to the operational dynamics of the CHP units, which are driven by spot-price variations.
Figure 12.
Annual power supply and H2 production (EL vs. SR): Comparison of annual grid electricity supply and hydrogen production for EL and SR across scenarios A–C under FIP scheme.
Under the FIP scheme, CHP output fluctuates significantly throughout the year as the plant adjusts its operation to market prices. These fluctuations directly influence the EL pathway, which depends on CHP-generated electricity. However, contrary to a simple proportional relationship, hydrogen production in the EL pathway increases during low-price periods and decreases during high-price periods. This is because high market prices incentivize feeding electricity into the grid, while low prices make it economically preferable to divert electricity to hydrogen production. As a result, EL hydrogen output is highest when FIP prices are low and CHP electricity is not sold profitably. This inverse relationship between power supply to the public grid and hydrogen production is clearly visible across scenarios A–C. The power supply to the grid does not include the self-consumption of the EL or the SR. The EL scenarios are designed around three hydrogen production targets—5, 10, and 20 kg/day—and the annual hydrogen output (line graph) increases stepwise from A to C in accordance with these targets. The decreasing annual electricity supply (bar graph) reflects the increasing share of CHP-generated electricity diverted from the grid to the electrolyzer as hydrogen production requirements grow. In contrast, the SR pathway exhibits an almost constant electricity production profile, as shown by the bar charts. This stability arises from the technical characteristics of the reformer, which requires a continuous biogas input of approximately 50 kW and a minimum uptime of 48 h. Because SR is directly fueled by biogas and does not depend on the availability of electricity, its hydrogen output increases only in proportion to the production targets (5, 10, and 20 kg/day), and remains largely independent of CHP fluctuations or market-price dynamics. This decoupling from power-system variability is a fundamental distinction between SR and EL pathways. The total annual supply of electricity, heat, and hydrogen for all scenarios can be found in Table 2.
Table 2.
Total Annual Supply of Electricity, Heat, and Hydrogen for All Scenarios.
Overall, the results demonstrate that EL is highly sensitive to price-responsive CHP operation, resulting in variable hydrogen output that depends on market conditions. In contrast, SR provides stable and predictable hydrogen production, albeit at the cost of higher biogas consumption. These differences form the foundation for the comparative economic and system-integration analyses presented in the following sections. These comparisons should be interpreted in light of two modelling choices: hydrogen demand is imposed as a fixed annual target, and simulations use data from a single year (2024). Together, these choices may constrain operational flexibility in the model and limit the extent to which results generalize to years with different weather, price patterns, or operational contexts.
3.2.2. Dynamic Operating Behavior Under FIP (Time-Series Analysis)
Figure 13 illustrates the hydrogen production profiles for the EL and SR pathways, together with the corresponding spot market prices under the FIP scheme. A clear contrast emerges between the two hydrogen production methods.
Figure 13.
Hourly hydrogen production profile under FIP scheme (EL vs. SR): Hourly hydrogen production of EL and SR under FIP scheme, shown together with hourly spot market prices. EL exhibits price-responsive operation, with hydrogen production increasing during low-price periods and decreasing as market prices rise. In contrast, SR operates largely independently of short-term price fluctuations, resulting in a comparatively stable hydrogen output.
Under the FIP scheme, the EL system exhibits a distinctly price-responsive operating pattern. Hydrogen production increases during low-price hours, when electricity generated by the CHP units yields limited revenue, and decreases during high-price hours, when feeding electricity into the grid becomes economically preferable. This inverse relationship between hydrogen output and spot market price results in a highly dynamic and discontinuous EL production profile, highlighting the operational flexibility of EL under market-based dispatch. In contrast, the SR pathway demonstrates a stable and nearly uninterrupted hydrogen production profile throughout the year. Because SR is directly fueled by biogas and constrained by minimum operating time requirement, its operation remains largely decoupled from market-price fluctuations. As a result, SR provides a steady hydrogen supply but lacks the operational responsiveness observed in EL.
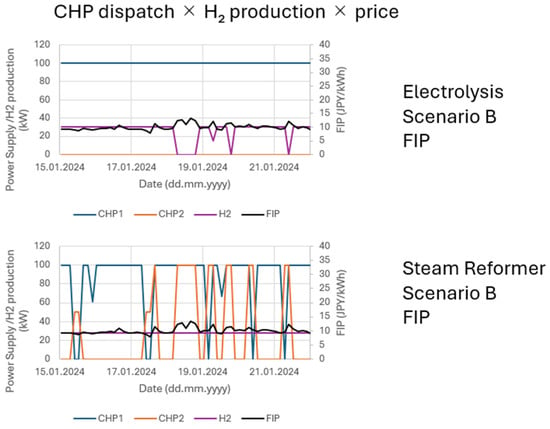
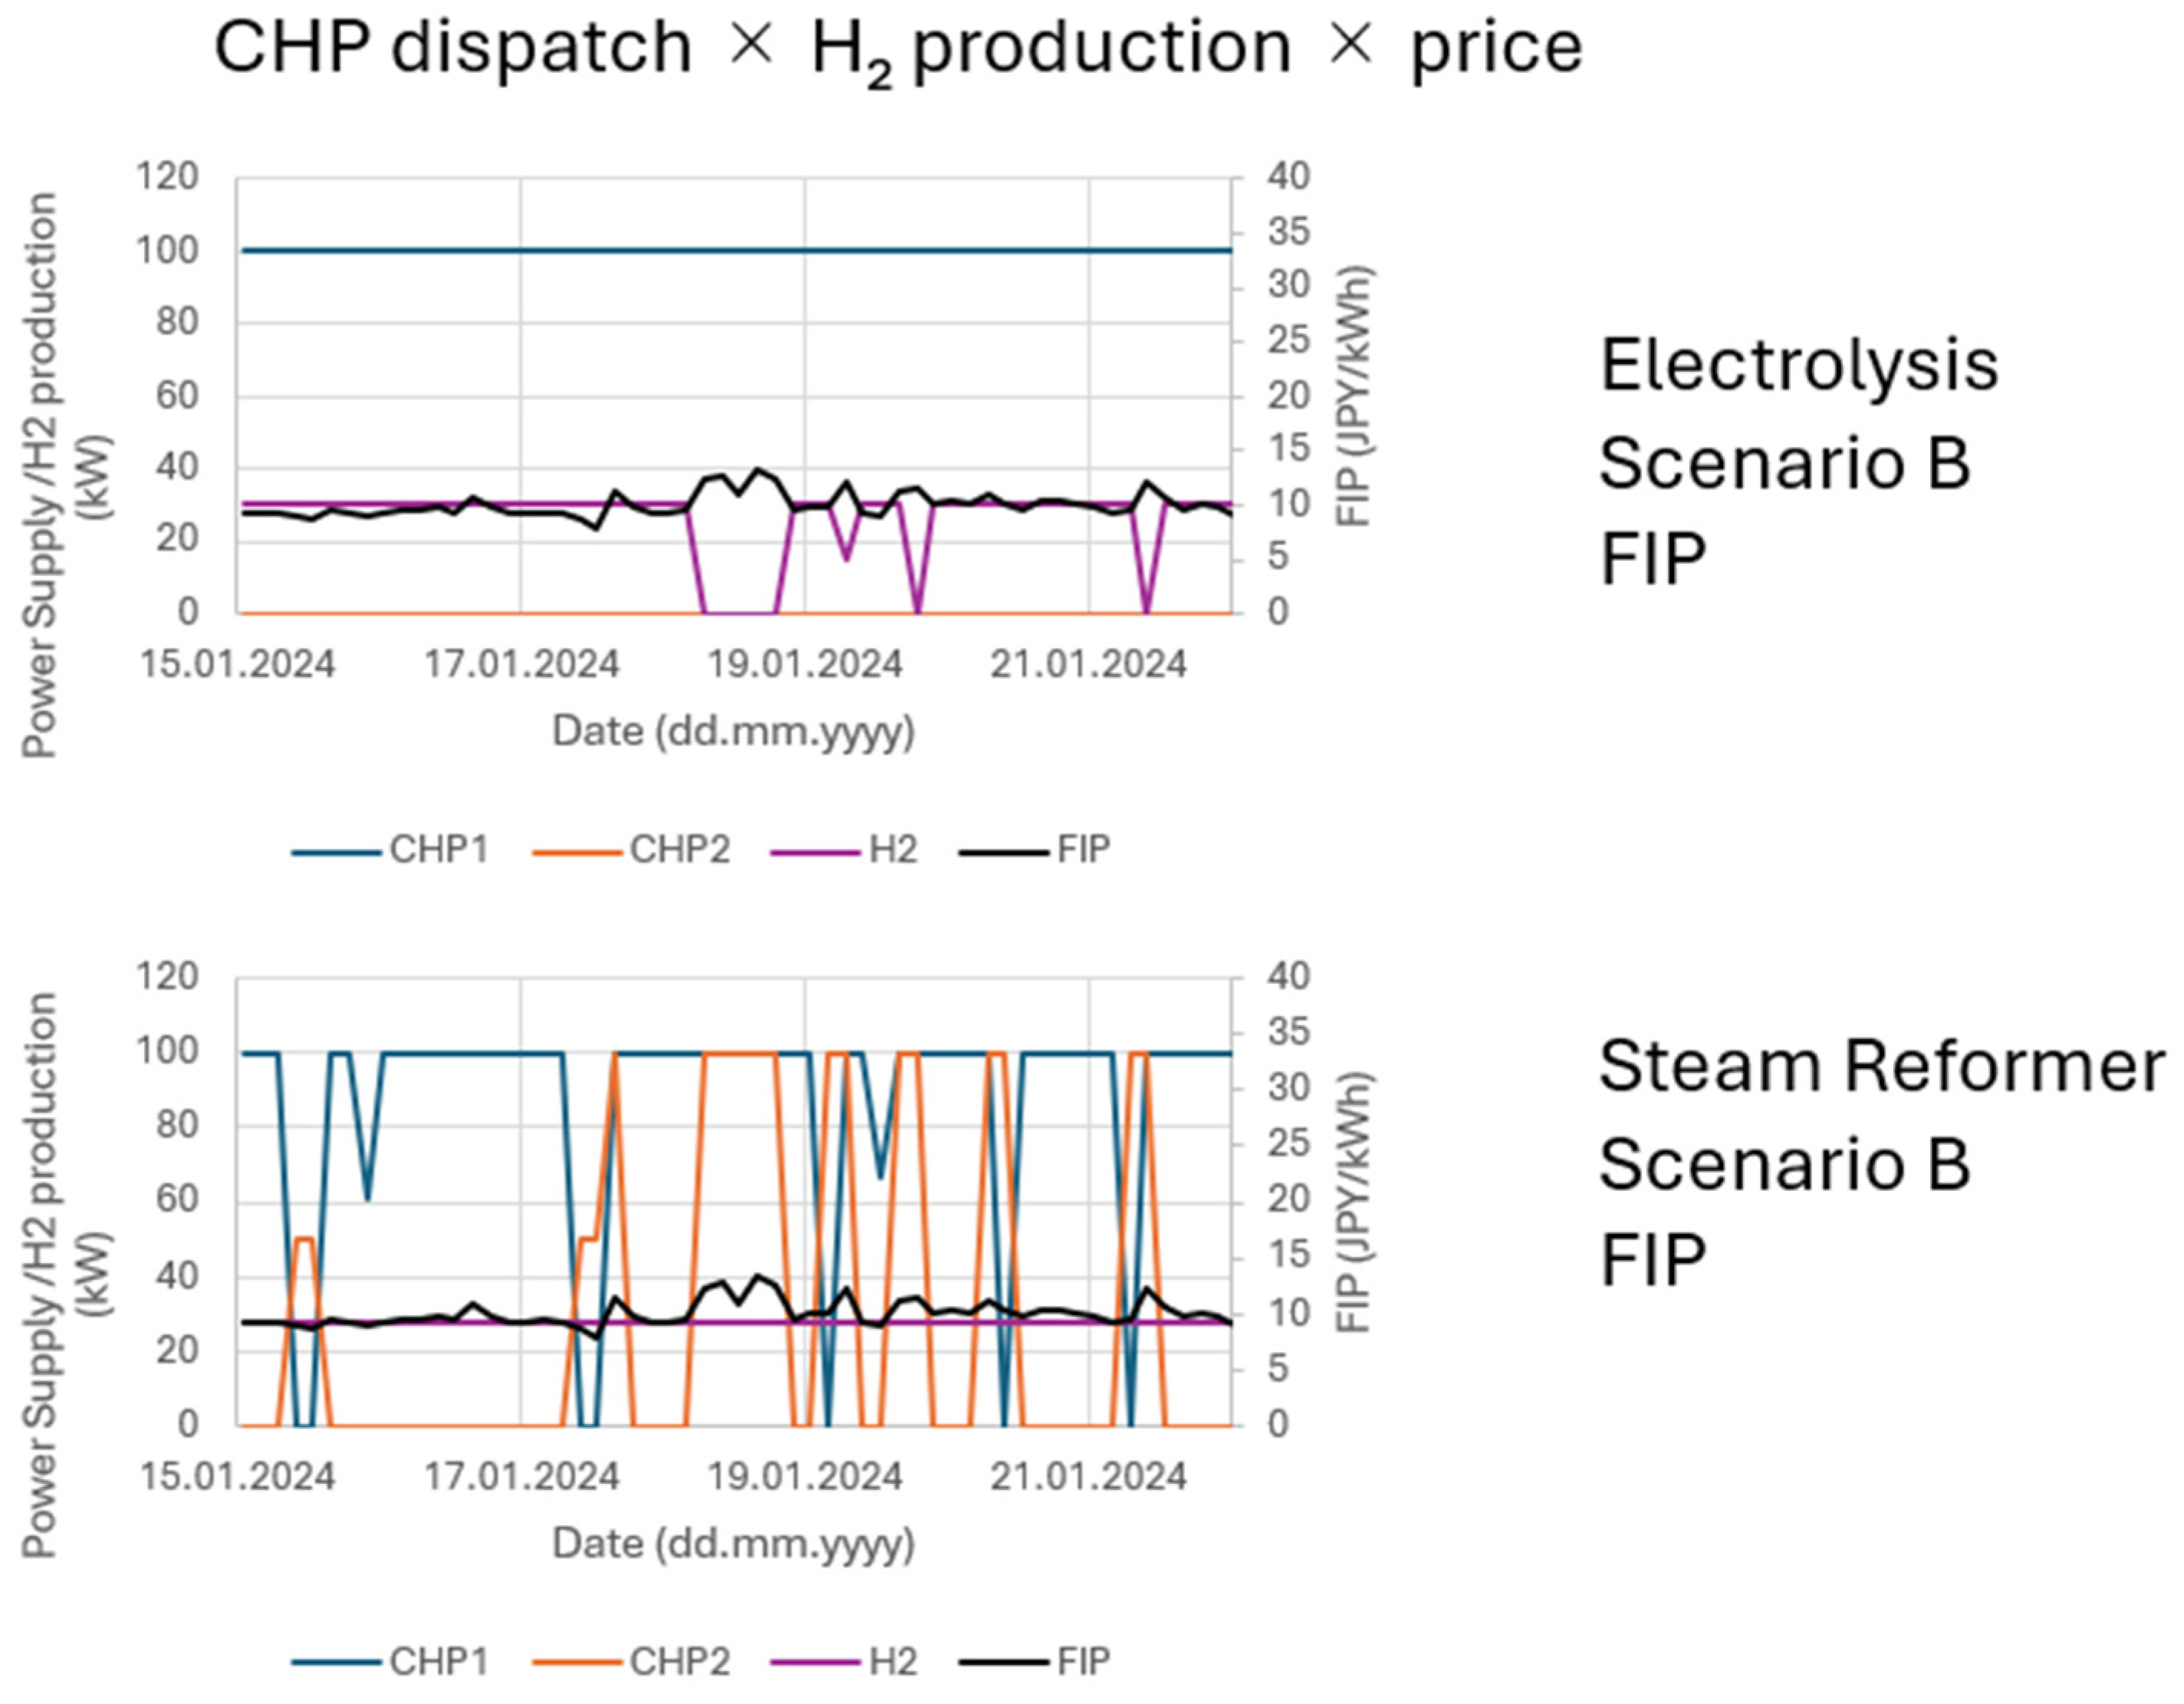
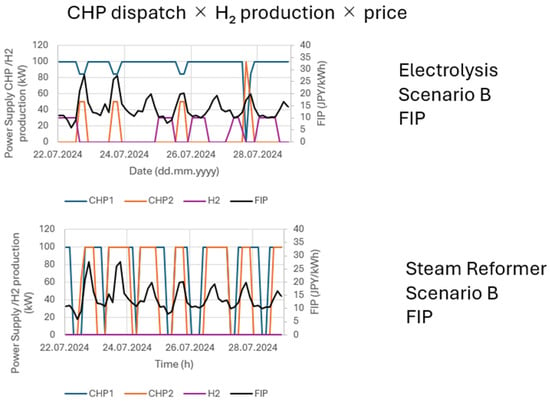
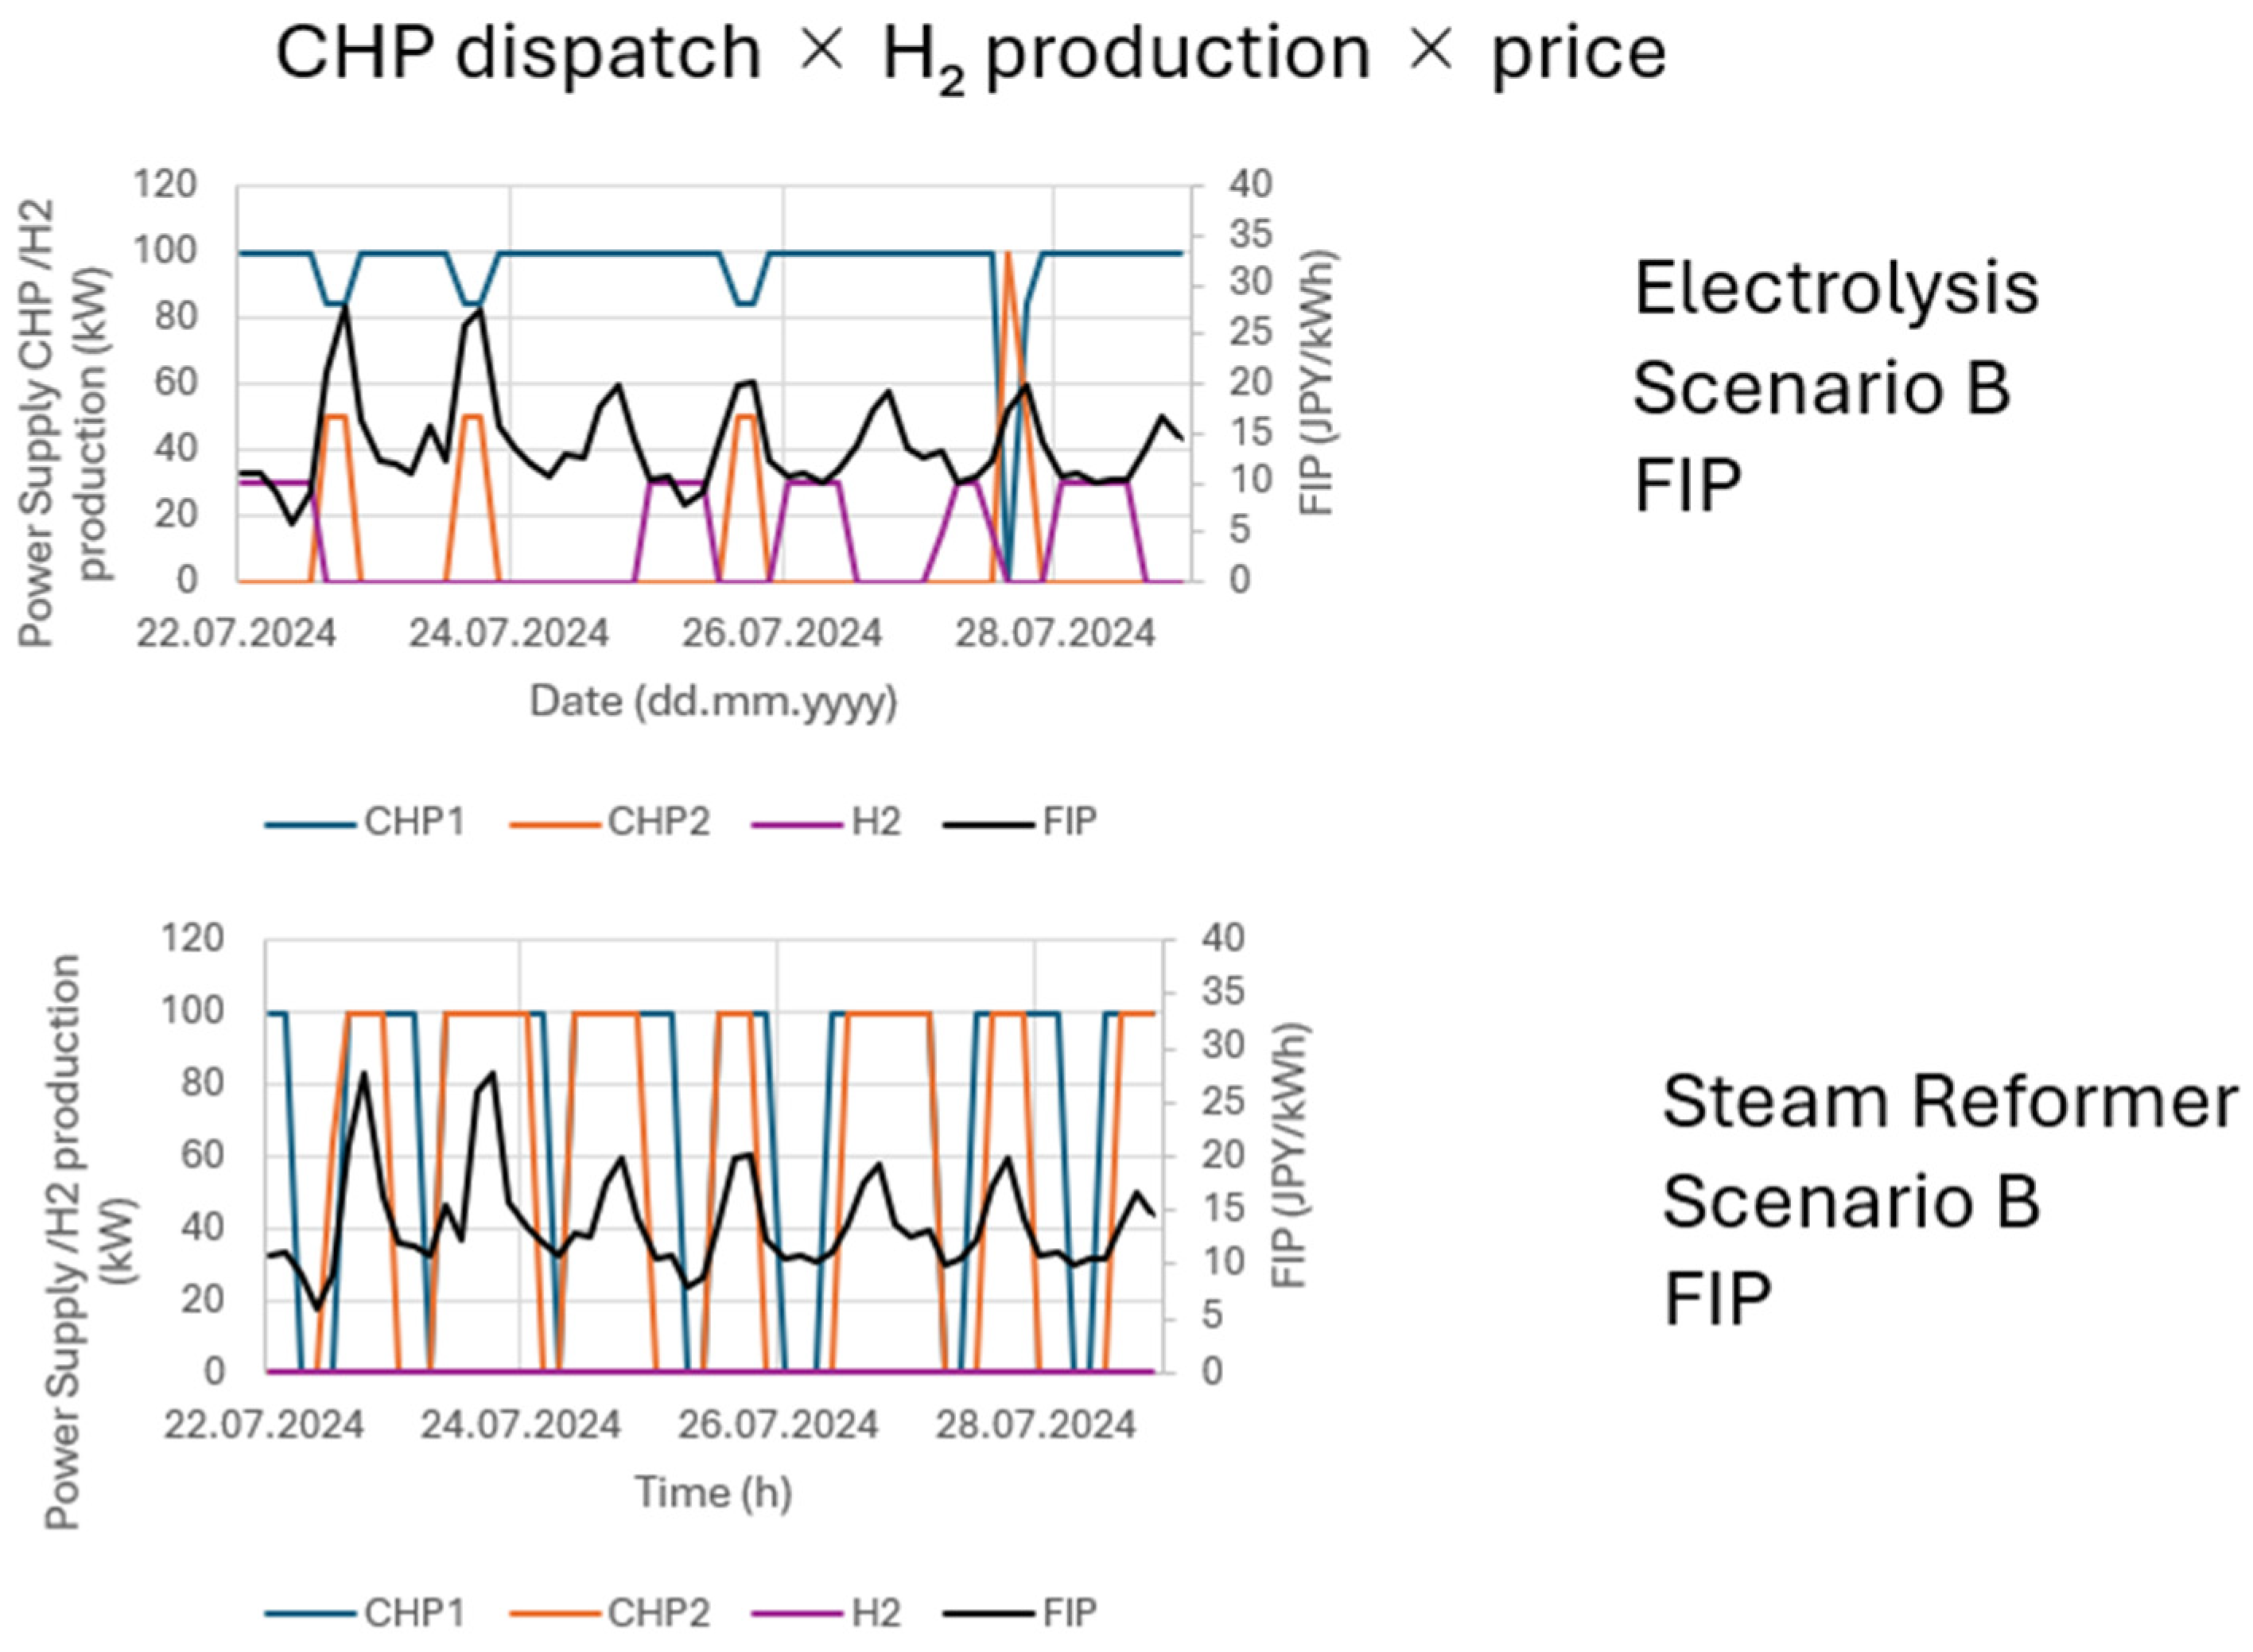
Figure 14 and Figure 15 further illustrates these differences through one-week operating profiles during representative winter and summer periods. During both the coldest and hottest weeks of the year, EL operation clearly follows an inverse price-driven logic: hydrogen production is prioritized during low-price hours, while CHP output is redirected toward electricity supply during high-price periods. In contrast, SR operation remains largely unchanged across seasons, with hydrogen production maintained at a stable level despite variations in CHP dispatch and spot market prices.
Figure 14.
Operating profile (15–21 January 2024): CHP dispatch, hydrogen production (EL/SMR), and spot-market price under FIP.
Figure 15.
Operating profile (22–28 July 2024): CHP dispatch, hydrogen production (EL/SMR), and spot-market price under FIP.
These time- resolved profiles confirm that EL enables flexible, price-driven switching between electricity supply and hydrogen production, whereas SR operates as a baseload hydrogen supply pathway governed primarily by biogas availability and technical constraints rather than market signals. These operational differences, particularly the price-responsive flexibility of EL and the stable biogas-driven behavior of SR, directly translate into contrasting revenue outcomes, as presented in Section 3.2.3.
3.2.3. Revenue Potential and Economic Performance of Hydrogen Pathways
To evaluate the revenue potential and its sensitivity to market variables, a simplified sensitivity analysis was performed. The baseline hydrogen price was set at 100 JPY/kWh, referencing the current market price levels and the strategic trajectory outlined in Japan’s Basic Hydrogen Strategy (Revised 2023) [46]. While the national strategy targets a future supply cost of 30 JPY/Nm3 (approx. 10 JPY/kWh) by 2030, the 100 JPY/kWh baseline represents a conservative scenario for the early commercialization phase. From this baseline, the effects of both price increases and decreases were evaluated to cover a wide range of potential market conditions. Sensitivity to FIP level was analyzed using the same approach. While a comprehensive economic assessment would typically incorporate detailed capital expenditures (CAPEX) and operational expenditures (OPEX), this study focuses on the revenue-side dynamics and the operational flexibility required to maximize income under fluctuating market prices. Due to limited data availability at the time of analysis, a full CAPEX/OPEX assessment, including logistical costs such as hydrogen transportation, storage, and market access, was considered outside the current scope. Instead, this analysis provides an initial indication of revenue-based performance, identifying the conditions under which the integration of a hydrogen pathway may be operationally and economically advantageous. A detailed evaluation accounting for these total costs of ownership is left for future work.
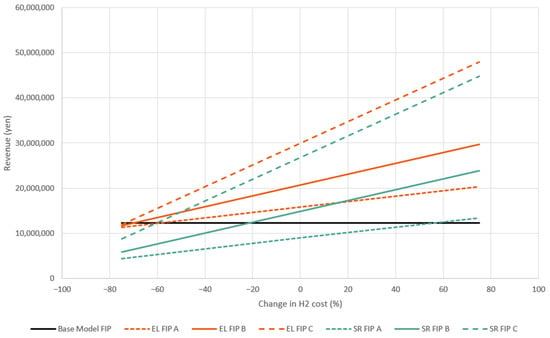
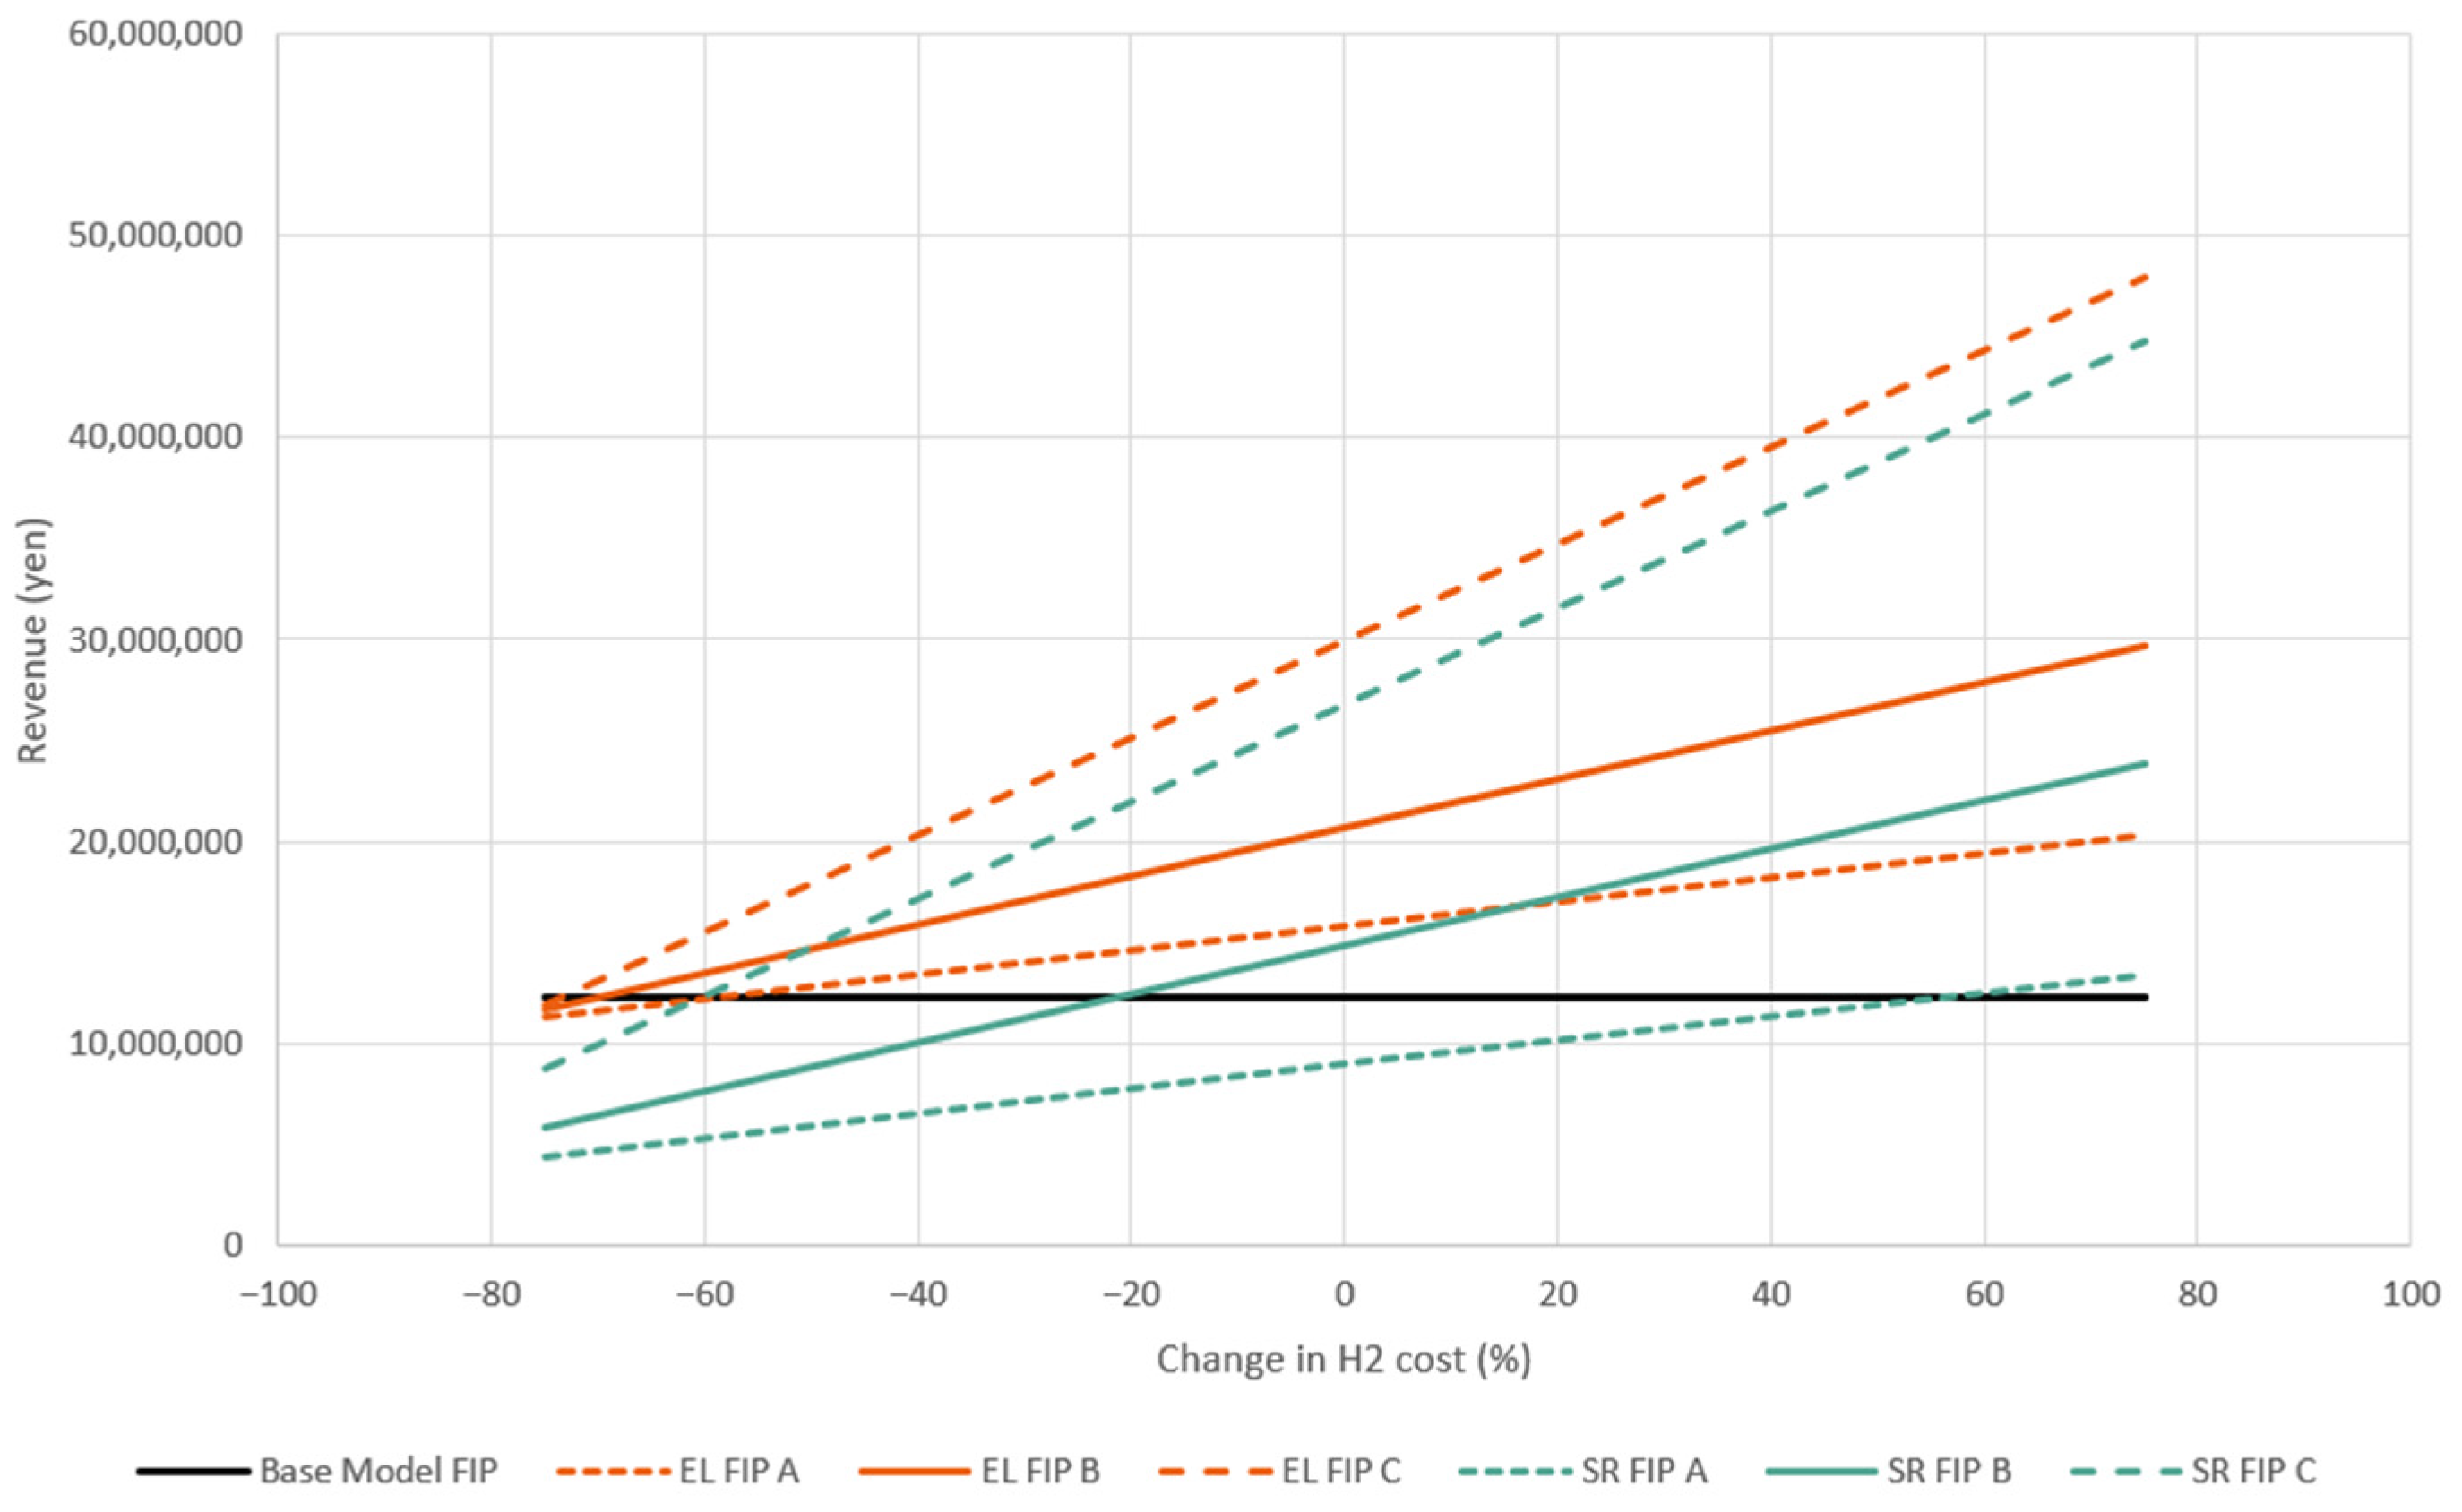
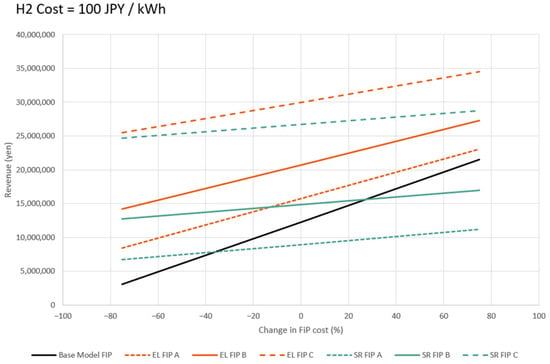
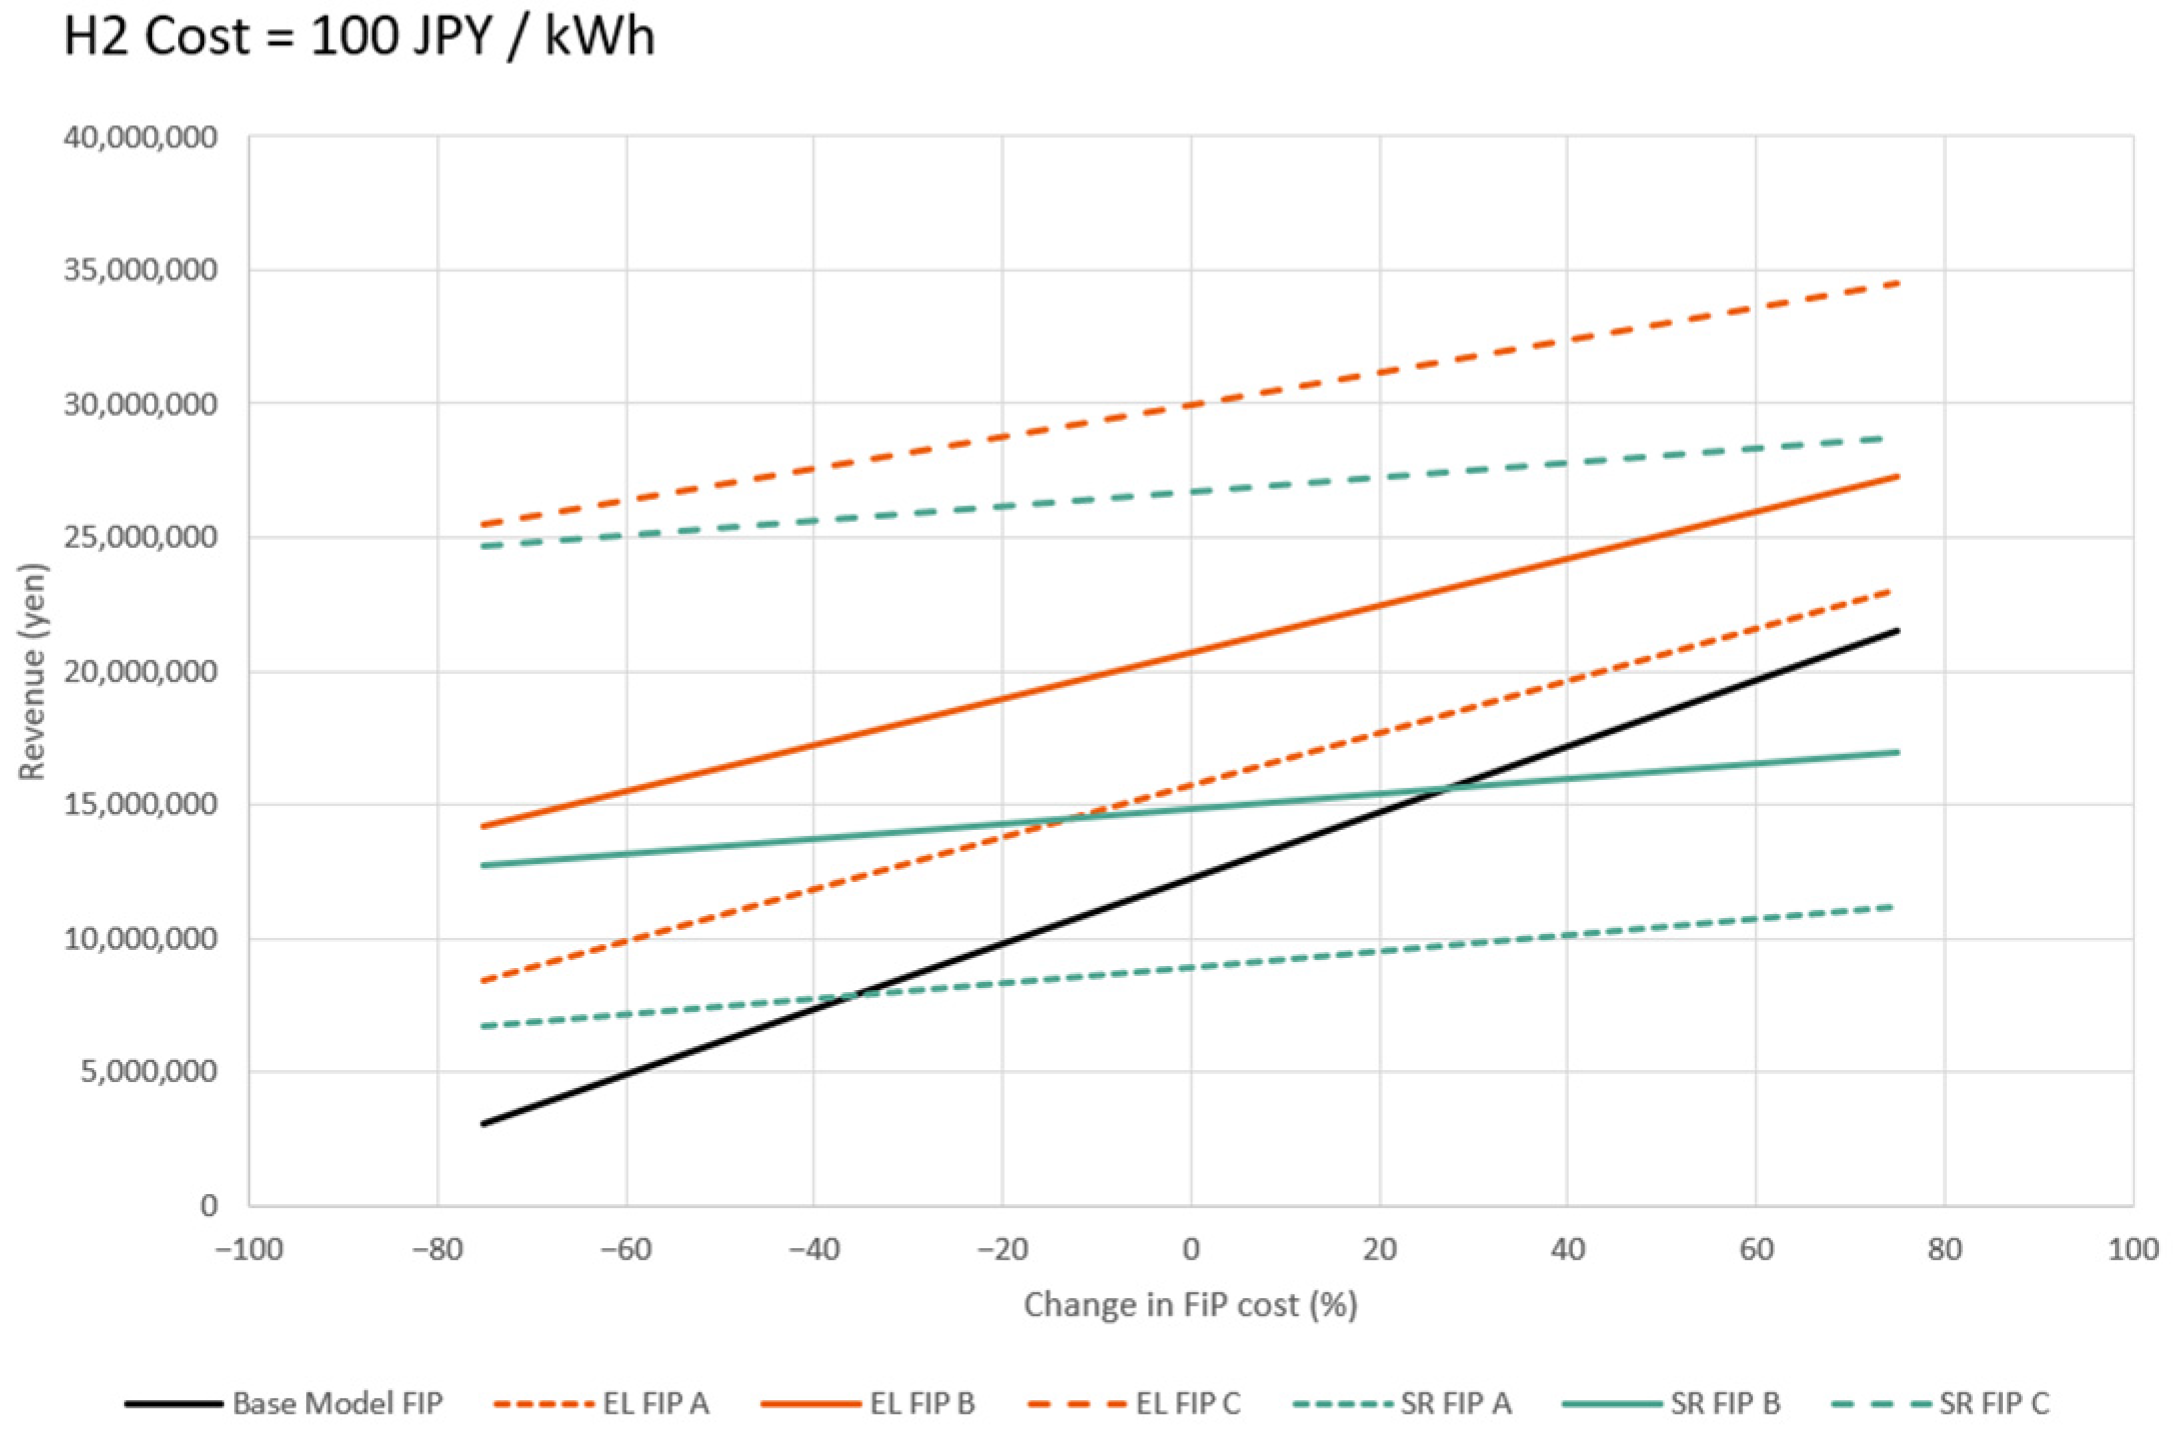
Figure 16 and Figure 17 evaluate the revenue performance of the EL and SR pathways under the FIP scheme through sensitivity analyses with respect to hydrogen price and change in FIP, respectively. Total annual revenue is defined as the sum of electricity sales revenue under the FIP scheme and hydrogen sales revenue.
Figure 16.
Revenue potential of hydrogen production pathways under the FIP scheme: Sensitivity of total annual revenue to changes in the assumed hydrogen price. The horizontal axis represents the percentage change in hydrogen price (denoted as “H2 cost” in the figure to reflect the unit value used for economic sensitivity) relative to a reference value of 100 JPY/kWh. This reference value is based on the target price in Japan’s “Basic Hydrogen Strategy” to ensure competitiveness with conventional fuels. Three hydrogen production levels are considered: A (5 kg/day), B (10 kg/day), and C (20 kg/day), with the base FIP model shown for comparison.
Figure 17.
Revenue potential of hydrogen production pathways under the FIP scheme: Sensitivity of total annual revenue to changes in FIP. This figure shows the impact of fluctuations in the FIP and market-based electricity prices on total annual revenue for EL and SR pathways. Three hydrogen production levels are considered: A (5 kg/day), B (10 kg/day), and C (20 kg/day). The hydrogen price is fixed at a reference value of 100 JPY/kWh, which aligns with the target price in Japan’s “Basic Hydrogen Strategy” to ensure competitiveness with conventional fuels. For comparison, the base case (Base FIP model) is also shown.
Figure 16 shows the sensitivity of total annual revenue to changes in the assumed hydrogen price. For both the EL and SR pathways, total revenue rises monotonically with increasing hydrogen prices, reflecting the growing contribution of hydrogen sales. Across all scenarios, the EL cases exhibit a consistently steeper revenue response than the SR cases, with this difference being more pronounced under scenarios B and C, indicating a stronger dependence of EL revenue potential on hydrogen market conditions. In contrast, the SR pathway displays a more moderate sensitivity to hydrogen price variations. Because SR relies on continuous biogas consumption and operates largely independently of electricity market conditions, its revenue structure remains relatively rigid and less responsive to hydrogen price fluctuations. Consequently, SR offers a smaller potential for revenue upside under favorable hydrogen price assumptions, while also exhibiting a reduced downside risk in revenue under low hydrogen price scenarios.
Figure 17 presents the sensitivity of total annual revenue to changes in the FIP level while fixing the hydrogen price at 100 JPY/kWh. As expected, revenue increases with higher FIP levels across all cases, reflecting the direct impact of electricity remuneration on system income. The EL pathways exhibit a stronger dependence on FIP variation than the SR pathways, particularly in scenarios with lower hydrogen production targets (Scenario A). This reflects the fact that EL can dynamically shift between electricity supply and hydrogen production, thereby amplifying the influence of FIP incentives on revenue performance. Overall, the sensitivity analyses reveal differing revenue responses of EL and SR under the FIP framework.
4. Discussion
4.1. Comparative Interpretation of EL and SR Performance Under the FIP Scheme
The sensitivity analysis results presented in the previous section indicate the need to reinterpret the roles of EL and SR under the FIP scheme from institutional and operational perspectives. Under the FIP framework, revenue is no longer determined by a fixed electricity price but by market-based dispatch decision. Consequently, the ability to switch between electricity generation and hydrogen production becomes a key factor in overall revenue potential. In this context, EL functions as a technology that connects both electricity and hydrogen markets, allowing energy to be redirected toward hydrogen production during periods of low electricity prices and thereby enabling the exploitation of price differentials between the two markets. However, it must be acknowledged that the economic viability of EL is significantly constrained by its high CAPEX. Under current Japanese FIP conditions, achieving a return on investment through electricity arbitrage alone remains challenging for individual BGPs. A potential breakthrough lies in the utilization of surplus renewable energy, which has become a critical issue in regions like Hokkaido due to frequent grid curtailment. Integrating EL as a tool for “sector coupling”—leveraging near-zero-cost surplus electricity from external wind or solar sources—could drastically reduce operational costs and enhance the competitiveness of EL-based biogas-to-hydrogen systems. By contrast, SR relies on continuous biogas consumption, which inherently limits its responsiveness to short-term market price fluctuations, while providing a distinct value proposition in terms of stable energy flows. Accordingly, the distinction between EL and SR should not be interpreted solely in terms of revenue magnitude, but rather as reflecting different system design philosophies under the FIP scheme, namely a trade-off between market-responsive and stability-oriented systems.
These findings are consistent with the technology-level evidence in Lepage et al. (2021) [47]: thermochemical routes, including SR of biomass-derived streams, remain yield-efficient and operationally stable, while EL economics are strongly governed by electricity cost and deployment scale. Accordingly, the viability of EL improves markedly when paired with low-cost renewable electricity, reinforcing our sector-coupling rationale under the FIP framework. Our results therefore complement the review’s techno-economic perspective by showing how market design and operational dispatch under FIP translate those technology characteristics into system-level revenue potential and flexibility–stability trade-offs.
4.2. System-Level Resource Use and Integration Implications
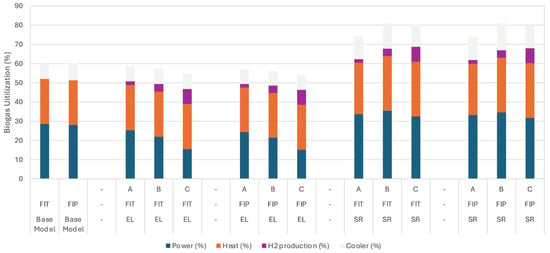
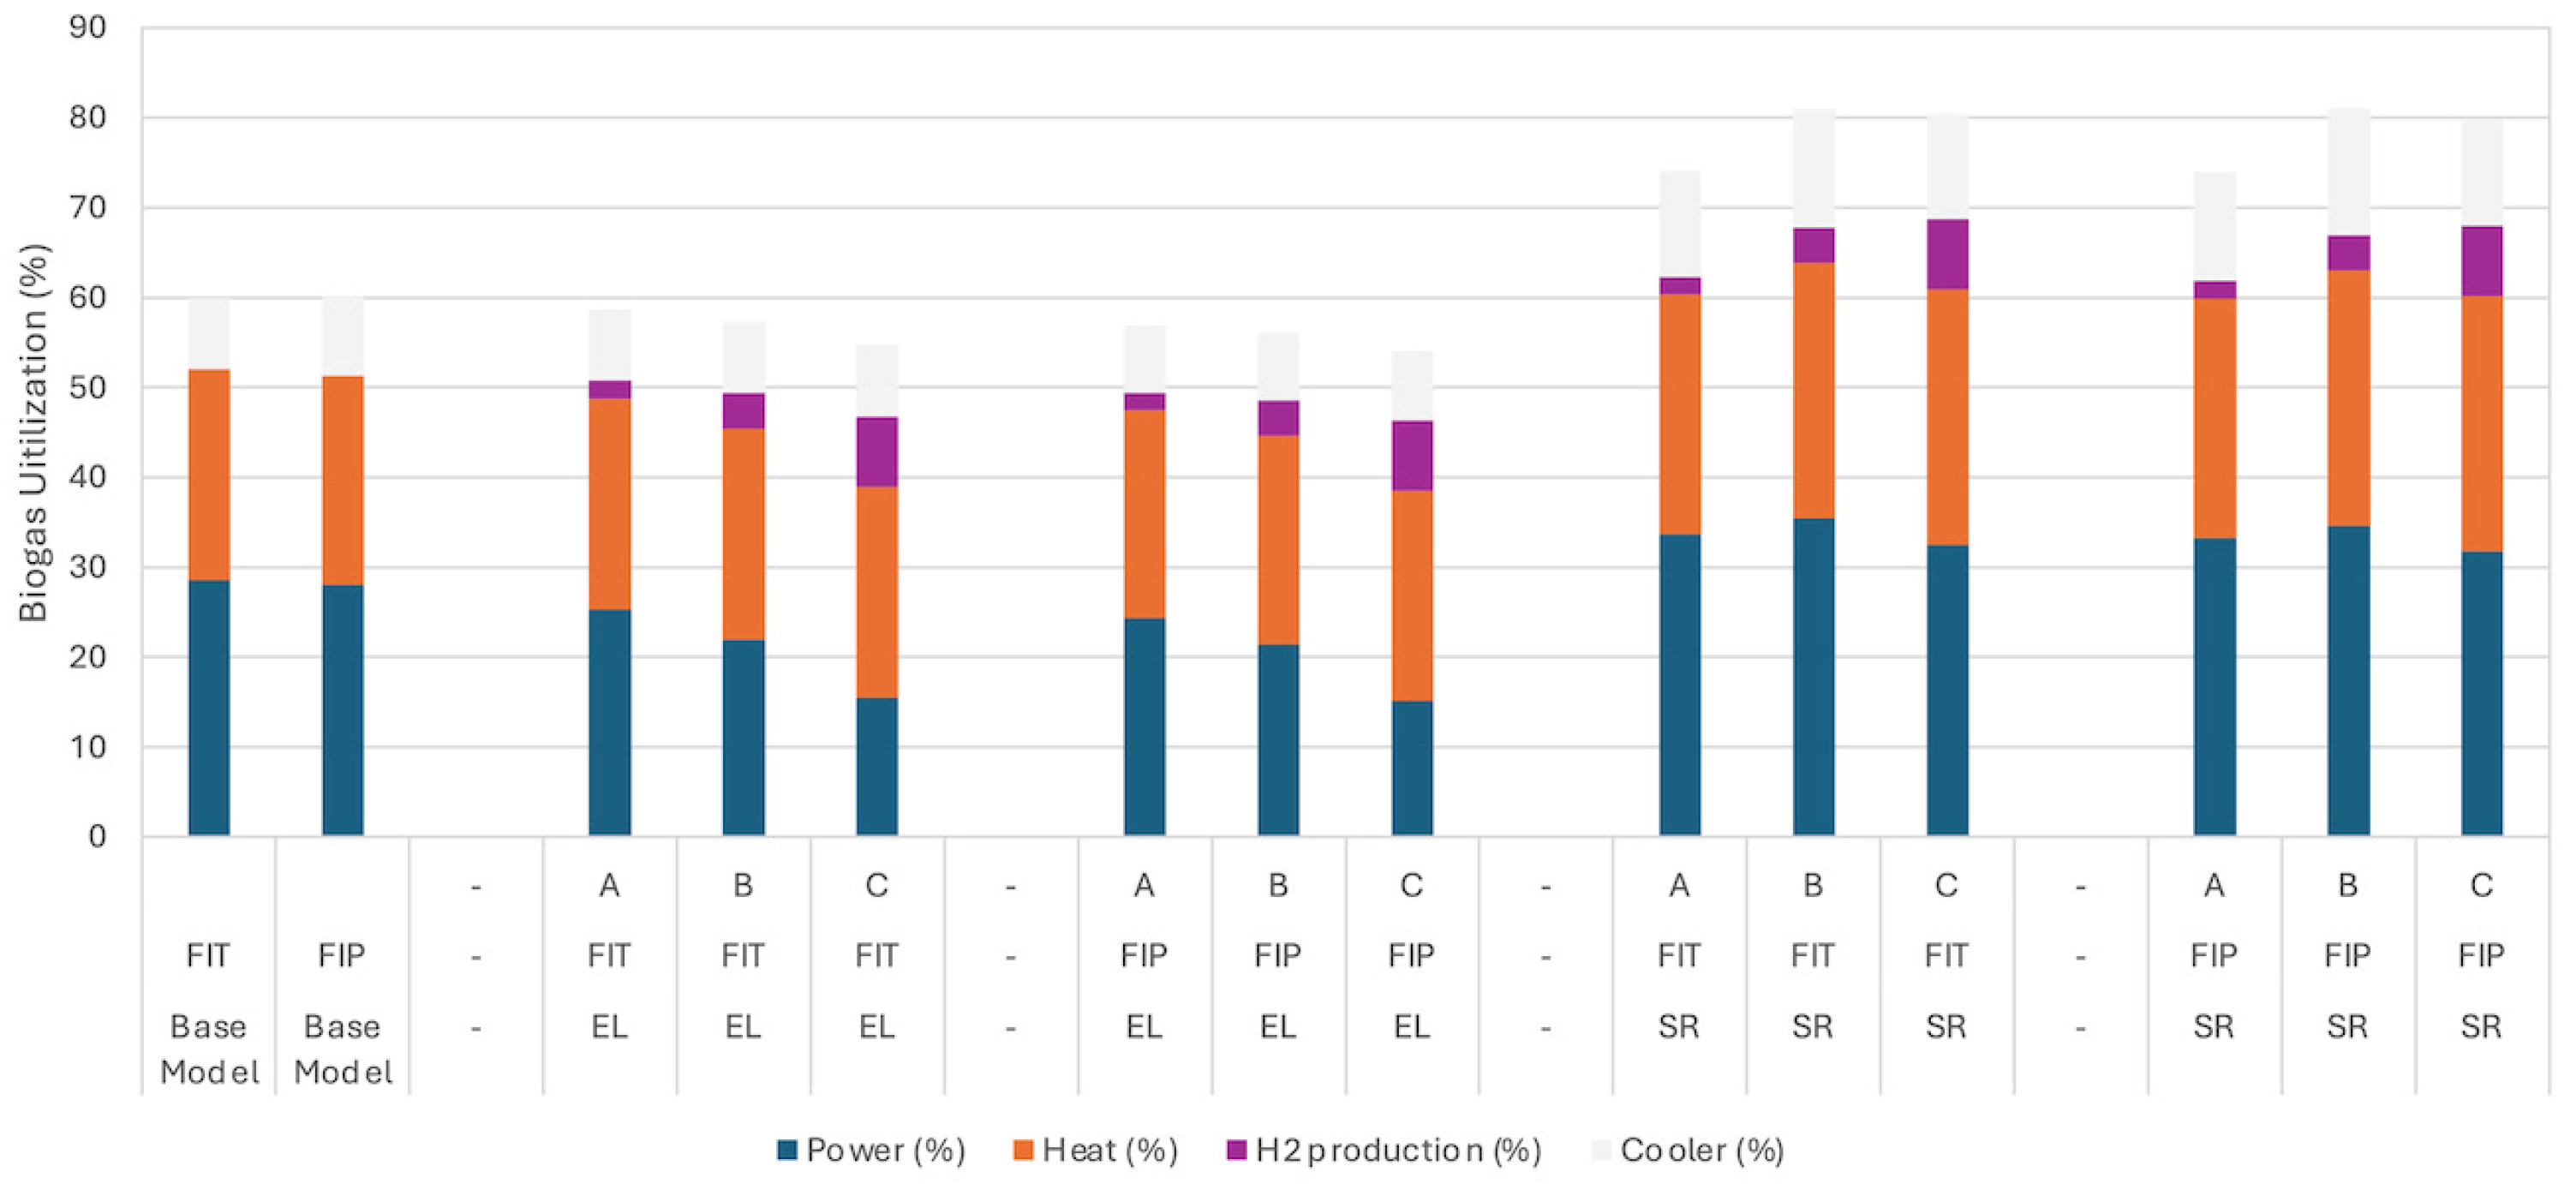
Figure 18 presents the annual biogas flow and mass balance for the analyzed scenarios, illustrating how biogas-derived energy is allocated among power generation, heat supply, hydrogen production, and auxiliary cooling at the system level. This representation provides insight into the structural differences in resource use between the EL and SR pathways beyond simple utilization metrics. The SR pathway is characterized by a high degree of direct biogas consumption, as biogas is used both as a hydrogen feedstock and as an energy source to satisfy the thermal demand of the reformer. As a result, SR-based configurations tend to approach the maximum potential biogas throughput, reflecting a system design that prioritizes continuous fuel use and stable energy flows. In contrast, the EL pathway exhibits a fundamentally different allocation structure. In the scenarios considered in this study, all electricity is generated by biogas-based CHP units and is consumed internally within the system, primarily by the electrolyzer, rather than being fed into the electricity grid. Consequently, hydrogen production in EL systems relies more heavily on electricity conversion than on direct biogas consumption, leading to a lower overall biogas throughput while maintaining substantial hydrogen output.
Figure 18.
System-level biogas flow and energy allocation in EL and SR pathways: System-level allocation of biogas-derived energy among power generation, heat utilization, hydrogen production, and cooling demand for EL and SR pathways under FIP scheme. Values are normalized to the maximum potential biogas production (100%). The same results can alternatively be expressed in absolute energy units (kWh).
From a system integration perspective, this distinction highlights a key trade-off between direct fuel utilization and conversion flexibility. While SR maximizes biogas use through continuous reformer operation, EL decouples hydrogen production from continuous biogas consumption by leveraging electricity as an intermediate energy carrier. This structural flexibility enables EL-based systems to adapt more readily to price-responsive operation under the FIP scheme, albeit with reduced dependence on biogas throughput.
It should be noted that the system-level resource allocation and integration implications discussed in this section are based on several simplifying assumptions. In this study, the dynamic behavior of the EL and SR processes was not modeled in detail, and both were represented as black boxes. Consequently, transient effects such as start-up, shutdown, and part-load dynamics were not explicitly reflected in the resource flow analysis. In addition, potential degradation of electrolyzers associated with frequent cycling was not considered, nor were their implications for long-term performance and costs. Capital and operating expenditures were also represented using simplified, representative values, without explicitly accounting for technology- or site-specific variations. Furthermore, this analysis does not encompass the full scope of hydrogen supply chain costs, such as the expenses for compression and transportation to end-users or the administrative costs of electricity market participation. Finally, hydrogen production was imposed via a fixed annual target and the simulations use a single year of data (2024), under the assumption of constant biogas composition and hourly time resolution with standard CBC solver settings; these choices can influence dispatch patterns and the magnitude of observed effects.
The system-level differences identified between EL and SR in this study are broadly consistent with the techno-economic characteristics summarized in Kannah et al. (2021) [48], who describe SR as a mature, fuel-intensive pathway yielding stable hydrogen output, and EL as a flexible but electricity-price-sensitive technology. Our results reflect these same tendencies, with SR achieving high biogas throughput and continuous operation, while EL shows strong responsiveness to hourly electricity prices under the FIP scheme. However, by embedding these technologies within a farm-scale BGP with CHP units, heat integration, and storage, this study provides a system-integration perspective not covered in the review literature. The findings therefore connect technology-level insights from the review with real-world operational and market conditions relevant to decentralized BGPs.
While these assumptions allow for a clear comparison of the structural differences in resource use between the EL and SR pathways, they may limit the direct transferability of the results to real-world operations. These limitations and directions for future work are discussed in more detail in the Conclusions section.
5. Conclusions
This study investigated the revenue-based economic performance and system-level implications of integrating hydrogen conversion pathways—EL and SR—into an individual BGP operating under the FIP scheme. The results indicate that EL and SR exhibit fundamentally different characteristics in terms of market responsiveness, resource utilization, and operational behavior.
SR-based systems are well suited to operational strategies that prioritize continuous operation, high biogas utilization, and stable energy output. Their relatively low sensitivity to hydrogen price fluctuations implies lower downside risk under uncertain market conditions, making SR an attractive option for operators seeking operational simplicity and limited exposure to electricity market volatility. In contrast, EL-based systems offer greater operational flexibility by coupling electricity and hydrogen production. Although EL may lead to lower average biogas throughput, it provides higher economic upside when periods of low electricity prices coincide with favorable hydrogen market conditions. This feature becomes increasingly relevant in energy systems with a growing share of variable renewable energy and greater electricity price volatility.
From this perspective, the central contribution of this study lies in identifying hydrogen conversion as an additional operational option under FIP-based market-oriented operation, and in clarifying which hydrogen production pathways and system configurations offer superior revenue potential and operationally flexibility at the scale of an individual BGP. Accordingly, the choice between EL and SR should be understood not as a purely technological comparison, but as a system-level design decision shaped by FIP-based operational constraints, reflecting differences in market exposure, operational flexibility, and risk profiles.
Furthermore, while this study focused on EL and SR, other high-potential alternatives should be considered for practical implementation under the FIP scheme. These include biomethane upgrading for direct gas grid injection or transport fuel, and advanced SR technologies with optimized heat recovery. By providing a comparative assessment of EL and SR under a common FIP framework, this study contributes to a clearer understanding of effective biogas-to-hydrogen integration strategies within increasingly market-driven energy systems.
Future studies should build upon these findings by incorporating a more comprehensive economic assessment that accounts for actual operational costs, including hydrogen transportation, storage, and the administrative expenses of market access, to further refine the practical feasibility of these pathways in the real-world supply chain.
Author Contributions
Conceptualization, S.I.; Methodology, N.O.; Validation, N.O.; Formal Analysis, S.I. and N.O.; Investigation, S.I. and N.O.; Resources, S.I. and N.O.; Writing—Original Draft Preparation, S.I.; Writing—Review and Editing, R.L. All authors have read and agreed to the published version of the manuscript.
Funding
This work was supported by JSPS KAKENHI Grant Number JP22K05899.
Data Availability Statement
The original contributions presented in this study are included in the article. Further inquiries can be directed to the corresponding author.
Acknowledgments
This study was supported by Rakuno Gakuen Sabbatical Research Program.
Conflicts of Interest
The authors declare no conflicts of interest.
Abbreviations
The following abbreviations are used in this manuscript:
| BGP | Biogas plant |
| CAPEX | Capital expenditures |
| CHP | Combined heat and power |
| EEG | German Renewable Energy Sources Act |
| EL | Electrolysis |
| FIP | Feed-in Premium |
| FIT | Feed-in Tariff |
| LCA | Life Cycle Assessment |
| OEMOF | Open Energy Modelling Framework |
| PEM | Proton Exchange Membrane |
| SMR | Steam Methane Reforming |
| SR | Steam reforming |
| TEA | Techno-Economic Analysis |
References
- Ministry of the Environment, Japan. 2023 National Greenhouse Gas Emissions and Absorptions Report; Ministry of the Environment: Tokyo, Japan, 2023. Available online: https://www.env.go.jp/content/000310244.pdf (accessed on 25 January 2026). (In Japanese)
- Agency for Natural Resources and Energy, Japan. Energy White Paper 2024: Annual Report on Energy in Japan; Agency for Natural Resources and Energy: Tokyo, Japan, 2024. Available online: https://www.enecho.meti.go.jp/about/whitepaper/2024/pdf/whitepaper2024_all.pdf (accessed on 24 January 2026). (In Japanese)
- Japan Organic Resource Association (JORA). Cost Reduction Measures Toward the Self-Reliance of Anaerobic Digestion–Based Biogas Power Generation; Material No. 5, 97th Procurement Price Calculation Committee; Ministry of Economy, Trade and Industry: Tokyo, Japan, 2024. Available online: https://www.meti.go.jp/shingikai/santeii/pdf/097_05_00.pdf (accessed on 2 August 2025). (In Japanese)
- IEA Bioenergy. Bioenergy’s Role in Balancing the Electricity Grid and Providing Storage Options; IEA Bioenergy Report; IEA Bioenergy: Paris, France, 2017. [Google Scholar]
- Thrän, D.; Dotzauer, M.; Lenz, V.; Liebetrau, J.; Ortwein, A. Flexible bioenergy supply for balancing fluctuating renewables in the heat and power sector—A review of technologies and concepts. Energy Sustain. Soc. 2015, 5, 35. [Google Scholar] [CrossRef] [Scilit]
- Agency for Natural Resources and Energy. FIT Tariff Trends and Policy Revisions 2023–2025; METI: Tokyo, Japan, 2025.
- Japan Organic Resource Association (JORA). Current Status of Anaerobic Digestion-Based Biogas Power Generation; Material No. 11, 88th Procurement Price Calculation Committee; Ministry of Economy, Trade and Industry: Tokyo, Japan, 2023. Available online: https://www.meti.go.jp/shingikai/santeii/pdf/088_11_00.pdf (accessed on 2 August 2025). (In Japanese)
- Electricity and Gas Market Surveillance Commission (EGC), Ministry of Economy, Trade and Industry (METI). Electricity Market Reform and Balancing Market Development in Japan; Electricity and Gas Market Surveillance Commission: Tokyo, Japan, 2024. Available online: https://www.egc.meti.go.jp/english/committee/pdf/egc_leaflet2024.pdf (accessed on 24 January 2026).
- Fraunhofer ISE. Post-FIT Economic Strategies for Biogas Plants in Germany; Fraunhofer ISE: Freiburg, Germany, 2021. [Google Scholar]
- Bundesnetzagentur. Monitoring Report on Renewable Electricity Markets; BNetzA: Bonn, Germany, 2023. [Google Scholar]
- European Biogas Association. Statistical Report of Biogas and Biomethane 2023—Excerpt; European Biogas Association: Brussels, Belgium, 2023; Available online: https://www.europeanbiogas.eu/wp-content/uploads/2023/12/EBA-Statistical-Report-2023-Excerpt.pdf (accessed on 27 January 2026).
- Ichiyanagi, E.; Pescia, D.; Agora Energiewende. The Energiewende in a Nutshell; Agora Energiewende: Berlin, Germany, 2017; Available online: https://www.agora-energiewende.org/publications/the-energiewende-in-a-nutshell (accessed on 24 January 2026).
- Neues zum EEG—‘Biomasse-Paket‘ von EU-Kommission Genehmigt. Becker Büttner Held, 2025. Available online: https://www.bbh-blog.de/alle-themen/beihilfenrecht/neues-zum-eeg-biomasse-paket-von-eu-kommission-genehmigt/ (accessed on 13 February 2026).
- Marijanovic, Z.; Dubois, V. Next Kraftwerke. Interview Biogaspaket: Zukunftsperspektiven für Flexible Biogasanlagen. Available online: https://www.next-kraftwerke.de/energie-blog/biogaspaket-neuregelungen (accessed on 12 February 2026).
- Fuelling Change: The Impact of National Policies on Biomethane Expansion in Europe. Biomethaverse. Available online: https://www.biomethaverse.eu/2023/10/01/fuelling-change-the-impact-of-national-policies-on-biomethane-expansion-in-europe/ (accessed on 12 February 2026).
- Agency for Natural Resources and Energy, Japan. Here’s More About the 6th Strategic Energy Plan: Renewable Energy Expanding with Cost Reduction While Promoting Acceptance of Local Communities; Agency for Natural Resources and Energy: Tokyo, Japan, 2022. Available online: https://www.enecho.meti.go.jp/en/category/special/article/detail_173.html (accessed on 27 January 2026).
- Agency for Natural Resources and Energy, Japan. Renewable Energy FIT/FIP Scheme Guidebook (2023 Edition); Agency for Natural Resources and Energy: Tokyo, Japan, 2023. Available online: https://www.enecho.meti.go.jp/category/saving_and_new/saiene/data/kaitori/2023_fit_fip_guidebook.pdf (accessed on 1 August 2025). (In Japanese)
- Agency for Natural Resources and Energy, Japan. The 7th Strategic Energy Plan; Agency for Natural Resources and Energy: Tokyo, Japan, 2025. Available online: https://www.enecho.meti.go.jp/category/others/basic_plan/pdf/2025_strategic_energy_plan.pdf (accessed on 20 August 2025).
- Agency for Natural Resources and Energy, Japan. Japan’s Energy Policy Toward Achieving GX (Part 2) Policy Package Toward Simultaneously Realizing Decarbonization and Economic Growth; Ministry of Economy, Trade and Industry: Tokyo, Japan, 2023. Available online: https://www.enecho.meti.go.jp/en/category/special/article/detail_179.html (accessed on 24 January 2026).
- Agency for Natural Resources and Energy, Japan. GX Policy Achieving Decarbonization and Economic Growth Together; Ministry of Economy, Trade and Industry: Tokyo, Japan, 2025. Available online: https://www.enecho.meti.go.jp/en/category/special/article/detail_214.html (accessed on 24 January 2026).
- Bauer, F.; Persson, T.; Hulteberg, C.; Tamm, D. Biogas upgrading—Technology overview, comparison and perspectives for the future. Biofuels Bioprod. Biorefin. 2013, 7, 499–511. [Google Scholar] [CrossRef] [Scilit]
- New Energy and Industrial Technology Development Organization (NEDO). Hydrogen Society Construction Technology Development Project: Regional Hydrogen Utilization Technology Development—Survey on a Total System for Hydrogen Utilization Derived from Livestock Manure in the Eastern Hokkaido Region. Results Presentation Materials of NEDO Hydrogen and Fuel Cell Projects. 2022. Available online: https://www.nedo.go.jp/events/report/Z2SE_00004.html (accessed on 3 August 2025).
- Damiri, A.P.; Guerrero, J.; Silva, C.M.; Ribeiro, A.M.; Rodrigues, A.E. A Review of Alternative Processes for Green Hydrogen Production Focused on Generating Hydrogen from Biomass. Hydrogen 2024, 5, 163–184. [Google Scholar] [CrossRef] [Scilit]
- Abawalo, M.; Pikoń, K.; Landrat, M. Comparative Life Cycle Assessment of Hydrogen Production via Biogas Reforming and Agricultural Residue Gasification. Appl. Sci. 2025, 15, 5029. [Google Scholar] [CrossRef] [Scilit]
- Tuluhong, A.; Chang, Q.; Xie, L.; Xu, Z.; Song, T. Current Status of Green Hydrogen Production Technology: A Review. Sustainability 2024, 16, 9070. [Google Scholar] [CrossRef] [Scilit]
- Bento, C.; Lopes, T.F.; Rodrigues, P.; Gírio, F.; Silva, C. Biogas reforming as a sustainable solution for hydrogen production: Comparative environmental metrics with steam-methane reforming and water electrolysis in the Portuguese context. Int. J. Hydrogen Energy 2024, 66, 661–675. [Google Scholar] [CrossRef] [Scilit]
- Bhandari, R.; Clemens, A.; Zapp, P. Life cycle assessment of hydrogen production via electrolysis—A review. J. Clean. Prod. 2014, 85, 151–163. [Google Scholar] [CrossRef] [Scilit]
- Ji, M.; Wang, J. Review and comparison of various hydrogen production methods based on costs and life cycle impact assessment indicators. Int. J. Hydrogen Energy 2021, 46, 38612–38635. [Google Scholar] [CrossRef] [Scilit]
- Radenahmad, N.; Azad, A.T.; Saghir, M.; Taweekun, J.; Bakar, M.S.A.; Reza, M.S.; Azad, A.K. A review on biomass derived syngas for SOFC based combined heat and power application. Renew. Sustain. Energy Rev. 2020, 119, 109560. [Google Scholar] [CrossRef] [Scilit]
- Lundgren, J.; Vreugdenhil, B.; Ganjkhanlou, Y.; Baldwin, R. Biomass Gasification for Hydrogen Production; IEA Bioenergy Task 33; IEA Bioenergy: Paris, France, 2025; Available online: https://www.ieabioenergy.com/blog/publications/biomass-gasification-for-hydrogen-production/ (accessed on 13 February 2026).
- Zhang, C. Review of catalytic reforming of biomass pyrolysis oil for hydrogen production. Front. Chem. 2022, 10, 962587. [Google Scholar] [CrossRef] [Scilit] [PubMed]
- Yu, S.; Li, Q.; Zhang, Y.; Yan, J.; Zhou, H. Enhancing carbon-negative emission technologies through biomass integration. Innov. 2025, 6, 101079. [Google Scholar] [CrossRef] [Scilit] [PubMed]
- IEA. Bioenergy with Carbon Capture and Storage-Energy System; International Energy Agency (IEA): Paris, France, 2024. Available online: https://www.iea.org/energy-system/carbon-capture-utilisation-and-storage/bioenergy-with-carbon-capture-and-storage (accessed on 13 February 2026).
- Leng, S.; Barghi, S.; Xu, C. A short review on green H2 production by aqueous phase reforming of biomass derivatives. npj Mater. Sustain. 2024, 2, 19. [Google Scholar] [CrossRef] [Scilit]
- Singh, S.; Pandey, G.; Rath, G.K.; Veluswamy, H.P.; Molokitina, N. Life cycle assessment of biomass-based hydrogen production technologies: A review. Int. J. Green Energy 2025, 22, 1454–1469. [Google Scholar] [CrossRef] [Scilit]
- Oemof Developer Group. Dispatch vs. Investment Optimization-v0.6.2; oemof-solph Documentation; Oemof Developer Group: Berlin, Germany, 2026; Available online: https://oemof-solph.readthedocs.io/en/stable/optimization/dispatch_vs_invest.html (accessed on 13 February 2026).
- Kazda, K.; Li, X. A Critical Review of the Modeling and Optimization of Combined Heat and Power Dispatch. Processes 2020, 8, 441. [Google Scholar] [CrossRef] [Scilit]
- Mohamed, E.A.; Mostafa, M.H.; Ali, Z.M.; Abdel Aleem, S.H.E. Assessing the sustainability of combined heat and power systems with renewable energy and storage systems: Economic insights under uncertainty of parameters. PLoS ONE 2025, 20, e0319174. [Google Scholar] [CrossRef] [Scilit] [PubMed]
- Heiker, M.; Kraume, M.; Mertins, A.; Wawer, T.; Rosenberger, S. Biogas Plants in Renewable Energy Systems—A Systematic Review of Modeling Approaches of Biogas Production. Appl. Sci. 2021, 11, 3361. [Google Scholar] [CrossRef] [Scilit]
- Ciuła, J.; Generowicz, A.; Gaska, K.; Gronba-Chyła, A. Efficiency Analysis of the Generation of Energy in a Biogas CHP System and its Management in a Waste Landfill—Case Study. J. Ecol. Eng. 2022, 23, 143–156. [Google Scholar] [CrossRef] [Scilit]
- Hilpert, S.; Kaldemeyer, C.; Krien, U.; Günther, S.; Wingenbach, C.; Plessmann, G. The open energy modelling framework (Oemof)—A new approach to facilitate open science in energy system modelling. Energy Strateg. Rev. 2018, 22, 16–25. [Google Scholar] [CrossRef] [Scilit]
- Forrest, J.; Lougee-Heimer, R. CBC User Guide. In Emerging Theory, Methods, and Applications; INFORMS: Catonsville, MD, USA, 2005; Available online: https://www.coin-or.org/Cbc/cbcuserguide.html (accessed on 12 January 2026).
- Federal Ministry for Economic Affairs and Climate Action (BMWK). State-Imposed Components of the Electricity Price. Available online: https://www.bundeswirtschaftsministerium.de/Redaktion/EN/Artikel/Energy/electircity-price-components-state-imposed.html (accessed on 12 January 2026).
- Japan Electric Power Exchange (JEPX). Spot Market Electricity Prices (Monthly). Available online: https://www.jepx.info (accessed on 1 August 2025).
- C.A.R.M.E.N. e. V. Marktübersicht Elektrolyseure. 2023. Available online: https://www.carmen-ev.de/service/marktueberblick-erneuerbare-energien/marktuebersicht-elektrolyseure/ (accessed on 7 January 2026).
- Ministerial Council on Renewable Energy, Hydrogen and Related Issues. Basic Hydrogen Strategy (Revised Edition); Ministerial Council on Renewable Energy, Hydrogen and Related Issues: Tokyo, Japan, 2023. Available online: https://www.meti.go.jp/shingikai/enecho/shoene_shinene/suiso_seisaku/pdf/20230606_5.pdf (accessed on 10 February 2026).
- Lepage, T.; Kammoun, M.; Schmetz, Q.; Richel, A. Biomass-to-hydrogen: A review of main routes production, processes evaluation and techno-economical assessment. Biomass Bioenergy 2021, 144, 105920. [Google Scholar] [CrossRef] [Scilit]
- Yukesh Kannah, R.; Kavitha, S.; Karthikeyan, O.P.; Kumar, G.; Dai-Viet, N.V.; Rajesh Banu, J. Techno-economic assessment of various hydrogen production methods—A review. Bioresour. Technol. 2021, 319, 124175. [Google Scholar] [CrossRef] [Scilit]

Disclaimer/Publisher’s Note: The statements, opinions and data contained in all publications are solely those of the individual author(s) and contributor(s) and not of MDPI and/or the editor(s). MDPI and/or the editor(s) disclaim responsibility for any injury to people or property resulting from any ideas, methods, instructions or products referred to in the content. |
© 2026 by the authors. Licensee MDPI, Basel, Switzerland. This article is an open access article distributed under the terms and conditions of the Creative Commons Attribution (CC BY) license.