


Abstract
Reverse electrodialysis (RED) is a power generation method that harnesses the energy of mixing high- and low-salinity solutions through ion migration across ion-exchange membranes. While it is being extensively investigated as an environmentally friendly technology that utilizes renewable materials and generates no air pollution, it also has severe limitations that put RED’s technical and economic feasibility into question. This paper discusses RED’s geographical, technical, and economic limitations and provides a critical review of the attempts at addressing them. We conclude that the pretreatment costs and the capital investment costs are prohibitively expensive, making RED uneconomical compared to other renewable energy generation methods.
1. Introduction
Many researchers have responded to the increasing pressure of climate change by developing new, “green” technologies for power generation. The industry has coined the term “Green Energy” to describe the electric energy generated by a set of technologies that either completely or mostly depend on renewable resources. Typical sources of “Green Energy” include solar plants, wind turbines, hydroelectric plants, and others. One of the proposed methods is to harness the energy of mixing brine and fresh water. The energy gained from the difference between fresh and salt water, dubbed as “Blue Energy” [1], can be generated by methods such as pressure-retarded osmosis, capacitive mixing, nanopore power generation, and reverse electrodialysis (RED) [2]. The “Blue Energy” approach offers important advantages: it is less sensitive to seasonal variation compared to wind and solar power and can work continuously 24/7 [3]. Among these methods, RED is the most popular method of generating Blue Energy. It has been extensively investigated by membrane scientists and has led to the development of new ion-exchange membranes. However, to our best knowledge, it has not been adopted as a significant part of the energy grid in any country. RED is perceived as economically unattractive when benchmarked against conventional energy supplies and other alternative power sources [2,4].
In this paper we will first discuss the physical basis of reverse electrodialysis. Then we will discuss its main limitations: economic, environmental, and engineering problems that impede the wide-scale implementation of reverse electrodialysis. Finally, we will try to answer the most pressing question regarding the RED research: is Blue Energy generated by RED the Green Energy of the future?
2. Physical Basis of Reverse Electrodialysis
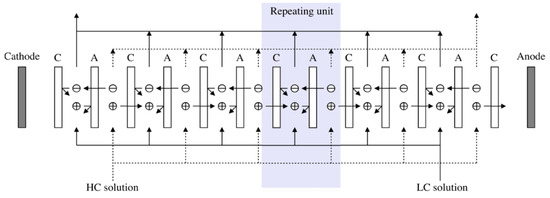
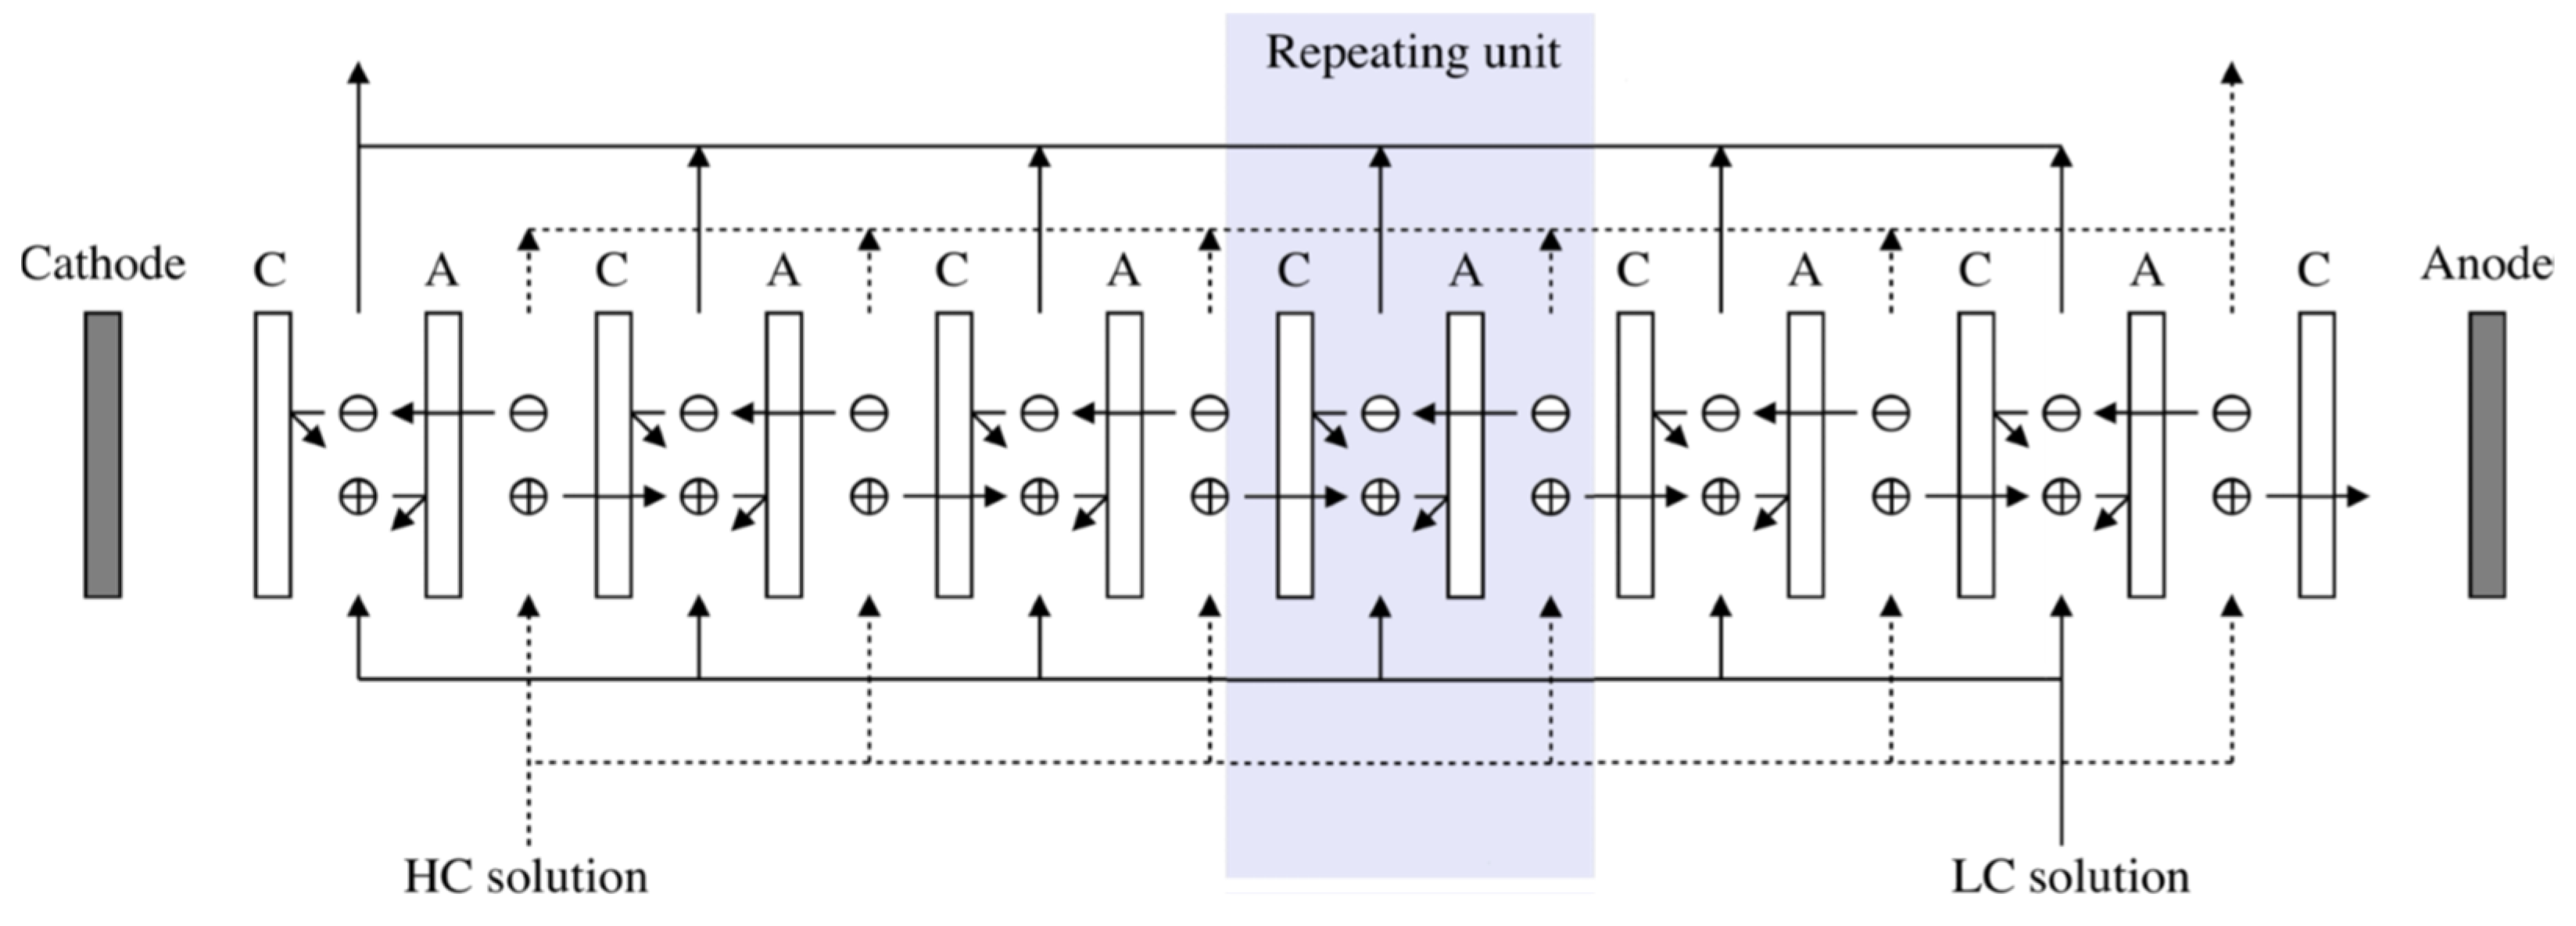
Reverse electrodialysis utilizes ion-exchange membranes, polymeric materials that are selectively permeable for cations (cation-exchange membranes) or anions (anion-exchange membranes). Cation- and anion-exchange membranes are alternately placed in the membrane stack, with high-concentration (HC) and low-concentration (LC) solutions flowing between the membranes—see Figure 1. The difference in ion concentration between two sides of the membrane at position x along the flow channel generates the electric potential of a single cell pair, Ecell(x), which can be calculated using the Nernst equation [5,6]:
where αC/αA denote the permselectivity of cation-/anion-exchange membrane, respectively (ion-exchange membranes do not exclude co-ions perfectly and some co-ions leak across the membranes during RED [7]); a+HC(x), a+LC(x), a−HC(x), a−LC(x) denote, respectively, the activity at position x of cations in the HC solution, cations in the LC solution, anions in the HC solution, anions in the LC solution; z+/z− denote valence of cations/anions; T denotes temperature, R is the gas constant and F is the Faraday constant. In the case of dilute solutions, used for the LC, the molar concentration, C, can be used instead of activity, as the activity coefficient γ approaches 1:
Ecell(x) = αC·RT/(z+F)·ln[a+HC(x)/a+LC(x)] + αA·RT/(z−F)·ln[(a−HC(x)/a−LC(x)],
ai = γi · Ci,
Figure 1.
General scheme of reverse electrodialysis stack. C—cation-exchange membrane, A—anion-exchange membrane, HC—high concentration, LC—low concentration. Arrows denote the direction of HC/LC solution flow and the direction of ion migration.
In the case of saline and hypersaline solutions, used for HC, the activity coefficient can be calculated using models taking into account the ion–ion interactions and ionic strength of the solution, I, such as [8]:
where B is the coefficient specific to a given cation–cation pair (see [8]) for detailed calculation. The electric resistance of the single cell pair at position x, Rcell(x), can be calculated as [5,6]:
where RHC(x), RLC(x), RC, and RA denote electric resistance of the HC solution, the LC solution, cation- and anion-exchange membrane, respectively. Ignoring the electrode rinse compartments, current density j and output voltage U for a RED stack with N cells are given as [5,6]:
log[γ1/(z+z−)] = −0.511·I0.5/(1 + I0.5) + (0.06 + 0.6B)I/(I + 1.5/|z+z−|)2 + BI/|z+z−|
Rcell(x) = RHC(x) + RLC(x) + RC + RA,
j(x) = [N·Ecell(x) − U]/[N·Rcell(x)],
Power output P of RED stack of effective length L and channel height h is given as [5,6]:
P = U·I = U·h·∫0Lj(x)dx,
In order to generate the power output P, however, it is necessary to pump both the HC and the LC solutions through the RED stack. Thus, the net power density, Pnet, must include pumping losses Phydraulic [5,6]:
Pnet = P − Phydraulic,
The amount of energy that can be generated by RED stems from the thermodynamics of mixing saline water with fresh water [7].
Apart from ion transport, RED also experiences water transport across the ion-exchange membranes. The salt concentration difference across the IEMs produces an osmotic gradient that drives the migration of water from the LC solution to the saltier HC solution. Water transport also occurs via electro-osmosis—charged ions migrating across a hydrated IEM exert an electrostatic field that drags along nearby polar water molecules [7].
Concentration polarization is also an important factor affecting the RED power generation. The mass transfer across the membrane can be generalized into three steps: migration of the species from the bulk of the HC solution to the one side of ion-exchange membrane through the diffusion boundary layer, migration across the membrane, and migration from the second side of the membrane to the bulk of the LC solution. Because of the difference between the diffusion boundary layer transport and the transport in the membrane phase, a difference arises between the bulk concentration of ions migrating from the HC to the LC, Cb, and the concentration at the membrane of said ion, Cm, which can be calculated as [9]:
where J denotes the ion flux (assumed as a positive value when an ion migrates from the HC to LC) and k denotes the mass transfer coefficient, which can be calculated as [9,10]:
where Sh denotes Sherwood’s number, dh denotes the specific dimension of the flow channel, Re denotes Reynolds’ number, and Sc denotes Schmidt’s number. The specific values of empirical parameters A, B, C of Equation (10) depend on flow regime and the geometry of the flow channel.
Cm,HC = Cb,HC − J/kHC,
Cm,LC = Cb,LC + J/kLC,
Sh = k·dh/D = A·ReB·ScC,
The concentration polarization decreases the power density as it decreases the driving force (activity difference between the HC and LC). Concentration polarization is affected by the geometry of the intermembrane spacer, the fluid properties, as well as the hydrodynamic conditions (i.e., linear flow velocity). As the electromembrane processes are typically operated in laminar flow regime, the decrease in concentration polarization is typically achieved by the optimization of spacer geometry [11,12,13].
Several factors affect the net power density of the RED stack—see Table 1 for the summary. A high difference in concentration between the HC and the LC increases the generated electric potential, increasing the generated power output. On the other hand, it limits the number of sites that are viable for RED to operate. The performance of ion-exchange membranes is crucial. Ideally, they should have high permselectivity and low electric resistance. Lowering intermembrane distance offers better mass transfer but also increases the pumping costs. Lowering membrane electric resistance increases the net power density; notably, there is synergistic effect in improving electric resistance and mass transfer, suggesting greater gains can be obtained by concurrently targeting the membrane and module design [7]. In the next section we will discuss how these factors impose limitations on RED technology.
Table 1.
Factors affecting reverse electrodialysis.
3. Limitations of Reverse Electrodialysis
To realize actual implementation, RED needs to at least be competitive with other alternative energy sources [4]. Although some authors claim RED could achieve electricity production cost of $0.10/kWh, similar to other renewable energy sources (see Table 2), they also stress this is a theoretical value under very favorable conditions (high power density, low membrane resistance) [3].
Table 2.
Levelized cost of electricity in 2023, data after [18].
3.1. Geographical Limitations
It is generally recommended for RED to have a high concentration difference between the HC and the LC solutions, with researchers using hypersaline HC solutions (5 mol/dm3) [19]. However, this imposes severe geographical limitations on the RED plant. Not all sites have two streams of very different salinity readily available. Possible sources for the HC solution could include seawater, hypersaline lakes, or anthropogenic brines [20]. RED plants could be located near river estuaries, so that seawater and river water could be utilized, and the RED waste stream can be discharged back to the sea. Alternatively, the RED plant can be co-located with a desalination plant or any other source of anthropogenic brines, utilizing the salinity of brines. The co-location with a desalination plant, however, would still need a source of the LC solution, which could be:
- (1)
- some external groundwater, which is not always available,
- (2)
- water produced by the desalination plant or by wastewater treatment plant. This, however, would mean that RED would at best only recover part of energy spent on desalination by mixing the portion of the product back with waste, thus decreasing the recovery. While this may sound like a pointless exercise, it could theoretically make sense if economic factors are taken into account, e.g., if you run desalination when the energy is cheap due to low demand, but then run RED on desalination products when the demand is high and energy is expensive (similar to how pumped storage hydroelectricity is used to load-balance the energy grid),
- (3)
- part of the desalination plant feed. However, the salinity difference between the desalination plant feed and the desalination brines would be lower than in the previous two cases.
Sampedro et al. [21] have discussed the possible locations of RED plants, investigating the potential of integrating RED in the 281 coastal wastewater treatment plants in the European Union. They identified two geographic criteria for assessing RED site potential: distance between wastewater treatment plant and seawater intake (maximum of 1 km), and altitude above sea level (maximum of 10 m). While the specific values of these factors would have to be subject of techno-economic assessment during the plant-design stage, those limits indicate how restricted RED is with respect to location. Essalhi et al. [22] have analyzed Sweden’s potential for RED energy production, concluding that the theoretical extractable energy potential is 13% of country’s total electricity consumption. This, however, is a value for a country with a long coastline and a lot of rivers entering the sea. Giacalone et al. [14] have discussed ten potential locations of RED plants around the world, finding that the best-case scenario is when highly concentrated brine (260–300 g/L) is mixed with fresh water (0.5–13.5 g/L). Locations in Utah, Turkmenistan, and Italy were identified as the most promising among all the locations investigated, which shows how geographically limited RED locations are.
Another important consideration is the utilization of RED waste stream. What RED does, basically, is to take brine and dilute it with fresh water. While you harness the energy from this process, you also end up with waste stream of salinity that is somewhere in between brine and diluate. One could argue that important minerals (e.g., sodium chloride, magnesium hydroxide, etc.) could be recovered from RED waste stream to offset the utilization costs, but it makes no technical or economic sense to use mixed brine to achieve that when you had concentrated solution in the first place. We argue that in order for the RED plant to be feasible, the income from the generated electric energy must be higher than the waste stream utilization costs, which can be substantial. For example, in the US, the costs of saline water utilization in inland desalination plants reach 5–33% of total desalination costs and is estimated at 0.26–0.32 $/m3 of desalinated water or 308–380 $/t of salt contained in the discharge (both in 2004 prices, inflation not included) [23]. In a recent economic analysis [24] of high-recovery brackish water desalination plant has shown that the brine disposal can account for 30–54% of total operating costs (the 2025 price of $1500/Mgal was assumed as brine disposal cost in the simulation).
The location of the RED plant also affects the temperature of the HC/LC solutions fed to the RED unit, which strongly affects the performance of ion-exchange membranes [3]. The temperature increases the ion mobility, increasing the solution conductivity and decreasing the membrane electric resistance [25]. It also decreases the solution viscosity, decreasing the pumping energy requirement. On the other hand, increased temperature decreases the permselectivity of ion-exchange membranes [20]. Additionally, membrane lifetime is reduced at higher temperatures (60 °C) [26]. Despite that, increasing the feed temperature from 20 to 40 °C can more than double the power output of a RED unit [25,27]. The specific composition of the HC stream can also influence the performance of the RED stack. For example, when the HC contains MgSO4 and NaCl in a 1:9 molar ratio, the power density can be 29–50% lower compared to the HC being pure NaCl solution [28].
3.2. The Need for Pretreatment
In order to be adopted in the power generation industry, RED must be able to utilize natural waters (e.g., river water, seawater, etc.). It is therefore impossible to assess the economics of RED power generation without taking into account the pretreatment required in such cases. Salinity gradient power generation faces the challenging operational obstacle of fouling, caused by natural organic matter, colloids, and biofilm-forming microbes, that are ubiquitous in natural waters [4].
Conventional pretreatment typically consists of acid addition, coagulant/flocculant addition, disinfection, media filtration, and cartridge filtration. In recent years, the microfiltration and/or ultrafiltration have been commonly used as a pretreatment in osmosis desalination plants [29]. The pretreatment costs in the case of membrane-based desalination technologies vary depending on plant capacity, type of feed water, and product quality requirements. For example, in the case of brackish water reverse osmosis, the costs were estimated as ca. $0.12/m3 and $0.25/m3 (in 2021 prices, inflation not included) for microfiltration and ultrafiltration, respectively [30].
Ju et al. [31] have compared various methods of pretreatment for the RED LC solution, concluding that only NF had a significant effect on open-circuit voltage and power density. However, since the energy consumption of NF decreased the net power density, granular activated carbon or activated filter media were recommended as pretreatment methods. Coagulation can be used as a RED pretreatment method; however, the coagulant dose needs to be carefully optimized, as it was shown in [32] that the excess of coagulant may lead to an increase in electric resistance of the cation-exchange membranes. Jwa et al. [33] have shown that microbial electrolysis can be effectively used as a RED pretreatment to increase the generated power density; however, it is unclear how much such a pretreatment would cost and if the increase in power density could offset the pretreatment costs. In the Okinawa RED pilot plant [34], the pretreatment consisted of sand filtration and 0.45 µm cartridge filter; however, the authors have noticed that when raw seawater was used, some fouling was observed. When the SWRO brine was used, fouling was less, as water fed to the desalination plant producing SWRO brine already underwent a pretreatment, including ultrafiltration. Vital et al. [35] have investigated the effect of pretreatment systems on the RED plant performance. For the LC solution, a dual media filtration (sand/anthracite) followed by microfiltration (1 µm pore size) was utilized, whereas for the HC (seawater), the dual media/microfiltration was followed by activated carbon treatment and ultrafiltration (0.02 µm pore size). The results show that if the dual-media filtration was used alone, gross power density decreased by 25% after 54 days, which was attributed to fouling. With the microfiltration step included, the decrease in gross power density was only 3%. The results indicate that RED needs at the very least a microfiltration pretreatment. The RED pretreatment would also be needed if the desalination wastewater is to be used as a HC solution. For example, in the hybrid system presented in [36], the HC solution for the RED is the SWRO retentate concentrated further by membrane distillation, while the LC is the pretreated seawater. Because of high rejection coefficients of reverse osmosis and membrane distillation, any foulant present in the feed water would be concentrated in the HC solution, which necessitates advanced pretreatment.
3.3. Ion-Exchange Membranes
The membrane is the crucial part of every membrane-based technology. In the case of RED, the permselectivity and electric resistance of the membranes directly affect the generated power density. Many of the challenges faced by RED processes are based on the IEM’s properties and costs [3].
Because the thickness of an ion-exchange membrane influences the area resistance, the use of relatively thin membranes is expected to be advantageous in a RED system [37]. The progress in ion-exchange membrane development has led to the fabrication of membranes as thin as 18 µm [38,39] with very low area resistance (0.46–0.47 Ω·cm2).
Permselectivity of the ion-exchange membrane mainly depends on the fixed charge density, defined as the quantity of counter-ions that can be exchanged per unit water content of the membrane. Charge density is a function of both ion-exchange capacity (IEC) and swelling degree. Ion-exchange capacity is not the sole factor that determines permselectivity; membranes with a high IEC can have a low permselectivity due to their high degree of swelling [37]. It appears there is no straight relationship between charge density and the area resistance/permselectivity [37]. The univalent permselective membranes, although they do not contribute to the increase in power output [38], are sometimes used to prevent IEM fouling [34,38]. Membrane stability is another factor affecting the overall cost of RED. Already existing commercial ion-exchange membranes have good stability in typical conditions (mixing seawater/brine with fresh water); however, if some unusual anthropogenic source of the HC/LC solutions is considered, membrane chemical stability should also be investigated.
The specific capital cost of a high-salinity ED plant is approximately $600/m2 of membrane, out of which ~$222/m2 are the membrane costs (in 2019 prices, inflation not included) [40]. Some authors have assumed even higher costs for the entire RED stack, e.g., $750/m2 [41] in 2015 prices. Ortiz et al. [42] have stated the RED membranes cost $114.75/m2 (in 2025 prices); however, the assumed membrane lifetime was low (5 years, whereas typical life-time of ED membranes is 10 years). Membranes International Inc. [43] as of the year 2026 offers ion-exchange membranes at 211 $/m2; however, they offer discounts for bulk purchases. Some market analysts even state that the cost of ion-exchange membranes may be approximately $250–500/m2 in the near future [44]. To our best knowledge, the cheapest ion-exchange membranes that can be purchased commercially, Ionsep-AM-A and Ionsep-AM-C [45,46], cost around 31–39 $/m2 as of the year 2026, but their electric resistance is quite high for a RED application, up to 6 Ω·cm2.
On the other hand, the membrane costs assumed by other authors seem to be underestimated, reaching even 4 €/m2 in 2024 prices [6]. Sampedro et al. [47] assumed in 2023 a membrane price of 4–10 €/m2, with a relatively long lifetime of 15 years. Other authors have assumed membrane costs of 4–15 €/m2 in 2019 prices [14], or $10/m2 in 2023 prices [48]. In [49], back in the year 2010, membrane costs were assumed to be lower than $2/m2. In 2022, the US Department of Energy awarded a research grant for a private company, GVD Corp., to manufacture low-cost (<20 $/m2) ion-exchange membranes, with the project end scheduled for 2024 [50]; however, it is unclear whether this goal was achieved. The research on lowering the ion-exchange prices is ongoing, and the use of low-cost acrylic precursors combined with improvement in membrane fabrication is expected to lower the cost down to 10 €/m2 [51]. However, these improvements are still at low TRL and have not been widely implemented in the industry. We would urge authors publishing economic analyses of RED to substantiate their techno-economic assessment by providing contact info of commercial suppliers offering membranes at the prices used for estimation.
3.4. Module Design
Module design is often an overlooked part of RED research. The physical parameters of the RED module can affect the generated power density. The intermembrane distance, enforced by spacer thickness, and the shape of the spacer mesh strongly affect the mass transfer [11,13,52] and the generated power density. Generally, thin spacers exhibit higher mass-transfer coefficients at the cost of higher hydraulic pressure drop [13]; in the case of RED, this leads to a trade-off between making the intermembrane distance as small as possible, but not too small so that the generated power is consumed by the increased pumping costs [53]. Wu et al. have compared the stainless-steel spacer (0.28 mm thickness, 72.83% porosity) with the PET spacer (0.25 mm thickness, 67% porosity) [54], finding that the former can increase the limiting current density by 31.4%. Vermaas et al. [55] have investigated the effect of residence time on the net power density in the 0.5–200 s range, showing that the optimum lies at 2.4 s and 7.2 s for stacks with profiled membranes and spacers, respectively. The geometry of spacer mesh (e.g., the ratio of distance between spacer filaments to spacer thickness) was also found to be an important factor influencing the maximum power density [12]. Having effective spacers that promote high mass transfer means that the required membrane length can be quite short [15]. In the case of RED, the HC is lowered and the LC is increased as the ions migrate through ion-exchange membranes; this leads to the drop in driving force. If the HC/LC flow channels in the RED module are too long, eventually equal salinity will be reached on both sides of the membrane, and no power will be generated. Considering that the membrane costs are quite substantial in the overall costs of RED power generation, short modules/high mass transfer is preferable.
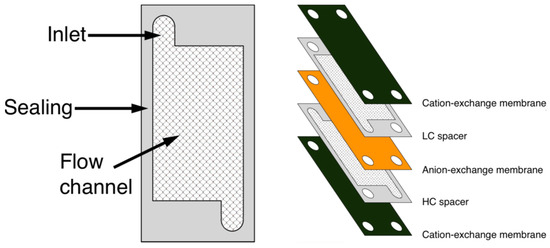
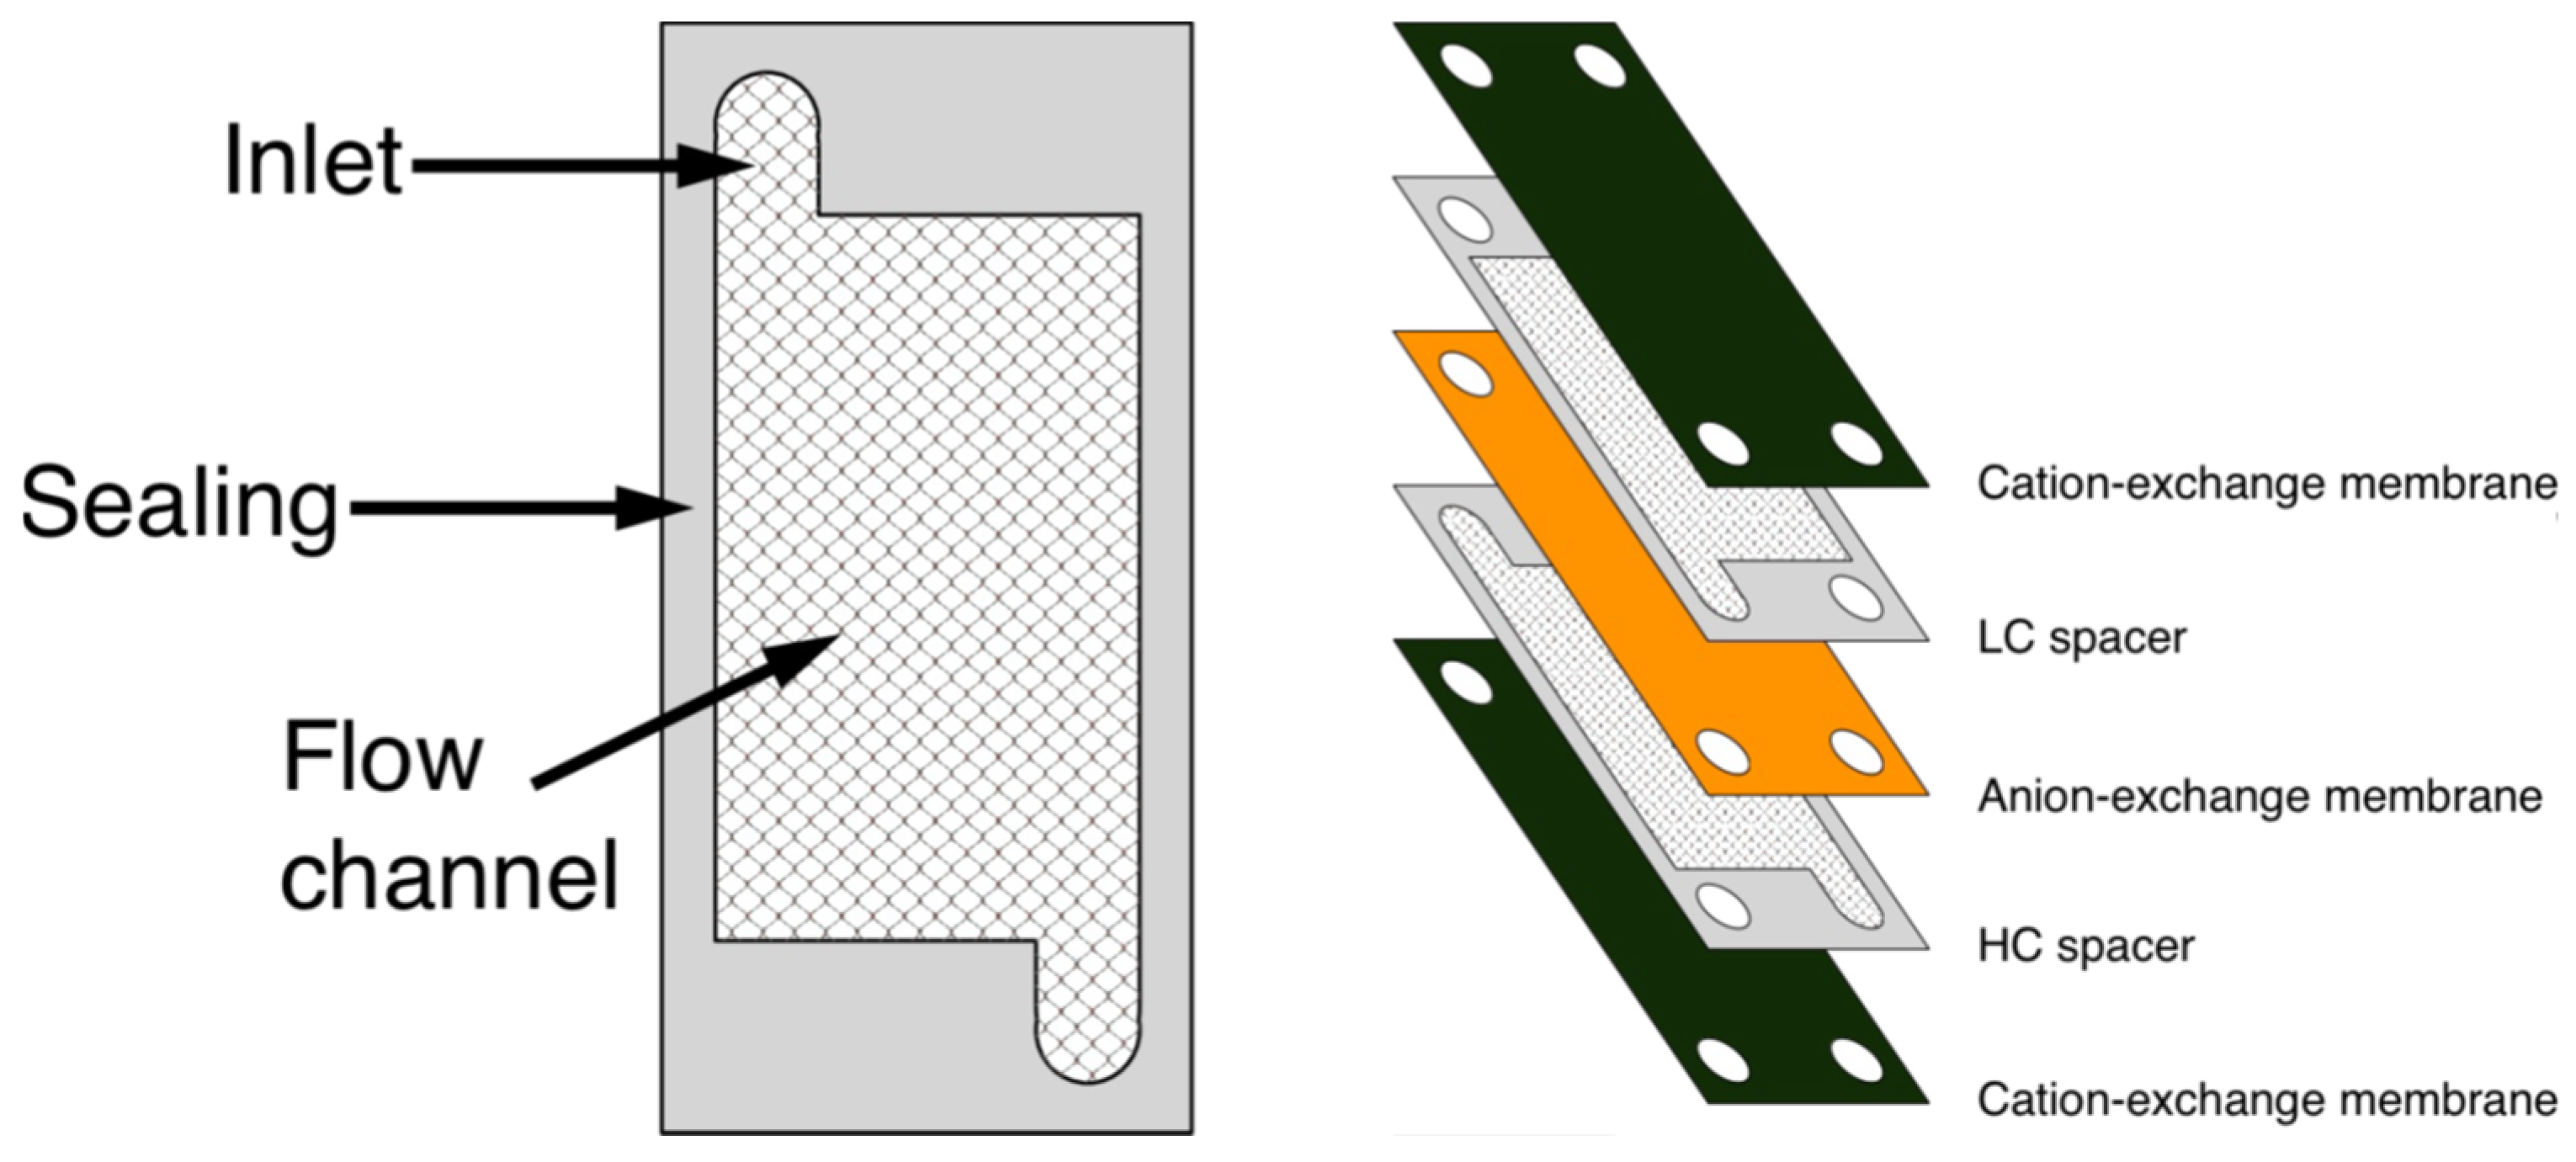
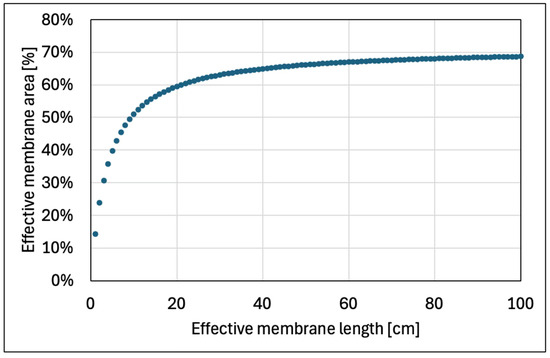
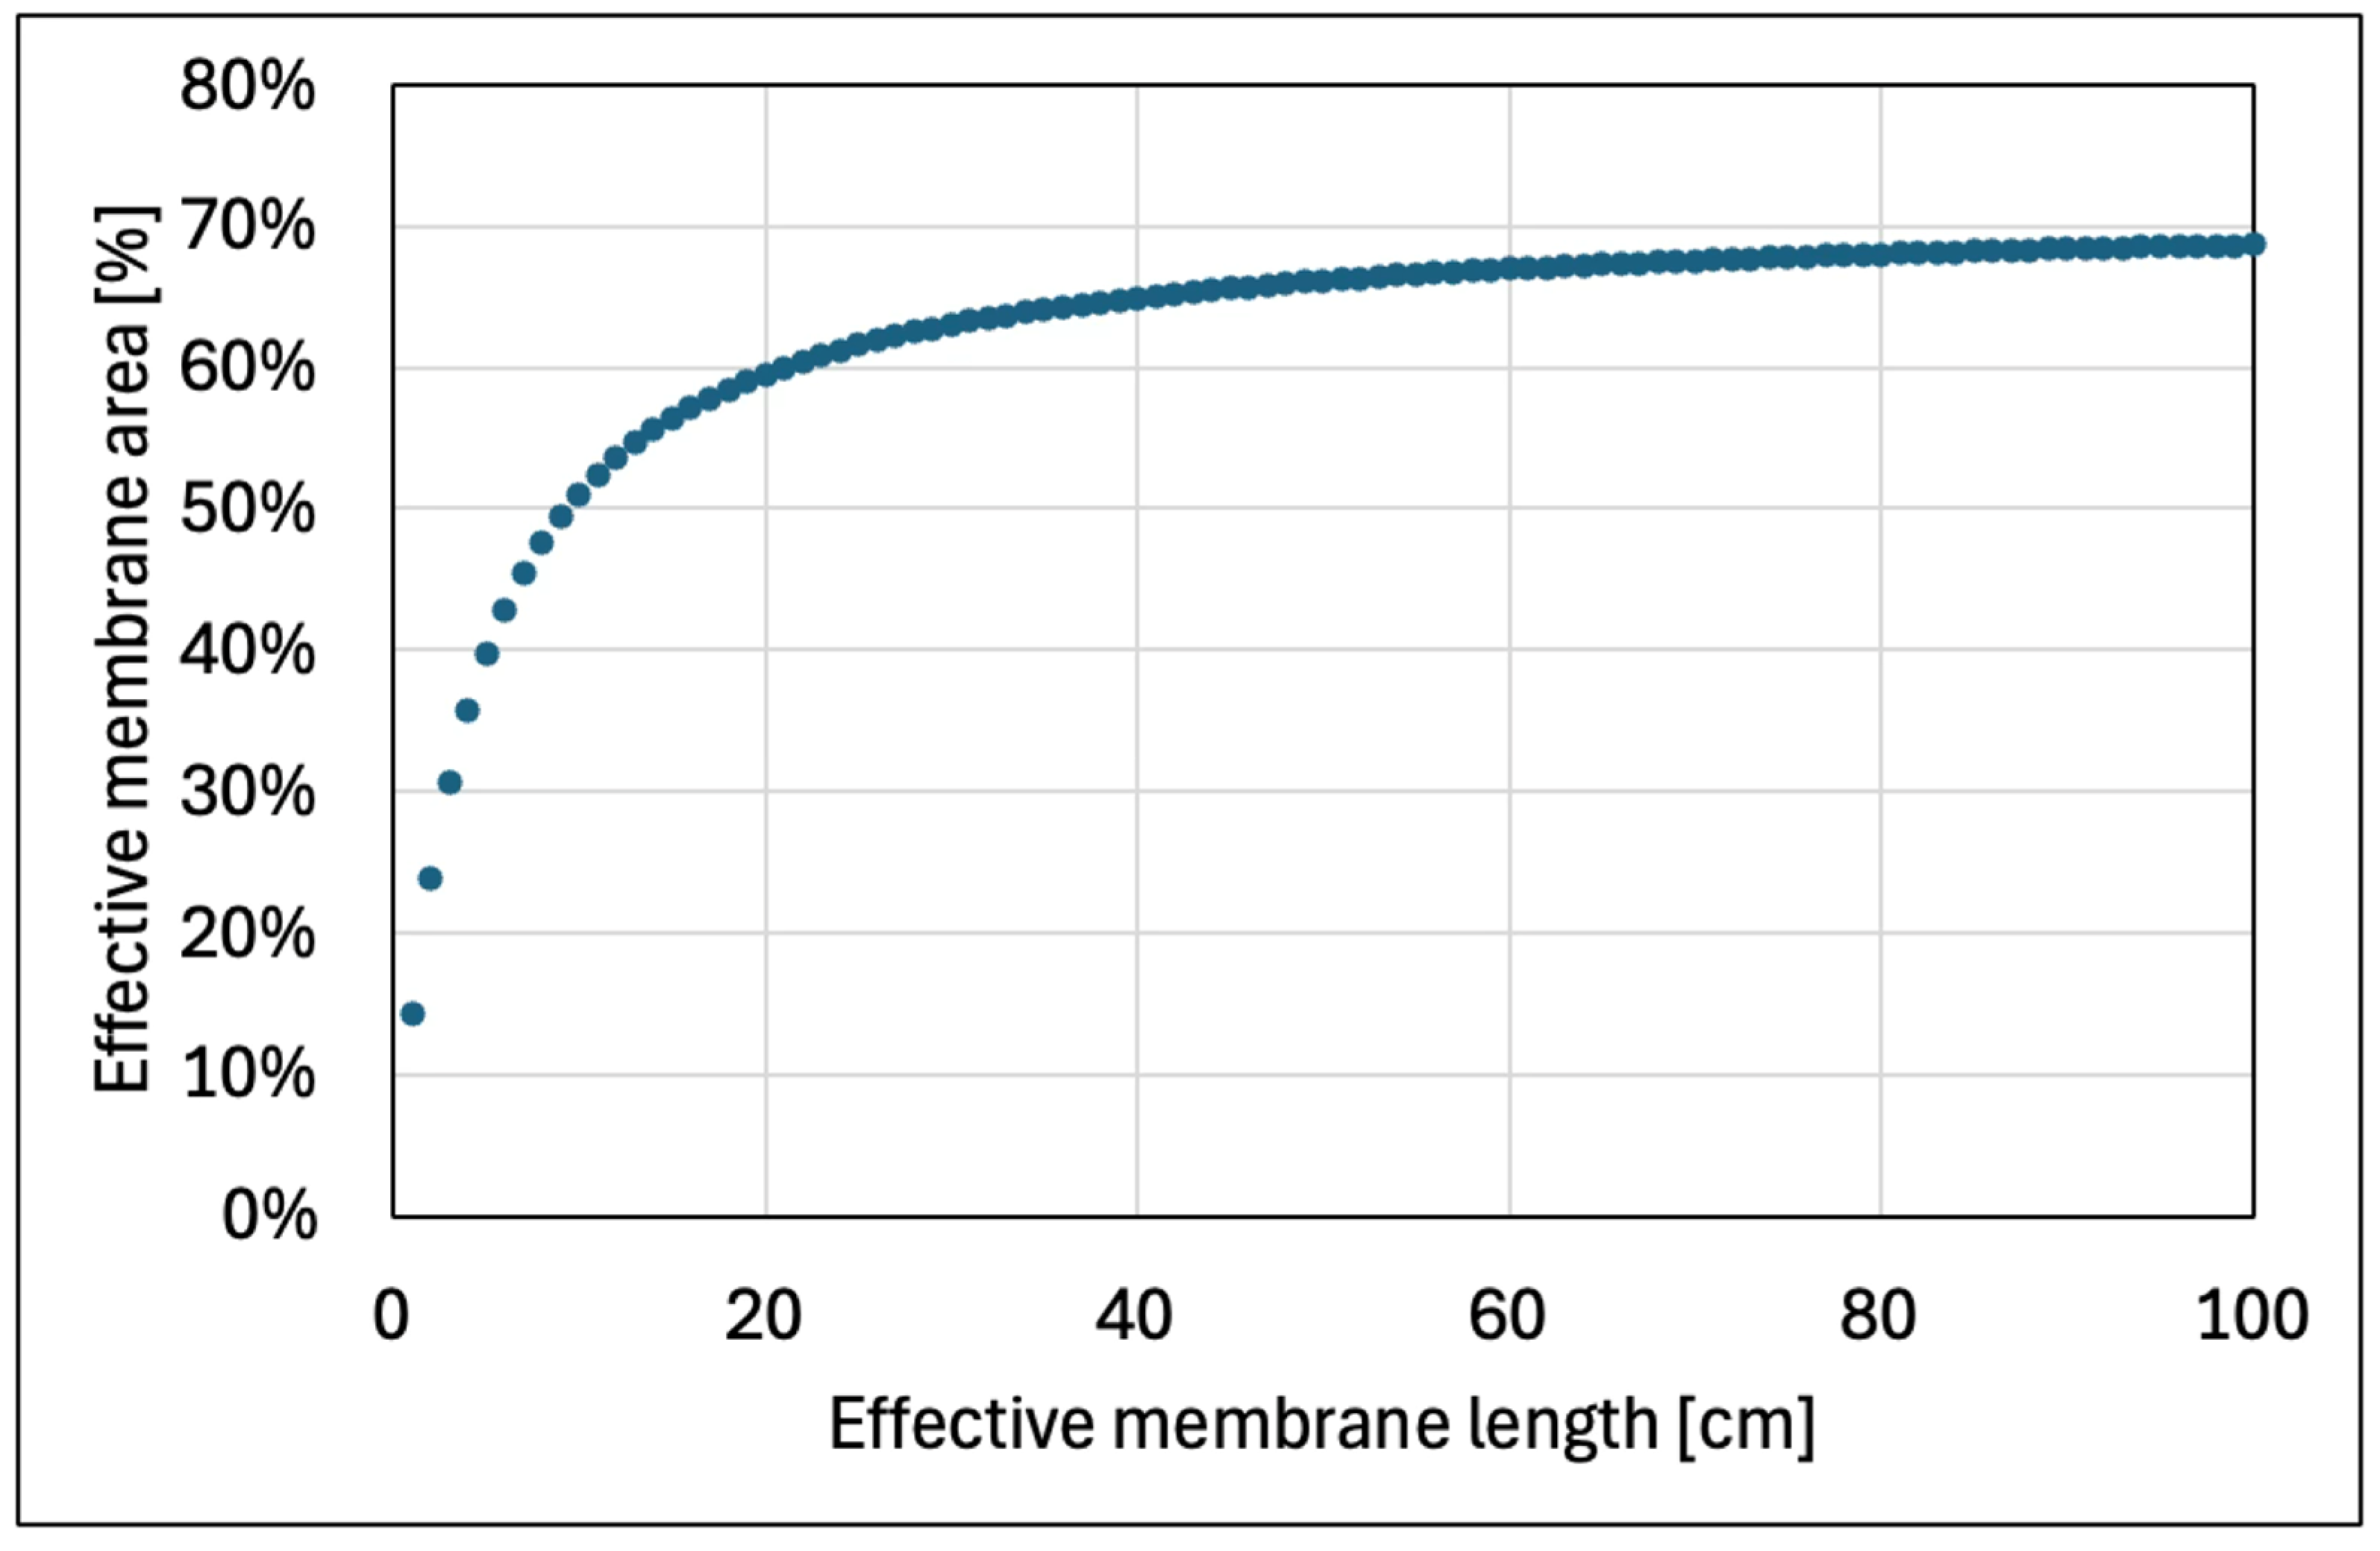
The module length, however, should be reflected in the techno-economic assessment of RED. In the plate-and-frame modules, typically used in RED, a fraction of the membrane area is in contact with the flowing HL/LC solutions (so-called effective membrane area) and the remainder is used as an outer sealing of flow channel and does not take part in the mass transfer (see Figure 2). Figure 3 presents the relationship between the effective membrane length, L, and the effective membrane area, Aeff, calculated as:
where Aflow channel is the area of the flow channel, Amembrane is the total area of the membrane (including sealing), h is the flow channel width (assumed as 10 cm in this example), and s is the sealing width (assumed as 2 cm).
Aeff [%] = Aflow channel/Amembrane = L·h/[(L + 2s)·(h + 2s)],
Figure 2.
Typical arrangement of membranes and spacers in the repeating unit of RED stack.
Figure 3.
Relationship between effective membrane length and effective membrane area, assuming 10 cm wide flow channel and 2 cm of membrane sealing.
The shorter the effective membrane length, the lower is the effective membrane area—this stems from basic geometry of plate-and-frame modules. Typically, when performing the techno-economic evaluation of electromembrane methods, the required membrane length is relatively large, and a constant value of effective membrane area is assumed, and the overall membrane costs are adjusted. We would urge the researchers proposing untypically short modules to reconsider whether the effective membrane area values still apply.
Another design question to be considered is the inlet effect. The research on the effect of inlet effects on the RED performance [10] suggests that flow channels should be as short as possible and not exceed the length of the flow entrance effect zone; for example, in their experiments, for a linear flow velocity of 1 cm/s, the average Sherwood number in an 0.5 cm-long empty channel (Sh = 27.6) was two times higher than the Sherwood number in a cm-long empty channel (Sh = 12.85). The use of short modules, however, faces practical challenge related to scale-up of the stack; the liquid should be uniformly distributed along the width of the flow channel and between the cell pairs. This is easy to achieve in bench-scale modules but gets increasingly difficult as flow channels become wider and the number of cell pairs grow. The lack of such uniformity may lead to the formation of “dead zones” where worse hydrodynamic conditions lower the mass transfer coefficient in the boundary layer, explaining the lowered limiting current density. In the case of RED, the same effect would lead to a decrease in the generated power. One could expect that these effects would be more prominent in short modules, where the effective membrane length is relatively short compared to inlet manifold part of the membrane. He et al. [17] observed the change in the way the feed enters the flow channel can increase the generated power density from ca. 0.47 W/m2 at 6 A/m2 to ca. 0.58 W/m2 at 7 A/m2. Cruz-Díaz et al. [16] have investigated how the inlet manifold affects the fluid in the flow channel and showed that each branch of inlet manifold produces different volumetric flow rate. In the case of electrodialysis, the non-uniform distribution of flow between parallel channels of the diluate compartment can lower the limiting current density [56,57]; the non-uniformity of flow distribution is proportional to the linear flow velocity.
4. Economic and Environmental Considerations
The cost of produced electricity is the crucial parameter affecting the widespread adoption of RED. Blue Energy should not be more expensive than the renewable energy produced by other methods, such as wind or solar power plants. Many studies provide power density obtained in pilot-scale (see Table 3), but the reporting on the levelized cost of electricity is scarce. Ortiz et al. [42] have analyzed the levelized cost of electricity produced by the hypothetical RED plant working in the Tuxpan region in Mexico, finding the best-case scenario to be 0.94 $/kWh (the authors used different methodology than presented here). The main reason for the high costs was the high CAPEX of the RED plant. The results were corroborated by Touati et al. [58], who found that the RED levelized costs of electricity remain prohibitively high (>0.6 $/kWh in 2025, methodology was different than presented in Section 4.1). On the other hand, Wang et al. have found that the electricity cost can be as low as 0.061 $/kWh in 2024 prices using their methodology [6]; however, in our opinion, the researchers have made unrealistic assumptions regarding the membrane costs (4 €/m2). Similarly, Sampedro et al. [47] used their methodology to calculate the levelized costs of energy in RED to be 0.083–0.106 €/kWh when a membrane price of 4 €/m2 was assumed, and 0.177–0.219 €/kWh for a membrane price of 10 €/m2 (costs in 2023 prices).
4.1. Economic Assessment of RED
As previously mentioned, the pretreatment costs are often underestimated when calculating the RED electricity price. To show the effect of pretreatment costs of LCOE, for each of the pilot plants mentioned in Table 3, the volume of the HC/LC required to generate 1 kWh of electric energy was calculated based on net power density found in the literature, module geometry, and flow rates presented in respective sources [25,34,59,60]. Three scenarios of pretreatment costs were assumed—regular pretreatment costing 0.12 $/m3 (microfiltration pretreatment for brackish water reverse osmosis [30]), basic pretreatment costing 0.06 $/m3 (50% less than assumed regular pretreatment), advanced pretreatment costing 0.18 $/m3 (50% more than assumed regular pretreatment). The feed volume required to generate 1 kWh of electric energy, V [m3/kWh], was calculated as:
where NPD is the net power density [kW/m2], A is the area of membranes installed [m2], Q is the volumetric flow rate of the feed (sum of the HC and LC) [m3/h]. The pretreatment cost per kWh was calculated by multiplying V by 0.06, 0.12, 0.18 $/m3, depending on which kind of pretreatment was assumed. All costs were assumed to reflect 2026 prices.
V = Q/(NPD·A),
Table 3.
Net power density in RED pilot plants.
The results presented in Table 4 suggest that even if very low pretreatment costs are assumed (0.06 $/m3 of feed solution), the net power densities obtained in existing RED pilot-scale plants are too low to offset the pretreatment costs. It is worth noting that the research on RED fouling [35] indicates that the very basic pretreatment may not be enough, as the presence of suspended particles in the feed water may lead to a 25% drop in power density and require frequent cleaning. For the RED-generated electricity to be economically competitive, the electricity cost should be equal to or less than the costs of electricity generated by other renewable energy methods. For example, the levelized cost of energy for offshore wind farms can be as low as 0.082–0.136 $/kWh in 2018 prices [61]—including 29% cumulative inflation between 2018 and 2026 [62], that is 0.106–0.175 $/kWh in today’s prices. Meanwhile, even very basic pretreatment for the RED plant costs 0.21–1.11 $/kWh, and the costs can be even higher (1.89–3.33 $/kWh) if the advanced pretreatment is required—all this before the CAPEX of RED plant is even considered.
Table 4.
Estimated pretreatment costs for RED pilot plants.
Our simple economic model assumes that the kind of pretreatment applied does not affect the net power density, as we are relying on the NPD reported in the literature. It is possible that the application of more sophisticated pretreatment, such as nanofiltration, would result in higher net power density because of the decreased risk of fouling; however, we do not believe the gains in NPDF would offset the cost of sophisticated pretreatment. Taking into account the data presented in Table 4, we estimate the NPD would have to be 6.15, 18.2, 9.6, and 33 W/m2 for cases 1–4, respectively, for the pretreatment cost in an advanced system to reach 0.175 $/m3—that is, the advanced pretreatment would have to increase the NPD by an order of magnitude to decrease the costs per kWh down to the offshore wind farm levels. It is worth pointing out that the pretreatment costs could be neglected if RED was to operate on solutions that have been already pretreated or highly purified—such as, for example, SWRO brines or lean brines from chlor-alkali industries for HC. The reliance on such specific use cases, however, would hinder the widespread adoption of RED as power-generation method.
To estimate the CAPEX of a RED plant, it was assumed that it is directly proportional to the area of installed membranes. A CAPEX value of 388 $/m2 was assumed, based on the analysis presented in [40], where out of 600 $/m2 investment cost of high salinity ED plant, approximately 222 $/m2 was the contribution of the membrane itself (in other words, we have assumed that the membrane price alone is 10 $/m2). It is worth noting that the value of 388 $/m2 is based on 2019 prices; we are deliberately not including the cumulative 2019–2026 inflation for the RED economic case. The remaining 378 $/m2 stems from other equipment: power source and electric equipment, electrodes, spacers, pumps, etc., all the costs that are still present regardless of membrane price. We have also assumed that the lifetime of the plant is 30 years of working 24/7 without interruption or cleaning. Based on these assumptions, the estimated capital investment costs in $/kWh were calculated as:
CAPEX = A·388 $/m2/(NPD·A·30 y·365 d/y·24 h/d),
The results presented in Table 4 suggest that CAPEX is prohibitively expensive even if the membrane price is low. Using Equation (13), it can be concluded that in order for CAPEX costs to go below 0.175 $/kWh (high end of levelized cost of electricity for offshore wind farms [61] including the 2018–2026 inflation), either the net power density should reach > 8.4 W/m2 under our assumptions (equipment cost 378 $/m2, 10 $/m2 for membranes, 30 y of plant life) or, alternatively, the cost of electrodialysis equipment should be lower than 97 $/m2, assuming 2.1 W/m2 net power density in a RED plant, 10 $/m2 for membranes, and 30 y of plant life. The theoretical limit of net power density is 3.5 W/m2 in a seawater-river water RED system with low-resistance ion-exchange membranes (0.5 Ω cm2) at very small spacing intervals (50 μm) [7]. Kim et al. [63] have been able to experimentally obtain 2.4 W/m2 in a seawater–river-water RED system operating in the bench-scale when using new low-resistance membranes and spacers. However, the results of our economic analysis suggest that under the assumptions presented in this work, the HC must have salinity higher than seawater for RED to be economically feasible. At 3.5 W/m2, the maximum achievable NPD for seawater–river water, the CAPEX of a RED system would be 0.42 $/kWh, which would not make economically competitive. The economic necessity of using hypersaline HC solutions plays into previously discussed geographical limitations of RED, as highly saline brines are rarer than seawater. The sensitivity analysis of the most promising Case 4 (the REAPower project [60])—see Table 5—shows even lowering the equipment costs by 20% and extending plant life to 36 years would still make estimated capital investment costs over two times higher than 0.175 $/kWh. The CAPEX sensitivity analysis of the remaining Cases 1, 2, 3 shows that none reaches 0.175 $/kWh in the investigated range (−20%/+20% change in independent variables).
Table 5.
Sensitivity of CAPEX (in $/kWh of generated electric energy) on equipment costs (−20%/+20%), membrane costs (−20%/+20%), and estimated plant life (−20%/+20%)—data calculated for Case 4 working at 2.1 W/m2 net power density.
4.2. Environmental Assessment of RED
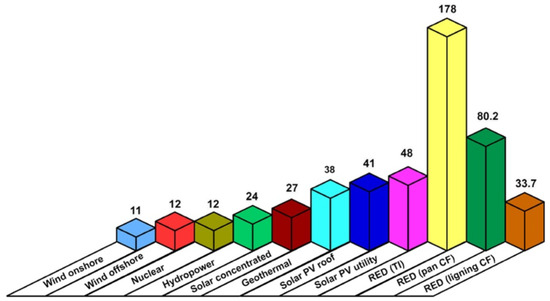
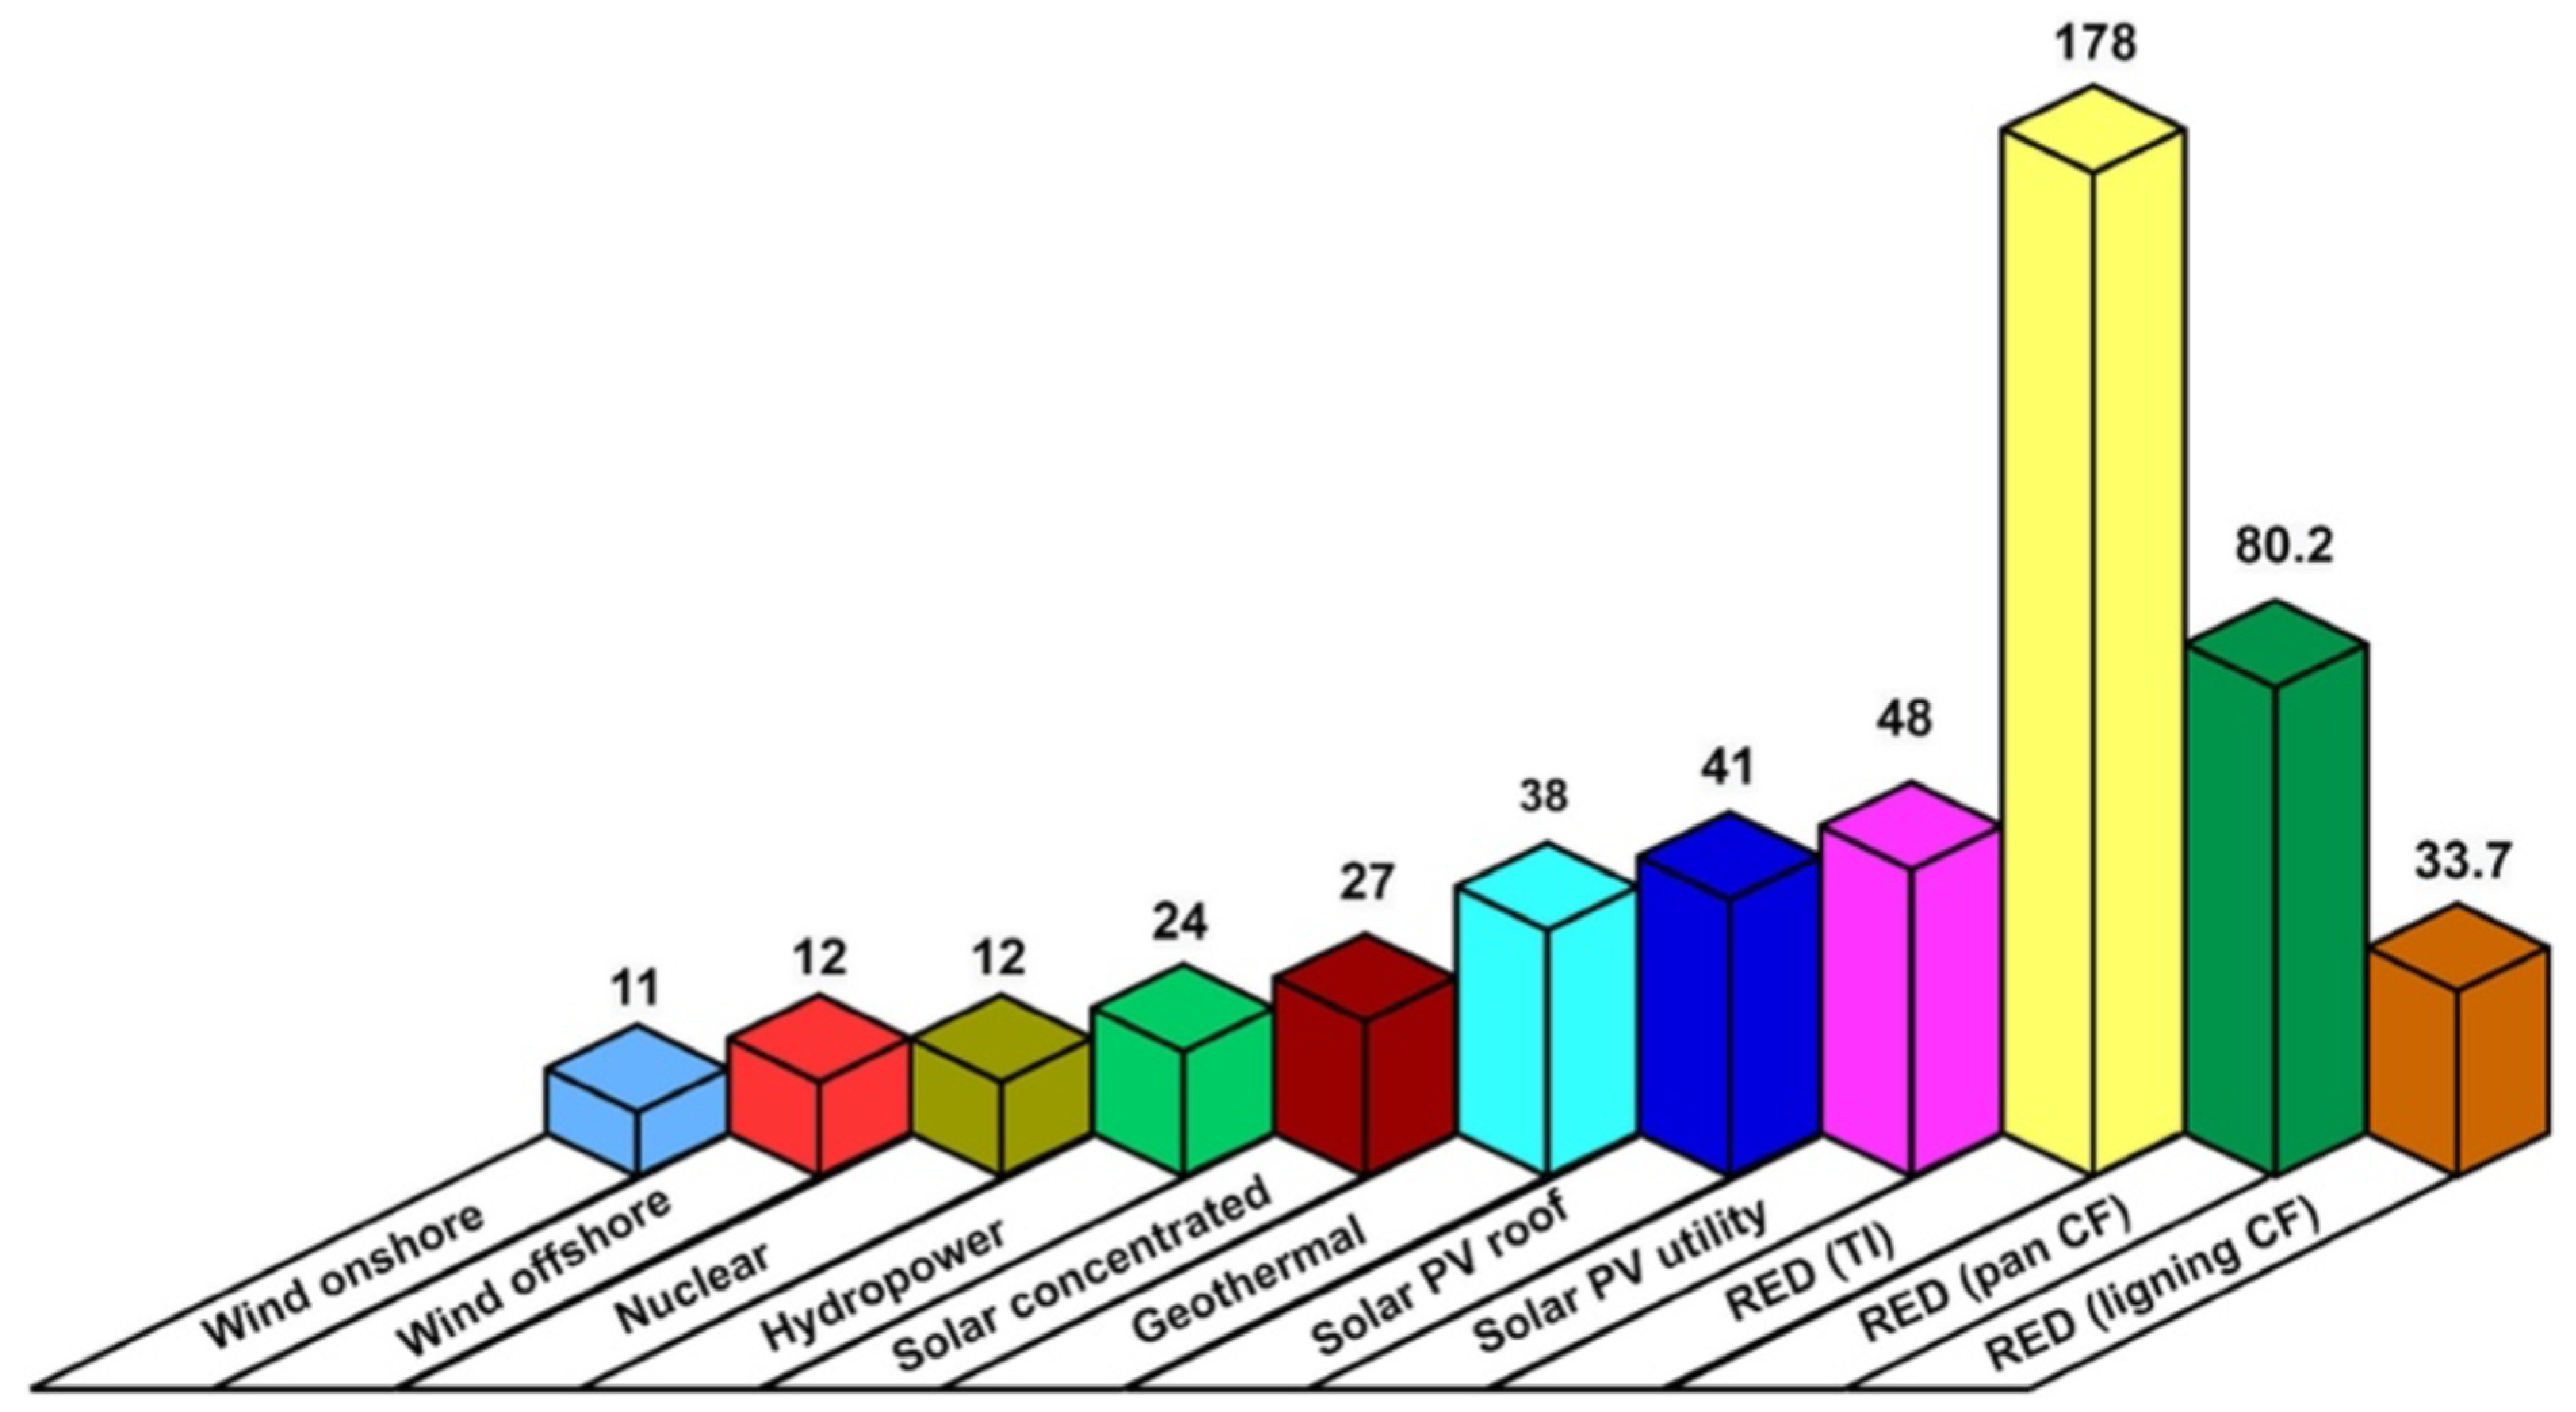
Another way of assessing the feasibility of RED as energy production method is to focus on the GHG emissions. Blue Energy may be expensive, but if the GHG emissions are very low, maybe it is a cost worth paying for slowing down the climate changes? There are very few studies of the environmental effect of electricity generation by RED (see Table 6 for summary of the studies) and the results are conflicting. For example, Mohammadi et al. [64] have performed a LCA of RED, showing that it has much higher impact on global warming potential (see Figure 4), mainly caused by the production of titanium for the RED electrodes. Replacing titanium with other materials, especially lignin carbon fiber, brings down the impact to the level comparable with solar and geothermal energy, but it is still three times higher than wind, nuclear or hydropower energies—all of which offer lower energy cost than RED. Mueller et al. [65], on the other hand, have found that the global warming potential impact is 9.4–14.2 g CO2(eq)/kWh, depending on the HC solution source, which is lower than wind energy. It is worth noting, though, that Mueller et al. include only graphite electrodes, not titanium ones, something that is a major factor in Mohammadi et al.’s analysis. The environmental impacts from waste disposal were also not considered. Tristan et al. [66] have included RED electrode material in life cycle inventory and calculated that the global warming potential is between 18 and 245 g CO2(eq)/kWh (the range was very broad because they included both lab- and pilot-scale units). The results indicate that CO2 emissions associated with RED energy generation are lower than solar energy, but higher than wind energy.
Table 6.
Selected literature data on LCA of RED technology.
Figure 4.
Lifecycle grams CO2 eq emissions per kWh energy Production, reprinted from Advanced Energy and Sustainability Research published by Wiley-VCH GmbH under Creative Commons 4.0 Attribution License. © 2025 Mohammadi et al. [64].
5. Conclusions
In conclusion, RED faces severe limitations that impede its widespread adoption:
- (1)
- geographical limitations on the location of the RED sites, including lack of viable feedwater streams and issues relating to wastewater utilization,
- (2)
- economic limitations related to the pretreatment requirements of RED stacks and the price of electromembrane equipment, even assuming low-cost membranes,
- (3)
- conflicting engineering requirements on the RED membrane modules.
The aim of this research was to answer the question: is Blue Energy generated by RED the Green Energy of the future? We believe the answer is no. While a lot of valuable research has been made in improving the properties of ion-exchange membranes, the pretreatment costs and the capital investment costs are prohibitively expensive even if the ion-exchange membranes are cheap (10 $/m2), because the cost of the necessary equipment (pumps, piping, electric equipment and automation) is not affected by the membrane costs. This makes RED uneconomical compared to the other renewable energy generation methods.
The question remains, however, how to address the challenges faced by RED power generation? One research direction is the synthesis of new, cheaper membranes. New phase-inversion ion-exchange membranes exhibit superior performance [67] and can have estimated costs as low as 4 $/m2 [68]. However, while this approach can substantially improve the physico-chemical properties of membranes, we remain skeptical whether even the lowered membrane cost can make RED economically competitive. Another interesting approach is to rethink the original purpose of RED—power generation—and to find other applications. For example, RED can be hybridized with electrodialysis [69,70] to create a self-sufficient desalination unit designed for remote, water-stressed areas such as small islands [69]. Researchers have also proposed integrated systems in which RED acts as an energy recovery device, simultaneously decreasing the salinity of desalination brines and recovering some of the energy [36]. The possible issue with this approach is that existing, commercially available energy recovery devices used in SWRO plants, utilizing retentate pressure, already have very high efficiency (>95%) and do not require materials as sophisticated as ion-exchange membranes. The efficiency of RED is lower (18.1% [22]). On the other hand, existing SWRO energy-recovery devices do not change the SWRO retentate salinity, unlike RED.
Author Contributions
Conceptualization, M.T.; methodology, M.T.; writing—original draft preparation, K.M.; writing—review and editing, M.T.; visualization, K.M.; supervision, M.T. All authors have read and agreed to the published version of the manuscript.
Funding
This research received no external funding.
Data Availability Statement
Data available upon request.
Conflicts of Interest
The authors declare no conflicts of interest.
Abbreviations
The following abbreviations are used in this manuscript:
| AEM | Anion-exchange membrane |
| CEM | Cation-exchange membrane |
| ED | Electrodialysis |
| GHG | Greenhouse Gas |
| HC | High Concentration |
| LC | Low Concentration |
| NPD | Net power density |
| RED | Reverse Electrodialysis |
| SWRO | Seawater Reverse Osmosis |
References
- Ross, R.; Krijgsman, J. New ionomer membranes for blue energy. In Proceedings of the 2005 International Conference on Future Power Systems, Brussels, Belgium, 16–18 November 2025. [Google Scholar] [CrossRef] [Scilit]
- Lin, S.; Wang, Z.; Wang, L.; Elimelech, M. Salinity gradient energy is not a competitive source of renewable energy. Joule 2024, 8, 334–343. [Google Scholar] [CrossRef] [Scilit]
- Zoungrana, A.; Çakmakci, M. From non-renewable energy to renewable by harvesting salinity gradient power by reverse electrodialysis: A review. Int. J. Energy Res. 2021, 45, 3495–3522. [Google Scholar] [CrossRef] [Scilit]
- Yip, N.Y.; Brogioli, D.; Hamelers, H.V.M.; Nijmeijer, K. Salinity Gradients for Sustainable Energy: Primer, Progress, and Prospects. Environ. Sci. Technol. 2016, 50, 12072–12094. [Google Scholar] [CrossRef] [Scilit] [PubMed]
- Veerman, J.; Post, J.W.; Saakes, M.; Metz, S.J.; Harmsen, G.J. Reducing power losses caused by ionic shortcut currents in reverse electrodialysis stacks by a validated model. J. Membr. Sci. 2008, 310, 418–430. [Google Scholar] [CrossRef] [Scilit]
- Wang, L.; Zhao, Y.; Long, R.; Liu, Z.; Liu, W. Techno-economics of multi-stage reverse electrodialysis for blue energy harvesting. Carbon. Neutrality 2024, 3, 2. [Google Scholar] [CrossRef] [Scilit]
- Yip, N.Y.; Vermaas, D.A.; Nijmeijer, K.; Elimelech, M. Thermodynamic, energy efficiency, and power density analysis of reverse electrodialysis power generation with natural salinity gradients. Environ. Sci. Technol. 2014, 48, 4925–4936. [Google Scholar] [CrossRef] [Scilit]
- Bromley, L.A. Thermodynamic properties of strong electrolytes in aqueous solutions. AIChE J. 1973, 19, 313–320. [Google Scholar] [CrossRef] [Scilit]
- Mitko, K.; Turek, M. Concentration distribution along the electrodialyzer. Desalination 2014, 341, 94–100. [Google Scholar] [CrossRef] [Scilit]
- Pawlowski, S.; Sistat, P.; Crespo, J.G.; Velizarov, S. Mass transfer in reverse electrodialysis: Flow entrance effects and diffusion boundary layer thickness. J. Membr. Sci. 2014, 471, 72–83. [Google Scholar] [CrossRef] [Scilit]
- Gurreri, L.; Tamburini, A.; Cipollina, A.; Micale, G.; Ciofalo, M. Flow and mass transfer in spacer-filled channels for reverse electrodialysis: A CFD parametrical study. J. Membr. Sci. 2016, 497, 300–317. [Google Scholar] [CrossRef] [Scilit]
- Jin, D.; Cui, Y.; Jin, Y. Effect of spacer geometry on reverse electrodialysis stack performance. Desalination 2025, 602, 118652. [Google Scholar] [CrossRef] [Scilit]
- Turek, M. Optimization of electrodialytic desalination in diluted solutions. Desalination 2002, 153, 383–387. [Google Scholar] [CrossRef] [Scilit]
- Giacalone, F.; Papapetrou, M.; Kosmadakis, G.; Tamburini, A.; Micale, G.; Cipollina, A. Application of re-verse electrodialysis to site-specific types of saline solutions: A techno-economic assessment. Energy 2019, 181, 532–547. [Google Scholar] [CrossRef] [Scilit]
- Turek, M.; Gierzkiewicz, D.; Laskowska, E.; Słowik, M.; Mitko, K.; Dydo, P.; Sąkol-Sikora, D.; Stawiarz, T.; Krzyżak, W. The required membrane length in electrodialytic desalination of river water. Desalination Water Treat. 2018, 128, 272–277. [Google Scholar] [CrossRef] [Scilit]
- Cruz-Díaz, M.R.; Laureano, A.; Rodríguez, F.A.; Arenas, L.F.; Pijpers, J.J.H.; Rivero, E.P. Modelling of flow distribution within spacer-filled channels fed by dividing manifolds as found in stacks for membrane-based technologies. Chem. Eng. J. 2021, 423, 130232. [Google Scholar] [CrossRef] [Scilit]
- He, Z.; Gao, X.; Zhang, Y.; Wang, Y.; Wang, J. Revised spacer design to improve hydrodynamics and anti-fouling behavior in reverse electrodialysis processes. Desalination Water Treat. 2016, 57, 28176–28186. [Google Scholar] [CrossRef] [Scilit]
- Chung, C.; Lee, J.; Yang, J.-S. The portfolio effect in the power sector of economies prioritizing renewable energy. Energy Policy 2026, 208, 114934. [Google Scholar] [CrossRef] [Scilit]
- Abdullah Shah, S.; Cucchiara, R.; Vicari, F.; Cipollina, A.; Tamburini, A.; Micale, G. Energetic Valorisation of Saltworks Bitterns via Reverse Electrodialysis: A Laboratory Experimental Campaign. Membranes 2023, 13, 293. [Google Scholar] [CrossRef] [Scilit]
- Daniilidis, A.; Vermaas, D.A.; Herber, R.; Nijmeijer, K. Experimentally obtainable energy from mixing river water, seawater or brines with reverse electrodialysis. Renew. Energy 2014, 64, 123–131. [Google Scholar] [CrossRef] [Scilit]
- Sampedro, T.; Gómez-Coma, L.; Ortiz, I.; Ibañez, R. Unlocking energy potential: Decarbonizing water reclamation plants with salinity gradient energy recovery. Sci. Total Environ. 2024, 906, 167154. [Google Scholar] [CrossRef] [Scilit]
- Essalhi, M.; Halil Avci, A.; Lipnizki, F.; Tavajohi, N. The potential of salinity gradient energy based on natural and anthropogenic resources in Sweden. Renew. Energy 2023, 215, 118984. [Google Scholar] [CrossRef] [Scilit]
- US Department of the Interior Bureau of Reclamation. Reverse Osmosis Treatment of Central Arizona Project Water for the City of Tucson; Desalination Research and Development Program, Report No 36; US Department of the Interior Bureau of Reclamation: Washington, DC, USA, 2004.
- Binger, Z.M.; Li, M.; Dudchenko, A.V. De-risking high-recovery brackish water desalination via flow reversal and feed flushing using techno-economic assessment. Desalination 2025, 616, 119330. [Google Scholar] [CrossRef] [Scilit]
- Mehdizadeh, S.; Yasukawa, M.; Abo, T.; Kuno, M.; Noguchi, Y.; Higa, M. The Effect of Feed Solution Temperature on the Power Output Performance of a Pilot-Scale Reverse Electrodialysis (RED) System with Different Intermediate Distance. Membranes 2019, 9, 73. [Google Scholar] [CrossRef] [Scilit] [PubMed]
- Daniilidis, A.; Herber, R.; Vermaas, D.A. Upscale potential and financial feasibility of a reverse electrodialysis power plant. Appl. Energy 2014, 119, 257–265. [Google Scholar] [CrossRef] [Scilit]
- Guo, Z.-Y.; Ji, Z.-Y.; Zhang, Y.-G.; Yang, F.-J.; Liu, J.; Zhao, Y.-Y.; Yuan, J.-S. Effect of ions (K+, Mg2+, Ca2+ and SO42−) and temperature on energy generation performance of reverse electrodialysis stack. Electrochim. Acta 2018, 290, 282–290. [Google Scholar] [CrossRef] [Scilit]
- Vermaas, D.A.; Veerman, J.; Saakes, M.; Nijmeijer, K. Influence of multivalent ions on renewable energy generation in reverse electrodialysis. Energy Environ. Sci. 2014, 7, 1434–1445. [Google Scholar] [CrossRef] [Scilit]
- Greenlee, L.F.; Lawler, D.F.; Freeman, B.D.; Marrot, B.; Moulin, P. Reverse osmosis desalination: Water sources, technology, and today’s challenges. Water Res. 2009, 43, 2317–2348. [Google Scholar] [CrossRef] [Scilit]
- Karimanzira, D.; Went, J.; Neumann, F. Cleaning Strategies and Cost Modelling of Experimental Membrane-based Desalination Plants. Int. J. Econ. Financ. Manag. 2021, 9, 6–22. [Google Scholar] [CrossRef] [Scilit]
- Ju, J.; Choi, Y.; Lee, S.; Park, C.-G.; Hwang, T.; Jung, N. Comparison of Pretreatment Methods for Salinity Gradient Power Generation Using Reverse Electrodialysis (RED) Systems. Membranes 2022, 12, 372. [Google Scholar] [CrossRef] [Scilit]
- Mehdizadeh, S.; Yasukawa, M.; Suzuki, T.; Higa, M. Reverse electrodialysis for power generation using seawater/municipal wastewater: Effect of coagulation pretreatment. Desalination 2020, 481, 114356. [Google Scholar] [CrossRef] [Scilit]
- Jwa, E.; Yun, Y.-M.; Kim, H.; Jeong, N.; Hwang, K.S.; Yang, S.; Nam, J.-Y. Energy-efficient seawater softening and power generation using a microbial electrolysis cell-reverse electrodialysis hybrid system. Chem. Eng. J. 2020, 391, 123480. [Google Scholar] [CrossRef] [Scilit]
- Mehdizadeh, S.; Kakihana, Y.; Abo, T.; Yuan, Q.; Higa, M. Power Generation Performance of a Pilot-Scale Reverse Electrodialysis Using Monovalent Selective Ion-Exchange Membranes. Membranes 2021, 11, 27. [Google Scholar] [CrossRef] [Scilit]
- Vital, B.; Torres, E.V.; Sleutels, T.; Gagliano, M.C.; Saakes, M.; Hamelers, H.V.M. Fouling fractionation in reverse electrodialysis with natural feed waters demonstrates dual media rapid filtration as an effective pre-treatment for fresh water. Desalination 2021, 518, 115277. [Google Scholar] [CrossRef] [Scilit]
- Tufa, R.; Curcio, E.; Brauns, E.; van Baak, W.; Fontananova, E.; Di Profio, G. Membrane Distillation and Reverse Electrodialysis for Near-Zero Liquid Discharge and low energy seawater desalination. J. Membr. Sci. 2015, 496, 325–333. [Google Scholar] [CrossRef] [Scilit]
- Güler, E.; Elizen, R.; Vermaas, D.A.; Saakes, M.; Nijmeijer, K. Performance-determining membrane properties in reverse electrodialysis. J. Membr. Sci. 2013, 446, 266–276. [Google Scholar] [CrossRef] [Scilit]
- Sugimoto, Y.; Ujike, R.; Higa, M.; Kakihana, Y.; Higa, M. Power Generation Performance of Reverse Electrodialysis (RED) Using Various Ion Exchange Membranes and Power Output Prediction for a Large RED Stack. Membranes 2022, 12, 1141. [Google Scholar] [CrossRef] [Scilit] [PubMed]
- Tufa, R.A.; Pawlowski, S.; Veerman, J.; Bouzek, K.; Fontananova, E.; di Profio, G.; Velizarov, S.; Goulao Crespo, J.; Nijmeijer, K.; Curcio, E. Progress and prospects in reverse electrodialysis for salinity gradient energy conversion and storage. Appl. Energy 2018, 225, 290–331. [Google Scholar] [CrossRef] [Scilit]
- Nayar, K.G.; Fernandes, J.; McGovern, R.K.; Dominguez, K.P.; McCance, A.; Al-Anzi, B.S.; Lienhard, J.H. Cost and energy requirements of hybrid RO and ED brine concentration systems for salt production. Desalination 2019, 456, 97–120. [Google Scholar] [CrossRef] [Scilit]
- Weiner, A.M.; McGovern, R.K.; Lienhard, J.H. A new reverse electrodialysis design strategy which significantly reduces the levelized cost of electricity. J. Membr. Sci. 2015, 493, 605–614. [Google Scholar] [CrossRef] [Scilit]
- Ortiz, M.; Rivera, G.; Mendoza, E. A Levelized Cost of Energy (LCOE) Analysis of a Reverse Electrodialysis (RED) Plant in Tuxpan, Mexico. Energies 2025, 18, 5540. [Google Scholar] [CrossRef] [Scilit]
- Available online: https://ionexchangemembranes.com/price-list/ (accessed on 9 January 2026).
- IndustryARC. Ion Exchange Membrane Market—Forecast (2026–2032). Available online: https://www.industryarc.com/Research/Ion-Exchange-Membrane-Market-Research-501511 (accessed on 9 January 2026).
- Available online: https://www.alibaba.com/product-detail/Cation-Exchange-Membrane_60195764538.html (accessed on 9 January 2026).
- Available online: https://www.alibaba.com/product-detail/Anion-Exchange-Membrane_60205080824.html (accessed on 9 January 2026).
- Sampedro, T.; Tristán, C.; Gómez-Coma, L.; Fallanza, M.; Ortiz, I.; Ibañez, R. Design of a Reverse Electro-dialysis Plant for Salinity Gradient Energy Extraction in a Coastal Wastewater Treatment Plant. Membranes 2023, 13, 546. [Google Scholar] [CrossRef] [Scilit]
- Campisi, G.; Cosenza, A.; Giacalone, F.; Randazzo, S.; Tamburini, A.; Micale, G. Desalination of oilfield produced waters via reverse electrodialysis: A techno-economical assessment. Desalination 2023, 548, 116289. [Google Scholar] [CrossRef] [Scilit]
- Post, J.W.; Goeting, C.H.; Valk, J.; Goinga, S.; Veerman, J.; Hamelers, H.V.M.; Hack, P.J.F.M. Towards implementation of reverse electrodialysis for power generation from salinity gradients. Desalination Water Treat 2010, 16, 182–193. [Google Scholar] [CrossRef] [Scilit]
- US Department of Energy. Low-Cost Manufacturing of High-Performance Ion Exchange Membranes for Electrodialysis Using Initiated Chemical Vapor Deposition. Available online: https://www.sbir.gov/awards/196898 (accessed on 4 January 2026).
- Deboli, F.; Van der Bruggen, B.; Donten, M.L. A versatile chemistry platform for the fabrication of cost-effective hierarchical cation and anion exchange membranes. Desalination 2022, 535, 115794. [Google Scholar] [CrossRef] [Scilit]
- Gurreri, L.; Tamburini, A.; Cipollina, A.; Micale, G.; Ciofalo, M. CFD simulation of mass transfer phenomena in spacer filled channels for reverse electrodialysis applications. Chem. Eng. Trans. 2013, 32, 1879–1884. [Google Scholar]
- Vermaas, D.A.; Saakes, M.; Nijmeijer, K. Doubled power density from salinity gradients at reduced intermembrane distance. Environ. Sci. Technol. 2011, 45, 7089–7095. [Google Scholar] [CrossRef] [Scilit] [PubMed]
- Wu, X.; Sun, D.; Lv, J.; Lv, Y.; Xu, S.; Zhu, X. The spacer characteristic effect on hydrogen and electricity co-generation of a reverse electrodialysis stack driven by the salinity gradient of aqueous potassium acetate solutions. Energy 2025, 331, 137041. [Google Scholar] [CrossRef] [Scilit]
- Vermaas, D.A.; Guler, E.; Saakes, M.; Nijmeijer, K. Theoretical power density from salinity gradients using reverse electrodialysis. Energy Procedia 2012, 20, 170–184. [Google Scholar] [CrossRef] [Scilit]
- Ledingham, J.; Sedransk Campbell, K.L.; In ’t Veen, B.; Keyzer, L.; Campbell, A.N. Barriers to electrodialysis implementation: Maldistribution and its impact on resistance and limiting current density. Desalination 2022, 531, 115691. [Google Scholar] [CrossRef] [Scilit]
- Ledingham, J.; Howse, J.R.; Campbell, A.N.; Veen, B.I.; Keyzer, L.; Sedransk Campbell, K.L. Experimental validation of the presence of flow maldistribution in electrodialysis stacks and its effect on the limiting current density. J. Membr. Sci. 2025, 716, 123494. [Google Scholar] [CrossRef] [Scilit]
- Touati, K.; Nouri, G.; Mulligan, C.N. Assessing process feasibility of salinity gradient systems through maxi-mum extractable and net energy outputs. J. Environ. Chem. Eng. 2025, 13, 118490. [Google Scholar] [CrossRef] [Scilit]
- Nam, J.-Y.; Hwang, K.-S.; Kim, H.-C.; Jeong, H.; Kim, H.; Jwa, E.; Yang, S.; Choi, J.; Kim, C.-S.; Han, J.-H.; et al. Assessing the behavior of the feed-water constituents of a pilot-scale 1000-cell-pair reverse electrodialysis with seawater and municipal wastewater effluent. Water Res. 2019, 148, 261–271. [Google Scholar] [CrossRef] [Scilit] [PubMed]
- Tedesco, M.; Cipollina, A.; Tamburini, A.; Micale, G. Towards 1 kW power production in a reverse electrodialysis pilot plant with saline waters and concentrated brines. J. Membr. Sci. 2017, 522, 226–236. [Google Scholar] [CrossRef] [Scilit]
- Cali, U.; Erdogan, N.; Kucuksari, S.; Argin, M. Techno-economic analysis of high potential offshore wind farm locations in Turkey. Energy Strategy Rev. 2018, 22, 325–336. [Google Scholar] [CrossRef] [Scilit]
- Available online: https://www.in2013dollars.com/us/inflation/2018?amount=1 (accessed on 2 February 2026).
- Kim, H.-K.; Lee, M.-S.; Lee, S.-Y.; Choi, Y.-W.; Jeong, N.-J.; Kim, C.-S. High power density of reverse electrodialysis with pore-filling ion exchange membranes and a high-open-area spacer. J. Mater. Chem. A 2015, 3, 16302–16306. [Google Scholar] [CrossRef] [Scilit]
- Mohammadi, Y.; Mannan, M.; Fazeli, S.; Ul Afsar, N.; Upadhyayula, V.K.K.; Tavajohi, N. Exploring Salinity Gradient Power in Sweden: Key Factors, Machine Learning Predictive Modeling, and Life Cycle Assessment. Adv. Energy Sustain. Res. 2025, 6, 2500124. [Google Scholar] [CrossRef] [Scilit]
- Mueller, K.E.; Thomas, J.T.; Johnson, J.X.; DeCarolis, J.F.; Call, D.F. Life cycle assessment of salinity gradient energy recovery using reverse electrodialysis. J. Ind. Ecol. 2021, 25, 1194–1206. [Google Scholar] [CrossRef] [Scilit]
- Tristán, C.; Rumayor, M.; Dominguez-Ramos, A.; Fallanza, M.; Ibáñez, R.; Ortiz, I. Life cycle assessment of salinity gradient energy recovery by reverse electrodialysis in a seawater reverse osmosis desalination plant. Sustain. Energy Fuels 2020, 4, 4273–4284. [Google Scholar] [CrossRef] [Scilit]
- Chen, L.; Deemer, E.M.; Li, X.; Walker, W.S. Sulfonated Polyethersulfone Membranes for Brackish Water Desalination: Fabrication, Characterization, and Electrodialysis Performance Evaluation. Appl. Sci. 2024, 15, 216. [Google Scholar] [CrossRef] [Scilit]
- Aquino, M.; Santoro, S.; Avci, A.H.; Tufa, R.A.; Bouzek, K.; Straface, S.; La Russa, M.F.; Davoli, M.; Politano, A.; Politano, G.G.; et al. Asymmetric sulfonated polysulfone cation exchange membranes prepared by non-solvent induced phase separation for reverse electrodialysis using desalination brines. Electrochim. Acta 2025, 541, 147292. [Google Scholar] [CrossRef] [Scilit]
- Chen, Q.; Liu, Y.-Y.; Xue, C.; Yang, Y.-L.; Zhang, W.-M. Energy self-sufficient desalination stack as a potential fresh water supply on small islands. Desalination 2015, 359, 52–58. [Google Scholar] [CrossRef] [Scilit]
- Setodeh, M.; Osfouri, S.; Abbasi, M.; Azin, R. Experimental analysis of hybrid electrodialysis (ED)-reverse electrodialysis (RED) process for the desalination of brackish waters and generation of renewable energy in a pilot scale. Desalination Water Treat. 2021, 231, 101–112. [Google Scholar] [CrossRef] [Scilit]

Disclaimer/Publisher’s Note: The statements, opinions and data contained in all publications are solely those of the individual author(s) and contributor(s) and not of MDPI and/or the editor(s). MDPI and/or the editor(s) disclaim responsibility for any injury to people or property resulting from any ideas, methods, instructions or products referred to in the content. |
© 2026 by the authors. Licensee MDPI, Basel, Switzerland. This article is an open access article distributed under the terms and conditions of the Creative Commons Attribution (CC BY) license.