


Abstract
Voltage security assessment is increasingly challenged by stochastic demand growth and localized stress patterns that are not well represented by deterministic, single-snapshot analyses. This paper proposes a fully steady-state probabilistic stress-testing framework based on Monte Carlo simulation and Newton–Raphson AC power flow, jointly evaluating the minimum bus voltage magnitude (voltage-floor adequacy) and the scenario maximum Fast Voltage Stability Index (worst-case line stress). Stress is injected selectively on screened weak buses by sampling a random stress footprint and intensity across three progressive levels (L1–L3), while preserving the local power factor. The approach is demonstrated on IEEE 14-, 30-, and 118-bus benchmark systems using realizations per level, with 100% convergence across all cases. Across all systems, results show a consistent, monotone degradation of the voltage floor and a systematic increase in violation risk as stress intensifies. For the IEEE 14 system, the voltage-risk profile escalates rapidly, with rising from 0.16 (L1) to 0.54 (L3), while the worst-case FVSI tail strengthens markedly (p95 increasing from 0.1455 to 0.2081), indicating a growing likelihood of severe voltage-stress events. In contrast, the IEEE 30 and IEEE 118 systems exhibit milder shifts in central voltage levels but maintain substantial exposure relative to the 0.95 pu planning threshold, with reaching 0.79 and 0.74 at L3, respectively. Beyond risk magnitudes, the framework reveals a nontrivial structural phenomenon in worst-case line stress: as system size increases, stochastic stress outcomes become increasingly concentrated into a small number of dominant transmission corridors. Recurrence analysis at the highest stress level shows fragmented criticality in IEEE 14 (Top-3 lines sharing criticality), near-total dominance by a single corridor in IEEE 30 (>92% of cases), and complete dominance collapse in IEEE 118 (one corridor governing 100% of events). These results demonstrate that probabilistic stress-testing can simultaneously quantify voltage-risk escalation and expose hidden structural bottlenecks that remain invisible under deterministic screening, providing a scalable diagnostic tool for planning-stage monitoring and reinforcement prioritization.
1. Introduction
Voltage security continues to be a fundamental operational concern in modern transmission systems, where increasing demand variability, geographically clustered load growth, and tighter operating margins can push networks closer to voltage-limit conditions. While deterministic studies provide valuable pointwise insights, real-world operation is inherently uncertain: load levels fluctuate continuously, stress is rarely uniform across the grid, and vulnerability can manifest through a distribution of operating points rather than a single “worst” snapshot. For planning and operational screening, this motivates assessment approaches that quantify how voltage security degrades probabilistically under plausible stochastic demand stress, not only whether a single operating point is secure.
Classical voltage stability assessment is often performed using steady-state AC power flow complemented by stability indices, with the Fast Voltage Stability Index (FVSI) among the most widely used line-based indicators. FVSI provides a compact proxy for proximity to voltage instability mechanisms associated with reactive power stress along transmission corridors, whereas bus-voltage criteria quantify the immediate adequacy of the voltage profile. However, these two perspectives are frequently treated separately: (i) voltage-floor analysis focuses on minimum bus voltage magnitudes and violation rates relative to planning thresholds, while (ii) line-based stability screening focuses on identifying critical corridors by the maximum index value under a given operating point. In uncertain environments, a unified treatment is needed to characterize both the probabilistic erosion of the voltage floor and the probabilistic behavior of worst-case line stress.
In particular, FVSI is a severity proxy that increases as reactive loading at the receiving end of a corridor grows relative to the voltage support at the sending end. In stochastic studies, different realizations may activate different stressed corridors; therefore, this paper summarizes line-wise behavior through the scenario maximum , which consistently captures the worst stressed transmission corridor in each realization and enables recurrence-based dominance analysis across Monte Carlo trials.
A key practical difficulty is that stochastic demand stress is not purely system-wide or homogeneous. In many systems, voltage weakness is driven by localized or correlated load growth concentrated at buses that are structurally weak (e.g., electrically remote buses, heavily loaded areas, or buses exhibiting low base-case voltage). Therefore, probabilistic voltage-security assessment should reflect two realities: (i) stress tends to concentrate on a subset of vulnerable buses, and (ii) the number of simultaneously stressed buses and the intensity of stress vary from realization to realization. This demands a modeling design that is both interpretable and reproducible, while remaining computationally tractable for multiple benchmark networks.
Definition (voltage stress). In this paper, voltage stress denotes the steady-state degradation of voltage security induced by demand growth, particularly when active and reactive loading increases are concentrated at electrically weak buses. Under stochastic operating conditions, voltage stress is evaluated through (i) the erosion of the voltage floor via the minimum bus voltage magnitude and (ii) the amplification of corridor-level reactive stress via line-based severity indicators such as , summarized at the scenario level through .
To address these needs, this paper proposes a fully steady-state probabilistic stress-testing framework for voltage-security assessment under stochastic loading. The approach uses Monte Carlo sampling to generate thousands of perturbed demand realizations per stress level, solves a Newton–Raphson (NR) AC power flow for each realization, and evaluates two complementary indicators: the minimum bus voltage magnitude as a voltage-floor metric, and the scenario maximum FVSI as a worst-case line stress metric. Stress is injected selectively on a screened set of weak buses, and each realization samples both (i) a random stress footprint (how many weak buses are simultaneously perturbed) and (ii) a random stress intensity factor, preserving the local power factor by scaling and consistently. By repeating this process at progressively intensified stress levels (L1–L3), the framework enables controlled cross-level comparisons while maintaining a consistent stochastic structure across systems.
The proposed methodology is applied to IEEE 14-, 30-, and 118-bus benchmark systems to examine how voltage-security degradation scales with network size and redundancy. Results are reported using empirical probability density functions (PDFs), cross-level empirical CDF (ECDF) overlays, percentile summaries, and operational risk metrics such as for a planning-relevant threshold . In addition, the recurrence of the line achieving is tracked to reveal whether worst-case voltage-stress outcomes are structurally dispersed across multiple corridors or concentrated into a small set of dominant bottlenecks as stress increases.
The main contributions of this paper are summarized as follows:
- A reproducible Monte Carlo stress-testing framework for probabilistic voltage-security assessment under stochastic loading, implemented with NR AC power flow and consistent multi-level stress design (L1–L3).
- A unified dual-metric evaluation strategy combining a voltage-floor indicator () with a worst-case line stress indicator (), enabling simultaneous characterization of voltage-profile risk and proximity-to-instability behavior.
- A weak-bus targeted stochastic perturbation model that emulates realistic, localized stress patterns via random footprint and intensity sampling, while preserving the local power factor in perturbed buses.
- A distributional reporting and risk-interpretation pipeline based on PDFs, ECDF overlays, percentile extraction, and voltage-violation probabilities, supporting rigorous cross-level and cross-system comparisons.
- A recurrence-based diagnostic of critical-corridor dominance using the line attaining , revealing whether worst-case stress is structurally dispersed or concentrated across systems and stress levels.
The remainder of the paper is organized as follows. Section 2 reviews related work and background (to be completed). Section 3 details the proposed probabilistic stress-testing framework, including stress modeling, power-flow handling, and statistical post-processing. Section 4 presents the results for IEEE 14-, 30-, and 118-bus systems and provides a cross-system comparative analysis. Finally, the last section concludes the paper and outlines directions for further research.
2. Related Work and Background
Voltage stability assessment has been widely investigated through (i) analytical voltage stability indices (VSIs) for screening weak buses and critical corridors, (ii) index-guided optimization and control frameworks for stability enhancement, and (iii) probabilistic and risk-aware methodologies that incorporate uncertainty from load demand and renewable generation. This section summarizes the most relevant contributions aligned with the scope of this paper and clarifies the gap addressed by the proposed probabilistic, distributional stress-testing framework.
2.1. Index-Based Voltage Stability Assessment and Index-Guided Enhancement Frameworks
A substantial stream of research focuses on developing and comparing voltage stability indices to improve prediction accuracy and interpretability under stressed operating conditions. In [1], a Modern Voltage Stability Index (MVSI) is proposed to improve voltage collapse prediction by partially accounting for line resistance, mitigating the large errors reported when resistance is neglected in conventional formulations. MVSI is benchmarked against Lmn, FVSI, LQP, NLSI, VSLI, and NVSI on the IEEE 30-bus system, showing improved identification of critical lines, weak buses, and reactive power limits prior to collapse. A closely related study [1] further reinforces the same conclusion by demonstrating MVSI’s superior predictive accuracy under multiple loading conditions on the same benchmark.
Beyond index formulation, several works embed VSIs into optimization frameworks to enforce voltage security and improve operating performance. In [2], a voltage security-constrained–optimal power flow (VSC–OPF) formulation is proposed, where voltage stability criteria are incorporated by minimizing aggregated VSI measures (FVSI, Lmn, and LVSI). Validation on IEEE 30-, 57-, and 118-bus systems under normal and contingency conditions shows improved voltage stability margins and reduced losses compared with conventional cost-oriented OPF. In [3], six indices (VCPI, LVSI, Lmn, FVSI, LQP, and NLSI) are evaluated within a multiobjective OPF solved by a Multiobjective Mayfly Algorithm (MOMA), demonstrating that the relative ranking of indices depends on the chosen objective mix (cost, losses, computation time, and renewable penetration), with VCPI and NLSI achieving strong performance, while Lmn exhibits weaker outcomes. A broader comparative OPF study is reported in [4], where five indices (L-index, FVSI, Lmn, LVSI, and VCPI) are alternately embedded into the OPF objective and solved via improved particle swarm optimization; results across IEEE 14-, 30-, 57-, and 118-bus systems highlight index-dependent trade-offs among cost, losses, emissions, and loadability.
Several studies leverage indices as diagnostic triggers for corrective devices and reinforcement. In [5], an ANN-based framework trained via the Levenberg–Marquardt algorithm forecasts voltage instability using VSI features, comparing FVSI and LQP to identify vulnerable buses and support SVC placement under maximum loadability conditions on the IEEE 14-bus system. In [6], FVSI is used to identify candidate buses for distributed generation placement in radial distribution networks, with Whale Optimization Algorithm (WOA) used for sizing to reduce losses and improve voltage profiles in 15- and 33-bus test systems. FACTS-oriented placement is investigated in [7], where FVSI and a Power Stability Index (PSI) are compared for identifying effective device locations in the IEEE 14-bus transmission network; results indicate different performance strengths across loss components and power flow impacts. Similarly, ref. [8] proposes a contingency-based FACTS placement strategy to improve voltage stability margin using bus and line criticality indicators (including FVSI and LQP), and ref. [9] applies FVSI and VCPI to guide coordinated TCSC and SVC placement optimized via PSO, achieving improved voltage profiles under heavy loading. Collectively, these studies confirm that FVSI and related indices are widely adopted and effective for severity screening and device-guided mitigation; however, their primary focus is corrective enhancement (OPF/FACTS/DG), rather than probabilistic structural diagnostics of voltage-stress behavior under uncertain operating points.
To clarify the positioning of the present work within the broader landscape of steady-state voltage stability assessment, Table 1 summarizes representative voltage stability indices (VSIs) commonly reported in the literature. The comparison highlights the type of indicator, the physical aspect typically captured, their standard applications, and the main limitations that motivate probabilistic and distributional extensions beyond single-snapshot screening.
Table 1.
Comparison of representative steady-state voltage stability indices (VSIs), their scope, and typical limitations reported in the literature.
- Positioning of the present work. This paper does not propose a new voltage stability index. Instead, it introduces a probabilistic stress-testing and recurrence-based aggregation framework that operates on established indices—here, the Fast Voltage Stability Index (FVSI)—to transform conventional snapshot indicators into distributional risk metrics. By analyzing the behavior of and the recurrence of across large stochastic ensembles, the framework reveals voltage-risk escalation and structurally dominant corridors that remain hidden under deterministic or single-scenario assessments.
2.2. Probabilistic Voltage Stability Assessment Under Uncertainty
A second stream of literature addresses uncertainty in renewable generation and load demand through probabilistic modeling and assessment. In [10], probabilistic wind-speed modeling is evaluated using multiple probability distribution functions and diverse datasets; the study demonstrates that distributional selection materially affects voltage profile and stability assessment outcomes, providing practical guidance for stability studies under wind uncertainty. In [11], a mixed-integer linear programming framework allocates wind distributed generation in smart distribution grids considering OLTC and power factor control, using a probabilistic voltage stability index and loss reduction measures, demonstrating improved stability and reduced losses compared with classical approaches.
Sampling and computational efficiency are central concerns in probabilistic voltage stability analysis. In [12], multiple probabilistic sampling techniques are evaluated (Monte Carlo, Markov Chain Monte Carlo, importance sampling, and quasi-Monte Carlo variants such as Sobol, Halton, and Latin Hypercube), showing that quasi-Monte Carlo approaches can achieve high accuracy using substantially fewer samples. Correlation-aware modeling is investigated in [13], where correlated uncertainties in load and renewable integration are addressed through a theoretically grounded increment direction and a power method transformation combined with Latin hypercube sampling, yielding accurate and computationally efficient probabilistic assessment in modified IEEE systems. Complementarily, ref. [14] proposes a probabilistic framework for steady-state voltage stability margins under uncertainty by combining continuation power flow and three-point estimation, using statistical expansion for distribution recovery and employing the L-index for weak bus identification and contingency ranking; validation on IEEE 24- and 118-bus systems shows close agreement with Monte Carlo baselines and highlights strong dependence on operating conditions and correlations.
While these works establish mature probabilistic voltage stability methodologies, they largely emphasize margin estimation, uncertainty modeling, and sampling efficiency, rather than jointly characterizing voltage-floor risk and worst-case line-stress dominance through distributional aggregation of and across large stochastic ensembles.
2.3. Monte Carlo-Based Planning, Security, and Market-Oriented Frameworks
Monte Carlo simulation is also widely used within planning and security frameworks, where voltage stability interacts with investment, control, and operational objectives. In [15], a probabilistic optimization framework maximizes hosting capacity in distribution networks with renewables, storage, and voltage regulation devices, combining Monte Carlo simulation with a Snake Optimization Algorithm and demonstrating improved voltage stability and techno-economic outcomes. Transmission expansion planning under load-side uncertainty is investigated in [16], where Monte Carlo simulation is integrated with AC power flow and a metaheuristic solver, using PQVSI to enforce voltage stability feasibility in a deregulated context. In [17], a two-stage robust optimization approach allocates dynamic reactive power to enhance voltage security under wind uncertainty, using warm-start linear power flow approximations and demonstrating improved voltage deviation performance relative to heuristic strategies. Broader adequacy and security assessment in distribution networks with distributed generation is studied in [18], combining discrete–continuous simulation with steady-state AC power flow and dynamic verification of frequency and voltage stability in islanding conditions. Market-oriented security coordination is addressed in [19], where stochastic multiobjective day-ahead market clearing integrates security indices and contingencies using a two-stage Monte Carlo-driven optimization scheme.
These contributions confirm that Monte Carlo analysis is widely adopted in planning and security applications; however, voltage stability indicators are typically embedded as constraints or secondary indices within broader optimization workflows, whereas the present work is explicitly diagnostic and distributional, focusing on probabilistic voltage-floor erosion and structural dominance of worst-case FVSI corridors.
2.4. Weak-Bus Identification and Voltage-Risk Metrics
Weak-bus identification remains a fundamental diagnostic task, particularly under emerging stressors such as electrified transportation and renewable-driven variability. In [20], the impact of electric vehicle fast-charging station placement is assessed on the IEEE 33-bus system, demonstrating stronger degradation when chargers are installed at weak buses and introducing a composite VRP index to guide placement decisions. Reactive power planning guided by weak-location screening is investigated in [21], where VCPI-based identification supports a voltage-constrained reactive power planning problem solved via a hybrid Harris Hawk–PSO algorithm on IEEE 57, yielding robust performance under varying reactive loading. UVLS design also leverages weak-bus screening, as in [22], where FVSI is used to identify weak buses and a GA–PSO approach optimizes shedding actions, improving voltage profiles while reducing shedding magnitude and improving convergence speed. A comprehensive review [23] surveys the broader VSI landscape, emphasizing their roles in collapse proximity, loadability margins, weak-bus detection, contingency ranking, and critical branch identification, while noting limitations in computational burden and applicability.
Risk-aware voltage assessment has further evolved through probabilistic and statistical frameworks targeting violation likelihood under uncertainty. In [24], voltage violations and overload mitigation in hybrid AC/DC distribution networks are addressed via probabilistic modeling of complementarity and uncertainty, guiding VSC sizing and placement. System-level risk aggregation is proposed in [25], which defines voltage violation and related indicators and combines them through probabilistic modeling and Value-at-Risk concepts under wind penetration. A CVaR-based planning framework for mitigating voltage violations and branch overloads under renewable uncertainty is presented in [26], combining uncertainty modeling and network reconfiguration decisions. In [27], EV charging uncertainty is modeled probabilistically using real data and multiple distributions, with power flow validation confirming the accurate reproduction of voltage violation patterns. A correlation-aware probabilistic security risk assessment for wind-integrated systems is proposed in [28], using LHS–Cholesky decomposition and defining static voltage and overload risk indices validated on a modified New England 39-bus system.
These studies reinforce the importance of voltage-risk quantification under uncertainty, particularly via violation probabilities and risk measures. However, they typically emphasize voltage magnitude violations and system-level risk aggregation, rather than recurrence-based dominance of the worst-case line-stress mechanism captured by across large ensembles.
2.5. Contingency-Oriented and Data-Driven Voltage Security Assessment
Contingency analysis remains central to voltage security assessment, particularly under reliability requirements and high renewable penetration. In [29], a data-driven framework predicts contingency severity with and without UPFC using LVSI and machine learning on large contingency datasets, demonstrating effective severity estimation for IEEE 30. In [30], emergency congestion management is addressed through optimal load shedding using Grey Wolf Optimizer under normal and conditions, improving loss, curtailment, and voltage stability outcomes. In [31], voltage security assessment under large-scale wind integration is studied using P–V and Q–V analyses under contingencies together with remedial action schemes, providing practical ranking and collapse anticipation capabilities for operators.
Although these contributions emphasize contingency severity assessment and control-oriented responses, they generally focus on ranking outages or applying corrective actions, rather than probabilistically characterizing how worst-case stress relocates (or concentrates) across stochastic operating conditions.
2.6. Statistical Aggregation and Recurrence-Aware Voltage-Stability Analytics
A smaller subset of studies begins to incorporate statistical aggregation of stability indicators across scenarios, which is conceptually closer to the diagnostic perspective adopted in this paper. In [32], FVSI statistics are analyzed across base-case and contingencies to guide DG placement, using frequency-based analysis to identify weak components and improve voltage profiles and FVSI levels after corrective deployment. Data-driven contingency ranking and online prediction using neural networks is studied in [33,34], where dimensionality reduction is achieved via weak-bus feature extraction and PCA/ICA-based feature engineering combined with clustering, yielding accurate and computationally efficient contingency ranking in IEEE 30.
These works demonstrate the value of statistical summaries and learning-based processing of large scenario sets. However, they remain oriented toward control actions (DG placement) or online ranking/prediction, rather than a dedicated probabilistic stress-testing methodology that (i) jointly quantifies voltage-floor risk and worst-case FVSI behavior distributionally, and (ii) explicitly tracks the recurrence of the line achieving to identify dominance concentration and structural bottlenecks.
2.7. Recent Optimization and Metaheuristic Trends Around Voltage Objectives
Recent years have also seen extensive metaheuristic development for OPF and planning under uncertainty, often including voltage deviation or stability-related terms in objective functions. Representative examples include optimal placement of capacitor banks and multi-type DG using an improved Golden Jackal Optimization algorithm [35]; hybrid DRL–QIGA for OPF under renewable integration [36]; FACTS placement and sizing using Fata Morgana Algorithm [37]; OPF with renewable uncertainty using Chaotic African Vultures Optimization [38]; DG planning under correlated uncertainty using Improved Beluga Whale Optimization [39]; STATCOM placement via mixed-integer distributed ant colony optimization [40]; and fuzzy tuned mayfly algorithm for multiobjective problems incorporating voltage stability objectives [41]. These contributions demonstrate active methodological innovation in optimization, but their emphasis is typically on solution quality and computational performance for control/planning problems rather than diagnostic, distributional characterization of voltage-security degradation.
2.8. Positioning and Gaps Addressed by This Work
The reviewed literature highlights that (i) indices such as FVSI and related VSIs are widely validated for severity screening and are frequently embedded in OPF, FACTS, DG planning, and UVLS frameworks [1,2,3,4,5,6,7,8,9,21,22,23]; (ii) probabilistic voltage stability assessment is well established, with strong developments in uncertainty modeling, sampling efficiency, and probabilistic margin estimation [10,11,12,13,14]; and (iii) Monte Carlo simulation is broadly used in planning, security, and market contexts, typically as a component of optimization-driven workflows [15,16,17,18,19,24,25,26,27,28,35,36,37,38,39,40,41]. However, despite these advances, there remains limited work that is explicitly diagnostic and recurrence-aware, jointly quantifying (a) distributional voltage-floor erosion through and (b) the structural dominance of worst-case line stress through the recurrence of the corridor attaining , under a consistent stochastic stress protocol across benchmark systems.
Motivated by this gap, the present work proposes a fully steady-state probabilistic stress-testing framework based on Monte Carlo sampling and Newton–Raphson AC power flow. By combining ECDF/PDF-driven distributional analysis with voltage-violation risk metrics and recurrence tracking of the line achieving , the approach exposes structural dominance and dominance-collapse behaviors that can remain invisible to deterministic screening, single-scenario contingency ranking, or optimization-centric studies.
While established indices such as FVSI, L-index, and CPF margins are widely used for single-snapshot screening and collapse proximity assessment, the contribution of this work lies in transforming a conventional snapshot indicator (FVSI) into a probabilistic, recurrence-aware diagnostic through large-ensemble aggregation. The framework jointly reports voltage-floor risk () and worst-corridor dominance ( recurrence), enabling structural bottleneck identification under uncertainty without requiring control-oriented redispatch modeling.
Contributions beyond conventional Monte Carlo power flow. Although Monte Carlo simulation combined with Newton–Raphson AC power flow is well established, the contributions of this work lie in how stochastic outcomes are structured, aggregated, and interpreted. Specifically, the framework (i) injects stochastic stress selectively at weak buses using randomized footprint and intensity models, (ii) jointly evaluates voltage-floor adequacy () and worst-corridor stress () across large ensembles, and (iii) introduces recurrence-based dominance analysis to identify transmission corridors that persistently govern worst-case voltage stress. This persistence-focused, distributional diagnostic perspective goes beyond single-snapshot or mean-based Monte Carlo assessments.
3. Methodology
This section describes the proposed probabilistic stress-testing framework used to quantify voltage-security degradation under stochastic loading. The method is fully steady-state, relies on Newton–Raphson (NR) power flow for each Monte Carlo realization, and evaluates two complementary indicators: the minimum bus voltage magnitude and the maximum Fast Voltage Stability Index . The framework is applied consistently across IEEE 14-, 30-, and 118-bus benchmark systems and across multiple stress levels (L1–L3), enabling cross-level and cross-system comparisons.
3.1. Scope, Inputs, and Outputs
A test system is defined by its bus and line data sets (topology, impedances/admittances, generator limits, and base loads). For each stress level , the framework generates N stochastic load realizations. For each realization r, the algorithm:
- Constructs a perturbed loading condition by injecting random demand increments on a subset of weak buses;
- Solves the NR power flow and records the convergence status;
- Computes the scenario metrics and (plus the critical line associated with , when needed).
The final outputs per system and stress level include empirical distributions, CDFs, and risk/percentile summaries of and , computed on converged scenarios only.
3.2. Stress Levels and Weak-Bus Targeting
The proposed stress model targets a subset of buses that are more likely to exhibit voltage weakness under load growth. In this manuscript, denotes the set of weak buses, selected once per system using a deterministic base-case screening criterion (e.g., low-voltage buses and/or sensitivity-informed ranking from the base solution). The number of weak buses retained is denoted by .
The weak-bus set is selected deterministically from the base-case operating point using voltage-profile information and system-scaled screening criteria. This choice is intentional: weak-bus identification is not a contribution of this work, but an input to the proposed stress-testing framework. The objective is to concentrate stochastic demand perturbations on buses that are already electrically vulnerable under nominal conditions, thereby emulating realistic localized stress patterns. While alternative approaches based on sensitivity indices, modal analysis, or L-index ranking could also be employed, the present framework is agnostic to the specific weak-bus identification technique and can directly accommodate such alternatives without modification.
To emulate geographically and operationally plausible stress patterns, each Monte Carlo realization perturbs a random number of buses drawn from a discrete distribution:
where is a small support set (e.g., ), and are the associated probabilities (). A subset with is sampled uniformly without replacement from .
Stress levels L1–L3 are implemented by progressively increasing the perturbation intensity distribution (Section 3.3), while keeping the overall stochastic structure (weak-bus set and bus-count distribution) consistent.
In Equation (1), denotes the number of weak buses simultaneously stressed in realization r (stress footprint size). The probabilities define the categorical mass function over the support set , i.e., and . After drawing , the stressed subset is sampled uniformly without replacement from .
Definition (stress levels). The levels L1–L3 represent progressively intensified stochastic loading regimes applied under an otherwise fixed modeling structure. Across levels, the weak-bus set and the footprint model for the number of stressed buses (Equation (1)) are held constant, while the stress intensity factor is sampled from level-dependent distributions with increasing support and variability (Equation (3)). Accordingly, L1 represents mild stress suitable for screening, L2 represents moderate stress, and L3 represents severe but still pre-collapse stress (as verified by the observed 100% NR convergence in all reported cases). The fully expanded details for stress levels are shown in Table 2.
Table 2.
Stress-level definition used in the case studies (intensity factor ).
The stress-level ranges are chosen to provide three interpretable operating regimes under a consistent stochastic structure: (i) L1 induces mild perturbations suitable for screening around the base operating point, (ii) L2 produces moderate stress where voltage-floor degradation becomes clearly observable in distributional terms, and (iii) L3 probes severe yet still solvable operating regions. In practice, these ranges were verified to explore a broad stressed-equilibrium space while maintaining stable NR convergence across all systems (100% convergence in the reported cases), ensuring that the analysis focuses on probabilistic voltage-security erosion rather than widespread numerical collapse.
3.3. Stochastic Load Perturbation Model
The base-case demand at bus i is defined as . For each realization r, the perturbed demand is defined as:
where
- is the realization-level stress intensity factor;
- is a binary selector such that if and otherwise.
The stress factor is sampled from a level-dependent distribution:
where is configured to represent increasing variability/severity from L1 to L3 (e.g., bounded uniform or truncated normal distributions with increasing upper bound). This design allows systematic intensification while maintaining reproducibility and comparability.
Remark on power factor consistency. The formulation in (2) applies the same multiplicative factor to and at the perturbed buses, preserving the local power factor (or equivalently, preserving the ratio of the base case) during stochastic growth.
Remark on stress distribution selection. The stress-intensity distributions are selected to define controlled and interpretable stress regimes rather than to model a specific probabilistic forecast of demand growth. Uniform distributions with increasing support are used to progressively intensify stochastic loading while preserving transparency and cross-system comparability. The objective is not to optimize or calibrate stress parameters, but to probe how voltage security and structural dominance evolve as stress severity increases under a consistent stochastic protocol.
3.4. Power Flow Solution and Convergence Handling
For each realization r, a Newton–Raphson power flow is executed to obtain the steady-state voltage magnitudes and angles . The NR method iteratively solves the nonlinear AC power balance equations:
with specified injections and . Convergence is recorded as a binary flag:
All statistical analyses of and are computed on converged realizations only, using the mask . Non-converged cases are preserved in logs for diagnostic reporting and reproducibility.
Remark on power balance, feasibility, and the role of OPF. In each Monte Carlo realization, stochastic load increments are applied on a subset of weak buses while generator setpoints remain as defined by the base-case operating point. As in standard AC power flow practice, the slack (balancing) bus absorbs the net active power mismatch required to satisfy system-wide power balance, while reactive power balance is enforced through the nonlinear AC equations and generator reactive limits embedded in the NR formulation. In this paper, feasibility is therefore assessed through the existence of a converged steady-state solution: non-convergent scenarios are logged and excluded from distributional statistics, and convergent scenarios represent physically consistent equilibria under the adopted operating assumptions.
Unlike probabilistic studies that explicitly model corrective redispatch via OPF, the objective here is diagnostic rather than corrective: the intent is not to enforce economic or operational feasibility through optimal control actions, but to expose how voltage security degrades when the system is stressed under a fixed dispatch structure. Introducing OPF redispatch could mask structural vulnerabilities by compensating stress through control actions; such mitigation-oriented modeling is a valuable extension but is intentionally outside the scope of this screening-focused framework.
3.5. Performance Indicators
Minimum bus voltage
For a converged realization r, the system’s minimum voltage is defined as:
where is the set of buses.
Fast Voltage Stability Index
For each transmission line directed from a sending bus i to a receiving bus j, the Fast Voltage Stability Index (FVSI) is evaluated using the standard form:
where is the line impedance magnitude, is the line reactance, is the sending-end voltage magnitude, and is the receiving-end reactive power associated with the corridor (consistent with the FVSI implementation used in the study). The scenario maximum FVSI is then:
with denoting the set of transmission lines. When required (e.g., recurrence analysis), the line achieving is stored:
The maximum operator in Equation (9) is used to represent the worst-case corridor stress in a given operating realization. This choice aligns with planning-stage screening practice: a realization is characterized by its most critical corridor, and tracking the identity of the maximizing line enables recurrence-based diagnostics of structural dominance across stochastic scenarios.
3.6. Empirical Distributions, CDFs, and Percentiles
Considering that denotes the samples of a metric x (either or ) over the converged realizations. The empirical cumulative distribution function (ECDF) is computed as:
where is the indicator function.
To summarize tail behavior and enable professional cross-level comparisons, the following percentiles are extracted:
In the proposed visualizations, percentile markers are superimposed on the ECDF curves for each stress level, improving interpretability without sacrificing the full distributional information.
3.7. Voltage Risk Metrics
For operational risk interpretation, voltage-violation probabilities are computed with respect to a voltage threshold (e.g., pu):
This metric complements percentile and ECDF analyses by directly reporting the probability of falling below a planning-relevant voltage security limit.
3.8. Computational Procedure
Algorithm 1 summarizes the complete workflow for a given system and stress level. The procedure is repeated for each level L1–L3, using fixed random seeds (offset per level) to enable repeatable experiments.
| Algorithm 1 Stochastic stress-testing for a given system and stress level L |
|
The number of realizations was set to per stress level as a balance between distributional stability and computational tractability. For the considered test systems, this sample size was observed to yield stable empirical distributions and percentile estimates for both and , with no qualitative changes in distribution shape or dominance ranking when additional realizations were tested during preliminary runs. Moreover, all reported cases achieved 100% NR convergence, ensuring that statistical summaries are not distorted by numerical collapse effects.
To improve readability and provide a visual summary of the stochastic stress-testing procedure, Figure 1 presents a flowchart representation of Algorithm 1, highlighting the generation of stochastic load realizations, the NR power-flow solution, and the post-processing steps used for distributional and recurrence-based analysis.
Figure 1.
Flowchart representation of Algorithm 1: weak-bus targeted stochastic stress generation (random footprint and intensity), NR AC power flow per realization, computation of and (with critical-line extraction), and distributional/recurrence-based post-processing across stress levels L1–L3.
4. Analysis of Results
4.1. Case Study: IEEE 14-Bus System
This subsection reports the stochastic stress-testing outcomes for the IEEE 14-bus benchmark under three progressively intensified stress levels (L1–L3). The analysis focuses on (i) voltage-floor behavior via the minimum converged bus voltage and (ii) voltage-stress severity via the scenario maximum .
4.1.1. Setup Summary and Convergence Behavior
The IEEE 14-bus system comprises 14 buses and 20 transmission lines. For each stress level, Monte Carlo scenarios were generated. The procedure used an automatically selected weak-bus subset size (with ). The number of simultaneously perturbed buses follows
which yields .
The base-case power flow converged and the maximum base-case FVSI value was , occurring on line (2–5). The weak-bus set used for stochastic stress injections (size ) was
Across all three levels, the convergence rate was 100% (nonconvergence rate 0%), indicating that the tested stress ranges explore a broad stochastic operating space without widespread Newton–Raphson collapse.
4.1.2. Distributional Behavior of Across Stress Levels
Figure 2 shows the converged PDFs for L1–L3. A monotone degradation is observed as stress increases: the mean decreases from (L1) to (L2) and (L3), while the dispersion grows markedly (: ). The median also shifts left (p50: ), indicating systematic deterioration of typical voltage-floor conditions.
Figure 2.
IEEE 14-bus: PDF histograms of converged under stochastic loading for stress levels L1–L3.
To connect these distributions to operational risk, the probability of violating increases monotonically with stress:
All levels yield , showing that the stress protocol intentionally drives the system below the 0.95 pu planning threshold for IEEE 14 in these ranges.
4.1.3. Distributional Behavior of and Tail Escalation
Figure 3 reports the converged PDFs. While the central mass remains near the base-case critical value at mild stress, the upper tail escalates strongly with stress, as confirmed by the high-percentile progression:
This indicates that severe voltage-stress events become substantially more likely under higher stress, even if the median shifts more moderately (p50: ). In addition, the standard deviation grows significantly (), evidencing increased stochastic variability of the worst-case stability proximity.
Figure 3.
IEEE 14-bus: PDF histograms of converged under stochastic loading for stress levels L1–L3.
4.1.4. Cross-Level ECDF Overlays
To provide a compact cross-level comparison and enable direct percentile reading, Figure 4 overlays the ECDFs of and for L1–L3. For , the ECDF curves separate clearly in the low-voltage region, confirming monotone degradation and increased tail risk at higher stress. For , the separation becomes pronounced at high quantiles, reinforcing the heavy-tail escalation observed in the PDF and percentile statistics.
Figure 4.
IEEE 14-bus: cross-level ECDF overlays summarizing distributional shifts from L1 to L3.
4.1.5. Numerical Summary
Table 3 summarizes the principal statistics extracted from the analysis for IEEE 14 across all stress levels (converged trials only, per level).
4.2. Case Study: IEEE 30-Bus System
This subsection reports the stochastic stress-testing outcomes for the IEEE 30-bus benchmark under three progressively intensified stress levels (L1–L3). The analysis mirrors the IEEE 14-bus case and focuses on (i) voltage-floor behavior via the minimum converged bus voltage and (ii) voltage-stress severity via the scenario maximum .
Table 3.
IEEE 14-bus summary statistics across stress levels (converged trials only, per level).
4.2.1. Setup Summary and Convergence Behavior
The IEEE 30-bus system comprises 30 buses and 41 transmission lines. For each stress level, Monte Carlo scenarios were generated. The weak-bus subset size was automatically selected as using the system-scaled criterion with . The number of simultaneously perturbed buses follows
reflecting the larger system size and higher redundancy compared to IEEE 14.
The base-case power flow converged successfully, yielding a maximum base-case FVSI value of on line (2–5). The weak-bus set used for stochastic stress injections was
Across all stress levels, the convergence rate remained 100%, indicating that the stress ranges explore a wide stochastic operating region without inducing numerical collapse in the Newton–Raphson solver.
4.2.2. Distributional Behavior of Across Stress Levels
Figure 5 shows the probability density functions of the converged values for stress levels L1–L3. Compared to IEEE 14, the IEEE 30 system exhibits higher absolute voltage levels and reduced dispersion, reflecting its increased structural robustness.
Figure 5.
IEEE 30-bus: PDF histograms of converged under stochastic loading for stress levels L1–L3.
As stress intensifies, the mean decreases monotonically from (L1) to (L2) and (L3), while the standard deviation increases from to . The median follows a similar trend (p50: ), confirming a systematic degradation of voltage-floor conditions under stronger stochastic loading.
Despite the higher nominal voltage levels, the probability of violating increases sharply with stress:
In contrast, no violations below pu were observed at any level, underscoring the stronger voltage support of the IEEE 30 system relative to IEEE 14.
4.2.3. Distributional Behavior of
Figure 6 reports the PDFs of the converged values. Unlike IEEE 14, the IEEE 30 system exhibits a highly concentrated FVSI distribution across all stress levels, with the dominant critical line remaining (2–5) in nearly all scenarios.
Figure 6.
IEEE 30-bus: PDF histograms of converged under stochastic loading for stress levels L1–L3.
For L1 and L2, the FVSI distribution collapses tightly around the base-case value (), with negligible dispersion. Under the highest stress level L3, a slight broadening is observed, reflected in an increase of to and a modest rise in the upper tail (p95: ). Nevertheless, the median remains unchanged at , indicating that severe voltage-stress events remain structurally constrained to a narrow corridor.
4.2.4. Cross-Level ECDF Overlays
To synthesize the distributional trends, Figure 7 overlays the ECDFs of and across stress levels. For , the ECDF curves shift progressively toward lower voltages, with increasing separation in the lower tail, confirming the monotone increase in voltage-violation risk. In contrast, the ECDFs remain tightly clustered, diverging only slightly at the extreme upper quantiles under L3, consistent with the PDF and percentile analysis.
Figure 7.
IEEE 30-bus: cross-level ECDF overlays summarizing distributional shifts from L1 to L3.
4.2.5. Numerical Summary
Table 4 summarizes the principal statistics for IEEE 30 across all stress levels (converged trials only, per level).
Table 4.
IEEE 30-bus summary statistics across stress levels (converged trials only, per level).
4.3. Case Study: IEEE 118-Bus System
This subsection reports the stochastic stress-testing outcomes for the IEEE 118-bus benchmark under three progressively intensified stress levels (L1–L3). Consistent with the prior cases, the analysis focuses on (i) voltage-floor behavior through the minimum converged bus voltage and (ii) voltage-stress severity through the scenario maximum .
4.3.1. Setup Summary and Convergence Behavior
The IEEE 118-bus system comprises 118 buses and 186 transmission lines. For each stress level, Monte Carlo scenarios were generated. The weak-bus subset size was automatically selected as using . To reflect the higher-dimensional stress space of a large transmission grid, the number of simultaneously perturbed buses is selected as
consistent with the system-scaled criterion ().
The base-case Newton–Raphson power flow converged successfully. The maximum base-case FVSI value was , occurring on line (92–100). The weak-bus set used for stochastic stress injections (size ) was
Across all stress levels, the convergence rate remained at 100% (nonconvergence rate 0%), indicating that the stress ranges probe a broad stochastic operating region without widespread power-flow collapse.
4.3.2. Distributional Behavior of Across Stress Levels
Figure 8 reports the probability density functions of converged for L1–L3. Compared to IEEE 14, the voltage-floor distributions remain closer to the planning threshold, with relatively small dispersion. Nevertheless, a monotone degradation with stress is still observed: the mean decreases from (L1) to (L2) and (L3), while the standard deviation increases from to . The median also shifts left (p50: ), confirming a systematic, though moderate, deterioration in typical voltage-floor conditions.
Figure 8.
IEEE 118-bus: PDF histograms of converged under stochastic loading for stress levels L1–L3.
In terms of operational risk, the probability of violating is substantial and increases with stress:
However, no scenarios violated at any level, confirming that although the IEEE 118 system frequently dips below the conservative planning threshold under stochastic demand stress, it retains a strong margin against deeper voltage-collapse proximity in the explored ranges.
4.3.3. Distributional Behavior of
Figure 9 reports the PDFs of the converged values. In contrast to IEEE 14, and even more strongly than IEEE 30, the IEEE 118 system exhibits an extremely concentrated FVSI response across stress levels: the scenario maximum remains fixed at the base-case value with negligible numerical dispersion and identical percentiles (p50, p90, p95) for all levels. The dominant critical line remains (92–100) in all scenarios per level, implying a near-deterministic critical corridor under the present stress design.
Figure 9.
IEEE 118-bus: PDF histograms of converged under stochastic loading for stress levels L1–L3.
This behavior indicates that under the current protocol, stochastic load increases predominantly manifest as gradual voltage-floor degradation, while the worst-case FVSI mechanism remains structurally “locked” to the same corridor. This is not a weakness of the framework; rather, it provides a diagnostic signal that the chosen FVSI definition and stress injection pattern excite voltage-floor sensitivity more strongly than line-wise FVSI relocation for this particular test system.
4.3.4. Cross-Level ECDF Overlays
Figure 10 overlays the ECDFs of and across L1–L3. For , the ECDF curves show consistent leftward shifts and increased lower-tail mass as stress increases, confirming a monotone degradation trend that is compactly visible in the cumulative domain. For , the ECDF curves collapse nearly perfectly, corroborating the level-invariant FVSI response and the persistence of the critical corridor (92–100) across all trials.
Figure 10.
IEEE 118-bus: cross-level ECDF overlays summarizing distributional shifts from L1 to L3.
4.3.5. Numerical Summary
Table 5 summarizes the principal statistics for IEEE 118 across all stress levels (converged trials only, per level).
Table 5.
IEEE 118-bus summary statistics across stress levels (converged trials only, per level).
4.4. Cross-System Comparative Analysis of Outcomes
This subsection synthesizes the stochastic stress-testing results across the IEEE 14-, 30-, and 118-bus systems, with the objective of identifying scalable trends in voltage-risk exposure, distributional degradation, and structural dominance as system size and stress intensity increase. The analysis focuses on three complementary dimensions: (i) probabilistic voltage-violation risk, (ii) distributional behavior of the voltage floor , and (iii) recurrence-based identification of structurally dominant transmission lines.
4.4.1. Probabilistic Voltage-Violation Risk Across Systems
Figure 11 reports the probability of violating the planning threshold under stochastic loading for all systems and stress levels. Several important trends emerge.
Figure 11.
Cross-system probability of voltage violation under stochastic loading for IEEE 14, IEEE 30, and IEEE 118 systems across stress levels L1–L3.
First, voltage-violation risk increases monotonically with stress level (L1→L3) for every test system, confirming the internal consistency of this research stress protocol. However, the *rate* at which this risk escalates is strongly system dependent. The IEEE 14-bus system exhibits immediate saturation, with even at L1, reflecting its limited voltage-support margin and low structural redundancy.
In contrast, the IEEE 30- and 118-bus systems display a more gradual degradation. At L1, the violation probability is approximately for IEEE 30 and for IEEE 118, increasing to and at L3, respectively. This indicates that larger systems benefit from increased buffering capacity at mild stress, yet still converge toward high-risk regimes as stochastic loading intensifies.
Importantly, no system exhibits violations below pu across all stress levels, confirming that this research explores severe but pre-collapse operating regions rather than inducing widespread numerical instability.
4.4.2. Distributional Degradation of the Voltage Floor
Figure 12 compares the distribution of converged minimum bus voltage across stress levels for each system using boxplots. This representation highlights both central tendencies and tail behavior, enabling a direct assessment of voltage robustness.
Figure 12.
Distribution of minimum bus voltage under stochastic loading for IEEE 14, IEEE 30, and IEEE 118 systems across stress levels L1–L3.
For the IEEE 14-bus system, the distributions shift sharply downward and widen significantly as stress increases, with L3 exhibiting a pronounced lower tail extending well below pu. This confirms that voltage insecurity is not only frequent but also severe in small systems under coordinated stochastic stress.
The IEEE 30-bus system shows a more moderate degradation pattern: while the medians remain close to the threshold at L1 and L2, the interquartile range and lower whiskers expand noticeably at L3. This indicates an increased likelihood of localized voltage weakness rather than systemic collapse.
The IEEE 118-bus system displays the tightest distributions overall, with comparatively small dispersion even at L3. Nevertheless, the systematic downward shift of the median and the growing proportion of samples below pu confirm that large-scale systems are not immune to voltage-floor erosion under correlated load perturbations.
The horizontal pu reference line emphasizes that this methodology captures a progressive *encroachment* into insecure operating regions rather than abrupt transitions, reinforcing its suitability for probabilistic voltage-risk assessment.
4.4.3. Structural Dominance and Critical-Line Recurrence
Beyond voltage magnitudes, this research enables the identification of structurally dominant transmission corridors by tracking the recurrence of the line attaining across stochastic scenarios. Figure 13 reports the Top-3 most recurrent critical lines at the highest stress level (L3) for each system.
Figure 13.
Top-3 critical transmission-line recurrence at stress level L3 for IEEE 14, IEEE 30, and IEEE 118 systems, measured as the percentage of scenarios, where each line attains . (Line identifiers follow the standard IEEE test-system branch notation “i–j” used throughout the manuscript).
The IEEE 14-bus system exhibits a fragmented dominance structure, with three lines sharing criticality (approximately , , and recurrence). This dispersion reflects a lack of clear structural bottlenecks and indicates that voltage stress can migrate across multiple corridors depending on the stochastic realization.
In stark contrast, the IEEE 30-bus system demonstrates near-total dominance by a single corridor (line 2–5), accounting for over of all worst-case outcomes. This reveals a highly concentrated vulnerability structure, where voltage instability is governed by a small subset of transmission assets despite increased system size.
The IEEE 118-bus system exhibits an extreme form of dominance collapse: a single transmission line (92–100) accounts for 100% of occurrences at L3. This result highlights a critical and nontrivial insight—large-scale systems may exhibit *greater* structural fragility, with stochastic stress consistently funneled through a single bottleneck.
These findings confirm that the presented methodology not only quantifies voltage-risk severity but also exposes hidden structural asymmetries that are invisible to single-snapshot or average-based analyses.
4.4.4. Key Cross-System Insights and Topology-Aware Interpretation
The cross-system analysis demonstrates that the proposed probabilistic stress-testing framework consistently captures three complementary and physically meaningful dimensions of voltage-security behavior across transmission networks of very different scales: (i) escalation of voltage-floor risk under stochastic loading, (ii) distributional degradation of operating conditions, and (iii) structural dominance of critical transmission corridors identified through the recurrence of . Crucially, these outcomes are strongly linked to network topology and system characteristics, rather than being mere statistical artifacts.
The IEEE 14-bus transmission system is adopted as the first case study to validate the methodology on a compact and weakly meshed network. This benchmark system, widely used in voltage stability research, consists of 14 buses, 5 generators, and 11 loads. Due to its limited redundancy, stochastic stress leads to rapid voltage-floor degradation and a fragmented dominance pattern in which multiple transmission corridors alternately govern the worst-case FVSI response. Specifically, the probabilistic recurrence analysis at the highest stress level identifies lines 10–11, 2–5, and 3–4 as the most critical corridors, jointly accounting for the majority of occurrences. Figure 14 illustrates the IEEE 14-bus topology, where these dominant transmission lines are highlighted in red.
Figure 14.
IEEE 14-bus transmission system topology. The most critical transmission corridors identified through recurrence under stochastic stress (lines 10–11, 2–5, and 3–4) are highlighted in red.
The IEEE 30-bus transmission system constitutes the second study case and represents a real transmission network derived from the Midwestern United States power system. This system comprises 30 buses, 6 generators, and 9 aggregated loads interconnected through a moderately meshed transmission network. Compared to IEEE 14, the system exhibits higher structural redundancy and stronger voltage support, resulting in a more gradual degradation of the voltage floor under stochastic stress. However, the recurrence-based analysis reveals a pronounced concentration of structural dominance. In particular, transmission lines 2–5 emerge as the overwhelmingly dominant corridor, with lines 9–11 acting as a secondary contributor to worst-case FVSI events. Figure 15 highlights these critical corridors in red, illustrating how stochastic voltage stress is consistently funneled through a very limited subset of transmission assets.
Figure 15.
IEEE 30-bus transmission system topology. Dominant transmission corridors identified via recurrence under stochastic stress (lines 2–5 and 9–11) are highlighted in red.
The IEEE 118-bus transmission system serves as the third and largest study case, representing a portion of the American Electric Power System located in the Midwestern USA. This large-scale network consists of 118 buses, 19 generators, and 91 loads interconnected through 186 transmission lines. Owing to its size and meshed structure, the system maintains comparatively strong voltage support and exhibits no deep voltage-collapse events within the explored stress ranges. Nevertheless, the probabilistic analysis uncovers an extreme form of structural dominance. Under stochastic weak-bus loading, transmission lines 92–100 account for essentially all occurrences of at the highest stress level, indicating a complete dominance collapse toward a single critical corridor.
Due to the massive scale of the IEEE 118-bus system, Figure 16 presents a zoomed-in view of the network region surrounding lines 92–100, with the dominant corridor highlighted in red. This localized visualization emphasizes that even in large and highly meshed transmission networks, stochastic voltage stress can consistently concentrate on a very small subset of structurally critical assets.
Figure 16.
IEEE 118-bus transmission system. Zoomed-in view of the network region containing the dominant transmission corridor. Lines 92–100, which attains in 100% of stochastic realizations at L3, is highlighted in red.
Overall, these topology-aware results confirm that increasing system size tends to delay the onset of severe voltage violations, while simultaneously amplifying structural dominance effects, concentrating voltage-stress risk into an increasingly small number of transmission corridors. The proposed stochastic, recurrence-based diagnostic framework therefore provides actionable insight for planning-stage applications, enabling system operators and planners to identify and prioritize structurally critical lines for enhanced monitoring, reactive support, or reinforcement under uncertain loading conditions.
5. Conclusions
This paper introduced a fully steady-state probabilistic stress-testing framework for voltage security assessment under stochastic demand growth, combining Monte Carlo simulation with Newton–Raphson AC power flow and dual performance indicators, namely the minimum bus voltage magnitude and the scenario maximum Fast Voltage Stability Index . By selectively perturbing screened weak buses and progressively intensifying stress levels, the framework provides a reproducible and system-agnostic approach for quantifying voltage-risk exposure across large ensembles of operating conditions. The consistent 100% convergence observed across all systems and stress levels confirms that the proposed methodology explores severe yet pre-collapse operating regions, making it suitable for planning-stage diagnostics rather than post-instability analysis.
Numerical results on the IEEE 14-, 30-, and 118-bus benchmark systems demonstrate a clear and monotone degradation of the voltage floor as stochastic stress intensifies. Smaller systems exhibit rapid escalation of voltage-risk severity, while larger systems retain higher nominal voltage levels but still experience substantial encroachment into insecure operating regions relative to planning thresholds. Importantly, the results show that increasing system size delays—but does not eliminate—voltage insecurity under correlated demand stress, highlighting the necessity of probabilistic rather than deterministic voltage-security assessment.
Beyond voltage magnitudes, the analysis of worst-case line stress reveals a pronounced structural effect in large-scale networks. While the IEEE 14-bus system exhibits dispersed criticality across multiple corridors, the IEEE 30- and 118-bus systems display strong dominance concentration, with stochastic stress repeatedly funneled through a single transmission line at high stress levels. This dominance-collapse phenomenon demonstrates that larger and more redundant networks may exhibit greater structural fragility, where voltage-stress propagation is governed by a very small subset of assets that consistently control worst-case behavior.
Overall, the proposed framework offers a compact and interpretable diagnostic tool that simultaneously captures probabilistic voltage-risk escalation and structural dominance in transmission systems. By exposing vulnerabilities that remain hidden under single-snapshot or average-based screening, the methodology provides valuable insight for planning-stage monitoring, asset prioritization, and preventive reinforcement decisions. Future work may extend this framework to alternative stress models, dynamic or continuation-based stability indicators, and the evaluation of mitigation strategies within the same probabilistic setting.
From a practical standpoint, the proposed framework supports planning-stage voltage-security screening under uncertain load growth by (i) quantifying the probability of violating operational voltage thresholds through , and (ii) identifying structurally dominant transmission corridors via the recurrence of the line attaining across stochastic operating points. These diagnostics can be used to prioritize corridors for enhanced monitoring, reinforcement assessment, or preventive reactive support allocation, particularly when uncertainty concentrates stress on weak buses. Unlike single-snapshot studies, the framework provides distributional risk signatures and persistence-based structural insights that remain stable across large ensembles of plausible stressed operating conditions. The key advantage is therefore not the introduction of a new index, but a scalable probabilistic screening protocol that converts standard stability metrics into risk- and persistence-based planning insights.
Future Work
Following, readers can find the main areas of research for future works related to this paper:
- Extension to alternative stress models and uncertainty sources. Future research will explore more diverse stochastic stress formulations, including spatially correlated load growth, renewable generation variability, and probabilistic outage combinations. Incorporating multiple uncertainty sources would enable a richer representation of realistic operating environments and further test the robustness of the proposed framework.
- Integration with dynamic and continuation-based stability metrics. While this study focused on steady-state indicators, future work will extend the probabilistic framework to include dynamic voltage stability metrics, continuation power flow (CPF) margins, and time-domain stability indicators. This integration would allow direct comparison between steady-state risk signatures and dynamic collapse proximity under stochastic stress.
- Assessment of mitigation and reinforcement strategies. The present work is intentionally diagnostic. A natural extension is to embed the framework within planning studies that evaluate the effectiveness of reactive power support, transmission reinforcement, or network reconfiguration strategies in reducing probabilistic voltage risk and alleviating dominance collapse in critical corridors.
- Scalability and application to large real-world networks. Future studies will apply the proposed methodology to large-scale utility systems and regional transmission networks, focusing on computational scalability, parallelization, and automated weak-bus screening. This will facilitate the practical adoption of probabilistic voltage-security diagnostics in real planning and operational environments.
Author Contributions
M.J.: conceptualization, methodology, validation, writing—review and editing, data curation, formal analysis. D.C.: validation, review and editing. A.A.T.: review and editing. E.G.: review and editing. All authors have read and agreed to the published version of the manuscript.
Funding
Universidad Politécnica Salesiana and GIREI supported the Smart Grid Research Group under the project “Optimization of Energy Dispatch in Block H of the Salesian Polytechnic University, Quito South Campus, through a Predictive Consumption Model and Hybrid Management between Solar Panels and the Electric Grid” approved and founded by resolution 005-01-2025-02-07.
Data Availability Statement
The original contributions presented in this study are included in the article. Further inquiries can be directed to the corresponding author.
Conflicts of Interest
The authors declare no conflicts of interest.
Abbreviations
The following abbreviations and symbols are used in this manuscript:
| AC | Alternating Current |
| CDF | Cumulative Distribution Function |
| ECDF | Empirical Cumulative Distribution Function |
| FVSI | Fast Voltage Stability Index |
| NR | Newton–Raphson |
| IEEE | Institute of Electrical and Electronics Engineers |
| L1–L3 | Progressive stochastic stress levels |
| MC | Monte Carlo |
| p.u. | Per-unit system |
| Bus indices (sending and receiving ends of a line) | |
| r | Monte Carlo realization index |
| N | Total number of Monte Carlo realizations |
| Number of converged realizations | |
| Set of buses in the system | |
| Set of transmission lines | |
| Set of weak buses selected for stress injection | |
| Number of weak buses, | |
| Subset of stressed buses in realization r | |
| Number of stressed buses in realization r | |
| Probability mass of the categorical bus-count distribution | |
| Stress intensity factor in realization r | |
| Stress-intensity distribution for level L | |
| Base-case active power demand at bus i | |
| Base-case reactive power demand at bus i | |
| Perturbed active power demand at bus i in realization r | |
| Perturbed reactive power demand at bus i in realization r | |
| Net active power injection at bus i | |
| Net reactive power injection at bus i | |
| Voltage magnitude at bus i | |
| Voltage phase angle at bus i | |
| Minimum bus voltage in realization r | |
| Random variable of minimum bus voltage | |
| Voltage-security threshold (p.u.) | |
| Resistance of line | |
| Reactance of line | |
| Impedance of line , | |
| Magnitude of line impedance | |
| Receiving-end reactive power at bus j in realization r | |
| FVSI of line in realization r | |
| Maximum FVSI over all lines in realization r | |
| Critical line achieving in realization r | |
| Empirical CDF of metric x | |
| q-th percentile of metric x | |
| Probability of voltage violation below threshold | |
| Power-flow convergence flag for realization r | |
| Indicator function | |
| j | Imaginary unit, |
References
- Mokred, S.; Wang, Y.; Chen, T. Modern voltage stability index for prediction of voltage collapse and estimation of maximum load-ability for weak buses and critical lines identification. Int. J. Electr. Power Energy Syst. 2023, 145, 108596. [Google Scholar] [CrossRef] [Scilit]
- Thasnas, N.; Siritaratiwat, A. Implementation of Static Line Voltage Stability Indices for Improved Static Voltage Stability Margin. J. Electr. Comput. Eng. 2019, 2019, 2609235. [Google Scholar] [CrossRef] [Scilit]
- Kyomugisha, R.; Muriithi, C.M.; Nyakoe, G.N. Performance of Various Voltage Stability Indices in a Stochastic Multiobjective Optimal Power Flow Using Mayfly Algorithm. J. Electr. Comput. Eng. 2022, 2022, 7456333. [Google Scholar] [CrossRef] [Scilit]
- Khunkitti, S.; Premrudeepreechacharn, S.; Chatthaworn, R.; Thasnas, N.; Khunkitti, P.; Siritaratiwat, A.; Watson, N.R. A comparison of the effectiveness of voltage stability indices in an optimal power flow. IEEJ Trans. Electr. Electron. Eng. 2019, 14, 534–544. [Google Scholar] [CrossRef] [Scilit]
- Singh, P.; Parida, S.K.; Chauhan, B.; Choudhary, N. Online voltage stability assessment using artificial neural network considering voltage stability indices. In Proceedings of the 2020 21st National Power Systems Conference, NPSC 2020, Gandhinagar, India, 17–19 December 2020. [Google Scholar] [CrossRef] [Scilit]
- Ang, S.; Leeton, U. Optimal placement and size of distributed generation in radial distribution system using whale optimization algorithm. Suranaree J. Sci. Technol. 2019, 26, 1–12. [Google Scholar]
- Roshan, R.; Samal, P.; Sinha, P. Optimal placement of FACTS devices in power transmission network using power stability index and fast voltage stability index. In Proceedings of the International Conference on Electrical and Electronics Engineering, ICE3 2020, Gorakhpur, India, 14–15 February 2020; pp. 246–251. [Google Scholar] [CrossRef] [Scilit]
- Gupta, S.K.; Mallik, S.K. Enhancement in Voltage Stability Using FACTS Devices Under Contingency Conditions. J. Oper. Autom. Power Eng. 2024, 12, 365–378. [Google Scholar] [CrossRef]
- Nadeem, M.; Zeb, M.Z.; Imran, K.; Janjua, A.K. Optimal Sizing and Allocation of SVC and TCSC in Transmission Network by combined Sensitivity index and PSO. In Proceedings of the 2019 International Conference on Applied and Engineering Mathematics, ICAEM 2019-Proceedings, Taxila, Pakistan, 27–29 August 2019; pp. 111–116. [Google Scholar] [CrossRef] [Scilit]
- Alzubaidi, M.; Hasan, K.N.; Meegahapola, L. Impact of Probabilistic Modelling of Wind Speed on Power System Voltage Profile and Voltage Stability Analysis. Electr. Power Syst. Res. 2022, 206, 107807. [Google Scholar] [CrossRef] [Scilit]
- Alanazi, M.S. A MILP model for optimal renewable wind DG allocation in smart distribution systems considering voltage stability and line loss. Alex. Eng. J. 2022, 61, 5887–5901. [Google Scholar] [CrossRef] [Scilit]
- Alzubaidi, M.; Hasan, K.N.; Meegahapola, L.; Rahman, M.T. Identification of efficient sampling techniques for probabilistic voltage stability analysis of renewable-rich power systems. Energies 2021, 14, 2328. [Google Scholar] [CrossRef] [Scilit]
- Zhang, J.; Fan, L.; Zhang, Y.; Yao, G.; Yu, P.; Xiong, G.; Meng, K.; Chen, X.; Dong, Z. A Probabilistic Assessment Method for Voltage Stability Considering Large Scale Correlated Stochastic Variables. IEEE Access 2020, 8, 5407–5415. [Google Scholar] [CrossRef] [Scilit]
- Rawat, M.S.; Vadhera, S. Probabilistic Steady State Voltage Stability Assessment Method for Correlated Wind Energy and Solar Photovoltaic Integrated Power Systems. Energy Technol. 2021, 9, 2000732. [Google Scholar] [CrossRef] [Scilit]
- Mahmoud, A.M.; Ezzat, M.; Abdel Aleem, S.H.E.; Abdelaziz, A.Y. Hosting capacity maximization by optimal planning of active and reactive power compensators, voltage regulators, and energy storage units in a rural Egyptian power system. Electr. Eng. 2025, 107, 9547–9576. [Google Scholar] [CrossRef] [Scilit]
- Alhamrouni, I.; Salem, M.; Rahmat, M.K.; Siano, P. Bacterial Foraging Algorithm & Demand Response Programs for a Probabilistic Transmission Expansion Planning with the Consideration of Uncertainties and Voltage Stability Index. IEEE Can. J. Electr. Comput. Eng. 2021, 44, 179–188. [Google Scholar] [CrossRef] [Scilit]
- Jiang, M.; Xu, C.; Guo, Q.; Wang, W.; Ge, H.; Wang, B. Dynamic Reactive Power Robust Allocation Based on Linear Power Flow for Large-Scale Wind Farm Integration. In Proceedings of the 2019 IEEE PES Innovative Smart Grid Technologies Asia, ISGT 2019, Chengdu, China, 21–24 May 2019; pp. 3174–3178. [Google Scholar] [CrossRef] [Scilit]
- Issicaba, D.; Pecas Lopes, J.A.; Da Rosa, M.A. Adequacy and security evaluation of distribution systems with distributed generation. IEEE Trans. Power Syst. 2012, 27, 1681–1689. [Google Scholar] [CrossRef] [Scilit]
- Amjady, N.; Aghaei, J.; Shayanfar, H.A. Stochastic multiobjective market clearing of joint energy and reserves auctions ensuring power system security. IEEE Trans. Power Syst. 2009, 24, 1841–1854. [Google Scholar] [CrossRef] [Scilit]
- Deb, S.; Tammi, K.; Kalita, K.; Mahanta, P. Impact of electric vehicle charging station load on distribution network. Energies 2018, 11, 178. [Google Scholar] [CrossRef] [Scilit]
- Shekarappa, G.S.; Mahapatra, S.; Raj, S. Voltage Constrained Reactive Power Planning Problem for Reactive Loading Variation Using Hybrid Harris Hawk Particle Swarm Optimizer. Electr. Power Compon. Syst. 2021, 49, 421–435. [Google Scholar] [CrossRef] [Scilit]
- Larik, R.M.; Mustafa, M.W.; Aman, M.N.; Jumani, T.A.; Sajid, S.; Panjwani, M.K. An improved algorithm for optimal load shedding in power systems. Energies 2018, 11, 1808. [Google Scholar] [CrossRef] [Scilit]
- Nageswa Rao, A.R.; Vijaya, P.; Kowsalya, M. Voltage stability indices for stability assessment: A review. Int. J. Ambient Energy 2021, 42, 829–845. [Google Scholar] [CrossRef] [Scilit]
- Zhang, L.; Tong, B.; Wang, Z.; Tang, W.; Shen, C. Optimal Configuration of Hybrid AC/DC Distribution Network Considering the Temporal Power Flow Complementarity on Lines. IEEE Trans. Smart Grid 2022, 13, 3857–3866. [Google Scholar] [CrossRef] [Scilit]
- Ma, Y.; Yang, X.; Wang, Z.; Dong, L.; Zhao, S.; Cai, Y. Operation Risk Assessment for Power System With Large-scale Wind Power Integration Based on Value at Risk. Dianwang Jishu/Power Syst. Technol. 2021, 45, 849–854. [Google Scholar] [CrossRef]
- Wang, J.; Wang, W.; Wang, H.; Wu, J.; Wang, S. Planning method of soft open point for an active distribution network considering conditional value-at-risk. Dianli Xitong Baohu Yu Kongzhi/Power Syst. Prot. Control 2022, 50, 1–11. [Google Scholar] [CrossRef]
- Hasan, K.N.; Preece, R.; Milanovic, J.V. Probabilistic Modelling of Electric Vehicle Charging Demand based on Charging Station Data. In Proceedings of the 2022 17th International Conference on Probabilistic Methods Applied to Power Systems, PMAPS 2022, Manchester, UK, 12–15 June 2022. [Google Scholar] [CrossRef] [Scilit]
- Xia, S.; Song, L.; Wu, Y.; Ma, Z.; Jing, J.; Ding, Z.; Li, G. An Integrated LHS-CD Approach for Power System Security Risk Assessment with Consideration of Source-Network and Load Uncertainties. Processes 2019, 7, 900. [Google Scholar] [CrossRef] [Scilit]
- Angadi, R.V.; Daram, S.B.; Venkataramu, P.S.; Joshi Manohar, V. Data Mining and Machine Learning Technique in Contingency Analysis of Power System with UPFC. Distrib. Gener. Altern. Energy J. 2022, 37, 1305–1328. [Google Scholar] [CrossRef] [Scilit]
- Sayed, F.; Kamel, S.; Tostado, M.; Jurado, F. Congestion Management in Power System Based on Optimal Load Shedding Using Grey Wolf Optimizer. In Proceedings of the 2018 20th International Middle East Power Systems Conference, MEPCON 2018-Proceedings, Cairo, Egypt, 18–20 December 2018; pp. 942–947. [Google Scholar] [CrossRef] [Scilit]
- Dorile, P.O.; Jagessar, D.R.; McCann, R.A. Security of a Power System under High Penetration of Wind Energy Considering Contingencies and Stability Margins. In Proceedings of the 19th IEEE Student Conference on Research and Development: Sustainable Engineering and Technology towards Industry Revolution, SCOReD 2021, Kota Kinabalu, Malaysia, 23–25 November 2021; pp. 450–455. [Google Scholar] [CrossRef] [Scilit]
- Jaramillo, M.; Carrión, D.; Perdikos, F.; Tipan, L. A Data-Driven Approach to Voltage Stability Support via FVSI-Based Distributed Generator Placement in Contingency Scenarios. Energies 2025, 18, 2466. [Google Scholar] [CrossRef] [Scilit]
- Moradzadeh, B.; Hosseinian, S.H.; Toosi, M.R.; Menhaj, M.B. Online voltage stability monitoring and contingency ranking using RBF neural network. In Proceedings of the IEEE PES PowerAfrica 2007 Conference and Exposition, PowerAfrica, Johannesburg, South Africa, 16–20 July 2007. [Google Scholar] [CrossRef] [Scilit]
- Moradzadeh, B.; Hosseinian, S.H.; Monfared, M. Two comparative approaches for online voltage stability monitoring and contingency ranking. In Proceedings of the 2nd International Conference on Electrical and Control Technologies, ECT 2007, Kaunas, Lithuania, 3–4 May 2007; pp. 116–119. [Google Scholar]
- Elseify, M.A.; Hashim, F.A.; Hussien, A.G.; Kamel, S. Single and multi-objectives based on an improved golden jackal optimization algorithm for simultaneous integration of multiple capacitors and multi-type DGs in distribution systems. Appl. Energy 2024, 353, 122054. [Google Scholar] [CrossRef] [Scilit]
- Gurumoorthi, G.; Senthilkumar, S.; Karthikeyan, G.; Alsaif, F. A hybrid deep learning approach to solve optimal power flow problem in hybrid renewable energy systems. Sci. Rep. 2024, 14, 19377. [Google Scholar] [CrossRef] [Scilit]
- Aljaidi, M.; Jangir, P.; Agrawal, S.P.; Pandya, S.B.; Parmar, A.; Alkoradees, A.F.; Arpita; Smerat, A. Optimizing FACTS Device Placement Using the Fata Morgana Algorithm: A Cost and Power Loss Minimization Approach in Uncertain Load Scenario-Based Systems. Int. J. Comput. Intell. Syst. 2025, 18, 12. [Google Scholar] [CrossRef] [Scilit]
- Mohamed, A.A.; Kamel, S.; Hassan, M.H.; Zeinoddini-Meymand, H. CAVOA: A chaotic optimization algorithm for optimal power flow with facts devices and stochastic wind power generation. IET Gener. Transm. Distrib. 2024, 18, 121–144. [Google Scholar] [CrossRef] [Scilit]
- Li, J.; Zhou, X.; Zhou, Y.; Han, A. Optimal Configuration of Distributed Generation Based on an Improved Beluga Whale Optimization. IEEE Access 2024, 12, 31000–31013. [Google Scholar] [CrossRef] [Scilit]
- Al-Majali, B.H.; Zobaa, A.F. A novel optimal allocation of STATCOM to enhance voltage stability in power networks. Ain Shams Eng. J. 2024, 15, 102658. [Google Scholar] [CrossRef] [Scilit]
- Gangil, G.; Kumar Goyal, S.; Saraswat, A. Multi-objective optimization of reactive power dispatch problem using fuzzy tuned mayfly algorithm. Expert Syst. Appl. 2024, 249, 123819. [Google Scholar] [CrossRef] [Scilit]
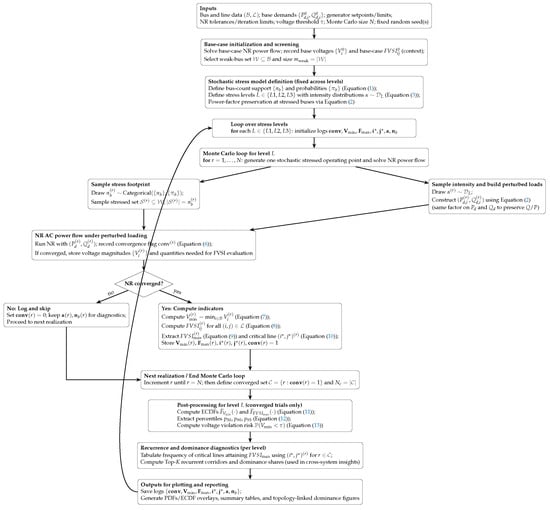
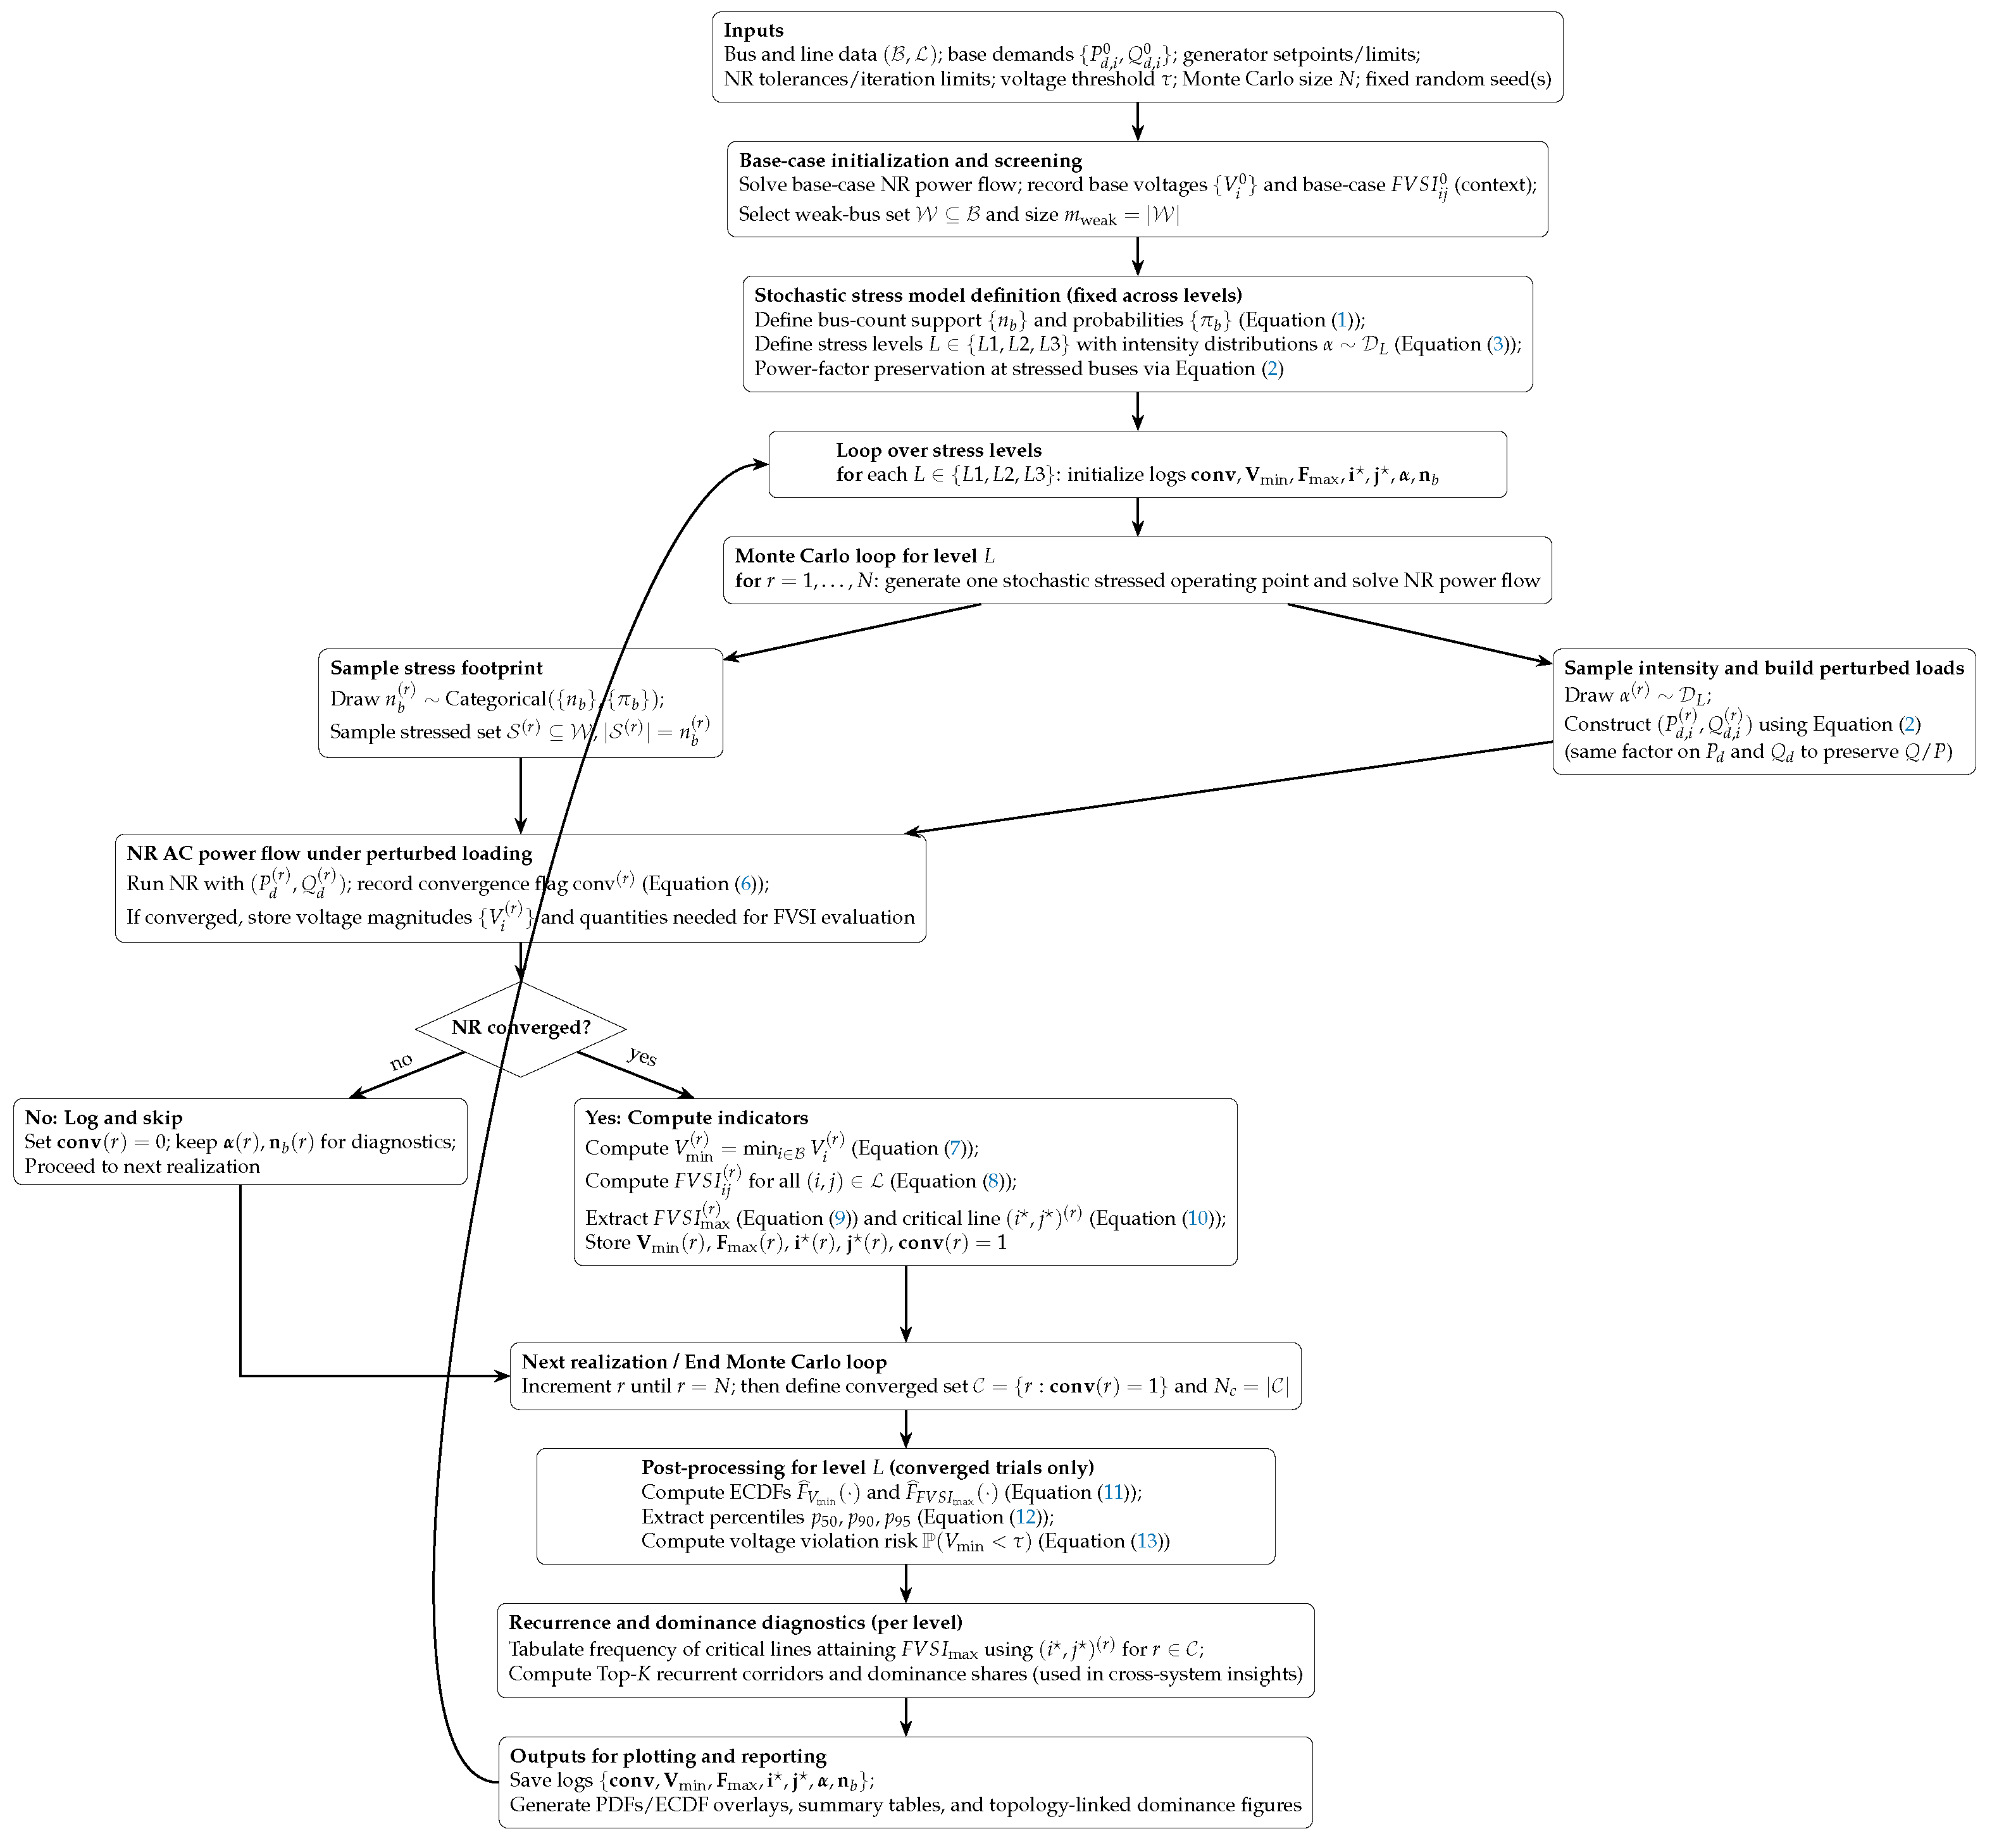
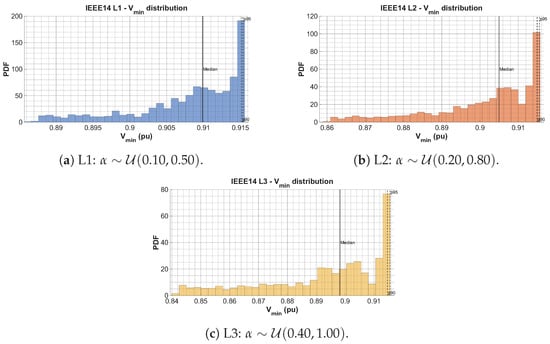
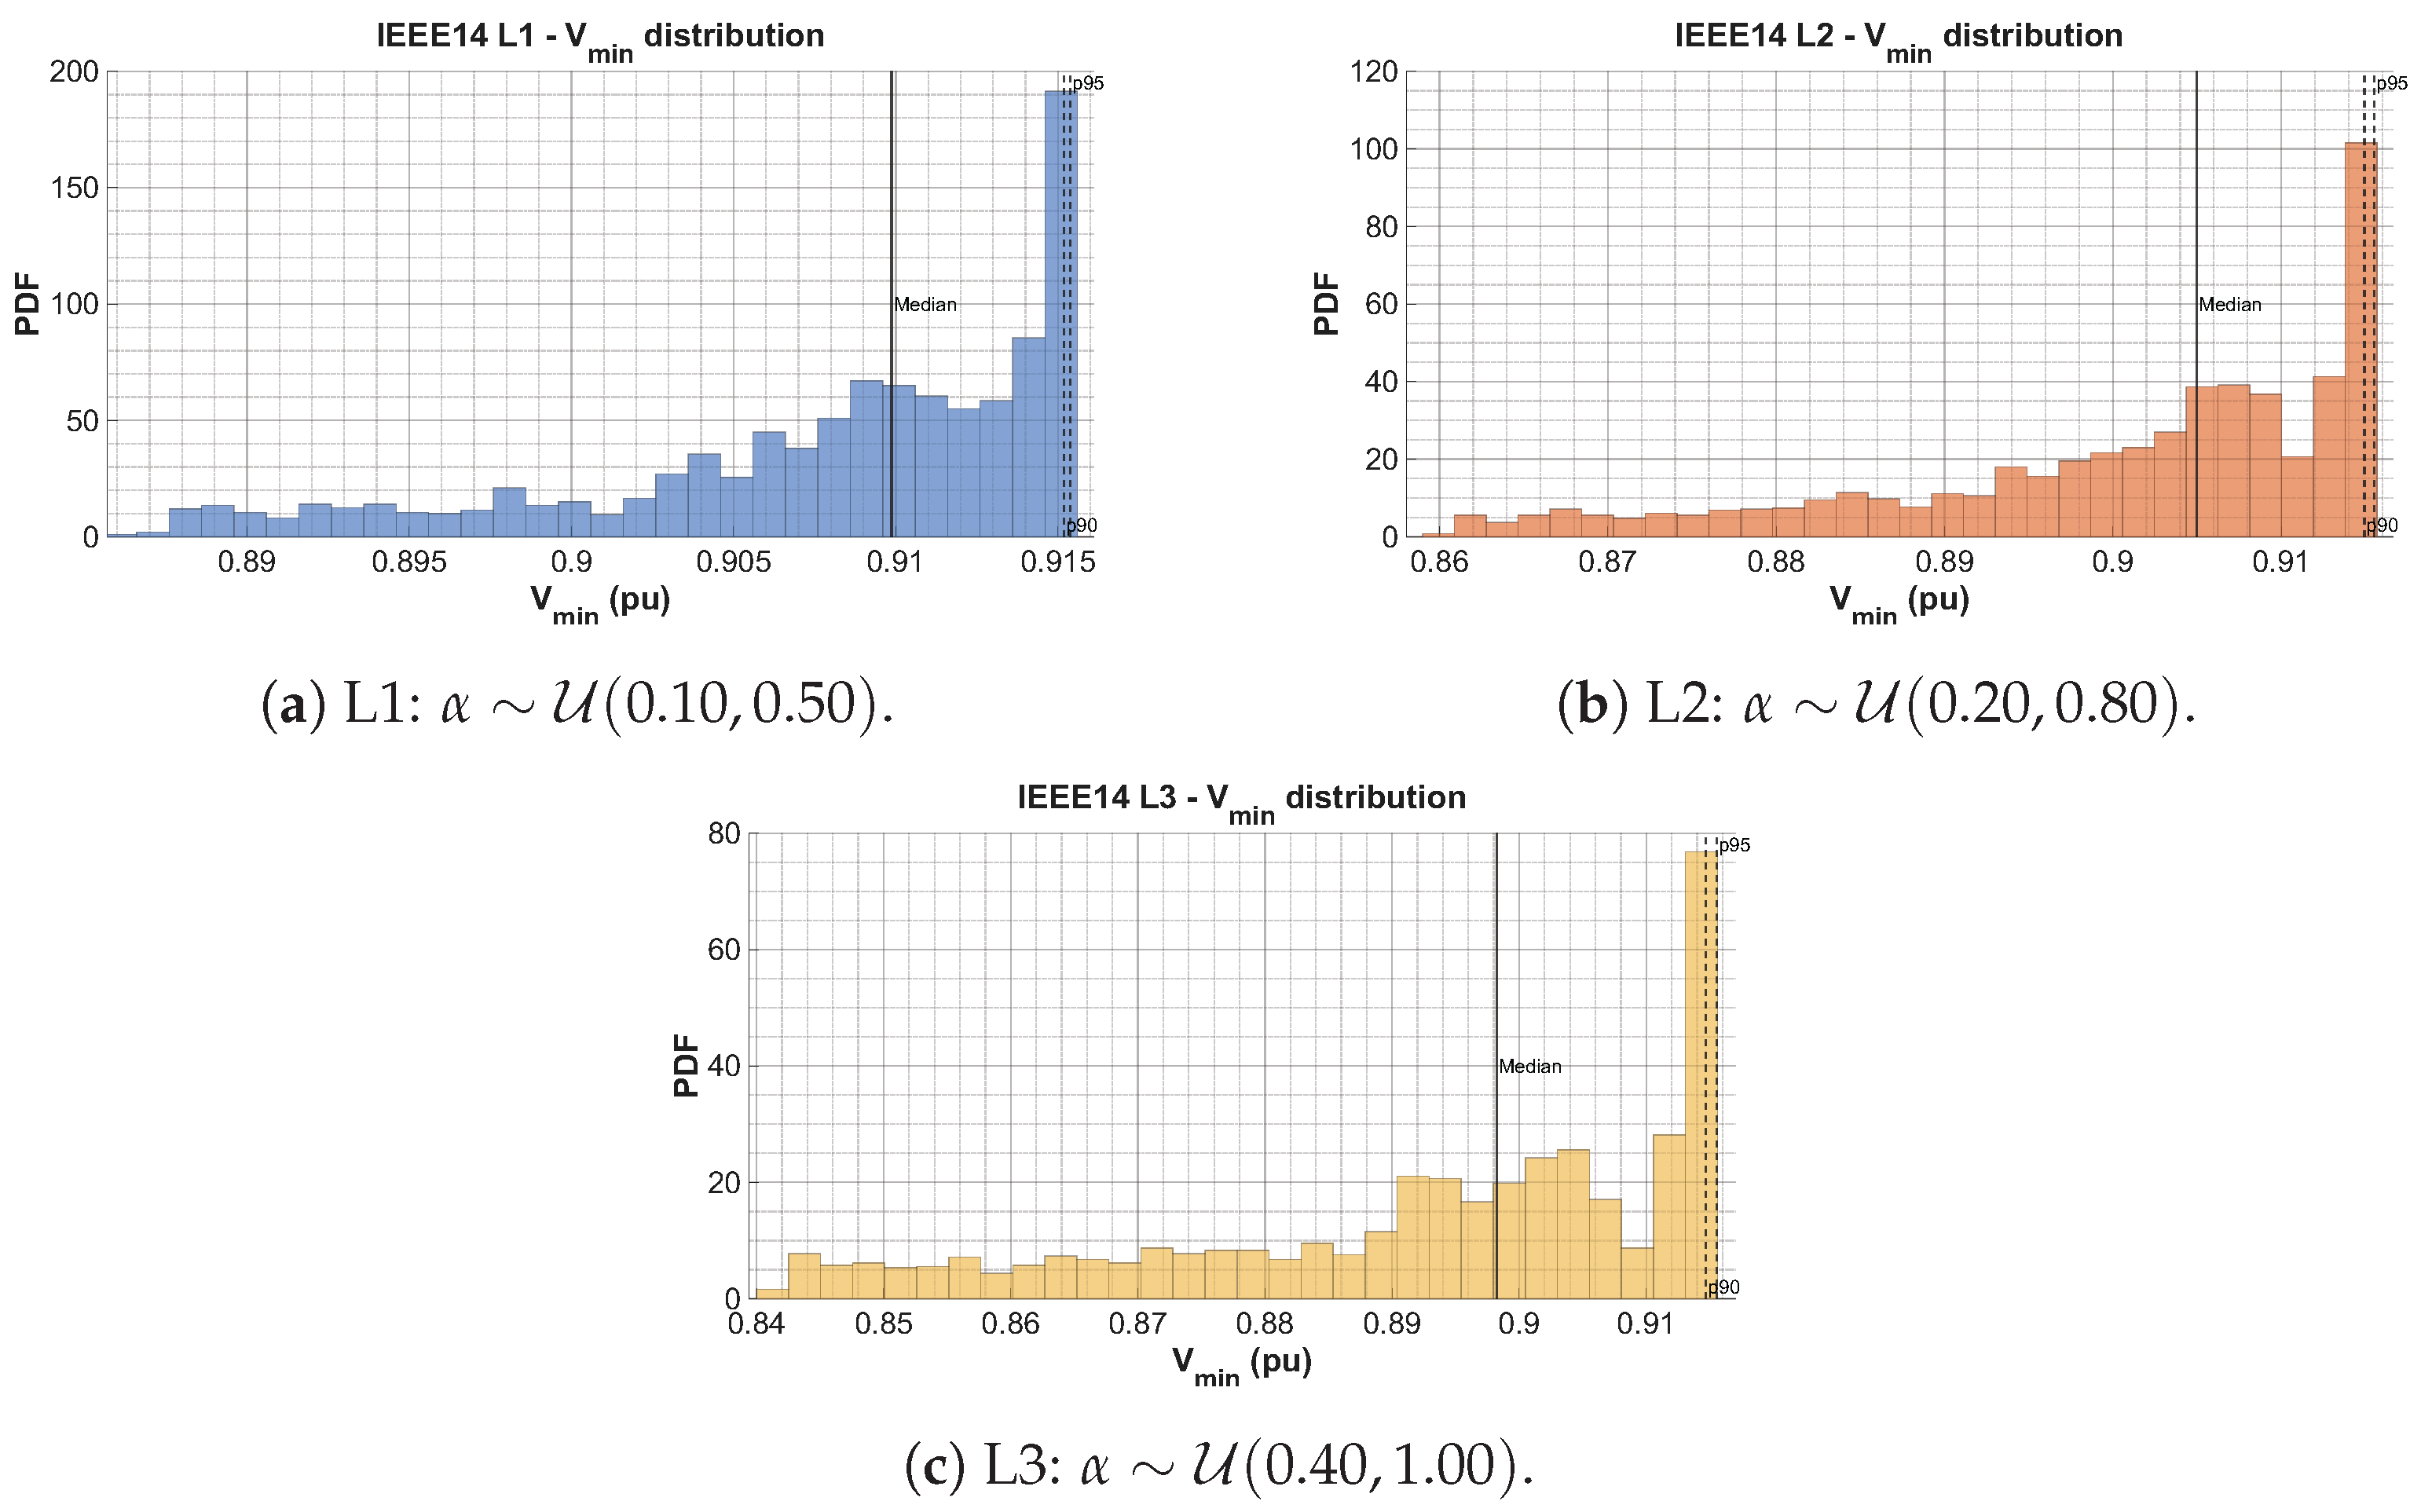
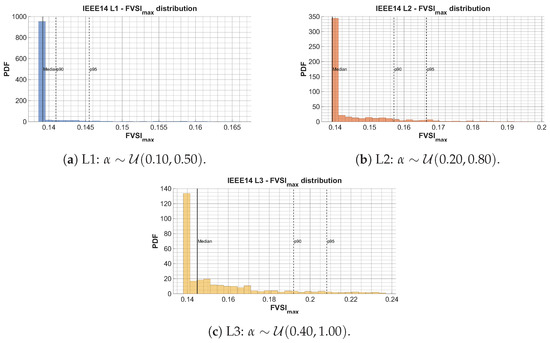
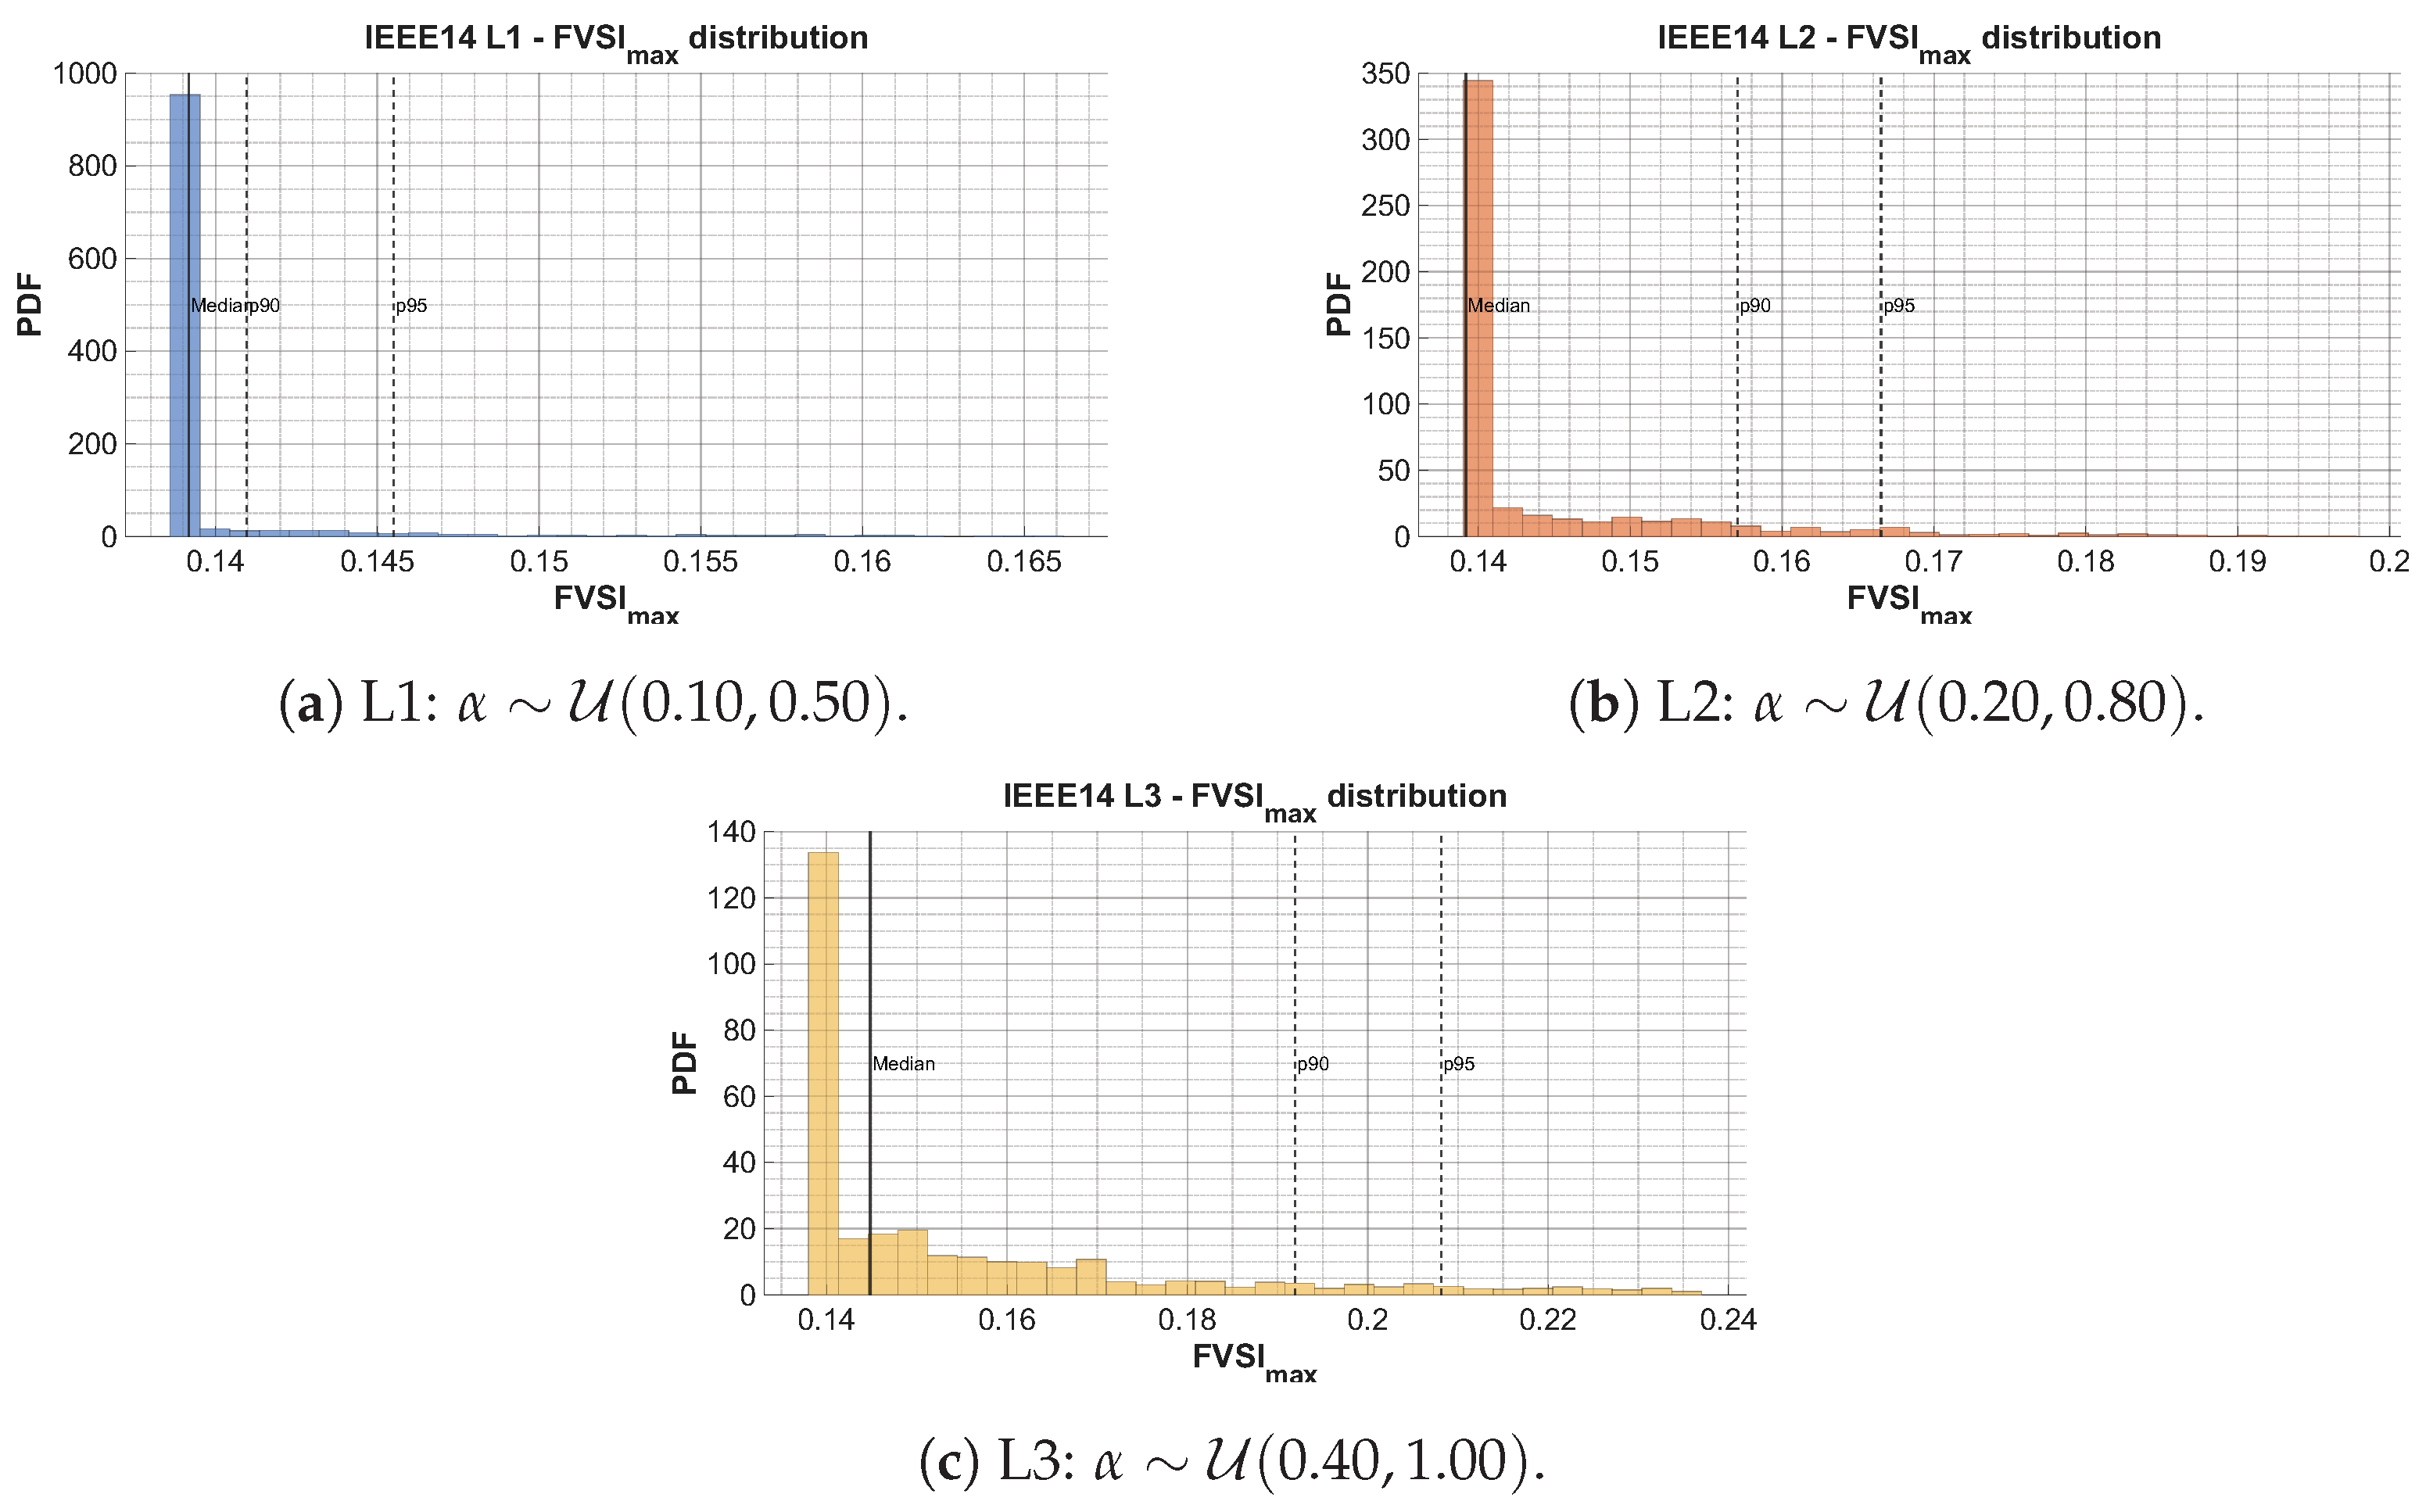
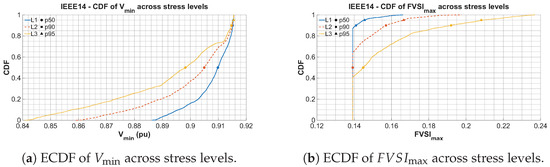
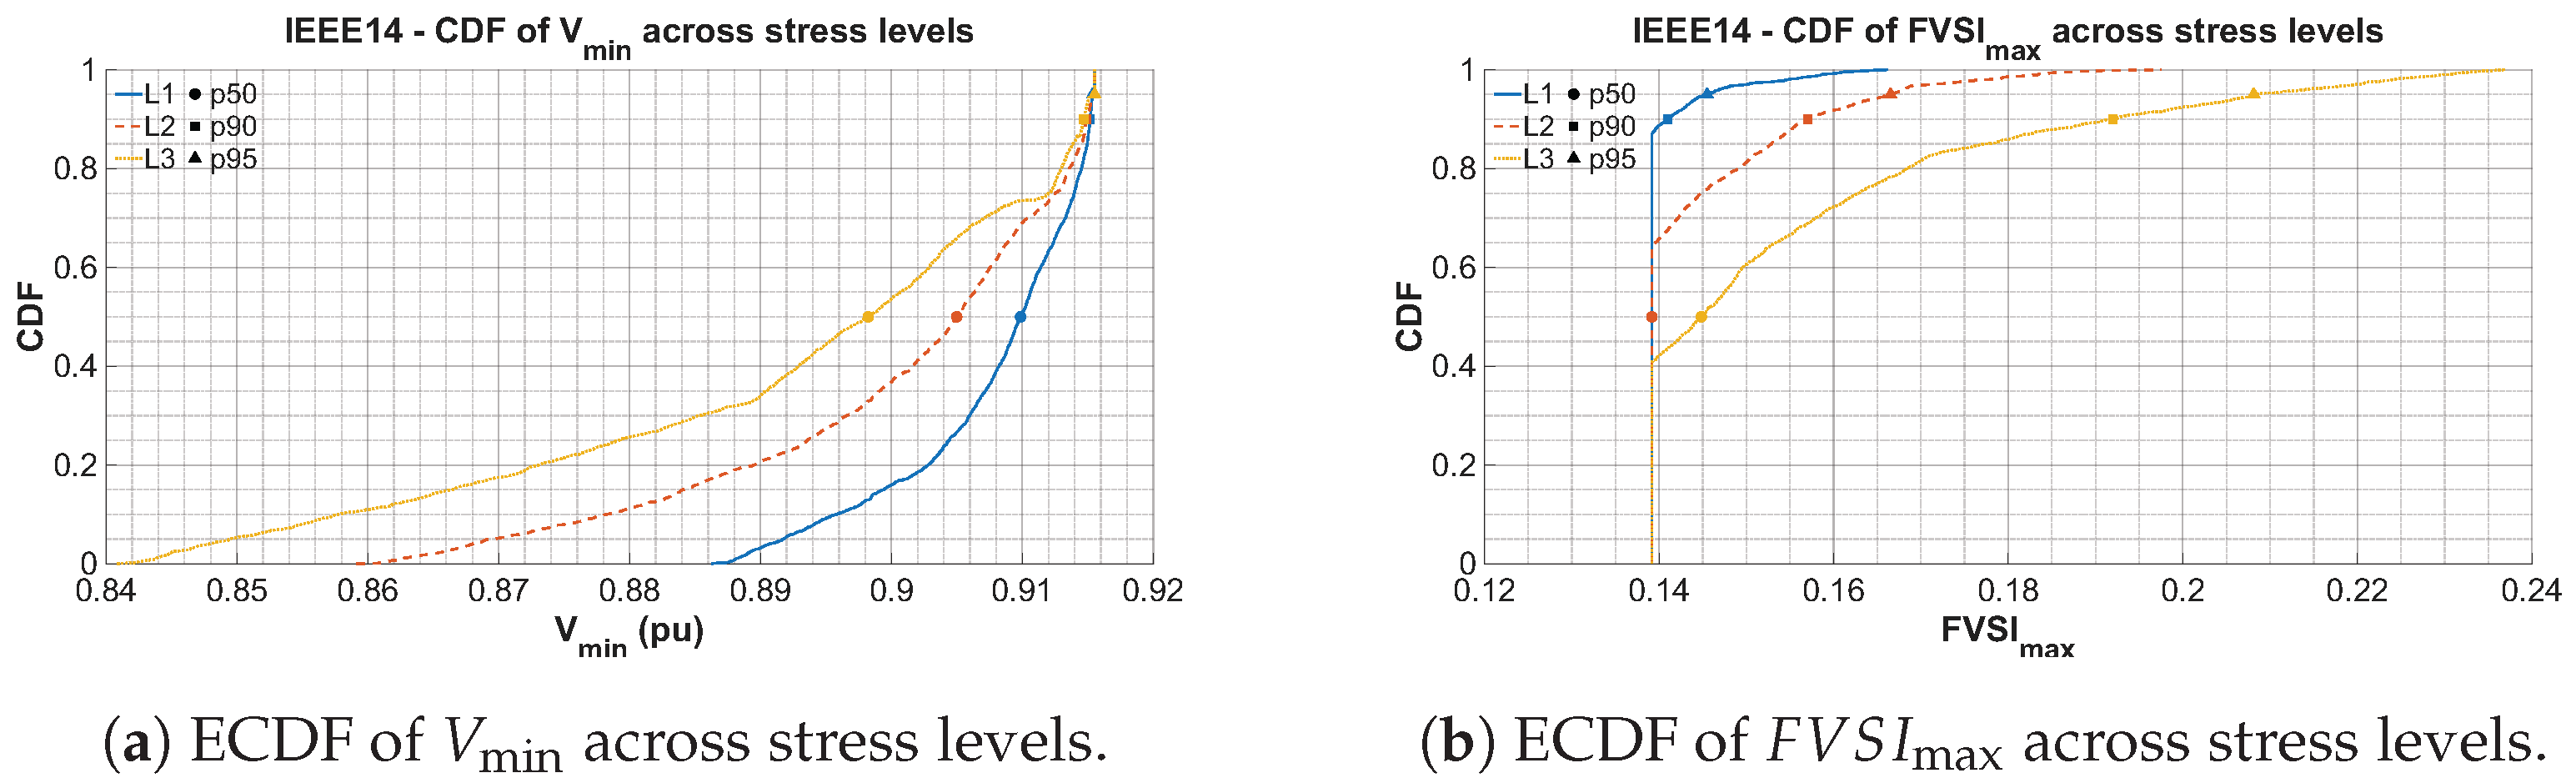
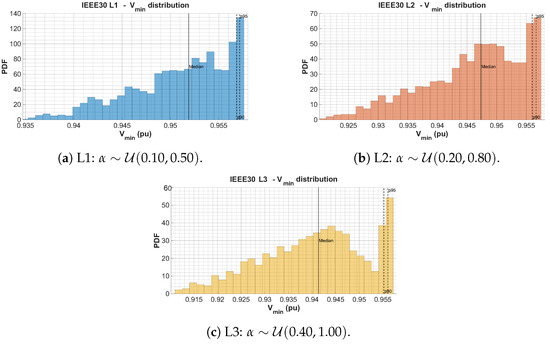
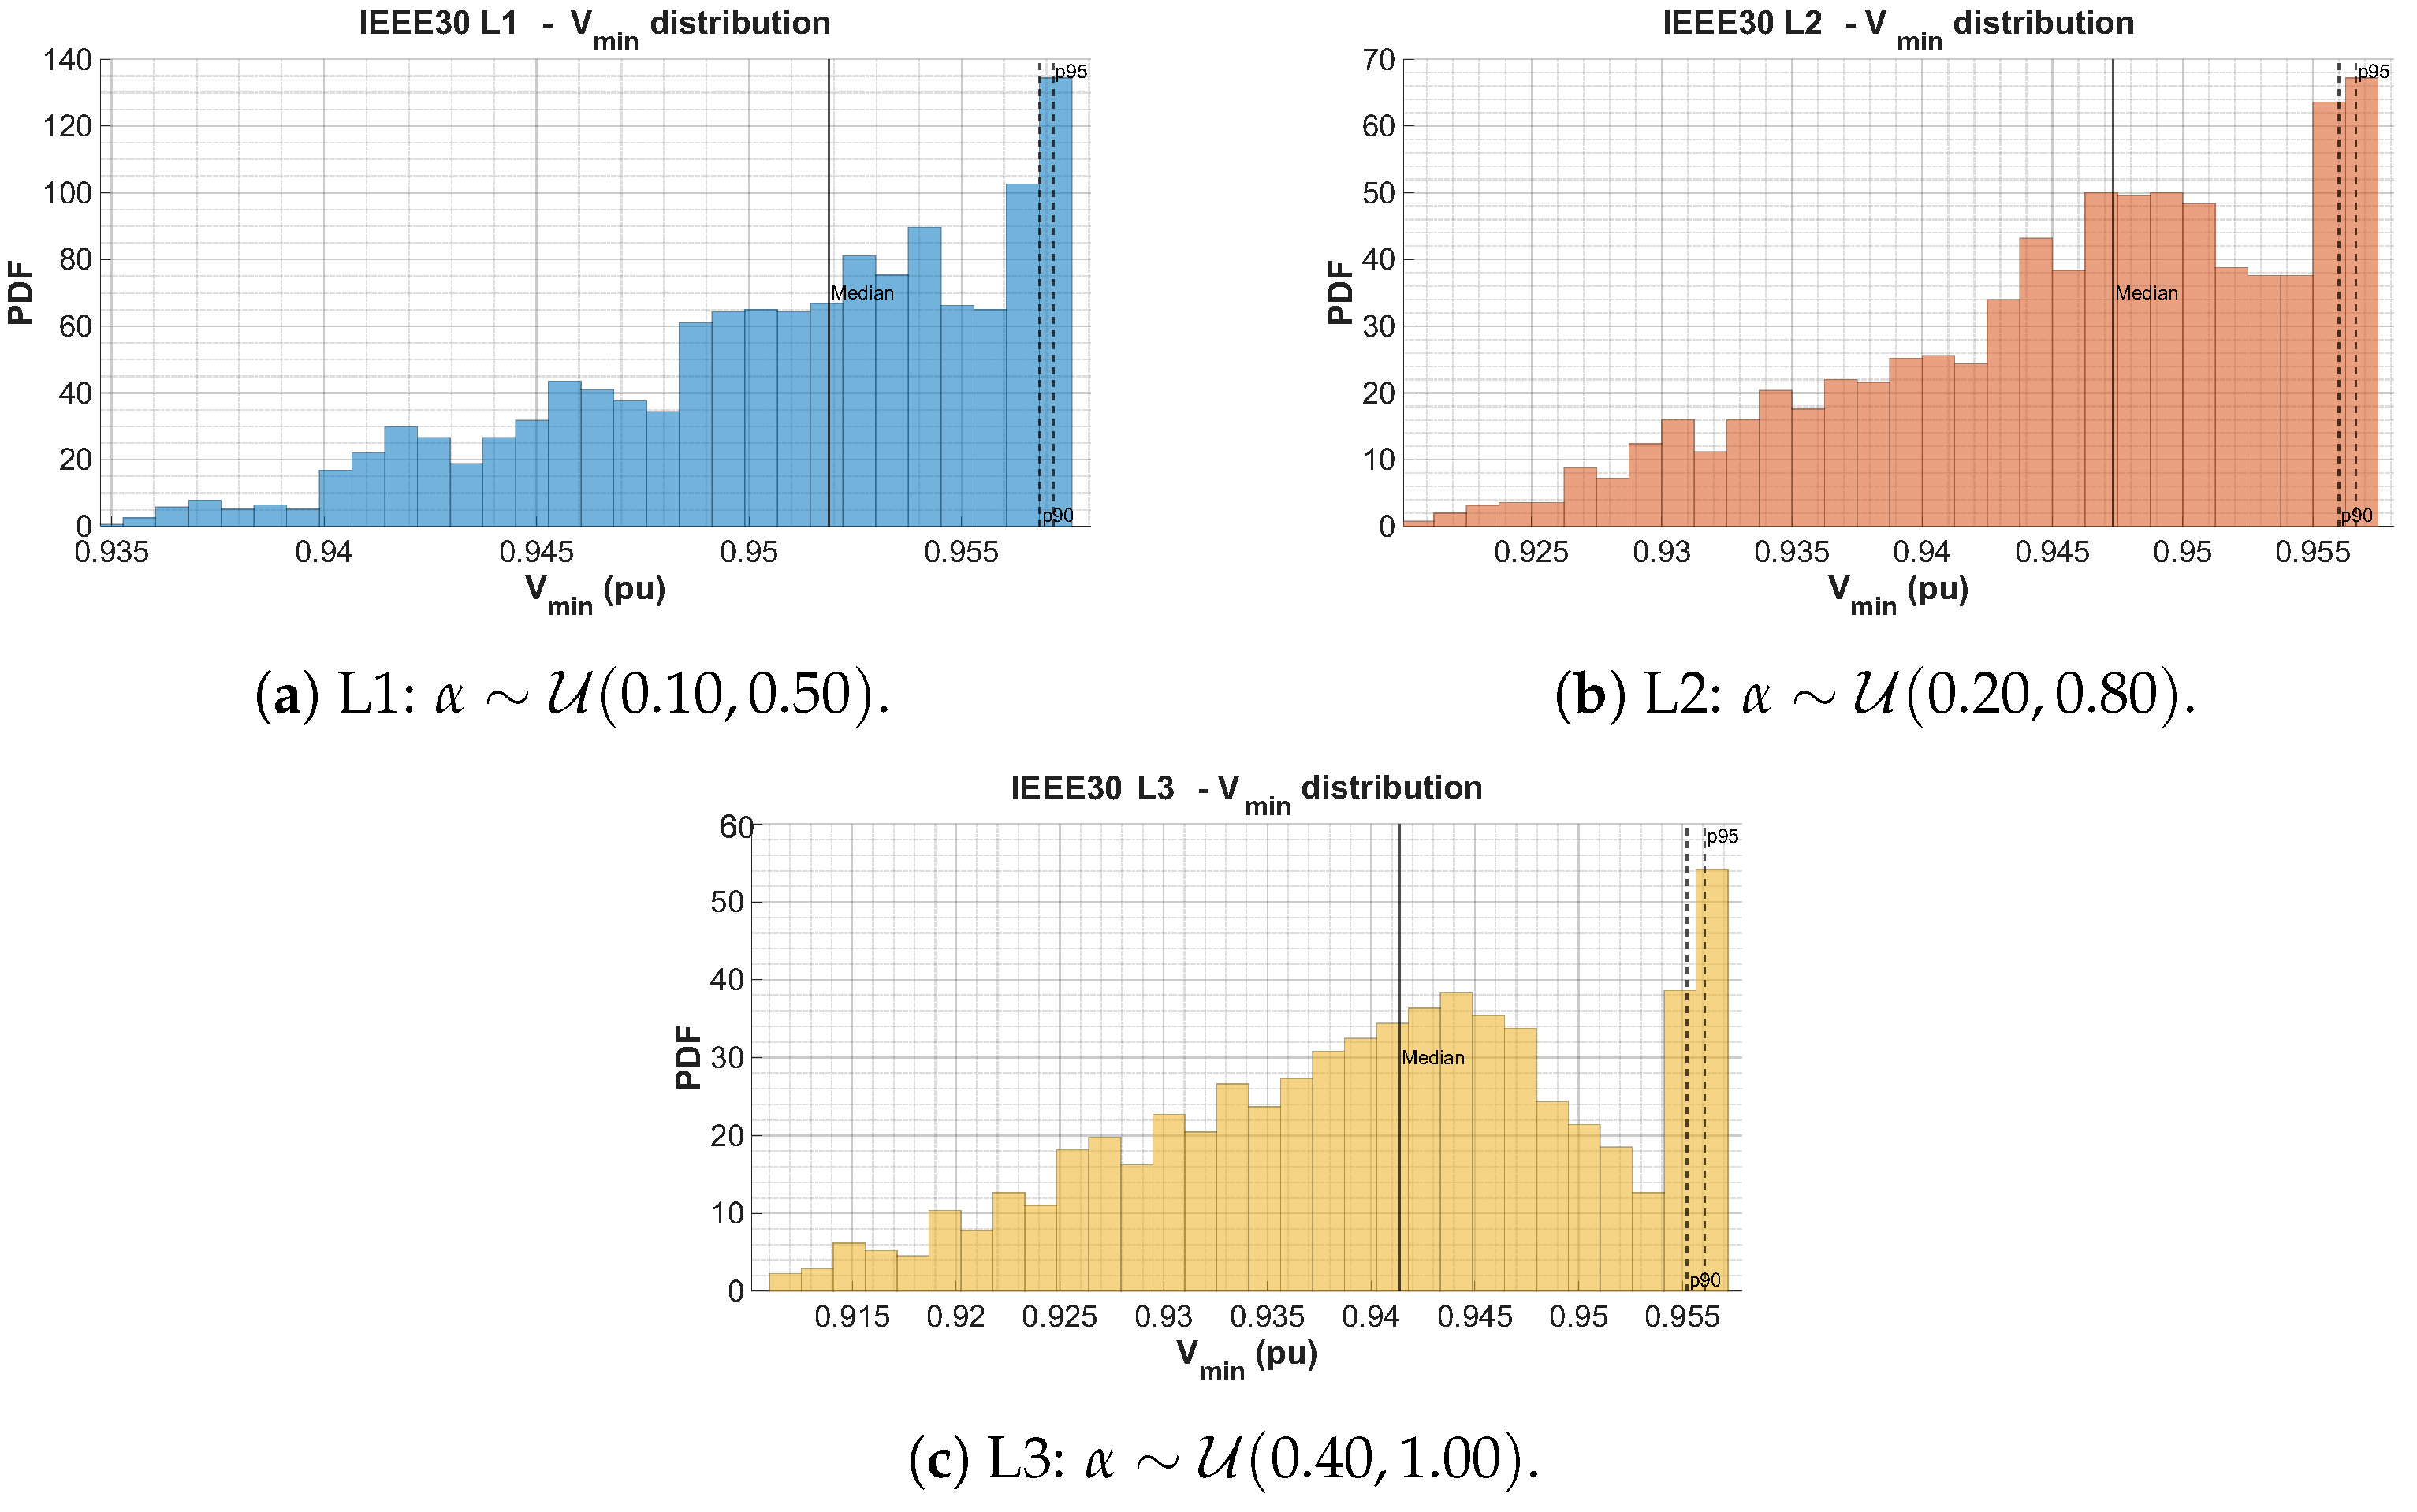
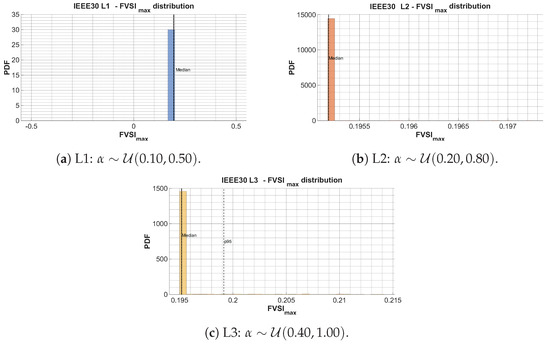
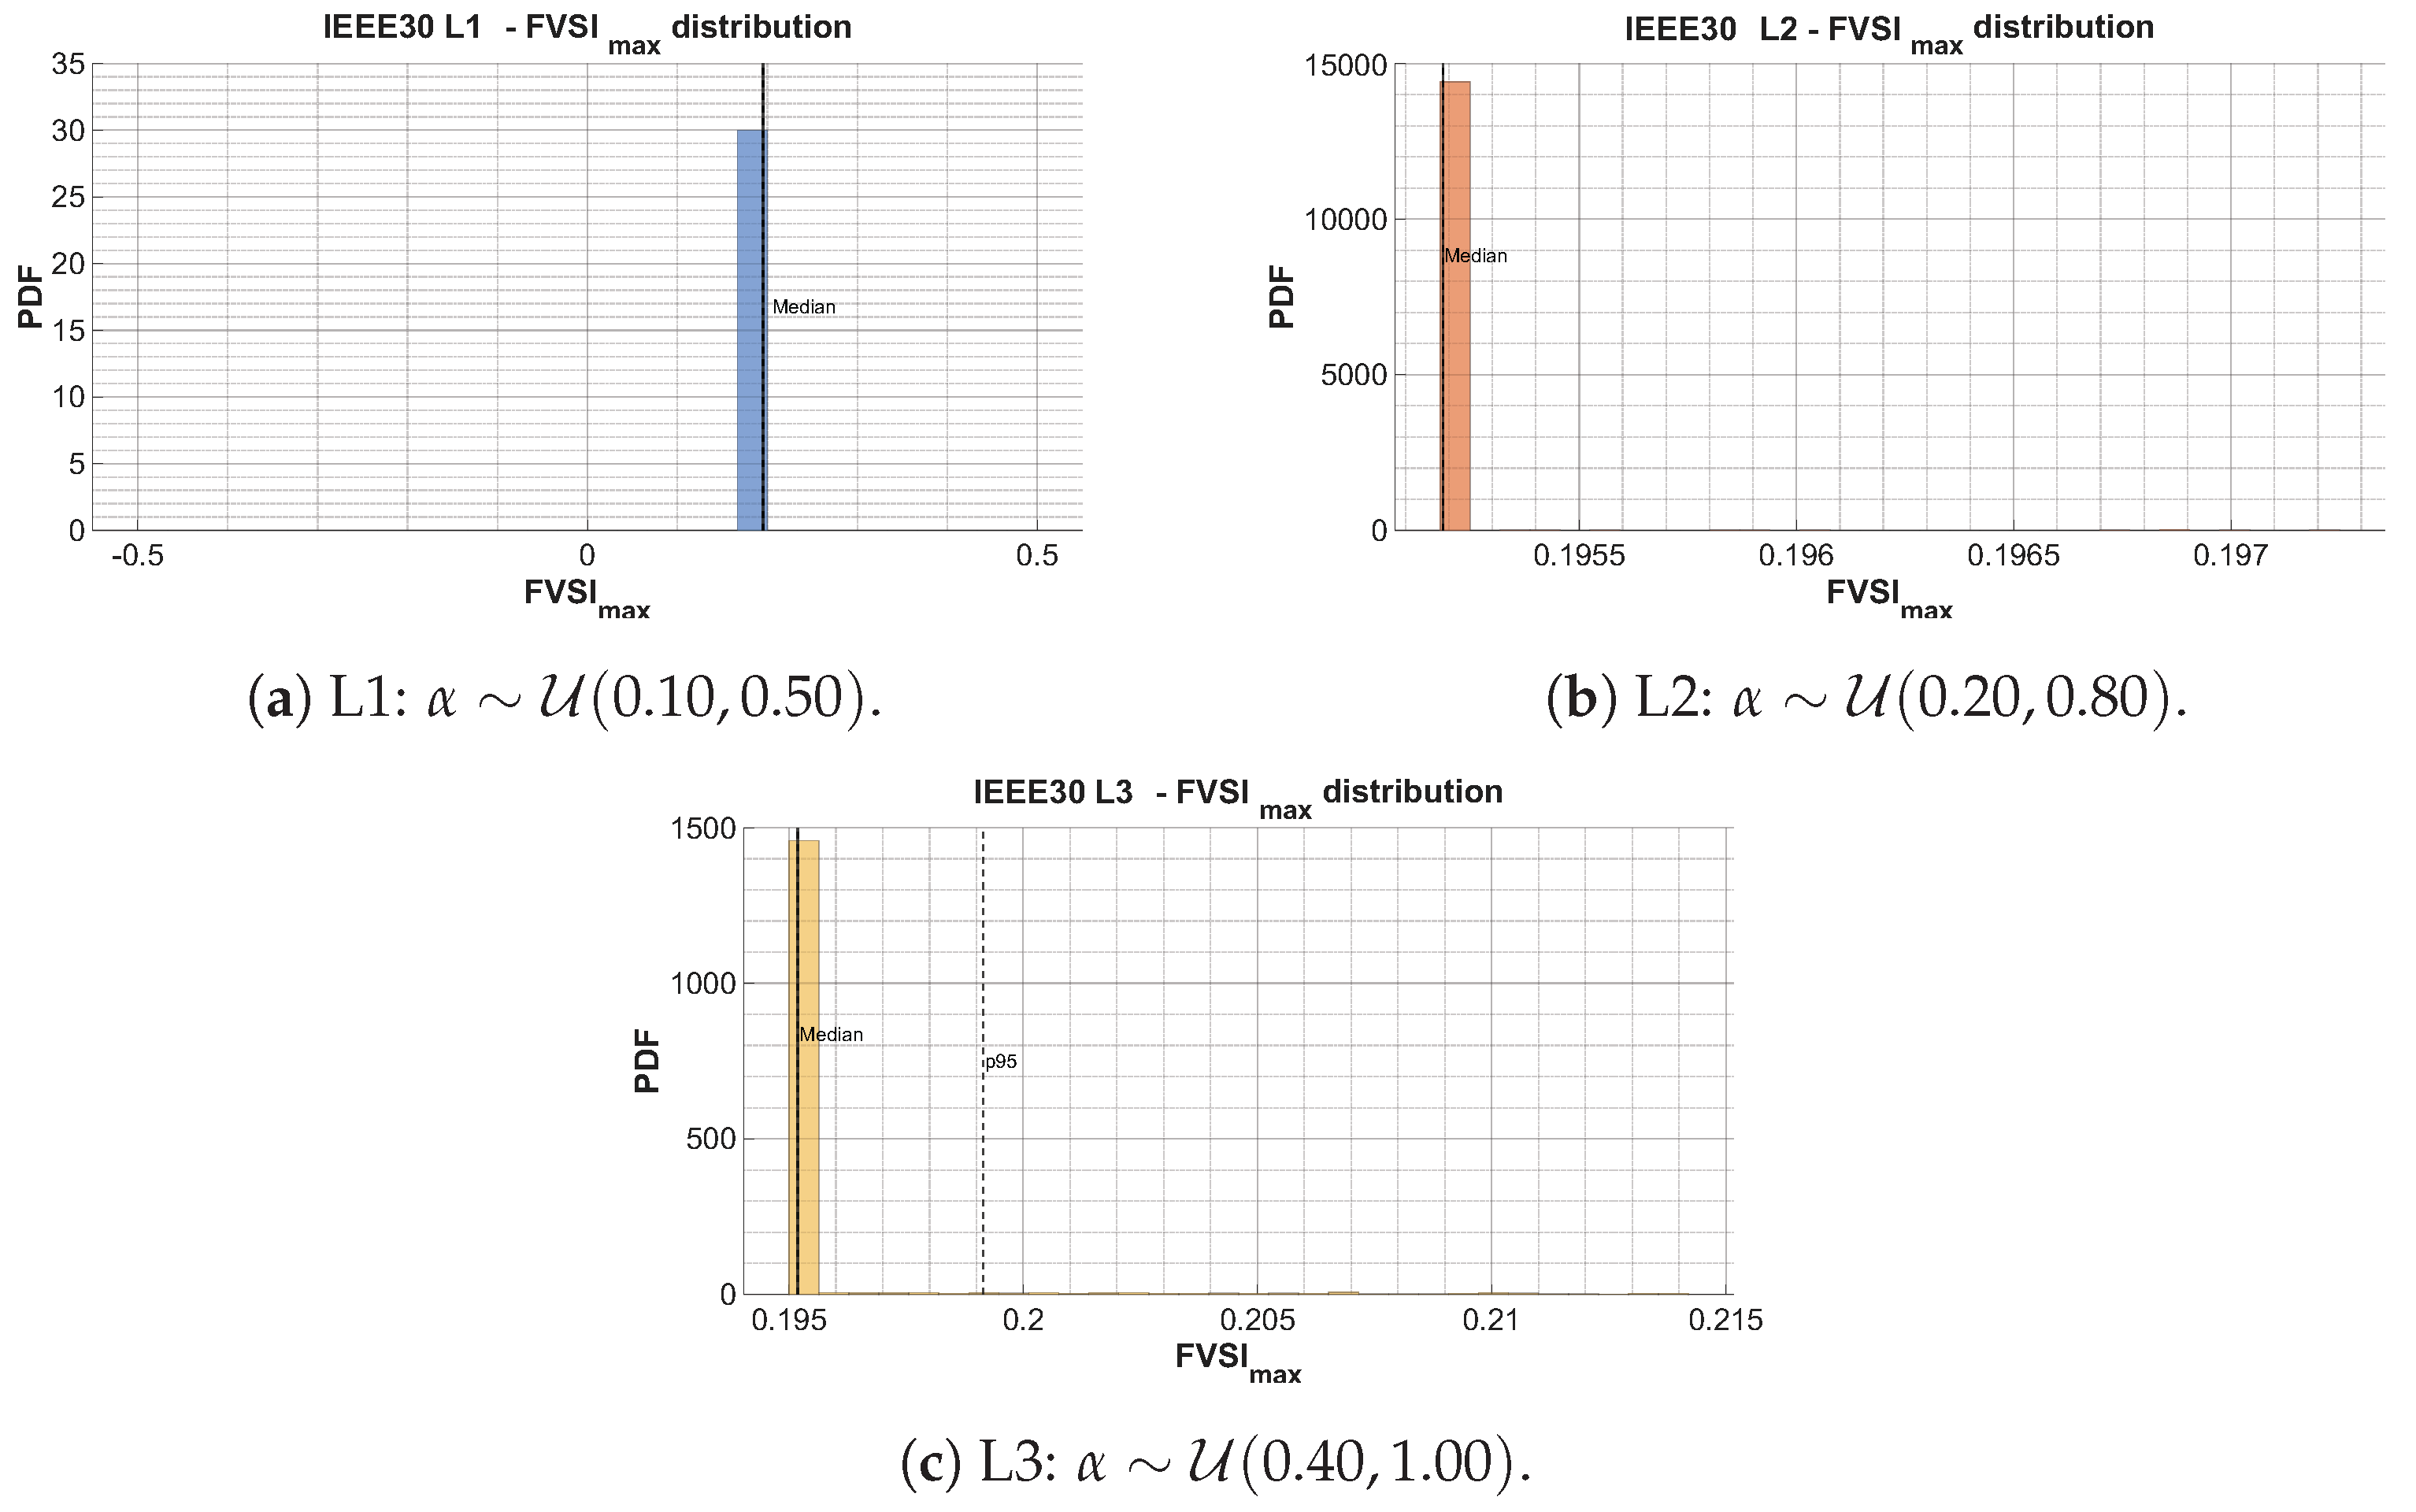
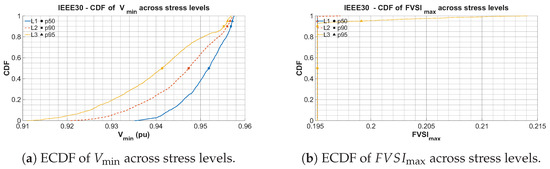
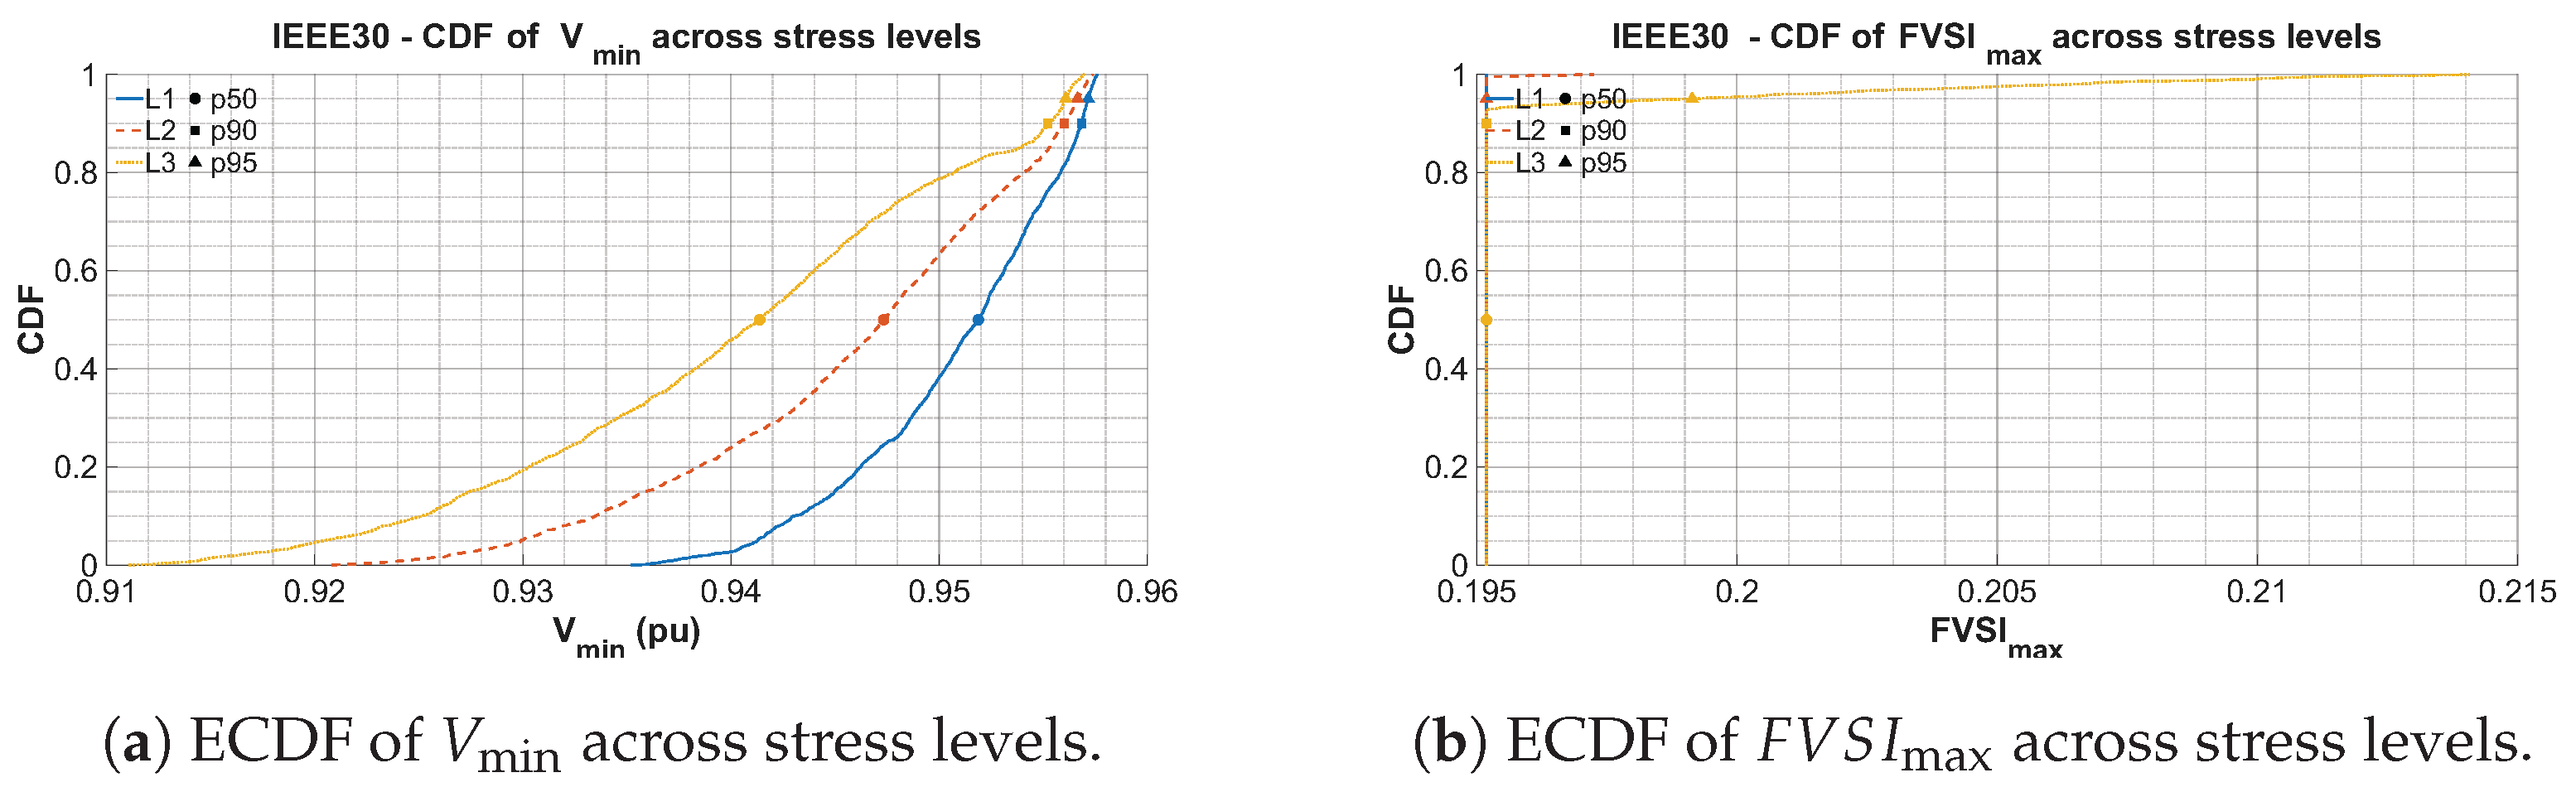
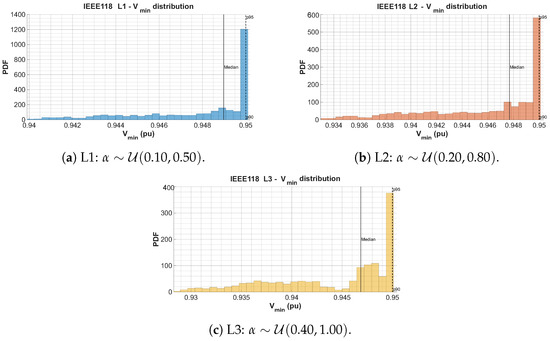
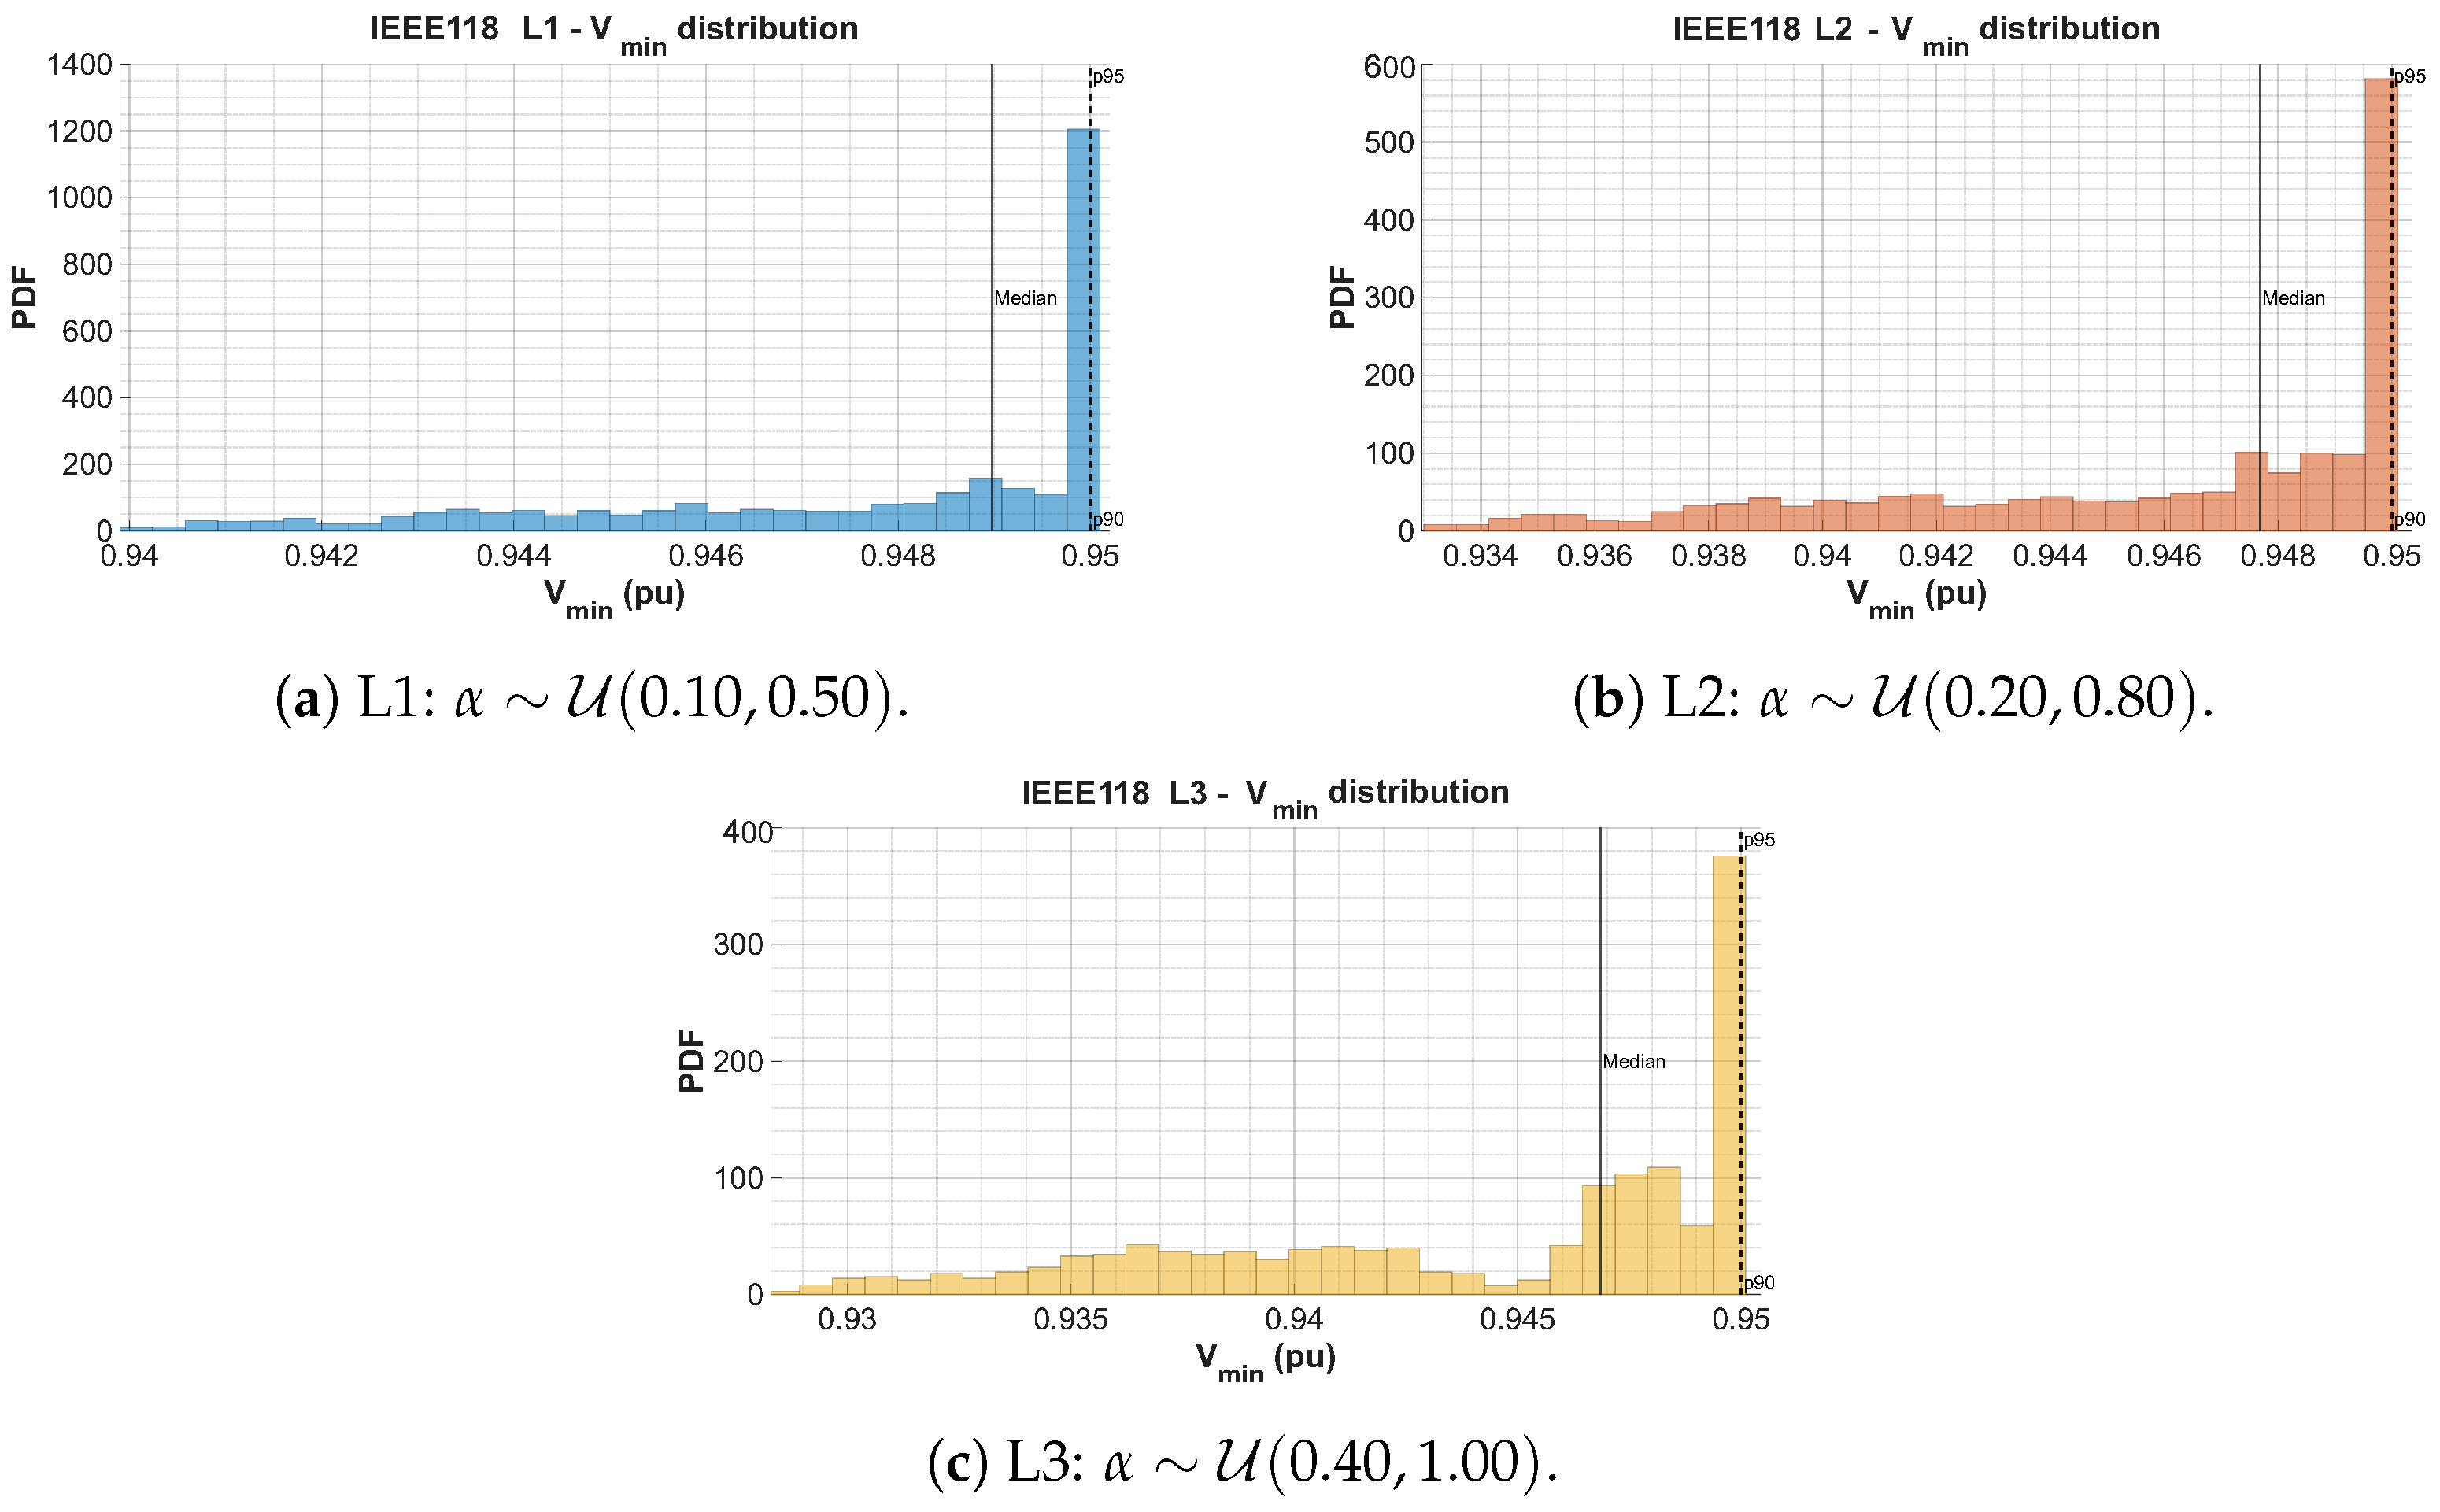
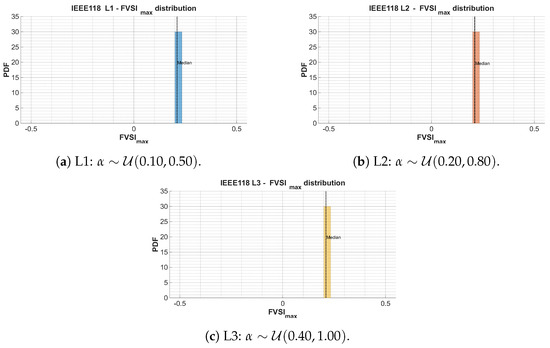
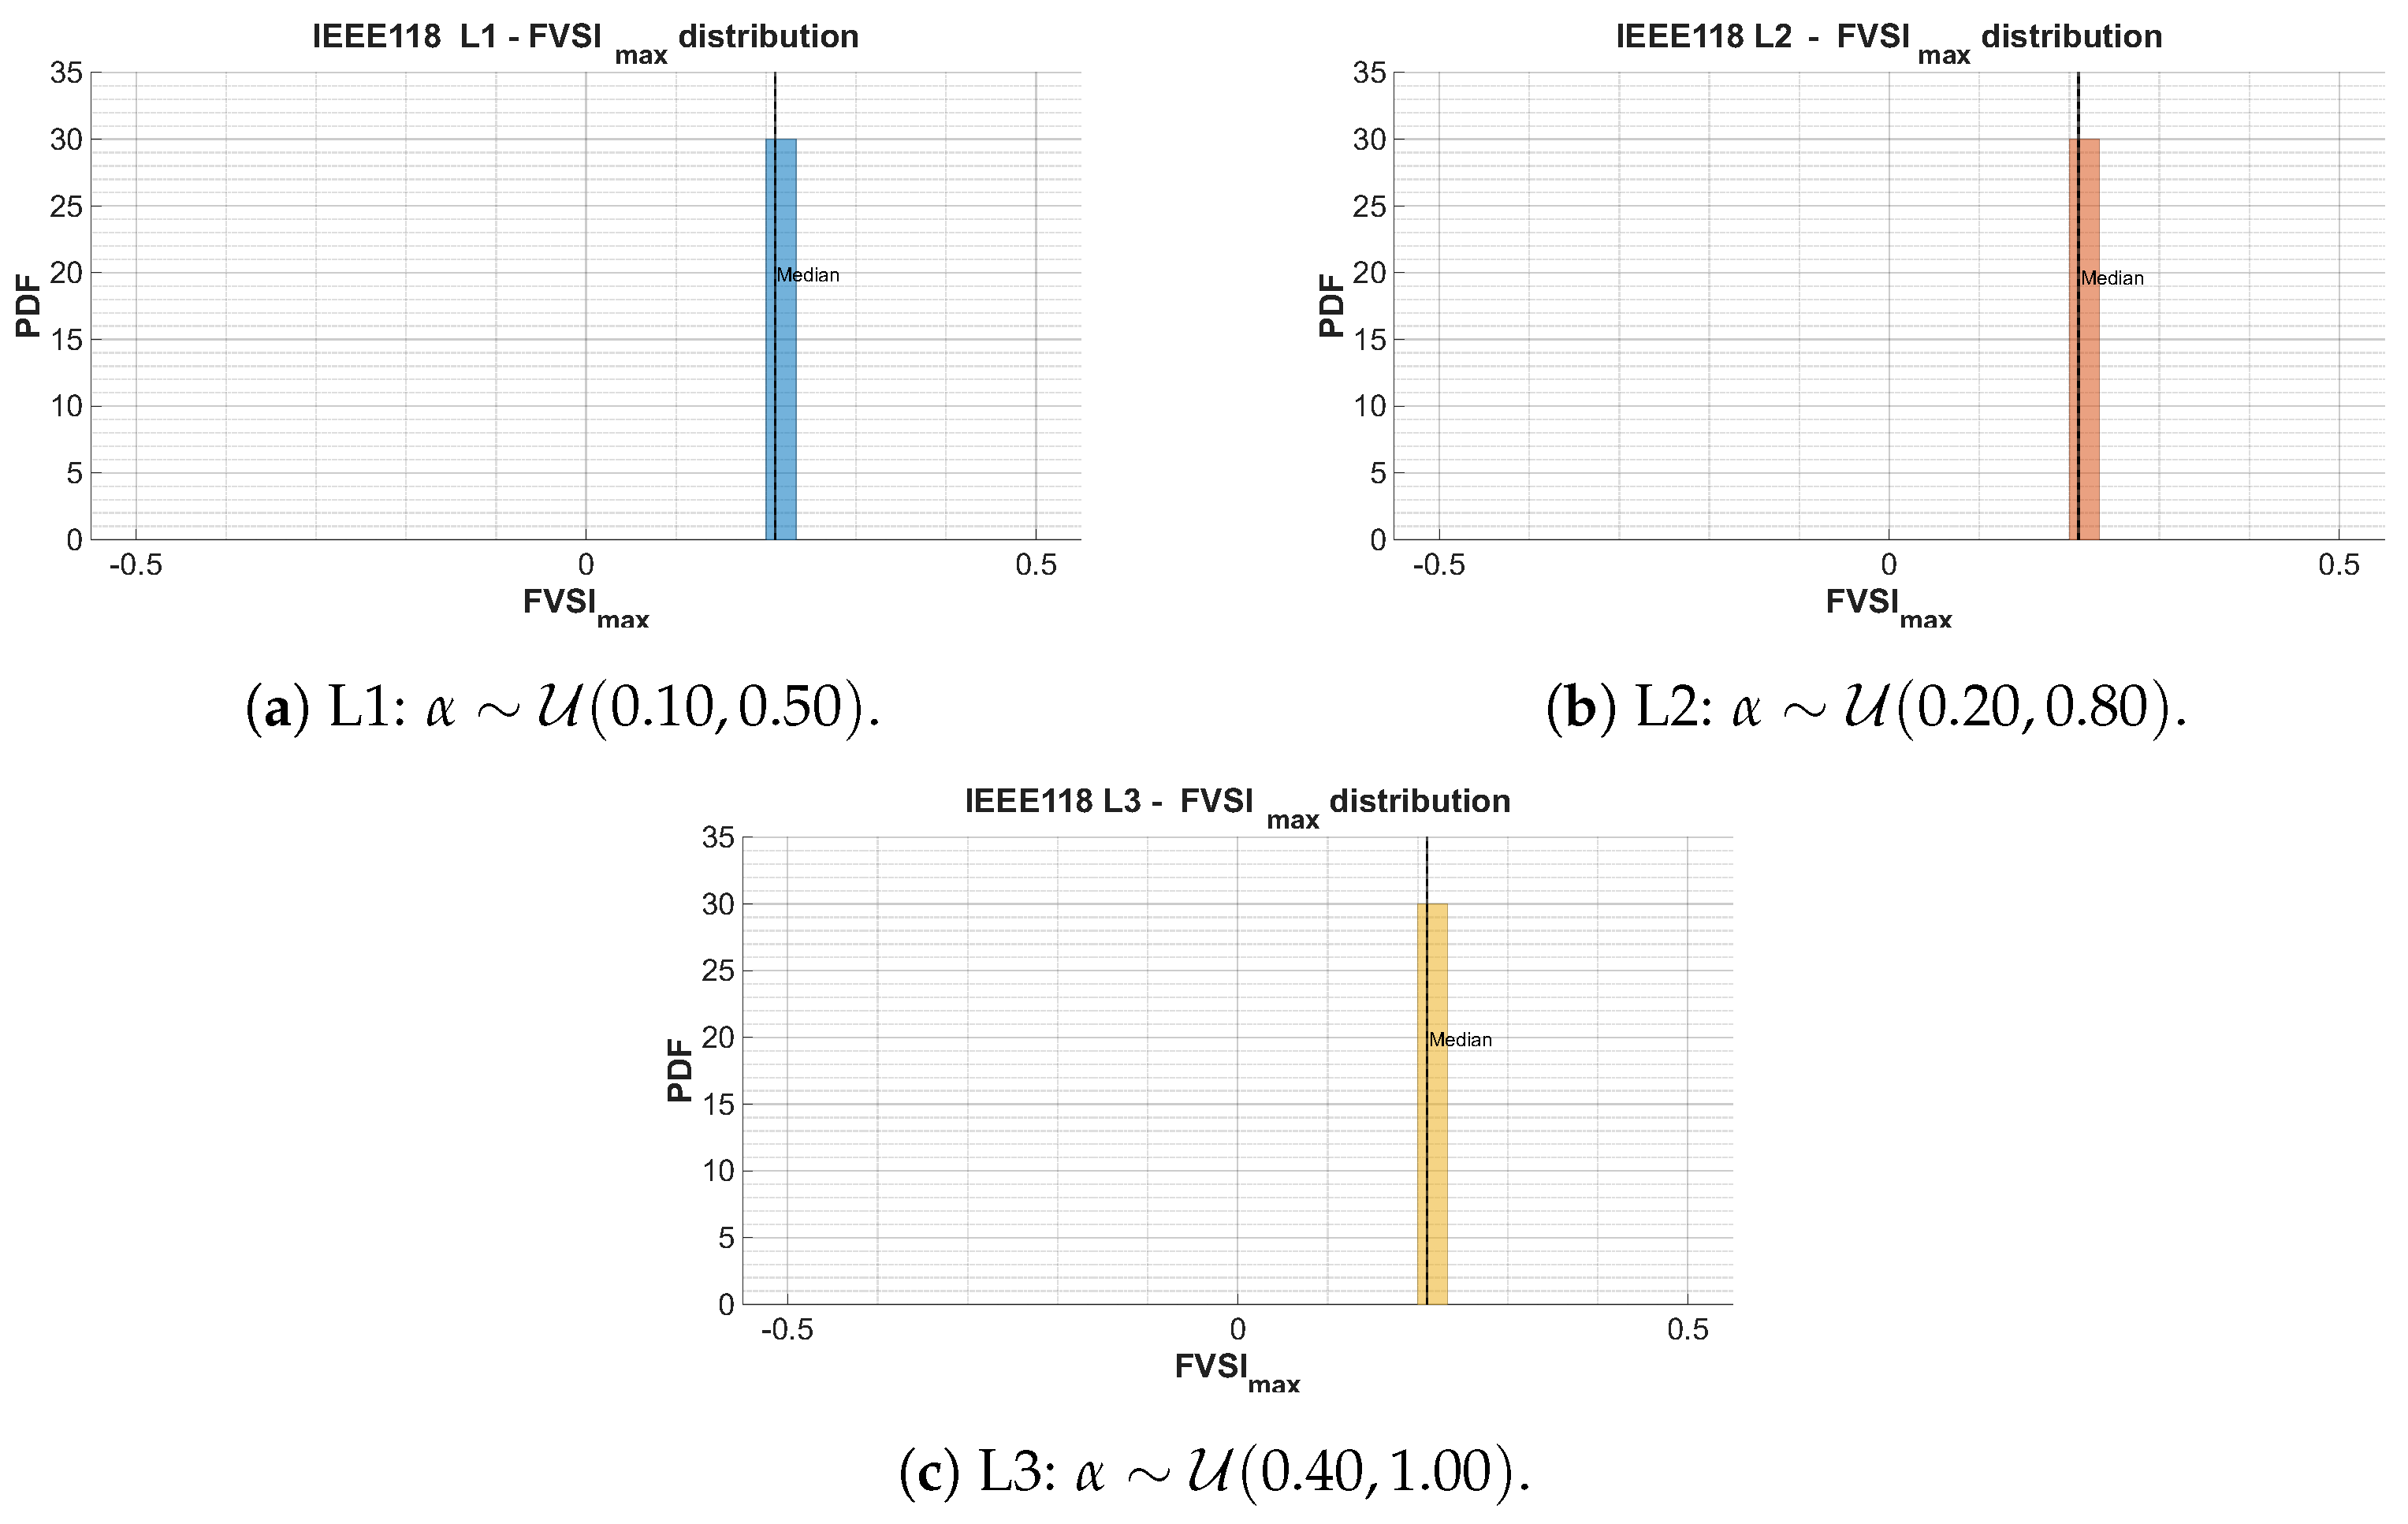
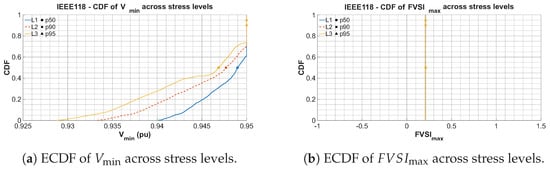
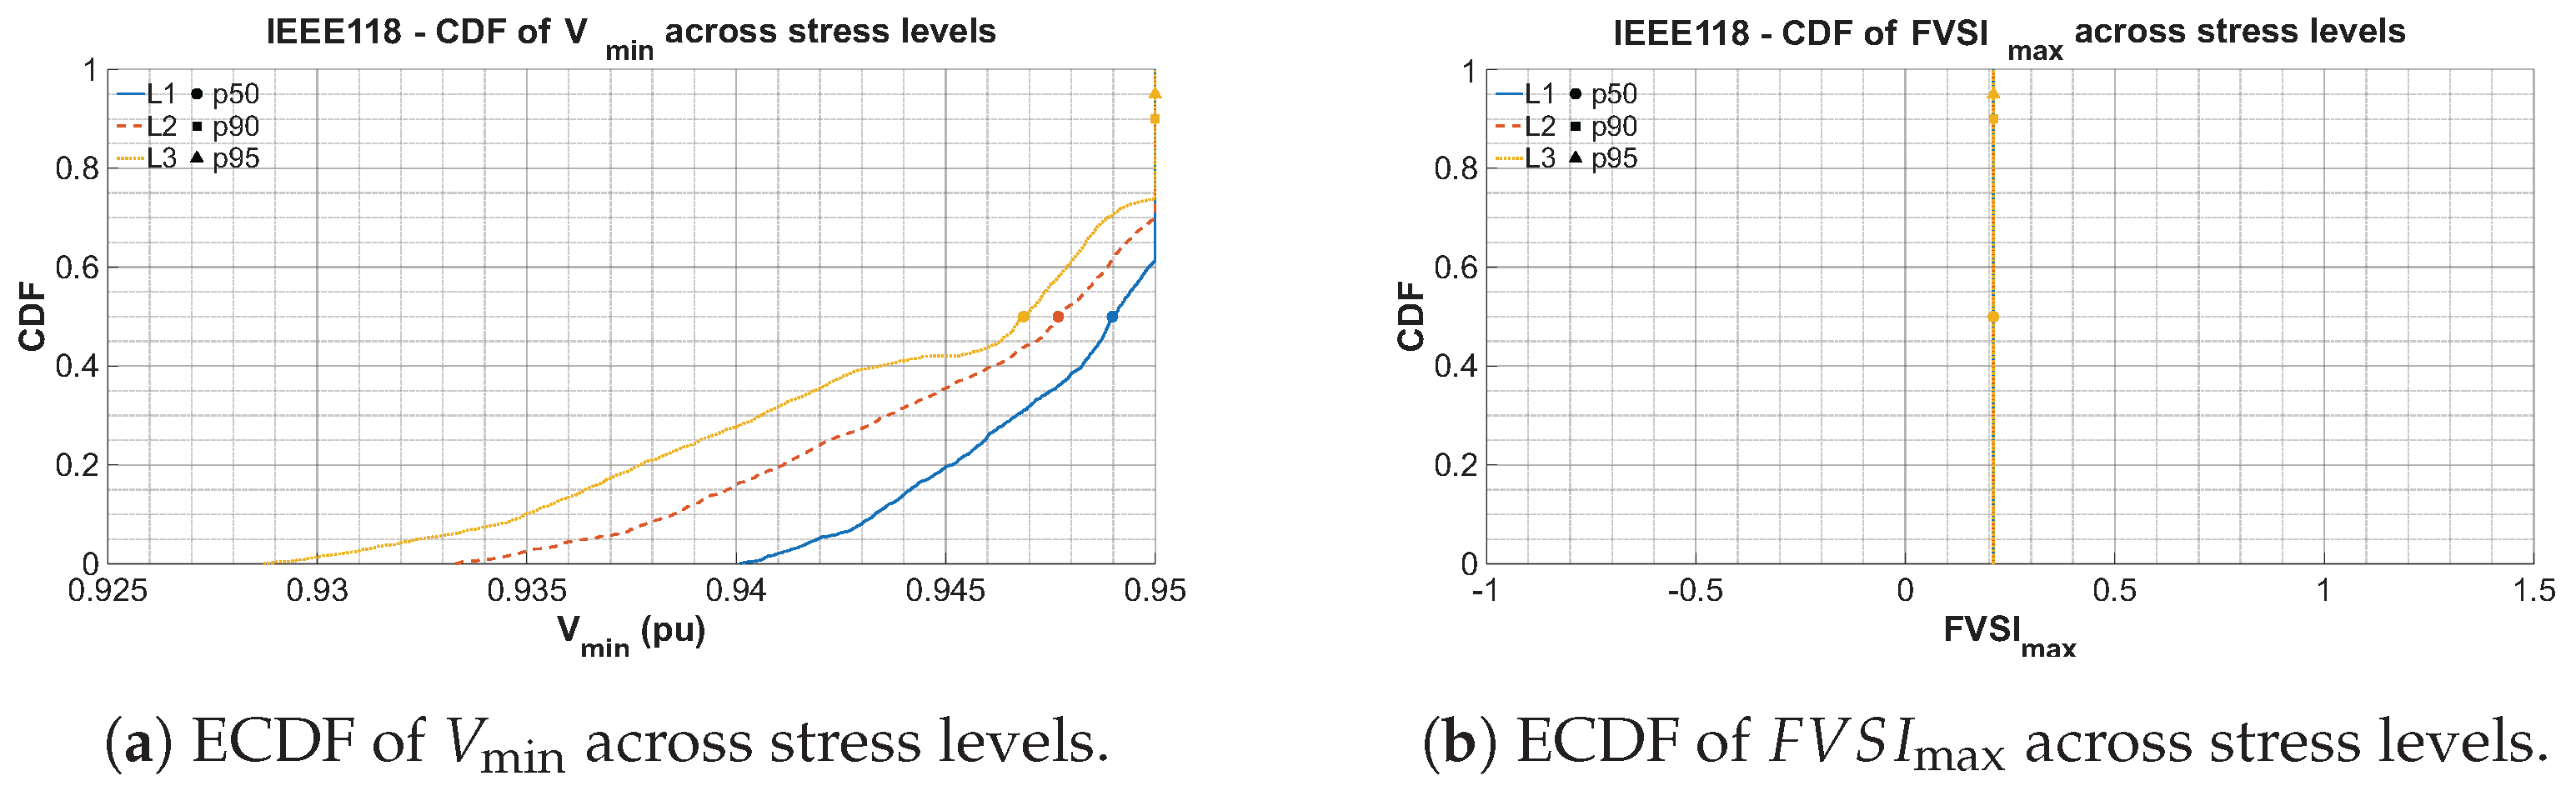
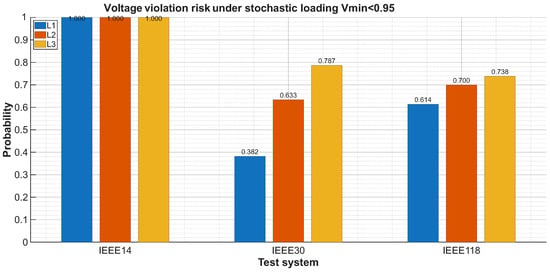
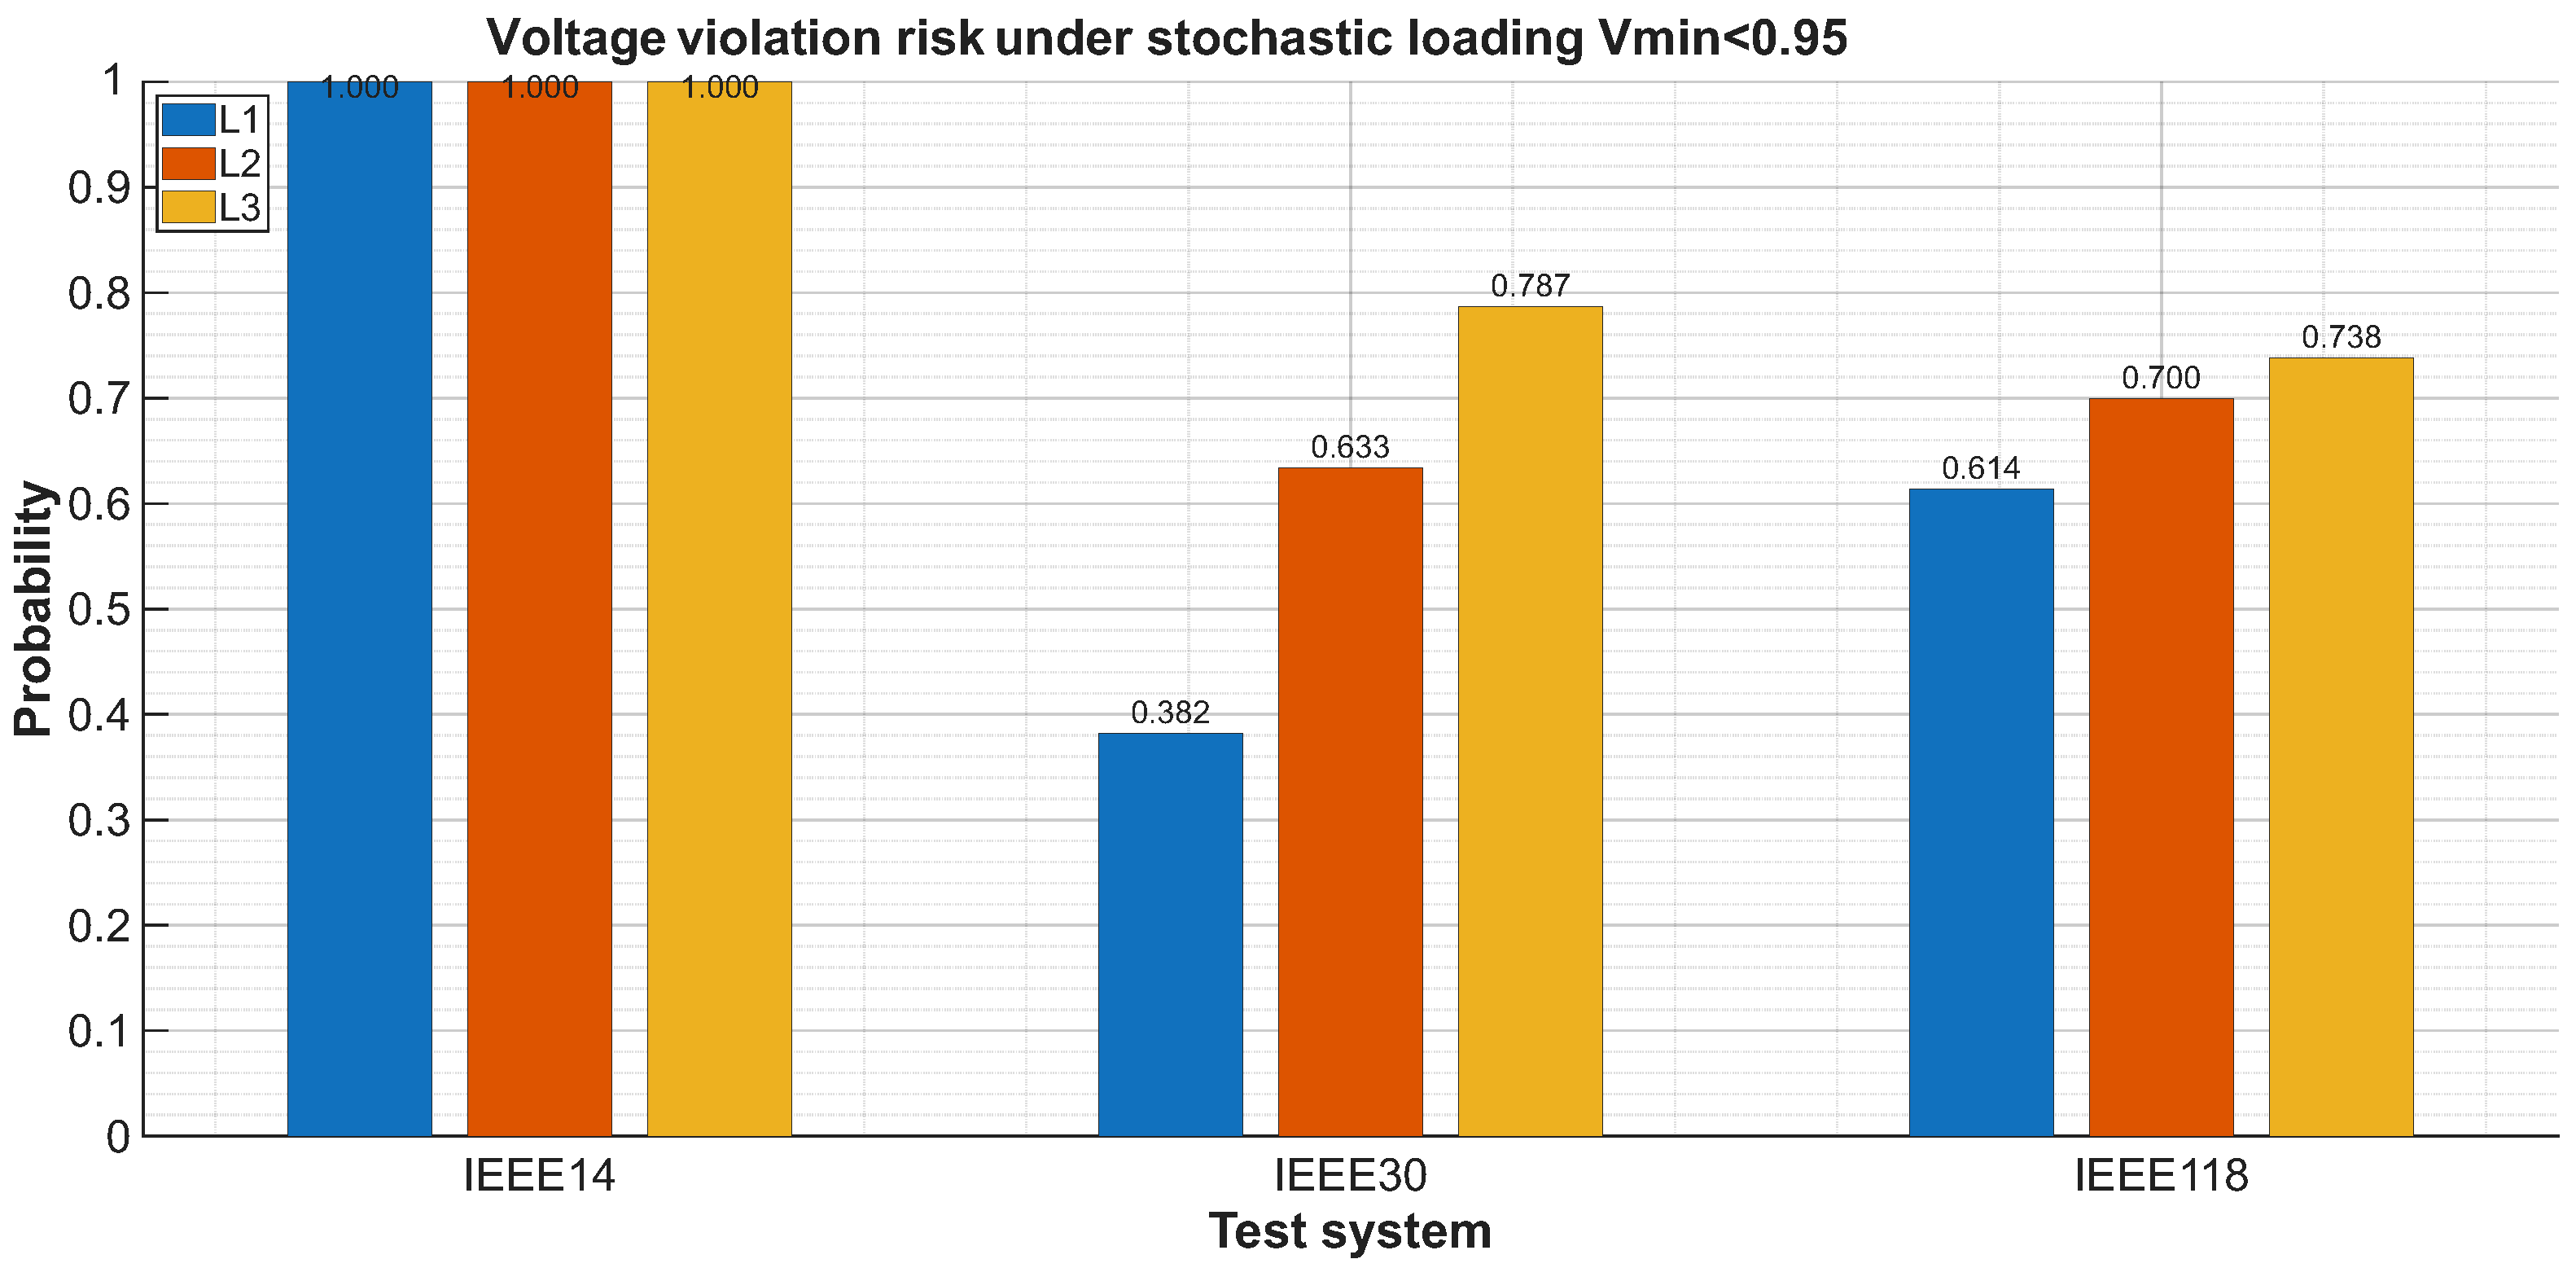
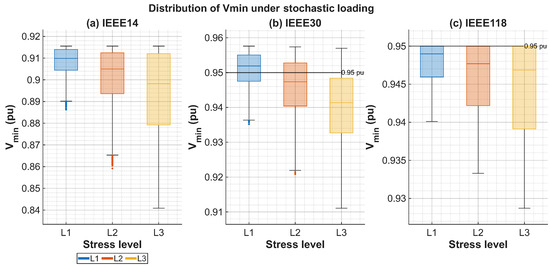
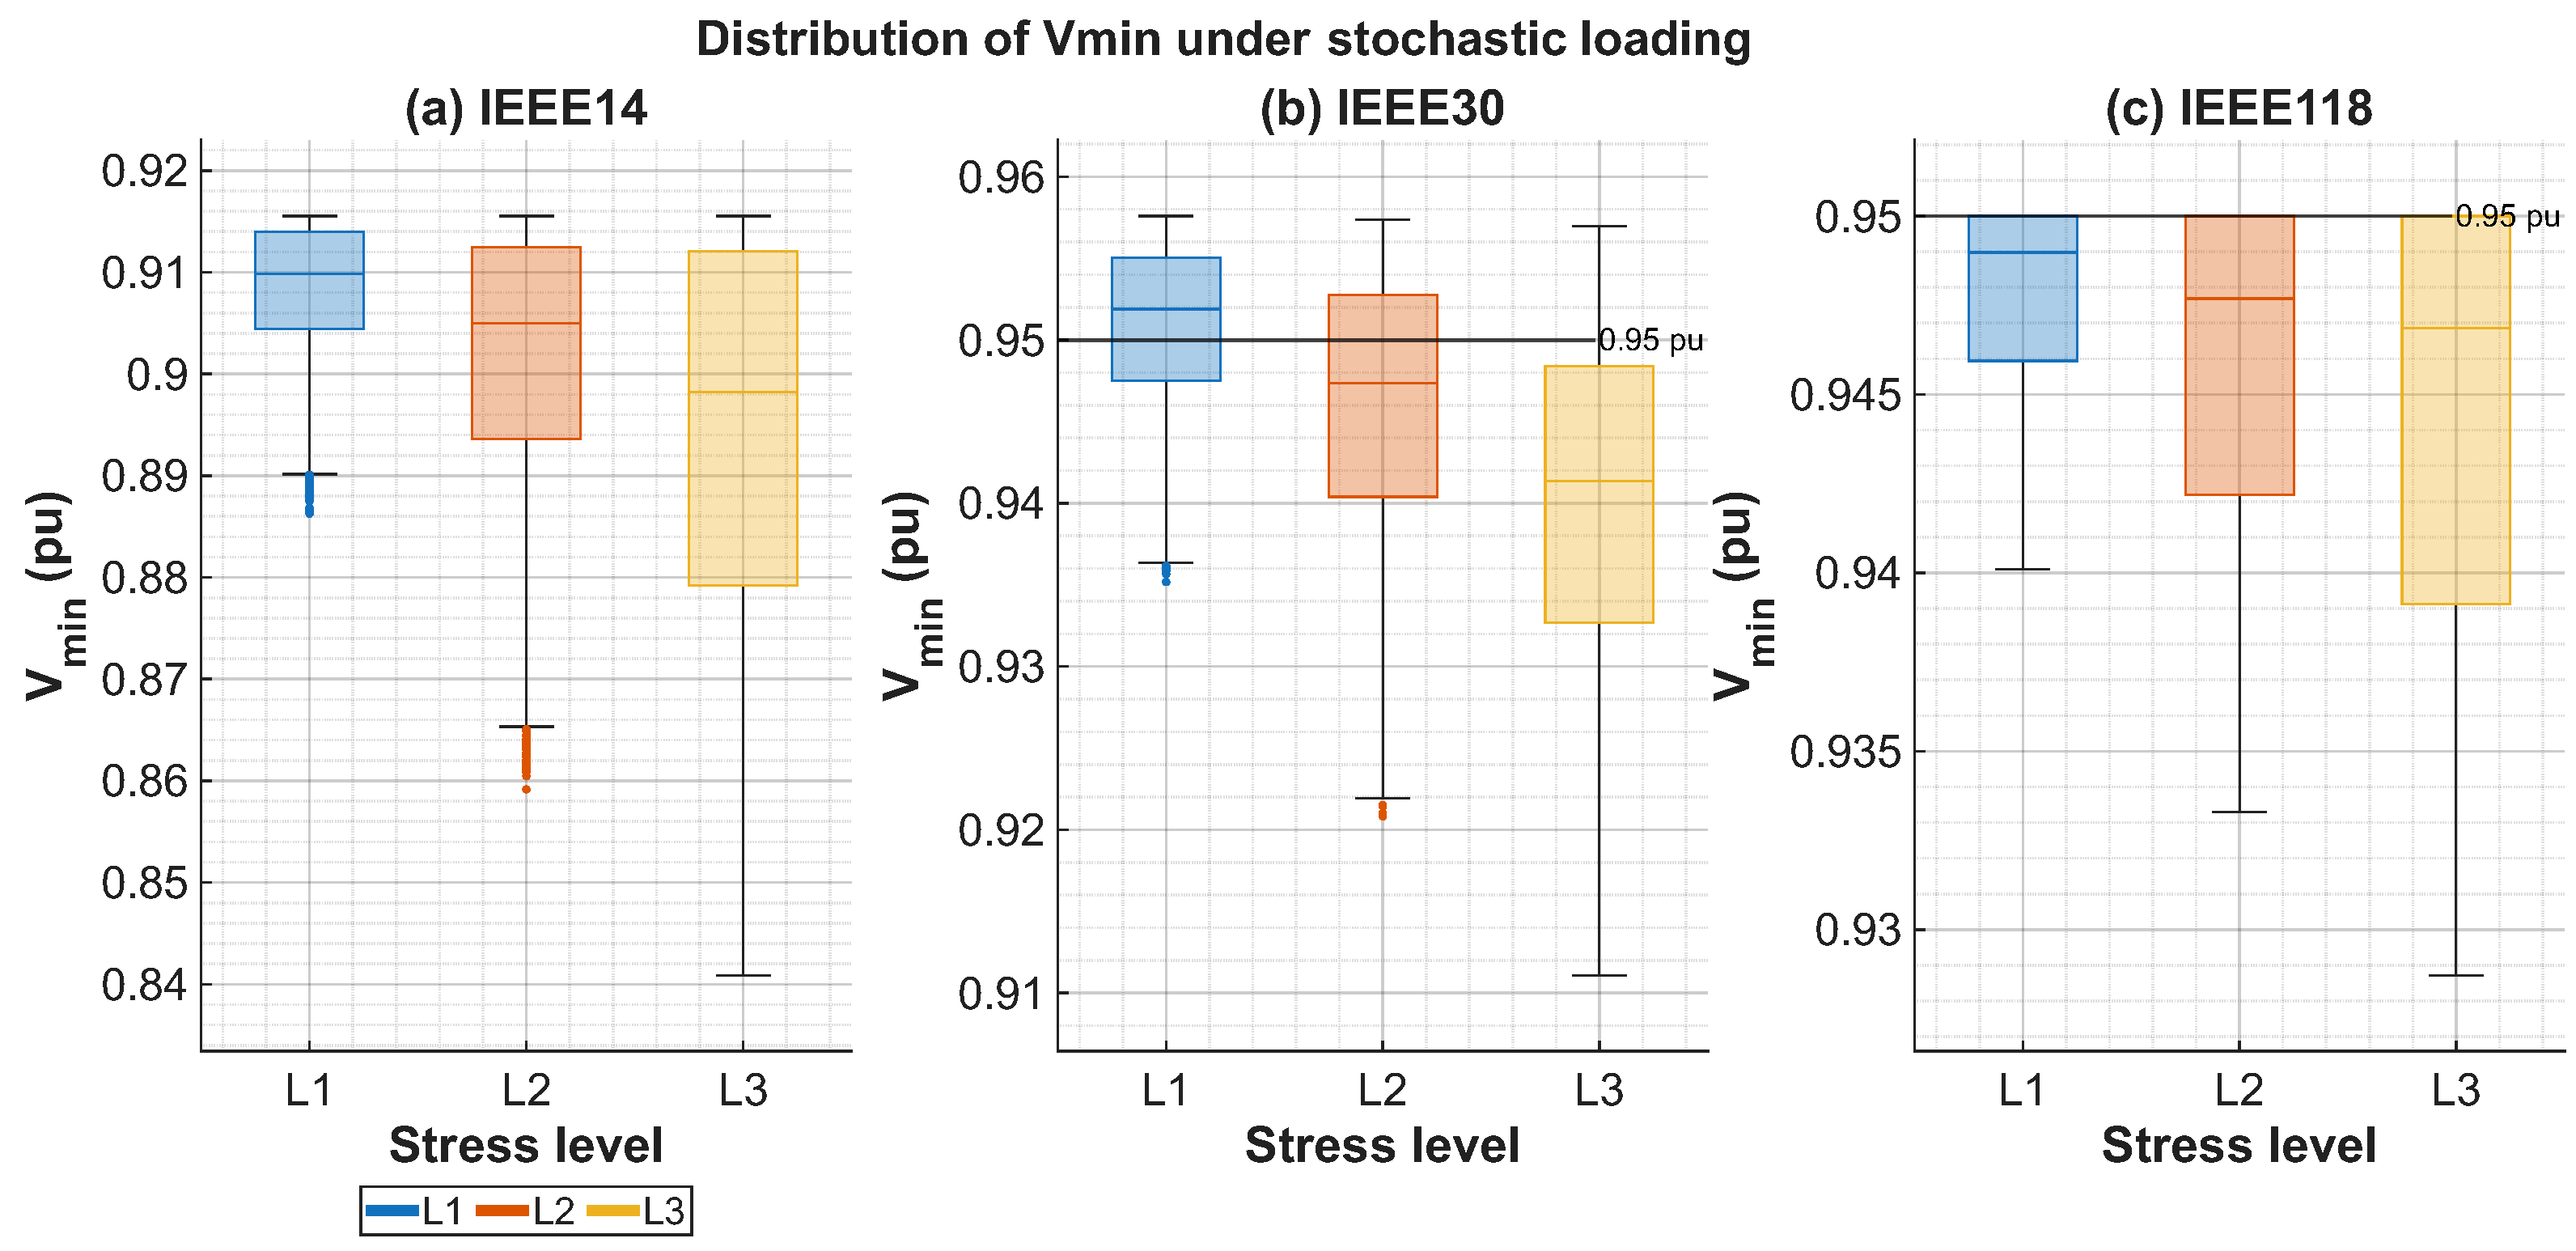
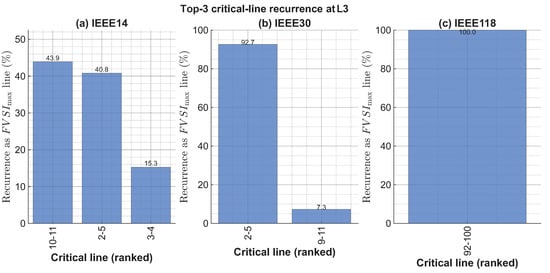
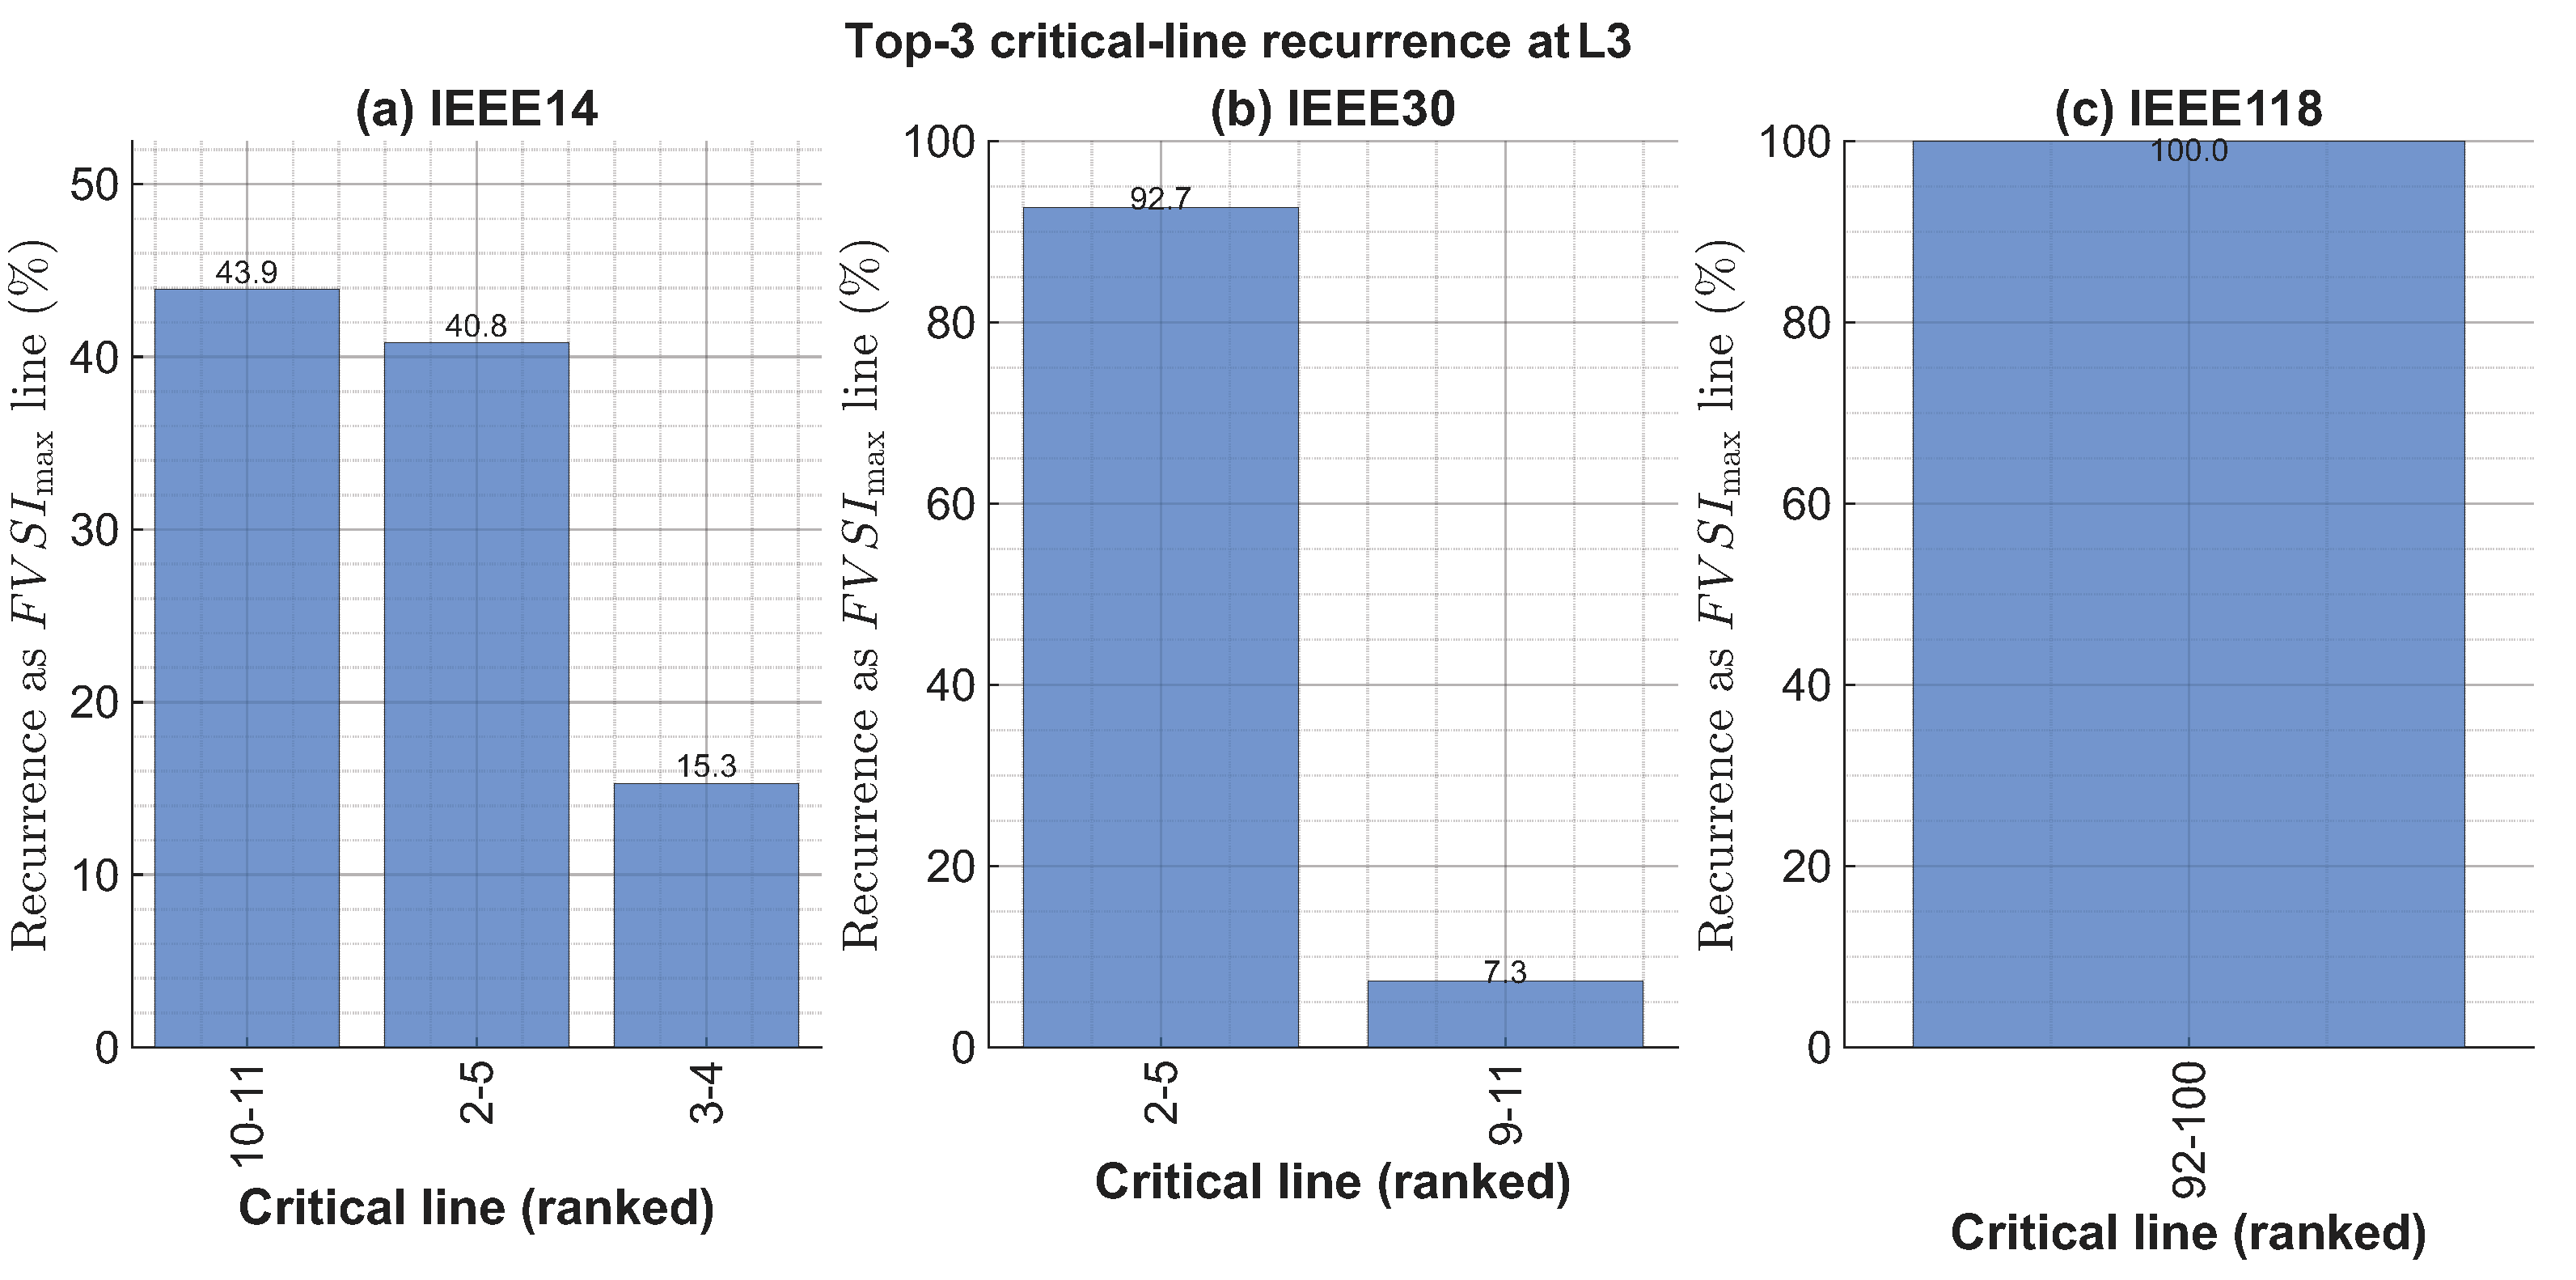
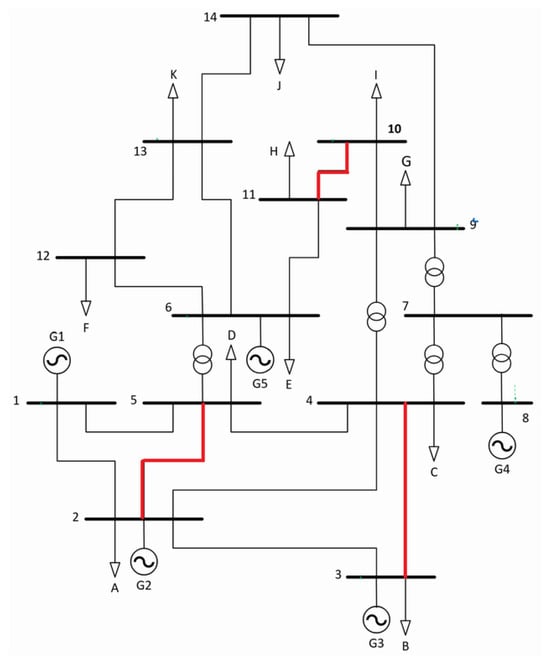
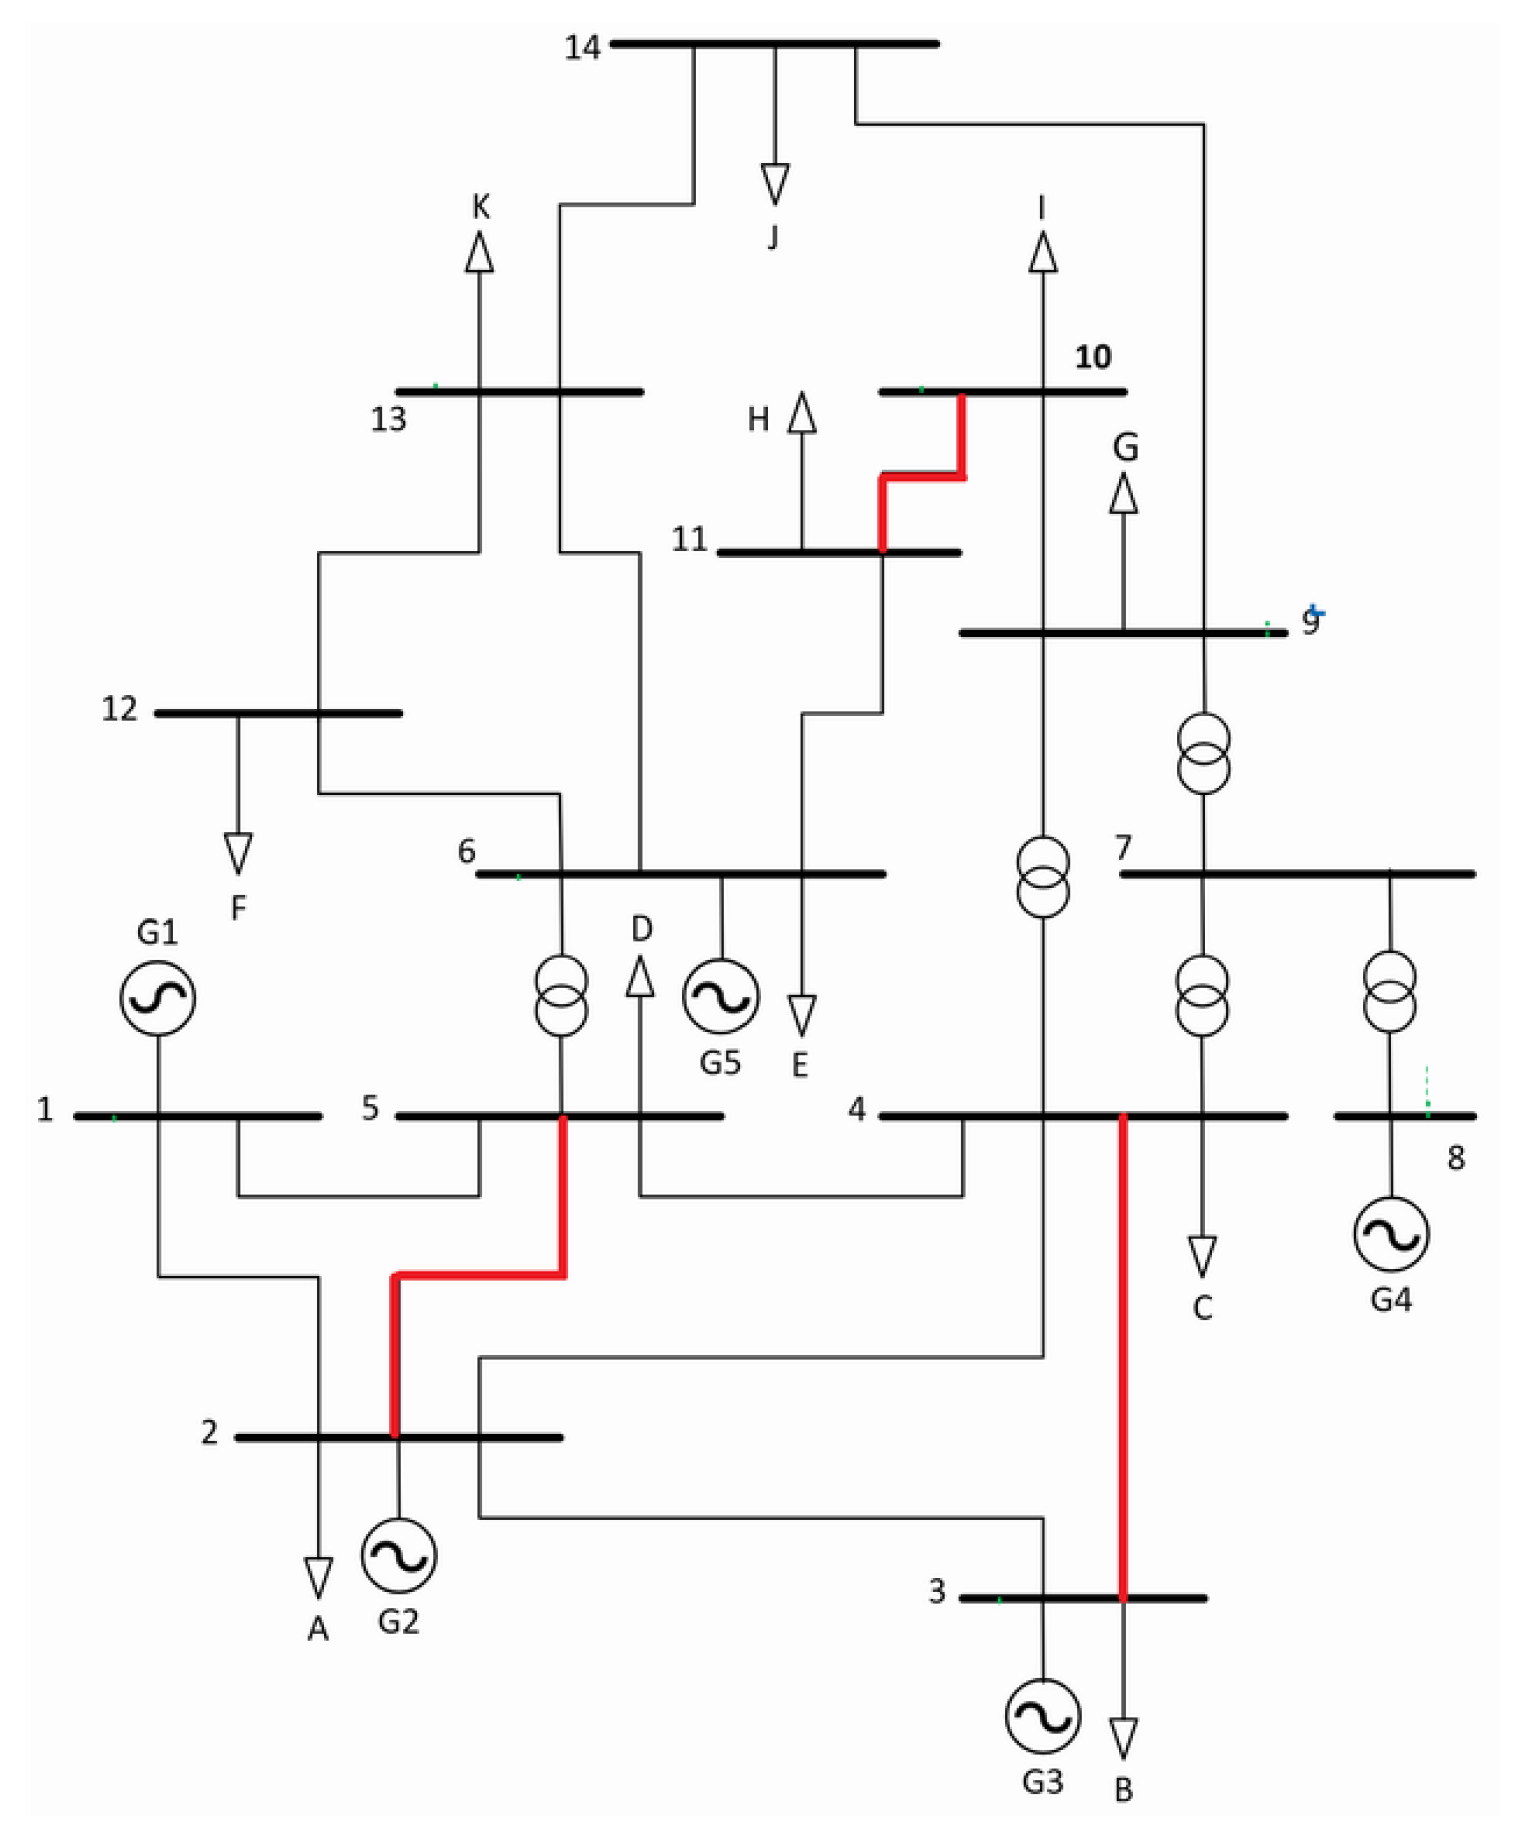
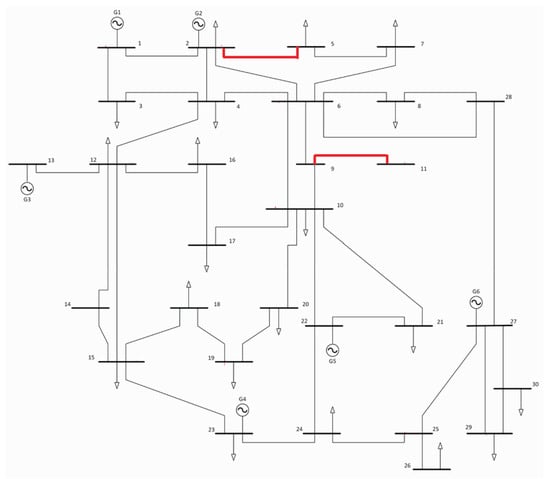
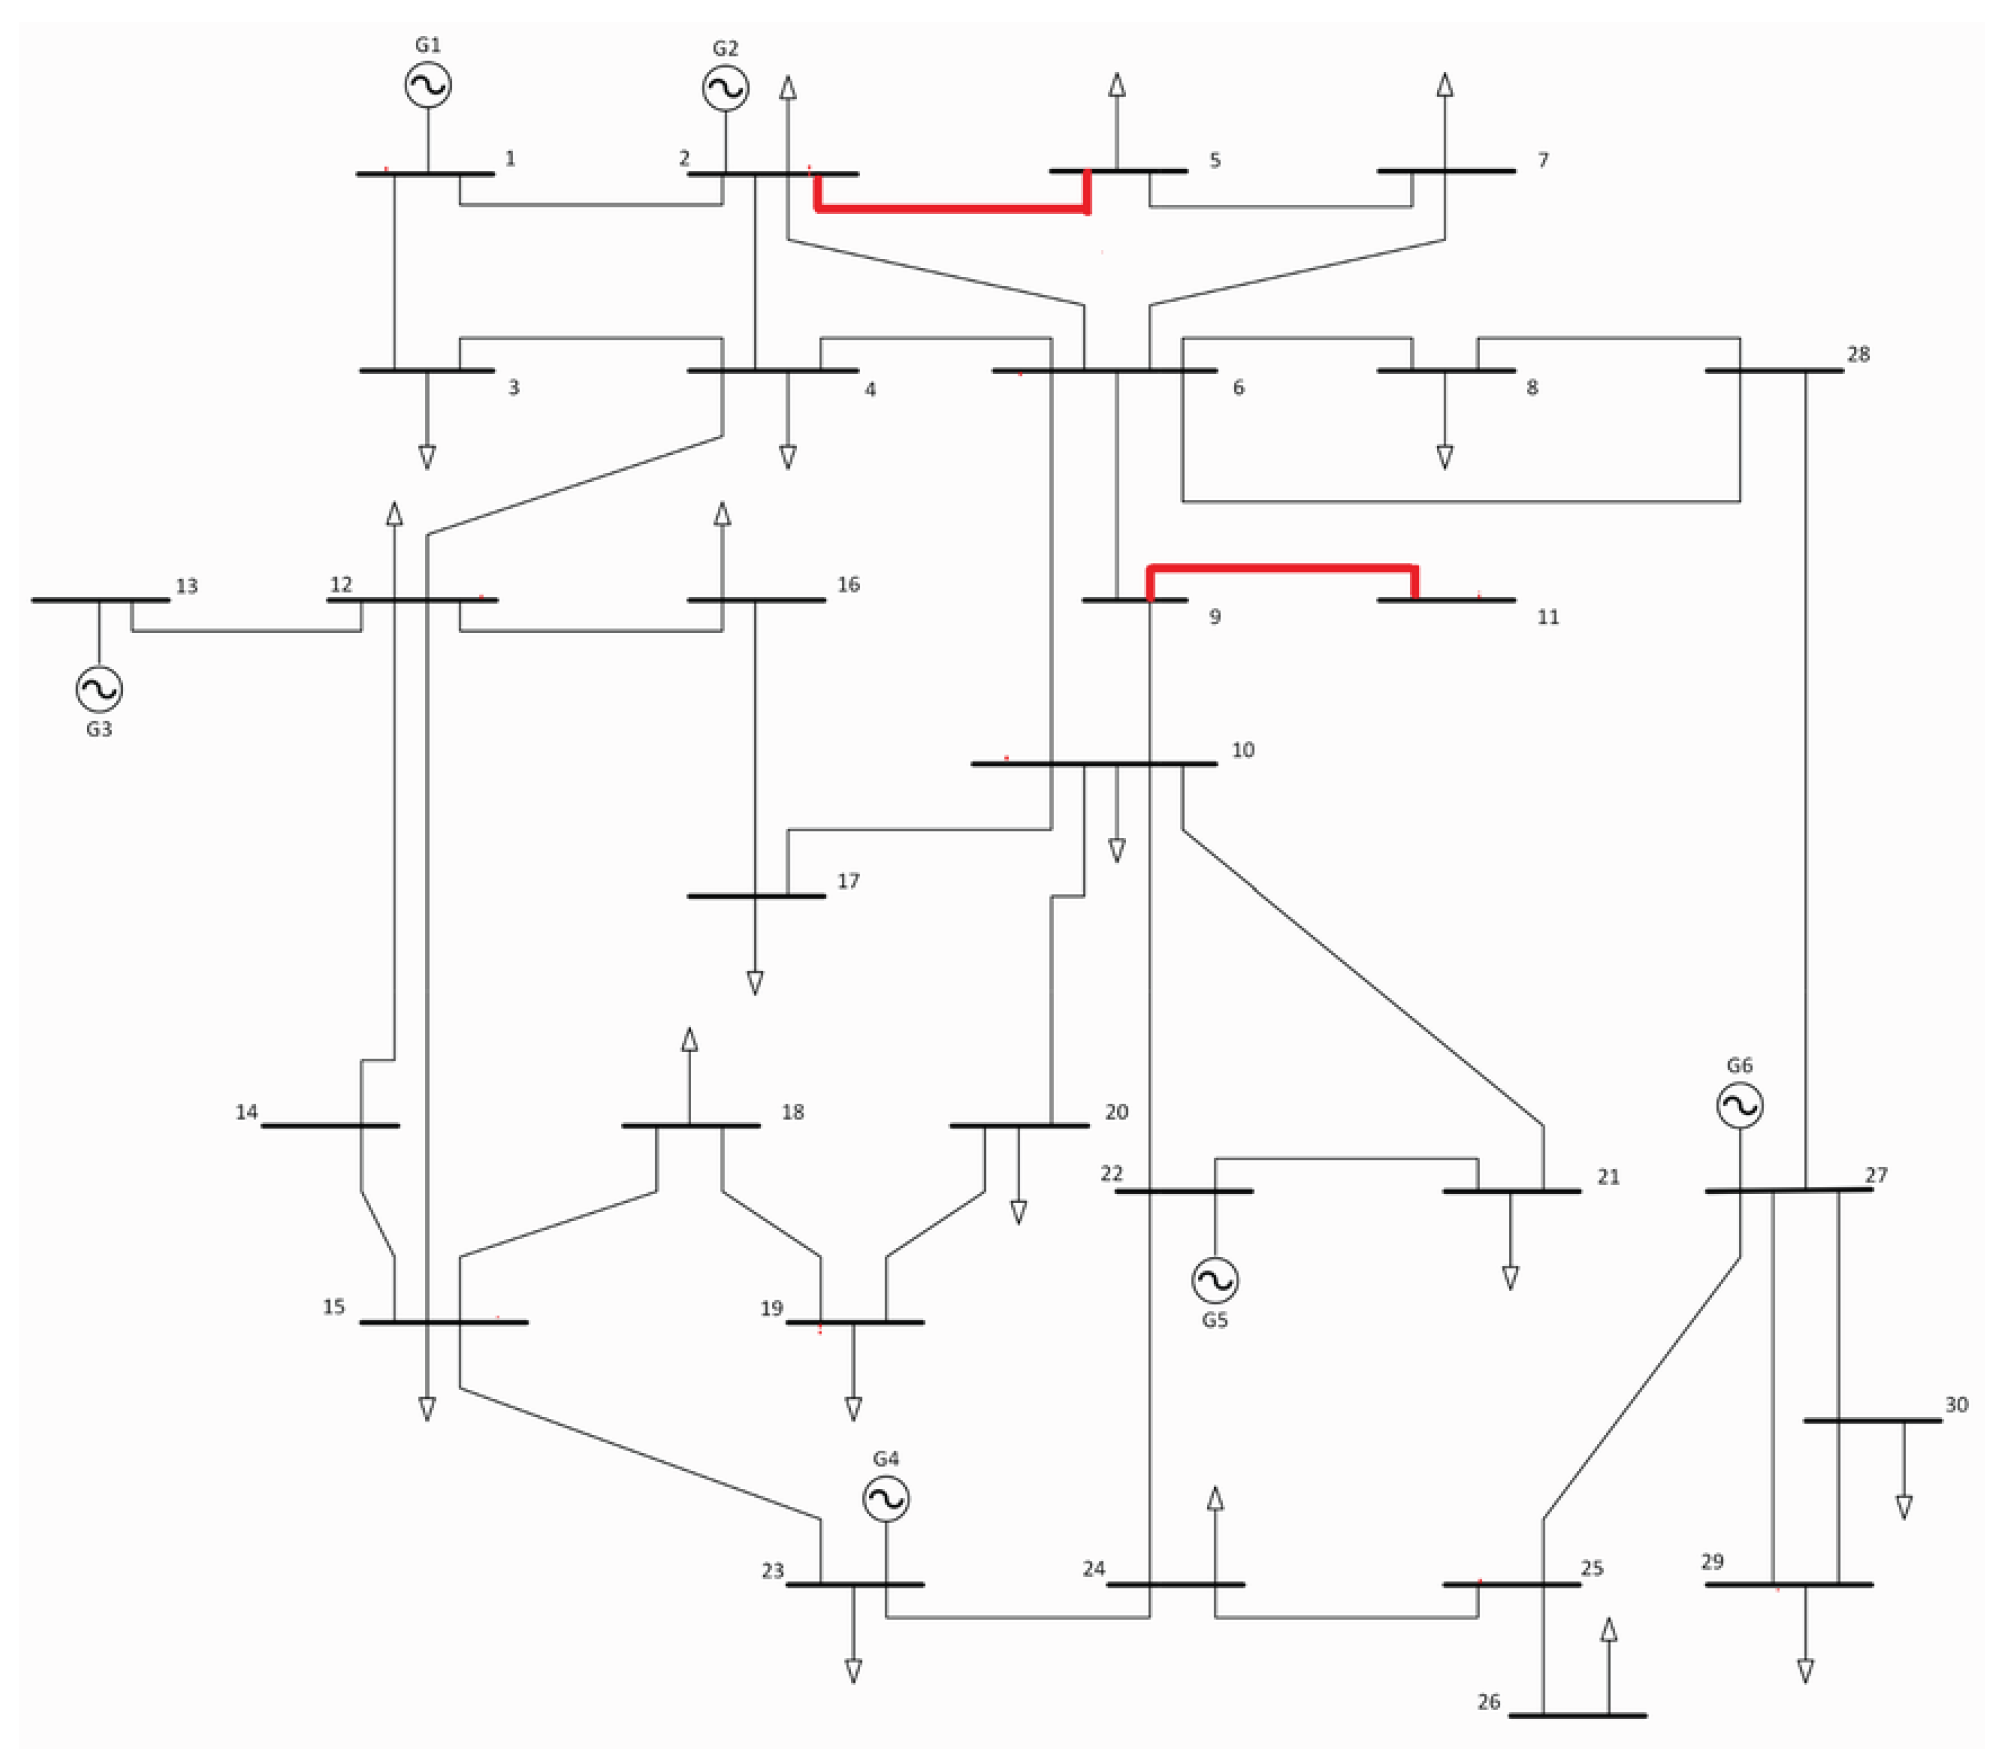
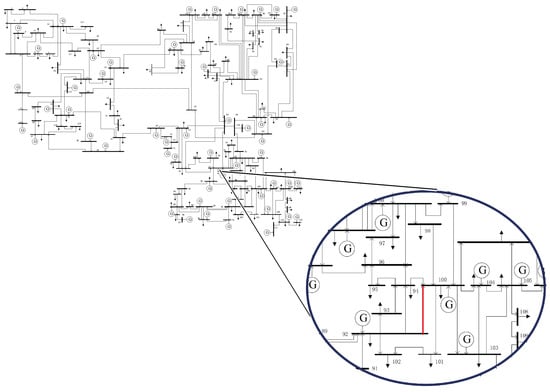
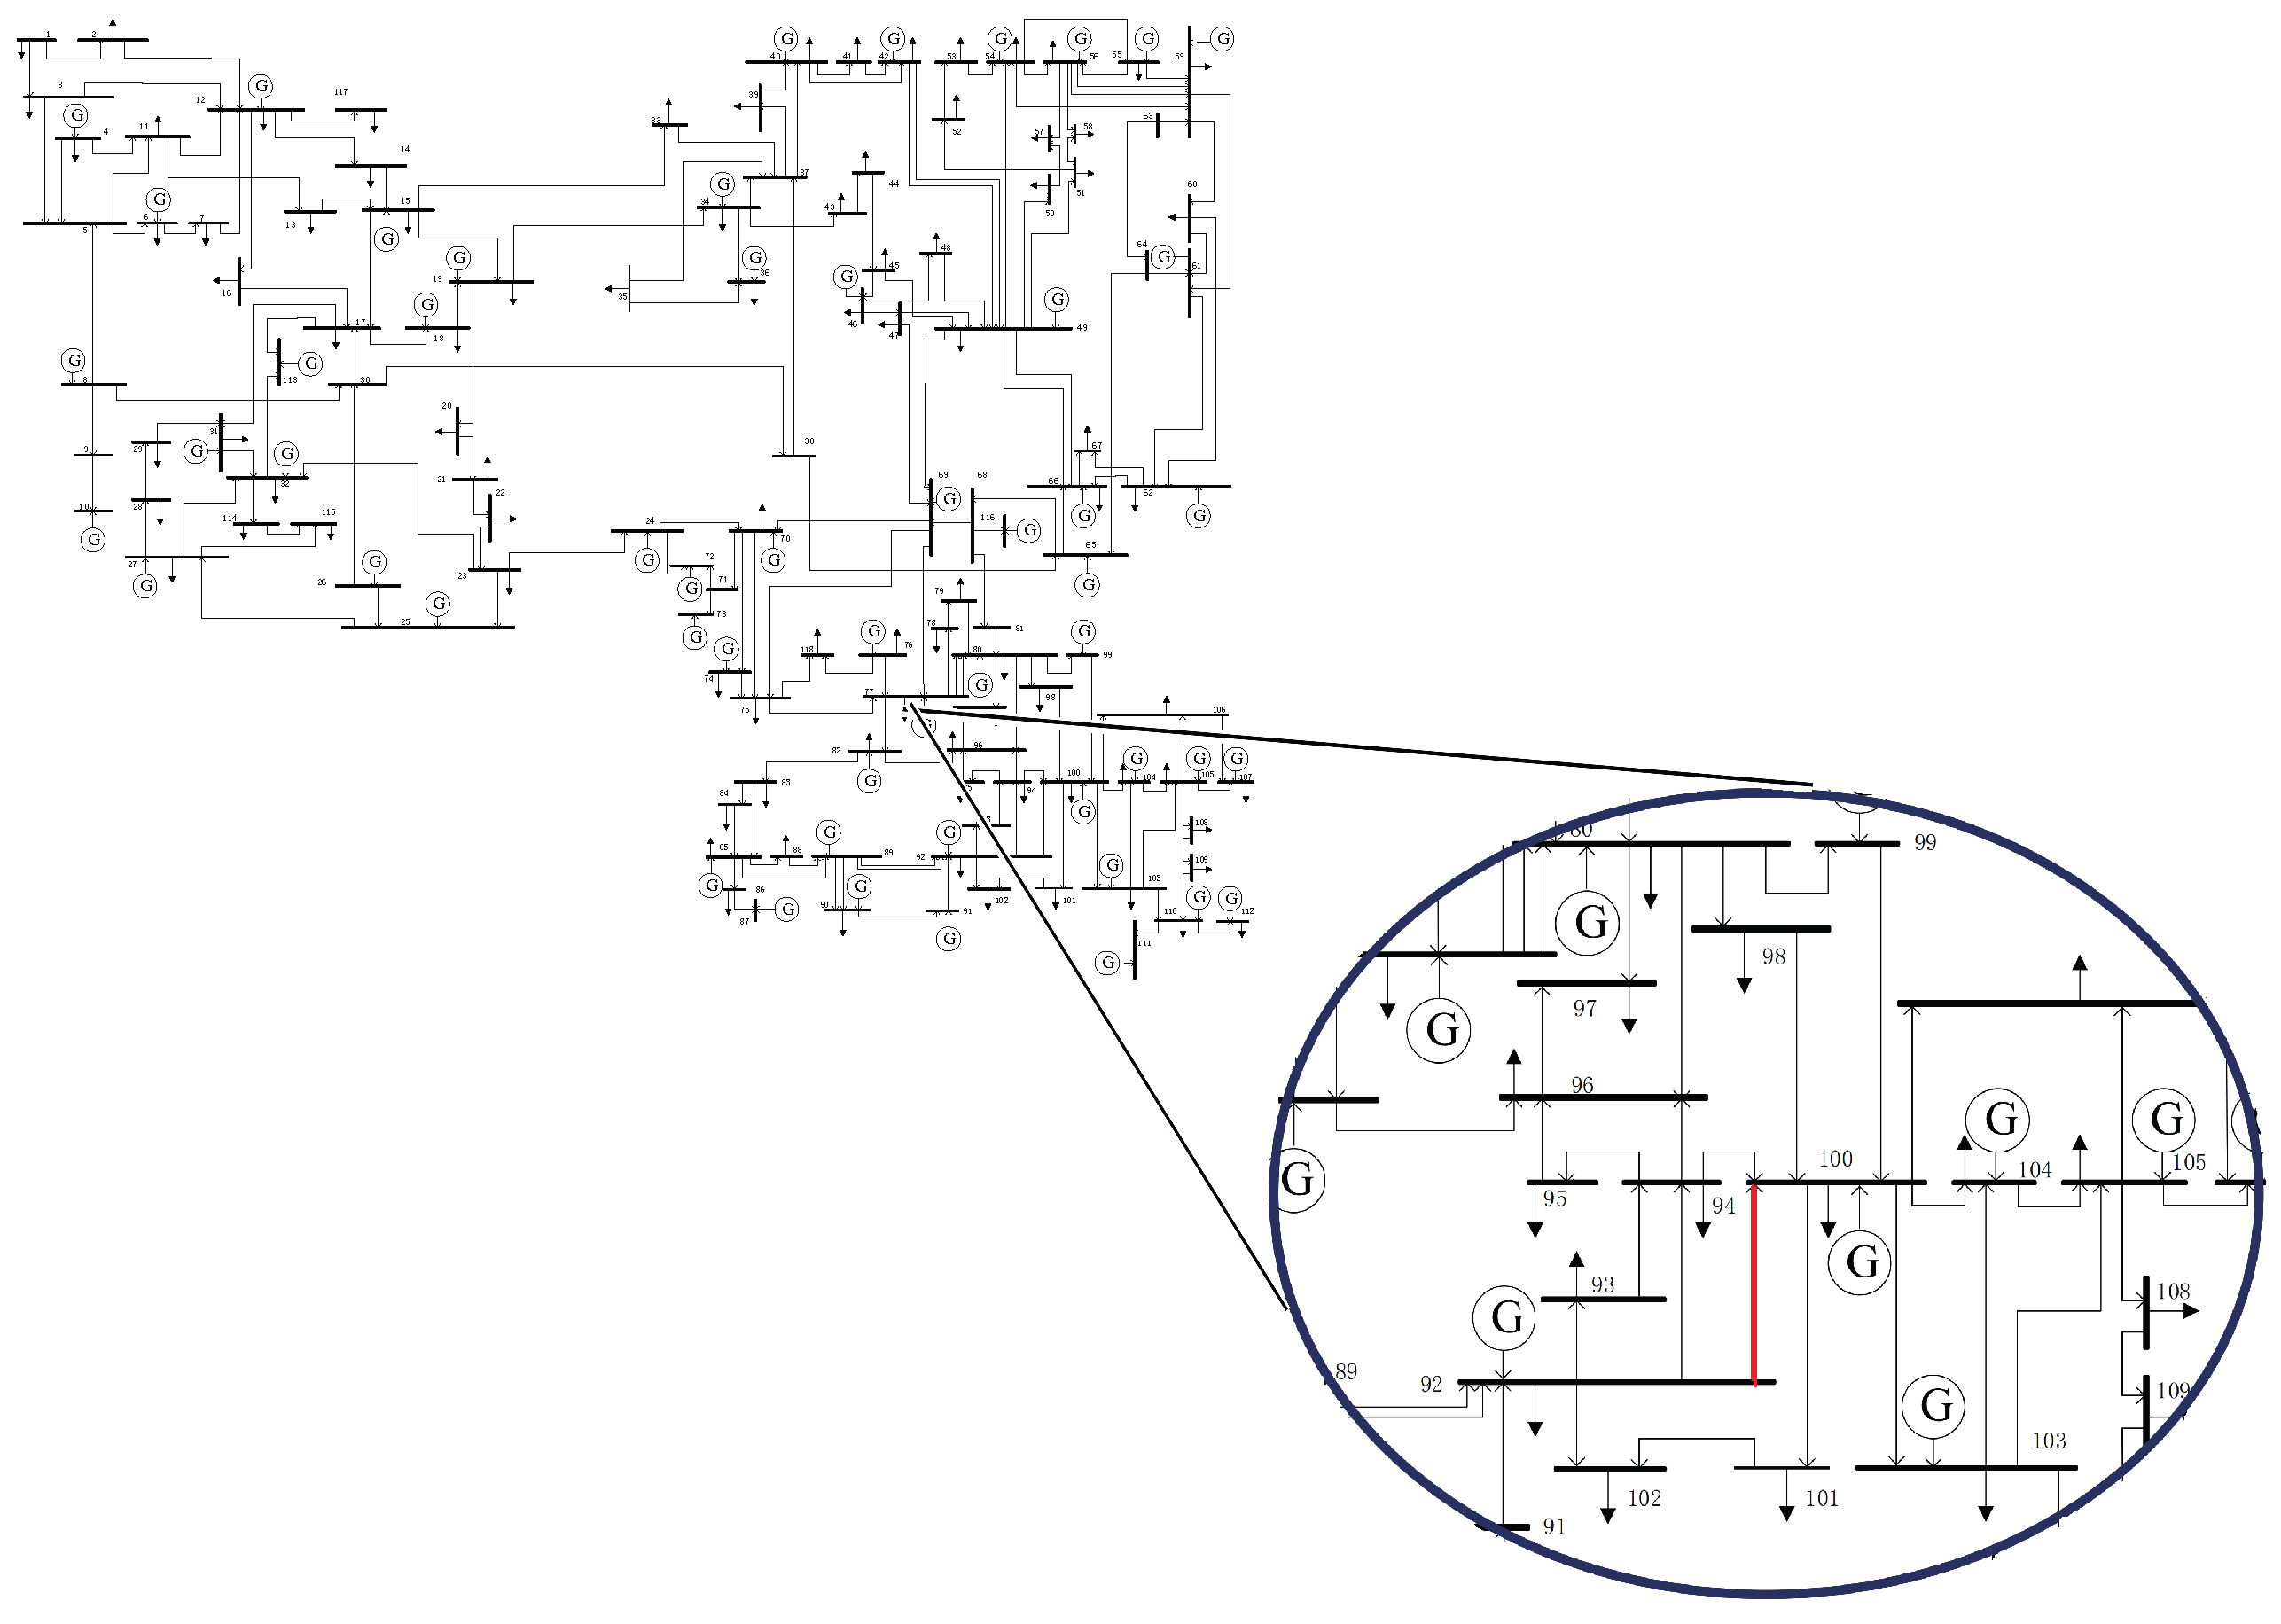

Disclaimer/Publisher’s Note: The statements, opinions and data contained in all publications are solely those of the individual author(s) and contributor(s) and not of MDPI and/or the editor(s). MDPI and/or the editor(s) disclaim responsibility for any injury to people or property resulting from any ideas, methods, instructions or products referred to in the content. |
© 2026 by the authors. Licensee MDPI, Basel, Switzerland. This article is an open access article distributed under the terms and conditions of the Creative Commons Attribution (CC BY) license.